Executive Summary
In this report, the authors identify an asset class to which they apply a new phrase, Moderate-Income Rental Housing. Their data demonstrates that as an investment vehicle, Moderate-Income Rental Housing (mirh) delivers consistent, predictable returns and compares favorably with other common asset classes over the time period studied. Meanwhile, demand is surging for rental housing affordable for moderate-income households, and interest is growing in Environmental, Social, and Governance (esg)-focused investments. Combined, it all points to mirh as a promising esg investment option for which the time may now be right.
Interest among institutional real estate investors in what is often referred to as workforce housing—rental housing that receives either few or no governmental subsidies, yet is priced low enough to be affordable to moderate income households—is surging. There is no consistent characterization of this type of housing, although one common definition is a large, institutional-grade multifamily asset occupied by tenants earning between 60% and 120% of the Median Family Income (mfi) in the metropolitan area where it is located. Demand from tenants for this type of housing is increasing concurrently with the nationwide surge in home prices that has occurred amidst the covid-19 pandemic, with many moderate-income renter households now unable to transition to homeownership, and with fewer such households vacating their existing housing units than in past periods.
Meanwhile, although Environmental, Social, and Governance (esg)-focused investments have increased globally in the 21st century, arguably interest has intensified still further during the current pandemic. In the wake of the murder of George Floyd and the ensuing wave of protests that followed in 2020, investor appetite is particularly high for socially-focused investments (the “s” in esg), and yet this segment of esg remains comparatively underdeveloped. This is in part due to the difficulty of quantifying and defining what exactly qualifies as a socially-focused investment, unlike, for instance, environmentally-focused investments (such as solar farms) whose ecological benefits (such as avoided carbon dioxide emissions) are easily quantified, measured, and reported.
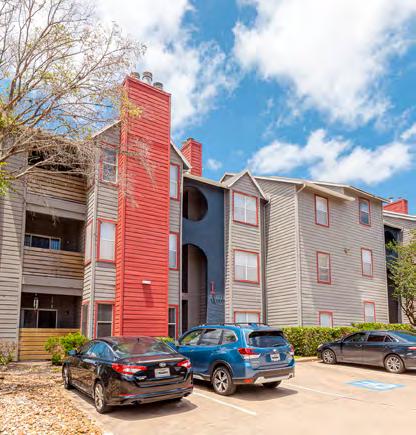
AGAVE AT SOUTH CONGRESS: 195 UNITS

The convergence of these two trends—surging demand for the apartments on the part of tenants and for the properties enveloping them on the part of investors—suggests a natural opening for a new asset class to which we apply a new phrase, Moderate-Income Rental Housing (mirh). Although “workforce housing” is the bestknown terminology for this emergent asset class, it has substantial drawbacks as a moniker, including the likelihood of being confused with employer-provided housing. It also inaccurately insinuates that the majority of tenants of subsidized rental housing (such as rental buildings subsidized with federal government Low Income Housing Tax Credits) lack employment. Meanwhile, other commonly used terms, such as “missing middle housing” (often used to refer to middle-density, rather than middle-income, housing) and Naturally Occurring Affordable Housing (assets that are often too small, too poorly maintained, or both, to be of interest to institutional investors) miss the mark as well. mirh, on the other hand, straightforwardly describes the asset class it refers to without (even if unintentionally) casting aspersions on other asset classes or groups of people.
In this report, we draw on data from the ncreif Property Index (“npi”) as published by the National Council of Real Estate Investment Fiduciaries (ncreif) and divide institutionally owned multifamily rental assets throughout the United States into mirh and “above-mirh” categories, so that we can compare and contrast their collective performance. This empirical analysis is the heart of the report, which bolsters our broader argument making the case for mirh as a new asset class defined by a clear, industrybacked standard.
Methodology
ncreif-provided data is aggregated in order to protect the confidentiality of its data-contributing institutional investor members. Thus, before obtaining data from ncreif we had to compute a threshold rent that varies from metropolitan area to metropolitan area. This allowed ncreif to provide us with aggregated data divided into two categories, mirh and abovemirh, for each unit of analysis. mirh properties, as we defined them for this analysis, are those in which the mean asset-wide rent is below the threshold rent; above-mirh properties are those in which it is equal to or above the threshold.
RESIDENTS ENJOYING COMMUNITY FESTIVITIES
To compute the threshold rent, we approximated an affordable rent, net of typical utility costs, for a household earning 80% of the mfi for the metro area. We adopted the typical federal housing affordability standard in which rent plus utility expenditures are deemed to be affordable when they are below 30% of gross household income. To compile the data needed for the threshold rent calculations, we drew mfi data from the us Department of Housing and Urban Development (hud) and utility cost data from the American Housing Survey and the us Energy Information Agency.
We compared mirh versus above-mirh assets in terms of total return, the variation or uncertainty of total returns from year to year (otherwise known as risk or “standard deviation of total returns”), capital expenditures, occupancy, and other metrics. We did this at three levels of aggregation: nationwide, vintage year, and metro. For the nationwide analysis, we included data from 38 of the 48 metropolitan areas represented in ncreif’s dataset (the remaining 10 did not meet a minimum threshold of at least 20 assets per metro). In this dataset, assets were free to migrate in and out of the mirh category over time in cases where their mean rents drifted above or below the mirh threshold. The vintage year analysis, by contrast, created three nationwide mirh cohorts, starting in 2005, 2010, and 2015, comprised of properties that met mirh criteria at the beginning of the period and then remained in the cohort irrespective of fluctuations in rents around the mirh threshold thereafter. The vintage year analysis thus allowed a “same store” analysis. Finally, there were eight metropolitan areas—Atlanta, Austin, Dallas, Denver, Houston, Phoenix, Seattle, and Washington, dc—that contained enough assets in both the mirh and abovemirh categories to conduct meaningful comparisons at the level of these individual metros. Tellingly, the nation’s three largest metros, New York, Los Angeles, and Chicago, lacked enough mirh assets to allow for such analysis within them.

THE PRESERVE AT WELLS BRANCH: 308 UNITS
Total Return vs Risk vs Major Asset Classes Over Last 10 Years from
Q2 2011–Q2 2021
EMERGING MARKET
BARCLAYS UST BARCLAYS AGG GOV/CREDIT
SOURCE: Mark Roberts and Jake Wegmann using data from NCREIF and Bloomberg from 2Q2011 – 2Q2022. The “mirh Index” returns reflect the calculations as described in the methodology section.
Topline Findings
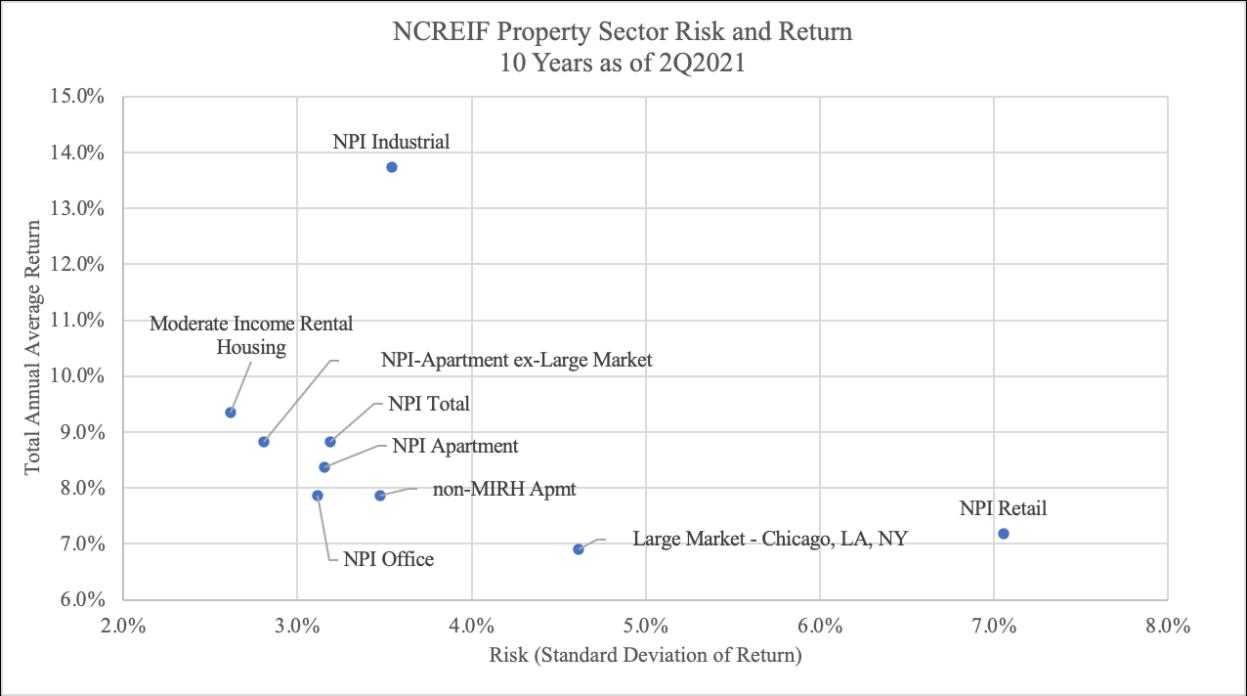
▸ Moderate Income Rental Housing (mirh) compares favorably in terms of its return and has a lower variation in total returns from year to year (risk) since 2011 as compared to other common asset classes. The multifamily assets that we classified as mirh achieved an average unleveraged return of 9.4% in the 10 years leading up to the second quarter of 2021. This positions mirh in the middle of the pack when compared to other common investment options analyzed; however, mirh had the lowest risk (2.6% ) among all such assets. Said differently, over the time period studied two-thirds of the time the total annual return averaged 9.4% +/- 2.6% . Institutional investors typically prefer consistent and predictable performance, and it appears mirh can provide this to them. (See chart above.)
▸ Since 2011, mirh has outperformed otherwise similar “above-mirh assets,” i.e., rental apartment assets that are also captured within ncreif’s data set but whose rents exceed the 80% of ami threshold.
mirh’s average total rate of return (9.35%) exceeded the overall ncreif Property Index Apartment sub-index (8.37%), as well as the assets we classified as “above-mirh” (7.86%).
The direction of this finding is robust to elimination of large metros, which lack mirh assets in the ncreif dataset.
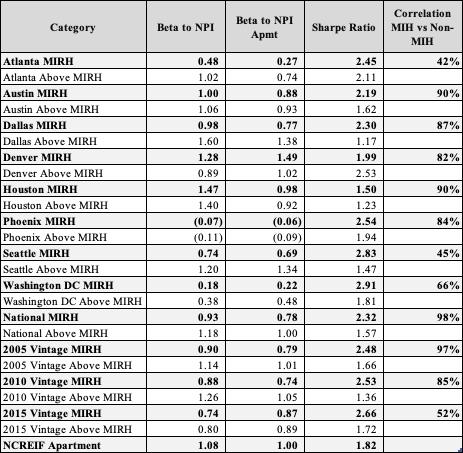
▸ mirh returns since 2011 have exhibited relatively low correlations with indices of other mainstream asset classes, i.e., stocks, government bonds, and high‑yield bonds. For instance, the correlation was +0.029 for total returns for mirh assets with the S&P500, +0.04 with Nasdaq, -0.12 with bbg Barclays us Treasury bonds, and +0.41 with bbg Barclays High Yield bonds.
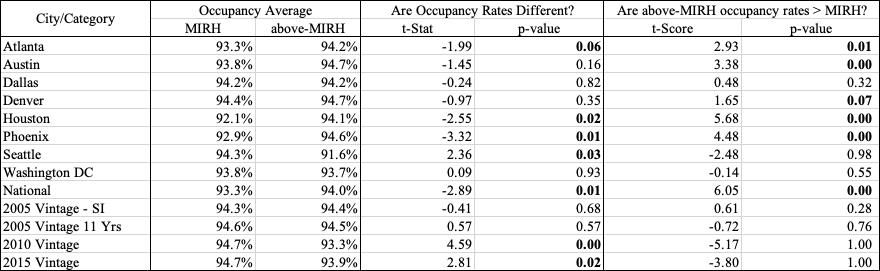
▸ Despite generally tightening rental market conditions over the last decade, particularly at the lower end, mirh assets since 2011 in our dataset have somewhat counterintuitively exhibited slightly lower average occupancy rates (93.3% ) than abovemirh assets (94.0% ).
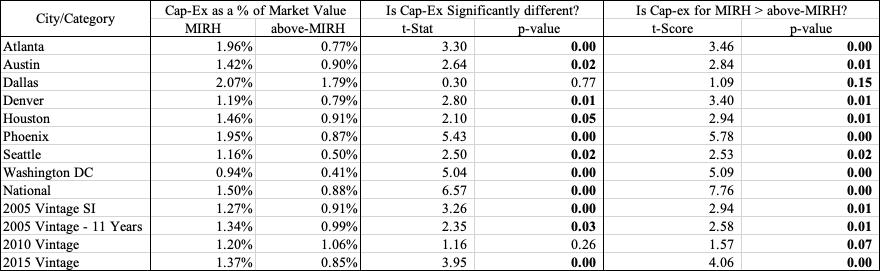
▸ mirh assets since 2011 have required higher capital expenditures (1.5% on average) than above-mirh properties (0.88%).
However, these higher capital requirements are more than offset by the assets’ higher income and total returns.
▸ Analyses of individual metros with sufficient data coverage to permit comparison between mirh and above-mirh assets reveal that the patterns enumerated above hold up almost without exception.
This is true in Sunbelt metros (Atlanta, Austin, Houston, and Phoenix), gateway metros (Washington, dc and Seattle), and Denver.
Implications
One of the unique challenges facing mirh as a potential defined asset class is that success in the very return metrics that we find is likely to fuel suspicion among the broad spectrum of the public that is concerned about housing affordability, and the policymakers who respond to such concerns. With mirh, there is a risk of a perceived conflict between financial success for investors and the wellbeing of the tenants being served.
MELROSE TRAIL APARTMENTS: 183 UNITS
COMMUNITY FARMERS MARKET
One highly useful strategy for countering this tension would be for the institutional multifamily investment industry to develop and coalesce around an agreed upon standard that would identify a given property as certified mirh housing. We propose, as a starting point, that a certified mirh property should
1) Rent all of its mirh-compliant apartments to households earning less than 100% of the median family income for its metro area, adjusted by household size; and
2) For those units charge rent that, when combined with utility costs, is less than 30% of the median, householdsize adjusted income corresponding to 100% of mfi
To gain acceptance, a mirh standard would have to forthrightly account for important issues such as income-mixing within an asset and the need for a minimum time accountment adhering to self-imposed mirh restrictions. The lihtc, with its clear criteria for eligibility coupled with well-incentivized and robust internal self-policing and compliance procedures, and Enterprise Green Communities (egc), with its development and wide-scale adoption originating from within the affordable housing industry, offer attractive precedents for a mirh standard.
Although the impetus for developing mirh would most logically arise from within the multifamily real estate industry, there would likely be strong public sector interest in its adoption as well. In many metros in the United States, market rate multifamily can already provide mirh housing. Even so, mirh offers numerous affordability benefits, including protection of tenants from sudden rent increases over time. In such cases, local governments may be interested in encouraging or incentivizing mirh via modest (“light touch”) subsidies or other measures such as property tax abatements, the opportunity to purchase publicly-owned land at reduced prices, expedited permitting, and others. By contrast, in metros with more extreme levels of unaffordability for middle income households, where unsubsidized housing cannot serve households within the mirh income band, more aggressive actions may be needed. In such cases, mirh may be able to play a productive role in publicprivate partnerships of various forms in order to deliver muchneeded middle income rental housing affordability. The bottom line is that mirh is a promising concept and potential emergent asset class for which the time may now be right.
RESIDENTS ENJOYING COMMUNITY FESTIVITIES
THE BRIDGE AT NORTHWEST HILLS: 314 UNITS
All photos of properties and activities provided by Affordable Central Texas.
Moderate-Income Rental Housing: Assessing its Viability as an Asset Class for Real Estate Investment with Environmental, Social, and Governance (ESG) Criteria
Mark G. Roberts
Director of Research, Folsom Institute for Real Estate
Cox School of Business
Southern Methodist University
Jake Wegmann
Associate Professor
Community and Regional Planning Program
School of Architecture
University of Texas at Austin
The analysis and opinions in this report are the work of the authors and do not represent the official position of their employers, Southern Methodist University or the University of Texas at Austin.
List of Charts & Tables
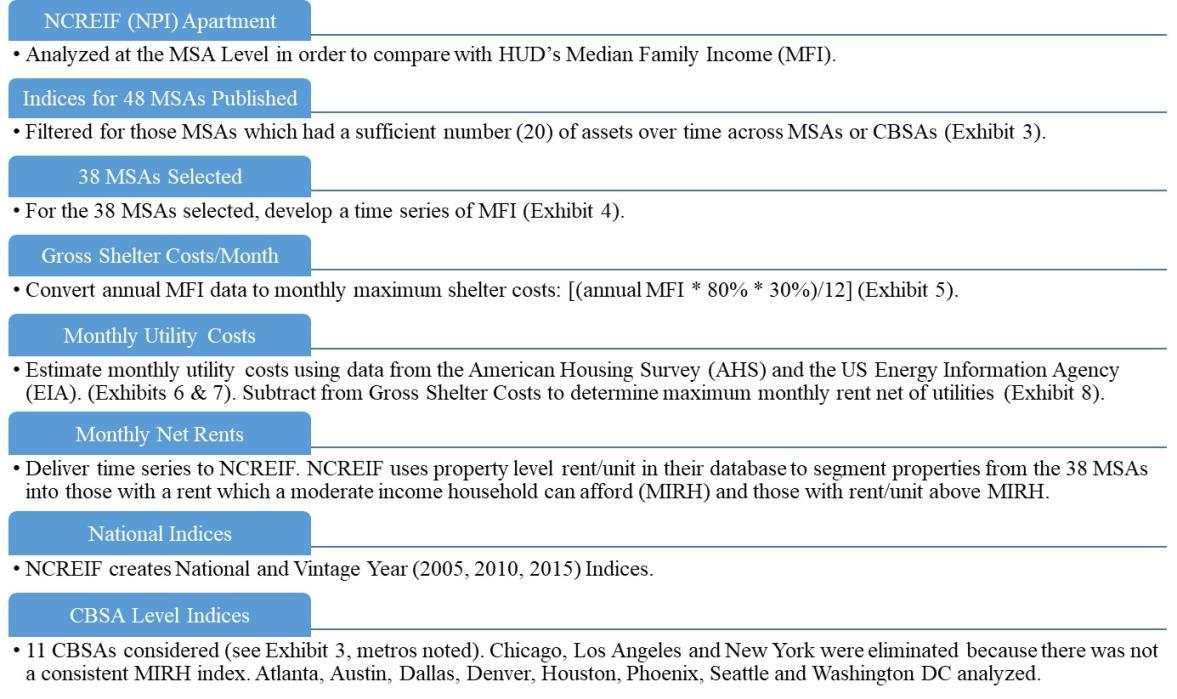
Exhibit 1: Methodology Flowchart
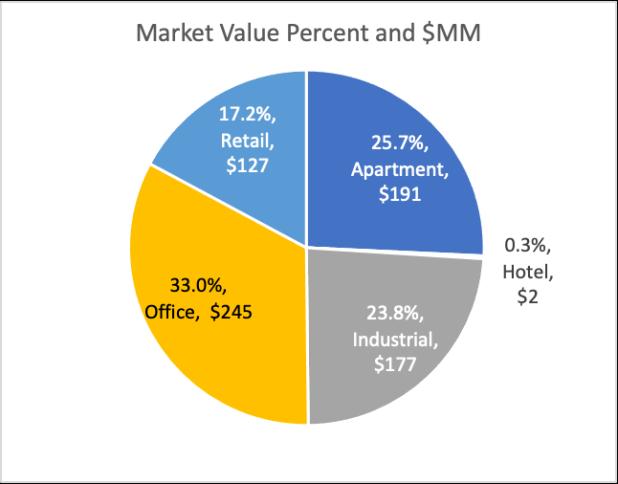
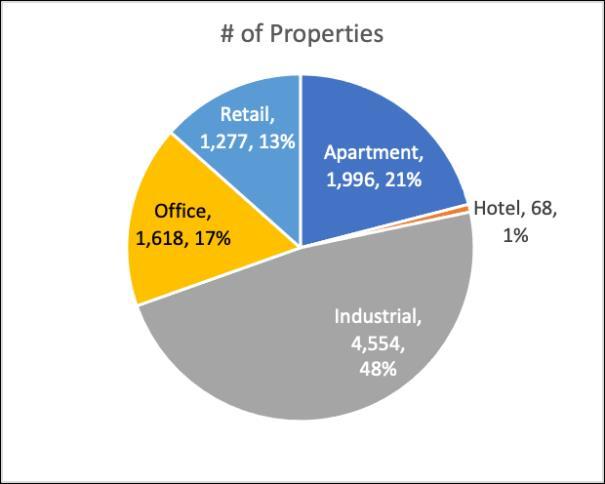
Exhibit 2: Composition of the NCREIF Property Index as of 2Q 2021
Exhibit 3: NCREIF Apartment Index - Property Count Analysis
Exhibit 4: Median Family Income by Metro
Exhibit 5: Maximum Shelter Costs per Month, inclusive of Utilities, assuming 30% of 80% MFI
Exhibit 6: Monthly Utility Cost Analysis by Metro
Exhibit 7: Monthly Utility Cost Analysis by Metro by Year, 2018 Base Year and CPI-U Adjusted
Exhibit 8: Maximum Monthly Net Rent – 80% of MFI x 30% Shelter, less Utilities
Exhibit 9: 10-Year Total Return and Risk of National MIRH vs Major Asset Classes
Exhibit 10: Correlation of Total Returns between MIRH, above-MIRH and Major Asset Classes
Exhibit 11: 10-Year Total Return and Risk of National MIRH vs Other NCREIF Sectors
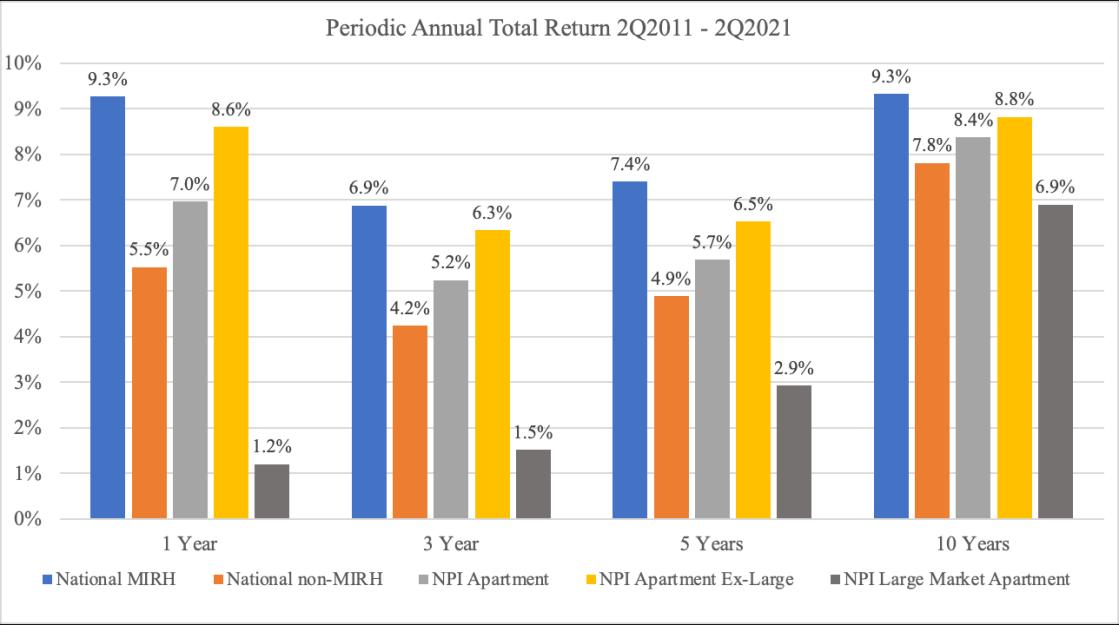
Exhibit 12: Periodic Annual Total Returns – MIRH vs Other Apartment Market Segments
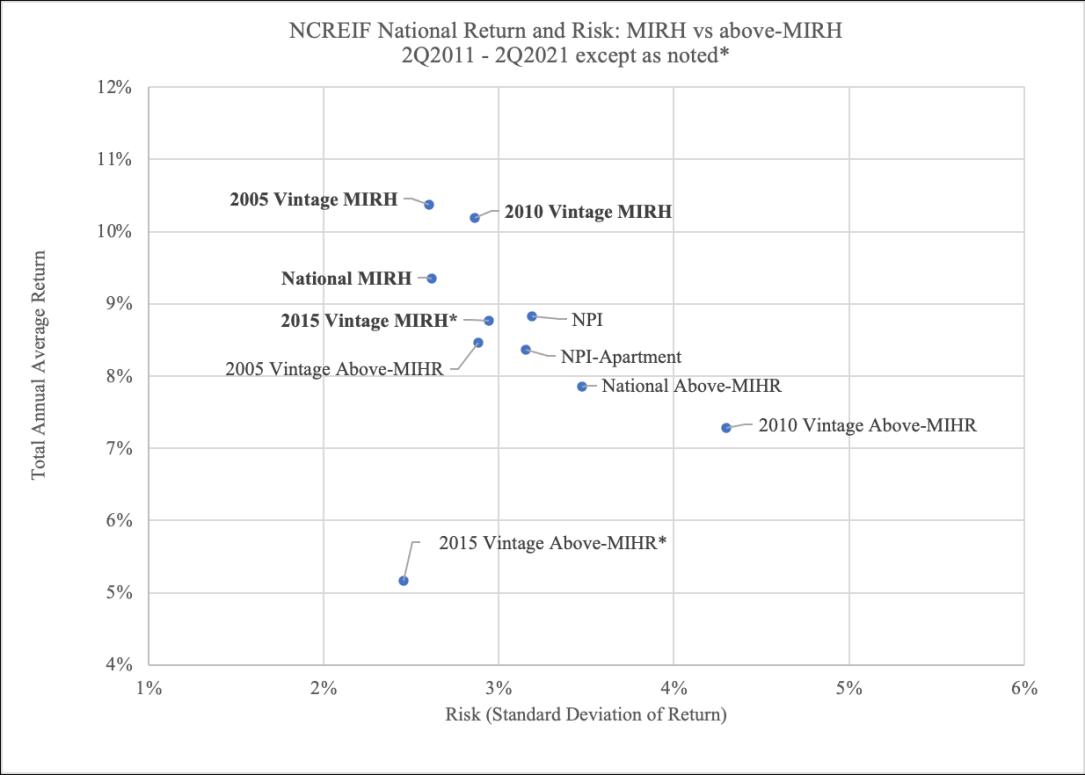
Exhibit 13: 10-Year Total Return & Risk by National and Vintage Year MIRH vs above-MIRH
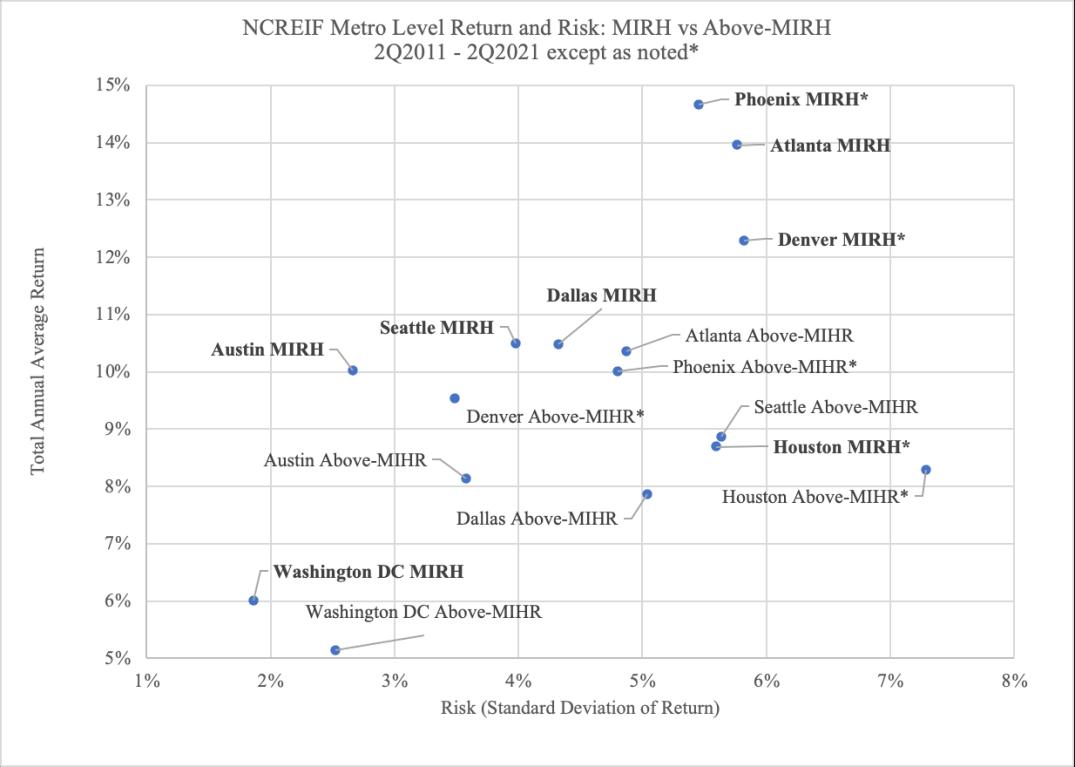
Exhibit 14: 10-Year Total Return & Risk by Metro MIRH vs above-MIRH
Exhibit 15: Periodic Returns by National, Vintage Year and Metro – MIRH vs above-MIRH
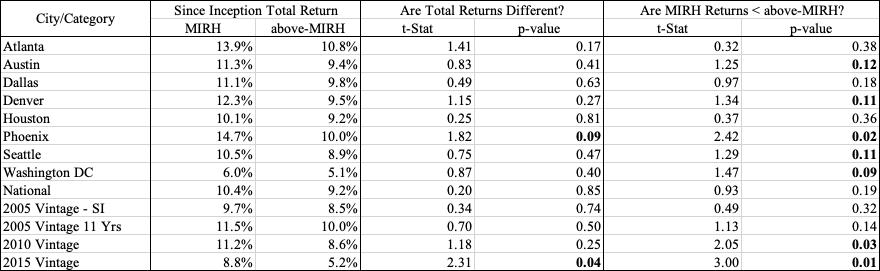
Exhibit 16: Are Total Returns between MIRH and above-MIRH Significantly Different?
Exhibit 17: Risk Metrics by National, Vintage Year and Metro – MIRH vs above-MIRH
Exhibit 18: Are Occupancy Rates between MIRH and above-MIRH Significantly Different?
Exhibit 19: Are Capital-Expenditures as % of Market Value Significantly Different Between MIRH and above-MIRH?
Exhibit 20: Are Earning Yields between MIRH and above-MIRH Significantly Different?
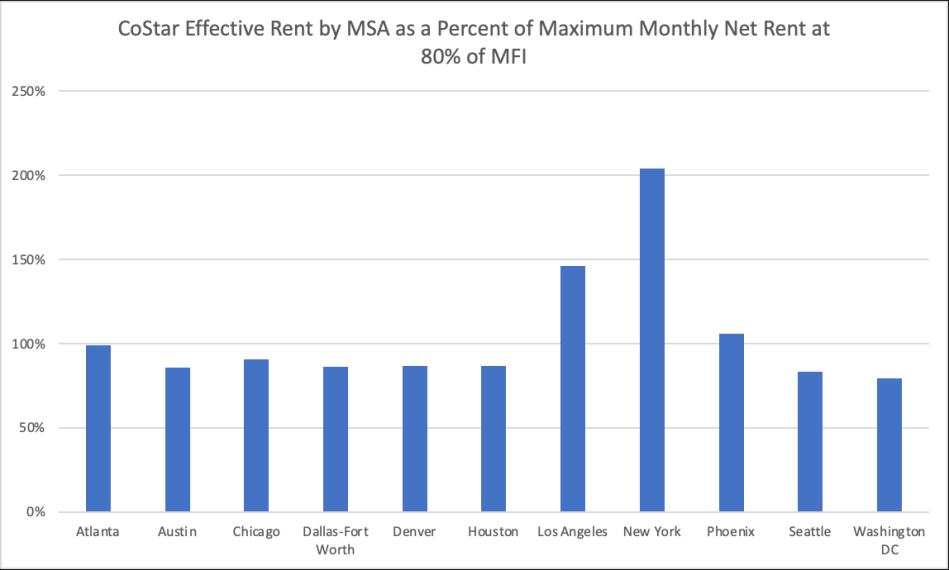
Exhibit 21: Median market rents compared to 80% of MFI rents for selected metros, 2021
About the Funders
Wells Fargo This paper was funded by the Wells Fargo Foundation. We are grateful to them and their Social Impact and Sustainability team for supporting the research
About ACT Affordable Central Texas (ACT) is 501c(3) and is the sponsor and investment manager of the Austin Housing Conservancy Fund. ACT was formed in 2016 by a group of highly experienced Austin real estate, finance and affordable housing professionals to ensure Austin’s workforce can afford to live in greater Austin by building a scalable social impact fund to preserve well located multi-family apartment properties for longer-term affordability as well as provide programs to build community and improve resident outcomes. The Fund now owns five properties totaling 1,200 units with an approximate value of $200 million serving 1,800 residents. Visit austinhousingconservancy.com for more information.
About the Authors
Mark G Roberts, CFA, AIA is a lecturer at the Cox School of Business and Director of Research of the Folsom Real Estate Institute at Southern Methodist University and also Crow Holdings Capital. Prior to this role, he was the Executive Director of the Real Estate Center at the McCombs School of Business at University of Texas – Austin. He served as the Co-Head of Research and Multi-Asset Investing at DWS as well as the Global Head of Research and Strategy for Alternatives. Prior to this, he was the Global Head of Real Estate Research and Strategy at Invesco. He was also Director of Construction at ClubCorp Inc. He's held several industry roles such as the President of the Real Estate Research Institute (RERI) and Chairman of the Board at NCREIF. He currently serves on the PREA Research Committee and is actively involved in ULI. He is a fellow of the Homer Hoyt Institute and RERI as well as a MIT Spaulding Award winner which recognizes distinguished alumni. He holds a Master’s of Science in Real Estate Development from the Massachusetts Institute of Technology and a Bachelor’s in Architecture from the University of Illinois.
Jake Wegmann, Ph.D is an Associate Professor and PhD Program Director in the Community and Regional Planning program within the School of Architecture at the University of Texas at Austin. He has been on the University of Texas faculty since 2014. His published research focuses on various aspects of real estate development, land use regulation, and housing affordability. He has conducted applied research for a variety of funders and clients, including the City of Austin, Harris County (Texas), the owner of a square mile of developable land in Lubbock County (Texas), Urban Land Institute/San Francisco chapter, Chinatown Community Development Corporation (San Francisco), and various others. He teaches courses on real estate development, quantitative methods, survey design, and doctoral student career development. He received his PhD from UC Berkeley, dual Master of City Planning and Master of Science in Real Estate Development degrees from MIT, and his bachelor’s degree from Dartmouth College. Prior to academia, he worked on various development projects for several nonprofit and for-profit affordable housing developers in Denver and San Francisco.
ACKNOWLEDGEMENTS & DISCLAIMERS
The authors would like to thank Reed Jordan of Wells Fargo, as well as David Steinwedell, Frances Ferguson, and Steve LeBlanc of Affordable Central Texas for their sponsorship of this research and their willingness to let us follow the data wherever it led. The analyses discussed in this report would not have been possible without willingness of the National Council of Real Estate Investment Fiduciaries (NCREIF) to furnish data. We particularly thank Jeff Fisher for his assistance in this regard. We also want to acknowledge and thank Charlie Wilkins and Anker Heegaard from Compass Group Affordable Housing, LLC for their valuable feedback. Finally, we are also grateful for the feedback provided by Stockton Williams from the Urban Land Institute and Bob Taylor from Morgan Stanley.
The opinions expressed in this report are the views of Mark G. Roberts, Roberts REA, LLC, and Jake Wegmann, New Trails Research, LLC, as individuals and should not be construed as the positions of the institutions with which they are affiliated. This research project is intended to provide perspectives and insights based on information and data available over the time period studied and does not constitute advice and recommendations. The authors, ACT, and Wells Fargo disclaim any liability for actions taken as a result of this research and its findings.
EXECUTIVE SUMMARY
Interest among institutional real estate investors in what is often referred to as workforce housing rental housing that receives either few or no governmental subsidies, yet is priced low enough to be affordable to moderate income households is surging. There is no consistent characterization of this type of housing, although one common definition is a large, institutionalgrade multifamily asset occupied by tenants earning between 60% and 120% of the Median Family Income (MFI) in the metropolitan area where it is located. Demand from tenants for this type of housing is increasing concurrently with the nationwide surge in home prices that has occurred amidst the COVID-19 pandemic, with many moderate-income renter households now unable to transition to homeownership, and with fewer such households vacating their existing housing units than in past periods.
Meanwhile, although Environmental, Social, and Governance (ESG)-focused investments have increased globally in the 21st century, arguably interest has intensified still further during the current pandemic. In the wake of the murder of George Floyd and the ensuing wave of protests that followed in 2020, investor appetite is particularly high for socially-focused investments (the “S” in ESG), and yet this segment of ESG remains comparatively underdeveloped. This is in part due to the difficulty of quantifying and defining what exactly qualifies as a socially-focused investment, unlike, for instance, environmentally-focused investments (such as solar farms) whose ecological benefits (such as avoided carbon dioxide emissions) are easily quantified, measured, and reported.
The convergence of these two trends surging demand for the apartments on the part of tenants and for the properties enveloping them on the part of investors suggests a natural opening for a new asset class to which we apply a new phrase, Moderate-Income Rental Housing (MIRH). Although “workforce housing” is the best-known terminology for this emergent asset class, it has substantial drawbacks as moniker, including the likelihood of being confused with employer-provided housing. It also inaccurately insinuates that the majority of tenants of subsidized rental housing (such as rental buildings subsidized with federal government Low Income Housing Tax Credits) lack employment. Meanwhile, other commonly used terms, such as “missing middle housing” (often used to refer to middle-density, rather than middleincome, housing) and Naturally Occurring Affordable Housing (assets that are often too small, too poorly maintained, or both, to be of interest to institutional investors) miss the mark as well. MIRH, on the other hand, straightforwardly describes the asset class it refers to without (even if unintentionally) casting aspersions on other asset classes or groups of people.
In this report, we draw on data from the NCREIF Property Index (“NPI”) as published by the National Council of Real Estate Investment Fiduciaries (NCREIF) and divided institutionally owned multifamily rental assets throughout the United States into MIRH and “above-MIRH” categories, so that we can compare and contrast their collective performance. This empirical analysis is the heart of the report, which bolsters our broader argument making the case for MIRH as a new asset class defined by a clear, industry-backed standard.
Methodology
NCREIF-provided data is aggregated in order to protect the confidentiality of its datacontributing institutional investor members. Thus, before obtaining data from NCREIF we had to compute a threshold rent that varies from metropolitan area to metropolitan area. This allowed NCREIF to provide us with aggregated data divided into two categories, MIRH and above-
MIRH, for each unit of analysis. MIRH properties, as we defined them for this analysis, are those in which the mean asset-wide rent is below the threshold rent; above-MIRH properties are those in which it is equal to or above the threshold.
To compute the threshold rent, we approximated an affordable rent, net of typical utility costs, for a household earning 80% of the MFI for the metro area. We adopted the typical federal housing affordability standard in which rent plus utility expenditures are deemed to be affordable when they are below 30% of gross household income. To compile the data needed for the threshold rent calculations, we drew MFI data from the US Department of Housing and Urban Development (HUD) and utility cost data from the American Housing Survey and the US Energy Information Agency.
We compared MIRH versus above-MIRH assets in terms of total return, the variation or uncertainty of total returns from year to year (otherwise known as risk or “standard deviation of total returns”), capital expenditures, occupancy, and other metrics. We did this at three levels of aggregation: nationwide, vintage year, and metro. For the nationwide analysis, we included data from 38 of the 48 metropolitan areas represented in NCREIF’s dataset (the remaining 10 did not meet a minimum threshold of at least 20 assets per metro). In this dataset, assets were free to migrate in and out of the MIRH category over time in cases where their mean rents drifted above or below the MIRH threshold. The vintage year analysis, by contrast, created three nationwide MIRH cohorts, starting in 2005, 2010, and 2015, comprised of properties that met MIRH criteria at the beginning of the period and then remained in the cohort irrespective of fluctuations in rents around the MIRH threshold thereafter. The vintage year analysis thus allowed a “same store” analysis. Finally, there were eight metropolitan areas Atlanta, Austin, Dallas, Denver, Houston, Phoenix, Seattle, and Washington, DC that contained enough assets in both the MIRH and above-MIRH categories to conduct meaningful comparisons at the level of these individual metros. Tellingly, the nation’s three largest metros, New York, Los Angeles, and Chicago, lacked enough MIRH assets to allow for such analysis within them.
Findings
• Moderate Income Rental Housing (MIRH) compares favorably in terms of its return and has a lower variation in total returns from year to year (risk) since 2011 as compared to other common asset classes. The multifamily assets that we classified as MIRH achieved an average unleveraged return of 9.4% in the 10 years leading up to the second quarter of 2021.This positions MIRH in the middle of the pack when compared to other common investment options analyzed; however, MIRH had the lowest risk (2.6%) among all such assets. Said differently, over the time period studied two-thirds of the time the total annual return averaged 9.4% +/- 2.6%. Institutional investors typically prefer consistent and predictable performance, and it appears MIHR can provide this to them. (See chart below.)
• Since 2011, MIRH has outperformed otherwise similar “above-MIRH assets,” i.e., rental apartment assets that are also captured within NCREIF’s data set but whose rents exceed the 80% of AMI threshold. MIRH’s average total rate of return (9.35%) exceeded the overall NCREIF Property Index Apartment sub-index (8.37%), as well as the assets we classified as “above-MIRH” (7.86%). The direction of this finding is robust to elimination of large metros, which lack MIRH assets in the NCREIF dataset.
• MIRH returns since 2011 have exhibited relatively low correlations with indices of other mainstream asset classes, i.e., stocks, government bonds, and high-yield bonds. For instance, the correlation was +0.029 for total returns for MIRH assets with the S&P500, 0.04 with Nasdaq, -0.12 with BBG Barclays US Treasury bonds, and +0.41 with BBG Barclays High Yield bonds.
• Despite generally tightening rental market conditions over the last decade, particularly at the lower end, MIRH assets since 2011 in our dataset have somewhat counterintuitively exhibited slightly lower average occupancy rates (93.3%) than aboveMIRH assets (94.0%).
• MIRH assets since 2011 have required higher capex (1.5% on average) than aboveMIRH properties (0.88%). However, these higher capital requirements are more than offset by the assets’ higher income and total returns.
• Analyses of individual metros with sufficient data coverage to permit comparison between MIRH and above-MIRH assets reveal that the patterns enumerated above hold up almost without exception. This is true in Sunbelt metros (Atlanta, Austin, Houston, and Phoenix), gateway metros (Washington, DC and Seattle), and Denver.
10-Year Total Return and Risk of National MIRH vs Major Asset Classes
Implications
One of the unique challenges facing MIRH as a potential defined asset class is that success in the very return metrics that we find is likely to fuel suspicion among the broad spectrum of the public that is concerned about housing affordability, and the policymakers who respond to such concerns. With MIRH, there is a risk of a perceived conflict between financial success for investors and the wellbeing of the tenants being served.
One highly useful strategy for countering this tension would be for the institutional multifamily investment industry to develop and coalesce around an agreed upon standard that would identify a given property as certified MIRH housing. We propose, as a starting point, that a certified MIRH property should 1) rent all of its MIRH-compliant apartments to households earning less than 100% of the median family income for its metro area, adjusted by household size; and 2) for those units charge rent that, when combined with utility costs, is less than 30% of the median, household-size adjusted income corresponding to 100% of MFI. To gain acceptance, a MIRH standard would have to forthrightly account for important issues such as income-mixing within an asset and the need for a minimum time accountment adhering to self-imposed MIRH restrictions. The LIHTC, with its clear criteria for eligibility coupled with well-incentivized and robust internal self-policing and compliance procedures, and Enterprise Green Communities (EGC), with its development and wide-scale adoption originating from within the affordable housing industry, offer attractive precedents for a MIRH standard.
Although the impetus for developing MIRH would most logically arise from within the multifamily real estate industry, there would likely be strong public sector interest in its adoption as well. In many metros in the United States, market rate multifamily can already provide MIRH housing. Even so, MIRH offers numerous affordability benefits, including protection of tenants from sudden rent increases over time. In such cases, local governments may be interested in encouraging or incentivizing MIRH via modest (“light touch”) subsidies or other measures such as property tax abatements, the opportunity to purchase publicly-owned land at reduced prices, expedited permitting, and others. By contrast, in metros with more extreme levels of unaffordability for middle income households, where unsubsidized housing cannot serve households within the MIRH income bad, more aggressive actions may be needed. In such cases, MIRH may be able to play a productive role in public-private partnerships of various forms in order to deliver much-needed middle income rental housing affordability. The bottom line is that MIRH is a promising concept and potential emergent asset class for which the time may now be right.
OVERVIEW
For several decades, interest in moderate-income rental housing as a distinct asset class for institutional investment has risen episodically but arguably never attained critical mass. There are now reasons to believe that moderate-income rental housing could attain viability as an investment product in a way it never has before. In this report, we empirically test this viability by retrospectively evaluating the performance of multifamily assets that could plausibly qualify as moderate-income rental housing.
Why moderate-income rental housing, and why now? Two macro trends are converging at the time of writing in early 2022. The first is an explosion of across-the-board interest in investments that take account of Environmental, Social, and Governance (ESG) criteria. One recent analysis estimate that global ESG assets under management increased from $23 trillion in 2016 to $31 trillion in 2018, and projects they will reach $141 trillion, or about a third of the global total, by 2025. ESG investment grew first and most rapidly in Europe, but the fastest region for expansion in 2021 is the United States.1 Interest in ESG investment in the United States likely accelerated amidst the wave of social justice protests that occurred in the wake of the murder of George Floyd in May 2020. It is not much of a leap to imagine that this surge of interest in ESG investment extends to real estate, including multifamily assets.
Concurrent with a rise in demand from investors for ESG-friendly multifamily assets that serve middle-income households yet deliver competitive returns, the need for such assets from the standpoint of their end users is arguably acute and rising. Furthermore, this segment of the population is generally not eligible for housing subsidies or rental assistance. In short, there is a squeeze on middle-income households that rent. Even prior to the onset of the current pandemic, in 2019, according to the most recent annual report from Harvard’s Joint Center for Housing Studies, nearly half of renter households earning between $35,000 and $49,999 spent 30% or more of gross income on housing costs. In housing policy parlance, they exceeded the federal standard for “housing cost burden.”
2 An excerpt from a prior report from the Joint Center summarizes the pre-pandemic situation:
The spread of cost burdens up the income scale coincides with the ongoing decline in lower-cost rentals. While the improving economy has increased the share of middleincome renters, earnings growth has not caught up with the rise in rents. To meet the 30percent-of-income affordability standard, a household earning $30,000 a year would have to pay no more than $750 a month for housing costs, while a household earning $45,000 would have to pay no more than $1,125. As the stock of units charging such low rents continues to decline, it is increasingly difficult for households with modest incomes to find housing that is within their means.3
1 Adeline Diab and Gina Martin Adams. 2021 (February 23). “ESG Assets May Hit $53 Trillion by 2025, a Third of Global AUM.” Bloomberg Professional Services Research and Analysis. URL: https://www.bloomberg.com/professional/blog/esg-assets-may-hit-53-trillion-by-2025-a-third-of-global-aum. For a lengthier overview of global ESG investment trends and challenges see: R. Boffo and R. Patalano 2020 “ESG Investing: Practices, Progress and Challenges.” OECD Paris. URL: www.oecd.org/finance/ESG-Investing-PracticesProgress-and-Challenges.pdf
2 Joint Center for Housing Studies of Harvard University. “The State of the Nation’s Housing 2021.” URL: https://www.jchs.harvard.edu/state-nations-housing-2021
3 Joint Center for Housing Studies of Harvard University. “America’s Rental Housing 2020,” page 5. URL: https://www.jchs.harvard.edu/sites/default/files/Harvard_JCHS_Americas_Rental_Housing_2020.pdf. For more on
Although the pandemic temporarily depressed rents for high-quality units, this respite for tenants has come to an end. Meanwhile, rent levels in low- and medium-quality rentals never experienced any declines at all during the pandemic 4 Combine these trends with millions of tenants relying on temporary eviction moratoria and various forms of government relief payments to stay housed,5 plus a nationwide surge in house prices that has put homeownership out of reach for many more middle-income renters, and it is clear that moderate income rental housing is more in demand than ever.6
When these two macro-trends are considered in tandem surging interest in ESG investment, combined with a growing need for rental units with affordable and stable rents for middle income households the potential for moderate income rental housing as an asset class becomes clear. However, MIRH, as we call it in this report, must deliver attractive returns in relation to its volatility vis-à-vis other multifamily investment alternatives, and vis-à-vis entirely different asset classes, for this potential to be realized. After all, ESG investment is still primarily performance-driven. This performance, or lack thereof, in MIRH is what we set out to quantify, without ex ante expectations, in this report. To the extent MIRH investments can deliver both financial and social goals, it may underpin longer-term preservation of the housing stock for middle-income renters. What is more, with ongoing dwindling of the existing stock of moderateincome rental housing, for instance via the upgrading in many markets of existing Class B buildings towards higher-end assets serving tenants paying higher rents, there is a degree of urgency to growing MIRH as an asset class.
The rest of the report is structured as follows. Following this introductory section, we provide some background and definitions underpinning the concept of moderate-income rental housing, or what we are referring to via the novel nomenclature of MIRH. In doing so, we explain why we avoid the sometimes-used term “workforce housing,” and also steer clear of some other possible alternatives. Next, in the following section we explain our methods the details of the data set provided by the National Council of Real Estate Fiduciaries (NCREIF) in the analysis, the selection and exclusion criteria we applied and their justification, how we used the resulting winnowed data set to divide investment-grade multifamily assets into those that might qualify as MIRH under reasonable retrospective criteria and those that are “above-MIRH,” and how we compared the performance of both. Next is the heart of the report: our presentation of the results of our analysis. In brief, we find that MIRH multifamily assets, over the past 11 to 16 years, analyzed in several different ways, have largely equaled or exceeded the performance of above-MIRH multifamily assets over the time period both in the aggregate nationwide and also within the individual metro areas that have enough data coverage to permit such evaluation. By and large, MIRH assets offer equivalent or superior returns and lower volatility, albeit with higher capital expenditures, when compared to above-MIRH multifamily. Their return-to-risk
housing stress on middle-income households, see also: Jenny Schuetz. 2019 (May 7). “Cost, Crowding, or Commuting? Housing Stress on the Middle Class.” Brookings Institution. URL: https://www.brookings.edu/research/cost-crowding-or-commuting-housing-stress-on-the-middle-class/
4 Joint Center 2021, Figure 3 (page 3)
5 Joint Center 2021, discussion beginning on page 25, including Figure 24.
6 ATTOM, which maintains a leading property database, reports that in the third quarter of 2021, 75% of the counties it tracks have median single-family house prices that are less affordable relative to median household income compared to historical averages. This share is up sharply from 56% the year before, during which time median national single-family house prices skyrocketed by 18%, and is the highest in 13 years. URL: https://www.attomdata.com/news/market-trends/home-sales-prices/attom-q3-2021-u-s-home-affordability-report/
ratio also compares favorably with other major asset classes, including stocks, high-yield bonds, and US government treasuries.
Our empirical findings buttressing the investment case for MIRH as a distinct asset subclass of multifamily real estate set up the final section, which discusses and contextualizes our overall findings. We offer some recommendations for the multifamily industry to take in making the concept of a MIRH asset class a reality, and outline ways in which the public sector might contribute to and support the growth of MIRH. Finally, we close with some recommendations for future research to further empirically stress-test the MIRH concept.
BACKGROUND AND DEFINITIONS
A significant challenge in establishing moderate income rental housing as a recognized asset class is a lack of consistent definitions. As a contrasting example, the housing industry (both for- and nonprofit) that has grown up around the Low-Income Housing Tax Credit (LIHTC) benefits from the clear definition established by the US Congress when the LIHTC was passed in 1986, and the Internal Revenue Service’s subsequent codification of its criteria. For decades, there has been no doubt about which multifamily assets could be eligible to receive LIHTC: only those that included income- and rent-restricted units affordable to households earning 50% or 60% of Median Family Income (MFI)7, as defined by the US Department of Housing and Urban Development, could hope to qualify 8 This clarity has helped the LIHTC gain industry acceptance to the point where 3.2 million units9 had been built or rehabbed from inception through 2018, all of them with private investment capital.
By contrast, clear definitions for rental housing that is designed to serve households at higher income levels than LHITC housing, but for whom market rate housing would be a strain or out of reach, have been elusive. We begin by proposing such a definition. Next, we define the metropolitan areas that this report uses as its geographical unit of analysis. We then review some other definitions and nomenclatures for what we refer to as moderate income rental housing that have been proposed in the past, and make the case for our terminology.
Defining moderate-income rental housing (MIRH)
Our idealized definition of moderate-income rental housing (MIRH) is rental housing that serves tenants earning between 60% and 100% of the Median Family Income (MFI) for the metropolitan or micropolitan area or rural county in which it is located. However, because of data limitations, in this report we approximate and operationalize the definition of MIRH as an apartment complex in which the median apartment rent plus average utility costs is 80% or less of MFI as reported by the Department of Urban Housing and Development (HUD).10 We consider this definition to be sufficient for the basic proof of concept of MIRH as an asset class that lies at the heart of this analysis. Also, for the data used in our study, the assets were owned and operated by institutional investors. Further details on our identification of MIRH assets are provided in the Methods section of this report. A brief overview of other definitions and names for moderate-income rental housing and our case for MIRH
7 The term Area Median Income (AMI) is sometimes used instead of Median Family Income (MFI). The two terms have the same meaning in the context of affordable housing. In this report, we use MFI instead of AMI.
8 From inception of Low Income Housing Tax Credits (LIHTCs) until 2018, only units rented for less than 60% of MFI could qualify. Mixed-income developments could include units rented at higher levels, but tax credits could not be claimed for them only for the pro rata portion of the project corresponding to units rented for 60% of MFI or less. Since 2018, Congressional legislation has allowed for “income averaging,” where units rented up to 80% of MFI can qualify for LIHTC provided that the units for which LIHTC are claimed average 60% of MFI or less.
9 https://www.huduser.gov/portal/datasets/lihtc.html
10 Although some MIRH assets may be brand-new construction, the majority are likely to be existing properties, mirroring the composition of multifamily assets in general.
Interest in moderate-income rental housing has waxed and waned over the decades, and has never received the same focused and sustained attention as low-income rental housing. In a 2016 law review article, the legal scholar Matthew Parlow observes that the argument for what was often referred to as workforce housing gained steam in the middle of the first decade of this century, in the runup to the Global Financial Crisis.11 The shock and urgency of the GFC diverted attention from “workforce housing,” but interest in the topic gradually returned in the last decade amid slow but steady economic recovery, relatively low multifamily production, low growth in homeownership, and associated rising rent growth.
We have elected to avoid the term “workforce housing,” even though it is commonly used, for at least two reasons noted by Tiffany Ford and Jenny Schuetz of the Brookings Institution.12 The first is that the term workforce housing misleadingly implies that most households earning incomes too low to qualify for such housing are not employed, when this is not true. For example, the federal minimum wage of $7.25 per hour equates to an annual income of $14,500 per year (assuming a 40-hour work week and 50 weeks of work per year), which is below the HUD definition of an extremely low income (30% of median or below) for a oneperson household in the Austin-Round Rock MSA in 2021. A worker earning the federal minimum wage is part of the workforce but cannot qualify for MIRH. The other drawback of the term “workforce housing” is that it conflates a generalized effort to supply housing for moderateincome workers, as described in this report, with specific efforts by groups of employers or specific companies to provide housing for their workers. Efforts to build a teachers’ village in Newark, NJ,13 US Department of Agriculture-funded farmworker housing developments, and even the 19th century-era Pullman company town in Chicago (today a national monument) meet this more precise definition of workforce housing. Another term used for this type of housing is Employer-Assisted Housing (EAH), which encompasses both for-sale and rental housing for employees of a particular employer.14
Parlow notes that the Urban Land Institute originally defined workforce housing as serving people earning between 60% and 120% of MFI; Ford and Schuetz also note that this is a commonly used definition At times an even more expansive definition of 60% to fully 150% of MFI is used, highlighting the lack of a consistent definition to date.15 Even within ULI, which arguably has done more than any other organization to promote MIRH, the use of 60% of 120% of MFI as a definition is by no means consistent; for instance, a ULI report from 2010 focused on Boston used the 60% to 100% (i.e., median) income band.16 In our report, we use this narrower band, 60% to 100% of AMI, to capture rental housing that is aimed too high to qualify
11 Matthew Parlow. 2016 (March). “Whither Workforce Housing?” Fordham Urban Law Journal(40), vol. 5 symposium, Article 9.
12 Tiffany Ford and Jenny Schuetz. 2019 (October 29) “Workforce Housing and Middle-Income Housing Subsidies: A Primer.” URL: https://www.brookings.edu/blog/up-front/2019/10/29/workforce-housing-and-middle-incomehousing-subsidies-a-primer/
13 https://www.teachers-village.com/
14 Housing Works, a pro-housing advocacy group in Austin, recently released a JP Morgan Chase Foundationfunded guide to EAH. https://housingworksaustin.org/wp-content/uploads/2021/11/Presentation-only_EAH__11-2921.pdf
15 Aileen Jacobius. 2017 (October 2). “Workforce Housing Catches Eye of Managers, Investors.” Pensions & Investments. URL: https://www.pionline.com/article/20171002/PRINT/171009979/workforce-housing-catches-eyeof-managers-investors
16 Urban Land Institute. 2010. “Priced Out: Persistence of the Workforce Housing Gap in the Boston Metro Area.” http://uli.org/wp-content/uploads/ULI-Documents/WH_Boston10.ashx_.pdf
for LIHTCs, but that is less likely to be produced by market rate development. Although there are some metros in which market rate development may produce rental housing affordable to tenants earning 100% of MFI, there are fewer of them than metros in which such development yields rental housing for households earning 120%. As Ford and Schuetz note, in past decades workforce housing efforts were primarily conceived to entice middle income housing to big cities; today, in a growing number of locations, the emphasis has flipped to preventing the loss of such residents from increasingly expensive cities In short, a narrower band of incomes for MIRH makes the concept more meaningful in more places and more attuned to today’s primary issues of concern, and therefore we adopt the narrower, 60% to 100% of MFI definition.
At least two other terms are sometimes used interchangeably with what we refer to in this report as MIRH: “Missing Middle” housing and Naturally Occurring Affordable Housing (NOAH). We find both of them to be at least somewhat off the mark for what we describe and quantify in this report. Missing Middle housing is an increasingly well-recognized term that describes medium-density, small-parcel forms of housing such as bungalow courts and fourplexes housing that is “missing” because it was commonly built in large quantities a century or more ago in many US cities but no longer is.17 Confusingly, Missing Middle is occasionally used to refer to middle income housing rather than middle density housing these two characteristics can coexist in the same housing property but this intersection is by no means guaranteed. We find it best to simply avoid the Missing Middle terminology when referring to what we call MIRH, particularly since most of the assets analyzed in this report are large multifamily properties that are decidedly not middle density nor situated on small, residentialscale parcels.
A different term, NOAH, accurately captures the primary mechanism by which market rate rental housing comes to eventually serve middle-income households, i.e., housing filtering (or the gradual diminution of an asset’s relative attractiveness compared to competing properties over time due to gradual obsolescence or less-than-perfect upkeep). However, the term NOAH is often used to refer to smaller multifamily properties, many of them held by non-institutional owners, that are not the types of institutional investment grade assets featured in this report.18
Although we believe that “moderate income” is a straightforward term, one that we define in the manner listed above, we acknowledge that the federal government uses it differently according to the particular application. For instance, under the Community Reinvestment Act, which requires banks to provide services in historically disadvantaged communities, moderate income is defined as “Individual income that is at least 50 percent and less than 80 percent of the area median income, or a median family income that is at least 50 percent and less than 80 percent, in the case of a geography.” By contrast, in Comprehensive Housing Affordability Strategy data products released by HUD, moderate income households are
17. Daniel G. Parolek. 2020. Missing Middle Housing: Thinking Big and Building Small to Respond to Today’s Housing Crisis Washington, DC: Island Press
18 For a recent example of this usage of NOAH, see: Urban Land Institute. 2021. “Preserving Philadelphia’s Naturally Occurring Affordable Housing.” URL: https://ulidigitalmarketing.blob.core.windows.net/ulidcnc/sites/28/2021/05/NOAH-Study-Visit-Report-finalweb2.pdf
those “whose incomes are between 81 percent and 95 percent of the median income for the area, as determined by HUD.”19
No terminology is perfect; every possible choice has its limitations. However, in this report we eschew the alternative terms reviewed above and instead use the nomenclature of MIRH, since it provides a straightforward description of the subset of multifamily housing that we aim to analyze. Furthermore, we define “moderate income” as an income range that is generally too high to be served by most formal subsidized housing programs but low enough to meaningfully reflect a recognized need in most markets. It is possible that as MIRH grows in popularity and recognition as a distinct asset class, the industry will coalesce around a different term or precise definition. For the time being, however, we use MIRH to mean rental housing reserved for and affordable to those earning under 80% of MFI
19 For moderate income definition under CRA, see: https://www.federalreserve.gov/consumerscommunities/cra_resources.htm. For definition under CHAS, see: https://www.tdhca.state.tx.us/glossary.htm
METHODOLOGY
The principal aim of our analysis is to analyze the absolute and relative performance attributes and operating characteristics of apartment assets which not only have a rental level which is accessible to moderate income households (“MIRH” assets), but also do not rely upon government subsidies or tax credits. However, to our knowledge, there is not an independent and objective published total return index on unsubsidized affordable housing. Such an index is necessary to analyze the historical return, risk, and performance characteristics of such investments relative to other property sectors or asset classes. Thus, we needed to develop a proxy index to evaluate the return performance of buildings which can provide shelter to moderate income households.
Our objective was to create both a MIRH Index and an above-MIRH Index so we could compare and contrast the performance of each at various geographic levels. The first level was to develop a national index. In the case of the national index, if a property in a given quarter provided a rent which a moderate-income household could afford under our definition, it was included in the MIRH Index. The drawback of this approach is that a property could be included in the MIRH Index in one quarter and moved into the above-MIRH Index in an ensuing period if the rent on the property exceeded our maximum rent. To address this drawback, we also sought to develop several vintage-year indices.
In the case of the vintage year indices, properties were segmented into MIRH and aboveMIRH in a given-year and remained in their category in subsequent years. In this instance, we essentially created a “same store” analysis. Eventually, we created three vintage year indices for 2005, 2010 and 2015. The drawback to this approach is the composition and performance could be influenced by the composition of cities underlying each category for each vintage year. To address this issue, we also sought to create metro-level indices which could neutralize this drawback.
To create these proxy indices, we utilized data from the NCREIF Property Index (“NPI”) as reported by the National Council of Real Estate Investment Fiduciaries (“NCREIF”). Exhibit 1 provides a flowchart which describes the methodology we applied to develop the MIRH and above-MIRH indices. This flowchart is followed by a detailed explanation of the process.
Exhibit 1: Methodology Flow Chart
NCREIF is the leading provider in the U.S. of investment performance indices for nonlisted, directly held commercial and residential properties. At the end of the second quarter of 2021 and as highlighted in Exhibit 2, NCREIF provided quarterly return performance data for over 9,500 properties, which had a combined market value in excess of $742 billion.
NCREIF aggregates property level total return performance from over 100 datacontributing members each quarter. These data-contributing members consist of institutional investment managers who have a minimum of $50 million in non-listed real estate assets under management. The performance indices which are created for the NPI reflect the quarterly
Exhibit 2: Composition of the NCREIF Property Index as of 2Q 2021
appraised performance of individual buildings on a tax-exempt and unleveraged basis. For a property to be included in the NPI, it must have an occupancy rate of at least 60% or, for a newly developed or renovated property, a year must have passed since the certificate of occupancy was issued.
In regards to the total returns within the NCREIF database, to our knowledge the income on the assets is not restricted due to deed restrictions or other limitations placed on the properties. In theory, if there were such restrictions, appraisers might use higher cap rates and lower growth rates compared to non-restricted assets to arrive at a determination of value which is used to calculate the total return on a property20 Such restrictions could distort the performance attributes. In our analysis, we assume there are no such income restrictions on the apartment properties in NCREIF’s database
NCREIF collects income, appreciation, and total return performance data from its data contributing members on 1,996 apartment communities in the U.S. At the end of the second quarter of 2021, these assets had a combined market capitalization of over $191 billion. This dataset comprises various classes of high-rise, mid-rise, and garden-style apartments owned and operated by these institutional investors. NCREIF uses the zip code information on a property to map them into a metropolitan area. For privacy reasons, NCREIF does not disclose the performance of individual assets, but it will provide performance indices for a metropolitan area if there are at least three properties owned by three different data contributing members.
The most granular reporting level is at the metropolitan designation, formed from entire counties, known as a Metropolitan Statistical Area (“MSA”)21 The broadest level is a Combined Statistical Area (“CSA”). For example, San Francisco and Oakland are considered to form part of one individual MSA, and San Jose is part of another When grouped with each other and with several smaller MSAs, they form part of a CSA that corresponds with a reasonable common definition of the entire “San Francisco Bay Area ”22
At the end of the second quarter of 2021, NCREIF reported on the apartment performance for 48 individual MSAs. Combined, there were 1,884 properties with a market capitalization of $185 billion included in these MSAs. When compared with the national apartment statistics, this implies 112 apartment assets totaling close to $6 billion in market capitalization were also included in the national apartment index. However, since the criterion of a minimum of three assets owned by three different data contributing members in an MSA was not met, NCREIF did not produce an MSA-level performance index.
20 The NCREIF return formula follows a similar formula for what is used in the equity markets. The return in a given quarter is equal to the income yield less expense for capital expenditures (“cap-ex”) such as physical improvements or leasing costs, plus the change in value of the asset over the quarter. The total returns used are based on the performance of the building and do not include mortgage costs. Assets are appraised each quarter and the ending appraised value reflects an estimate of the sales price. This one period calculation is equivalent to a single-period internal-rate-of-return (IRR) which assumes all the cash flows (both income during the period and sales proceeds at the end of the period) are received at the end of the quarter.
21 We acknowledge there can be a wide dispersion of incomes across a neighborhood and a more granular approach which evaluates the performance of MIRH assets at the zip code level could offer additional insights. However, HUD generally only provides a median income at the MSA versus neighborhood level. In addition, the more granular analysis would result in a smaller sample size of assets from NCREIF which would limit the robustness of the analysis.
22 For more information about the delineation of metropolitan areas, please see: https://www.census.gov/programssurveys/metro-micro/about.html
For the national level analysis and vintage year analysis, we eliminated 10 of the 48 metros from the analysis because NCREIF only started reporting MSA level performance much more recently than 200523. From the original list of 48 metros, this eliminated Baton Rouge, Boulder, Charleston, Columbus, Las Vegas, Oxnard, Sacramento, Salt Lake City, San Antonio, and Vallejo from consideration.
There were two West Coast metros, San Jose and Santa Rosa, which also did not have a separate performance index in 2005. However, since they are included in the larger San Francisco CSA, they were included in the initial screen. Similarly, NCREIF segments Philadelphia and Bucks County into two MSA-level indices. While this is the most granular level, they had a short history of apartment return performance. However, since both MSAs are included in the Philadelphia CSA, which had a longer time series, they were included in the initial MSA screening.
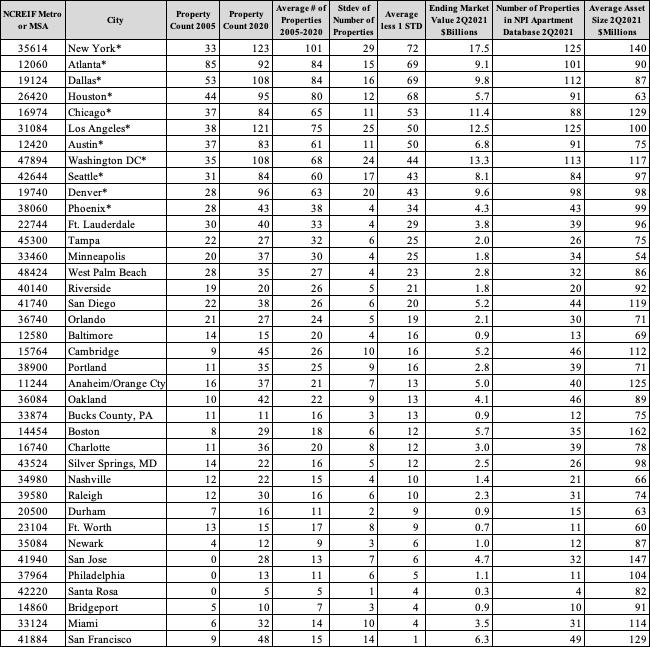
To identify metros for the MSA and CSA level performance analysis of MIRH assets versus above-MIRH assets, we established certain filtering criteria. Our objective was twofold. First, we wanted to ensure we had a reasonably large sample set over time for each category of assets within a given metro (either at the more granular MSA level or the larger CSA level) Second, we aimed to have a stable and minimum number of assets. Initially, we did not know the number of properties which would be available in our sample. To ensure a sufficient sample size, we selected those metros which had a high average number of properties over time and where the standard deviation of the property count within a metro was low. In other words, we sought to have a consistently large number of assets over time. Ultimately, we simply calculated the average property count over time (2005-2020) and subtracted one standard deviation from the mean and isolated those metros which had a minimum property count of 30. Our objective was to ensure we had a minimum of 10 assets within each category (MIRH vs above-MIRH) within a metro to generate some statistically relevant results. Our property count analysis is summarized in Exhibit 3.
23 We chose 2005 as the initial starting date for our analysis because that was the first year in which the average property count across all 48 cities exceeded 20 assets. We made an initial assumption to filter for a minimum of 20 properties anticipating having a minimum of 10 properties in the MIRH category and 10 properties in the aboveMIRH category.
Exhibit 3: NCREIF Apartment Index – Property Count Analysis; Ranked by Greatest Number of Properties
* Metros noted with an asterisk are those which met the authors’ property count criteria and were considered for metro level analysis. Properties for all metros were allowed to be included for the national and vintage year analysis
This led to the selection of 11 metros to undertake further analysis, namely; Atlanta, Austin, Chicago, Dallas, Denver, Houston, Los Angeles, New York, Phoenix, Seattle, and Washington, DC. Furthermore, to maximize our sample size, we utilized the broader CSA level for these markets versus the narrower MSA level. There were a few metros which fell slightly short of our required property count, namely Ft. Lauderdale, Minneapolis, West Palm Beach, and San Diego. While we excluded these from our metro-level analysis, they are included in the national and vintage-year analysis. For each of these metros, the property count varied over time
and was inconsistent. Nevertheless, these metros may provide areas for further research in the future.
Also, two notable exceptions to our metro-level analysis are San Francisco and Boston. While these metros are included in the national and vintage year analysis, they were dropped from consideration for the metro-level analysis due to the limited number of properties and the length of the time series available.
In the case of San Francisco, prior to 2017, there were fewer than 16 properties in the metro-level index. In the case of Boston, there were fewer than 19 properties included in the NCREIF database prior to 2015. Furthermore, while we could combine the MSAs in the San Francisco region (i.e., Oakland, San Jose and San Francisco) to increase the sample size, HUD produces a unique Median Family Income (“MFI”) level for each of these MSAs. As such, we would add bias in the analysis by creating our own CSA level MFI. For the national and vintageyear analysis though, each of the Bay Area MSAs were included and we applied HUD MFI published specific to each metro to have an apples-to-apples comparison.
The next step in our data analysis was to segment the properties within the database into those properties which had a rent level which a moderate-income household could afford, according to HUD’s definition (i.e., MIRH properties), and those properties which had a higher rent level (above-MIRH properties).
According to our research, a household is considered moderate-income if it is earning 80% or less of MFI. Further, housing is considered “affordable” if such a household is spending 30% or less on shelter costs. Shelter costs includes both rents and utilities. Thus, to develop a maximum rent/unit level which we could use to segment the properties in the NCREIF database, we combined data from the Housing and Urban Development (HUD) database24, the US Energy Information Agency (EIA)25 for electricity costs, and the American Housing Survey (AHS)26 for other utility costs such as natural gas, water and other fuels.
To arrive at a maximum monthly rent, we first consolidated MFI data for the 38 NCREIF metros using data from HUD. As seen in Exhibit 4, we constructed an MFI time series for each year for each city starting in 2000 through the second quarter of 2021. As seen in Exhibit 5, our maximum gross monthly allowable rent (inclusive of utilities) was derived from Exhibit 4. This table simply assumes a maximum rent which reflects 30% of 80% of MFI. For example, as shown in the first cell for Anaheim/Orange County in 2000, the median family income as depicted in the HUD tables was $69,600. Eighty percent of this amount equals $55,680 per year. Allowing 30% for shelter costs results in maximum shelter costs of $16,704 annually, or $1,392 per month as shown in the first cell in Exhibit 5.
24 HUD User, Office of Policy Development and Researchhttps://www.huduser.gov/portal/datasets/il.html#2021_data
25 U.S. Energy Information Agency, state level electricity costs. The link depicts data for 2020. Data for 2019 was derived from EIA schedules 861 – schedules 4A-D, EIA-861S and EIA-861U. The data was also reported by Move.org and published on November 12, 2021 by Mr. Joe Roberts. https://www.eia.gov/electricity/sales_revenue_price/pdf/table5_a.pdf
26 American Housing Survey, https://www.census.gov/programs-surveys/ahs.html. All data from 2019 or the most recent available. We used the “monthly total housing costs” table from Table Creator utility, with the tenure filter set to “renter”, with Variable 1 set to “year built,” and Variable 2 set to “units by structure type.” This allowed us to obtain utility expenditures for units in buildings built from 2010-2015 (or all buildings if year built data wasn’t available), and in buildings with 50 or more units.
Exhibit 4: Median Family Income by Metro
Source: HUD Office of Policy Development & Research as of October 4, 2021.
*Cities noted with an asterisk are those which met the authors’ property count criteria and were utilized for city level analysis. All cities were analyzed for the national and vintage year analysis.
Exhibit 5: Maximum Shelter Costs per Month, inclusive of Utilities, Assuming 30% of 80% MFI
Source: HUD Office of Policy Development & Research as of October 4, 2021.
*Cities noted with an asterisk are those which met the authors’ property count criteria and were utilized for city level analysis. All cities were analyzed for the national and vintage year analysis.
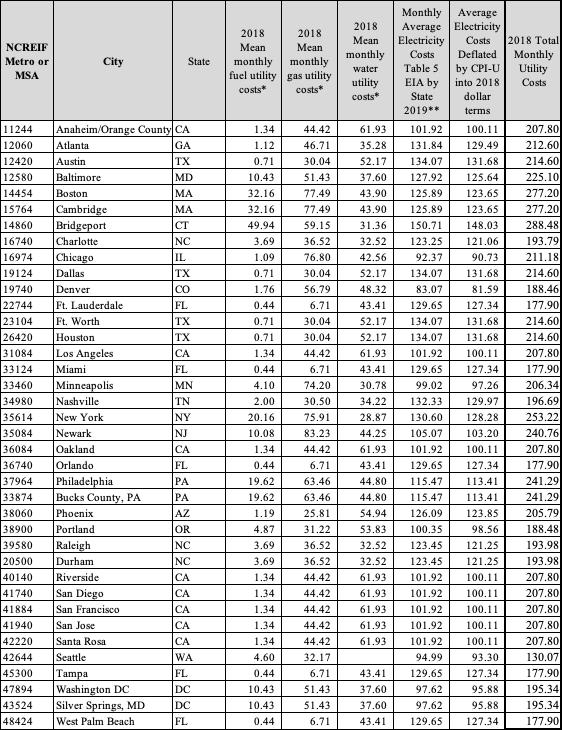
Our next step was to identify monthly utility costs for each of the 38 MSAs. We have two sources of information as noted above and as depicted in Exhibit 6. We utilized the AHS data for water, gas, and other fuels while using the EIA data for electricity costs. The AHS data by
definition is survey based, while the EIA calculates an average monthly residential electricity bill by dividing annual residential electricity revenues by the number of customer accounts and by 12 months. On the one hand, the EIA data is based on accounting versus survey-based data and we believe it is a superior data source for residential electricity costs. On the other hand, it reflects statewide versus metro-level data. When compared with the AHS, it seems somewhat more reliable in reflecting electricity costs whereas responses to the AHS questions may include other utility items and do not distinguish between for-sale and for-rent properties like those in the NCREIF database. Also, we did not include tenant utility costs for streaming or broadband internet services in our analysis. It is debatable whether these costs should be included in shelter costs. If we had included them, then our maximum monthly rent could be adjusted lower by roughly $80-$100 per month27
Exhibit 6: Monthly Utility Cost Analysis by Metro28
27 See Move.org estimates for state level broadband internet and streaming costs.
28 Source: 2018 American Community Survey for fuel, gas and water. US Energy Information Agency 2019, Table 5 for state-level monthly residential electricity costs
We first calculated the base year cost of monthly utilities as of 2018 for when we had the AHS data and then deflated these costs by the CPI-U index for the years 2000-2017 and inflated them for the years 2019-2020. This time series for the 38 MSAs is depicted in Exhibit 7. It is worth noting that our utility cost estimates averaged 3.69% (+/-0.67%) of 80% of MFI over time as well as on a cross-sectional basis across the metros. This compared favorably to the proportional weight of household energy as reflected in the basket of goods which comprises the consumer price index (CPI-U). As of December 2020, the relative weight of household energy costs in the CPI-U was 3.28%.29 Thus a comparison to the basket of goods in the CPI provided a reasonable check on our utility estimates as a share of median family income.
7: Monthly Utility Cost Analysis by Metro by Year, 2018 Base Year and CPI-U Adjusted
Source: Author's calculations using monthly city level utility costs from American Housing Community Survey, 2018 and monthly state-level electricity costs in 2019 from US Energy Information Agency table 5a. 2018 used as the base year and deflated or inflated using the CPI-U from the Federal Reserve FRED database *Cities noted with an asterisk are those which met the author's property count criteria and utilized for city level analysis. All cities were analyzed for the national and vintage year analysis
As shown in Exhibit 8, we subtracted the monthly utility costs as shown in Exhibit 7 from the maximum monthly shelter rent depicted in Exhibit 5. Thus, exhibit 8 reports the monthly maximum allowable rent, net of utilities, necessary for a household earning 80% of MFI to spend less than 30% on shelter costs.
Once armed with a time series of maximum monthly net rent (exhibit 8), we delivered the data to NCREIF. As NCREIF restricts access to building level data, it applied the filtering screen for each MSA and applied it to each apartment asset in its database. If a particular asset within an MSA in a given year had an average rent per unit at the property level which was less than the maximum rent per unit time series we created, then it was considered a building which provided an average rent per unit which was less than the amount a moderate-income family earning 80% of MFI could afford and was thus classified as a MIRH asset. If the building had a rent/unit
29 Bureau of Labor Statistics, Table A Relative Performance, December 2020 factsheet. https://www.bls.gov/cpi/factsheets/household-energy.htm
Exhibit
which was higher, then it was included in the above-moderate-income, or above-MIRH, category.
Exhibit 8: Maximum Monthly Net Rent – 80% of MFI x 30% Shelter, less Utilities
*Cities noted with an asterisk are those which met the author's property count criteria and utilized for city level analysis. All cities were analyzed for the national and vintage year analysis
All of the 38 MSAs highlighted in the table were screened. If the rent per unit of a property within a metro met our moderate-income criteria, it was included in both the national and vintage year analysis regardless of the property count within a given metro. In the case of the national analysis, a property was allowed to enter and exit the moderate-income category depending upon whether it met the criteria in a given year. Thus, it is not considered a “same store” analysis. To counter this potential bias in the analysis, we also evaluated the vintage year analysis for the 2005, 2010 and 2015 periods, as described earlier. In the case of the vintage year analysis, if a property met our criteria in the first year of the vintage year, that property was held in the moderate-income category through to the second quarter of 2021. Finally, for the metrolevel analysis, the sample sizes were smaller than the national statistics. As a result, we screened properties each year and if a property met the criteria in a given quarter, it was included in the MIRH analysis for that quarter. The results from our analysis are highlighted in the following section.
Finally, while the 2005 vintage year index had a start date of the first quarter of 2005, the start and end dates for other metros vary. In the case of the National index, the 2010 vintage index as well as the indices for Atlanta, Austin and Dallas, each had a start date of the first quarter of 2010. The time series varies for Denver and Phoenix which have a start date 2Q 2014. In both of these cities, since all properties in these markets had a rent level which was below our required maximum prior to this date, there weren’t any above-MIRH properties to compare to an MIRH index. In the case of Houston, during the latter half of 2018, there weren’t any qualifying MIRH properties in our sample which resulted in a broken time series, so those dates after 2018 were excluded. Further, the Seattle and Washington DC time series commenced in 2Q 2012, while the 2015 Vintage year commenced in 1Q2015.
FINDINGS
In this section we review the results of our analysis. Throughout this section we refer to our “Moderate Income Housing” indices as “MIRH”. We refer to the non-moderate indices as “above-MIRH”. We first review our National MIRH index against various asset classes. We will then review the performance characteristics of our city-level and vintage year indices.
Exhibit 9 depicts the return and risk of various asset classes over the last 10 years as of 2Q 2021. Risk is known as “standard deviation” and defined as the average uncertainty of total returns in a given year. A low standard deviation indicates that the returns tend to be close to their longer-term average, while a high standard deviation indicates that values are spread out over a wider range and thus are “riskier” or less predictable. As shown, our MIRH Apartment index (depicted as Moderate-Income Rental Housing) had the lowest risk amongst the asset classes depicted. Investors also use the Sharpe ratio to help decide how much return they receive compared to the risk they are taking. The Sharpe ratio measures the average return of an investment in excess of the risk-free rate (treasury bond yield) per unit of risk. Said differently, it determines if an investor receives more return for the level of risk. Indeed, the Sharpe ratio30 was 3.4 and was only eclipsed by the industrial market which had a Sharpe ratio of 3.7. From a total return perspective, only the S&P 500, the Nasdaq and the NCREIF Industrial sector posted higher returns.

Moderate Income Rental Housing outperformed the overall NCREIF Property Index Apartment sub-index (“NPI Apmt”) by 98 basis points (9.35% versus 8.37%) and did so with
30 A Sharpe ratio is used to help investors understand the return of an investment compared to its risk. The ratio reflects the average return earned on an investment which is in excess of the risk-free rate (the 90-day treasury bill) divided by the volatility (standard deviation) of the investment’s excess total return.
Exhibit 9: 10-Year Total Return and Risk of National MIRH vs Major Asset Classes
less risk (2.6% versus 3.2%). However, the NPI Apartment sub-index includes MIRH properties. Thus, when we compare our MIRH index with the above-MIRH properties, MIRH produced excess performance of 149 basis points (9.35% versus 7.86%). Also, the above-MIRH properties actually underperformed the overall NCREIF Property Index (NPI Total) by 98 basis points, while the MIRH index outperformed by 52 basis points.
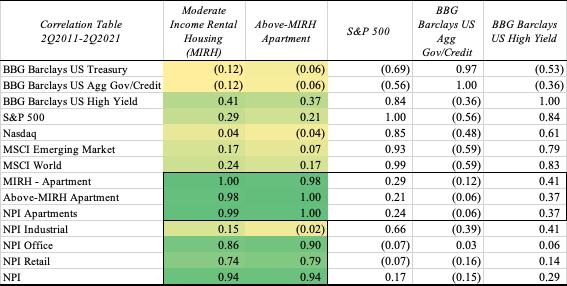
In light of the superior performance of MIRH, the question arises, were the correlation in returns relative to other asset classes different? We could not find a significant difference in the correlations as seen in Exhibit 10.
Exhibit 10: Correlation of Total Returns between MIRH, above-MIRH and Major Asset Classes
As depicted, the correlation in returns between MIRH to the above-MIRH index and the overall NPI Apartment sub-index was 0.98 and 0.99, suggesting that MIRH can be a substitute for above-MIRH properties from a portfolio diversification perspective. When compared to the overall NPI, the correlations between the MIRH index and the above-MIRH index were the same (0.94) over the timeframe analyzed. However, as will be discussed in the risk-metric section below, MIRH seemingly had some better defensive characteristics relative to above-MIRH housing.
When comparing the correlations of the various apartment indices versus a few equity and bond market indices, there was not a meaningful difference in the correlations. The only possible difference in correlations occurred with the industrial market where the MIRH index had a slightly higher correlation whereas the above-MIRH index was essentially uncorrelated. We suspect the reason may be due to better relative performance of MIRH versus above-MIRH housing when compared to the buoyant total returns of the industrial market over the last 10years.
We were somewhat surprised by the relatively higher performance of MIRH. Reflecting back on our filtering process, we realized NCREIF was not able to provide a continuous timeseries for MIRH properties in Chicago, Los Angeles and New York. Presumably, there were too few buildings in these metros which offered a rent level which was below our maximum rent
criteria. Therefore, because the MIRH Index may not include properties from Chicago, Los Angeles and New York, we could have a metro-selection bias when comparing performance between the National MIRH index, the above-MIRH Index and the NPI Apartment Sub-Index. To investigate this, we extracted the performance of these large cities from the NPI Apartment Sub-Index. The return and risk from this analysis is included in Exhibit 11, while the periodic returns are shown in Exhibit 12.
Exhibit 11: 10-Year Total Return and Risk of National MIRH vs Other NCREIF Sectors
Over the last 10 years as of 2Q 2021, collectively, the performance of the three largest metros weighed on the overall NPI Apartment Sub-index. Together, the combined performance of these cities underperformed the NPI Apartment sub-index by 147 basis points (6.9% versus 8.4%). If these metros were not included in the NPI Apartment index, the performance of the NPI Apartment sub-index would have increased 45 basis points to 8.82% (shown as the NPIApartment ex-Large Market in Exhibit 11). We also determined there was not a statisticallysignificant difference in the average returns of the MIRH Index and the NPI Apartment Subindex ex-Large Market index.31
Despite slightly higher long-term performance, the statistical analysis suggests the National MIRH assets and the NPI Apartment ex-Large Market index likely come from a similar population of apartment assets. As such, it provided evidence that buildings which provide a rent
31 From a statistical perspective, we calculated the F-statistic and determined the variances between the National MIRH Index and the NPI Apartment Index ex-large cities were uneven. As such, we computed a difference of means test assuming unequal variances. The results from that test provided a t-statistic of 0.43 versus a critical twotail t-stat of 2.1, corresponding to p=0.66 at α=0.05 which indicated there was not a statistically significant difference in the returns between the two indices.
level which can accommodate a moderate-income household could provide similar performance attributes. Thus, removing these large metros did not alter our basic conclusions.
Exhibit 12: Periodic Annual Total Returns – MIRH vs Other Apartment Market Segments32
As seen in the chart regarding the periodic returns, the MIRH Property Index outperformed each of the other indices shown and, in some cases, by a substantial amount. Given the discussion above, the NPI Apartment Ex-Large market is likely biased higher because it includes better performing MIRH properties but excludes worse performing above-MIRH housing from three large metros. Admittedly, there may be metro-selection bias in the National Analysis. For this reason, we wanted to isolate metro-selection bias by comparing MIRH assets and above-MIRH properties at the metro level as highlighted below.
Metro Level and Vintage Year Analysis
The total returns and risk for each metro analyzed along with the vintage year analysis are depicted in Exhibits 13 and 14. While the returns between the MIRH indices and the aboveMIRH indices are directly comparable for a given metro or a given vintage year, they are not directly comparable from one metro to another because the time periods vary for Denver, Houston, Phoenix, and the 2015 Vintage year as described earlier. The balance of the data points reflects the 10-year period ending 2Q 2021.
32 It is coincidence that the one year and ten year returns for MIRH are similar. To the second decimal point, the one-year return was 9.27% and the ten-year return was 9.32%
13: 10-Year Total Return & Risk by National and Vintage Year MIRH vs above-MIRH
14: 10-Year Total Return & Risk by Metro MIRH vs above-MIRH
Exhibit
Exhibit
A casual observation from these exhibits highlights the outperformance of the MIRH assets at a metro level or vintage year compared to the above-MIRH property indices. Also, because the vintage year indices reflect a compilation of metro-level assets, the diversification of holding assets in multiple metros serves to reduce risk. As the periodic returns of each category reported in Exhibit 15 show, in every instance except one, the MIRH index outperformed the above-MIRH housing index. The one exception was the trailing one-year performance in Seattle where the MIRH index lagged by 60 basis points over the last year as of 2Q 2021.
In addition to producing higher total returns, in most cases, the MIRH index also produced lower risk, which we defined in the customary way as standard deviation of returns. In the sections below, it appears the earnings yield for the MIRH indices were significantly greater than the above-MIRH indices which may provide some explanation for the outperformance. There were four exceptions, namely Atlanta, Denver, Phoenix and the 2015 Vintage year. In the case of Atlanta and Denver there was a positive deviation in performance. This occurred in 2017/18 in Atlanta and in 2014/15 for Denver, which contributed to the increase in volatility. For
Exhibit 15: Periodic Returns by National, Vintage Year and Metro – MIRH vs above-MIRH
Phoenix and the 2015 Vintage year, there was an increase in outperformance in 2021 which may be due to COVID-19. In the case of Phoenix, there was a large increase in returns. In the case of the 2015 Vintage, recall that the MIRH Index did not include properties from the three largest metros. In turn, returns may have been biased higher. Or conversely, the above MIRH returns for the 2015 Vintage year index were biased lower because the index included those three metros which performed quite poorly in 2021.
Despite the apparent outperformance and lower risk for MIRH across most of the indices considered, from a statistical perspective the question arises, are the returns between MIRH and above-MIRH properties statistically different from one another? Furthermore, even though they may or may not be statistically different, do MIRH properties produce higher returns? To answer these questions, we ran a statistical test on the data, the results of which are depicted in Table 9
Exhibit 16: Are Total Returns Between MIRH and above-MIRH Significantly Different?
The first grouping of columns in the table depicts the since inception returns for that category as also reflected in Exhibit 15. The second set of columns asks the question, are the average returns between the two indices for a given category equal to one another? A low pvalue (known as the probability value), such as below 0.10 (10%) as highlighted in the column, suggests that the chance of the returns being equal is so low (and less than 10%), then they can be considered statistically different from one another.33
There were only two instances where the returns were statistically different from one another. The 2015 Vintage year shows a distinct likelihood that the returns are different. However, as has been discussed, the significant difference in performance may likely be a function of metro-level composition (Chicago, Los Angeles and New York) versus the effects of MIRH versus above-MIRH properties. At a significance level of 10%, we found a statistically significant difference in performance in Phoenix MIRH and above-MIRH properties, and for Austin, Denver, and Seattle at the 15% level of significance.
Despite the realized outperformance of MIRH since inception as depicted for each category, proponents of affordable housing may be disappointed that we could not confirm a
33 In this test and others, our null hypothesis was that the mean, or average, between two comparisons were equal to one another. If the calculated p-value was less than 5% at the 0.05 alpha level, or 0.10 alpha level for a 10% significance test, then we could discard our null hypothesis in favor of the alternative which suggested they were unequal to one another.
statistically significant difference in the average returns. The more appropriate viewpoint might be, since the performance is not significantly different, why overlook the opportunity to invest in properties which seemingly provide competitive performance attributes and also provided a rent level which is within the budget of a moderate-income household? The analysis and evidence presented suggests that the returns for MIRH properties most likely lie within a distribution of what investors might generally expect from their apartment investments.
The second question we wanted to investigate was the direction of performance. Even though there was not necessarily a statistically significant difference, could we infer that the returns for MIRH were higher? Certainly, the evidence over the time frame analyzed as depicted in the table suggest MIRH total returns were higher. In this instance, we frame our question differently and asked, are the returns from MIRH index lower than the returns for above-MIRH housing? Again, if our p-value was lower than 0.05, 0.10 or 0.15, reflecting probability at 5%, 10% or 15%, then we could reject the notion that MIRH property returns were lower in favor of the alternative answer which was they were equal to or greater than the above-MIRH properties.
There are several cases where we can reject the theory that MIRH properties produced lower returns. Even though the 2015 vintage shows a p-value of 0.01, we believe this result should be discarded due to the large metro effect. The 2010 vintage is more encouraging as it shows a p-value of 0.03. This indicates the chance of MIRH producing such an outsized return when it actually doesn’t produce outsized performance is 3% or less. Other categories provided some additional evidence at varying degrees of significance, such as Austin, Denver, Phoenix, Seattle and the last eleven years for the 2005 same-store vintage period.
Risk Analysis
In addition to the total returns analysis perspective, we also evaluated other risk metrics, namely the beta and Sharpe ratios, as well as the correlations between the pairs for each category. This data is highlighted in Exhibit 17. The statistics for the MIRH properties are highlighted in bold and the data was analyzed over the period available for each category. In every instance, with the exception of Denver and Houston, the beta, or systematic risk between the MIRH and above-MIRH properties was lower. This implies MIRH properties may have lower downside risk. However, this also implies they may have lower upside risk (i.e., lower upside potential) as well. Overall, because each has a lower beta versus both the overall NPI and the NPI Apartment sub-index, MIRH may provide defensive characteristics in a portfolio.
Exhibit 17: Risk Metrics by National, Vintage Year and Metro – MIRH vs above-MIRH
In addition to the defensive characteristics, the table reports the Sharpe ratio for each index.34 With the exception of Denver, the Sharpe ratio in every instance was higher and indicates MIRH produced superior risk-adjusted returns relative to above-MIRH properties. In the case of Denver, the standard deviation of returns was higher, but so too were the total returns. Nevertheless, because the MIRH returns varied considerably from their average, the Sharpe ratio was lower.
Relative to the paired correlations between the MIRH and above-MIRH index for each category, all of the correlations were very high. This suggests that MIRH and above-MIRH properties within a metro or a vintage year typically cycle together and will be influenced by the general fundamentals and capital market activity within a metro. Again, we discard the results from the 2015 Vintage due to the large market effect. In the case of Atlanta, total returns for MIRH properties rose in 2017 and 2018 while the returns for above-MIRH properties were flat
34 The Sharpe ratio was calculated by subtracting the risk-free rate (90-day T-bill) from the total return and dividing the result by the standard deviation of returns over the time frame analyzed.
to declining. This caused the correlation in returns to decline and suggests that within Atlanta there could be some diversification benefits from the time period studied.
The other outlier is Seattle. In this particular case, the returns for above-MIRH properties were flat to decelerating from 2014 to 2017. During this same time, returns on MIRH properties were increasing. Further investigation into the supply and demand conditions suggest development activity had increased for higher end residential and may help explain why total returns for above-MIRH housing were receding.35
The analysis thus far suggests MIRH performed competitively to above-MIRH housing over the time frame studied. This suggests investors might enhance the performance of their apartment portfolio by considering properties which provide a rent level which a moderateincome household could afford. It does raise additional questions as to why they performed as they did. While a building-specific analysis may provide additional insights, that is an area for further research. However, NCREIF fortunately provided aggregated statistics on occupancy trends, capital expenditures, and earnings yield.
Analysis of Operating and Valuation Characteristics: Occupancy Rates, Capital Expenditures and Earnings Yield
In each analysis, we asked the question if occupancy rates, capital expenditures as a share of market value, and earnings yield were equal to one another across the MIRH and aboveMIRH indices. If the test statistic (seen as “t-stat” in the table) was high and the p-value (probability) was low, we could make the case that they were significantly different from each other. Likewise, we also wanted to determine the direction (either higher or lower) even if the series were not significantly different from each other. In the case of the directional question for the occupancy analysis (as shown in Exhibit 18), we reversed the question and asked if aboveMIRH occupancy was lower than MIRH. If the t-stat was large and the p-value was low, then we could confirm MIRH had a lower average occupancy rate over time.
Exhibit 18: Are Occupancy Rates between MIRH and above-MIRH Significantly Different?
35 During the 2014-2017 timeframe, inventory growth in Seattle ranged between 3.2% to 3.5% per year as reported by CoStar. As can be seen in Table 11, the occupancy rate for above-MIRH assets was much lower and suggests the market was trying to absorb this new supply.
Similar to our total return analysis, the table describes the historical average occupancy rate for each index within a given category. For example, over the time frame analyzed, the average occupancy rate for MIRH in Atlanta was 93.3% while above-MIRH had a higher occupancy rate of 94.2%. In Atlanta, was there a statistically significant difference in the occupancy rates between the two indices? As it turns out, there wasn’t a statistical difference at the 0.05 probability level because the p-value was 0.06. However, at a less stringent significance level of 0.10 probability, there was a significant difference in the occupancy rates of the two series. From a directional perspective, we can determine from the analysis that there was only a 1% chance that above-MIRH housing had a higher occupancy rate when it did not. Thus, in the case of Atlanta, the analysis provides reason to believe there is a significant difference in occupancy level and that MIRH has a lower occupancy.
In several instances, it appears there generally is a significant difference in the occupancy rates for MIRH and most likely, MIRH has marginally lower occupancy rates. However, there are a few examples where this does not appear evident, such as Houston, Phoenix, Seattle, National and the 2010 Vintage indices where occupancy rates were significantly different. In Houston, Phoenix and National Indices, not only were the occupancy rates different, but the above-MIRH apartments had a higher occupancy. In the case of Seattle, and 2010 Vintage, though, the statistical evidence suggests MIRH had a higher occupancy. Overall, the analysis leaves the question as to why occupancy rates for MIRH were slightly lower than for aboveMIRH? There could be several reasons such as the location of the properties or the amenities provided. This is beyond the scope of this analysis. However, given the positive relative performance of MIRH, increasing the occupancy rate could enhance performance further.
Another possible reason for lower occupancy may be due to asset repositioning. To analyze this, we compared the capital expenditures as a share of market value (abbreviated as “cap-ex”) between the two categories; the results of our statistical tests are shown in Exhibit 19 We did not control for the individual property size. This is important to note as the average asset size in terms of market value was greater for the above-MIRH properties. Thus, the expenditures as a share of market value could be lower on the above-MIRH properties due to economies of scale given the large market capitalization. In other words, higher valued properties would presumably have a lower cap-ex share of market value simply due to a larger denominator and scale of a property, all else being equal.
Exhibit 19: Are Capital-Expenditures as % of Market Value Significantly Different Between MIRH and above-MIRH?
Similar to the previous tables, we show the historical annual average cap-ex as a share of market value for each index category followed by the test statistics. As is obvious in the table, the MIRH indices all had higher cap-ex percent compared to their counterparts. Again, additional analysis could control for asset size. With the exception of Dallas and the 2010 Vintage, the capex between the two indices was significantly different. Across all of the categories, the difference in the cap-ex proportion was 0.56% +/-0.30%. Accordingly, not only was there a significant difference in cap-ex, directionally cap-ex on MIRH was higher.
The question arises, if MIRH total returns are seemingly higher, while occupancy rates are marginally lower (average -0.11% +/- 1.26%) and cap-ex as a share of market value is higher, then what could cause the better relative performance trends we have shown? The answer may lie in the “basis” of the property as reflected by the higher earning yields for MIRH properties. The earnings yield provided by NCREIF closely approximates the current income yield. All else being equal, a higher income yield leads to a higher total return. As shown in Exhibit 20, the historical average earnings yield for each index and category is highlighted in the table. Across all categories, MIRH provided a higher average earnings yield of 0.50% +/-0.18% relative to above-MIRH.
Exhibit 20: Are Earning Yields between MIRH and above-MIRH Significantly Different?
With the exception of Atlanta, Austin, Denver and Houston, the earnings yield had a statistically significant difference. In addition, with the exception of Houston, not only were the earnings yields statistically different, they were also higher for MIRH. Perhaps the valuations are lower and the earnings yield higher as investors seek to underwrite potentially lower occupancy and higher capital expenditures. Nevertheless, the evidence suggests the valuations as reflected in the earnings yield offsets this risk to some degree, thus providing a compelling reason to consider investing in those types of properties which provide a rent level which is affordable to moderate income households.
DISCUSSION AND RECOMMENDATIONS
Although many results are presented in the previous section, we can summarize the topline findings as follows:
• Moderate Income Rental Housing (MIRH) compares favorably in terms of its return and risk profiles since 2011 as compared to other common asset classes.
• Since 2011, MIRH has outperformed otherwise similar above-MIRH assets, i.e., rental apartment assets that are also captured within NCREIF’s data set but whose rents exceed the 80% of AMI threshold. This finding persists even when we eliminate the large New York, Chicago, and Los Angeles markets from the analysis, which lack MIRH assets, and whose relatively poor return metrics might otherwise be expected to heighten the contrast between MIRH and above-MIRH performance. The superior performance of MIRH finding is also robust to “vintage” analysis, i.e., comparing the performance of assets that begin a given period (starting in either 2005, 2010, or 2015) as MIRH versus aboveMIRH over time.
• MIRH returns since 2011 have exhibited relatively low correlations with indices of other mainstream asset classes, i.e., stocks, government bonds, and high-yield bonds.
• Despite the narrative of tightening rental market conditions over the last decade, particularly at the lower end, MIRH assets since 2011 in our dataset have somewhat counterintuitively exhibited slightly lower occupancy rates than above-MIRH assets.
• MIRH assets since 2011 have required higher capital expenditures than above-MIRH properties. However, these higher capital requirements are more than offset by the MIRH assets’ higher income and total returns.
• Analyses of individual metros with sufficient data coverage to permit comparison between MIRH and above-MIRH assets reveal that the patterns enumerated above hold up almost without exception. This is true in Sunbelt metros (Atlanta, Austin, Houston, and Phoenix), gateway metros (Washington, DC and Seattle), and Denver.
We can summarize these findings with high-level takeaways about MIRH as an asset class. Based on recent performance, MIRH is an attractive ESG alternative to both conventional investment-grade multifamily and to other common asset classes in terms of its return relative to risk. Investors in MIRH should expect that such assets will often require higher capital expenditures not surprising given that these properties should be expected to be older or slightly less up-to-date in the average case as compared to properties with higher rents within the same metros. However, investors, on average, are more than compensated by superior returns over the time frame studied. Finally, while nothing is guaranteed, there are reasons to expect that the robust performance of MIRH will persist during the 2020s. Their (surprisingly) higher vacancy rates, combined with favorable market conditions nationwide for rent growth and a supply response that will take years to fully manifest in many metros combine to point the way towards a high probability of MIRH’s advantages persisting in the years to come. These favorable trends suggest that efforts to solidify MIRH as a recognized asset class would be rewarded in the near term.
Establishing
MIRH
as a recognized asset class
One of the unique challenges of MIRH as a potential defined asset class is that success in the very return metrics that we analyze in this report is likely to fuel suspicion among the broad spectrum of the public that is concerned about housing affordability, and the policymakers who respond to such concerns. “Doing well by doing good” is an inherently different proposition in an affordable housing development than it is in, for instance, for a wind farm project. In the latter case, there is likely to be little public scrutiny towards the underlying reason for higher-thanexpected returns, whether the real reason was higher energy prices, better-than-expected project delivery, or some other factor. In fact, financial success is likely to be celebrated as a portend of increased interest in clean power generation. In MIRH, by contrast, there is a risk of a perceived conflict between financial success and the wellbeing of the tenants being served.
One highly useful strategy for countering this tension would be for the institutional multifamily investment industry to develop and coalesce around an agreed upon standard that would identify a given property as certified MIRH housing.36 As a starting point for discussion, we propose that a certified MIRH property must 1) rent all of its MIRH-compliant apartments to households earning less than 100% of the median family income for its metro area, adjusted by household size; and 2) for those units charge rent that, when combined with utility costs, is less than 30% of the median, household-size adjusted income corresponding to 100% of MFI.
One important issue to resolve would be how to handle the question of income mix within a given property, as mixing MIRH and above-MIRH apartments within the same property could be a desired option in many cases. Possibilities for addressing income mix within a MIRH standard include reporting the percentage of an asset that is MIRH compliant (e.g., “Example Project is 45% MIRH-compliant”), or setting minimum thresholds for eligibility, as is the case with the LIHTC, or both. Another important issue that would need to be addressed would be a minimum time period for an asset to be deemed compliant with the official MIRH designation, and whether the MIRH restrictions would remain in force in the event of a sale. (Arguably they would need to in order to provide meaningful protections to the tenants, just as is the case in typical housing subsidy mechanisms such as the LIHTC.) In any event, if such a standard were adopted, and were widely recognized as credible, MIRH would come to be seen as an important element (though one among many) of a comprehensive public strategy to ease housing unaffordability.
At least two precedents provide valuable lessons as to how a MIRH standard could be successful. One is the Enterprise Green Communities (EGC) standard, a green building standard created by Enterprise Community Partners (a large national nonprofit) in 2004 in collaboration with the affordable housing industry. Although the US Green Building Council’s more widelyknown Leadership in Energy and Environmental Design (LEED) is also an instructive precedent, EGC is a binary standard with minimum requirements needed for a given property to qualify, as would need to be the case for a MIRH standard. Both EGC and LEED are successful examples of standards that have proven durable because of industry involvement in their creation and ongoing efforts to keep them updated over time to reflect changes in technology and industry best practices.
The other precedent comes directly from affordable housing and was already mentioned earlier in this report: the Low-Income Housing Tax Credit (LIHTC). One ingredient in the
36 We do not claim that the name of the standard would be “certified MIRH housing,” nor that MIRH will be the industry’s agreed-upon name for what we are labeling MIRH. In fact, branding and naming are important ingredients for success for a new standard and would need to be carefully considered.
success of the LIHTC is its clear and transparent criteria for eligibility. Another, as noted by Federal Reserve researcher David Erickson, is that investors are incentivized to police multifamily asset owners’ compliance with the LIHTC standards as codified in the federal tax code.37 To do so, they (or their fiduciaries) scrutinize rent rolls on an annual basis to verify that tenants’ incomes and rents are underneath the allowed thresholds, because otherwise the investors’ tax credits could be in jeopardy of recapture by the Internal Revenue Service. This structure, Erickson argues, has allowed the LIHTC to largely avoid the rash of corruption and self-dealing scandals that plagued earlier iterations of HUD direct subsidy programs. Even if a certified MIRH program would likely be more analogous to the EGC standard in its form and structure than the LIHTC, the lesson of the LIHTC is that a robust and rigorous system of enforcement is necessary for an affordable housing standard to be widely viewed as credible.
At times, the “S” in ESG is more difficult to benchmark than the “E.” So many aspects of environmental performance of a given investment are readily quantifiable and measured: tons of CO2, stormwater runoff, number of bird species present, etc. By contrast, social phenomena can be much harder to quantify, since the lives of human beings and the extent to which they get better as a result of a given investment are much more difficult to measure and quantify. In this regard, certified MIRH arguably has a leg up on other socially-focused ESG investments. Because quantifying the income limits associated with a given housing unit (e.g., 80% of MFI) is already a routine practice in affordable housing within not only LIHTC-funded assets, but others such as housing supported by inclusionary zoning ordinances or HUD funding, for example this set of practices can be easily extended up the income ladder to encompass MIRH. But the other side of the coin is that policymakers and affordable housing advocates will expect the same levels of credibility and transparency with MIRH affordable housing as they do with other types of affordable housing. To harness the potential of MIRH for housing-focused ESG investment, and to avoid the potential pitfalls, industry collaboration and agreement on a rigorous and well-designed certified MIRH standard, along with credible enforcement mechanisms, will be paramount.
Prospects for a productive public sector role in growing MIRH
Although industry interest in MIRH is likely strong enough on its own to power growth in this emergent asset class in coming years, there will nevertheless likely be strong interest from the public sector as well. It will be useful for the industry to anticipate and strategize around the points of connection between MIRH investment and a productive role that the public sector could play in helping it grow.
From the point of view of the public sector, not to mention everyday citizens, it is important to recognize that the importance of MIRH lies not simply in its expansion of the stock of rental housing which can accommodate households earning less than 80% of MFI. This is an obvious and widely understood benefit of MIRH. A less-recognized benefit of MIRH is its potential to offer stability to existing tenants. Whereas policy mechanisms that protect homeowners from housing cost increases over time, ranging from federal backstopping of 30year fixed rate mortgages to a wide variety of state laws that hold property tax increases in check38 , are widespread, the same cannot be said for rental housing. Although in 2019 Oregon
37 David J. Erickson. 2009. The Housing Policy Revolution: Networks and Neighborhoods. Washington, DC: Urban Institute Press.
38 Adam H. Langley and Joan Youngman. 2021. “Property Tax Relief for Homeowners.” Lincoln Institute of Land Policy. URL: https://www.lincolninst.edu/publications/policy-focus-reports/property-tax-relief-homeowners
passed an “anti-gouging” law, in which annual rent increases are limited to 7% plus CPI, the vast majority of renters in the United States live in jurisdictions in which local and state laws impose no limits on the rent increases they may experience upon lease renewal. In a time of constricted rental housing supply and surging demand, local governments nationwide are under pressure to not only expand the rental housing stock (ideally with minimal use of taxpayer dollars) but to find ways to provide protections for existing renters. They will almost certainly view MIRH as a means of accomplishing both objectives. Those interested in the growth of MIRH as an asset class should consider the opportunities and avoid the pitfalls of governmental involvement in this sector.
With this basic framework in mind, there are at least three basic ways in which local governments may interface with MIRH in coming years. First, they may contribute public funds alongside private investment capital in MIRH investment funds. Such public dollars would be expected to earn a return, just as is the case for private investment capital, but could be positioned as patient capital in order to widen the types of MIRH development projects or acquisitions that are economically feasible.
Second, local governments may offer “light touch” subsidies to specific MIRH developments. Traditional public sector affordable housing finance involves the expenditure of large quantities of local, state, federal, or philanthropic dollars sometimes all of the above per unit produced in a single project. Often these subsidies total to hundreds of thousands of dollars per unit. This set of practices is unlikely to change in the production of low-income rental housing in the near future. However, there is increasing interest among local governments in infusing smaller (“light touch”) per-unit dollar amounts into MIRH projects to encourage their development (if new build) or preservation (if existing), with the funds often arriving via sources that are deferred, indirect, or in-kind.39 Examples include preferred land use approvals for MIRH projects; expedited building permit issuance; property tax abatements; reduced connection fees from municipal utility providers; parcels leased or purchased at below market rates from a city; and others. For instance, Affordable Central Texas, one of the funders of this project, frequently partners with governmental entities such as public housing authorities in order to take advantage of their ability to secure property tax abatements on multifamily properties.
In return for providing light touch subsidies, cities or other governmental entities may ask for concessions from developers and asset owners that are not as thoroughgoing as deep income targeting in traditional affordable housing, but that may go beyond simply adhering to MIRH income thresholds. Examples could include acceptance of Housing Choice (“Section 8”) Vouchers or enrollment in a proactive eviction prevention program.40
Finally, in the past US cities and states implemented programs, such as New York State’s Mitchell-Lama program from 1955, that acted aggressively to expand the supply of middleincome rental housing in cities To this day, over 100,000 Mitchell-Lama apartments exist in New York City.41 Developments such as Lafayette Park in Detroit, Carl Sandburg Village in Chicago, and Park La Brea in Los Angeles are all examples of large, urban middle-income housing developments initiated in the mid 20th century with heavy involvement from the public
39 Family Housing Fund. 2013 (June). “The Space Between: Realities and Possibilities in Preserving Unsubsidized Affordable Rental Housing.” URL: https://www.fhfund.org/report/the-space-between-preserving-affordablehousing/
40 Shelby R. King. 2021 (December 3). “How One of Boston’s Top Evictors Changed Its Ways.” Shelterforce. URL: https://shelterforce.org/2021/12/03/how-one-of-bostons-top-evictors-changed-its-ways/ 41 Ford and Schuetz, 2019.
sector. Although from the vantage point of 2021 it is difficult to imagine a repeat of the heavy use of eminent domain for land acquisition and clearance, as was employed in many such past developments, it is nevertheless possible that local governments may eventually once again act aggressively to promote MIRH or analogous development as concern about housing affordability for middle income households mounts.
One final observation about the role of government is in order: the need for public sector involvement to achieve MIRH development will vary drastically according to local market conditions, not to mention the cost of development as driven by availability of developable land, the level of stringency and unpredictably in the local land use approvals process, and other factors. This variation is shown in Table 14, which reports the ratio between median market rate apartment rents for 2021 as recorded by CoStar, and the rent affordable to a household earning 80% of MFI per our methodology detailed earlier in this report. In well-functioning space, land, and development markets for multifamily rentals, it should be possible to serve households at 80% of MFI without taxpayer subsidies. This is the case for eight out of the 11 metros shown. In these metros, median market rents are below 80% of MFI; in other words, it can be said that the market is generally serving households earning this level of income.
In Phoenix to a slight degree, and in Los Angeles and New York to much more extreme degrees, the situation is different. In these markets households at 80% of MFI cannot afford the median unsubsidized rental available on the market (at least the portion of it captured by CoStar’s data set). It is likely impossible, particularly in New York and Los Angeles, for new unsubsidized development to serve households within the MIRH income band as we have defined it.
Exhibit 21: Median market rents compared to 80% of MFI rents for selected metros, 2021
Thus the role of local governments in promoting MIRH will vary according to context. In more balanced markets, such as Dallas-Fort Worth or Seattle, public dollars commingled with investor dollars and “light touch” subsidies may be sufficient to nudge a healthy share of new multifamily development into the MIRH category. Even in the absence of such subsidies, investor appetite for MIRH assets, for the reasons we detail in this report, may be enough on its
own for substantial quantities of MIRH development to proceed, and for existing assets with MIRH potential to be formally repositioned as MIRH. By contrast, in the more extreme markets, such as Los Angeles and New York, more aggressive actions will likely be needed to promote MIRH development. In such places, MIRH likely won’t simply appear purely as a result of investor appetite; indeed, it is not a coincidence that we were unable to compare MIRH versus above-MIRH asset performance in these markets, since the former were simply absent from the NCREIF data set. Even the more balanced metros contain high-cost urban and suburban submarkets in which MIRH development may not be economically feasible without subsidy. Despite these differences in context, MIRH will make a meaningful contribution everywhere it is deployed, even in the more balanced markets, for the simple reason that it will provide assurance of stable rents for its tenants over time
Future research
We regard this report as only a first step in proving out the viability of MIRH as a viable and well-recognized investment asset class. As detailed in the methods section above, our data set imposed some limitations that required us to make certain simplifying assumptions. For instance, we relied on median rents reported at the level of individual assets, rather than disaggregated unit-level data linking individual apartment rents with the units’ bedroom counts and square footages. In addition to unit-level data, asset-level data on within-metropolitan location, building-level amenities, and other information would allow for finer-grained comparisons of MIRH to otherwise similar multifamily assets in terms of investment performance, and to quantify the propensity for multifamily assets to migrate in or out of the MIRH category over time. We aim to pursue research along these lines in the future.
A last word
One of the basic questions about MIRH as an asset class, as with so many forms of ESG investment, is whether it can deliver financially for investors. This report presents a first round of findings that strongly suggest the answer to that question is an emphatic “yes.” Of course, as noted, further rounds of research will be needed to further prove out the concept of MIRH as a defined investment vehicle.
However, a related set of questions about MIRH housing, again as with all ESG investment, is whether it can deliver for those who are not its investors, i.e., for those who are intended to benefit from its positive environmental, social, or governance attributes. In March of 2021, writing in Harvard Business Review, Michael O’Leary and Warren Valdmanis titled an op-ed as “An ESG Reckoning Is Coming.” As they put it, “When companies offer insincere commitments or overpromise transformation, they risk the real work being done by others … Token programs and philanthropic side projects erode the public’s trust and invite backlash against the reform movement itself.”42
Luckily, multifamily investors, asset managers, lenders, developers, property owners, and others in the industry have an opportunity to avoid these negative outcomes while building a new ESG asset class with ample room for growth and potential to deliver meaningful social outcomes. Realizing this potential will require, in our view, not just additional proof-of-concept research but also a concerted effort within the industry to codify a meaningful and transparent standard that inspires confidence in MIRH as a concept (whatever name or label eventually
42 https://hbr.org/2021/03/an-esg-reckoning-is-coming
comes to be widely known). In addition, a productive and mutually beneficial collaboration with the public sector, particularly local governments, will be essential to maximizing the potential investment and social benefits that a new MIRH asset class can yield. The opportunity awaits; now it is time to seize it.