FOR QUESTIONS OR MORE INFORMATION:
Rowan Parris
Embodied Carbon Program Manager rparris @tcco.com 980. 402 . 4881
Lindsey Landwehr-Fasules Director - Sustainability lfasules @tcco.com 312 . 446 . 0944 Julia Gisewite V.P. Sustainability jgisewite @tcco.com 202 . 439.9970
OVERVIEW We are pleased to release the 2024 update to Turner’s Embodied Carbon Benchmark on the following page. This report highlights the continued progress and evolving trends in greenhouse gas emissions associated with the material footprint of our projects. Below is an updated snapshot of key findings and opportunities for further reduction of embodied carbon in the building materials studied. We hope this benchmarking report will inspire meaningful advancements in the way we build, work, and live within the built environment.
SUMMARY This report reinforces key findings from prior studies on the embodied carbon footprint of new commercial buildings in the United States and provides new insights into industry progress. Specifically, this study indicates:
• Observed reductions in embodied carbon coefficients year-over-year reflect measurable industry action
• New statistically significant relationships between embodied carbon and project characteristics are revealed by a larger sample set of projects
Future reports may include materials like aluminum, insulation, gypsum board, and acoustic panels to provide a fuller scope of building enclosure and interiors. Further, incorporating MEPF and other systems will offer a more complete picture of embodied carbon in buildings studied.
TRADE SPECIFIC DETAILS of this Embodied Carbon Baseline include:
CONCRETE:
• This study includes ready-mixed concrete, precast concrete, concrete masonry units (CMU), aggregate, shotcrete, flowable fill, concrete paving, or cementitious soil treatment
• In this study, concrete materials contributed to an average of 49.1% of a building’s embodied carbon footprint
STRUCTURAL STEEL:
• This study defines structural steel as hot-rolled sections, concrete reinforcing (rebar, wire mesh, and pre- or post- tensioning tendons), metal decks, plate steel, hollow sections, or merchant bar
• In this study, steel materials contributed to an average of 42.5% of a building’s embodied carbon footprint
ASPHALT:
• This study includes only asphalt paving materials. Roofing and waterproofing products were excluded, though they may be considered in future iterations of the report
• In this study, asphalt materials contributed to an average of 3% of a building’s embodied carbon footprint
GLASS:
• This study defines glass as flat or processed glass panes used in the exterior building façade and in interior storefront applications Mirrors and small door lites have largely been excluded.
• In this study, glazing materials contributed to an average of 4 9% of a building’s embodied carbon footprint.
WOOD:
• This study defines wood as prefabricated mass timber elements, dimensional lumber, and sheet products where quantities are known (e g roof blocking, floors, doors) Miscellaneous in-wall blocking is excluded from this report.
• In this study, wood materials contributed to an average of 0 4% of a building’s embodied carbon footprint.
• Note: Only two projects included in this year’s sample contained mass timber This study best reflects other wood products, not mass timber’s overall embodied carbon contribution.
FINDINGS METHODOLOGY
WHAT IS IN THIS REPORT? Among the information included in this publication, and of special importance, is the Turner Embodied Carbon Coefficient. This multiplier was determined by analyzing a sample of Turner projects representing nearly $12B and more than 16M SF in the United States. Sampled projects were modeled in the Embodied Carbon in Construction Calculator (EC3)1 using material quantities for five key materials estimated during preconstruction along with localized industry embodied carbon data.
33.80 kg CO2e/ft2 is the average “realized” carbon intensity of five key materials concrete, steel, asphalt, glass, and wood in this year’s project sample at the time of estimation in preconstruction. This coefficient is presented with the following qualifiers:
• Projects in the sample with scope limited to selective renovation were excluded from the coefficient to avoid skewing the average downward.
• Some project estimates included one or more product-specific EPDs, though most relied on localized industry averages in EC3. Excluding product-specific EPDs and using only localized industry averages, also known as “conservative” emissions factors in EC3, increases the coefficient to 34.09 kg CO2e/ft2. For more information on how EC3's "realized" and "conservative" metrics differ from a fixed set of industry baselines, please refer to the 2023 version of this report, available upon request.
The Embodied Carbon Coefficient can be used to quickly and easily approximate a baseline for the upfront embodied carbon footprint of a construction project or portfolio. A project-specific EC3 model using actual material quantities and EPD data is preferred for accurate benchmarking and reduction tracking, but Turner’s Embodied Carbon Coefficient can be used as an initial approximation or starting point.
For example, the average project size in the study is 239,401 ft2, so the baseline embodied carbon of concrete, steel, asphalt, glass, and wood material for a building of this size would be:
Beyond the project level, Turner’s Embodied Carbon Coefficient may also serve as an indication of industry progress toward emissions reduction targets in the construction materials sector. Using the “conservative” emissions factors, this year’s coefficient decreased by 7.67% from 36.92 (2023) to 34.09 (2024), while the 'realized' coefficient decreased by 7.17% from 36.41 (2023) to 33.80 (2024).
By isolating concrete and steel materials, the comparison can be extended one more year to include the original Baseline Report from 2022. The year-over-year “conservative” coefficients show a 6.67% decrease from 35.35 (2022) to 32.99 (2023) and a further 12.49% decrease between 2023 and 2024 (28.87). While small, these incremental reductions reflect a market shift and much-needed increase in availability of lower-carbon construction materials.
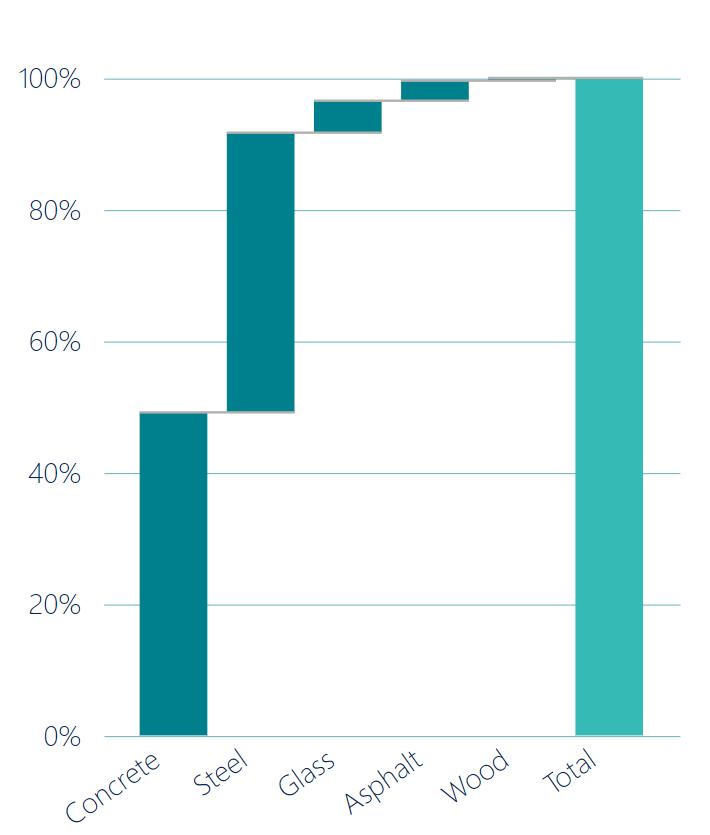
Concrete and steel continue to lead by a strong margin when considering the overall embodied carbon footprint of the five materials studied, making them key targets for reduction strategies. The chart below (left) shows the average contribution of each material type and highlights shifts from last year’s sample.
Concrete’s relative contribution decreased slightly from 53% to 49.1%, while steel increased from 33% to 42.5%, approaching the 50/50 split shown in the 2022 version of this report. Glass (6% to 4.9%), asphalt (7% to 3%), and wood (2% to 0.4%) showed reduced contributions in the 2024 sample.
These moderate shifts are likely to reflect variability in project types which are included in the sample set from year to year. For more details, see the right-most panel on selection methodology.
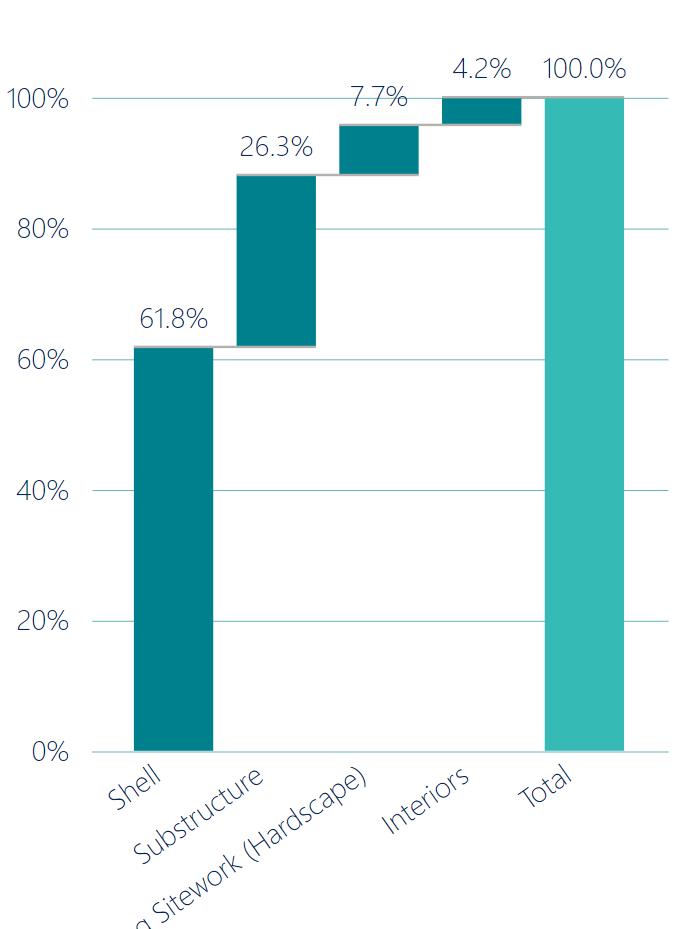
New this year, the second waterfall chart below (right) outlines the breakdown of average embodied carbon contribution by Uniformat section offering additional insight into which
This year’s larger sample set enables deeper exploration of a topic first introduced in the 2022 report: the relationship between embodied carbon and key project characteristics. While gross floor area was the only statistically significant predictor identified in the smaller 2022 dataset, the 2024 sample reveals two additional significant relationships: Risk Category and Level of Development. A third factor, Seismic Design Category, showed strong visual correlation but fell just short of statistical significance. The following charts illustrate these findings, offering new insights into how project characteristics influence embodied carbon outcomes.
67 projects were modeled for this study with the following criteria:
• Project scope has been awarded to Turner or a Turner-led JV,
• Building is either ground-up/new construction or a renovation/expansion with at least 3 of the 5 tracked materials included in scope, and
• Project is currently in Preconstruction (at the time of selection in 2024).
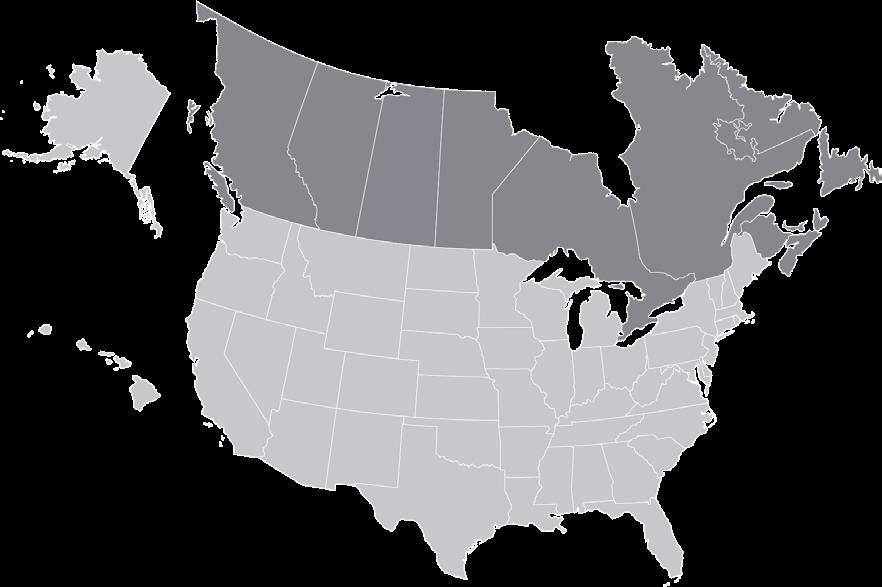
Projects represent a cross-section of geographic and building typology market segments in the U.S. and Canada totaling nearly $12B and more than 16M SF across 39 Business Units (BUs).
This study includes a range of building sizes, from 5,400 ft² to 1.35M ft². The average (mean) gross floor area is 239,401 ft², while the median is 166,872 ft², reflecting a slight positive skew. Compared to the 2023 sample, the 2024 dataset has 189% more projects, but the range is tighter with fewer projects exceeding 1M ft², reducing
Total project revenue is distributed similarly in this dataset, with a slight positive skew due to a smaller median ($115.7M) than the mean ($177.2M). Revenues range from $4.02M to $905.7M. Compared to 2023, the 2024 dataset is larger in number, but the range is tighter with fewer projects exceeding $1B, reducing overall skew from last year.
However, three projects were selective renovations, and two included mass timber elements.
This study modeled projects across 39 different BUs. Most were new construction, evenly split between concrete and steel composite structures.


