Town of Westlock respectfully acknowledges that we live, work, and play on the traditional and ancestral territories of many Indigenous, First Nations, Metis, and Inuit peoples. We acknowledge that what we call Alberta is the traditional and ancestral territory of many peoples, presently subject to Treaties 4, 6, 7, 8 and 10 and Six Regions of the Metis Nation of Alberta. We acknowledge the courageous and resilient community leadership of Indigenous leaders, of all ages. Knowledge Keepers, and Elders who are still with us today and those who have gone before us. We make this acknowledgement as an act of reconciliation, gratitude, and commitment to pursuing an inclusive, collaborative, and respectful path towards building strong communities.
ABOUT THIS REPORT
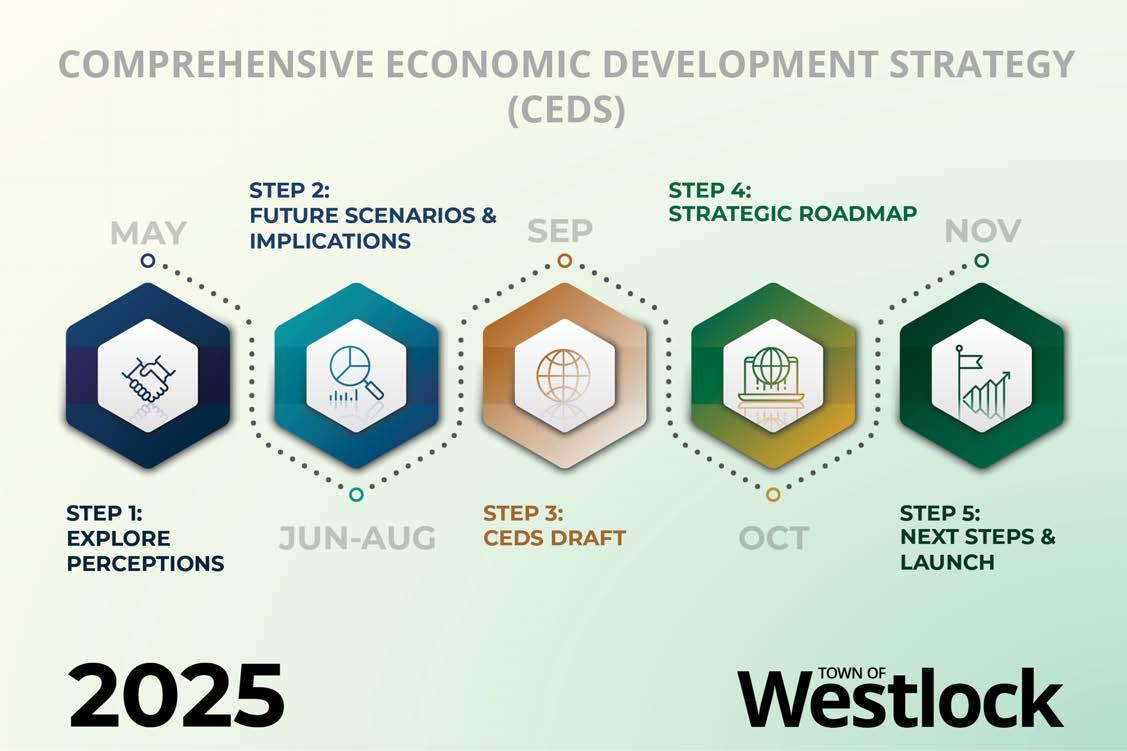
The Town of Westlock is developing a new Comprehensive Economic Development Strategy (CEDS) to guide long-term planning, attract investment, and foster sustainable growth (Figure 1). This SocioEconomic Benchmark Report provides a foundational analysis of Westlock’s current demographic and economic landscape, comparing it to similar communities across Alberta.
Prepared by the Planning and Development Department, the report offers insights into population trends, housing, income, education, and workforce characteristics. It is intended to support the CEDS process by identifying key opportunities and challenges shaping Westlock’s future.
The analysis draws on authoritative sources such as Statistics Canada, Alberta Municipal Affairs, the Alberta Regional Dashboard, and previous municipal planning documents, with input from regional economic development partners.
WHAT IS CEDS?
A Comprehensive Economic Development Strategy (CEDS) is a structured, community-driven process designed to identify economic opportunities, set strategic goals, and guide sustainable growth (Figure 1). The Town of Westlock’s CEDS, being developed between May and October 2025 with a public launch in November 2025, follows a five-step timeline:
h Explore Perceptions (May, 2025) Gather input and assess current economic conditions.
h Future Scenarios (June–August, 2025) Evaluate potential growth pathways and shared community vision.
h CEDS Draft (September, 2025) Prepare an initial strategy informed by data and stakeholder feedback.
h Strategic Roadmap (October, 2025) Finalize strategic actions for implementation.
h Launch & Next Steps (November, 2025) Release the plan and initiate follow-up processes.
The CEDS will establish a coordinated roadmap designed to strengthen Westlock’s business environment, attract investment, support workforce development, diversify the economy, and enhance quality of life. It engages local stakeholders—businesses, residents, regional partners— and aligns Westlock’s economic goals with emerging opportunities in sectors such as agriculture, manufacturing, health, tourism, and potential academic partnerships.
By offering measurable objectives and an implementation framework, the CEDS will help guide public and private investment, giving Westlock a clear path to building economic resilience and securing future prosperity.
FIGURE 1: COMPREHENSIVE ECONOMIC DEVELOPMENT STRATEGY (CEDS) TIMELINE - TOWN OF WESTLOCK (2025)
NOTE: This timeline outlines the five key development phases of the Town of Westlock’s Comprehensive Economic Development Strategy (CEDS), scheduled for completion between May and November 2025.
SOURCE: Town of Westlock [>]
COHORT COMMUNITIES
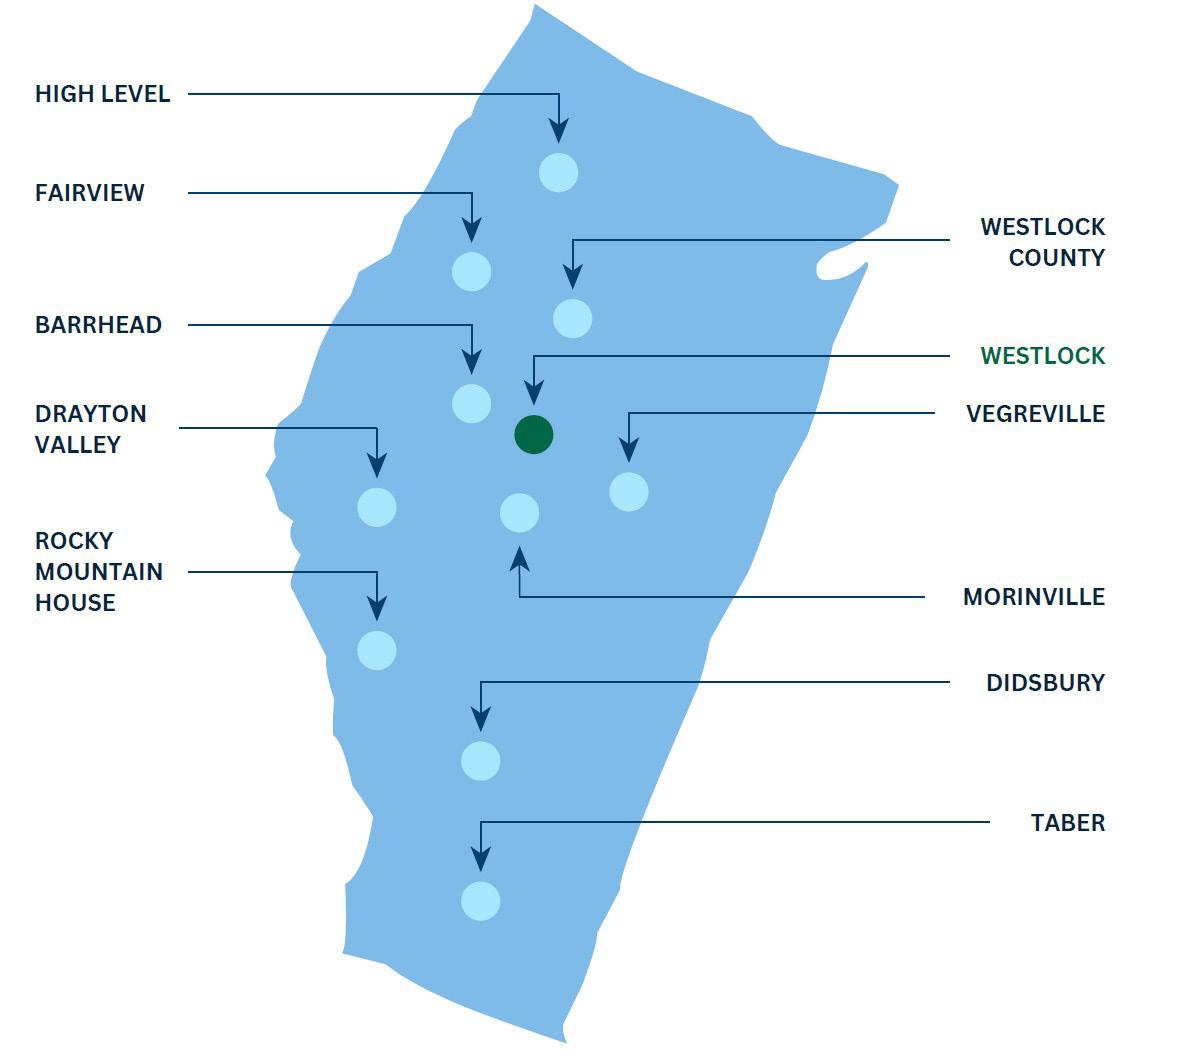
To better understand Westlock’s position in the region, this Benchmark Report compares key socioeconomic indicators across a group of peer municipalities—referred to as cohort communities. These comparisons offer meaningful insights into Westlock’s strengths, challenges, and opportunities within a broader regional and provincial context (Figure 2).
The selection of cohort communities was guided by four primary criteria:
h Community Size: Towns with similar population sizes to Westlock, allowing for equitable and relevant comparisons.
h Metro Positioning: Proximity to larger metropolitan centres to assess commuter patterns, regional influence, and growth potential.
h Quality of Life: Communities recognized for strong livability, including access to amenities, services, and a desirable residential environment.
h Industry Composition: A similar economic and employment base, including shared reliance on sectors such as agriculture, energy, manufacturing, or regional services.
Together, these factors ensure that the cohort represents a balanced and insightful benchmark
NOTE: This map illustrates the geographic location of Westlock and the cohort communities selected for socio-economic benchmarking in this report. Communities were chosen based on similarities in population size, industry mix, proximity to major centres, and quality of life indicators.
SOURCE: Town of Westlock [>]
FIGURE 2: GEOGRAPHIC DISTRIBUTION OF BENCHMARK COHORT COMMUNITIES
KEY FINDINGS
This Socio-Economic Benchmark Report provides a comparative snapshot of Westlock’s demographic and economic characteristics against peer communities in Alberta. The findings below highlight key areas that shape local planning, investment attraction, and long-term growth strategies.
POPULATION & GROWTH DYNAMICS
Westlock’s population has remained relatively stable over the past decade, demonstrating modest growth. While some peer communities have experienced faster expansion due to regional development pressures or commuter proximity to larger centres, Westlock maintains a steady population base that supports its role as a regional service hub.
ETHNIC & INDIGENOUS DIVERSITY
The community’s ethnic diversity is gradually increasing, aligning with national immigration trends. Westlock has a notable Indigenous population, which continues to be an integral part of the town’s cultural and demographic fabric. Ensuring inclusive planning and engagement will remain key for equitable service delivery and workforce development.
INCOME TRENDS
Median income for all family types in Westlock has shown consistent growth from 2001 to 2021, reflecting gradual economic advancement and a resilient workforce. While the town’s income levels remain slightly below those of high-growth neighbours like Morinville, they signal economic stability. Lone-parent families, though still facing income disparities, have seen significant improvement over two decades.
EDUCATIONAL ATTAINMENT
Westlock has experienced a positive shift in educational attainment. Between 2001 and 2021, the number of residents with university degrees and college diplomas increased substantially, while those without a high school diploma declined. These trends indicate an improving skills base and readiness for knowledge-based and technical job sectors.
RESIDENTIAL GROWTH
Westlock has seen steady growth in residential development over the past two decades. While the pace of expansion has been more measured compared to some higher-growth communities, the addition of new housing units reflects ongoing community stability and gradual demand. This trend reinforces Westlock’s role as a reliable and established place to live, with future potential to accommodate additional residents as economic and demographic shifts unfold.
DEMOGRAPHICS
CHAPTER 1 WESTLOCK POPULATION TREND ANALYSIS (2001 - 2024)
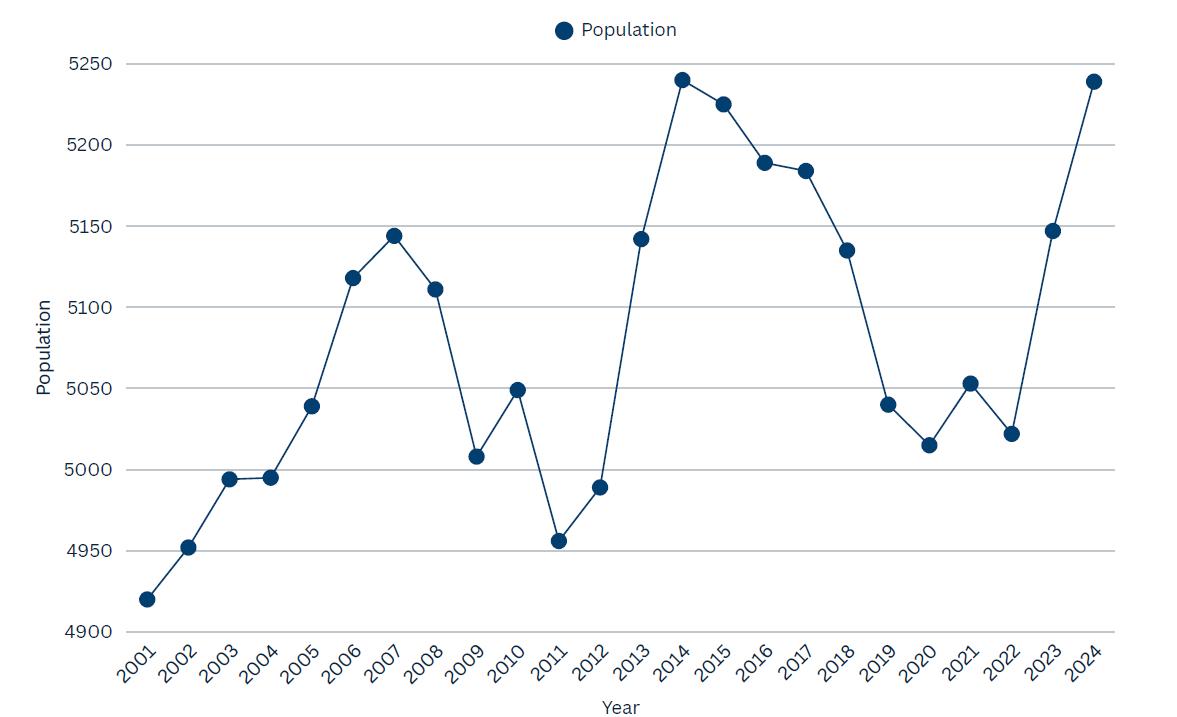
From 2001 to 2024, the Town of Westlock has seen fluctuating but relatively stable population levels, with periodic peaks and declines rather than sustained long-term growth (Figure 3).
In 2001, Westlock’s population stood at 4,920 residents, and by 2024, it reached 5,239 — a net increase of 319 people, or approximately 6.5% over 23 years. While this represents growth, it has occurred in irregular waves, with several dips that likely reflect local economic cycles, aging demographics, or out-migration during downturns (Figure 3)
Key patterns include:
h A noticeable climb between 2005 and 2008, peaking around 5,144.
h A subsequent drop post-2008, reaching a low in 2011 (4,956) — possibly tied to postrecession recovery delays.
h A sharp increase between 2012 and 2014, where the population hit its highest recorded level at 5,240.
h From 2015 to 2021, the community experienced a slow but steady decline, bottoming out in 2022 at 5,022
h Recent data (2023–2024) indicates a rebound trend, suggesting early signs of stabilization or renewed growth.
WHAT THIS MEANS FOR ECONOMIC DEVELOPMENT
Westlock’s long-term population trend tells a story of stability, but not acceleration. Between 2014 and 2024, the town’s population grew from 4,823 to 4,921, reflecting a modest 2.03% increase over ten years. In contrast, Alberta’s population grew by 17.07% during the same period. This places Westlock well below the provincial average, highlighting a need to rethink how the Town attracts and retains residents.
However, this slower growth also presents an opportunity. The recent uptick in population from 2022 to 2024 suggests renewed interest in the community — whether through improved livability, affordability, or emerging economic potential. This upward movement can serve as a springboard for a new chapter in Westlock’s growth story.
CHAPTER 1: WESTLOCK POPULATION TREND ANALYSIS
NOTE: This figure illustrates the year-over-year population estimates for the Town of Westlock from 2001 to 2024. The data reflects fluctuations based on municipal and provincial population counts, including census data and intercensal estimates.
SOURCE: Population by municipality [>]
ECONOMIC DEVELOPMENT OPPORTUNITIES
h Capitalize on Affordability: With lower housing and living costs than urban centres, Westlock can attract families, first-time homeowners, and remote workers seeking quality of life without big-city prices.
h Grow Through Immigration and Workforce Mobility: Participating in rural immigration streams and attracting regional workers can help fill gaps in healthcare, trades, and logistics.
h Invest in Seniors-Oriented Services: A maturing demographic provides long-term opportunities to expand elder care, seniorfriendly housing, and lifestyle services.
h Focus on Downtown & Infill Development: Slower growth means less pressure on infrastructure — a chance to invest in renewal, beautification, and walkability without high density shocks.
h Build a Long-Term Vision: With time on its side, Westlock can focus on sustainable, phased development — not rushed growth — aligning with quality-of-life values, economic diversification, and community identity.
FIGURE 3: HISTORICAL POPULATION TRENDS IN WESTLOCK (2001 - 2024)
CHAPTER 2 COHORT COMMUNITY POPULATION GROWTH (2014 - 2024)
Over the past decade, population trends across Westlock’s peer municipalities reflect a wide range of growth dynamics, shaped by geography, economic conditions, and regional spillover effects. Among the communities analyzed, Morinville experienced the highest population growth, rising by approximately 10% (Figure 4). This strong performance is likely driven by its proximity to St. Albert and Edmonton, allowing it to benefit from suburban spillover, housing development, and commuter-based growth. Similarly, Taber, with growth of 9%, has likely seen expansion due to its strength in agriculture and food processing, supported by a steady influx of workers and families connected to that sector (Figure 4).
High Level, recording 8% growth, may reflect its regional service role for Northern Alberta, particularly in forestry, transportation, and Indigenous governance. Meanwhile, Drayton Valley, which grew by about 3%, appears to be maintaining modest resilience despite fluctuations in the oil and gas industry that have affected many rural Alberta communities.
In contrast, several municipalities experienced notable population decline. Fairview’s population dropped by approximately -11%, the steepest decline among the cohort, which could be attributed to long-term rural depopulation trends and limited economic diversification.
Rocky Mountain House also saw significant decreases of -7%, potentially linked to aging demographics and outward migration of younger populations. Barrhead and Vegreville reported small declines ranging from -3% to -1%, suggesting relative stagnation without major growth pressure or decline risk.
Within this context, Westlock’s 2% population growth over the same period positions the town near the middle of the range. While this is well below the growth seen in commuter-aligned or sector-anchored communities like Morinville or Taber, it is significantly better than the population losses experienced by many of its peers.
Westlock’s modest growth may reflect a balance of factors — limited but steady housing development, a stable core of public sector services, and some regional draw without proximity to a major urban centre. The rebound observed between 2022 and 2024 suggests potential for renewed momentum, which could be captured through strategies focused on regional migration, small business attraction, and housing for working families.
CHAPTER 2: COHORT COMMUNITY POPULATION GROWTH (2014
- 2024)
FIGURE 4: TEN-YEAR (10) POPULATION GROWTH AMONG SELECTED ALBERTA COHORT COMMUNITIES (2014 - 2024)
4: TEN-YEAR (10) POPULATION GROWTH AMONG SELECTED ALBERTA COHORT COMMUNITIES (2014 - 2024)
NOTE: This figure presents the percentage change in population between 2014 and 2024 for Westlock and its selected cohort communities. The comparison offers insight into recent demographic trends, local growth patterns, and broader regional dynamics. Communities were selected based on similarities in population size, economic orientation, and geographic role within Alberta.
SOURCE: Population by municipality [>]
FIGURE
STRATEGIC IMPLICATIONS
h Opportunity for Regional Positioning: Westlock is one of the few mid-performing communities with growth — it can position itself as a stable, affordable, and livable alternative in north-central Alberta.
h Avoiding Stagnation: With surrounding communities experiencing population decline, Westlock has the opportunity to attract regional migration — including residents relocating from smaller shrinking towns in search of services, amenities, or employment.
h Growth Benchmarking: While top performers like Morinville and Taber may have structural or locational advantages, Westlock can study their models — especially in housing, immigration policy, and business development — to adapt scalable practices.
h Shifting Focus to Emerging Demographics: The slight growth trend in Westlock coincides with recent rebounds (2022–2024), suggesting potential to attract young families, newcomers, and retirees. Economic development strategies should now focus on population growth as a metric of long-term sustainability.
CHAPTER 3 VITAL STATISTICS IN WESTLOCK (2001 - 2023)
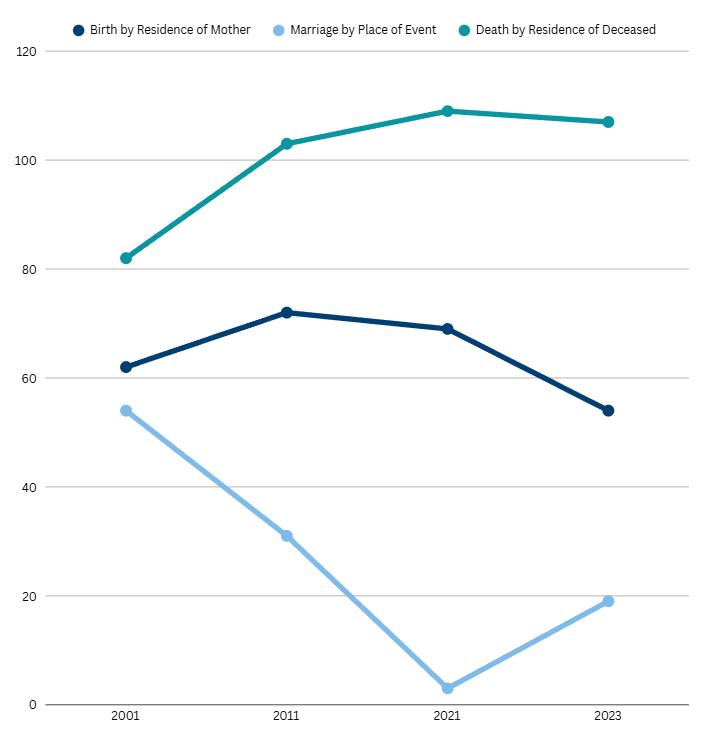
Vital statistics from the Town of Westlock reveal important demographic shifts that further explain the community’s modest population trends and highlight key areas for future planning. Between 2001 and 2023, the number of births by residence of mother remained relatively stable but showed signs of gradual decline — from 62 births in 2001 to just 54 in 2023 (Figure 5). While fluctuations occurred over the years (peaking at 72 births in 2011), the overall trend reflects a decline in younger, family-forming populations, likely due to aging, limited employment opportunities for young adults, and a regional pattern of outward migration from rural areas.
At the same time, death rates have steadily increased, with Westlock recording 82 deaths in 2001 and 107 in 2023 (Figure 5). This represents a 30% increase over two decades and confirms the town’s growing share of older residents. The result is a consistent natural population decrease each year, with deaths exceeding births by 20 in 2001, 31 in 2011, 40 in 2021, and 53 in 2023. Without meaningful in-migration, this trend places structural pressure on the town’s workforce, housing market, and service delivery models.
Another notable trend is the sharp drop in recorded marriages. In 2001, Westlock saw 54 marriages, but by 2021, that number fell to just 3, rebounding slightly to 19 in 2023.
Although the extreme drop in 2021 may partly reflect pandemic-related disruptions, the broader trend indicates that fewer young couples are choosing to settle or marry in the community. This aligns with the declining birth rates and suggests a need to strengthen the town’s appeal to younger demographics.
Taken together, these indicators point to a community that is stable but aging, with minimal natural growth. The findings reinforce the need for a strategic focus on population attraction, workforce retention, and supports for seniors. Immigration programs, housing incentives for families, and targeted infrastructure investments — particularly in health care and lifestyle amenities — will be critical in reversing or mitigating longterm demographic decline.
CHAPTER 3: VITAL STATISTICS IN WESTLOCK (2001 - 2023)
NOTE: This figure illustrates the number of births, marriages, and deaths recorded in Westlock between 2001 and 2023. Data reflects the residence of the mother (births), place of event (marriages), and residence of the deceased (deaths).
SOURCE: Births, marriages and deaths by municipality and year [>]
FIGURE 5: VITAL STATISTICS TRENDS IN WESTLOCK (2001 - 2023)
CHAPTER 4 VISIBLE MINORITY GROWTH IN WESTLOCK (2001 - 2021)
Over the past two decades, the Town of Westlock has experienced a notable increase in cultural diversity, as reflected in the steady rise of visible minority residents. In 2001, just 3.0% of the population identified as part of a visible minority group (Figure 6). By 2021, that figure had more than tripled to 9.4%, signaling a gradual yet meaningful demographic shift.
This growth has not occurred uniformly but has accelerated over time. Between 2001 and 2011, the proportion rose modestly from 3.0% to 4.2%, reflecting a slow pace of diversification.
However, the period from 2011 to 2016 saw a sharper increase to 7.4%, followed by continued growth to 9.4% in 2021 (Figure 6). This trajectory mirrors broader national trends, where immigration and second-generation population growth have contributed to increasing cultural diversity in rural and mid-sized communities, not just major urban centres.
In Westlock’s case, this trend may be attributed to a combination of secondary migration from larger cities, settlement through federal and provincial immigration programs, and local recruitment in sectors such as health care, trades, and small business.
As the town continues to welcome newcomers, this demographic shift presents both opportunities and responsibilities.
The growing presence of visible minority residents adds to the community’s social fabric, enriching local culture, school demographics, and entrepreneurial activity. It also presents a timely opportunity to enhance settlement services, develop inclusive policies, and promote cultural awareness and engagement.
As Westlock positions itself to attract population through targeted immigration initiatives, recognizing and supporting this increasing diversity will be essential. Building a community that is both welcoming and inclusive will not only sustain growth but also help retain new residents who contribute to Westlock’s economic and social vitality.
CHAPTER 4: VISIBLE MINORITY GROWTH IN WESTLOCK (2001
- 2021)
CHAPTER 4: VISIBLE MINORITY GROWTH IN WESTLOCK (2001 - 2021)
NOTE: This figure shows the percentage of Westlock’s population identifying as visible minorities between 2001 and 2021. Data is based on Statistics Canada census records and reflects self-reported population characteristics.
SOURCE: Percent visible minority by municipality [>]
FIGURE 6: GROWTH OF VISIBLE MINORITY POPULATION IN WESTLOCK (2001 - 2021)
FIGURE 6: GROWTH OF VISIBLE MINORITY POPULATION IN WESTLOCK (2001 - 2021)
CHAPTER 5 INDIGENOUS POPULATION IN WESTLOCK (2001 - 2021)
Between 2001 and 2021, the Aboriginal population in the Town of Westlock has grown significantly, both in absolute numbers and as a share of the total population. In 2001, there were approximately 150 Indigenous residents, representing 3.1% of the town’s population (Figure 7)
By 2021, that number had risen to 460 people, making up 9.9% of Westlock’s total population — more than tripling the community’s Indigenous representation over two decades.
The growth was most notable in two periods. Between 2001 and 2006, the Indigenous Population more than doubled, increasing from 150 to 315 people (Figure 7). Although there was a dip in 2011, the numbers rebounded strongly by 2016 and continued to grow through 2021. This upward trend indicates not only a strong Indigenous presence in the region but also the likelihood of Westlock serving as a hub for nearby First Nations and Métis individuals and families seeking access to services, education, housing, or employment.
This increase in Indigenous population contributes to Westlock’s evolving demographic makeup and presents a strategic opportunity for community collaboration and reconciliation. A larger Indigenous population reinforces the importance of inclusive policymaking and supports the case for expanding cultural services, educational programming, and workforce partnerships rooted in Indigenous engagement.
As the town develops its economic development strategy, stronger partnerships with Indigenous organizations — including local friendship centres, regional economic development corporations, or educational institutions — could help address mutual goals in areas such as workforce readiness, small business support, and cultural tourism. These efforts would not only benefit the Indigenous population but also help to position Westlock as a culturally aware and inclusive rural centre within North-central Alberta.
CHAPTER 5: INDIGENOUS POPULATION IN WESTLOCK
(2001 - 2021)
CHAPTER 5: INDIGENOUS POPULATION IN WESTLOCK (2001 - 2021)
NOTE: This figure illustrates the number of individuals in Westlock who self-identified as Indigenous in the census years 2001 through 2021. Data is based on Statistics Canada census records and reflects population reporting First Nations, Métis, or Inuit identity.
SOURCE: Aboriginal population by municipality [>]
FIGURE 7: GROWTH OF INDIGENOUS POPULATION IN WESTLOCK (2001 - 2021)
FIGURE 7: GROWTH OF INDIGENOUS POPULATION IN WESTLOCK (2001 - 2021)
CHAPTER 6
ALL FAMILIES MEDIAN INCOME
(2011 - 2021)
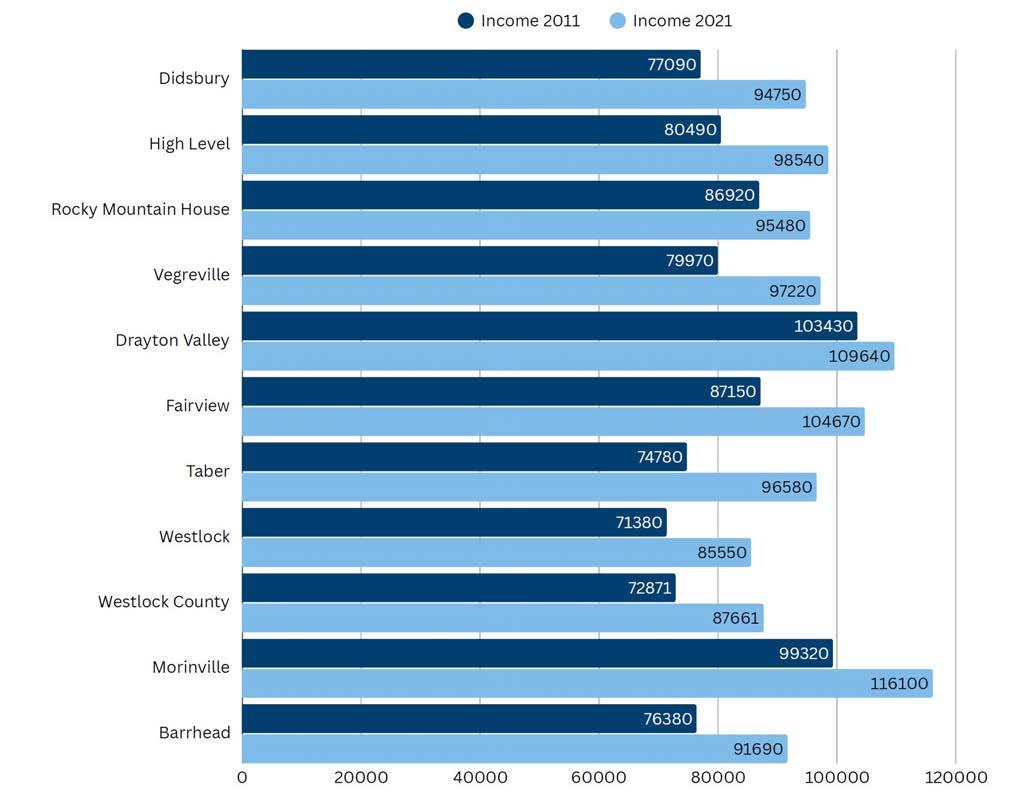
Between 2011 and 2021, the median income for all families in Westlock increased from $71,380 to $85,550, representing a growth of 19.85% over the ten-year period (Figure 8). This income metric includes couple families, lone-parent families, and individuals without children, providing a broad view of household financial conditions across the community.
Compared to its peer municipalities, Westlock’s income growth places it in a moderate position. While the increase is encouraging and reflects a degree of household stability, other communities such as Taber (+29.15%), Didsbury (+22.91%), and High Level (+22.43%) experienced stronger income gains (Figure 8). These towns may have benefited from more aggressive economic development efforts, regional industrial expansion, or strategic alignment with higher-wage sectors.
Despite Westlock’s modest income growth, its median remains lower than that of regional leaders like Morinville ($116,100) and Drayton Valley ($109,640) (Figure 8). This gap highlights the need for Westlock to expand access to higher-wage employment, diversify its economic base, and attract more income-generating investment if it is to remain competitive in the coming decade.
Importantly, the town’s income growth appears to reflect gradual economic improvement rather than significant structural transformation. This underscores the need for intentional strategies to support family-level financial security, encourage workforce development, and leverage affordability as a long-term growth advantage.
ECONOMIC DEVELOPMENT OPPORTUNITIES
Westlock’s moderate income growth presents an opportunity to build a stronger economic foundation for local families. To raise household earning potential, the Town should focus on:
h Attracting Higher-Wage Employers: Target sectors like light manufacturing, logistics, and agri-processing to diversify the job base and improve wage outcomes.
h Investing in Local Skills: Partner with training institutions to upskill youth, underemployed residents, and newcomers for emerging employment opportunities.
CHAPTER 6: ALL FAMILIES MEDIAN INCOME (2011 - 2021)
NOTE: Comparison of median income for all families in 2011 and 2021 across selected Alberta communities. Values are presented in Canadian dollars. Communities included: Didsbury, High Level, Rocky Mountain House, Vegreville, Drayton Valley, Fairview, Taber, Westlock, Westlock County, Morinville, and Barrhead.
SOURCE: Median income by municipality [>]
h Supporting Entrepreneurship: Strengthen local business creation through small grants, mentorship, and streamlined processes—especially for newcomers and young families.
h Marketing Affordability: Position Westlock as a livable, cost-effective alternative to larger centres, attractive to remote workers and regional migrants.
FIGURE 8: MEDIAN INCOME OF ALL FAMILIES (2011 VS 2021) - COMPARATIVE OVERVIEW BY COMMUNITY
h Prioritizing Inclusive Growth: Ensure visible minority and Indigenous residents have access to economic programs and employment pathways. These strategies can help Westlock move from modest gains to meaningful, sustainable income growth.
CHAPTER 7 LONG-TERM INCOME TRENDS IN WESTLOCK (2000 - 2021)
The income trends in Westlock over the past two decades reflect both broad provincial economic shifts and local demographic realities. From 2000 to 2021, all three family types — all families, couple families, and lone-parent families — experienced consistent growth in median incomes, with particularly strong gains observed after 2005 and again in the post-2010 recovery period.
The median income for all families in Westlock grew from $40,600 in 2000 to $85,550 in 2021, representing a 110.6% increase (Figure 9). This doubling of income over two decades suggests sustained economic development, rising employment, and possibly increased dual-income households.
Growth was relatively steady until 2015, after which incomes began to plateau slightly, with a notable dip in 2020 — likely attributable to the COVID-19 pandemic’s disruption of the local economy — followed by a sharp rebound in 2021. This indicates resilience in Westlock’s economic base and household income structures.
Couple families, consistently the highest-earning group, saw their median income rise from $44,500 in 2000 to $93,060 in 2021 — an increase of 109.1% (Figure 9). These figures are indicative of economic stability among dual- income or partnered households, and align with provincial
trends where couple families benefit from combined earning potential and often greater job security. The upward trajectory for this group is clear and mostly uninterrupted, suggesting that this segment is well-positioned within Westlock’s employment landscape.
The most significant percentage increase, however, was among lone-parent families, whose median income increased from $22,800 in 2000 to $51,500 in 2021 — a 125.7% increase. This remarkable growth signals positive shifts in support structures for single parents, increased workforce participation among lone-parent households, and possibly broader access to education, childcare, and benefits. The growth curve for this group steepens particularly after 2005, and while loneparent families still earn less than their coupled counterparts, the narrowing gap points toward improving equity.
Despite the persistent income disparity between family types, the faster growth in lone-parent income levels demonstrates progress toward income inclusivity and socioeconomic mobility From a policy perspective, it underscores the value of continuing to invest in programs and supports that empower single-parent households — such as training initiatives, housing support, and childcare subsidies.
FIGURE 9: MEDIAN FAMILY INCOMES IN WESTLOCK BY FAMILY TYPE (2000–2021, IN CANADIAN DOLLARS)
9: MEDIAN FAMILY INCOMES IN WESTLOCK BY FAMILY TYPE (2000–2021, IN CANADIAN DOLLARS)
NOTE: This figure displays the income trends over time for all families, couple families, and lone-parent families in Westlock.
SOURCE: Median income by municipality [>]
FIGURE
The short-term dip in 2020 across all family types highlights Westlock’s sensitivity to broader economic shocks. Yet the swift recovery by 2021 is promising and suggests that the local economy retains a degree of adaptability. These trends can inform longterm economic development planning, as well as social service strategies to ensure that income growth is sustained and inclusive across all household types.
In summary, Westlock’s long-term income trends reflect a steadily improving economic environment, with growth that is broadly distributed across household types, though at different levels. With lone-parent incomes rising faster than any other group, and coupled families maintaining steady gains, the town appears well-positioned to build on these gains through inclusive economic development, job creation, and targeted supports for vulnerable populations.
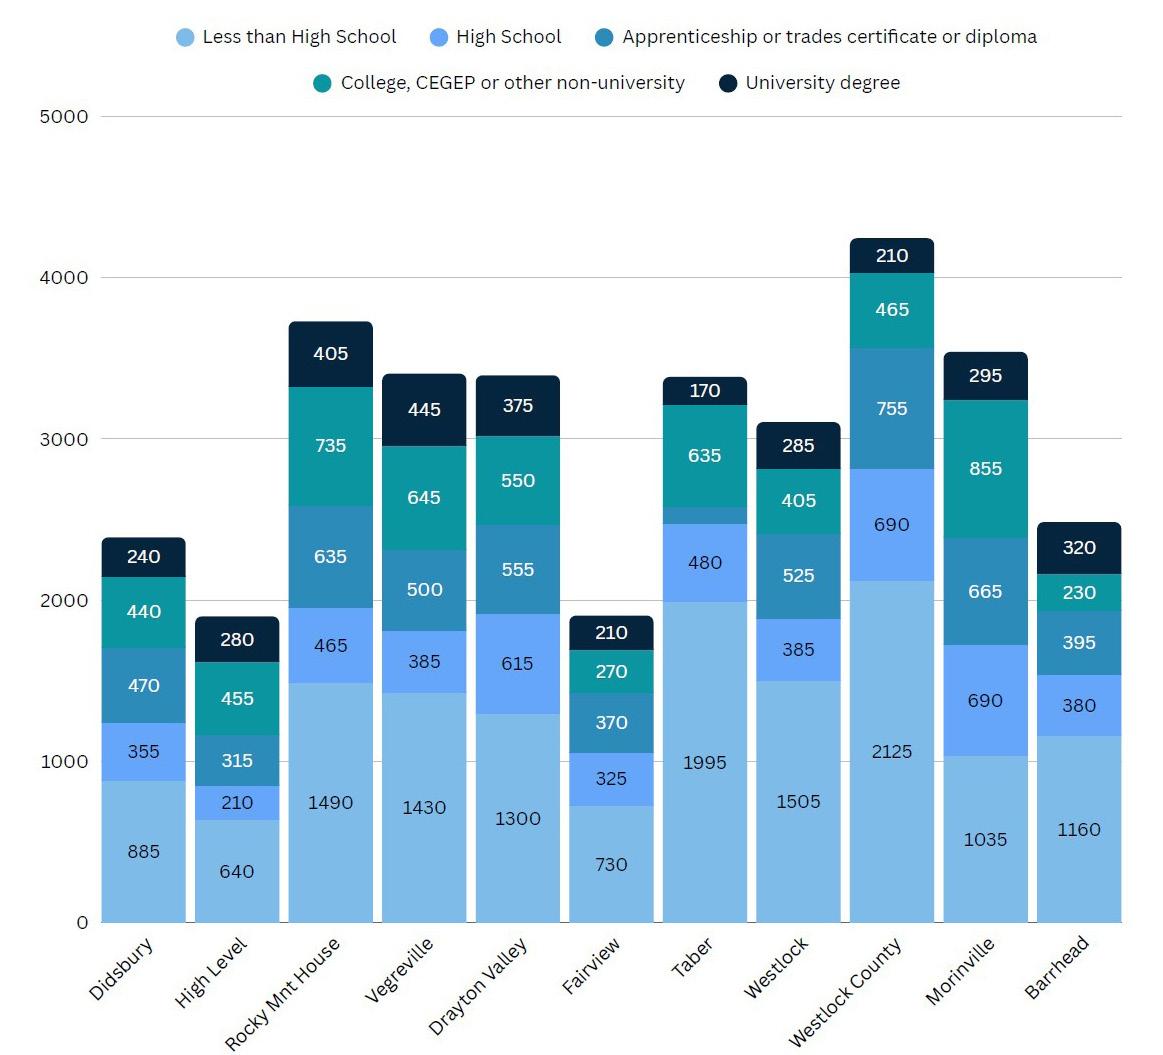
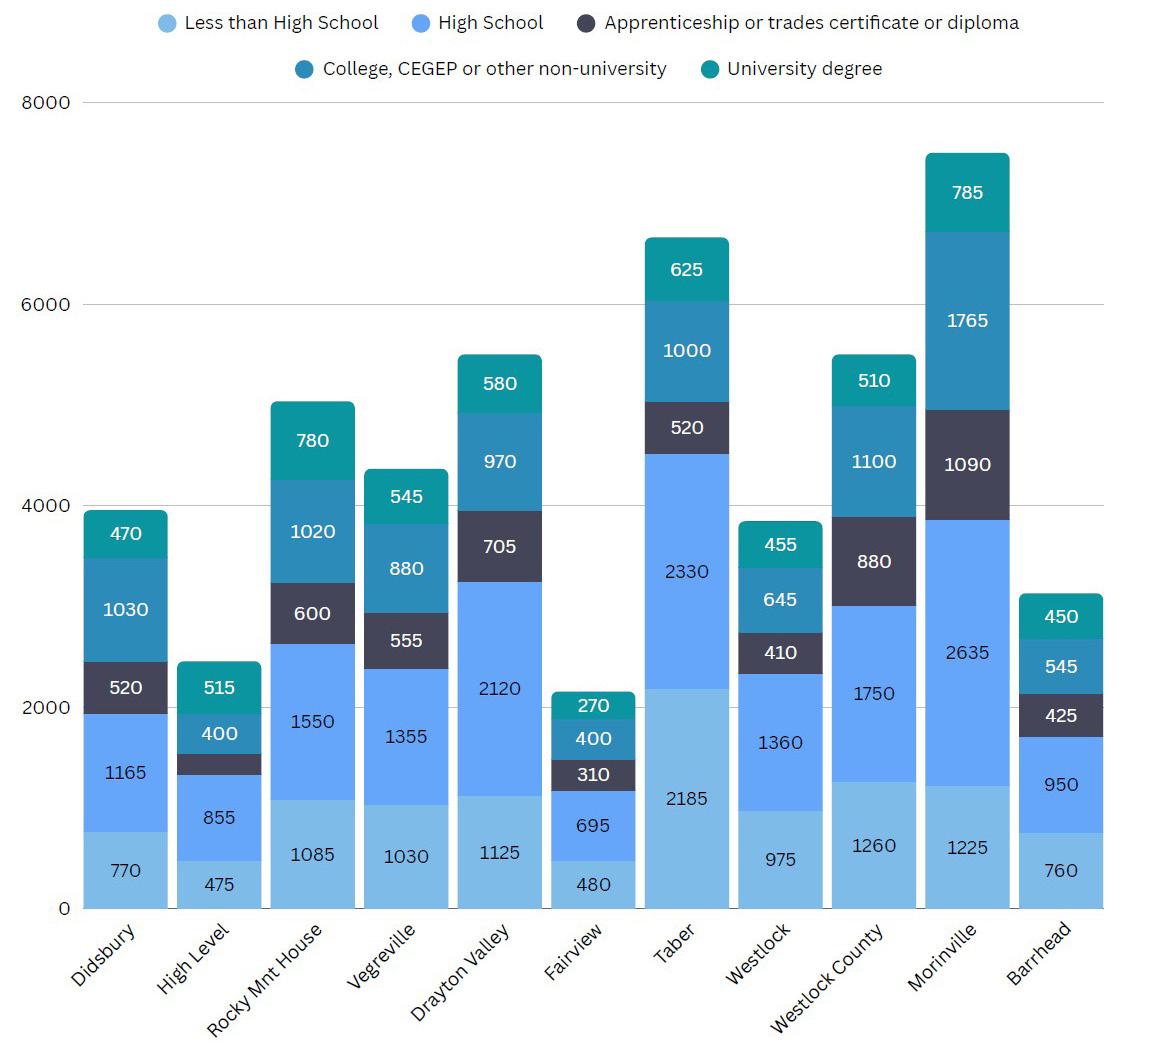
Between 2001 and 2021, Westlock experienced notable shifts in educational attainment (Figure 10, Figure 11), though its overall positioning remains mixed compared to peer communities.
Key Comparisons and Observations:
h Improved High School and College Completion: The number of residents in Westlock with high school diplomas rose from 385 in 2001 to 1,360 in 2021, and those with college or non-university education rose from 405 to 645 (Figure 10, Figure 11). These gains reflect positive outcomes in secondary and post-secondary access and completion, mirroring provincewide improvements.
h Decline in Apprenticeship/Trades Credentials: A concerning trend is the decline in trades certification, dropping from 525 in 2001 to 410 in 2021. In contrast, many peer communities, such as Drayton Valley (up 170), Westlock County (up 125), and Morinville (up 425), experienced increases. This decline may suggest waning engagement with trades education or fewer local employment opportunities in skilled trades.
h Modest University Growth: The number of university degree holders in Westlock increased from 285 to 455. While this represents growth, it is modest compared to places like Morinville (295 to 795) and Rocky Mountain House (405 to 780). Westlock lags behind in attracting or retaining residents with university credentials.
h Decreasing Share with Less than High School: The number of people without a high school diploma dropped significantly (from 1,055 in 2001 to 975 in 2021), a positive development reflecting improved education access and generational shifts in attainment.
FIGURE 10: EDUCATIONAL ATTAINMENT ACROSS SELECTED ALBERTA COMMUNITIES (2001)
NOTE: The figure displays the number of individuals (aged 15 and over) by highest level of education in 2001 for eachcommunity: Didsbury, High Level, Rocky Mountain House, Vegreville, Drayton Valley, Fairview, Taber, Westlock, Westlock County, Morinville, and Barrhead.
SOURCE: Educational attainment by municipality [>]
11: EDUCATIONAL ATTAINMENT ACROSS SELECTED ALBERTA COMMUNITIES (2021)
NOTE: The figure displays the number of individuals (aged 15 and over) by highest level of education in 2021 for each community: Didsbury, High Level, Rocky Mountain House, Vegreville, Drayton Valley, Fairview, Taber, Westlock, Westlock County, Morinville, and Barrhead.
SOURCE: Educational attainment by municipality [>]
FIGURE
RECOMMENDATIONS FOR ECONOMIC AND WORKFORCE DEVELOPMENT
h Revitalize Trades Training: Address the decline in trade certifications by promoting skilled trades as viable career paths and working with local employers to offer training and apprenticeships.
h Attract Degree-Holders: Position Westlock as an affordable, high-quality place to live for professionals by supporting remote work infrastructure and enhancing community amenities.
h Expand Local Learning Options: Encourage access to education through short-term programs, certifications, and training that can be delivered locally or online.
h Align Jobs with Skills: Attract businesses that match the town’s workforce strengths— especially in sectors like construction, logistics, services, and small manufacturing.
h Support Lifelong Learning: Promote adult learning opportunities in areas like digital skills, entrepreneurship, and caregiving to adapt to changing workforce needs.
DWELLING UNITS
CHAPTER 9 DWELLING UNIT GROWTH (2001 – 2023)
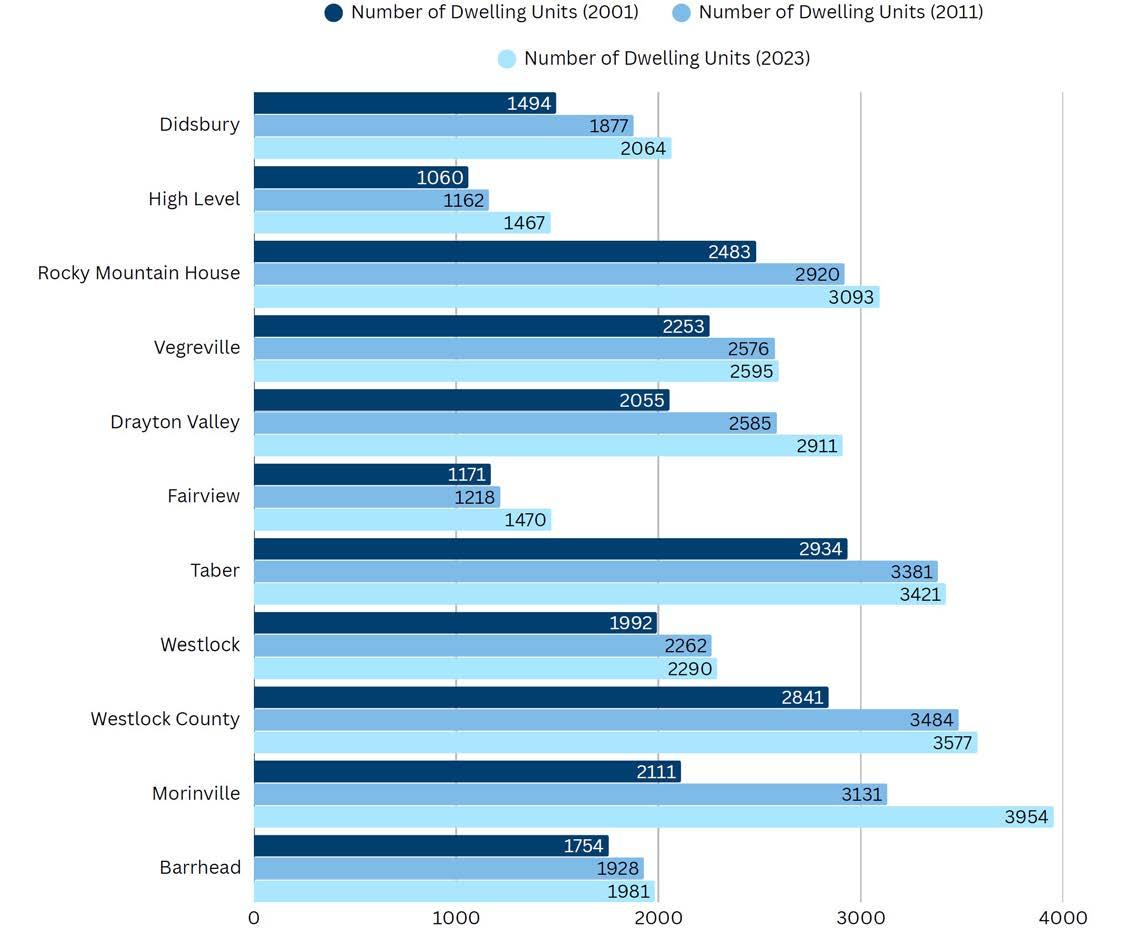
Between 2001 and 2023, all communities in the comparison group experienced growth in the number of dwelling units, although the rate and scale of growth varied significantly based on local development conditions, population trends, and proximity to urban centres.
Westlock added 298 new dwelling units over the 22-year period, growing from 1,992 in 2001 to 2,290 in 2023, which equates to a 14.96% increase (Figure 12). This places Westlock in the lowermiddle range of the cohort. The pace of growth suggests moderate but cautious residential expansion, likely tied to incremental population increases and market demand from local workforce turnover, seniors, and new families.
Communities such as Morinville (+87.3%), Drayton Valley (+41.7%), and High Level (+38.4%) led the cohort in terms of proportional growth (Figure 12). These municipalities likely benefited from strong population pressures, commuter appeal to larger cities (e.g., Morinville to St. Albert/ Edmonton), or targeted residential development initiatives. Their growth suggests a proactive housing response aligned with employment opportunities and in-migration.
In contrast, Fairview (+25.5%), Rocky Mountain House (+24.6%), and Barrhead (+12.9%) showed modest to moderate increases. These numbers reflect stability but may also point to constraints such as limited land development, aging populations, or less economic draw for new residents.
Westlock’s steady, below-average growth in dwelling units aligns with its modest population increase and economic stability. The data indicates that while the town has not experienced rapid expansion, it has also avoided stagnation.
ECONOMIC DEVELOPMENT OPPORTUNITIES
Westlock’s modest housing growth presents key opportunities to support population and economic expansion:
h Attract Developers: Promote land availability and affordability to encourage residential construction and infill development.
h Position as an Affordable Alternative: Market Westlock as a cost-effective option for families, seniors, and remote workers seeking quality housing.
CHAPTER 9: DWELLING UNIT GROWTH (2001 - 2023)
12: RESIDENTIAL UNIT GROWTH BY COMMUNITY (2001 - 2023)
NOTE: Comparison of residential unit counts in 2001, 2011, and 2023 across selected Alberta communities. Data reflects the number of dwelling units recorded during each period. Communities included: Didsbury, High Level, Rocky Mountain House, Vegreville, Drayton Valley, Fairview, Taber, Westlock, Westlock County, Morinville, and Barrhead.
SOURCE: Dwelling units by municipality [>]
FIGURE
SOCIO-ECONOMIC BENCHMARK REPORT 2025
h Diversify Housing Supply: Encourage a mix of housing types—such as rentals, townhomes, and seniors’ housing—to meet varied community needs.
h Support Workforce Growth: Link housing with workforce attraction by enabling accommodations for essential workers and new residents.
h Leverage Municipal Tools: Use public land, incentives, and streamlined approvals to reduce development barriers and attract investment.
WANT TO LEARN MORE?
Explore the data. Connect with our team, Help shape Westlock’s economic future.
The Town of Westlock is committed to building a strong, inclusive, and resilient community. Whether you have questions about this report, want to get involved in shaping our economic future, or need more information about the Comprehensive Economic Development Strategy (CEDS), we’re here to help.