


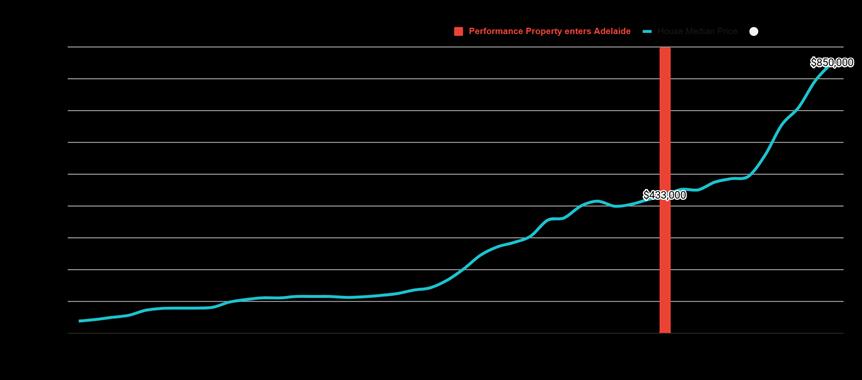

Performance Property entered the market with a MHP of $433,000. The thesis was that prices would increase by 60%, based on factors such as population growth, affordability, supply and demand (S&D), and debt service capacity. Since then, the MHP has risen to $850,000: a growth of 96%.

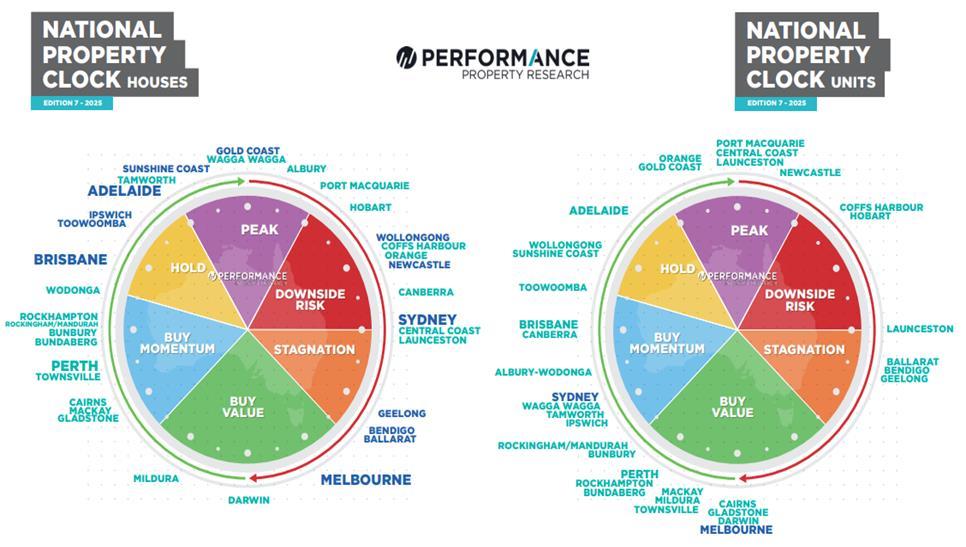
Supply and demand indicators show that there is still an extreme supply shortage in Adelaide, therefore this market can still expect some growth. However, all other measures (such as affordability) are indicating a peak in the market, and an end to fundamental growth.
The cost of established stock has approached the cost of replacement, indicating that the development of stock is becoming more feasible. This may lead to a future stock surplus and flattening prices.
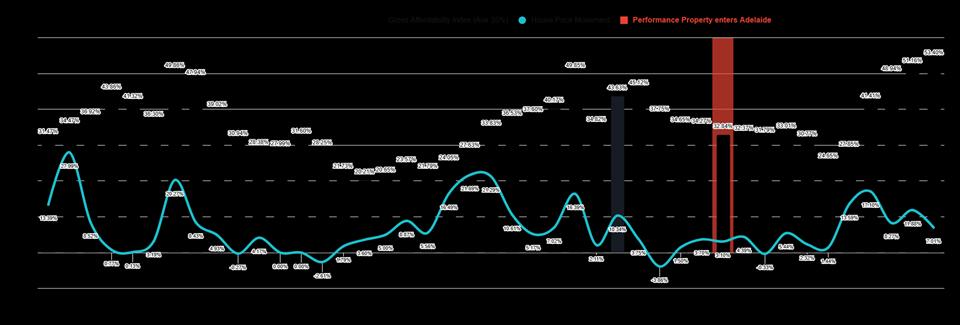
Affordability is the leading indicator when reviewing whether a market is at the bottom or top of a cycle. This graph shows that Adelaide’s housing affordability is at its historic AI ceiling, seen in the years 1989 and 2008. A falling interest rate will ease affordability, however some final growth based on supply issues is also expected - AI is therefore expected to remain at its ceiling in the short term.
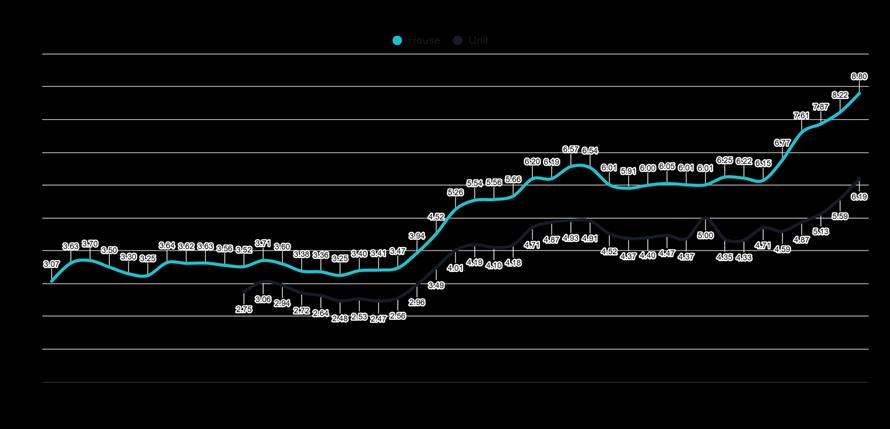
Price to Income for Adelaide housing and unit markets are at the highest it has ever been. It is the hardest it has ever been to save for a deposit, and therefore the most difficult time for genuine new entry to the market.
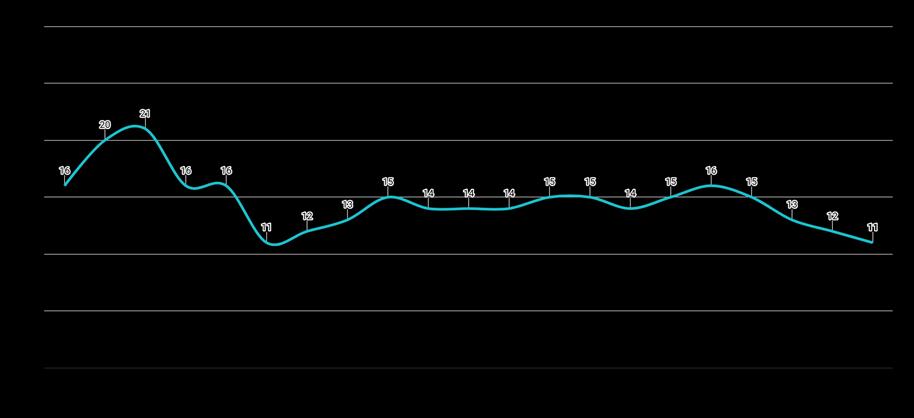
Currently, Adelaide ranks as the 11th most expensive region in Australia. Over the past 20 years, Adelaide's average ranking has been 15th.
Adelaide is on average the 15th most expensive region that we research. It is currently ranked 11th, its highest recorded position, driven by high unaffordability. This suggests the market may be nearing its peak.
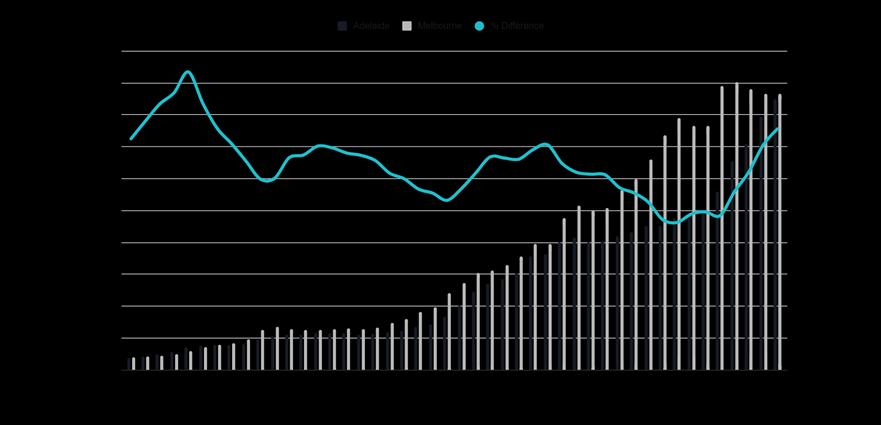
The long term average of Adelaide v Melbourne is 84%. This number currently sits at 98%, indicating that Adelaide is showing less value than usual, when compared to Melbourne.