Economic
Report to the Texas Nursery and Landscape Association 2025 by
Marco A. Palma and Charles R. Hall
Texas A&M University
2124 TAMU. College Station, TX. 77843-2124 mapalma@tamu.edu
Acknowledgements
This report was created with the generous support of the Texas Nursery and Landscape Association (TNLA). The Data were obtained from the Texas Comptrollers of Public Accounts (TCPA), Baseline data from the Green Industry Research Consortium National Nursery Survey. Others who contributed with this report include Daniel Hanselka and Dean McCorkle (Texas A&M AgriLife Extension Service). This report complies with the terms of the TNLA contract. The authors welcome comments or information about the usefulness and implications of these findings.
Background and Introduction
In 2024, the green industry approached a new chapter: after the extraordinary boom years during the COVID period, many segments began returning to more typical growth levels and industry players found themselves adjusting to slower momentum, elevated costs and shifting consumer behaviors. Within the nursery and greenhouse segment, the picture was mixed. According to an industry benchmarking survey, about half of respondents reported net profits in 2024 were below their 2023 performance, while the other half reported improvement. Some growers saw increases in square footage. Yet at the same time, forecasts cautioned that growth would likely be slower than in the pandemic years, as many consumers had already made major garden-and-outdoor purchases in 2020–21.
In the retail lawn and garden store channel, a benchmarking regarding garden centers reflected a similar recalibration. The report notes that “profits and growth mellowed with the COVID boom in the rearview.” This signals that while retailers are still operating above pre-pandemic benchmarks, they’re now working harder to sustain margins, control costs and refocus on core plant and garden product offerings rather than inflated growth. Customer ticket size and counts in certain spring selling seasons were reported as flat or down in North America.
Meanwhile, the landscape and lawn-care services segment emerged as a relative bright spot in 2024. Despite challenges including labor shortages, rising wages, materials-cost inflation and economic caution among customers service firms generally held steady, with ongoing demand for property-enhancement, outdoor living spaces and commercial landscaping contracts.
Putting these pieces together, the green industry in 2024 was characterized by consolidation rather than surge. Nursery and greenhouse businesses faced a “new normal” of moderate growth, with some firms thriving via expansion and automation, while others felt margin squeeze and flat unit sales. Retail garden centers shifted focus back to fundamentals plant inventory, customer service, and operational discipline. Landscape service providers, aided by underlying residential and commercial demand for outdoor spaces, managed to maintain meaningful growth amid headwinds.
From a leadership perspective, the relative success of the landscape services segment shows how value shifts toward experiential and service-based outdoor solutions (installation, maintenance, outdoor living) rather than purely product-centric (plants, pots, consumables). Simultaneously, the nursery/greenhouse and retail segments must navigate higher input costs (labor, energy, transport), weather-driven volatility, and changed customer behaviors (after the elevated pandemic years). The environment for margin growth is tougher and requires strategic focus.
In summary, 2024 wasn’t a blockbuster year for the green industry, but neither was it a collapse. It was a year of recalibration: growth continued, particularly among landscape service firms, but overall the industry shifted into more sustainable, steady-state mode rather than binge expansion. The winners will be those who sharpen cost control, invest in
automation or differentiated services, and align with evolving customer preferences for outdoor-living and maintenance services.
Summary of Texas Sales
Total Green Industry sales in Texas for 2024 increased 4.47% to $31.99 billion from $30.57 billion in 2023. The historically large increase from 2020 to 2021 represented a 24.8% jump from $22.8 to $30.4 billion. The total sales for 2024 are near the all-time highest peak of $32.3 billion of 2022. Note that the sales figures are adjusted by the Texas Comptroller’s office for the preceding three years, which may result in some small differences for the annual reports until the figures are thoroughly revised and become permanent. The production and manufacturing sector increased 2.81% from $3.94 to $4.06 billion in 2022 and 2023 respectively for a 1.22% increase
The Horticultural Services sector increased 11.85% to $10.4 billion in 2024. The sales of the sector recovered after a 13.76% reduction in 2023, and it is practically at the same level as in 2022. The Wholesale and Retail sector is nearly flat with a 0.48% increase to a total of $17.5 billion. The net margins attributed to the retail sector accounted for $5.3 billion. Net margins represent the share of sales attributed to the retail sector and not accounting for the portion of sales included in the production and manufacturing sector or the horticultural services sector. This study measures green industry sales in Texas by sector and then estimates economic contributions to the Texas Economy in terms of output, employment and value added.
Methodology
In order to estimate economic contributions of the Green Industry to the Texas economy sales by each green industry sector need to be measured The North American Industry Classification System (NAICS) is used to gather data on total green industry sales, including all sectors related to the green industry The data used in this report were provided by the State Comptroller’s Office, as well as baseline data from the Green Industry Research Consortium National Nursery Survey and includes industry sales through the end of fiscal year 2024. Please note that the Texas Comptroller’s office updates the sales data for the preceding three years, so there will be some adjustments in the sales figures for the previous three years. Every business in the state and the country is classified by North American Industry Classification System (NAICS). NAICS was developed jointly by the United States, Canada, and Mexico to provide comparable statistics about business activity across North America. Green industry firms fall within one of the NAICS codes in Table 1.
Green Industry Sales in Texas
When reporting sales to the State Comptroller’s office, each firm must report all sales, including those with sales taxes and those without sales taxes (wholesale). The reporting system has an area of potential slippage. For example, since wholesale growers do not
collect any sales tax (for the state), some small and medium size growers are unaware of their reporting responsibilities. Not all firms realize, however, that their services are subject to sale taxes. Therefore, unintended non-compliance has been a source of under reporting, which would underestimate green industry sales in Texas.
Table 1. NAICS Codes for Green Industry Sectors
Industry Sector
Nursery & Greenhouse 1114
Lawn & Garden Equipment Mfg 333112
Greenhouse Manufacturing (Prefab. Metal Buildings)* 332311
Landscaping Services 561730
Landscape Architectural Services 541320
Flower, Nursery Stock And Florist Supplies Wholesalers 424930
Lawn & Garden Equipment & Supplies Stores 4442
Florists 4531
Building Material & Supplies Dealers* 4441
Food & Beverage Stores* 445
General Merchandise Stores* 452
Farm & Garden Machinery & Equipment Wholesalers* 423820
* Green industry represents a portion of overall business activity (Sectors not included in Previous Scope reports).
metal buildings (332311) (Greenhouses) ^*
^ Estimated from baseline data from National Nursery Survey, and Texas Comptroller’s Office Data.
* NAICS represents a portion of Total Green Industry Sales
Due to this potential slippage problem, additional data were used to supplement this report’s methodology. Table 2 shows Total Green Industry Gross Sales in 2024, and Table 3 shows sales from 2018-2024 for each green industry sector. Table 3 shows sales for the retail industry including gross sales, and net sales. Net sales represent the margin sales that correspond to the retail sector only.
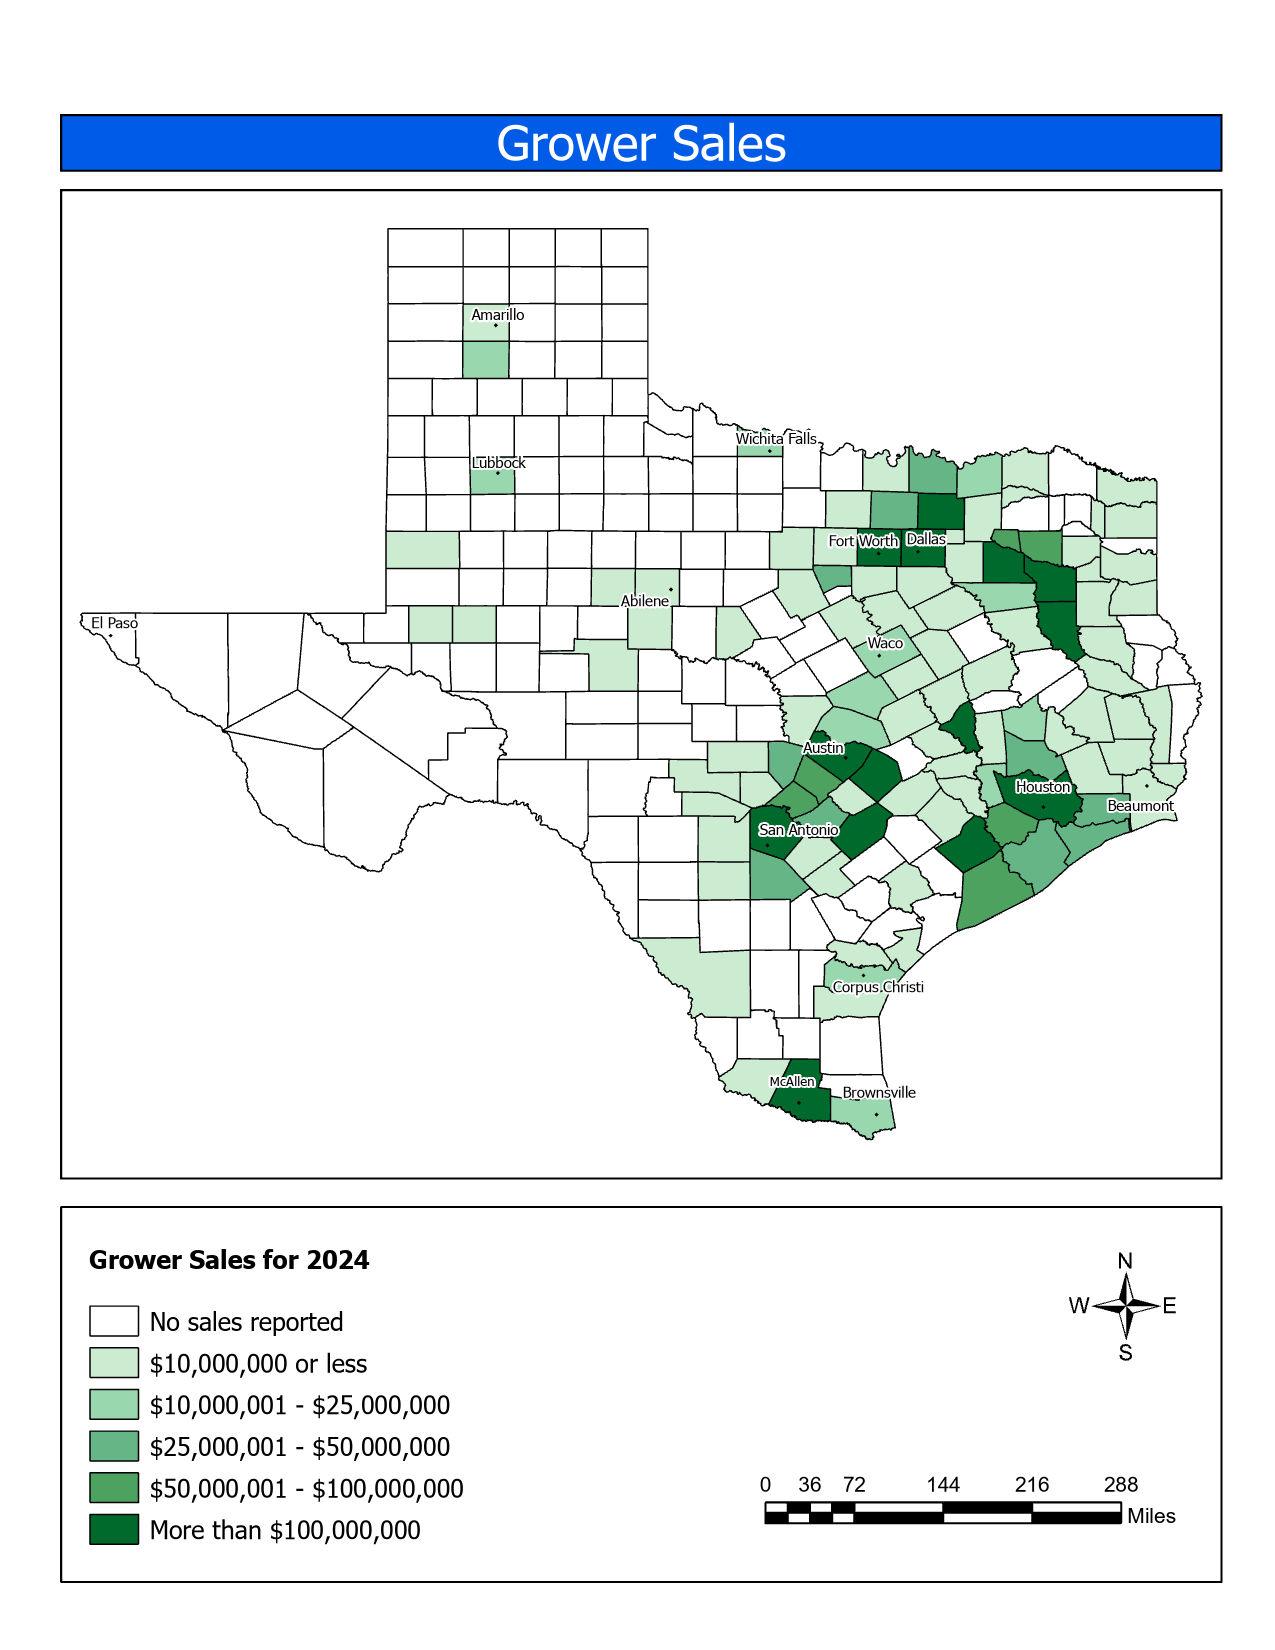
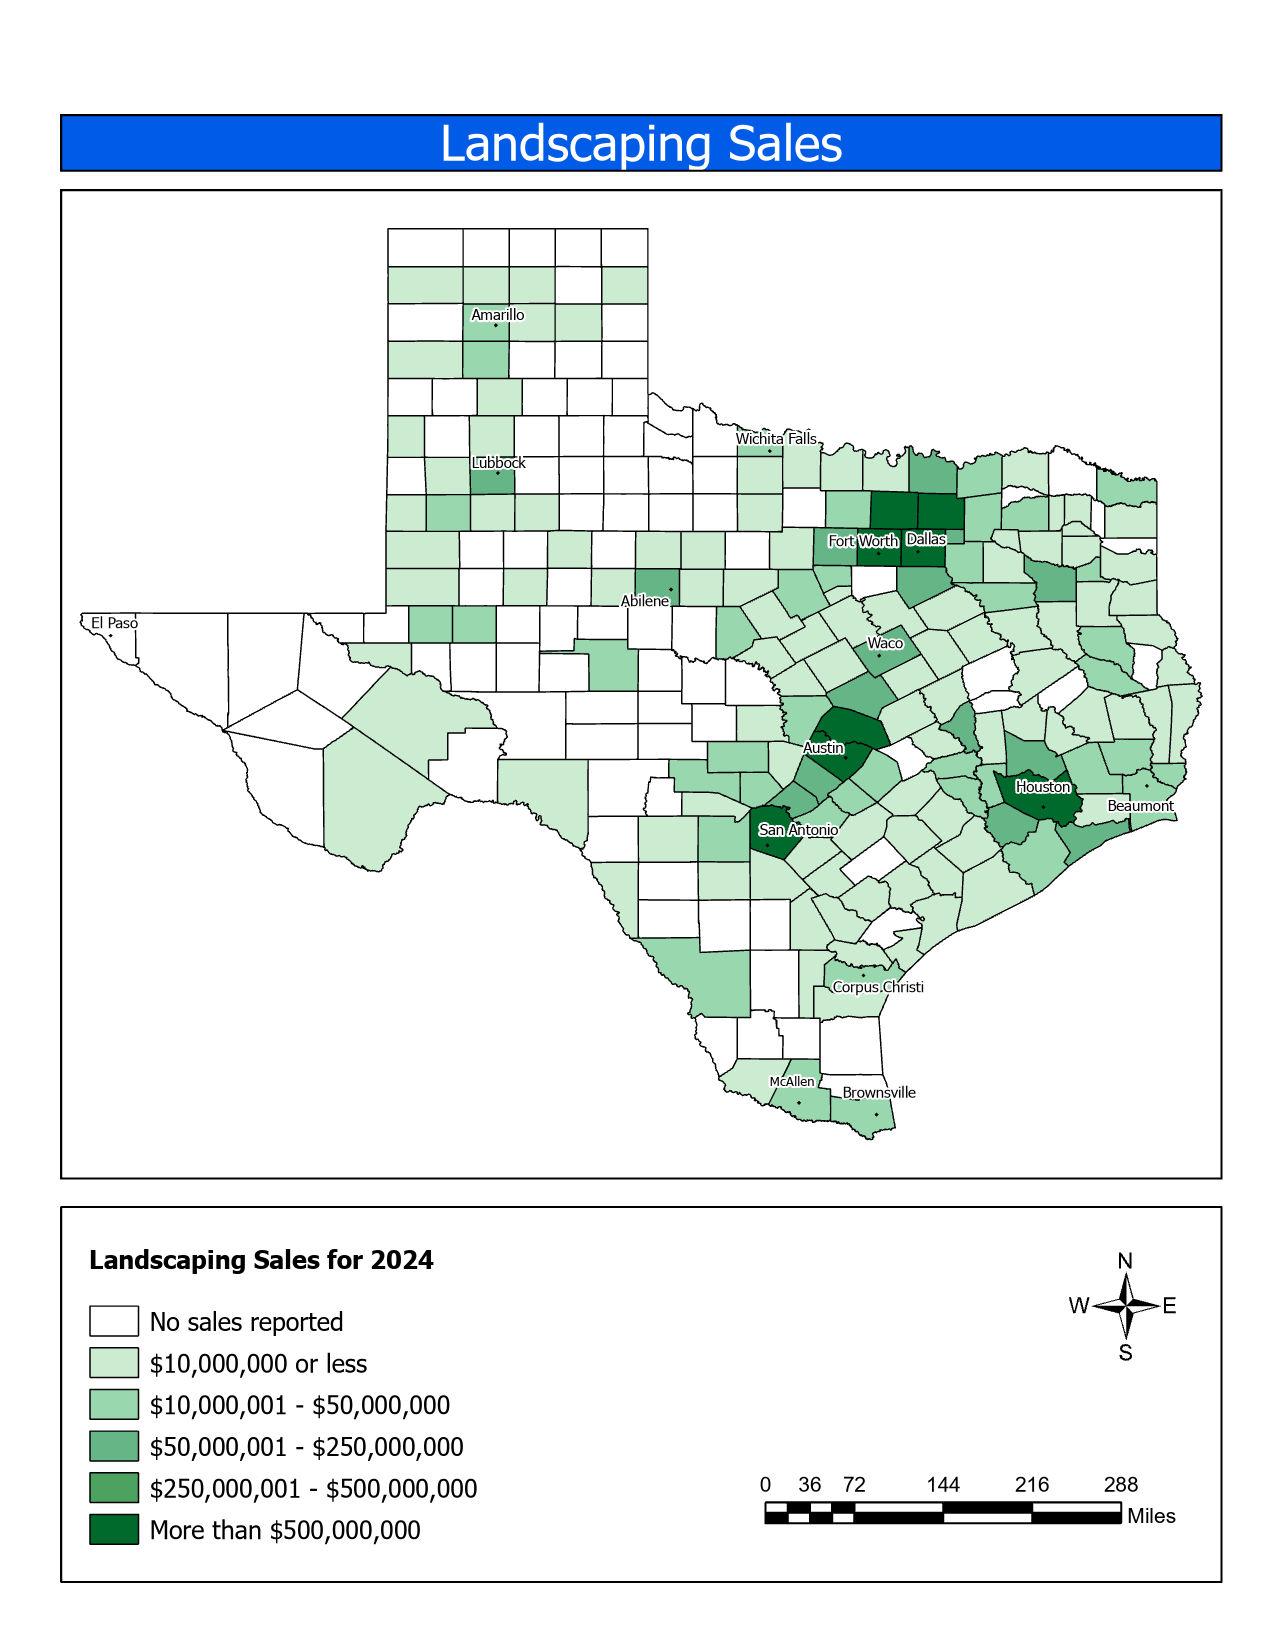
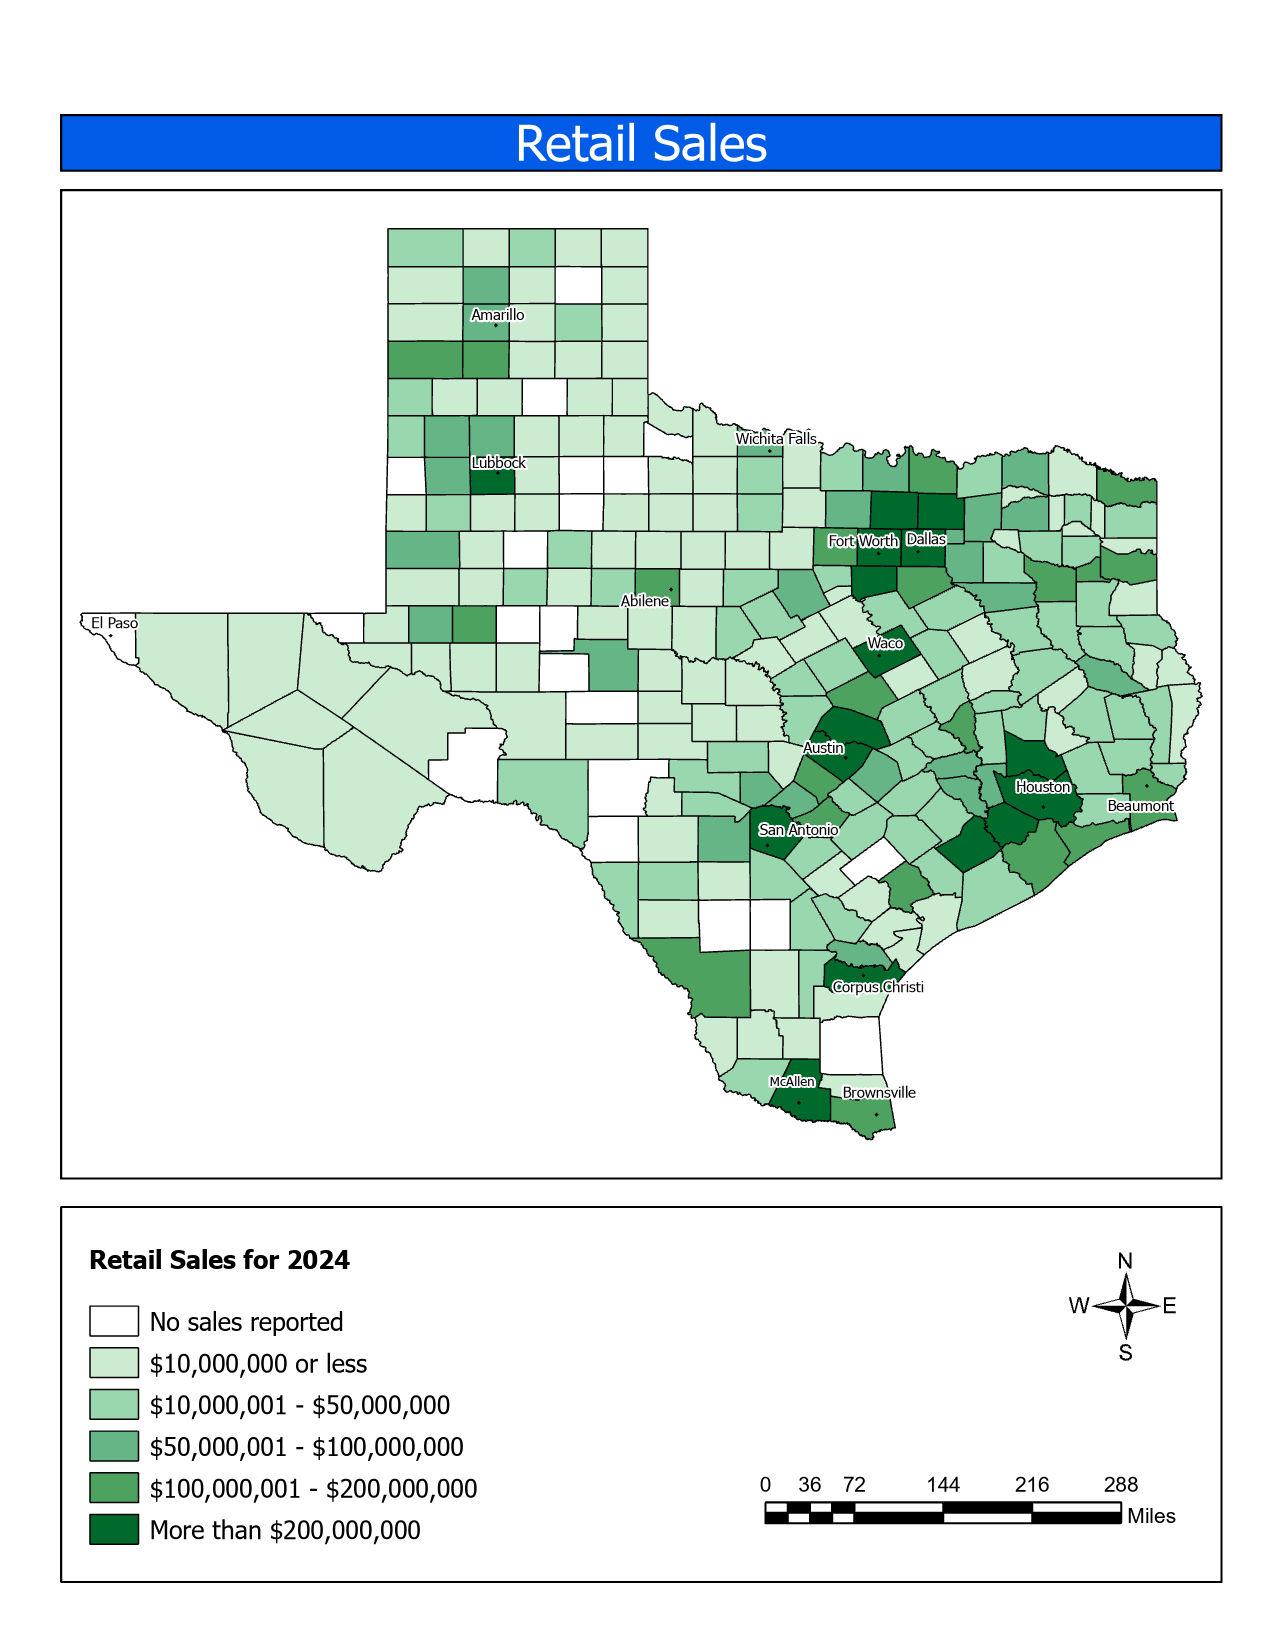
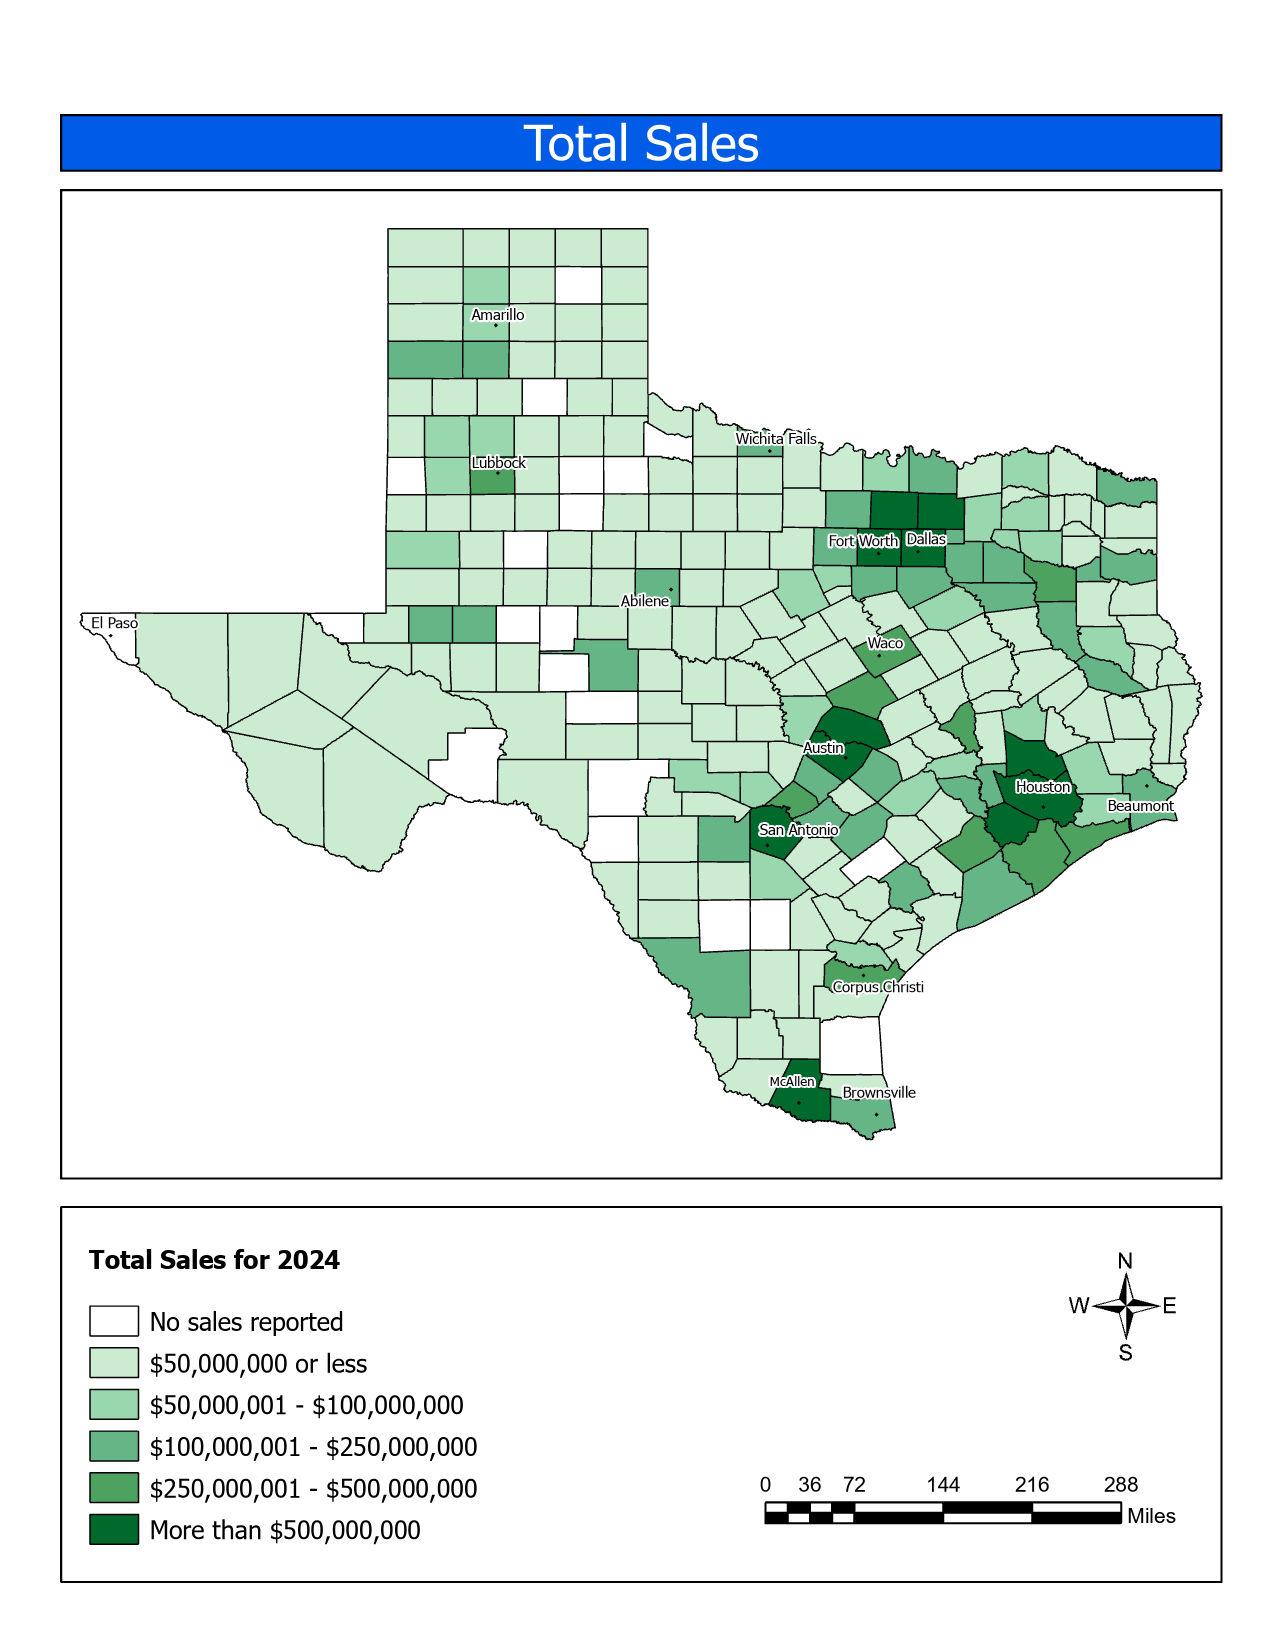
Total green industry gross sales, including grower, landscaping, and retailing sales increased 4.47% in 2024 for a total of $31 99 billion in gross sales. The grower sector experienced an increase of 2.81% to a total of $4.06 billion. The landscaping sector increased 11 85% to a total of $10.40 billion. Gross retail sales increased 0 48% to a total of $17 53 billion in 2024 Figures 1, 2, 3 and 4 represent industry sales for growers, landscaping, retailing (gross) and total gross industry sales respectively broken down by subsectors
3. Retailing Sales 2015-2024 .
Table 4 presents green industry sales by sector and by major Metropolitan Statistical Area (MSA). There are 27 MSAs in Texas. The economic scope reports sales in five of the major MSAs, including Austin, Dallas, Ft. Worth, Houston, and San Antonio. The five major MSAs included in this report represent a combined 61 37% of the total industry sales as shown in Figure 5. Dallas and Houston hold the largest share of green industry sales in 2024 with 20.04% and 17.07% respectively. Figure 6 is a graphical representation of grower, landscaping, and retailing sales by MSA in Texas.
Table 4. Total Green Industry Sales by Metropolitan Statistical Area (MSA), 2024 .
5. Total Green Industry Sales in Texas by MSA in 2024
Economic Contributions of the Green Industry to the Texas Economy
The net sales data from the previous section was used to estimate total economic contributions of the Green Industry to the Texas Economy. To evaluate the economic impact of the green industry to the Texas economy, economic models were developed using the Implan software system and associated Texas datasets (MIG, 2024). The Implan system includes more than 500 industries. Input-Output models represent the structure of a regional economy in terms of transactions, employees, households, and government institutions (Miller & Blair, 1985). It is noteworthy that the economic multipliers for the sectors were revised last year, and they are smaller reflecting overall less economic activity.
The economic multipliers derived from the Implan model were used to estimate the total economic activity generated in the state by sales (output) to final demand or exports. This includes the effects of intermediate purchases by green industry firms from other economic sectors (indirect effects) and the effects of green industry employee household consumer spending (induced effects), in addition to direct sales by industry firms. The wholesale and retail sectors use products from the production/manufacturing and horticultural services sectors; therefore, when calculating the impacts for the wholesale and retail trade horticulture products, output (retail sales) is reduced to reflect only the gross margin on sales to those sectors, otherwise we would be double counting the economic impact stemming from those products.
Economic impact multipliers vary based on data about actual relationships in the economy. The total economic contributions of the Green Industry in Texas were estimated at $34.65 billion in output; 224,490 jobs, and $22.28 billion in value added as shown in Table 5. For the production and manufacturing sectors, including nursery and greenhouse, lawn and garden equipment manufacturing, and metal building manufacturers, total output impacts were $5.54 billion; employment impacts were 38,308 jobs; and value-added impacts were $4.14 billion. For the horticultural services sectors, including landscaping services and landscape architecture services, total output impacts were $19 72 billion; employment impacts were 124,401 jobs; and value-added impacts were $11.43 billion. For the wholesale and retail trade sectors, total output impacts were $9.38 billion; employment impacts were 61,781 jobs; and value-added impacts were $6.70 billion. The largest economic impact contributions for individual sectors were landscaping services, lawn and garden stores and nursery and greenhouse.