Intelligence
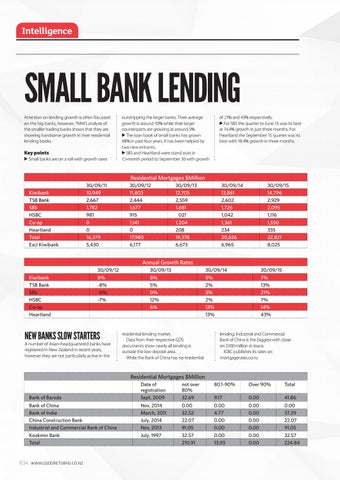
SMALL BANK LENDING Attention on lending growth is often focussed on the big banks, however, TMM’s analysis of the smaller trading banks shows that they are showing handsome growth in their residential lending books.
Key points
▶ Small banks are on a roll with growth rates
outstripping the larger banks. Their average growth is around 10% while their larger counterparts are growing at around 5% ▶ The loan book of small banks has grown 48% in past four years. It has been helped by two new entrants. ▶ SBS and Heartland were stand outs in 12-month period to September 30 with growth
of 21% and 43% respectively. ▶ For SBS the quarter to June 15 was its best at 14.4% growth in just three months. For Heartland the September 15 quarter was its best with 18.4% growth in three months.
Residential Mortgages $Million Kiwibank TSB Bank SBS HSBC Co-op Heartland Total Excl Kiwibank
30/09/11 10,949 2,667 1,782 981 0 0 16,379 5,430
30/09/12 11,803 2,444 1,677 915 1,141 0 17,980 6,177
30/09/13 12,705 2,559 1,681 1,021 1,204 208 19,378 6,673
30/09/14 13,861 2,602 1,726 1,042 1,361 234 20,826 6,965
30/09/15 14,796 2,929 2,095 1,116 1,550 335 22,821 8,025
Annual Growth Rates Kiwibank TSB Bank SBS HSBC Co-op Heartland
30/09/12 8% -8% -6% -7%
NEW BANKS SLOW STARTERS
A number of Asian-headquartered banks have registered in New Zealand in recent years, however they are not particularly active in the
30/09/13 8% 5% 0% 12% 6%
30/09/14 9% 2% 3% 2% 13% 13%
residential lending market. Data from their respective GDS documents show nearly all lending is outside the low deposit area. While the Bank of China has no residential
30/09/15 7% 13% 21% 7% 14% 43%
lending, Industrial and Commercial Bank of China is the biggest with close on $100 million in loans. ICBC publishes its rates on mortgagerates.co.nz
Residential Mortgages $Million
Bank of Baroda Bank of China Bank of India China Construction Bank Industrial and Commercial Bank of China Kookmin Bank Total
034
Date of registration Sept, 2009
not over 80% 32.69
80.1-90%
Over 90%
Total
9.17
0.00
41.86
Nov, 2014 March, 2011 July, 2014 Nov, 2013 July, 1997
0.00 32.52 22.07 91.05 32.57 210.91
0.00 4.77 0.00 0.00 0.00 13.93
0.00 0.00 0.00 0.00 0.00 0.00
0.00 37.29 22.07 91.05 32.57 224.84