As a native of New Mexico, and long-time business owner in Taos, I have a unique perspective on living and working here. I was raised in Taos and graduated from Taos High School and also lived and worked in Albuquerque, Detroit, Los Angeles, and Denver before bringing my advertising and marketing experience back to our local family business in 1997. As General Manager of Friday Motors, I had the privilege and opportunity to serve on many Boards and Initiatives and have a “Local’s” appreciation for our Arts, Culture, and History and our economy and future development.
My experience as a home buyer and seller in many cities has taught me what to expect in a dedicated Realtor and I strive to provide concierge level service to each of my clients. I promise to use my varied experience to research and evaluate opportunities for my clients with careful attention to the details that are important to them. I have over 35 years of experience in results driven marketing and I am passionate about applying these skills to what is most familiar… my own home town. I hope to be of particular assistance in starting and buying business properties and opportunities.
Our children graduated from our local school system and my husband and I are still in love with Taos! Among many interests, I have served as a member of the Taos County Chamber of Commerce, Taos Parks and Recreation Advisory Board, Founder of “500 Wishes for Children” holiday gift drive, “Women Give” Philanthropic Circle of the Taos Community Foundation, and I am the founding Director/President of High Altitude Athletics, a nonprofit Gymnastics and Cheer program. I am a member of the Luxury Home Marketing Institute and Commercial Association of Realtors of New Mexico, as well as, a member of the Taos County Association of Realtors. I am a certified Berkshire Hathaway Luxury Collection Specialist.
PAGE 4-7
PAGE 8
PAGE 9
PAGE 10
PAGE 11-14
PAGE 15
PAGE 16
PAGE 17-19
PAGE 20
NORTH AMERICAN LUXURY MARKET REVIEW
13-MONTH MARKET TRENDS
SINGLE-FAMILY HOMES MONTHLY OVERVIEW
ATTACHED HOMES MONTHLY OVERVIEW
MONTHLY STATISTICS BY CITY
LUXURY REPORT EXPLAINED
WELCOME MESSAGE
LOCAL LUXURY MARKET REVIEW
THANK YOU
NORTH AMERICAN LUXURY REVIEW
STABILITY MEETS SELECTIVITY
The luxury real estate market in North America in 2025 is a study in contrasts. While single-family homes continue to show resilience and even modest growth, the attached property market, encompassing condominiums and townhomes, has been moving at a slower pace.
Beneath these headline trends lie a set of deeper market forces: changes in inventory flow, evolving buyer expectations, and the continued importance of quality over sheer quantity.
This is not a market in decline, nor is it one experiencing runaway growth. Instead, it is operating in a space of stability, where affluent buyers remain active, but are deliberate in their choices, and sellers must align their offerings closely with current lifestyle and quality demands.
SINGLE-FAMILY HOMES: GROWTH WITH A SHIFT IN PACE
July’s market data shows that the single-family luxury segment remains strong compared to the past two years. Sales were 3.9% higher than July 2024 and 15.6% higher than July 2023. The sales ratio continues to favor sellers, although it is gradually moving toward balanced conditions.
One of the key contributors to this performance has been the increase in available inventory. Total supply for single-family homes was 21.7% higher year over year, with new listings up 12.2%, giving buyers more options and sellers more opportunities to connect with qualified prospects.
Despite this growth in supply, the median sold price has stayed consistent at approximately $1.3 million, both when compared to 2023 and 2024. This reflects an important reality of the luxury segment: when properties meet the high standards of today’s affluent buyers, they hold their value even when more inventory comes onto the market. The main sign of a shift is in the pace of sales, with days on market up 20% compared to last year. Buyers are clearly taking their time, evaluating multiple options before committing.
ATTACHED PROPERTIES: COOLING SALES BUT STABLE PRICES
The story is different in the attached property segment. In July, sales were 9.2% lower than the same month in 2024 and 0.6% lower than July 2023. The sales ratio is showing a steady tilt toward buyerfriendly conditions, with demand softening over recent months.
Inventory for attached homes is also in a different position compared to single-family properties. While there has been a year-over-year increase of 16.3%, the pace of new listings is slowing sharply. In June, attached homes saw new listings up 5.3% year over year, but by July, the growth rate had dropped to just 0.3%. This indicates that sellers in this segment are becoming more cautious, possibly waiting for stronger signals of buyer activity before bringing their properties to market.
Median sold prices for attached properties have stayed on par with previous years, which means that while sales volume has slowed, buyers are still willing to pay for the right property. As with single-family homes, attached properties that do not meet current luxury expectations are taking longer to sell.
INVENTORY TRENDS: QUANTITY AND QUALITY
Inventory is an important driver in both segments, but in the luxury space, more listings do not necessarily mean better opportunities. While overall availability is up 21.7% for single-family homes and 16.3% for attached properties, the real question is whether the inventory matches what buyers are looking to purchase.
Today’s affluent clients are not willing to compromise on key features. They are looking for exclusivity, thoughtful design, sustainability, state-of-the-art amenities, and exceptional craftsmanship.
These buyers are not just purchasing a home; they are investing in a lifestyle that reflects their personal values and aspirations. A property that falls short of delivering this will often remain on the market until it is repositioned, either through pricing adjustments or significant enhancements to its presentation.
PRICE STABILITY DESPITE HIGHER SUPPLY
Typically, rising inventory puts downward pressure on pricing, but the luxury market often resists this pattern. In comparison to last year, as reported by Zillow in June, the median sold price for the top 10% of the market has risen nearly 2.7%, even with inventory levels up by as much as 30–35% year over year in some areas.
Part of the reason is that high-end inventory remains low from a historical perspective, and the pool of wealthy buyers continues to grow. As of July, the sold-to-list price ratio was 98.33% for single-family homes and 98.34% for attached properties, underscoring the fact that well-positioned luxury properties are selling very close to their asking price.
MARKET RESILIENCE AND BUYER BEHAVIOR
The data from July, showing both an increase in inventory and solid sales, points to a market where confidence is still present on both sides of the transaction. However, if inventory continues to grow without a matching rise in sales, certain properties, especially those that have been on the market longer, may need price adjustments to attract buyer attention.
Affluent buyers are approaching their purchases with both strategic and emotional considerations. They expect agents to offer deep market insight, innovative marketing strategies, and a clear understanding of how to match properties with their exact needs. Increasingly, this includes leveraging technology such as AI-driven analytics and immersive digital presentations to identify and evaluate homes before ever stepping inside.
For these buyers, real estate remains one of the most dependable long-term investments. Beyond the financial returns, a luxury home offers something harder to quantify: a sense of security, a personal sanctuary, and a foundation for a desired lifestyle. This dual benefit, financial
stability and personal fulfillment, continues to make high-end real estate an attractive choice, even in a market that is more measured than in previous years.
A MARKET IN REFINED EQUILIBRIUM
The North American luxury market is positioned in what could be called a refined equilibrium. Singlefamily homes are likely to maintain steady demand, supported by expanded inventory and stable pricing, though longer selling times may become the norm. The attached property segment may continue to face headwinds, with sales volume under pressure even as prices remain firm, a sign of ongoing but selective demand.
Inventory will remain a central factor, but success in this space will depend on more than the number of listings - quality will be the true differentiator. Buyers will continue to seek properties that align precisely with their lifestyle, design, and location requirements, while sellers who adapt to these expectations will be best positioned to achieve strong results.
In short, 2025’s luxury real estate market is not one of dramatic swings, but of careful alignment. The balance between availability and selectivity, between steady prices and slower timelines, is defining the current landscape and will likely continue to do so for the remainder of the year.
IN CONCLUSION
Whether you’re investing, buying, or selling locally or globally in 2025, understanding market data and trends are essential to making smart, strategic decisions in an evolving luxury real estate landscape.
Working with a trusted luxury property specialist is key to gaining insight into what’s truly happening in your local market.
The art of buying and selling in this environment demands a critical and analytical approach. Setting realistic expectations and staying grounded in current realities will help ensure your goals are met with confidence and clarity.
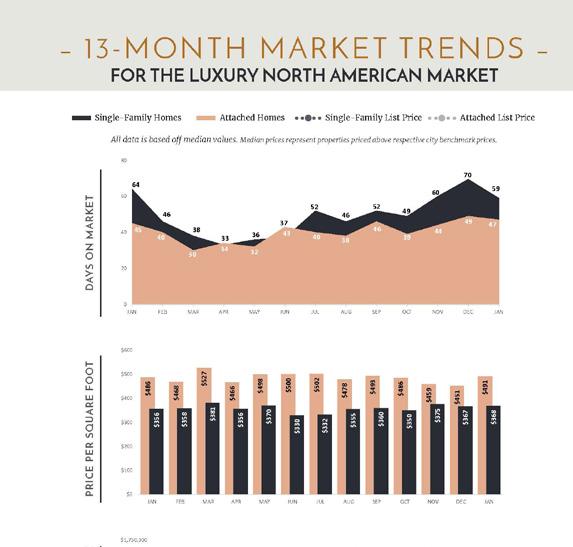
– 13 - MONTH MARKET TRENDS –
THE LUXURY NORTH AMERICAN MARKET
Attached Homes Single-Family List Price Attached List Price Single-Family Homes
All data is based off median values. Median prices represent properties priced above respective city benchmark prices.
$1,700,000
$1,500,000
$1,300,000
$1,100,000
$900,000
$700,000
$500,000
– LUXURY MONTHLY MARKET REVIEW –
A
Review of Key Market Differences Year over Year
SINGLE-FAMILY HOMES
SINGLE-FAMILY HOMES MARKET SUMMARY | JULY 2025
• Official Market Type: Seller's Market with a 24.17% Sales Ratio.1
• Homes are selling for an average of 98.33% of list price.
• The median luxury threshold2 price is $900,000, and the median luxury home sales price is $1,316,027.
• Markets with the Highest Median Sales Price: Pitkin County ($11,800,000), Eagle County ($6,925,000), Whistler ($5,600,000), and Ft. Lauderdale ($4,574,500).
• Markets with the Highest Sales Ratio: Cleveland Suburbs (115.1%), St. Louis (88.8%), Central Connecticut (85.4%), and DuPage County (70.9%).
1
– LUXURY MONTHLY MARKET REVIEW –
A Review of Key Market Differences Year over Year
• Official Market Type: Balanced Market with a 16.36% Sales Ratio.1
• Attached homes are selling for an average of 98.34% of list price.
• The median luxury threshold2 price is $700,000, and the median attached luxury sale price is $874,000.
• Markets with the Highest Median Sales Price: Whistler ($2,850,000), Pitkin County ($2,778,250), San Francisco ($2,300,000), and Ft. Lauderdale ($2,200,000).
• Markets with the Highest Sales Ratio: Fairfax County, VA (97.9%), Arlington & Alexandria, VA (78.2%), McLean & Vienna, VA (69.0%), and Anne Arundel County, MD (66.1%).
– LUXURY MONTHLY MARKET REVIEW –
– LUXURY MONTHLY MARKET REVIEW –
– LUXURY MONTHLY MARKET REVIEW –
– LUXURY MONTHLY MARKET REVIEW –
– LUXURY REPORT EXPLAINED –
The Institute for Luxury Home Marketing has analyzed a number of metrics — including sales prices, sales volumes, number of sales, sales-price-to-list-price ratios, days on market and price-per-squarefoot – to provide you a comprehensive North American Luxury Market report.
Additionally, we have further examined all of the individual luxury markets to provide both an overview and an in-depth analysis - including, where data is sufficient, a breakdown by luxury singlefamily homes and luxury attached homes.
It is our intention to include additional luxury markets on a continual basis. If your market is not featured, please contact us so we can implement the necessary qualification process. More in-depth reports on the luxury communities in your market are available as well.
Looking through this report, you will notice three distinct market statuses, Buyer's Market, Seller's Market, and Balanced Market. A Buyer's Market indicates that buyers have greater control over the price point. This market type is demonstrated by a substantial number of homes on the market and few sales, suggesting demand for residential properties is slow for that market and/or price point.
By contrast, a Seller's Market gives sellers greater control over the price point. Typically, this means there are few homes on the market and a generous demand, causing competition between buyers who ultimately drive sales prices higher.
A Balanced Market indicates that neither the buyers nor the sellers control the price point at which that property will sell and that there is neither a glut nor a lack of inventory. Typically, this type of market sees a stabilization of both the list and sold price, the length of time the property is on the market as well as the expectancy amongst homeowners in their respective communities – so long as their home is priced in accordance with the current market value.
REPORT GLOSSARY
DAYS ON MARKET: Measures the number of days a home is available on the market before a purchase offer is accepted.
LUXURY BENCHMARK PRICE: The price point that marks the transition from traditional homes to luxury homes.
NEW LISTINGS: The number of homes that entered the market during the current month.
PRICE PER SQUARE FOOT: Measures the dollar amount of the home's price for an individual square foot.
SALES RATIO: Sales Ratio defines market speed and determines whether the market currently favors buyers or sellers. A Buyer's Market has a Sales Ratio of less than 12%; a Balanced Market has a ratio of 12% up to 21%; a Seller's Market has a ratio of 21% or higher. A Sales Ratio greater than 100% indicates the number of sold listings exceeds the number of listings available at the end of the month.
SP/LP RATIO: The Sales Price/List Price Ratio compares the value of the sold price to the value of the list price.
REMAINING INVENTORY: The total number of homes available at the close of a month.
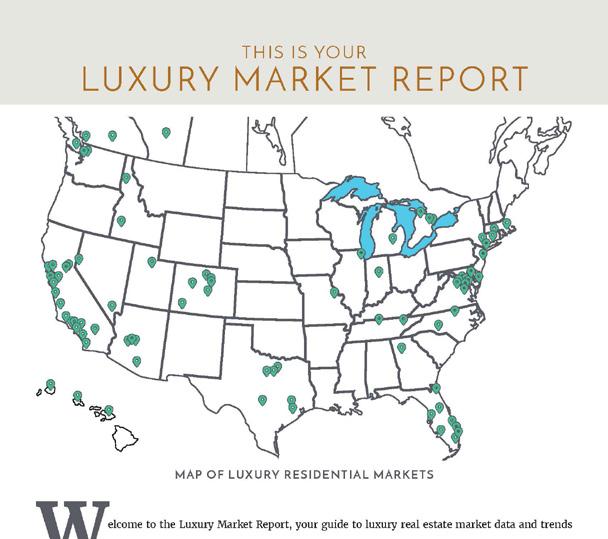
LUXURY RESIDENTIAL MARKETS
The Luxury Market Report is your guide to luxury real estate market data and trends for North America.
Produced monthly by The Institute for Luxury Home Marketing, this report provides an in-depth look at the top residential markets across the United States and Canada. Within the individual markets, you will find established luxury benchmark prices and detailed survey of luxury active and sold properties designed to showcase current market status and recent trends. The national report illustrates a compilation of the top North American markets to review overall standards and trends.
The Luxury Market Report is a monthly analysis provided by The Institute for Luxury Home Marketing. Luxury benchmark prices are determined by The Institute. This active and sold data has been provided by REAL Marketing, who has compiled the data through various sources, including local MLS boards, local tax records and Realtor.com. Data is deemed reliable to the best of our knowledge, but is not guaranteed.
TAOS NEW MEXICO
2025
SINGLE - FAMILY HOMES
LUXURY INVENTORY VS. SALES | JULY 2025
$3,500,000+
$3,000,000
$2,500,000
$2,000,000 - $2,499,999
$1,800,000 - $1,999,999
$1,600,000 - $1,799,999
$1,400,000 - $1,599,999
$1,300,000 - $1,399,999
$1,200,000 - $1,299,999
$1,100,000
$800,000 - $849,999
MEDIAN DATA REVIEW | JULY
• The single-family luxury market is a Buyer's Market with a
Ratio • Homes sold for a median of 96.30% of list price in July 2025. • The most active price band is $800,000-$849,999, where the sales ratio is
. • The median luxury sales price for
homes is $880,000. • The median days on market for July 2025 was 82 days, up from 66 in July 2024.