DES MOINES, IOWA | OCTOBER 2025




DES MOINES, IOWA | OCTOBER 2025


Joining Century 21 Signature Real Estate in 2005, I’ve been leading buyers and sellers towards their real estate goals in central Iowa through ownership and investing. Recognized as a top performer, I was named 2020 DMAAR Realtor of the Year and 2021 Iowa Realtor of the Year. Consistently ranking in the top 10 in Iowa and top 100 nationally for Century 21, I’m committed to excellence!
I believe we have such a strong team because we all share the same vision at 515REALTOR and are fully committed to helping our clients achieve their goals. It’s important to all of us that our clients feel heard, cared for and they receive the best real estate experience possible. We pride ourselves on going above and beyond the call of duty and making real estate as stress-free as possible for everyone involved.
Whether you’re looking to buy, sell, or design and build your dream home, call us today to begin your custom experience!



PAGE 4-7
PAGE 8
PAGE 9
PAGE 10
PAGE 11-14
PAGE 15
PAGE 16
PAGE 17-19
PAGE 20
NORTH AMERICAN LUXURY MARKET REVIEW
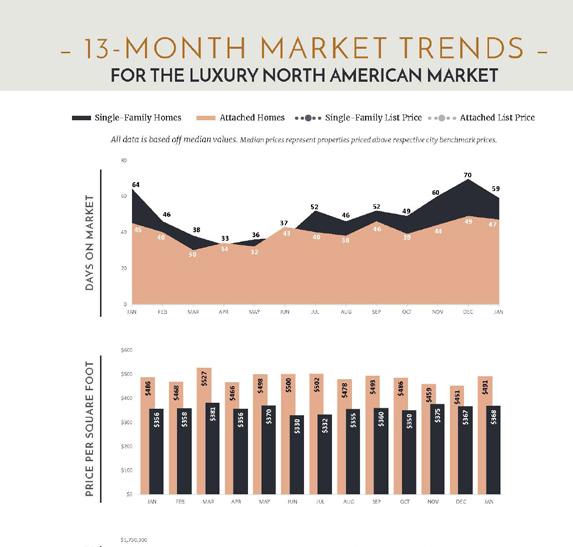
13-MONTH MARKET TRENDS
SINGLE-FAMILY HOMES MONTHLY OVERVIEW
ATTACHED HOMES MONTHLY OVERVIEW
MONTHLY STATISTICS BY CITY
LUXURY REPORT EXPLAINED
WELCOME MESSAGE
LOCAL LUXURY MARKET REVIEW
THANK YOU


After several years defined by sharp financial swings, shifting capital flows, and evolving buyer expectations, the North American luxury real estate market continues to settle into a more stable rhythm. According to the Institute’s data for September 2025, the results point to a market that is neither cooling dramatically nor accelerating uncontrollably but instead evolving into one characterized by moderation and discernment, although there are clear regional differences.
The numbers reveal both progress and adjustment: rising sales despite larger inventories, modest price appreciation, and a return to more traditional market pacing. Taken together, these shifts signal a luxury sector that continues to mature, with fundamentals, not volatility, driving performance.
Overall inventory in September rose by just under 14%, and new listings by 10.2% compared to September 2024. Sales increased by 15.2%, reflecting sustained buyer engagement even as options expand. The median sold price rose by 2.9%, while the median list price increased only 0.8%, underscoring a market where sellers are pricing more realistically and buyers are acting decisively on homes that meet high standards of value and lifestyle.
These dynamics point to a market that is now characterized by value-based negotiation. The luxury buyer of late 2025 is not chasing price spikes, they are prioritizing quality, location, design, and long-term stability. They are also factoring in broader economic influences such as interest rate adjustments, equity market performance, and global investment trends.
The last few months have seen a decline in the overall level of luxury inventory - falling by 8.0% since June, when it was at its highest. By comparison, in 2024, inventory increased by nearly 1% over the same four-month period. In correlation, the number of sold properties per month has also declined month
over month since June by 23.8% - putting this into perspective, the same period in 2024 saw a steeper 26.5% decline.
Overall, the number of luxury homes sold in 2025, as of the end of the third quarter, has exceeded 2024 levels by 4.9%. Thereby giving a clear indication that demand remains comparatively stronger this year, despite the more measured pace of recent months.
Overall inventory in September rose by 10.2% and new listings by 5.9% compared to September 2024. Sales increased by 14.6%, which is a substantial improvement given that the previous three months had each seen declines compared to their corresponding periods in 2024. The median sold price saw a 3.46% increase, while the median list price only increased by 0.1%, indicating that buyers remain willing to pay for well-positioned properties and are responding to competitive pricing.

This segment reached its greatest volume of available inventory in May 2025, but since then numbers have declined monthly and are now 7.3% lower as of the end of September. In contrast, in 2024, inventory rose nearly 1% during the same months. Similarly, the number of sold properties per month has declined month over month since May, with sales approximately 16.4% lower than in May, whereas in 2024 the decline was more pronounced at 23.4%.
Overall, as of the end of the third quarter, the total number of sold attached luxury properties in 2025 has declined by 4.3% compared to the previous year. This indicates that while this segment is stabilizing, it remains slightly more sensitive to pricing and inventory shifts than the luxury single-family market.
While these figures show current trends, it is important to view them within the broader context of the last several years. The market has been shaped not by internal over-correction but by external economic, financial, and global pressures from interest rate fluctuations and inflationary cycles to shifts in global wealth allocation and investment behavior.
Given the continued increase in overall inventory, it would be misleading to interpret the recent monthto-month declines as negative. Rather, these movements reflect a market that is leveling out. Despite external economic challenges, 2025’s data shows that luxury real estate has performed comparatively better than in 2024. The luxury sector remains in a cautious “wait-and-see” mode, but one that aligns with more traditional, sustainable expectations for growth and stability.
The Institute’s data underscores a critical narrative: month-to-month slowdowns in 2025 represent a recalibration, not a reversal. In many ways, the market is entering a phase of balance, where supply and demand are approaching parity and price movements are governed by fundamentals rather than sentiment. Buyers and sellers alike are adjusting expectations, price growth is moderating but not reversing, and overall confidence is stabilizing on stronger financial footing.
One of the most significant findings from the Institute’s data is how geographically distinct the luxury landscape has become. Broader national trends now conceal sharp local variations driven by regional economies, employment patterns, tax policy, and even international capital flows.

Across the United States, some of the strongest luxury markets in September were in California, Connecticut, Illinois, Maryland, Michigan, Minnesota, North Carolina, New Jersey, Ohio, and Virginia - all currently classified as seller’s markets. These areas continue to see tight inventory, strong absorption rates, and even competitive offers.
Meanwhile, much of the Sun Belt and Mountain West - including Arizona, Colorado, Florida, Georgia, Idaho and Texas – as well as Hawaii and Washington have transitioned toward balanced or buyer’s markets. This shift reflects both an easing of speculative demand and a normalization of supply following years of strong migration and luxury development.
In Canada, Alberta remains a strong seller’s market, supported by economic diversification and competitive pricing relative to global peers. Conversely, British Columbia and Ontario show signs of softening, particularly in urban condo markets where international demand has moderated due to global capital shifts and regulatory tightening.
The takeaway is clear: luxury real estate is once again a localized business, where understanding regional data and economic undercurrents is key to navigating opportunity.
Several powerful forces are influencing the trajectory of luxury housing across North America: most notably interest rates, capital markets, global wealth trends, and lifestyle reprioritization.
The recent rate cuts by the Federal Reserve – the first in over a year - and the Bank of Canada have begun to subtly shift market sentiment. Mortgage rates, though still high by historical standards, are now at their lowest levels of 2025. For ultra-high-net-worth buyers, the impact is largely psychological
but nonetheless significant. Improved liquidity, stronger equity markets, and the expectation of a more supportive monetary environment heading into 2026 are fueling a confidence-led revival, where sentiment is driving renewed transaction activity.
Luxury real estate continues to be shaped by global wealth migration. Shifts in tax regimes, geopolitical uncertainty, and currency performance are influencing where affluent individuals choose to allocate capital. For instance, in the U.S., particularly coastal and traditional luxury markets remain attractive for both domestic and international wealth, supporting steady demand.
Buyers are increasingly prioritizing intrinsic value - seeking properties that combine design excellence, privacy, sustainability, and technological integration. The Institute’s data, showing slower growth in list prices but steady gains in sold prices, reflects a mindset where buyers will pay for quality, but only when justified by fundamentals.
Ongoing labor shortages and elevated material costs continue to limit new luxury construction. As a result, established properties in prime locations are retaining value and often commanding premiums, especially when turnkey and move-in ready.
In essence, the luxury real estate market of late 2025 is defined not by volatility but by maturity. Rising inventories, steady sales, and modest price appreciation point to a sector that is resilient, data-aware, and globally connected.
Looking ahead, the luxury real estate market appears poised for measured expansion rather than speculative growth. If interest rates continue to soften into early 2026, the combination of renewed confidence, balanced supply, and pent-up demand could translate into stronger transaction volumes.
For real estate professionals, this environment rewards expertise grounded in economic literacy and local understanding. The next phase of luxury real estate will not be shaped by speculation, but by informed strategy, long-term thinking, and confidence built on fundamentals.
Single-Family Homes
Attached Homes Single-Family List Price Attached List Price
All data is based off median values. Median prices represent properties priced above respective city benchmark prices.
$1,700,000
$1,500,000
$1,300,000
$1,100,000
$900,000
$700,000
$500,000
• Official Market Type: Seller's Market with a 21.20% Sales Ratio.1
• Homes are selling for an average of 97.99% of list price.
• The median luxury threshold2 price is $900,000, and the median luxury home sales price is $1,340,626.
• Markets with the Highest Median Sales Price: Pitkin County ($11,800,000), Telluride ($5,612,500), Paradise Valley ($4,138,717), and Eagle County ($4,125,000).
• Markets with the Highest Sales Ratio: Cleveland Suburbs (73.30%), Silicon Valley (65.70%), Central Connecticut (57.60%), and San Francisco (57.50%).
1
• Official Market Type: Balanced Market with a 16.90% Sales Ratio.1
• Attached homes are selling for an average of 98.21% of list price.
• The median luxury threshold2 price is $700,000, and the median attached luxury sale price is $904,100.
• Markets with the Highest Median Sales Price: Pitkin County ($3,100,000), San Francisco ($2,622,500), Park City ($2,600,000), and Whistler ($2,274,000).
• Markets with the Highest Sales Ratio: Morris County, NJ (81.80%), Fairfax County, VA (76.20%), DuPage County, IL (73.80%), and McLean & Vienna, VA (69.40%).
The Institute for Luxury Home Marketing has analyzed a number of metrics — including sales prices, sales volumes, number of sales, sales-price-to-list-price ratios, days on market and price-per-squarefoot – to provide you a comprehensive North American Luxury Market report.
Additionally, we have further examined all of the individual luxury markets to provide both an overview and an in-depth analysis - including, where data is sufficient, a breakdown by luxury singlefamily homes and luxury attached homes.
It is our intention to include additional luxury markets on a continual basis. If your market is not featured, please contact us so we can implement the necessary qualification process. More in-depth reports on the luxury communities in your market are available as well.
Looking through this report, you will notice three distinct market statuses, Buyer's Market, Seller's Market, and Balanced Market. A Buyer's Market indicates that buyers have greater control over the price point. This market type is demonstrated by a substantial number of homes on the market and few sales, suggesting demand for residential properties is slow for that market and/or price point.
By contrast, a Seller's Market gives sellers greater control over the price point. Typically, this means there are few homes on the market and a generous demand, causing competition between buyers who ultimately drive sales prices higher.
A Balanced Market indicates that neither the buyers nor the sellers control the price point at which that property will sell and that there is neither a glut nor a lack of inventory. Typically, this type of market sees a stabilization of both the list and sold price, the length of time the property is on the market as well as the expectancy amongst homeowners in their respective communities – so long as their home is priced in accordance with the current market value.
DAYS ON MARKET: Measures the number of days a home is available on the market before a purchase offer is accepted.
LUXURY BENCHMARK PRICE: The price point that marks the transition from traditional homes to luxury homes.
NEW LISTINGS: The number of homes that entered the market during the current month.
PRICE PER SQUARE FOOT: Measures the dollar amount of the home's price for an individual square foot.
SALES RATIO: Sales Ratio defines market speed and determines whether the market currently favors buyers or sellers. A Buyer's Market has a Sales Ratio of less than 12%; a Balanced Market has a ratio of 12% up to 21%; a Seller's Market has a ratio of 21% or higher. A Sales Ratio greater than 100% indicates the number of sold listings exceeds the number of listings available at the end of the month.
SP/LP RATIO: The Sales Price/List Price Ratio compares the value of the sold price to the value of the list price.
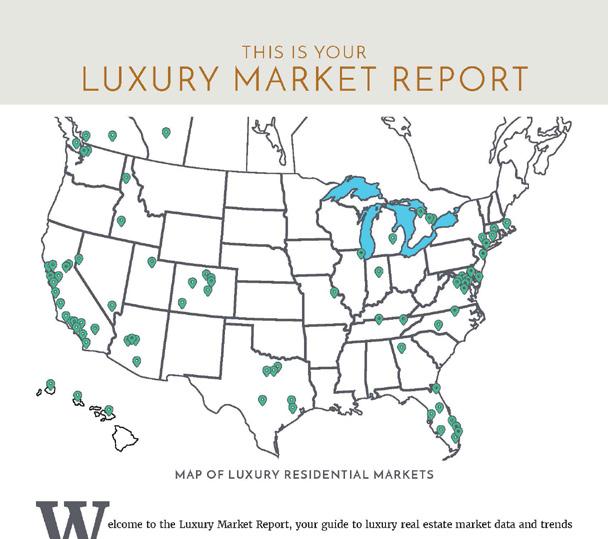
The Luxury Market Report is your guide to luxury real estate market data and trends for North America
Produced monthly by The Institute for Luxury Home Marketing, this report provides an in-depth look at the top residential markets across the United States and Canada. Within the individual markets, you will find established luxury benchmark prices and detailed survey of luxury active and sold properties designed to showcase current market status and recent trends. The national report illustrates a compilation of the top North American markets to review overall standards and trends.
Copyright © 2025 Institute for Luxury Home Marketing | www.luxuryhomemarketing.com | 214.485.3000
The Luxury Market Report is a monthly analysis provided by The Institute for Luxury Home Marketing. Luxury benchmark prices are determined by The Institute. This active and sold data has been provided by REAL Marketing, who has compiled the data through various sources, including local MLS boards, local tax records and Realtor.com. Data is deemed reliable to the best of our knowledge, but is not guaranteed.


$3,000,000+
$2,500,000 - $2,999,999
$2,250,000 - $2,499,999
$2,000,000 - $2,249,999
$1,750,000 - $1,999,999
$1,500,000 - $1,749,999
$1,250,000 - $1,499,999
$1,000,000 - $1,249,999
$900,000
$800,000
is $629,900.
The median days on market for September 2025 was 29 days, up from 22 in September 2024.


