HOW’S THE MARKET?
This is likely the most common question we get as real estate agents. To keep you up to date with the latest sales activities in The Woodlands, we are pleased to present to you the latest edition of the Seder Report. In this quarterly publication, you will find data on the latest home sales, broken down by zip code and price point
As a valued client, friend, or business partner, we believe that this report will be a beneficial resource for you. Whether you are considering a move, or simply interested in the local market, this report will provide you with valuable information to help you make informed decisions.
If you have any questions, would like to discuss the report in more detail, or would like details specific to your neighborhood, please do not hesitate to contact us
Sincerely,
Mike & Ally Seder

Seder@MikeSeder.com


281-602-8823
MikeSeder.com
No Pool
PriceRange #of Sold Homes Avg#of Bed Avg#of Bath AvgSqFt AvgList Price AvgSold Price AvgDays onMarket $100k-$299k 22 3 2 1,441 $262,440 $260,513 22 $300k-$499k 24 3 2 2,092 $379,133 $372,656 29 $500k-$599k 3 4 2 2,390 $556,333 $566,947 3 $600k-$699k 3 4 3 3,203 $637,000 $646,028 91 $700k-$799k 1 3 3 3,450 $745,000 $700,000 129 $800k-$999k 1 4 2 3,069 $825,000 $825,000 1 $1M-$1.999M 5 4 4 5,024 $1,617,200 $1,585,580 92 $2M-$2.999M 3 4 4 4,471 $2,333,300$2,379,967 1 $3M-$3.999M 0 $4M-$4.999M 0 $5MandAbove 0 77380
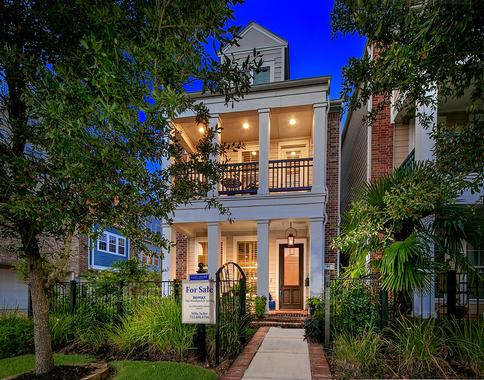
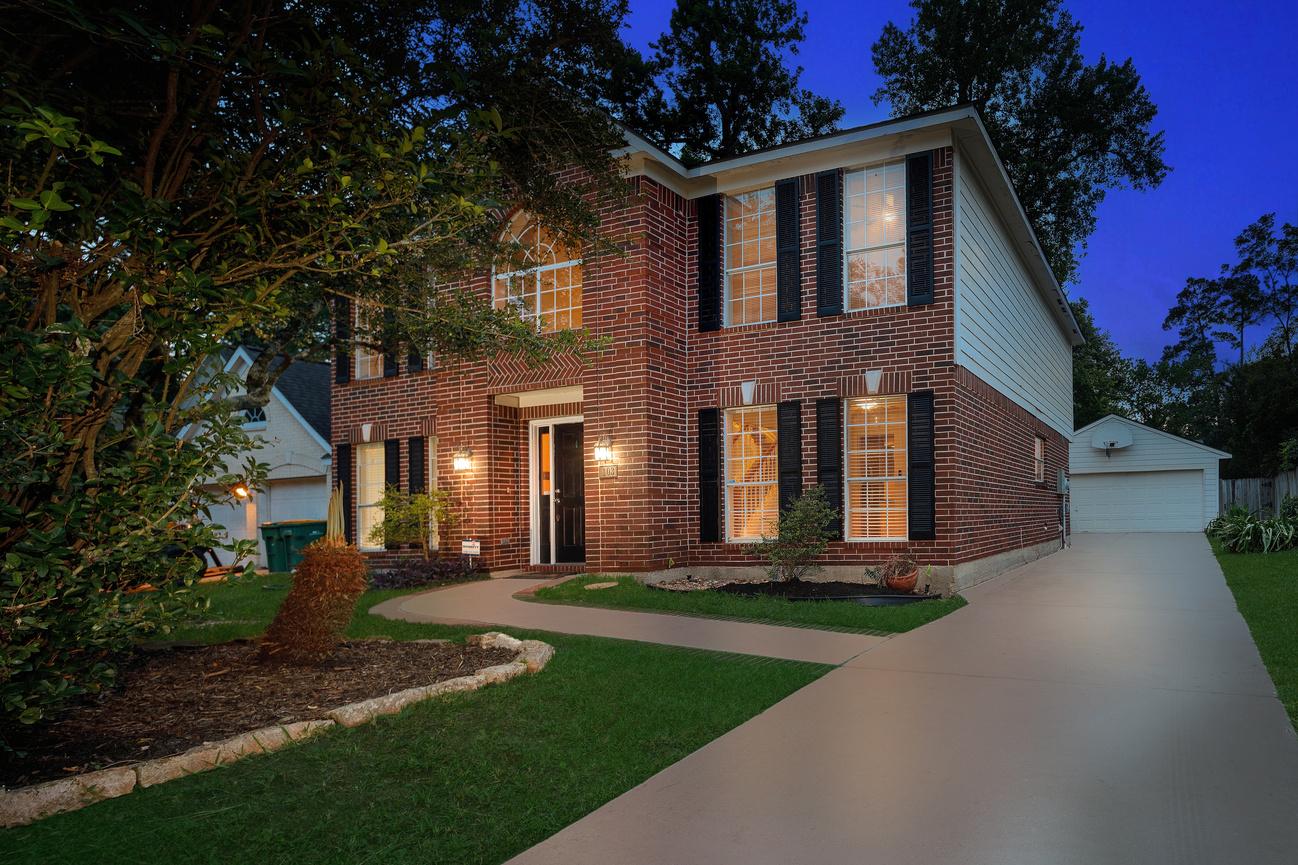
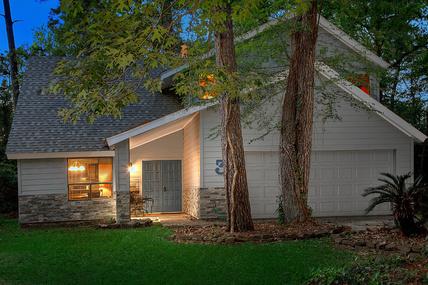
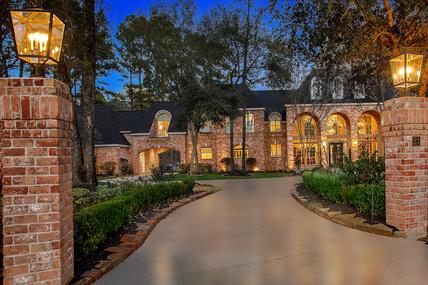
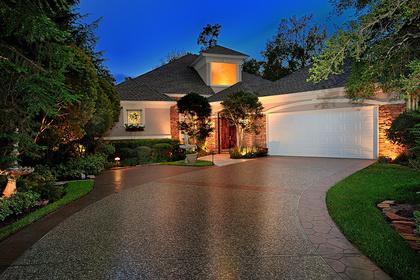
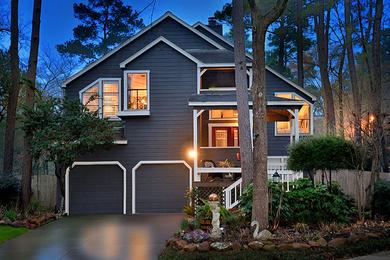
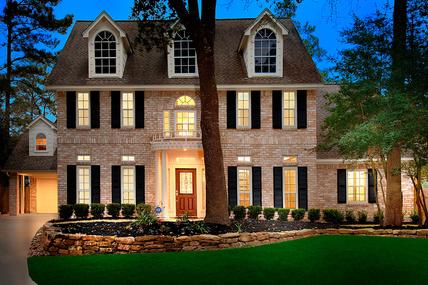
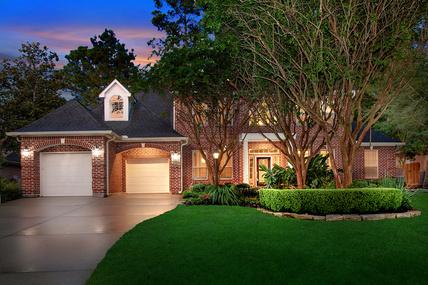
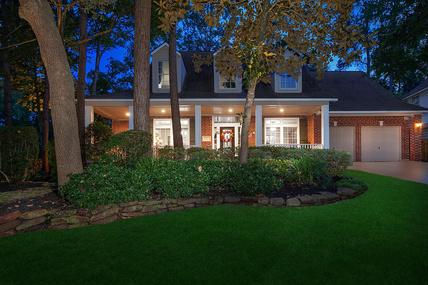
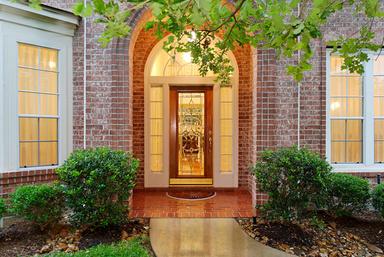
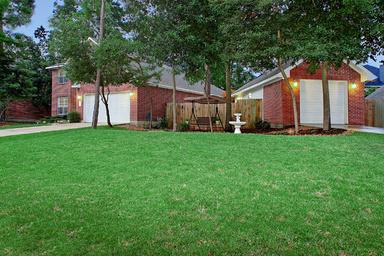
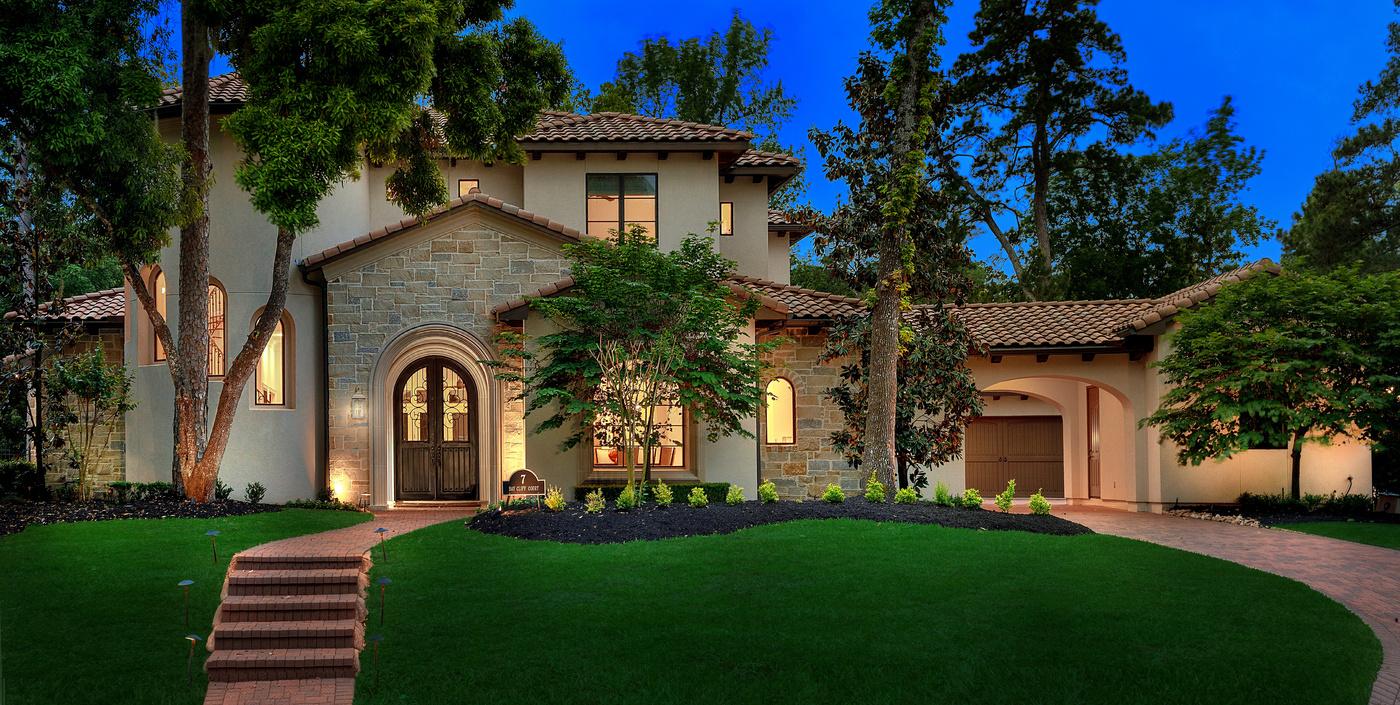
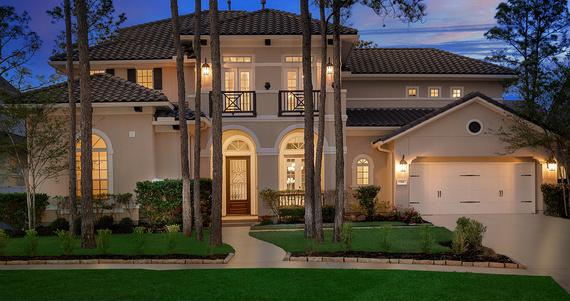
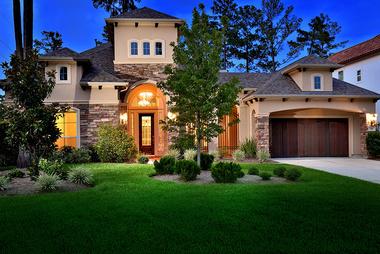
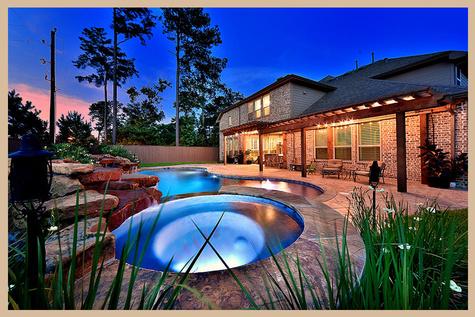
3 N T I M B E R T O P D R I V E S O L D I N 2 4 D A Y S 1 0 3 N R O C K F E R N C O U R T S O L D I N 3 D A Y S 4 6 R A F T E R S R O W S O L D I N 9 D A Y S This represents an estimated sale price for this property It is not the same as the opinion of value in an appraisal developed by a licensed appraiser under the Uniform Standards of Professional Appraisal Practice Data Source: Houston Association of REALTORS© Single family homes sold from April 1, 2023 - June 30, 2023. Information is believed to be accurate but is not guaranteed and should be individually verified.
77380 With Pool
PriceRange #of Sold Homes Avg#of Bed Avg#of Bath AvgSqFt AvgList Price AvgSold Price AvgDays onMarket $100k-$299k 0 $300k-$499k 8 4 3 2,209 $411,213 $404,063 51 $500k-$599k 0 $600k-$699k 1 5 3 3,538 $659,700 $690,000 2 $700k-$799k 1 4 2 2,715 $775,000 $740,000 18 $800k-$999k 0 $1M-$1.999M 6 4 4 4,651 $1,280,667$1,236,667 30 $2M-$2.999M 0 $3M-$3.999M 1 5 5 9,649 $3,590,000$3,550,000 156 $4M-$4.999M 1 5 6 8,853 $4,500,000$3,985,000 251 $5MandAbove 0
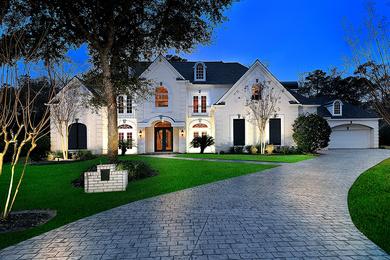
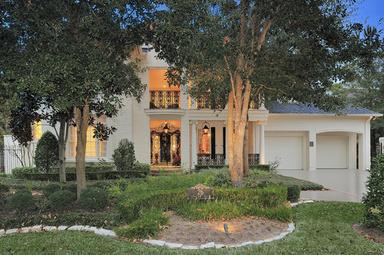
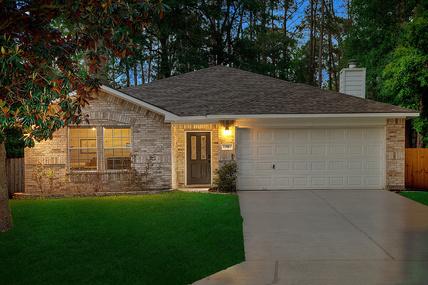
8 L A C E W I N G P L A C E S O L D I N 3 D A Y S 5 4 1 4 S O U T H G A T E D R I V E S O L D I N 3 D A Y S 2 3 M I S T Y G R O V E C I R C L E S O L D I N 2 D A Y S This represents an estimated sale price for this property It is not the same as the opinion of value in an appraisal developed by a licensed appraiser under the Uniform Standards of Professional Appraisal Practice Data Source: Houston Association of REALTORS© Single family homes sold from April 1, 2023 - June 30, 2023. Information is believed to be accurate but is not guaranteed and should be individually verified.
77381 No Pool
PriceRange #of Sold Homes Avg#of Bed Avg#of Bath AvgSqFt AvgList Price AvgSold Price AvgDays onMarket $100k-$299k 8 3 2 1,393 $268,625 $263,125 7 $300k-$499k 51 3 2 1,973 $396,325 $392,864 26 $500k-$599k 11 4 2 2,705 $535,126 $539,471 22 $600k-$699k 6 4 3 3,405 $689,717 $667,500 114 $700k-$799k 1 4 3 3,382 $675,000 $721,000 5 $800k-$999k 1 4 3 4,560 $940,000 $920,000 31 $1M-$1.999M 0 $2M-$2.999M 0 $3M-$3.999M 0 $4M-$4.999M 0 $5MandAbove 0
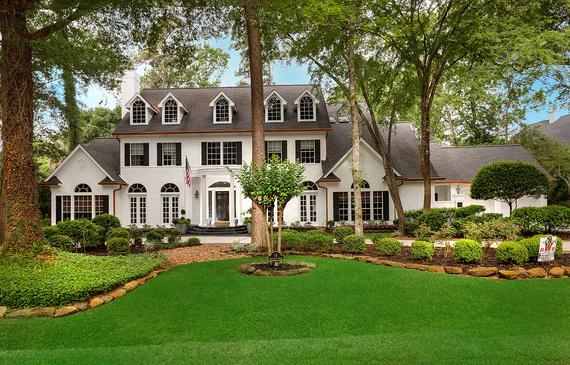
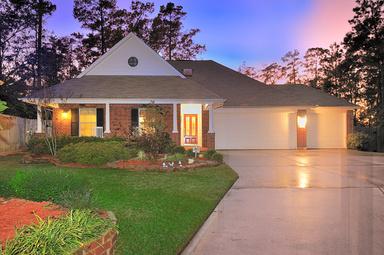
2 7 S L A K E M I S T H A R B O U R P L S O L D I N 3 D A Y S 7 H I D D E N D E E R C O R N E R C T S O L D I N 4 D A Y S 3 8 Q U A I L R O C K P L A C E S O L D I N 1 4 D A Y S This represents an estimated sale price for this property It is not the same as the opinion of value in an appraisal developed by a licensed appraiser under the Uniform Standards of Professional Appraisal Practice Data Source: Houston Association of REALTORS© Single family homes sold from April 1, 2023 - June 30, 2023. Information is believed to be accurate but is not guaranteed and should be individually verified.
77381 With Pool

PriceRange #of Sold Homes Avg#of Bed Avg#of Bath AvgSqFt AvgList Price AvgSold Price AvgDays onMarket $100k-$299k 0 $300k-$499k 10 4 2 2,327 $447,130 $444,050 45 $500k-$599k 10 4 3 2,743 $544,490 $557,350 20 $600k-$699k 13 4 3 3,012 $644,154 $651,963 5 $700k-$799k 10 4 3 3,430 $738,770 $747,170 38 $800k-$999k 10 4 3 3,588 $853,880 $850,925 15 $1M-$1.999M 9 4 4 4,468 $1,186,889 $1,207,847 6 $2M-$2.999M 2 6 6 7,916 $2,674,500 $2,400,000 146 $3M-$3.999M 0 $4M-$4.999M 0 $5MandAbove 0
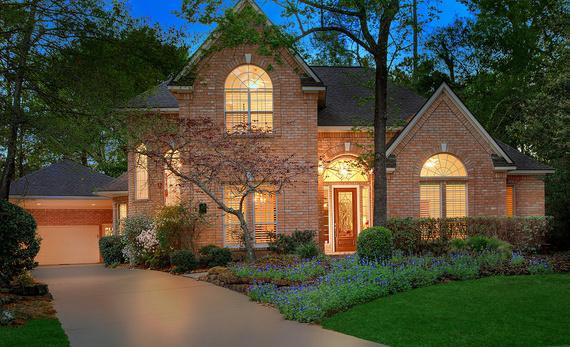
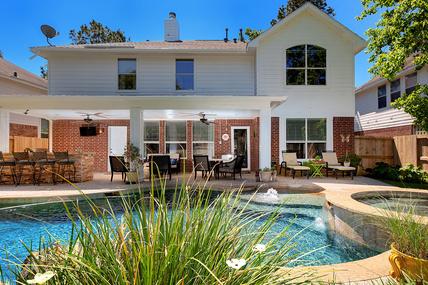
6 W I S L E P L A C E S O L D I N 1 D A Y 5 C R E S T O N E P L A C E S O L D I N 1 2 D A Y S 2 6 S T O N E C R O F T P L A C E S O L D I N 6 D A Y S This represents an estimated sale price for this property It is not the same as the opinion of value in an appraisal developed by a licensed appraiser under the Uniform Standards of Professional Appraisal Practice Data Source: Houston Association of REALTORS© Single family homes sold from April 1, 2023 - June 30, 2023. Information is believed to be accurate but is not guaranteed and should be individually verified.
77382 No Pool
PriceRange #of Sold Homes Avg#of Bed Avg#of Bath AvgSqFt AvgList Price AvgSold Price AvgDays onMarket $100k-$299k 0 $300k-$499k 47 3 2 2,171 $428,917 $427,090 20 $500k-$599k 15 4 2 2,592 $529,789 $538,067 36 $600k-$699k 8 4 3 3,220 $652,129 $642,806 54 $700k-$799k 3 4 3 3,860 $761,297 $737,333 6 $800k-$999k 2 4 4 4,385 $899,950 $912,500 8 $1M-$1.999M 0 $2M-$2.999M 1 5 5 7,220 $2,300,000 $2,100,000 216 $3M-$3.999M 0 $4M-$4.999M 0 $5MandAbove 0
9 0 E F A I R B R A N C H C I R C L E S O L D I N 3 D A Y S 3 8 S A C A C I A P A R K C I R C L E S O L D I N 5 D A Y S 2 3 K I N G S C O T E W A Y S O L D I N 2 0 D A Y S This represents an estimated sale price for this property It is not the same as the opinion of value in an appraisal developed by a licensed appraiser under the Uniform Standards of Professional Appraisal Practice Data Source: Houston Association of REALTORS© Single family homes sold from April 1, 2023 - June 30, 2023. Information is believed to be accurate but is not guaranteed and should be individually verified.
77382 With Pool

PriceRange #of Sold Homes Avg#of Bed Avg#of Bath AvgSqFt AvgList Price AvgSold Price AvgDays onMarket $100k-$299k 0 $300k-$499k 8 4 2 2,394 $490,361 $476,375 46 $500k-$599k 10 4 3 2,905 $561,080 $559,250 34 $600k-$699k 11 4 3 3,235 $643,173 $652,850 9 $700k-$799k 12 4 3 3,751 $735,658 $744,500 9 $800k-$999k 17 5 3 4,052 $867,729 $871,821 20 $1M-$1.999M 27 5 4 4,996 $1,354,889 $1,348,970 17 $2M-$2.999M 5 5 5 6,572 $2,583,000 $2,420,870 151 $3M-$3.999M 2 6 7 8,808 $3,625,000 $3,250,000 53 $4M-$4.999M 0 $5MandAbove 0
1 5 4 W S L A T E S T O N E C I R C L E S O L D I N 5 D A Y S 8 7 N B E T H A N Y B E N D C I R S O L D I N 1 6 D A Y S 3 8 L E G A T O W A Y S O L D I N 1 0 D A Y S This represents an estimated sale price for this property It is not the same as the opinion of value in an appraisal developed by a licensed appraiser under the Uniform Standards of Professional Appraisal Practice Data Source: Houston Association of REALTORS© Single family homes sold from April 1, 2023 - June 30, 2023. Information is believed to be accurate but is not guaranteed and should be individually verified.
77384 No Pool
PriceRange #of Sold Homes Avg#of Bed Avg#of Bath AvgSqFt AvgList Price AvgSold Price AvgDays onMarket $100k-$299k 19 3 2 1,599 $274,059 $273,200 78 $300k-$499k 92 4 3 2,472 $407,829 $407,195 36 $500k-$599k 7 4 2 2,916 $557,851 $551,599 39 $600k-$699k 9 4 3 3,264 $638,861 $637,768 37 $700k-$799k 4 4 3 3,036 $748,750 $735,575 58 $800k-$999k 2 5 4 3,415 $874,950 $842,500 15 $1M-$1.999M 2 5 4 5,027 $1,437,450 $1,395,000 19 $2M-$2.999M 0 $3M-$3.999M 0 $4M-$4.999M 0 $5MandAbove 0
2 2 W A T E R M I N T P L A C E S O L D I N 2 0 D A Y S 3 9 T A U P E W O O D P L A C E S O L D I N 1 5 D A Y S 2 6 W R E N F I E L D P L A C E S O L D I N 2 D A Y S This represents an estimated sale price for this property It is not the same as the opinion of value in an appraisal developed by a licensed appraiser under the Uniform Standards of Professional Appraisal Practice Data Source: Houston Association of REALTORS© Single family homes sold from April 1, 2023 - June 30, 2023. Information is believed to be accurate but is not guaranteed and should be individually verified.
77384 With Pool
PriceRange #of Sold Homes Avg#of Bed Avg#of Bath AvgSqFt AvgList Price AvgSold Price AvgDays onMarket $100k-$299k 0 $300k-$499k 1 4 3 3,043 $489,990 $490,000 24 $500k-$599k 4 4 3 2,777 $563,725 $550,000 48 $600k-$699k 7 4 3 3,224 $662,464 $659,857 20 $700k-$799k 3 4 3 3,400 $799,157 $728,500 41 $800k-$999k 4 4 4 3,989 $895,725 $890,000 63 $1M-$1.999M 5 5 5 4,950 $1,444,800 $1,414,500 75 $2M-$2.999M 0 $3M-$3.999M 0 $4M-$4.999M 0 $5MandAbove 0
1 9 0 W E V A N G E L I N E O A K S C I R S O L D I N 2 0 D A Y S 2 3 W E S T W A R D R I D G E P L S O L D I N 1 0 D A Y S 1 3 1 H A W K N E S T C O U R T S O L D I N 1 1 D A Y S This represents an estimated sale price for this property It is not the same as the opinion of value in an appraisal developed by a licensed appraiser under the Uniform Standards of Professional Appraisal Practice Data Source: Houston Association of REALTORS© Single family homes sold from April 1, 2023 - June 30, 2023. Information is believed to be accurate but is not guaranteed and should be individually verified.
77385 No Pool
PriceRange #of Sold Homes Avg#of Bed Avg#of Bath AvgSqFt AvgList Price AvgSold Price AvgDays onMarket $100k-$299k 28 3 2 1,872 $266,217 $257,283 85 $300k-$499k 99 4 2 2,298 $387,882 $382,278 111 $500k-$599k 20 4 3 3,209 $563,858 $551,037 92 $600k-$699k 7 4 3 3,199 $672,433 $639,979 225 $700k-$799k 5 4 4 3,524 $759,164 $725,403 116 $800k-$999k 2 4 4 4,069 $924,622 $879,017 156 $1M-$1.999M 0 $2M-$2.999M 0 $3M-$3.999M 0 $4M-$4.999M 0 $5MandAbove 0
1 8 N E W D A W N P L A C E S O L D I N 1 3 D A Y S 7 8 D R I F T I N G S H A D O W S C I R S O L D I N 1 2 D A Y S 2 7 1 M I S T Y D A W N S O L D I N 6 D A Y S This represents an estimated sale price for this property It is not the same as the opinion of value in an appraisal developed by a licensed appraiser under the Uniform Standards of Professional Appraisal Practice Data Source: Houston Association of REALTORS© Single family homes sold from April 1, 2023 - June 30, 2023. Information is believed to be accurate but is not guaranteed and should be individually verified.

PriceRange #of Sold Homes Avg#of Bed Avg#of Bath AvgSqFt AvgList Price AvgSold Price AvgDays onMarket $100k-$299k 0 $300k-$499k 4 4 3 3,190 $461,250 $470,000 15 $500k-$599k 4 4 3 2,850 $554,950 $552,000 48 $600k-$699k 1 4 3 3,050 $649,900 $635,000 13 $700k-$799k 0 $800k-$999k 0 $1M-$1.999M 0 $2M-$2.999M 0 $3M-$3.999M 0 $4M-$4.999M 0 $5MandAbove 0
1 9 S N O W W O O D S C O U R T S O L D I N 1 0 D A Y S 5 4 B O W I E B E N D C O U R T S O L D I N 1 1 D A Y S 5 1 G E N E S E E R I D G E D R I V E S O L D I N 9 D A Y S This represents an estimated sale price for this property It is not the same as the opinion of value in an appraisal developed by a licensed appraiser under the Uniform Standards of Professional Appraisal Practice Data Source: Houston Association of REALTORS© Single family homes sold from April 1, 2023 - June 30, 2023. Information is believed to be accurate but is not guaranteed and should be individually verified.
77385 With Pool
77389 No Pool
PriceRange #of Sold Homes Avg#of Bed Avg#of Bath AvgSqFt AvgList Price AvgSold Price AvgDays onMarket $100k-$299k 15 3 2 1,762 $253,267 $244,593 54 $300k-$499k 51 4 2 2,538 $391,741 $383,997 50 $500k-$599k 14 4 3 3,296 $537,707 $537,071 65 $600k-$699k 5 4 3 3,579 $650,600 $639,600 41 $700k-$799k 4 5 3 4,319 $746,250 $745,615 43 $800k-$999k 7 5 4 4,519 $904,643 $906,429 55 $1M-$1.999M 4 5 5 5,193 $1,716,250 $1,666,250 229 $2M-$2.999M 0 $3M-$3.999M 0 $4M-$4.999M 0 $5MandAbove 0
3 4 L I B E R T Y B R A N C H B L V D S O L D I N 9 D A Y S 1 1 0 S P I N C A S T E R D R I V E S O L D I N 1 5 D A Y S 7 B A Y C L I F F C O U R T S O L D I N 4 D A Y S This represents an estimated sale price for this property It is not the same as the opinion of value in an appraisal developed by a licensed appraiser under the Uniform Standards of Professional Appraisal Practice Data Source: Houston Association of REALTORS© Single family homes sold from April 1, 2023 - June 30, 2023. Information is believed to be accurate but is not guaranteed and should be individually verified.
77389 With Pool

PriceRange #of Sold Homes Avg#of Bed Avg#of Bath AvgSqFt AvgList Price AvgSold Price AvgDays onMarket $100k-$299k 0 $300k-$499k 12 4 2 2,748 $424,175 $418,375 47 $500k-$599k 7 4 3 3,074 $549,700 $553,143 7 $600k-$699k 4 4 3 3,722 $638,750 $634,375 63 $700k-$799k 3 4 3 3,860 $741,633 $739,167 9 $800k-$999k 12 4 3 3,936 $881,417 $890,304 11 $1M-$1.999M 15 5 4 4,992 $1,356,260 $1,345,933 55 $2M-$2.999M 0 $3M-$3.999M 0 $4M-$4.999M 0 $5MandAbove 1 6 7 9,360 $5,450,000 $5,000,000 46
2 P A L O M A B E N D P L A C E S O L D I N 1 6 D A Y S 2 6 S P R I N G B A S K E T T R A I L S O L D I N 8 D A Y S 2 2 7 S F A Z I O C O U R T S O L D I N 1 8 D A Y S This represents an estimated sale price for this property It is not the same as the opinion of value in an appraisal developed by a licensed appraiser under the Uniform Standards of Professional Appraisal Practice Data Source: Houston Association of REALTORS© Single family homes sold from April 1, 2023 - June 30, 2023. Information is believed to be accurate but is not guaranteed and should be individually verified.


S E D E R @ M I K E S E D E R . C O M M I K E S E D E R . C O M 2 8 1 - 6 0 2 - 8 8 2 3