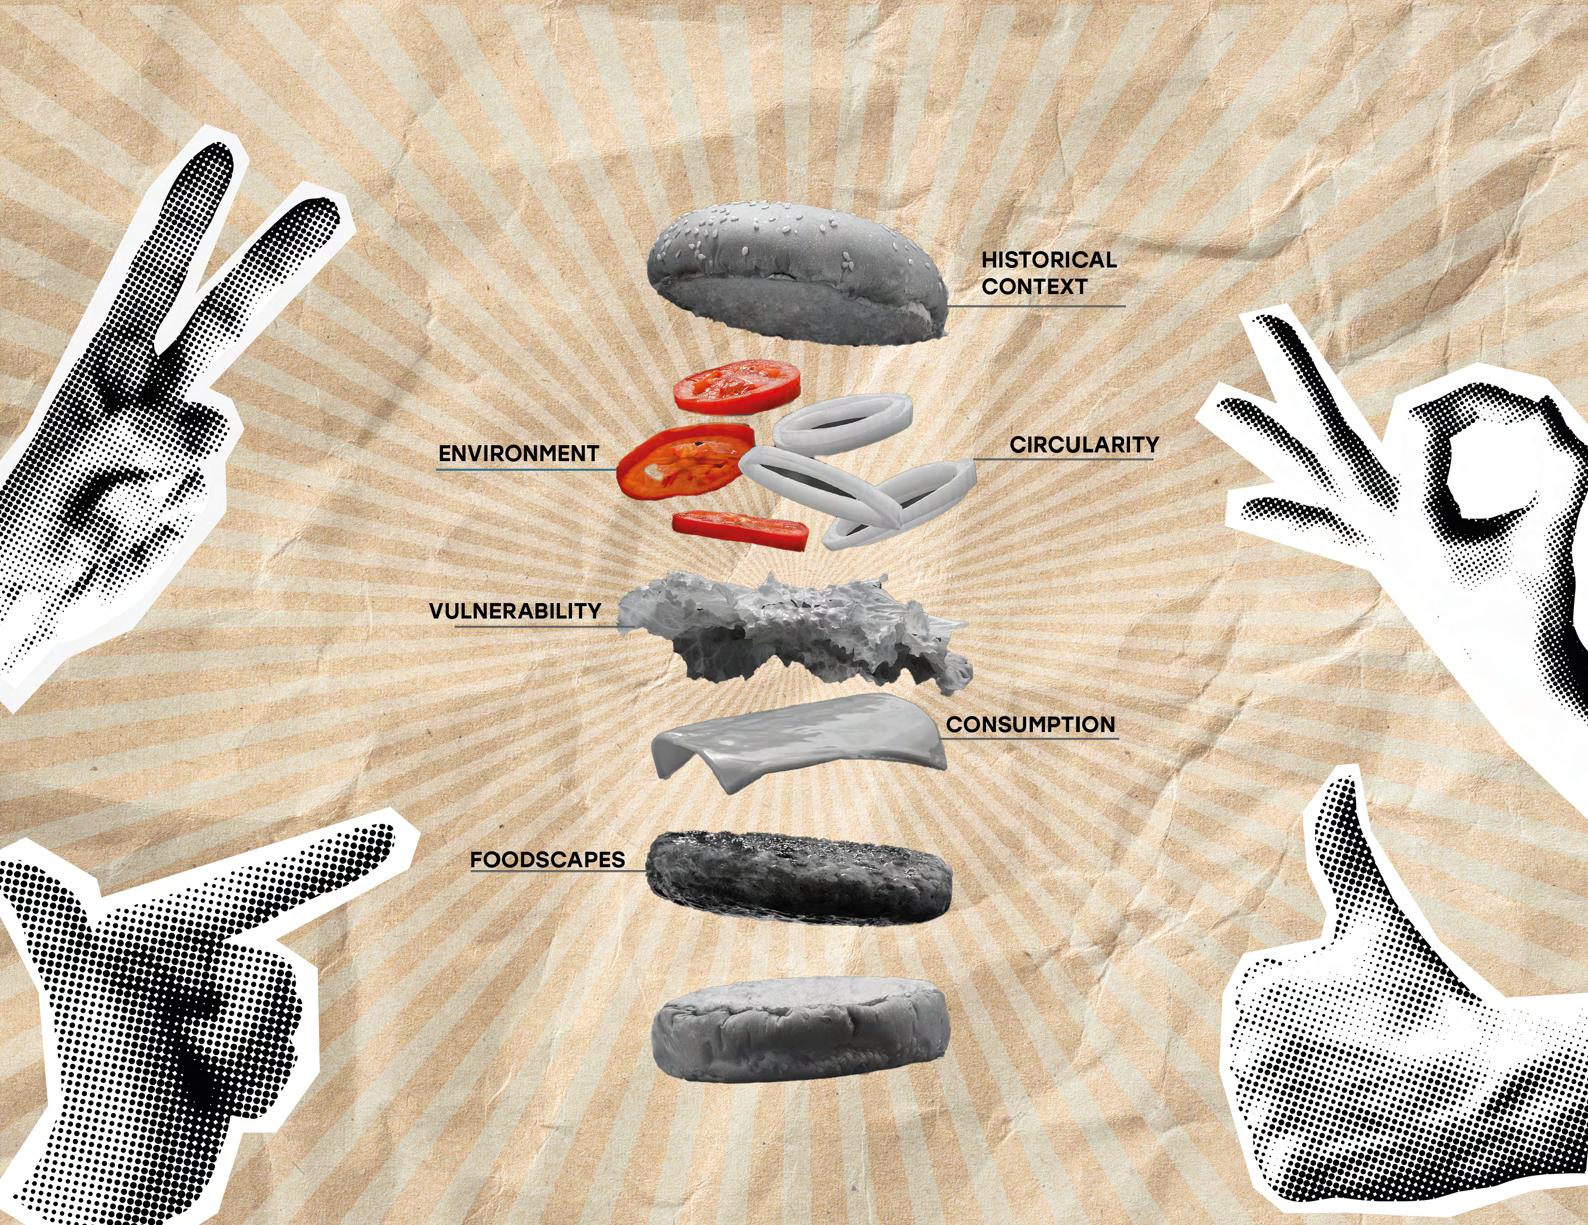
The way we produce, distribute, and consume food has evolved dramatically over time, shaped by technological advancements, cultural shifts, and economic transformations. This chapter explores the historical milestones that have defined our modern food systems, from ancient agricultural practices to the industrialization of food production. We will examine key moments such as the Green Revolution, the rise of global food supply chains, and the transition from local markets to multinational food empires. Understanding this historical progression provides insight into how past innovations and challenges have shaped the present, offering valuable lessons for the future of food sustainability and security.
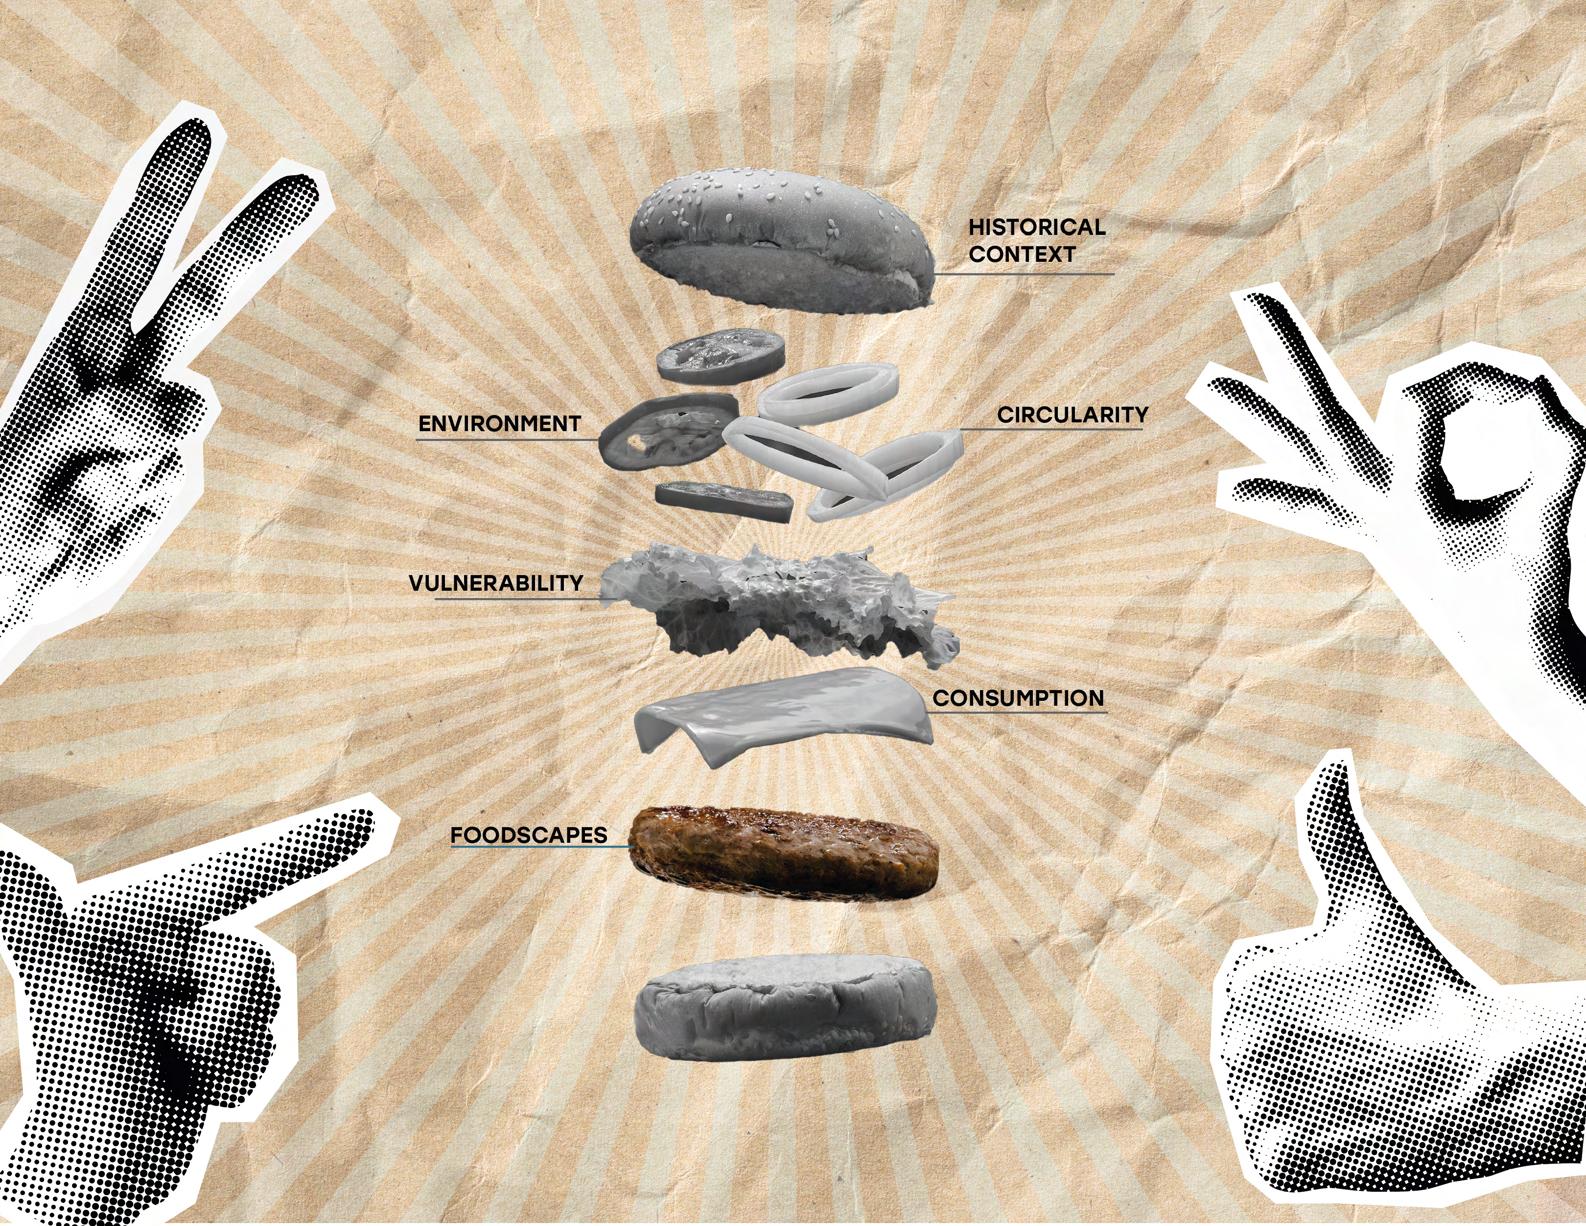
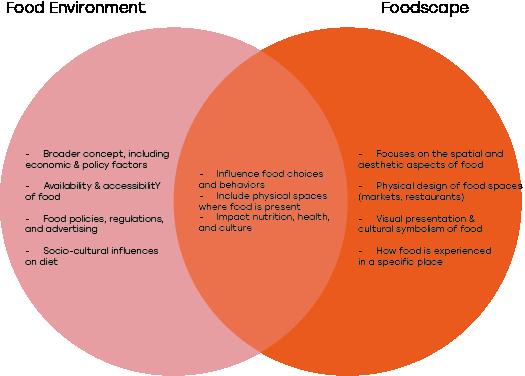
This section explores the socioeconomic impact of food, examining how accessibility, affordability, and industry practices affect communities. Additionally, we analyze the health and environmental consequences of food production and consumption, from nutritional disparities to sustainability challenges. To illustrate successful approaches, we present case studies of innovative foodscapes that promote equitable, resilient, and sustainable food systems.
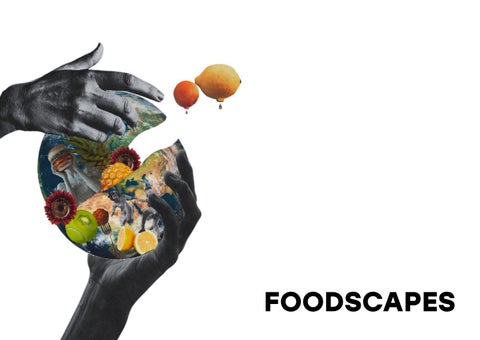
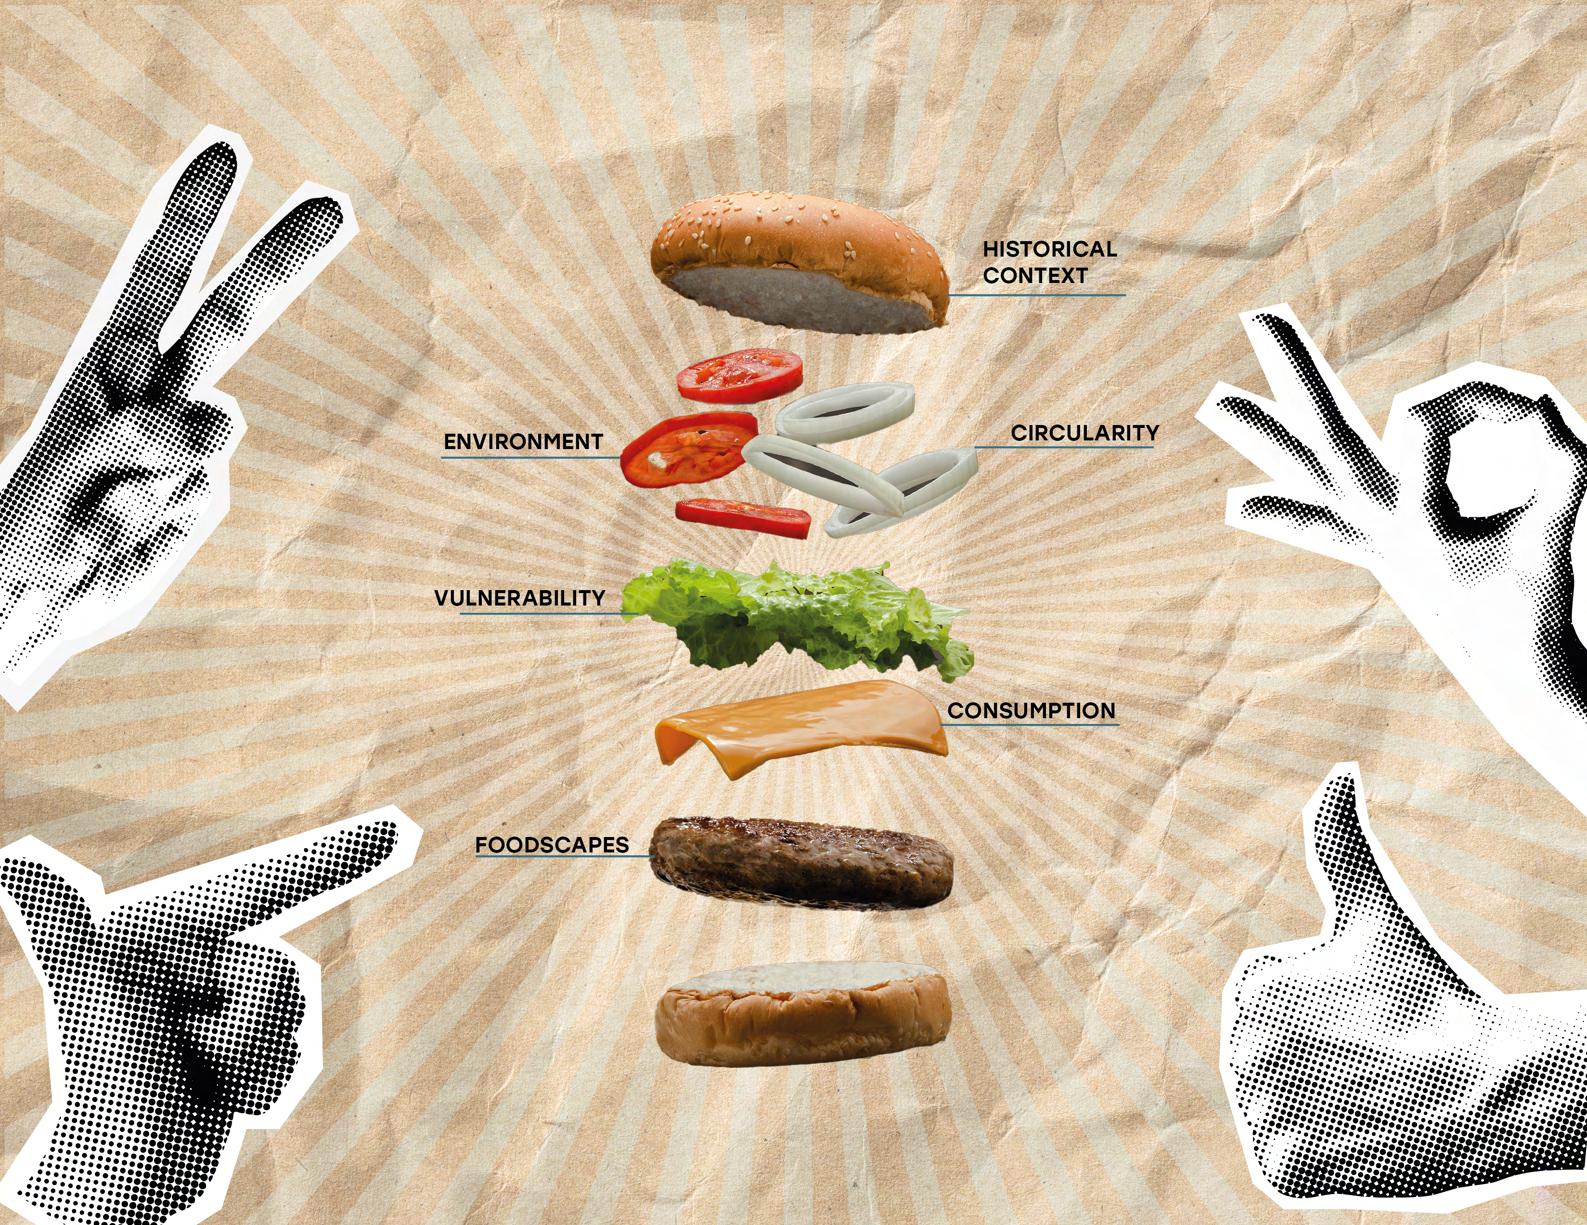
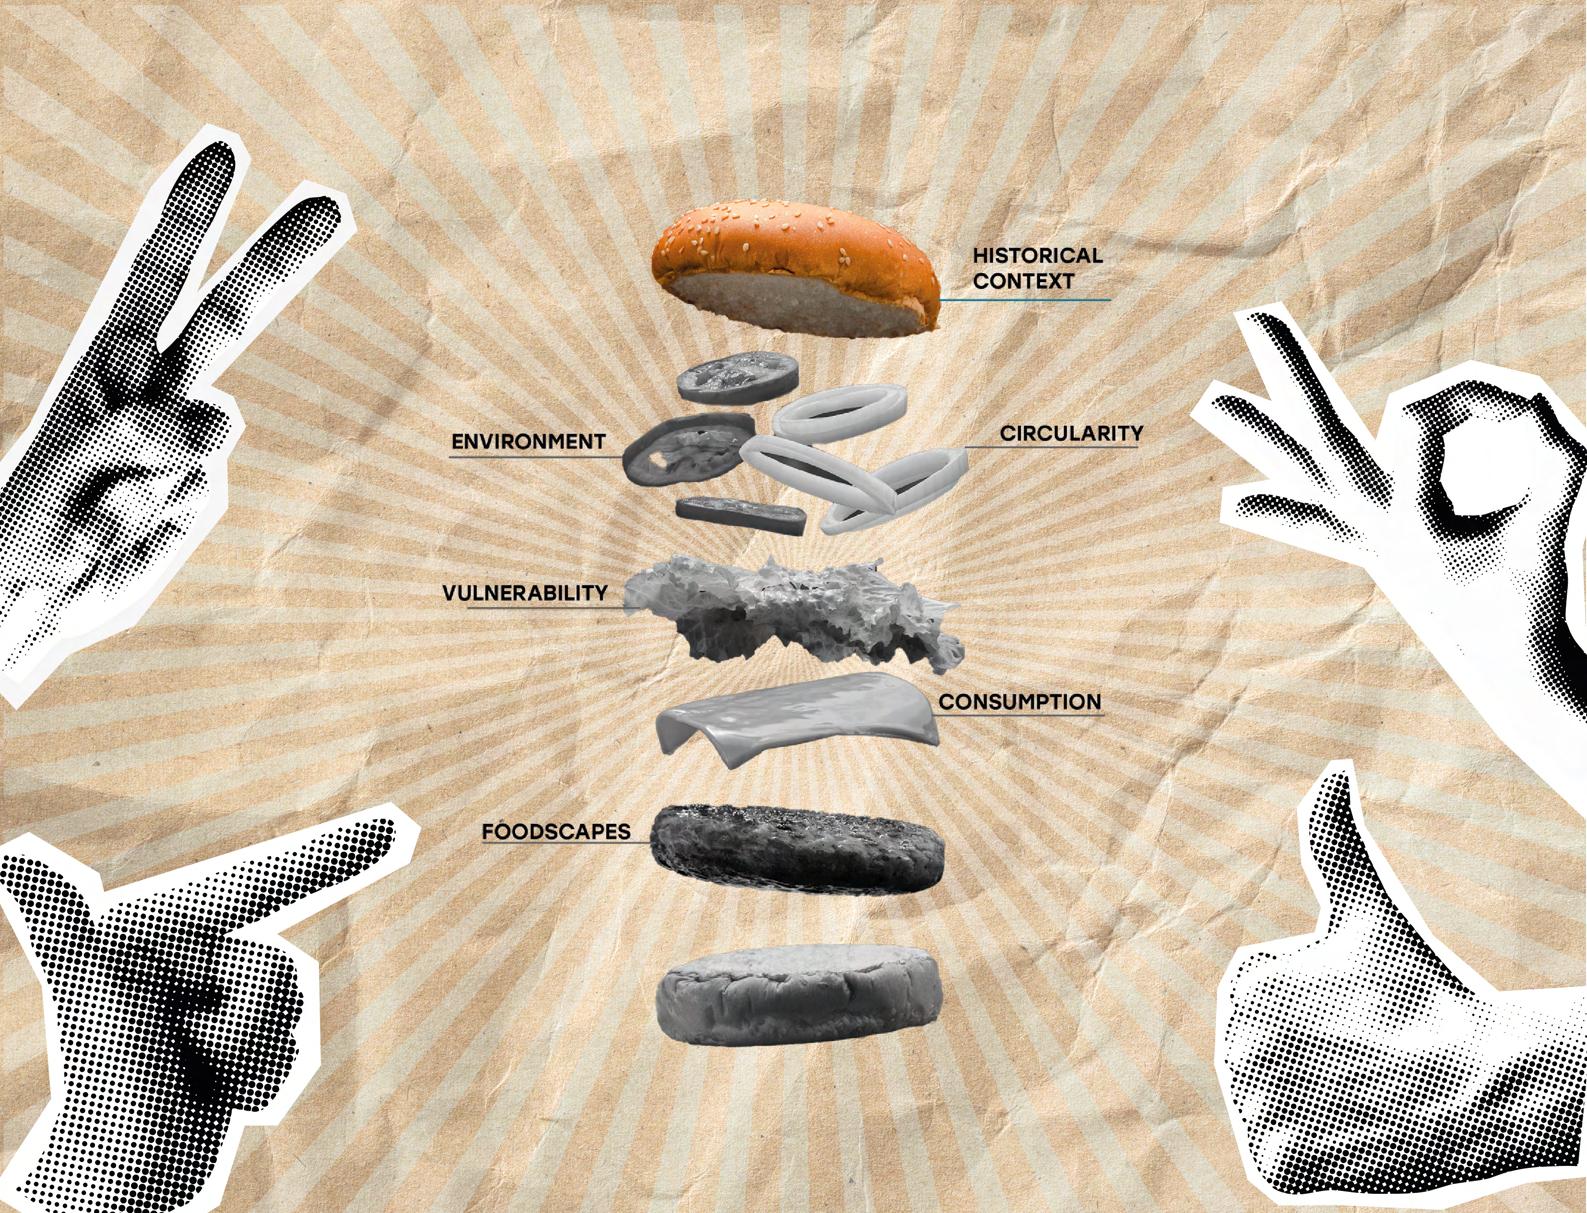
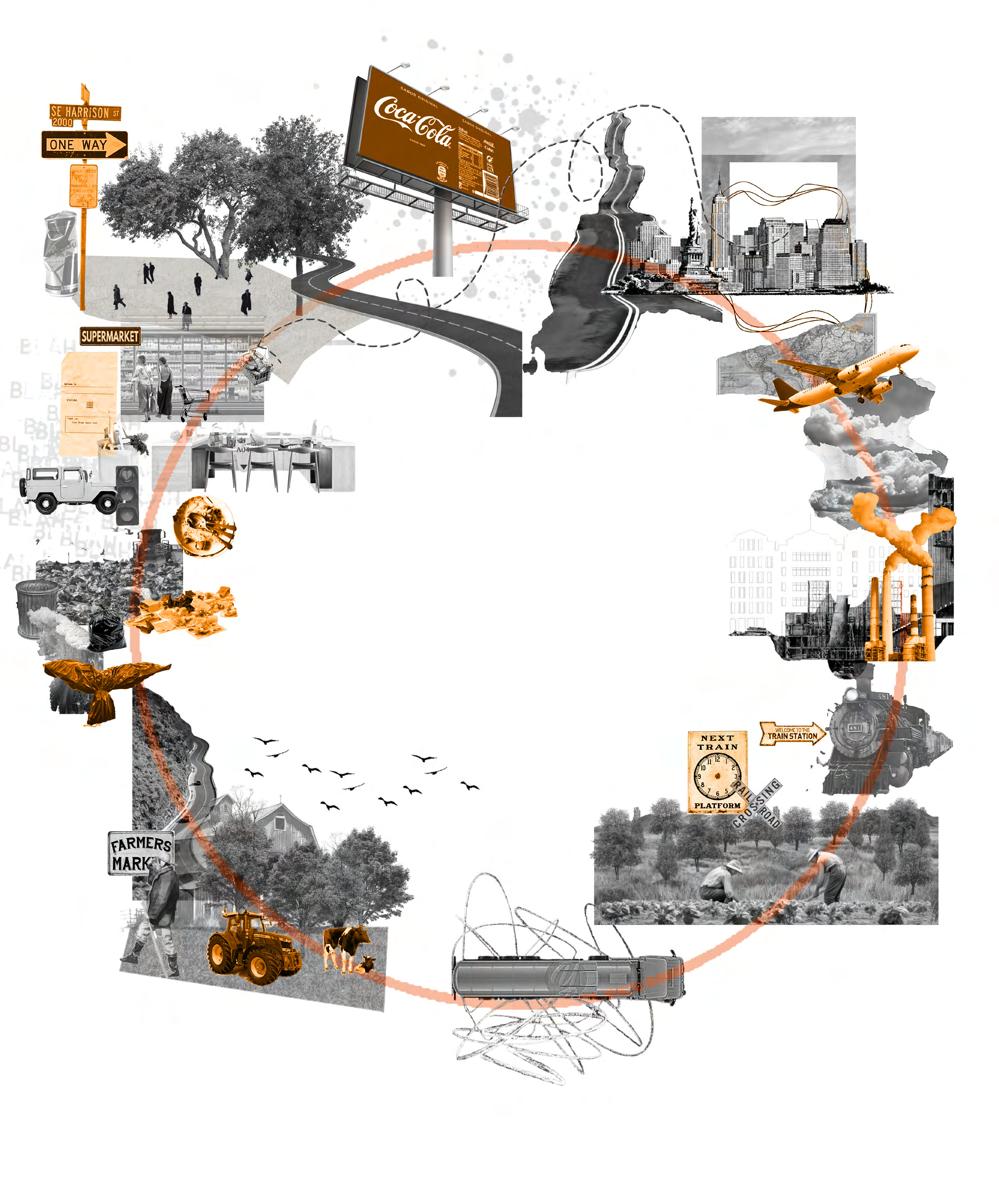
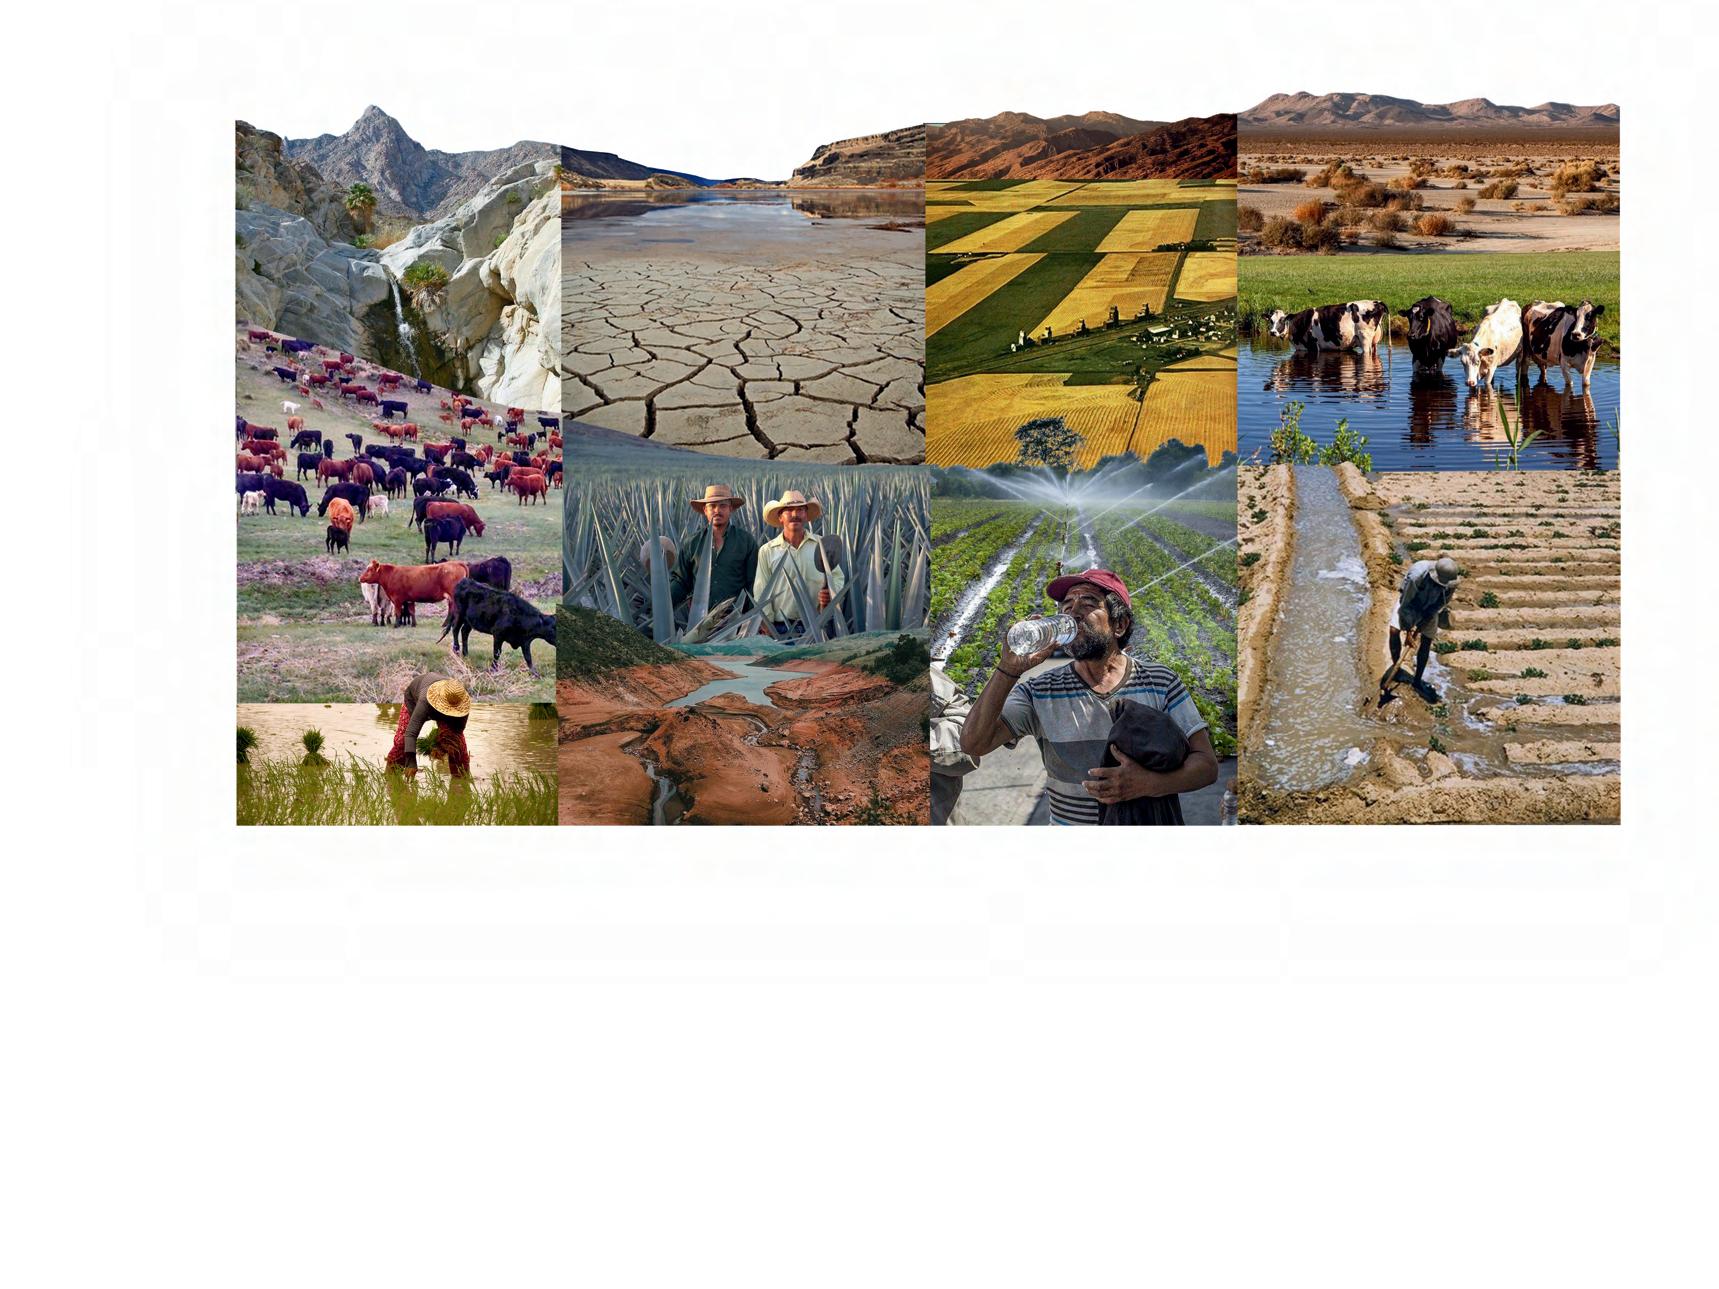
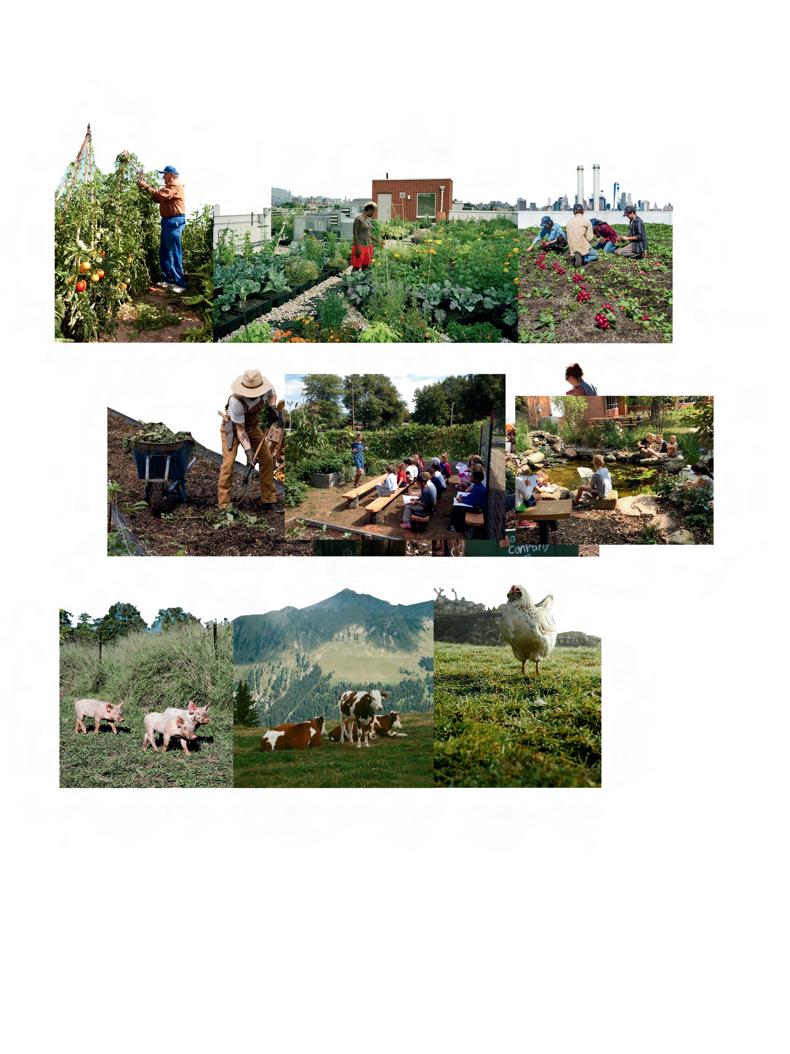
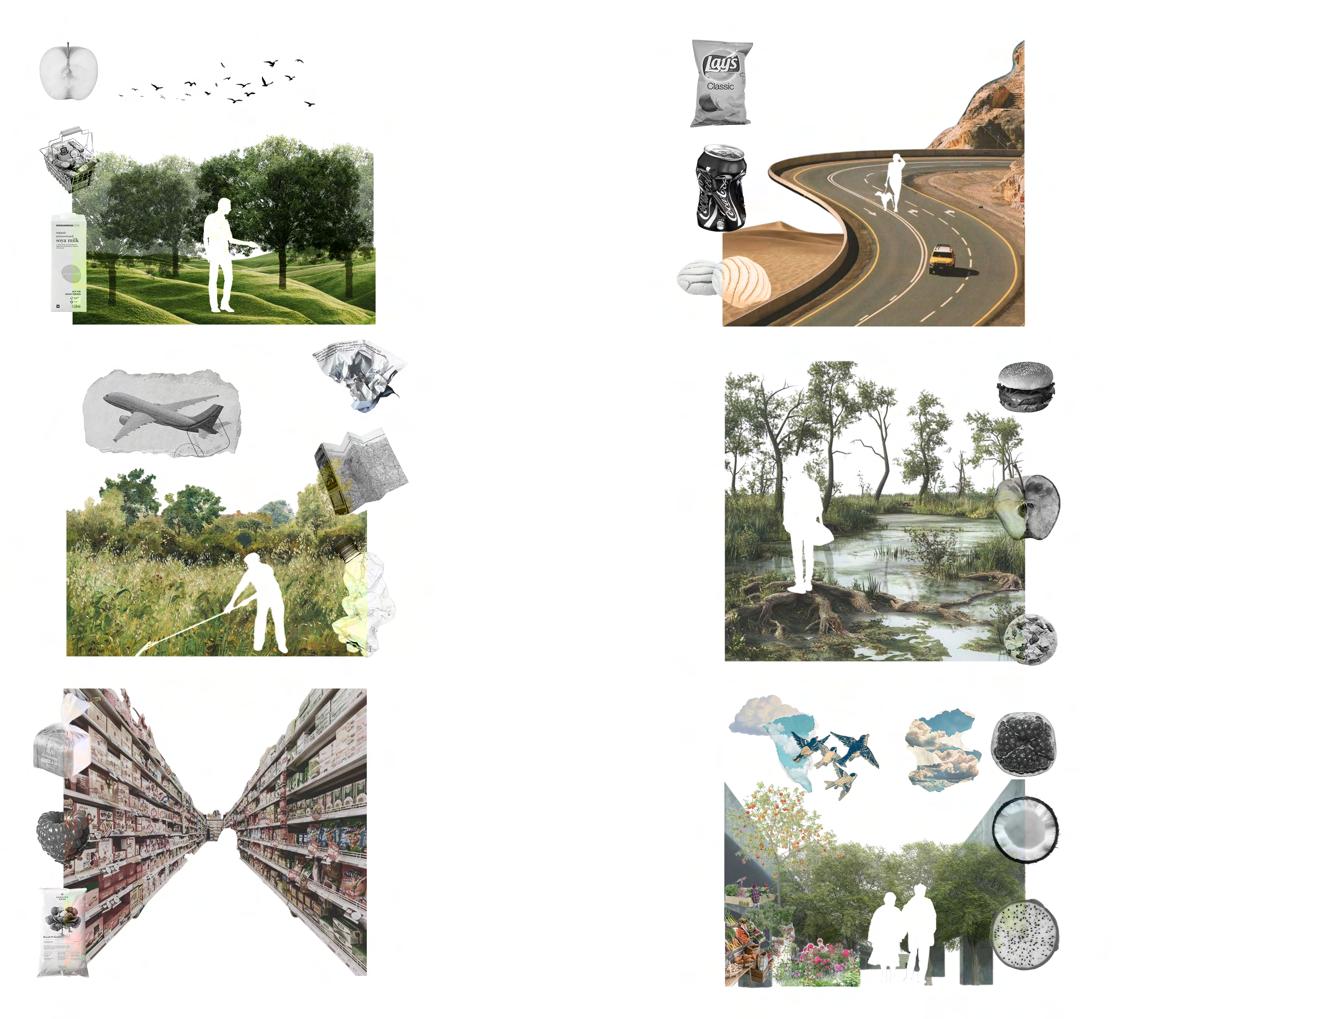
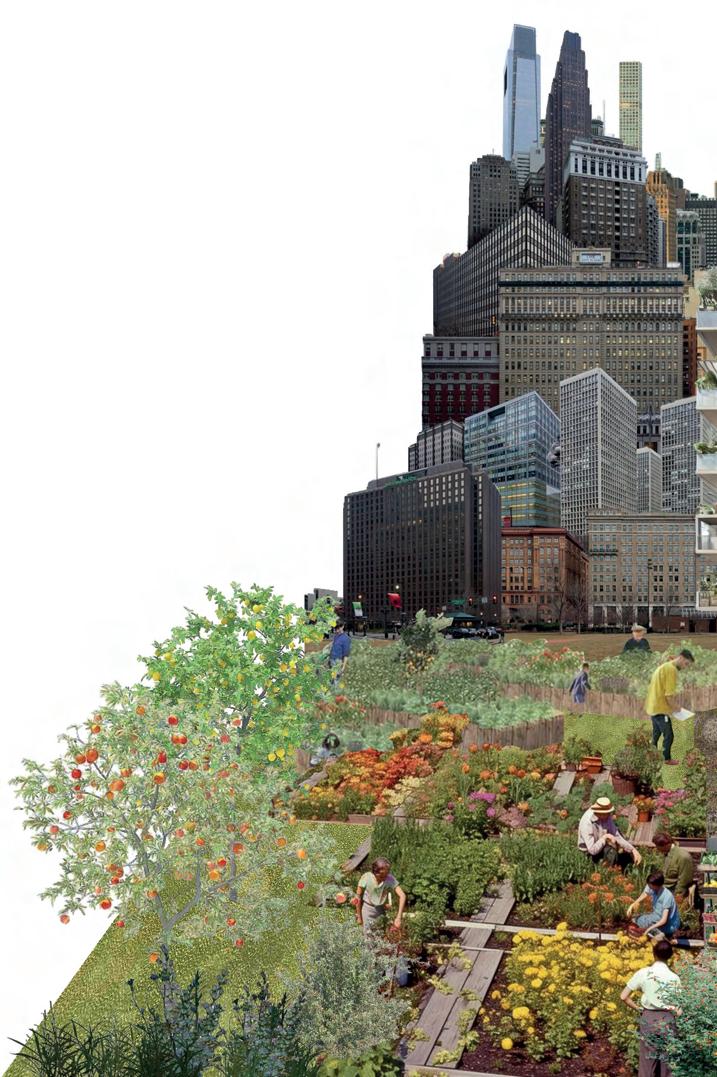
FOODSCAPES
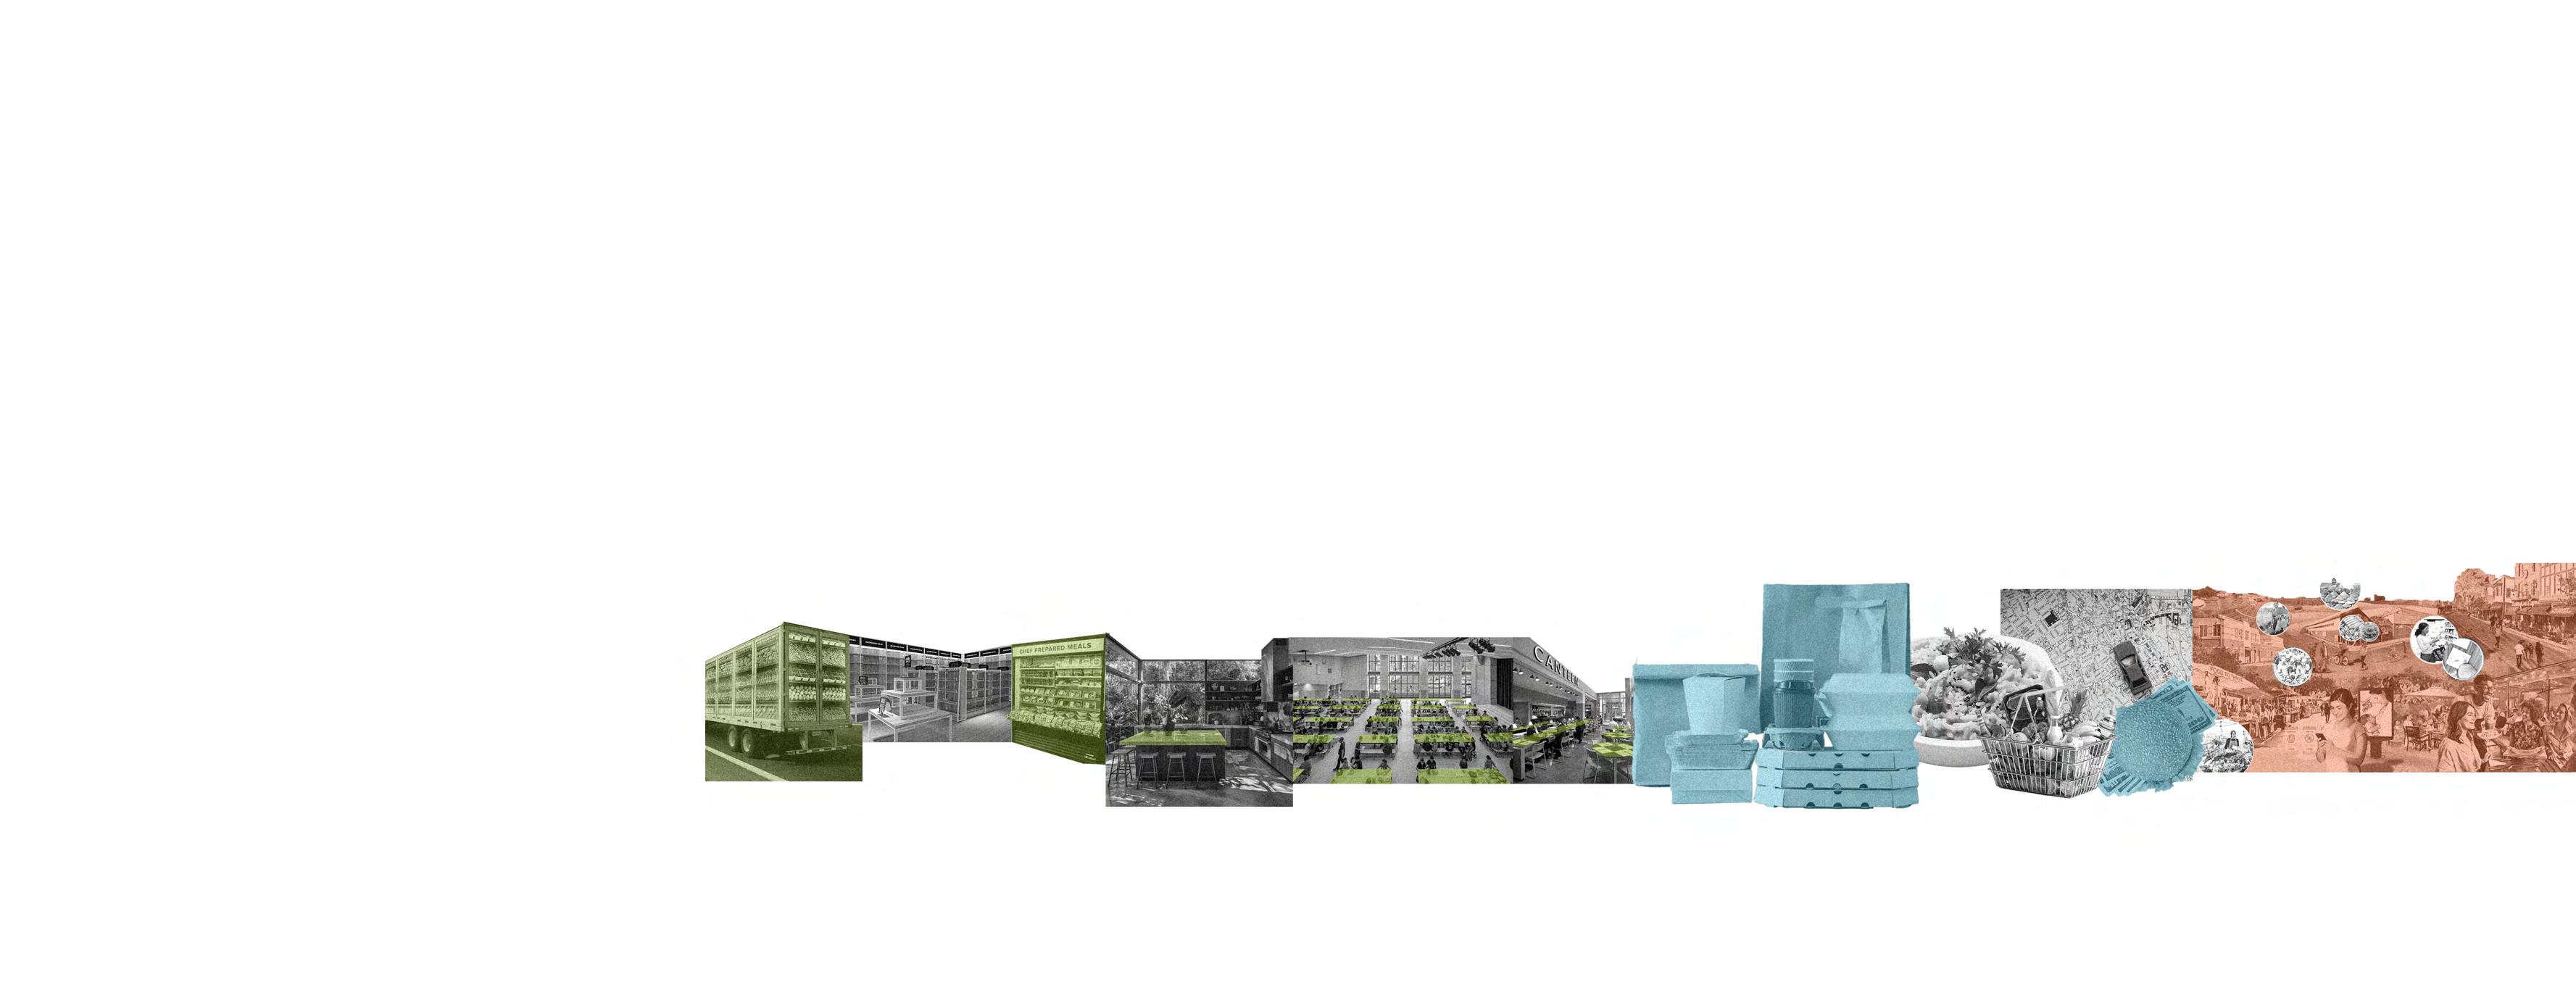
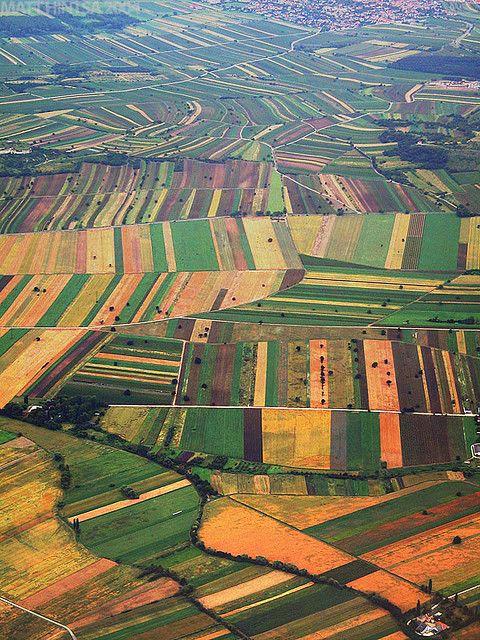
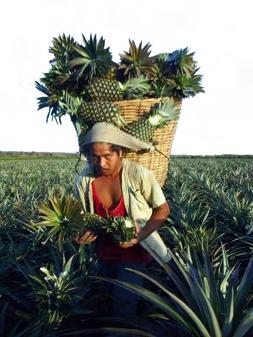
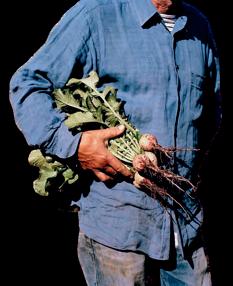
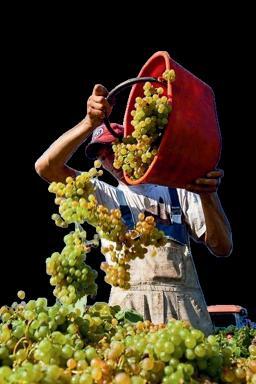
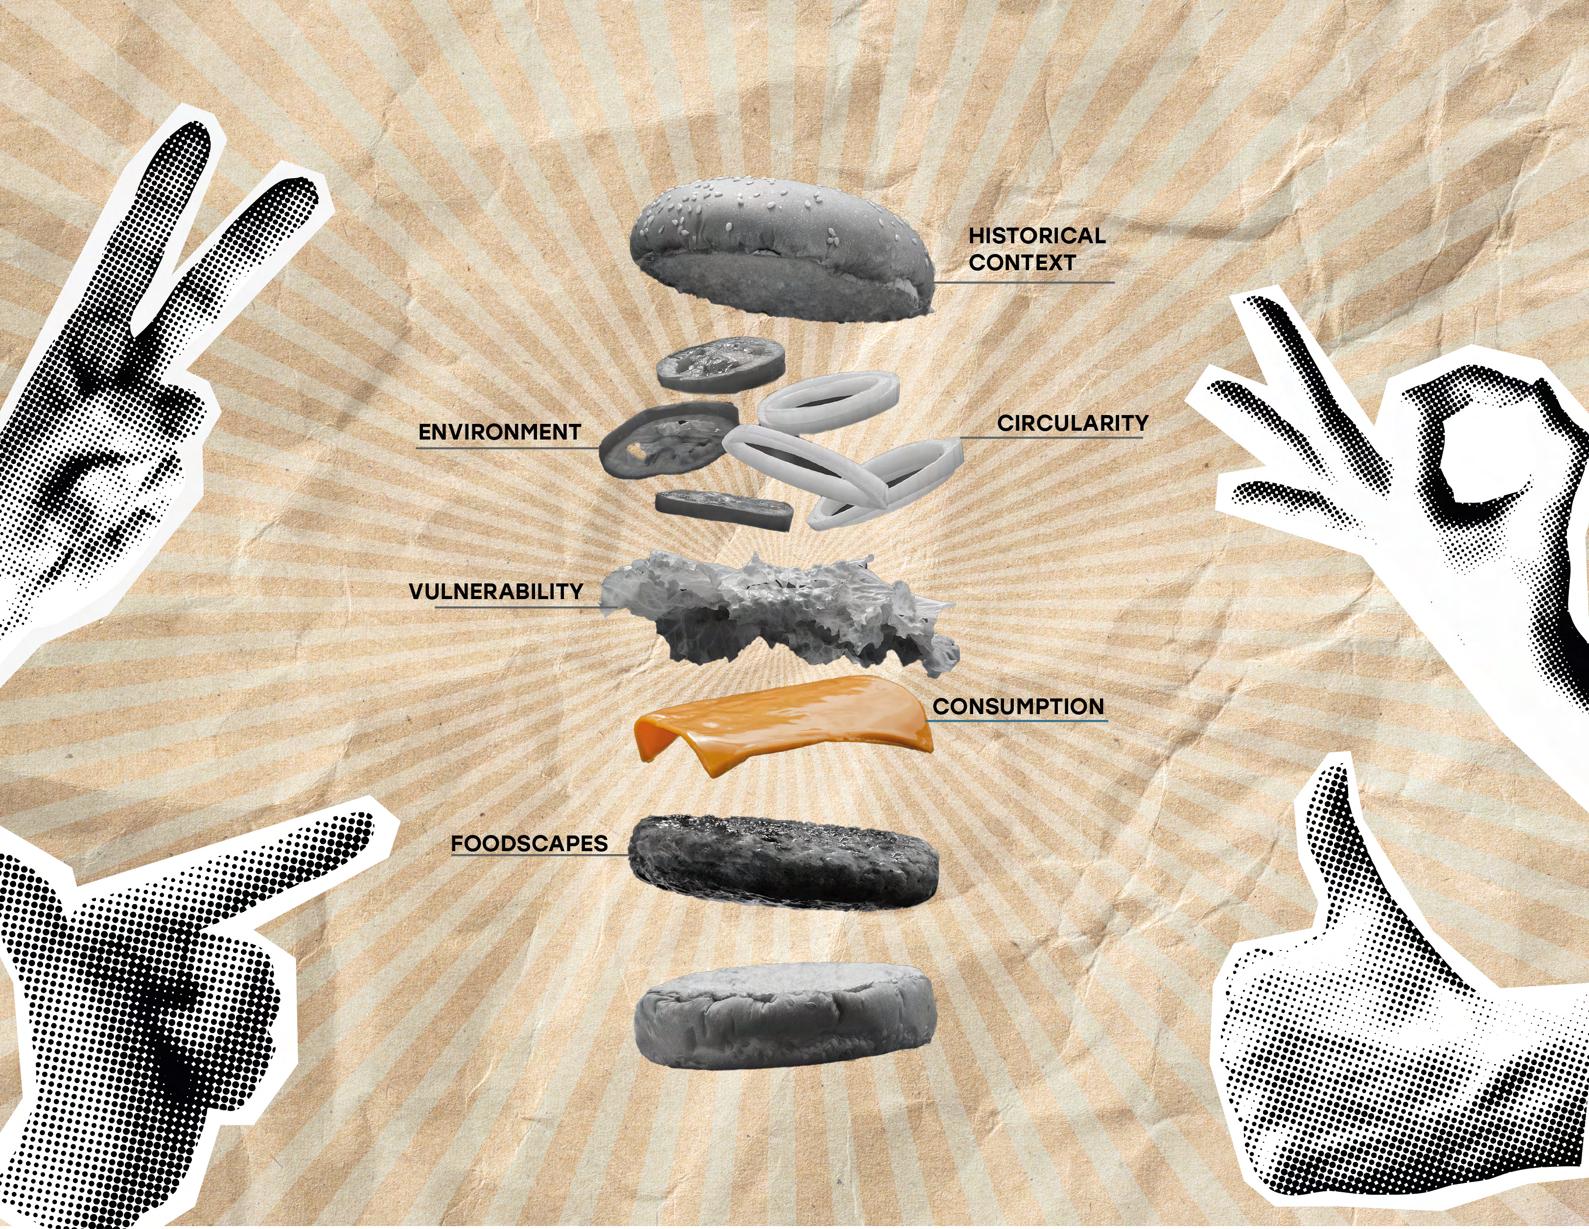
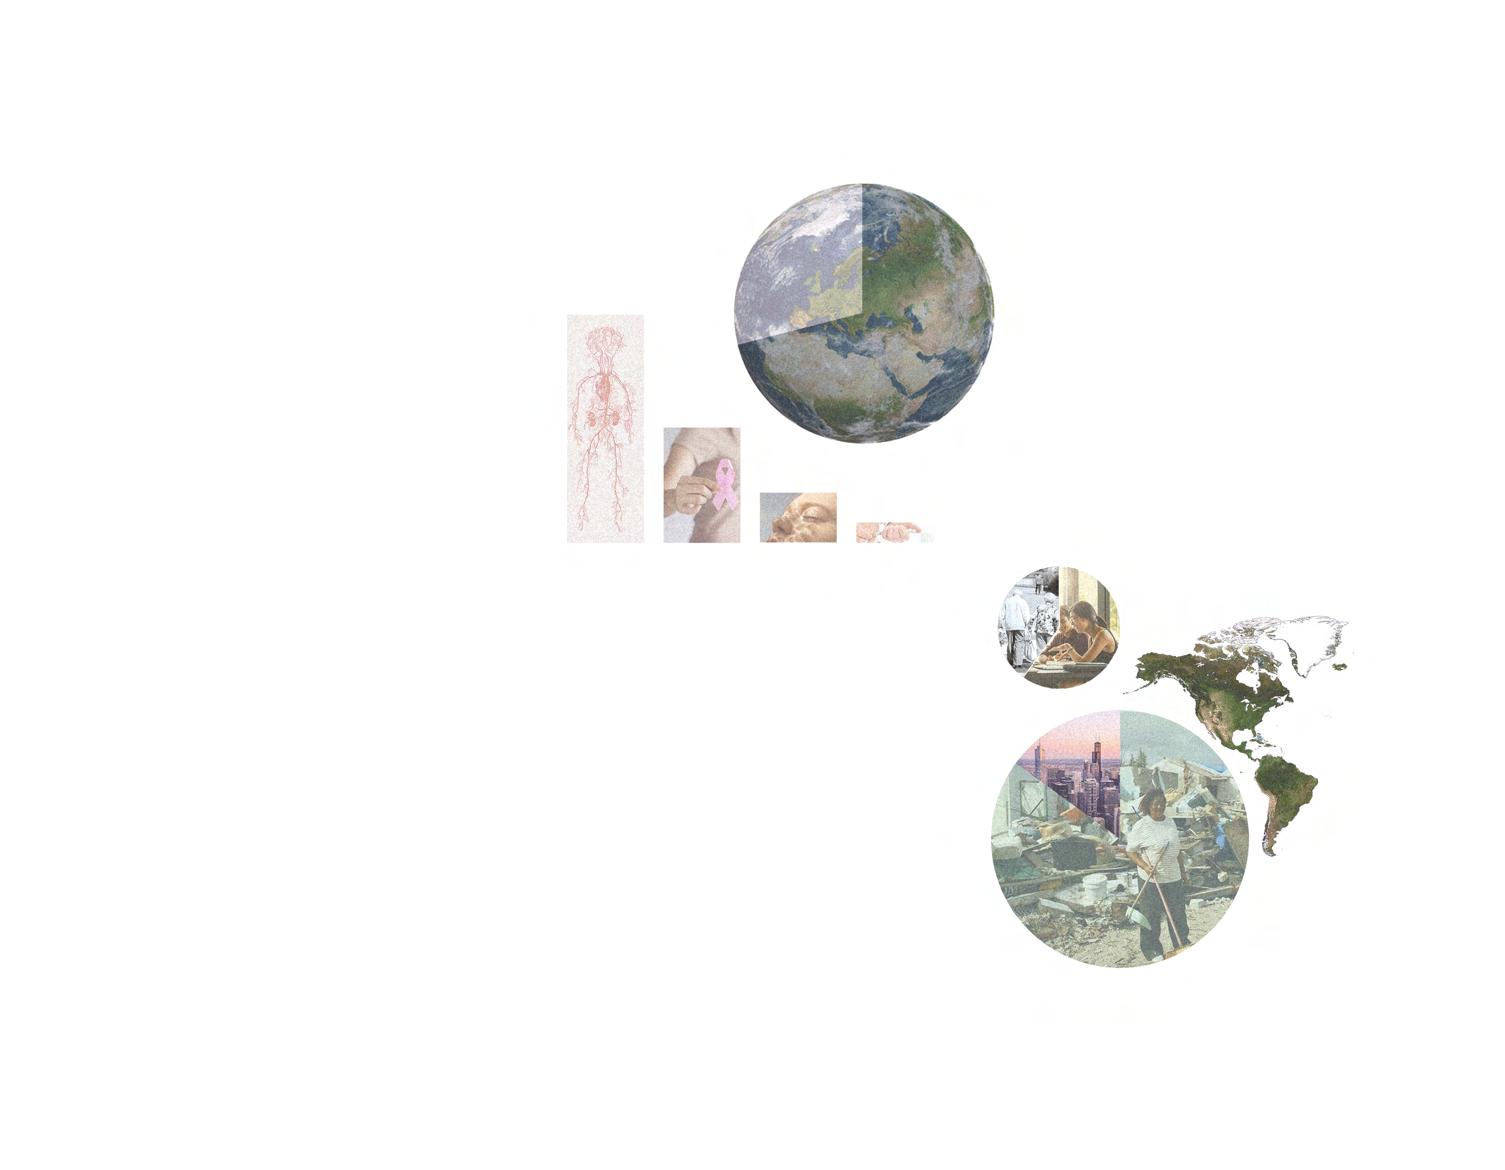
Foodscapes are defined as the spaces and systems where food is produced, distributed, prepared, and consumed. These include farms, markets, restaurants, and waste management facilities. These foodscapes reflect a variety of cultural traditions, social interactions, economic and political influences, such as policies and accessibility. Additionally, foodscapes impact the environment through agriculture, waste, and sustainability efforts. Regardless of scale, foodscapes shape communities’ relationships with food and are crucial for urban planning, sustainability, and public health.
Figure # . Foodscape. Collage by Natalia Vega
“GREEN REVOLUTION”
1. 500,000 B.C. - Hunter-gatherers consumed fruits, roots, vegetables, and game meat. Fire is discovered, revolutionizing food preparation.
2. 9000 B.C. - Domestication of sheep leads to early consumption of dairy products.
3. 8000 B.C. - Development of agriculture and livestock farming, with a diet primarily based on whole grains. First domestication of pigs in China.
4. 4000 B.C. - 1800 B.C. - In Ancient Egypt, agriculture, livestock, hunting, and fishing were practiced. Trade of oil and wine. Discovery of cereal fermentation; the wheel and metals begin to be used to make agriculture and livestock farming more efficient.
5. 1200 B.C. - The pyramid of Chichén Itzá is built.
6. 900 B.C. - 1400 A.D. - Mesoamerican civilizations domesticated chili peppers, avocados, squash, corn, and beans.
7. 776 B.C. - In Ancient Greece, the diet consisted of grains, beef, goat, pork, milk, cheese, and salt.
8. 100 A.D. - The oldest surviving Roman cookbook, *De Re Coquinaria*, is written.
9. 476 A.D. - 1492 (Middle Ages) - Food consumption was divided between kings, aristocrats, and nobles, and that of peasants, with a significant difference in quality and availability.
10. 765 A.D. - The first restaurant is established in Paris, changing the gastronomic experience.
11. 1492 - Christopher Columbus' voyages introduce foods like tomatoes, potatoes, and cacao to Europe.
12. 1519 A.D.- Hernán Cortés’ expedition arrives in Veracruz, Mexico.
13. 1521 A.D. - The Spanish conquest introduces wheat, rice, chickpeas, pork, sheep, chickens, eggs, wine, distilled spirits, milk, and dairy products to Mexico.
14. 1650 - The first café in Europe (Oxford) opens, marking the beginning of coffee culture.
15. 19th Century - Agricultural revolution with new technologies and food preservation methods.
16. 1800 A.D. - French influence introduces sweet bread and chocolate to the Mexican diet, alongside the Trigarante Army.
17. 1810 - Nicolas Appert invents canning, revolutionizing food preservation.
18. 1821 A.D. - The story of *Chiles en Nogada* becomes popular during Mexico’s nationhood.
19. 1893 - The first hamburger is sold at the Chicago World's Fair.
22. 1920 - 1921 - Álvaro Obregón decrees the creation of the SEP (Secretary of Public Education), influencing milk and sugar consumption in Mexico.
23. 1921 - The ketogenic (keto) diet is developed as a treatment for epilepsy.
24. 1929 - Coca-Cola arrives in Mexico City through the Mundet bottling company and in Guadalajara via La Favorita.
25. 1940 - The first drive-thru opens, allowing food purchases without leaving the car.
26. 1949 - The first McDonald’s restaurant opens in San Bernardino, California.
27. 1960 - Processed foods like instant noodles and frozen meals become household staples.
28. 1978 - The first OXXO store opens in Monterrey, Nuevo León.
29. 1980 - The *Slow Food* movement is born in Italy. Increase in processed food consumption and decline in fresh food intake.
30. 1980 - 1982 - Peso devaluation and advancement of food industrialization in Mexico.
31. 1980 - 1990 - Rise of the fitness industry in Mexico.
32. 1982 - Development of genetically modified crops, transforming food production.
33. 1985 - The first McDonald's in Mexico opens in Mexico City.
34. 20th Century- Mass food production and distribution in Western countries, leading to increased obesity.
35. 1988 - 1994 - Presidency of Carlos Salinas de Gortari: globalization of food through the signing of the North American Free Trade Agreement (NAFTA).
36. 1998 - Rise of *light* (low-calorie) products.
37. 2000 - 2006 - Vicente Fox increases taxes on food and medicine.
38. 2002 - Starbucks arrives in Mexico, operated by Alsea (company behind Domino’s, Burger King, Vips, among others).
39. 2006 - 2012 - Felipe Calderón implements a plan to combat the food crisis and poverty.
40. 2011 - Lab-grown meat is created for the first time.
41. 2012 - Enrique Peña Nieto announces the *National Crusade Against Hunger*. The Sustainable Development Goals (SDGs) are introduced.
42. 2013 - The first synthetic hamburger is presented.
43. 2014 - 2015 - Food delivery platforms such as Uber Eats and Rappi emerge.
44. 2015- Rise in popularity of plant-based meat substitutes.
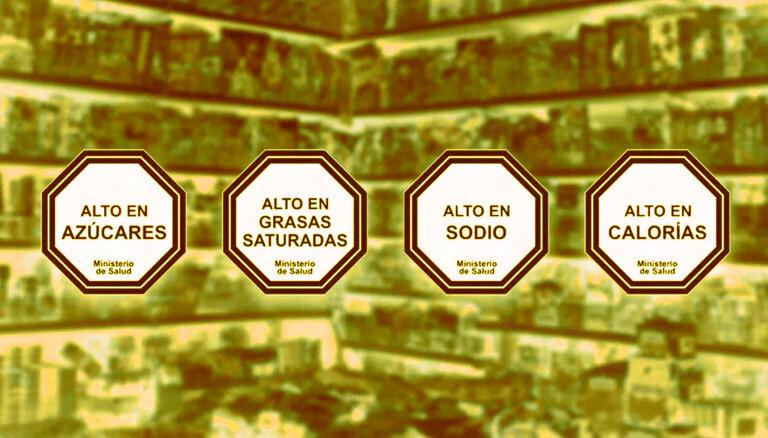
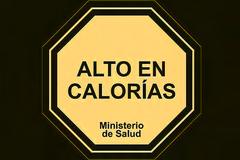
45. 2019 - 2023 - The COVID-19 pandemic drives the consumption of fresh and home-cooked foods. A new food labeling system is implemented in Mexico.
46. 2020- Alternative proteins, such as insect-based foods and lab-grown meat, become a trend.
HOW IT WORKS
1. High-Yield Varieties (HYVs) – Specially bred crops that produce more grains per plant.
2. Chemical Fertilizers & Pesticides – Boost soil nutrients and protect against pests.
3. Irrigation Techniques – Advanced irrigation systems ensure crops get sufficient water.
4. Mechanization – Use of tractors, harvesters, and other machines increased efficiency.
5. Multiple Cropping – Growing more than one crop per year on the same land.
POSITIVE IMPACT
1. Increased Food Production – Global agricultural output surged, preventing widespread famines.
2. Economic Growth – Many farmers, especially in countries like India and Mexico, experienced increased income.
3. Population Growth Support – Higher food production helped sustain a rapidly growing population.
4. Higher Crop Yields – Crops like wheat and rice saw significant yield increases.
5. Food Security – Reduced hunger and malnutrition in many developing nations.
6. Technological Advancements – Introduced modern farming tools, irrigation systems, and genetically improved seeds.
7. Economic Development – Strengthened agricultural economies, leading to rural job creation.
NEGATIVE IMPACT
1. Social Inequality – Large landowners benefited more than small farmers, widening economic disparities.
2. Soil Degradation – Overuse of chemical fertilizers reduced soil fertility.
3. Water Crisis – Excessive irrigation led to groundwater depletion.
4. Loss of Biodiversity – Farmers abandoned traditional crops in favor of high-yield varieties.
5. Health Issues – Chemical pesticides and fertilizers have caused health problems in farmers.
THE GREEN REVOLUTION TRANSFORMED GLOBAL AGRICULTURE, CHANGING HOW FOOD IS GROWN, DISTRIBUTED, AND CONSUMED. IT INTRODUCED NEW TECHNOLOGIES AND FARMING METHODS THAT RESHAPED ECONOMIES, SOCIETIES, AND THE ENVIRONMENT.
Figure # .Green Revolution . Collage by Ivanna de la Torre
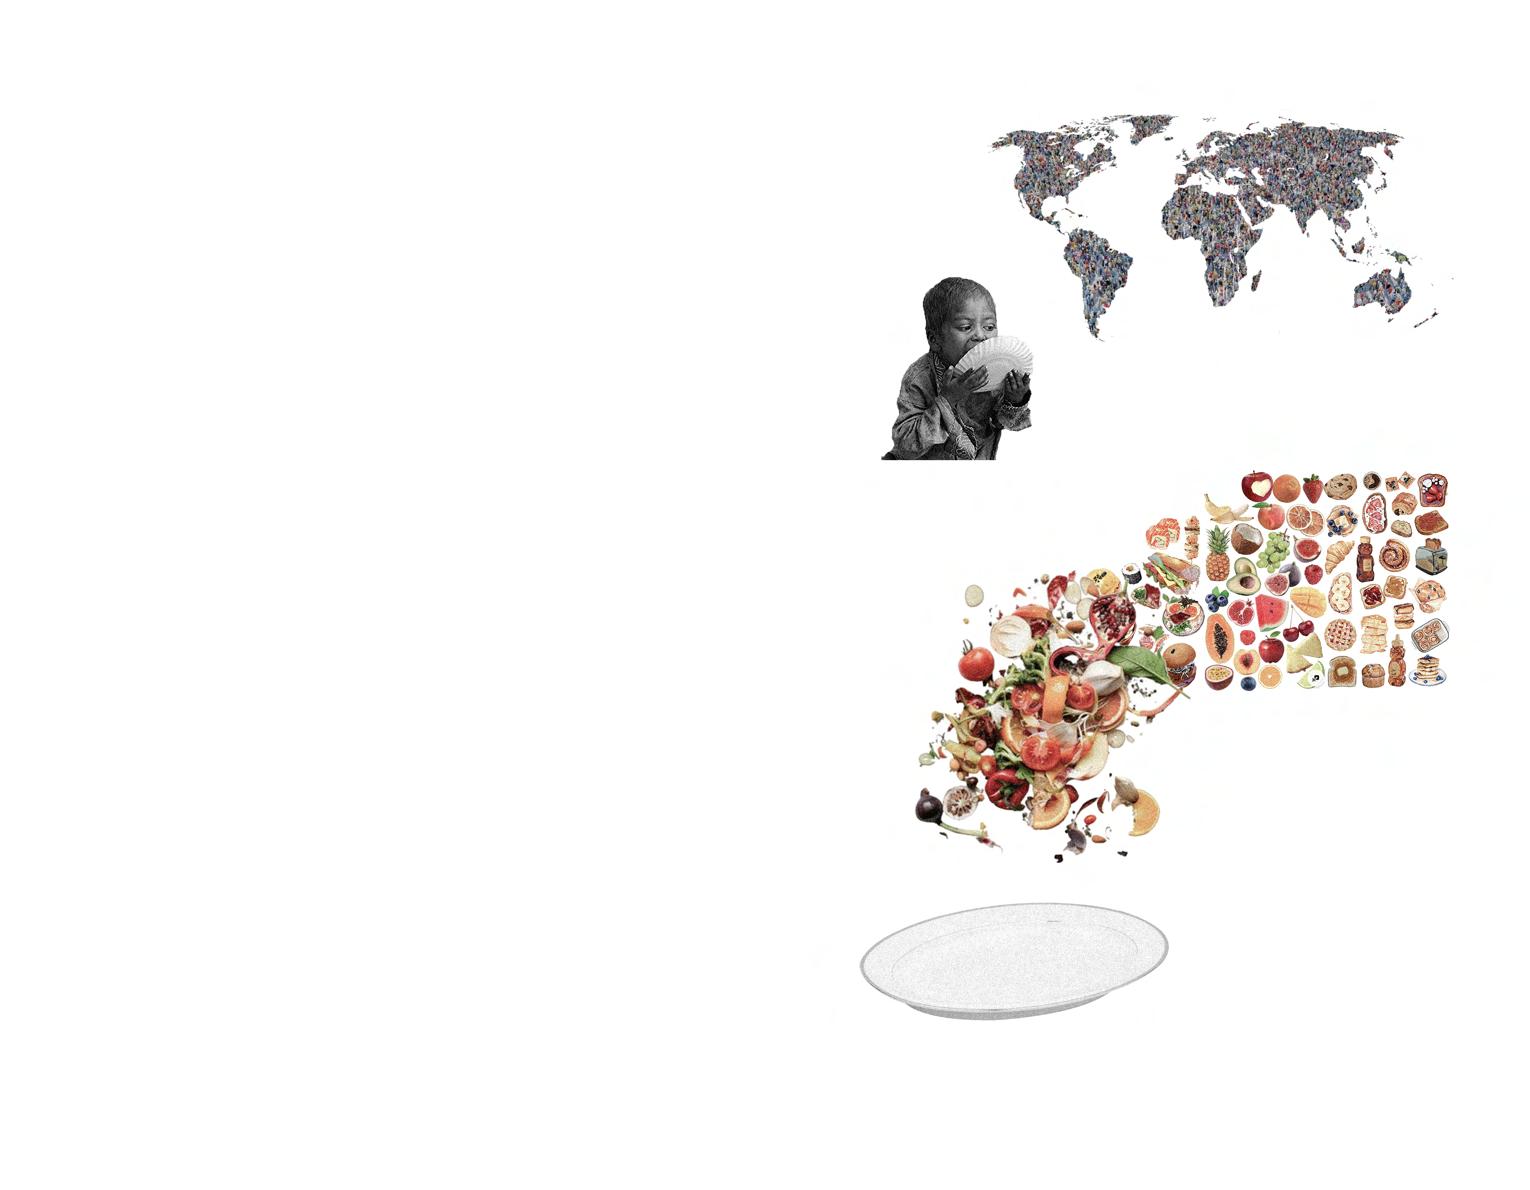
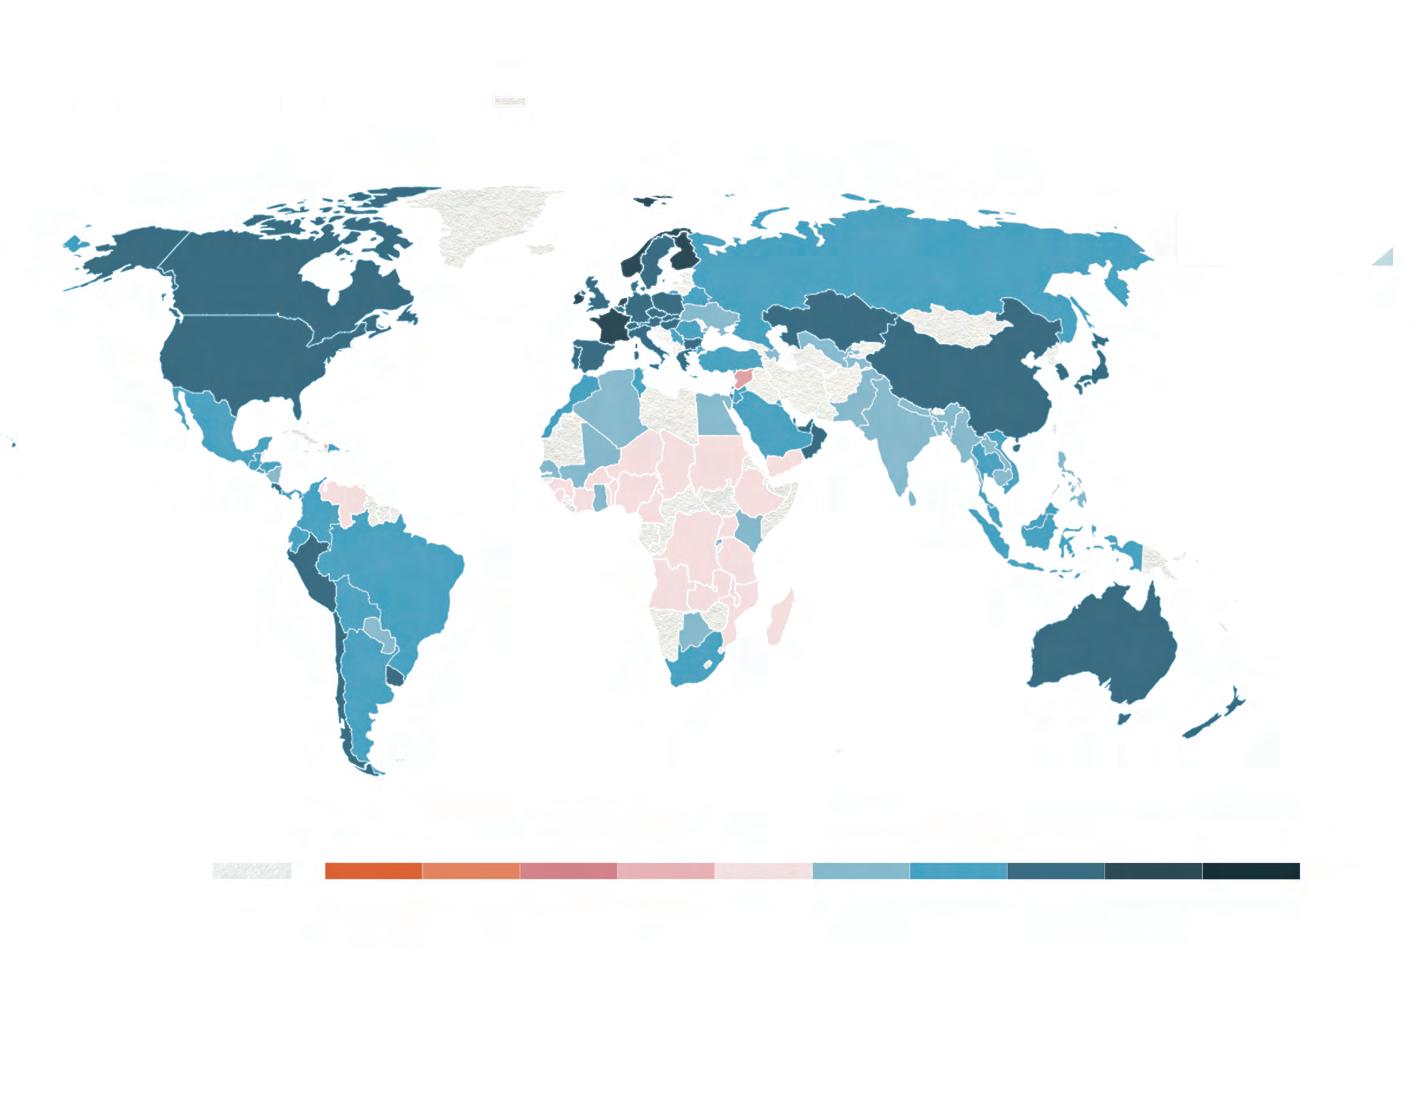
WORLD POPULATION (2023)
8.062 billion
30 MILLION CHILDREN grow up poor in the richest countries in the world
127 MILLION TONS OF PRODUCED FOOD
Food for 36 million people
1/3 OF FOOD IS WASTED
780 million people are hungry worldwide
while 34.3 million remain hungry.
The world’s population surpassing 8 billion and heading toward 9.7 billion by 2050 is intensifying pressure on food, water, and resources. Despite producing enough food for 10 billion, 780 million still face hunger due to unequal distribution, waste, and economic barriers. Conflicts, inefficient agriculture, and environmental damage exacerbate the issue, with one-third of food wasted. Without urgent reforms, 2 billion could suffer from hunger by 2050.
The food system, while supporting 1 billion jobs and contributing 10% to GDP, is a major driver of climate change, deforestation, and biodiversity loss, accounting for 35% of emissions and 70% of water use. As arable land diminishes and farmers struggle, sustainable solutions such as improving agricultural efficiency, reducing waste, and implementing fair food policies are critical to feeding the growing population without further harming the planet.
Figure # World Today. Collage by Valentina Bottle
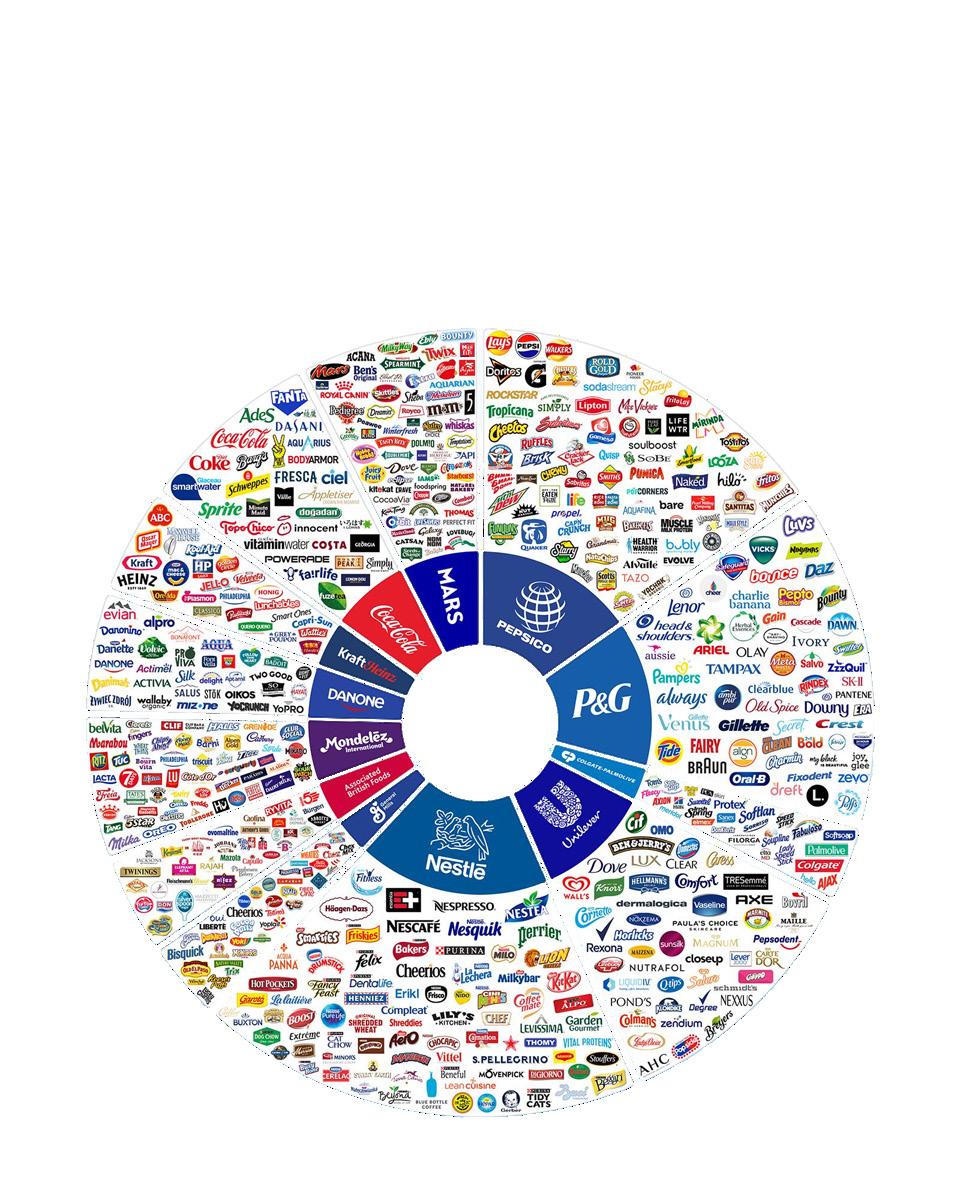
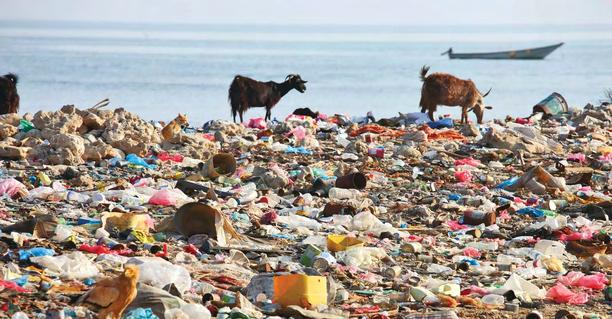
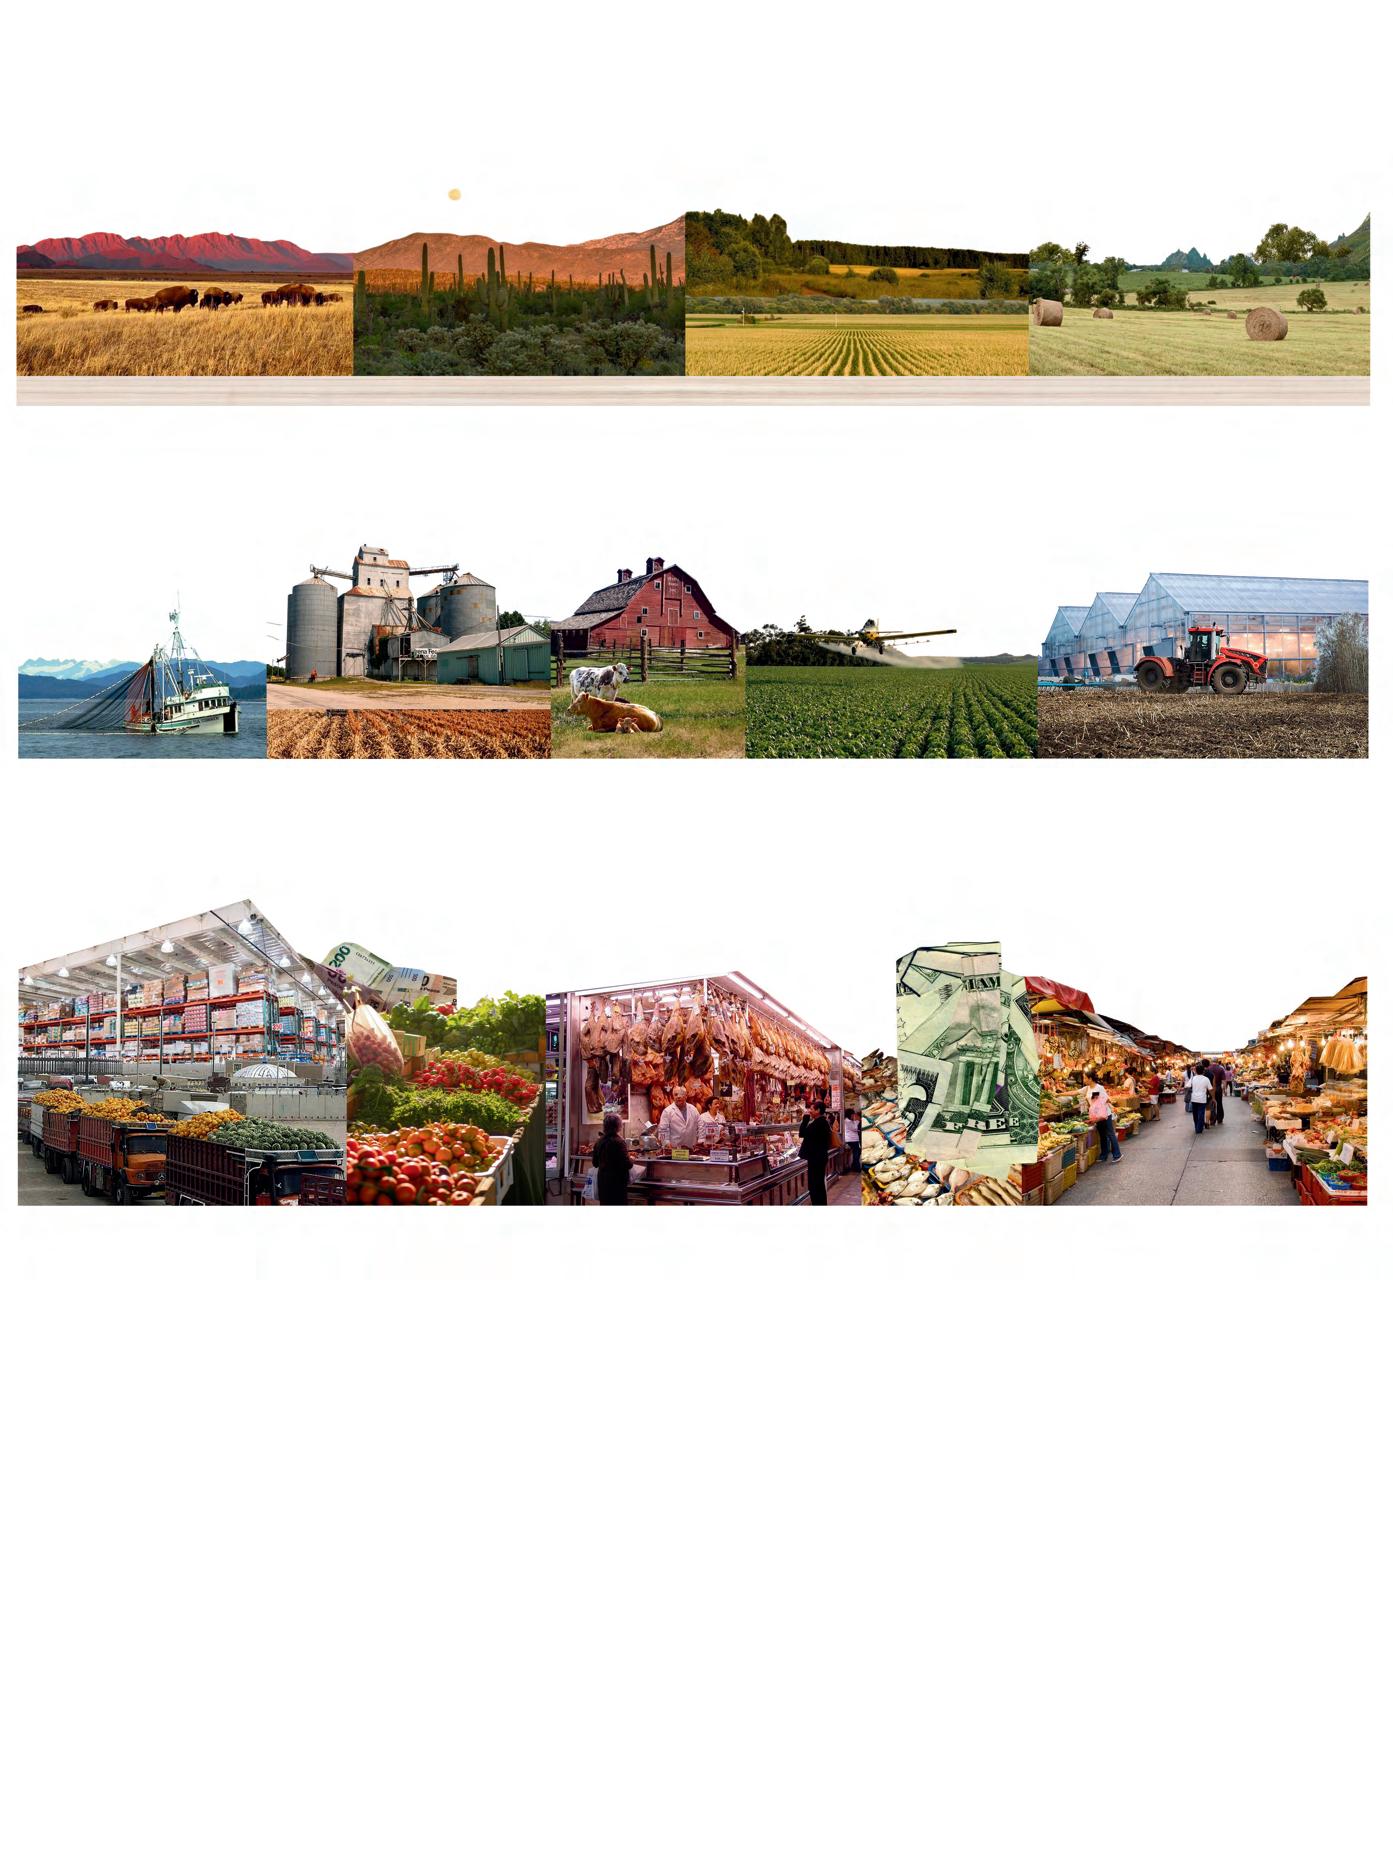
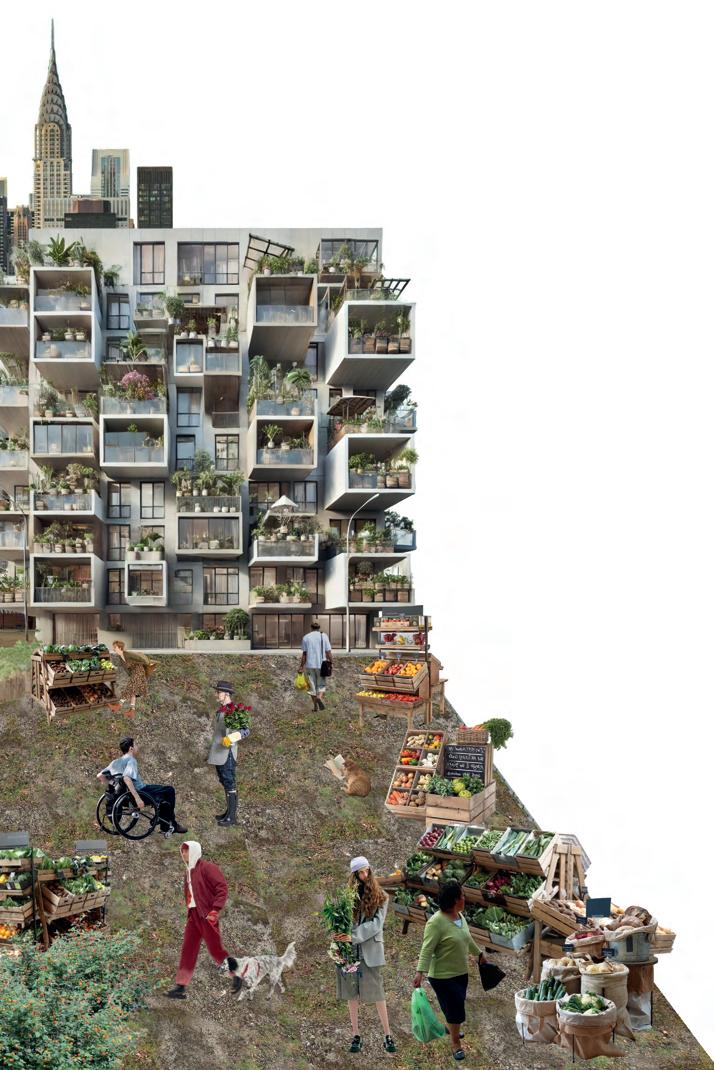
FOOD EMPIRE CHAINS
The global food system, dominated by multinational corporations, prioritizes profit over sustainability, nutrition, and equity. Corporate control has led to monoculture farming, patented seed dependency, and the marginalization of small farmers, replacing traditional food practices with mass-produced, processed alternatives. Industrialized agriculture disconnects consumers from food sources, exacerbates waste, and worsens global food inequalities.
Food scarcity is exploited in conflicts, while subsidies and deregulated markets in wealthy nations drive overproduction and inefficiency. This system fuels environmental destruction, threatens food security, and deepens inequality. Urgent reforms are needed to curb corporate dominance, promote sustainable agriculture, and ensure fair food distribution.
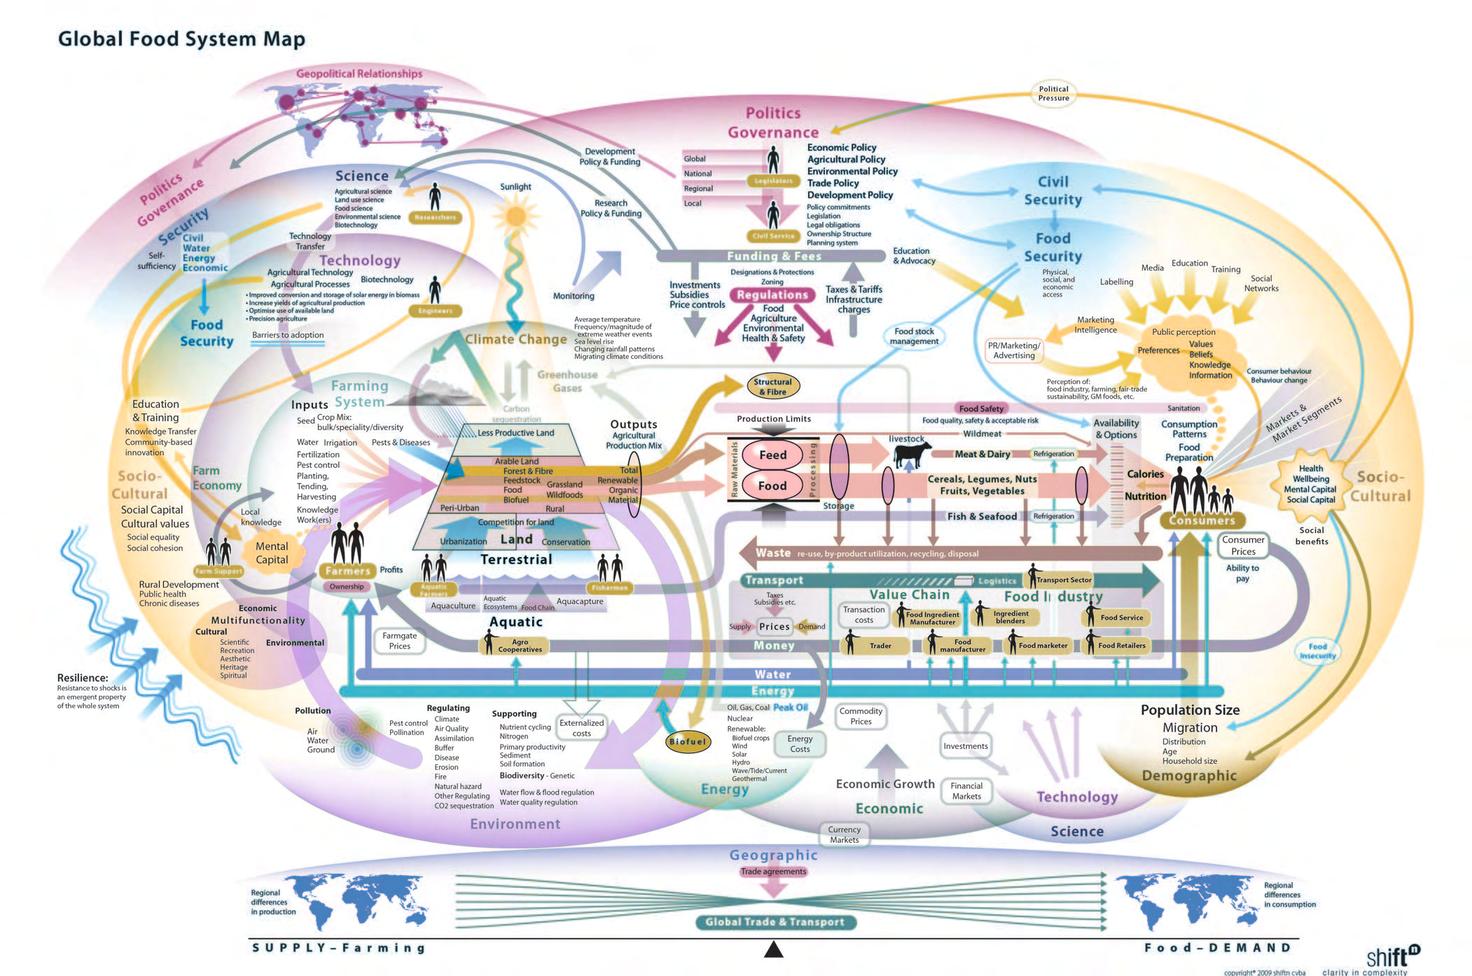
The Global Food System Map, created by the National Academies of Science, Engineering and Medicine, is a profound representation of the sheer complexity and interconnectivity that define the modern food system. It is not just a static diagram but a dynamic model that exposes the intricate relationships between agriculture, economics, environment, and society. Every element— whether it be food production, supply chains, or consumer behavior—is deeply intertwined with global forces such as climate change, trade policies, technological advancements, and resource availability. The map’s value lies in its ability to visualize these dependencies, demonstrating how even minor shifts—like a drought in one region or a change in consumer preference — can have cascading effects across the entire global food network. It highlights how food is not merely a commodity but a complex system of flows, pressures, and interactions that require a deep understanding to manage effectively.
At its core, the map reinforces the undeniable importance of food as the foundation of human survival, economic stability, and ecological balance. With food accounting for half of the bio-economy’s revenue, it is not just a necessity but a driving force of global development. The way food is produced, distributed, and consumed determines not only nutrition and health but also social equity, geopolitical stability, and environmental sustainability. By mapping out these intricate connections, this tool provides a crucial framework for decision-makers to address food security, sustainability, and economic resilience. It is a stark reminder that food is not just about feeding people—it is the backbone of civilization, and understanding its complexity is essential for shaping a more sustainable and equitable future.
Figure Global Food System Map. Edited by Ivanna de la Torre
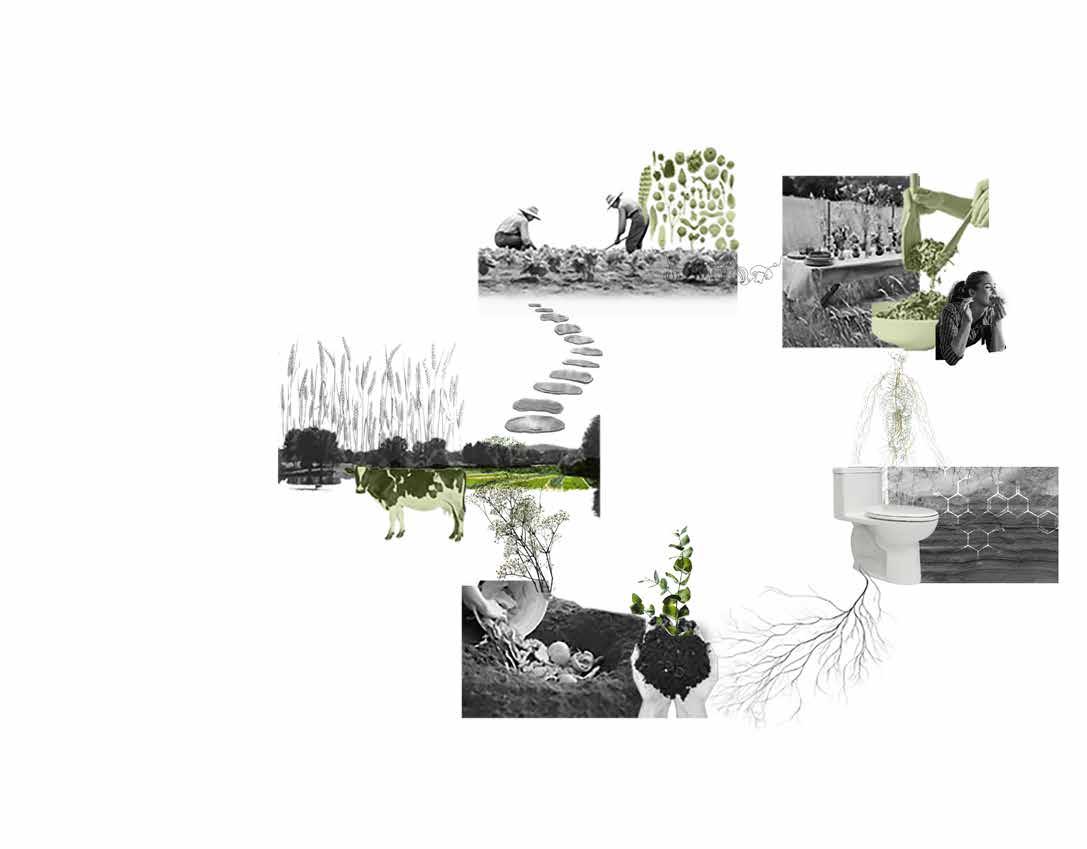
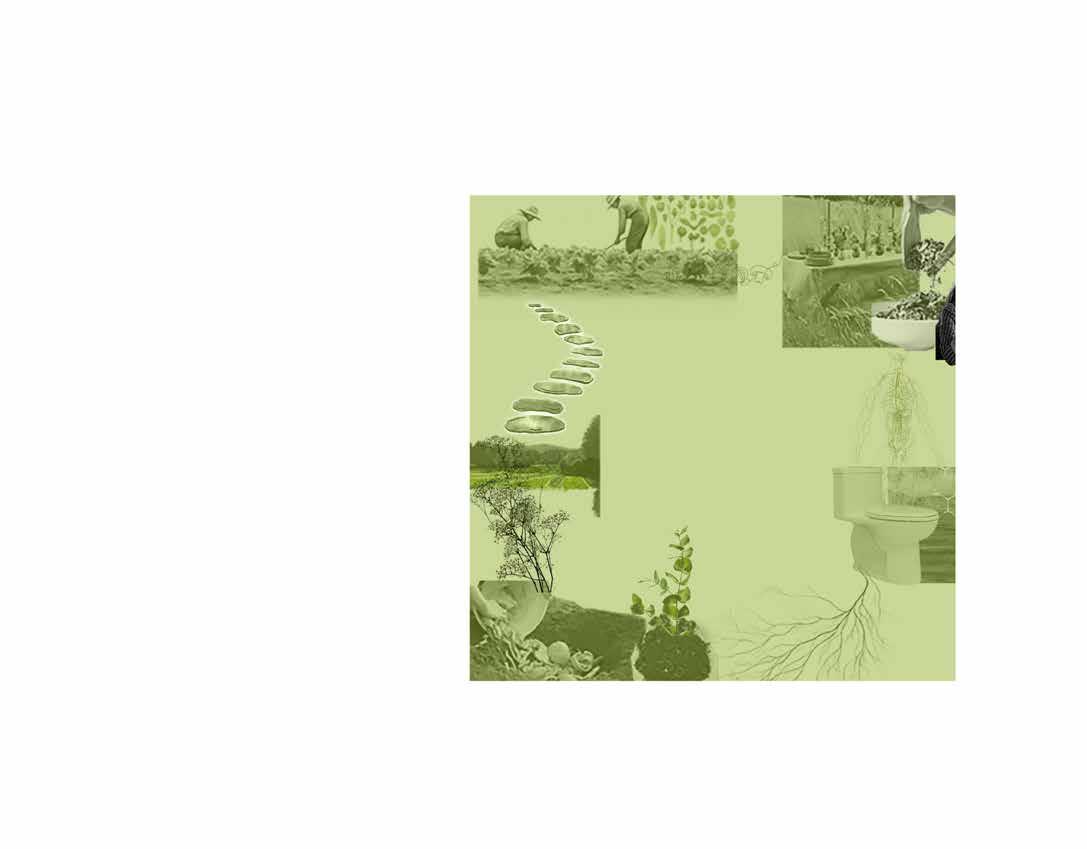
Figure # . Food Journey. Collage bVlentina Bottle
The food cycle was once a simple, natural process that sustained life for centuries. Before industrialization and the Green Revolution, people grew food using natural soil fertility, consuming what they harvested, and returning organic waste—such as food scraps, manure, and plant material—back to the land. This cycle enriched the soil, allowing new crops to grow each season without depleting nutrients. Farmers understood the importance of maintaining soil health, often using composting and manure to keep the land fertile. This balance ensured food production remained sustainable for generations. However, with industrial agriculture and modern waste disposal, much of this organic matter is now discarded instead of recycled, disrupting the natural cycle and depleting soil fertility.
COOKING AND PREPARATION
FARMING
TRANSPORTATION
FOOD PROCESSING
SEEDS AND PLANTING
https://www.nature.org/en-us/what-we-do/our-insights/perspectives/ foodscapes-regenerative-food-systems-nature-people/ Figure # . Food Journey. Collage By Ivanna
RETAIL
OCEAN RESIDUES
GARBAGE WASTE
de la Torre
Food systems have become increasingly complex over time, shaped by technological advancements, globalization, and evolving consumer demands. What once was a simple process of planting, harvesting, and consuming has now expanded into a vast, interconnected system involving large-scale farming, food processing industries, extensive transportation networks, and global supply chains.
The journey begins with planting seeds, tending crops, or raising livestock—activities that require significant resources, technology, and sustainability efforts. Once food is harvested, it undergoes processing to enhance preservation, safety, and convenience before being packaged for distribution. From there, it travels long distances via trucks, trains, or ships to reach supermarkets, restaurants, and markets worldwide.
Upon purchase, food enters yet another stage: preparation. Whether cooked at home, served in restaurants, or turned into ready-to-eat meals, the process of washing, chopping, and cooking is essential before food reaches the plate. But the journey doesn’t end there. After cooking and preparation, food waste, packaging materials, and residues from cleaning products contribute to environmental pollution. These discarded materials often make their way into landfills, waterways, and even the ocean, impacting marine ecosystems and adding to the growing issue of waste management.
Despite modern advancements, food production remains a labor-intensive and resource-demanding process, one that links agriculture, industry, transportation, and waste management. Each meal represents not just nourishment but the culmination of a vast, intricate network that spans the globe.
3
TYPES OF FOOD ENVIRONMENTS
Consumer (store availability, price, nutrition information) Community (stypes of outlets, accesibility) Organizational (home, school or work)
Vendor / product properties and convenience (quality, safety, level of processing, shelf life, packaging, time allocation, preparation facilities)
THE ROLE OF FOOD ENVIRONMENTS
4
DIMENSIONS OF FOOD ENVIRONMENTS
Prices and affordability (cost of products and purchasing power)
Marketing, regulation and desirability (branding, advertising, sponshorip, labelling)
Availability and (distance, tim daily mobili individual activi
Figure # . The Role of Food Enviorments. Collage by Valetina Bottle
and accesibility time, space, mobility, activity spaces)
Spatial (diversity of urban foodscapes and impacts on diet and health)
4 APPROACHES OF FOOD ENVIRONMENTS
Social and cultural (foodscapes are socially shaped and highlight structural inequalities)
Behavioral approaches (perceptions of foodscapes and food behaviors)
System approaches (global corporate food regime and local, ethical, sustainable food networks)
Food environments significantly influence dietary behaviors by shaping what people eat and how they access food. Supermarkets provide healthier options like fresh produce, while fast-food outlets and convenience stores often promote processed, calorie-dense foods.
Low-income neighborhoods frequently face food deserts and food swamps, limiting access to nutritious food and increasing reliance on unhealthy options. Beyond access, factors such as affordability, marketing, and cultural preferences also impact food choices. Processed foods are typically cheaper and more heavily advertised, making them more appealing, especially to those with limited financial resources. Even when healthy foods are available, cost and convenience often drive people toward less nutritious options.
To improve public health, interventions should address food environment disparities. Key strategies include expanding access to supermarkets, subsidizing healthy foods, regulating fast-food density, and offering nutrition education. These efforts can help promote healthier eating habits and reduce nutritional inequalities..
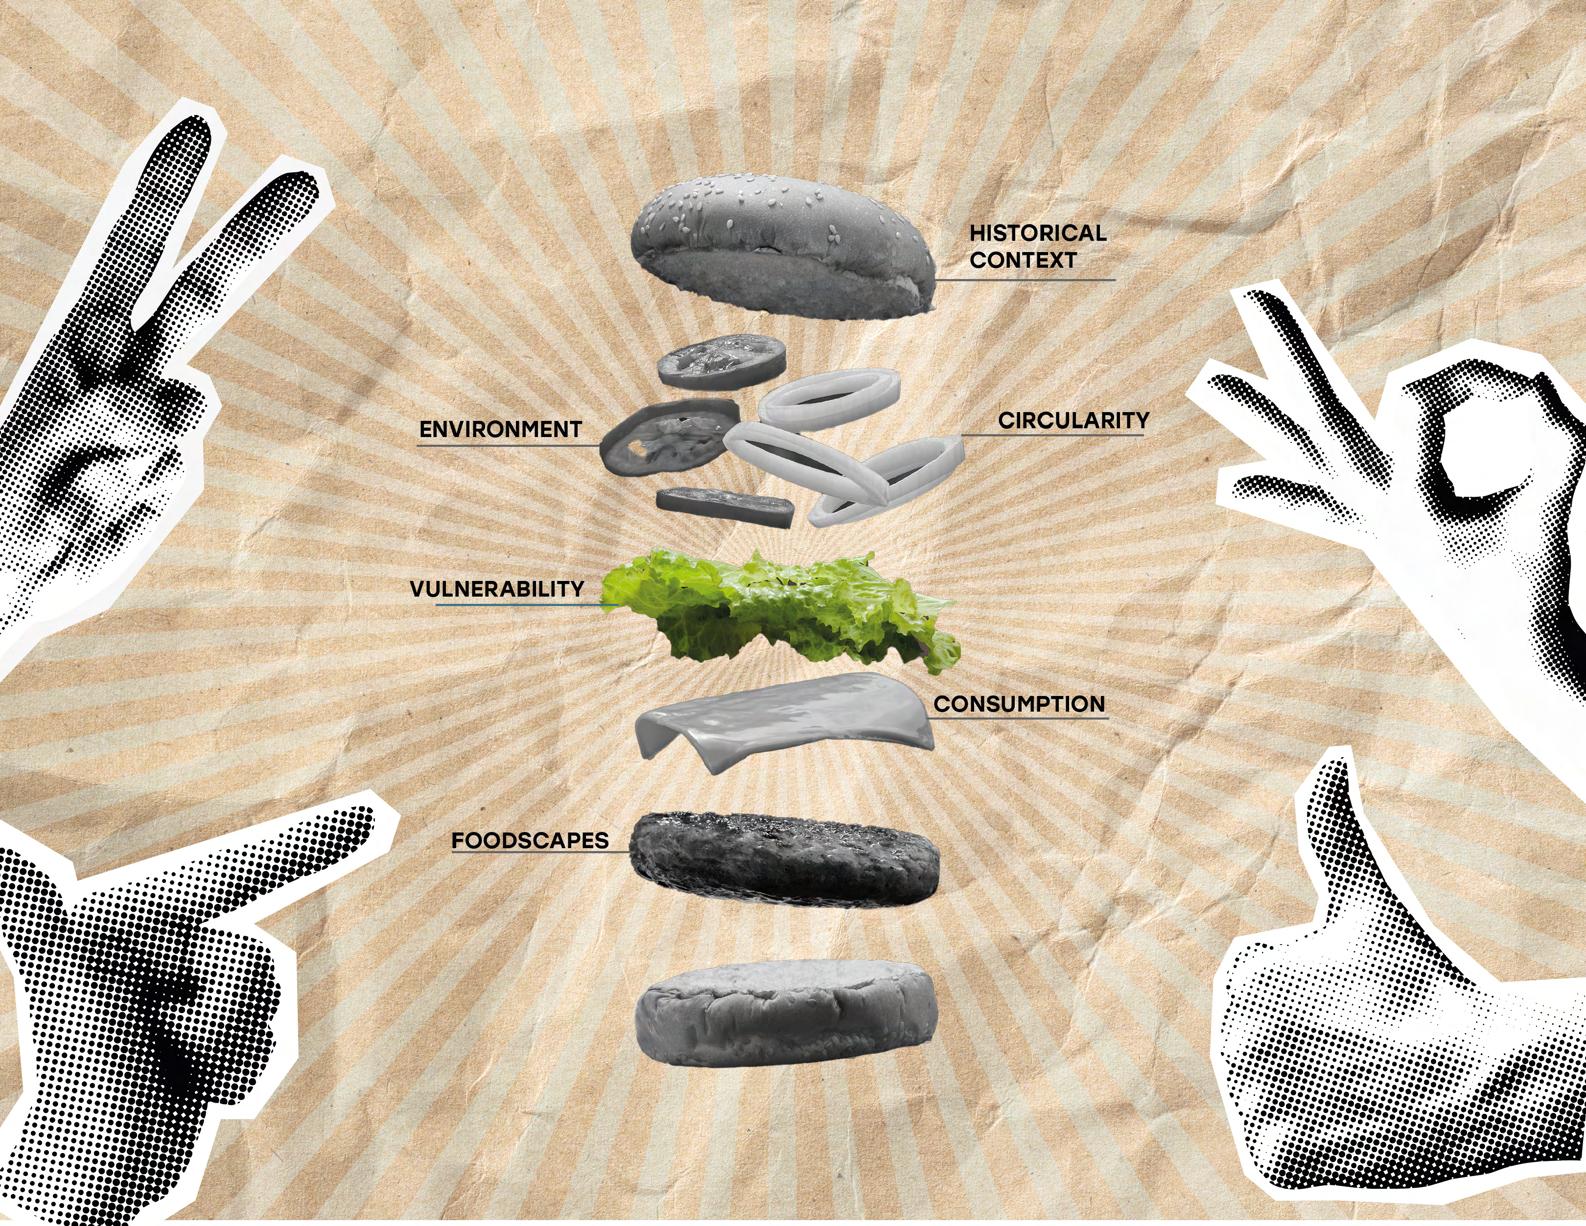
SOCIOECONOMICS & CULTURE DIABETES
CONSUMPTION
FOOD SYSTEM’S
Figure # . Food System Branches. Diagram by Santiago Tello
SOIL EROSION
ENVIRONMENT
SOIL EXPLOTATION
SOIL RESTORATION
FOOD CIRCULARITY
SUSTAINABILITY
CIRCULARITY
The environment plays a crucial role in shaping the global food system, influencing everything from agricultural practices to resource consumption. This chapter explores the impact of food production on land use, water consumption, and climate change, highlighting the challenges of deforestation, soil degradation, and pollution. We will examine how unsustainable farming practices contribute to environmental damage and the need for sustainable solutions to balance food demand with ecological preservation. Understanding these environmental implications is essential for developing strategies that ensure a resilient and responsible food system for future generations..
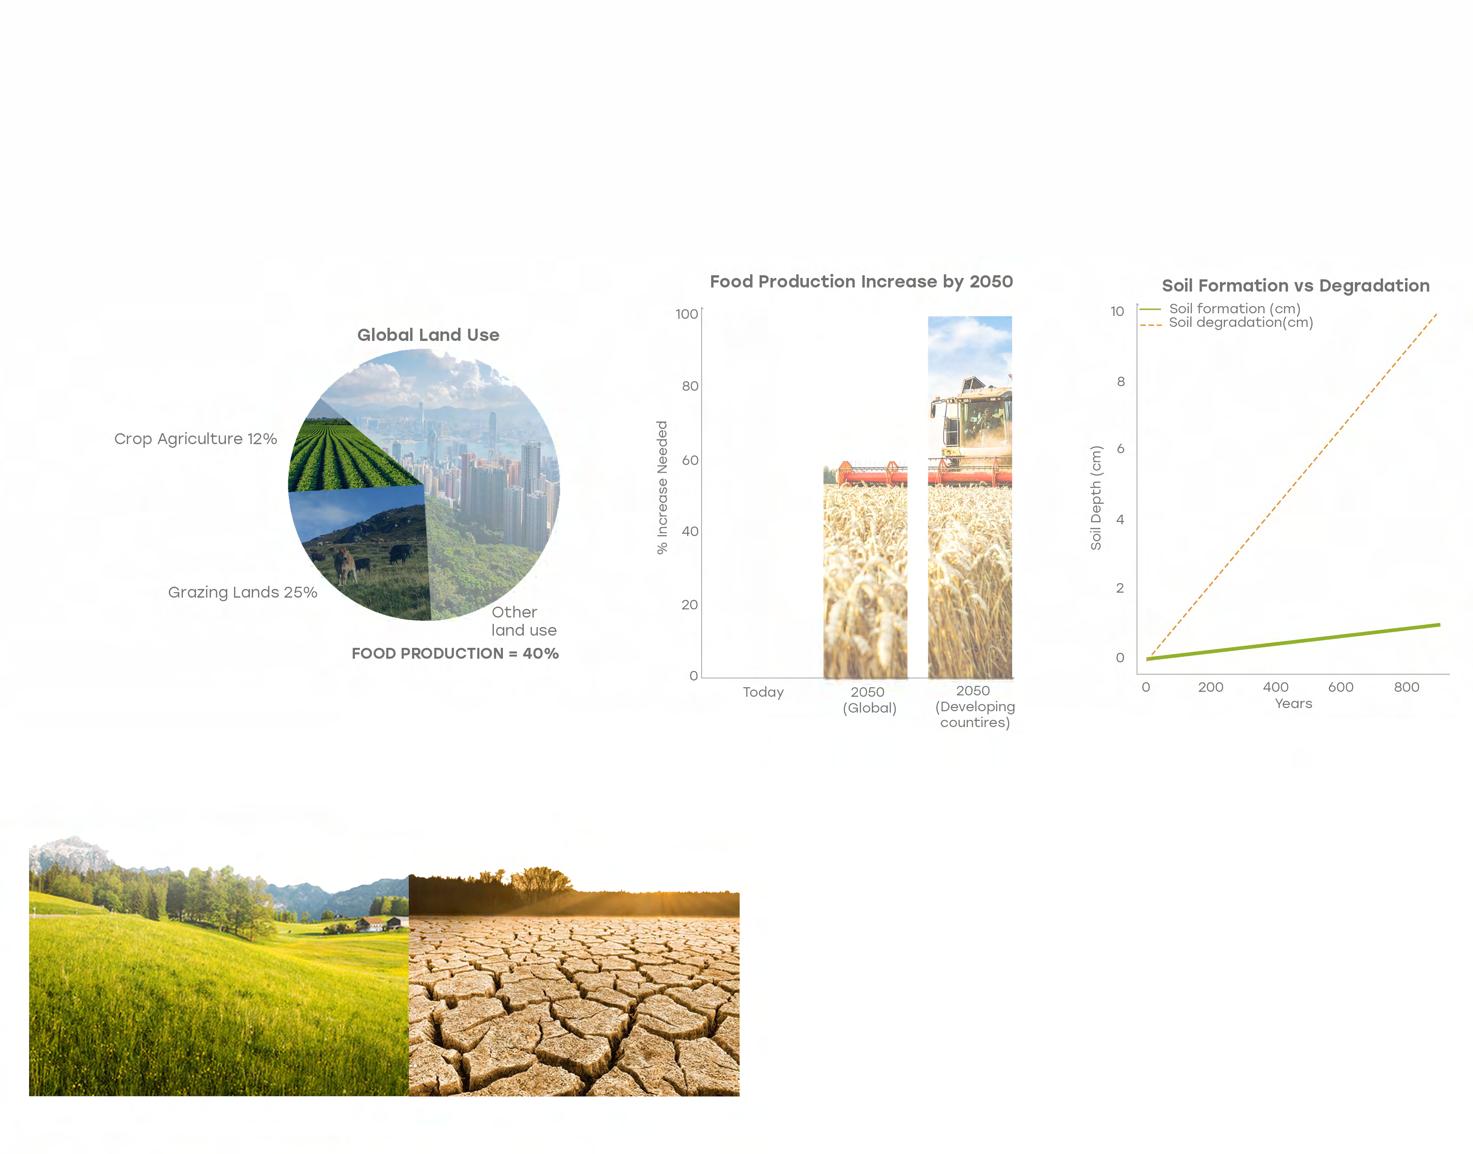
USE OF LAND IN FOOD
Approximately 40% of the Earth’s terrestrial land is dedicated to food and feed production, with 12% used for crop agriculture and 25% for grazing lands. To meet global food demands by 2050, agricultural production must increase by 60% worldwide and nearly 100% in developing countries. However, 33% of the world’s soil resources are degraded, reducing their ability to support food production. Without sustainable land management, nutrient depletion and erosion will limit yields, threatening food security. As 95% of food is directly or indirectly produced on soils, protecting agricultural land is crucial for feeding a growing population.
Figure # . Use of Land in Food. Diagram by Valentina Bottle
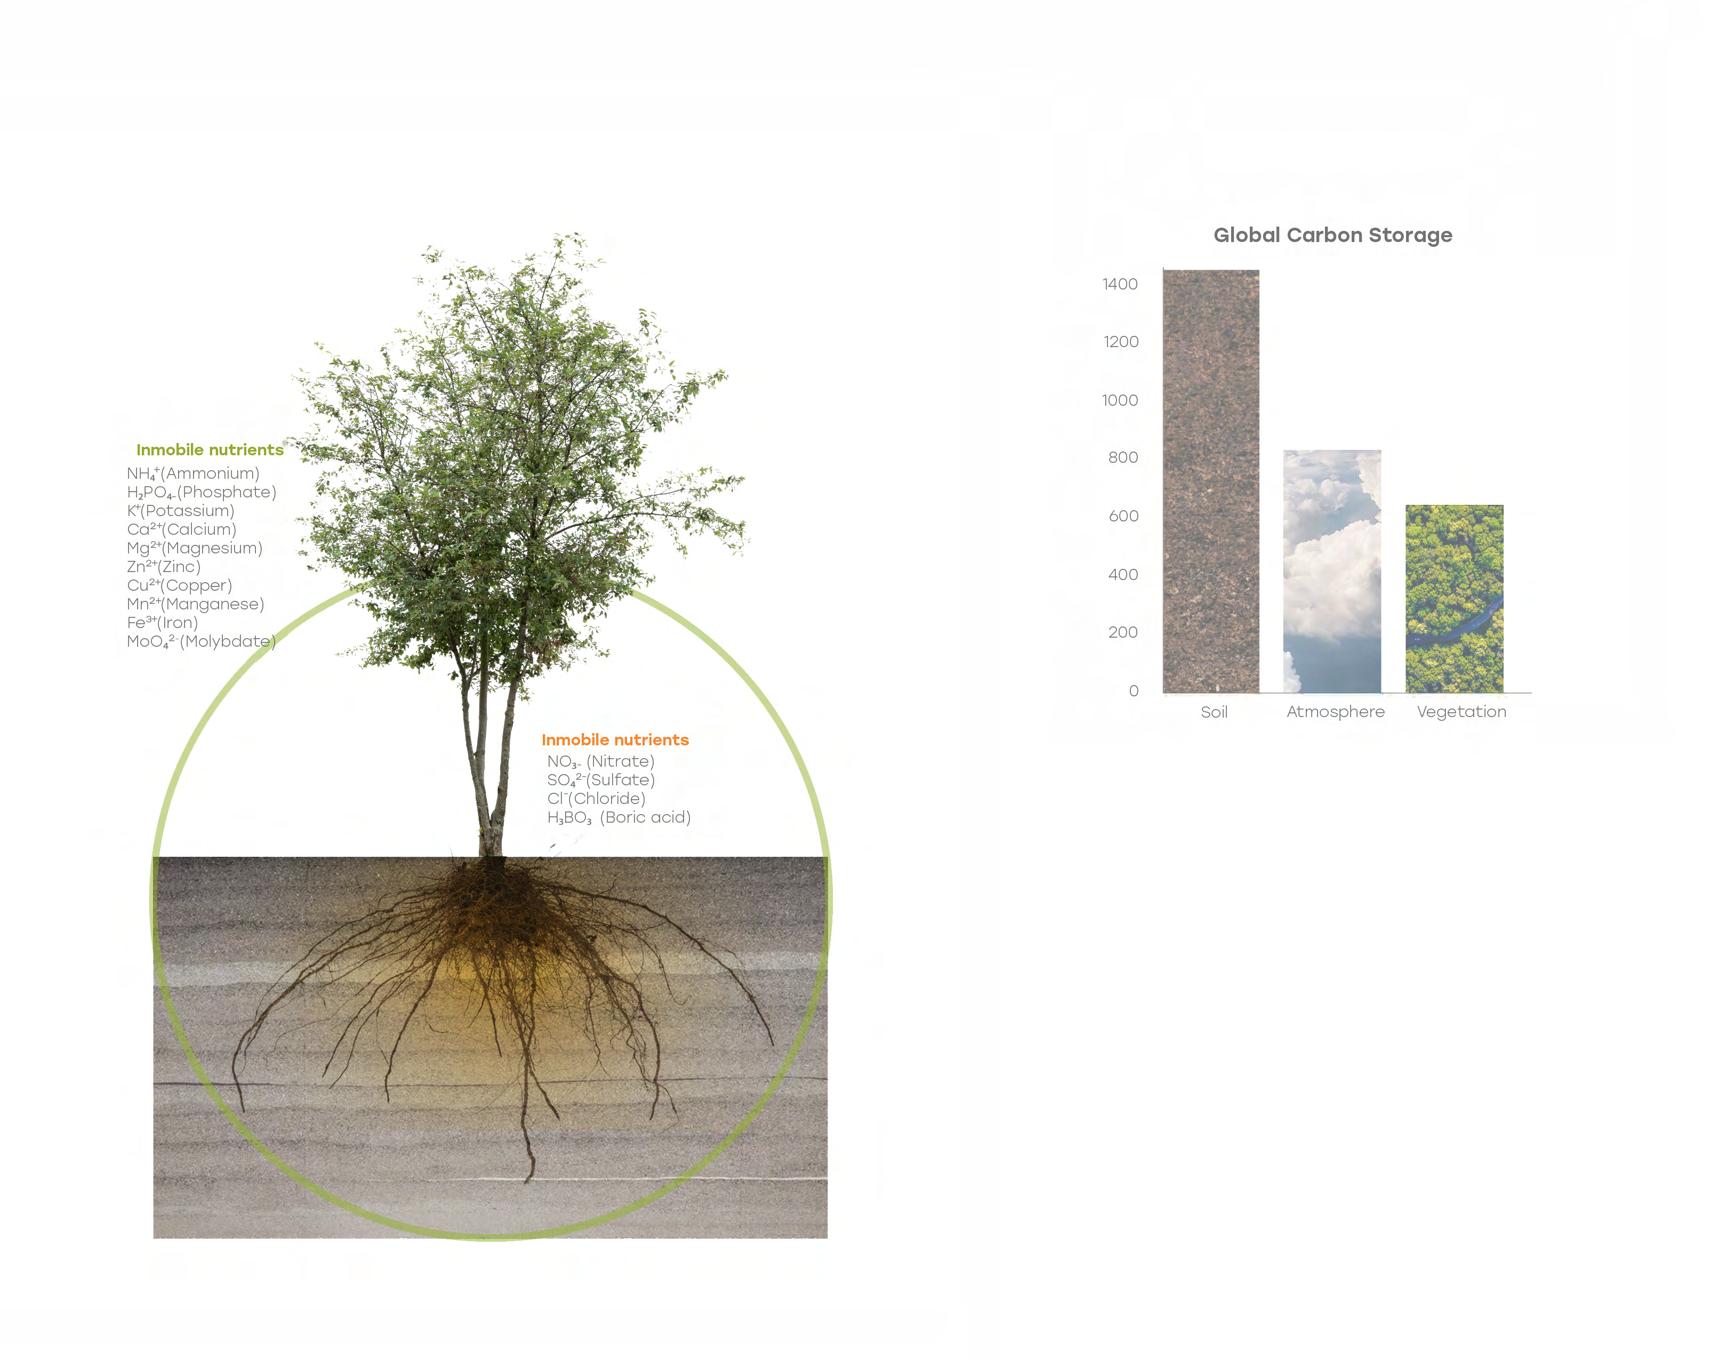
Soil is the foundation of 95% of global food production, soils contain 15 essential nutrients required for plant growth, including nitrogen (N), phosphorus (P), and potassium (K)—the primary nutrients for crops. A deficiency in any of these nutrients limits crop yield, making soil fertility a major factor in food production. Some nutrients, known as mobile nutrients, such as nitrogen, can be easily washed away by rainfall, leading to nutrient loss. To maintain fertility, farmers must replenish soils through organic matter return, compost, manure, and fertilizers. Sustainable soil management could increase food production by 58%, ensuring a stable food supply while also offsetting 34% of agricultural greenhouse gas emissions.
Figure # . Soil. Diagram by Valentina Bottle
SOIL DEGRADATION
ENVIRONMENTAL IMPLICATIONS
Intensive farming depletes soil nutrients, reduces fertility, and increases erosion, making land less productive over time.
PLASTIC POLLUTION
Large amounts of fresh water
The food industry relies heavily on plastic for packaging, storage, and agricultural materials like mulch, contributing to plastic waste and microplastic contamination.
Food production requires vast amounts of water for irrigation and processing, often leading to water depletion and contamination of water bodies with fertilizers, pesticides, and animal waste.
Greenhouse gas Emissions
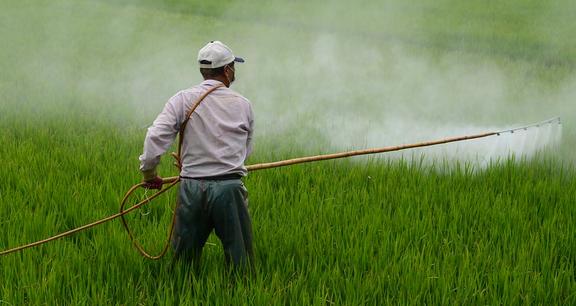
PESTICIDE CONTAMINATION
Agriculture is a major contributor to climate change, emitting carbon dioxide from deforestation, methane from livestock, and nitrous oxide from fertilizers.
The widespread use of pesticides and synthetic fertilizers contaminates soil and water, harming beneficial organisms and disrupting ecosystems.
Enourmouse Land Use
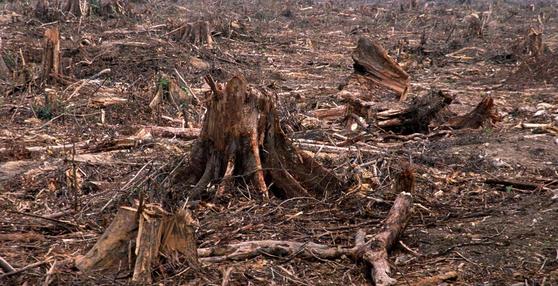
DEFORESTATION
Expanding agricultural land leads to deforestation and destruction of natural habitats, reducing biodiversity and disrupting ecosystems.
Food production leads to deforestation as forests are cleared for crops and livestock, disrupting ecosystems and increasing carbon emissions.
Reducing Biodiversity
Expanding agriculture reduces habitats, causing species loss and decreasing biodiversity, which harms ecosystems.
Soil Degradation
Intensive farming depletes soil nutrients, reduces fertility, and increases erosion, making land less productive over time.
Plastic Pollution
The food industry relies heavily on plastic for packaging, storage, and agricultural materials like mulch, contributing to plastic waste and microplastic contamination.
Pesticide Contamination
The widespread use of pesticides and synthetic fertilizers contaminates soil and water, harming beneficial organisms and disrupting ecosystems.
Deforestation
Food production leads to deforestation as forests are cleared for crops and livestock, disrupting ecosystems and increasing carbon emissions.
The environmental impact of food production and consumption is a pressing issue, as it drives resource depletion, greenhouse gas emissions, and waste accumulation. Agriculture consumes significant amounts of water and energy, while food waste exacerbates climate change and biodiversity loss. These challenges are closely linked to how food is grown, distributed, and discarded, making it essential to rethink our food systems. Integrating sustainability into food practices can help mitigate environmental harm, reduce waste, and promote more responsible consumption within existing foodscapes.
FORESTS, SHRUB, URBAN AREA, FRESHWATER
Poore & Nemecek (2018); UN FAO; UN AQUASTAT; On et al. (2018)
Entry of Plastic into the Environment Plastic Contaminating Food Sources
Plastic pollution is a growing crisis, with 9.2 billion tons produced and only 9% recycled. Single-use plastic, especially packaging, is a major contributor due to its short lifespan. If trends continue, plastic production will quadruple by 2050, worsening environmental damage and microplastic contamination. Urgent action is needed to reduce waste and improve recycling.
Seafood: Fish & marine life consume microplastics Crops: Plastics in soil & water absorbed by plants Packaged Food: Plastic leaches from containers
Humans consume plastic through food & water Health risks: toxic chemicals, hormonal imbalances, inflammation
Figure # . Plastic Pollution. Diagram by Ivanna de la Torre
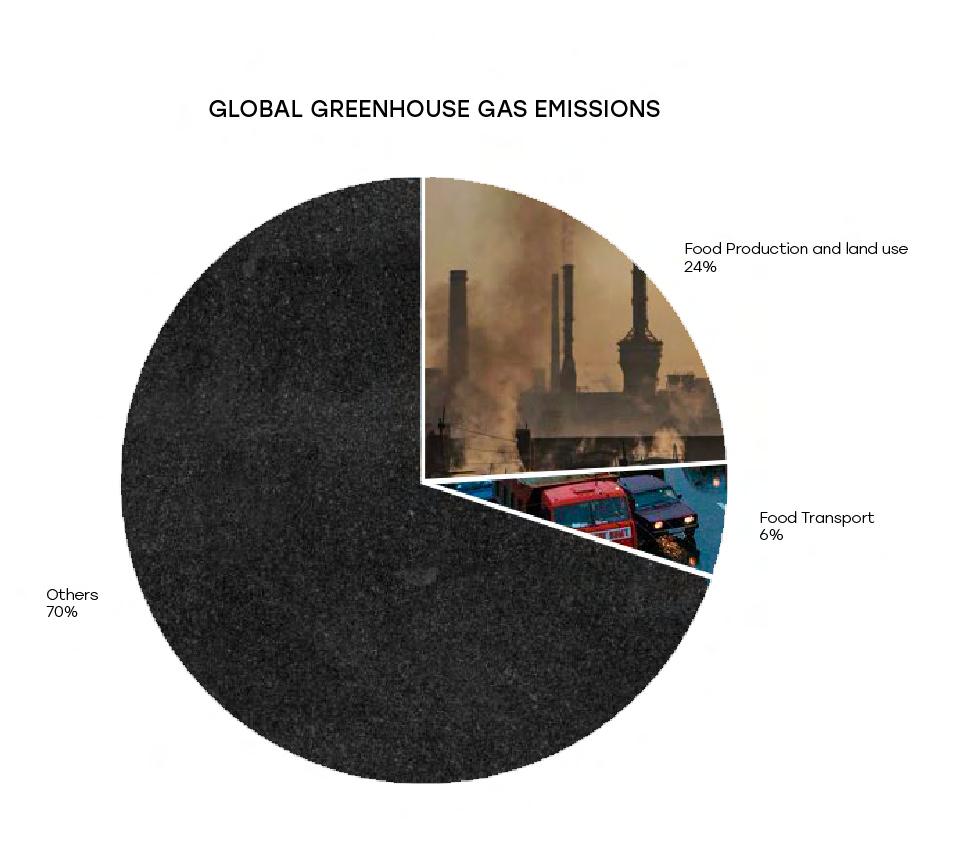
Food transportation plays a significant role in global greenhouse gas emissions, with food traveling an average of 1,500 miles from farm to plate. This long-distance shipping relies heavily on fossil fuels, increasing carbon emissions and contributing to climate change. Studies show that eating locally and seasonally can reduce food-related emissions by 5-7 times, as it eliminates the need for extensive transportation and refrigeration. By supporting local farmers and choosing seasonal produce, we can lower our carbon footprint, promote fresher and healthier food, and take a meaningful step toward a more sustainable food system.
Figure # . Transportation. Diagram by Ivanna de la Torre
The percentage of people using at least basic dinking waterservices
The percentage of people using at least basic santitation services.
Degree of IWRM implementation (1 - 100).
Annual freshwater withdrawls, total (% of internal reasources).
Renewable Internal freshwater reasources per capita(cubic meters).
Enviroumental flow requirements (106 m3/ annum).
Average precipitation in depth (mm per year)
Access to electricity (% of population).
Electric power consuption (KWh per capita).
Renewable energy consumption (% of total final energy consumption).
Renewable electricity output (% of total electricity output).
CO2 emissions (metric ions per capita).
Energy imports, net (% of energy use).
Prevalence of undernourishment (%).
Average protein supply (gr/bodyweight/day).
Percentage of children under 5 years of age affected by wasting (%).
Percentage of children under 5 years of age who are stunted (%).
Prevalence of obesity in the adult population (18 years and older).
Cereal yeld (kg per hectare).
Average dietary energy supply adequacy (ADESA) (%).
Average value of food production ($ per capita).
Figure # . Water Enery Food Nexus . Diagram by Natalia Vega
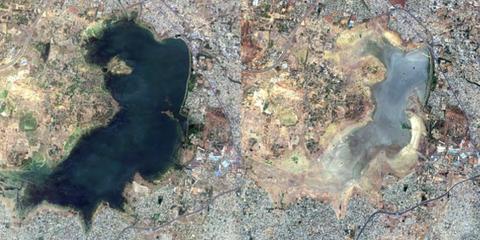
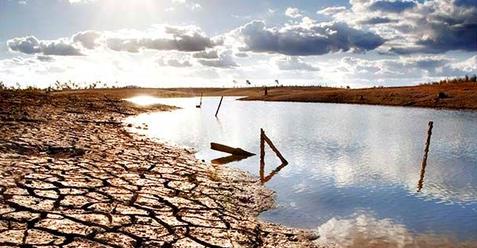
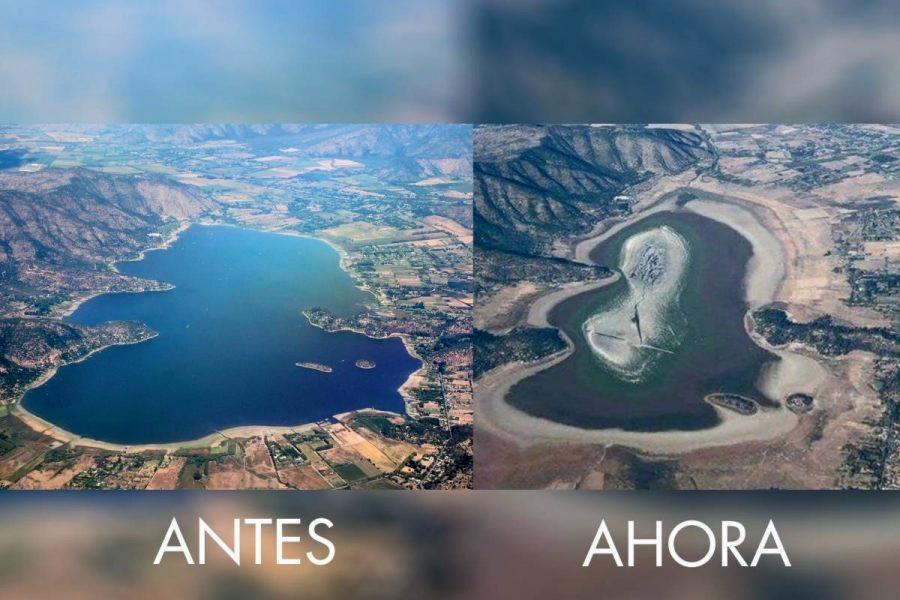
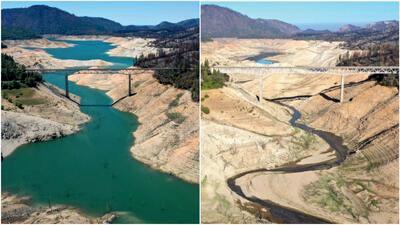
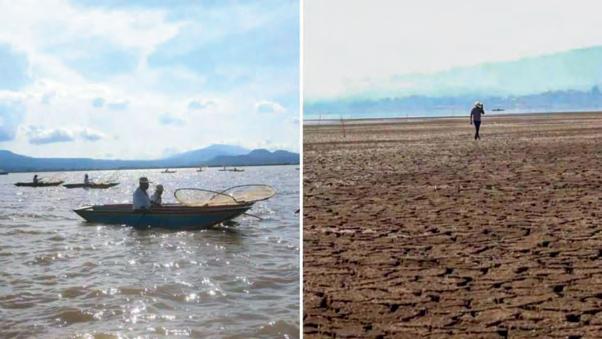
Figure # . WaterCrisis. Collage by Natalia Vega
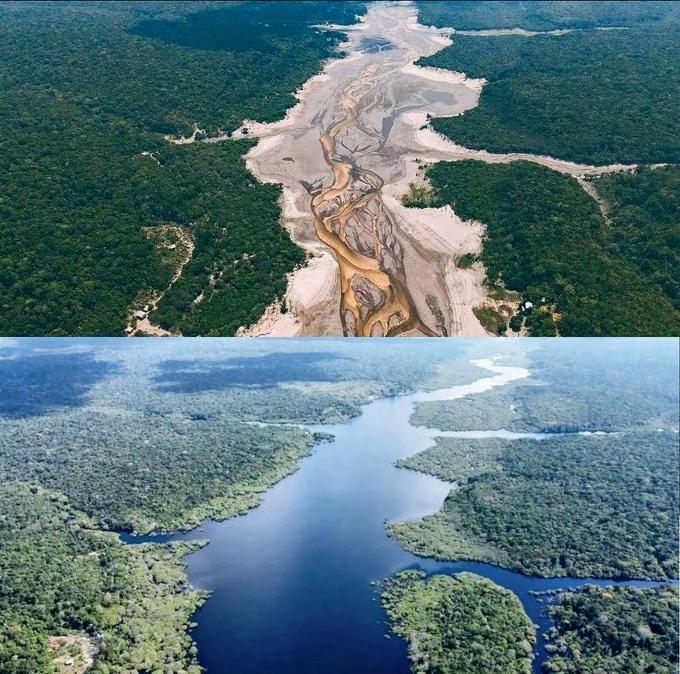
2.4 billion people now live in countries confronting water stress and almost 40 percent of global croplands already experience water scarcity.
All told, agriculture accounts for 72 percent of global freshwater withdrawals — amounting to nearly 3,000 cubic kilometers of water — taken from the world’s rivers, lakes, and groundwater aquifers each year.
Crop production is directly linked to transpiration levels, with greater production requiring more water.The evapotranspiration (ET) process, involving evaporation and transpiration, is a significant factor in crop yield. It takes between 500 and 4,000 liters of ET to produce one kilogram of grain.When this grain is used as animal feed, producing a kilogram of meat requires even more water, ranging from 5,000 to 15,000 liters.
While the average adult requires just 2 to 5 liters of drinking water and 20 to 400 liters of water for household use each day, in reality, individuals consume significantly more. On average, people use 2,000 to 5,000 liters of water per person per day. This figure is influenced by factors such as agricultural productivity and dietary habits.
Molden, David, Charlotte de Fraiture, and Frank Rijsberman. “Water Scarcity: The Food Factor.” Issues in Science and Technology 23, no. 4 (Summer 2007).
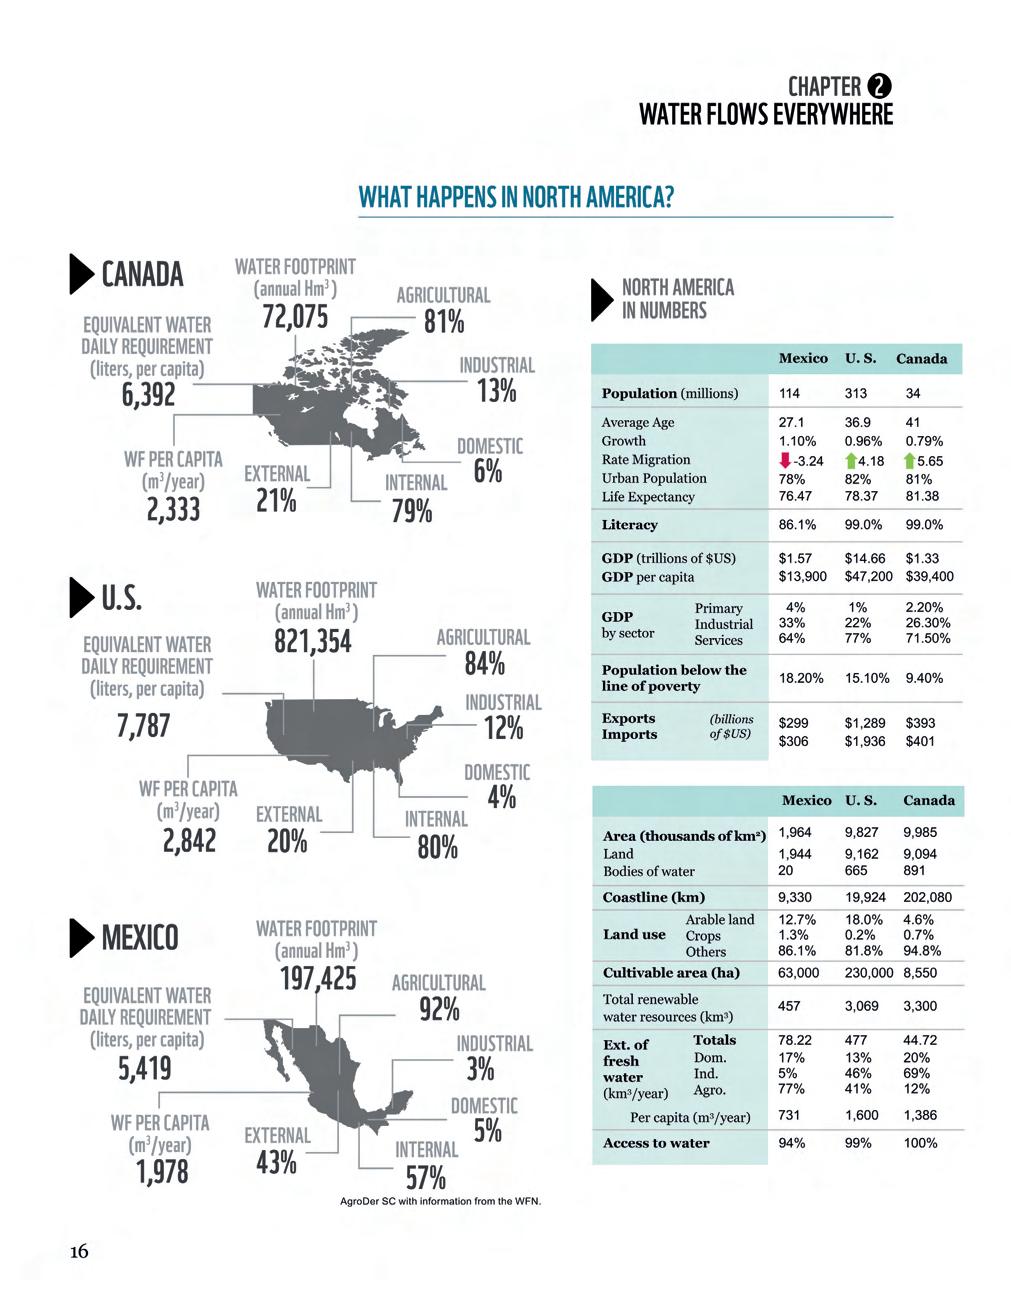
Mexico’s footprint is high, indicating alarming water scarcity. This issue is currently impacting the country, but it will be even more relevant for future water use.
AgroDer, 2012. The Water Footprint of Mexico in the context of North America. WWF Mexico and AgroDer. México DF
AgroDer, 2012. The Water Footprint of Mexico in the context of North America. WWF Mexico and AgroDer. México DF
GREEN WATER FOOTPRINT
RAIN WATER
Water from precipitation stored in the soil and evaporated, transpired and incorporated by plants. Amount of water needed to purify contaminants.
BLUE WATER FOOTPRINT
IRRIGATION WATER
Surface water or groundwater found in lakes, rivers, and aquifers.
GREY WATER FOOTPRINT
CONTAMINATION
Amount of water needed to purify contaminants
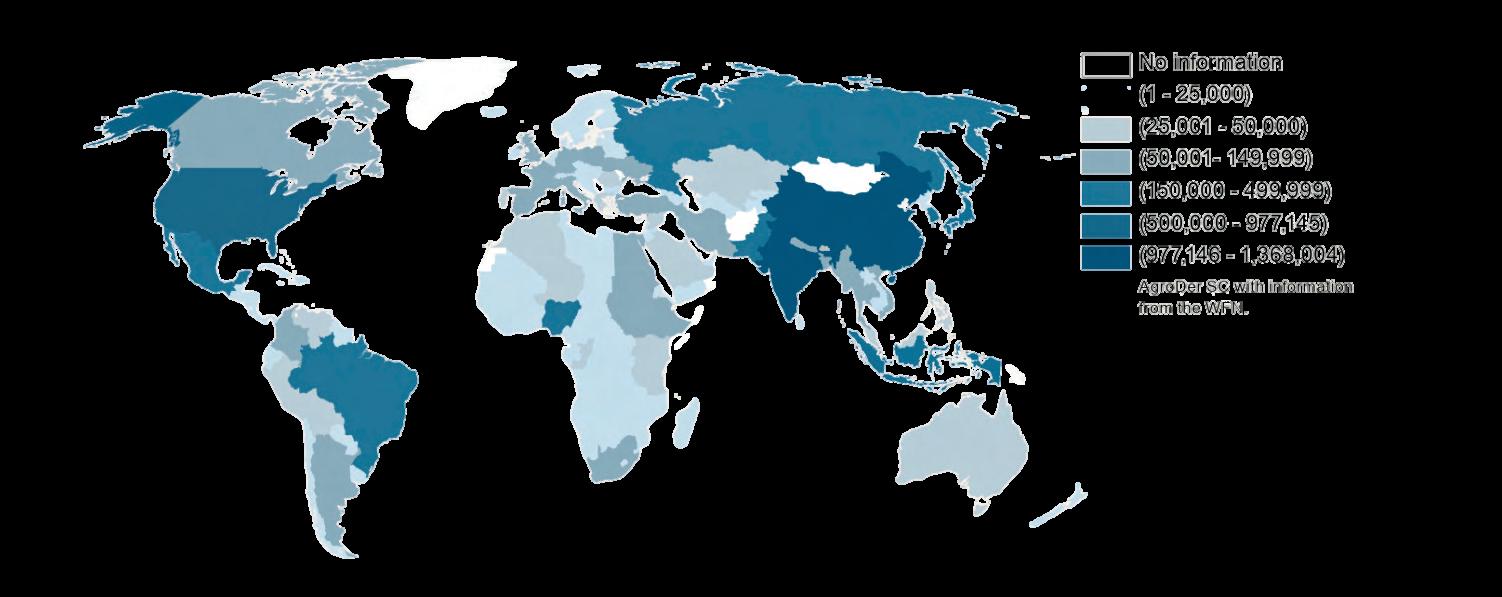
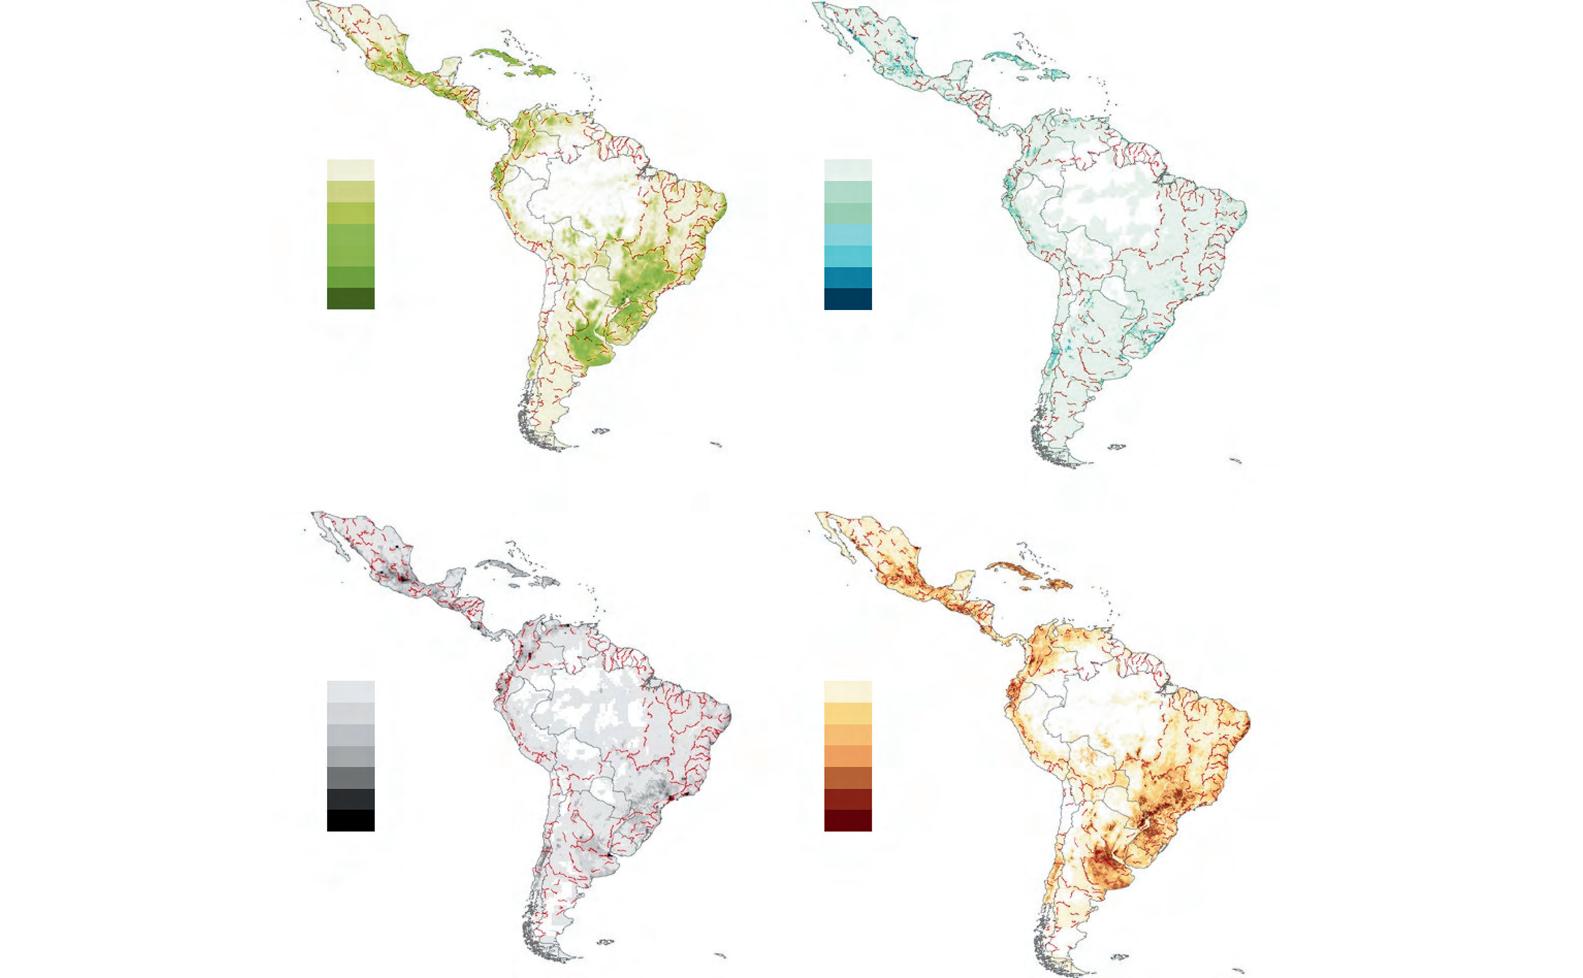
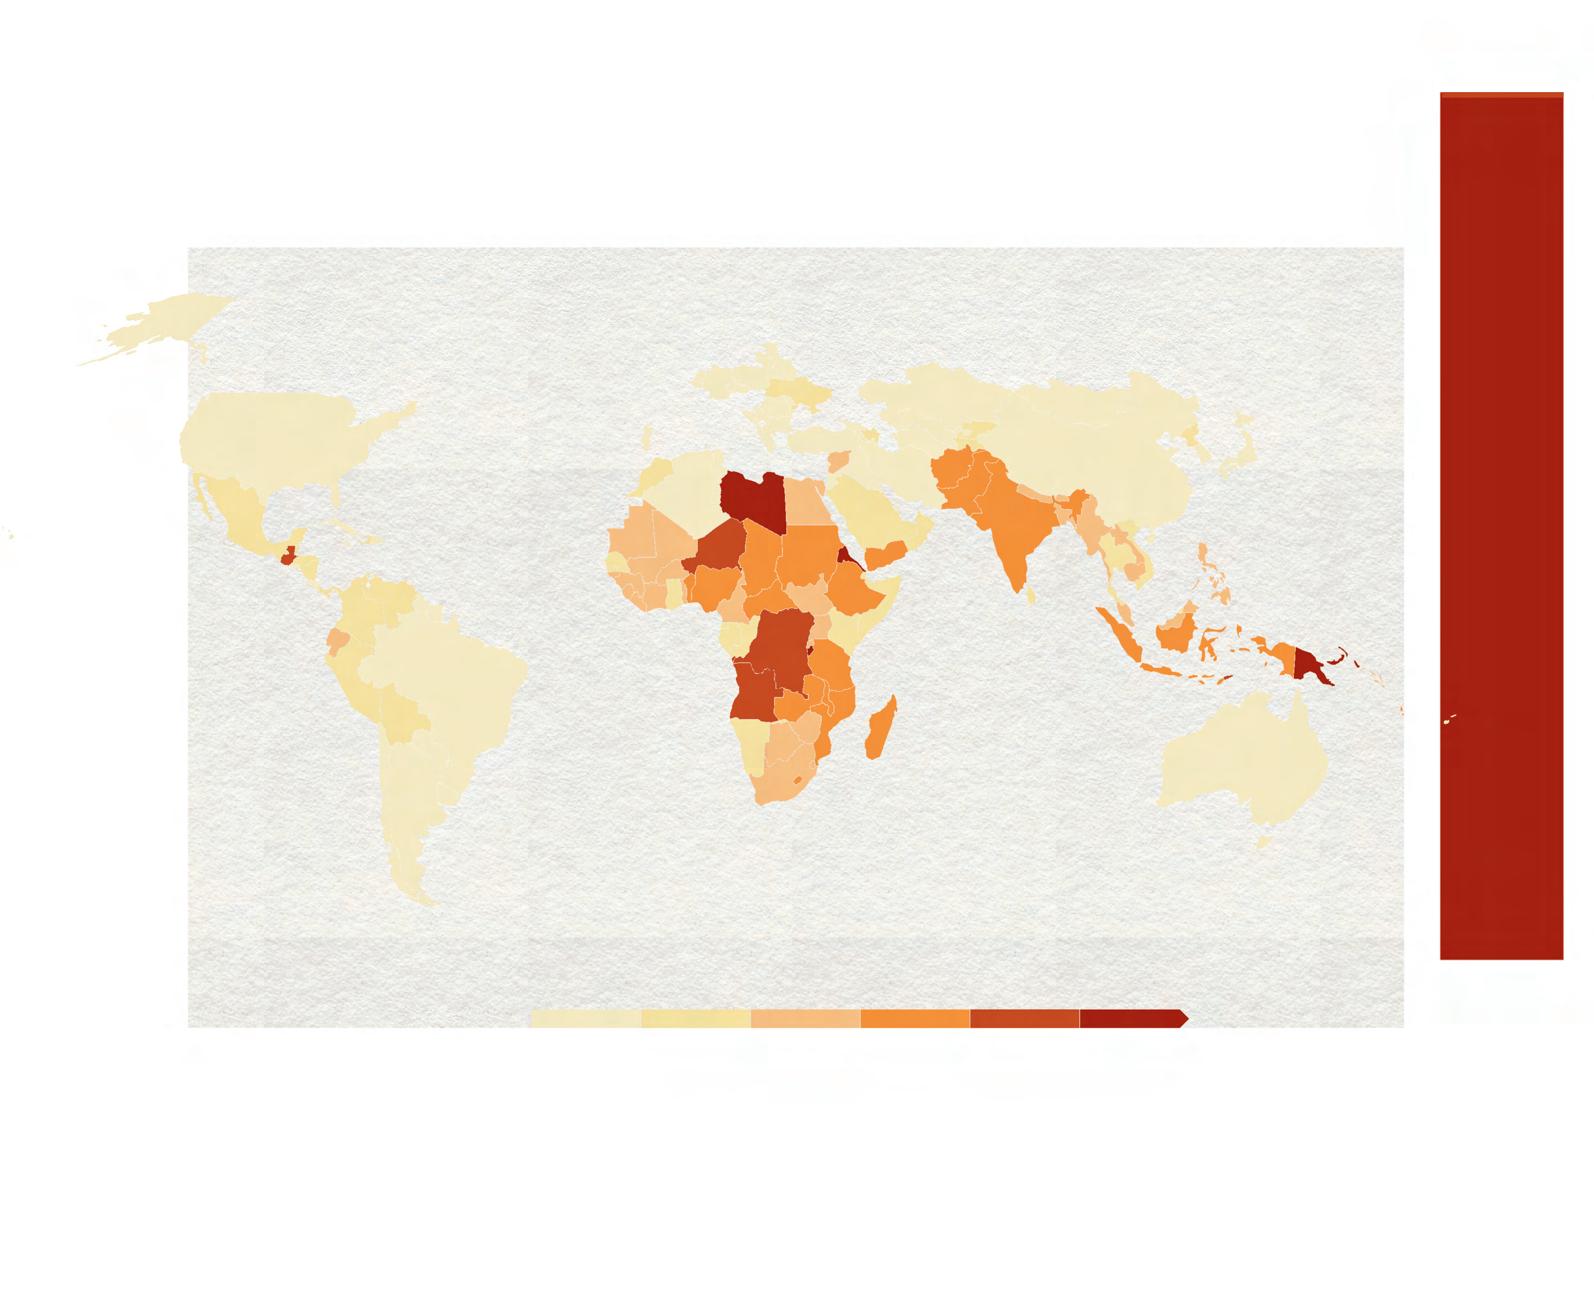
The spatial distribution of the green, blue, grey, and total water footprint (WF) in Latin America and the Caribbean (LAC) varies across the region’s major river basins. The Paraná Basin has the largest WF, reaching 336 billion m³ per year, representing 19% of the total. Other significant river basins include the Amazon (73 billion m³/year), Salado (52 billion m³/year), Uruguay (48 billion m³/year), Magdalena (36 billion m³/year), and Tocantins (34 billion m³/year). Together, these six basins account for approximately 50% of the total WF of production in LAC.
Regarding the blue water footprint, the largest is also found in the Paraná Basin, accounting for 10% of the total within the region. The Amazon, Santiago, and Uruguay basins also have a high blue WF, each contributing 4% of the total.
Figure 2.The green, blue, grey and total water footprints within Latin America & Caribbean (1996-2005). The data are shown in mm/y on a 5 by 5 arc minute grid. Data source: Mekonnen and Hoekstra (2011b).
Developing countries
countries
indicates mounting pressure on global water resources, posing challenges for both rural farming communities and urban areas dependent on these food supplies.
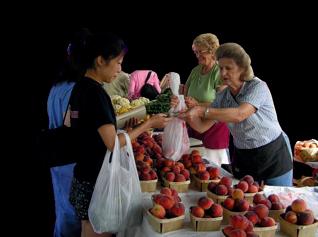
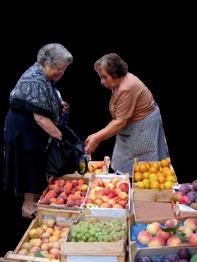
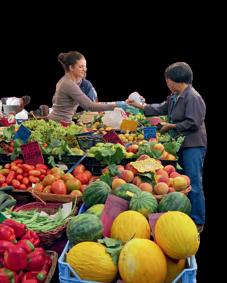
Figure # . Food time . Collage by Valentina Bottle
The water footprint of food varies significantly between animal products and crops, with animal agriculture generally demanding more water. Beef production and consumption, in particular, require a concerning amount of water due to the resources needed to grow feed, provide drinking water for cattle, and process meat. In contrast, vegetables like lettuce, tomatoes, and potatoes use considerably less water, making them more sustainable choices in terms of water usage. This disparity underscores the importance of promoting plant-based diets and adopting water-efficient agricultural practices to address the growing strain on global water supplies, especially as urban food demand continues to rise.
Bovine
Figure # Food time . Collage by Valentina Bottle
Circularity in food systems focuses on creating a regenerative cycle where resources are continuously reused and waste is minimized. This chapter delves into innovative approaches such as composting, regenerative agriculture, and food waste reduction strategies that contribute to a more efficient and sustainable food chain. We will also explore how traditional agricultural practices once maintained natural balance and how modern industrial food systems have disrupted these cycles. By reintroducing circular principles, we can work toward a more resilient and less wasteful approach to food production and consumption.
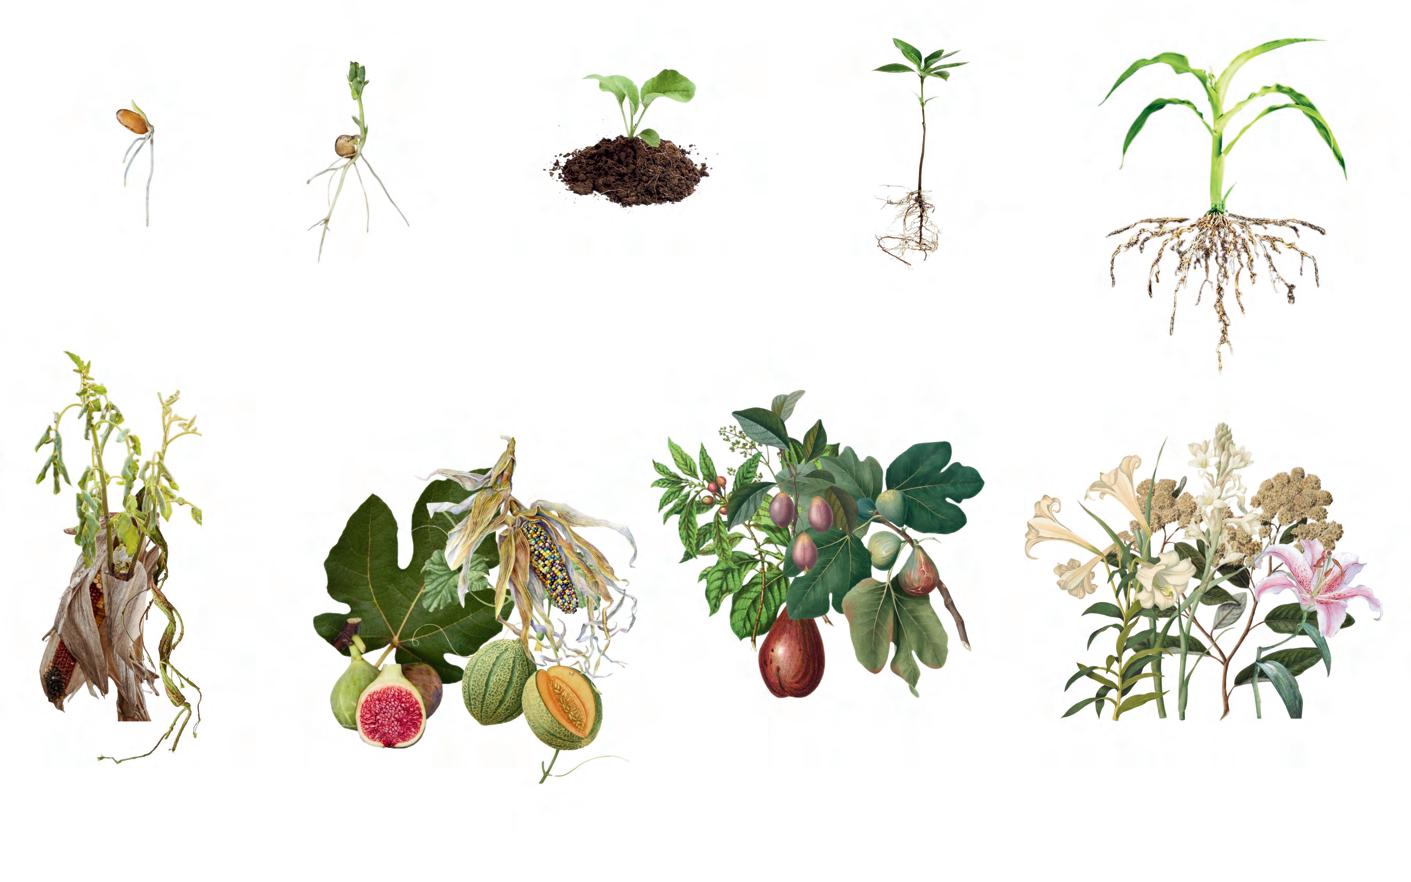
Stage 0: Germination, Sprouting Or Bud Development
Germination, sprouting and bud development are part of the primary growth phase of the plant, require adequate water, temperature and oxygen, and can deplete their nutritional reserves without additional fertilization.
At this stage of plant growth, genuine leaves, essential for photosynthesis, are produced and require fertilization to ensure healthy growth.
The tillering is the stage in which new vertical shoots are formed next to the initial shoot, increasing the number of “daughter plants” and developing articulated stems with nodes and internodes.
Plant senescence, marked by cellular alterations and metabolic changes, is influenced by environmental factors such as photoperiod and temperature, and can be modulated by hormonal treatments in annual crops.
During this ripening stage, the increase in ethylene activates the production of enzymes that modify the color, texture, flavor and aroma of the fruit, facilitating ripening.
Stage 9: Senescence, Beginning Of Dormancy
Stage 8: Fruit and Seed Ripening
Stage 1: Leaf Development
Stage 2: Side Shoot Formation Or Macollation
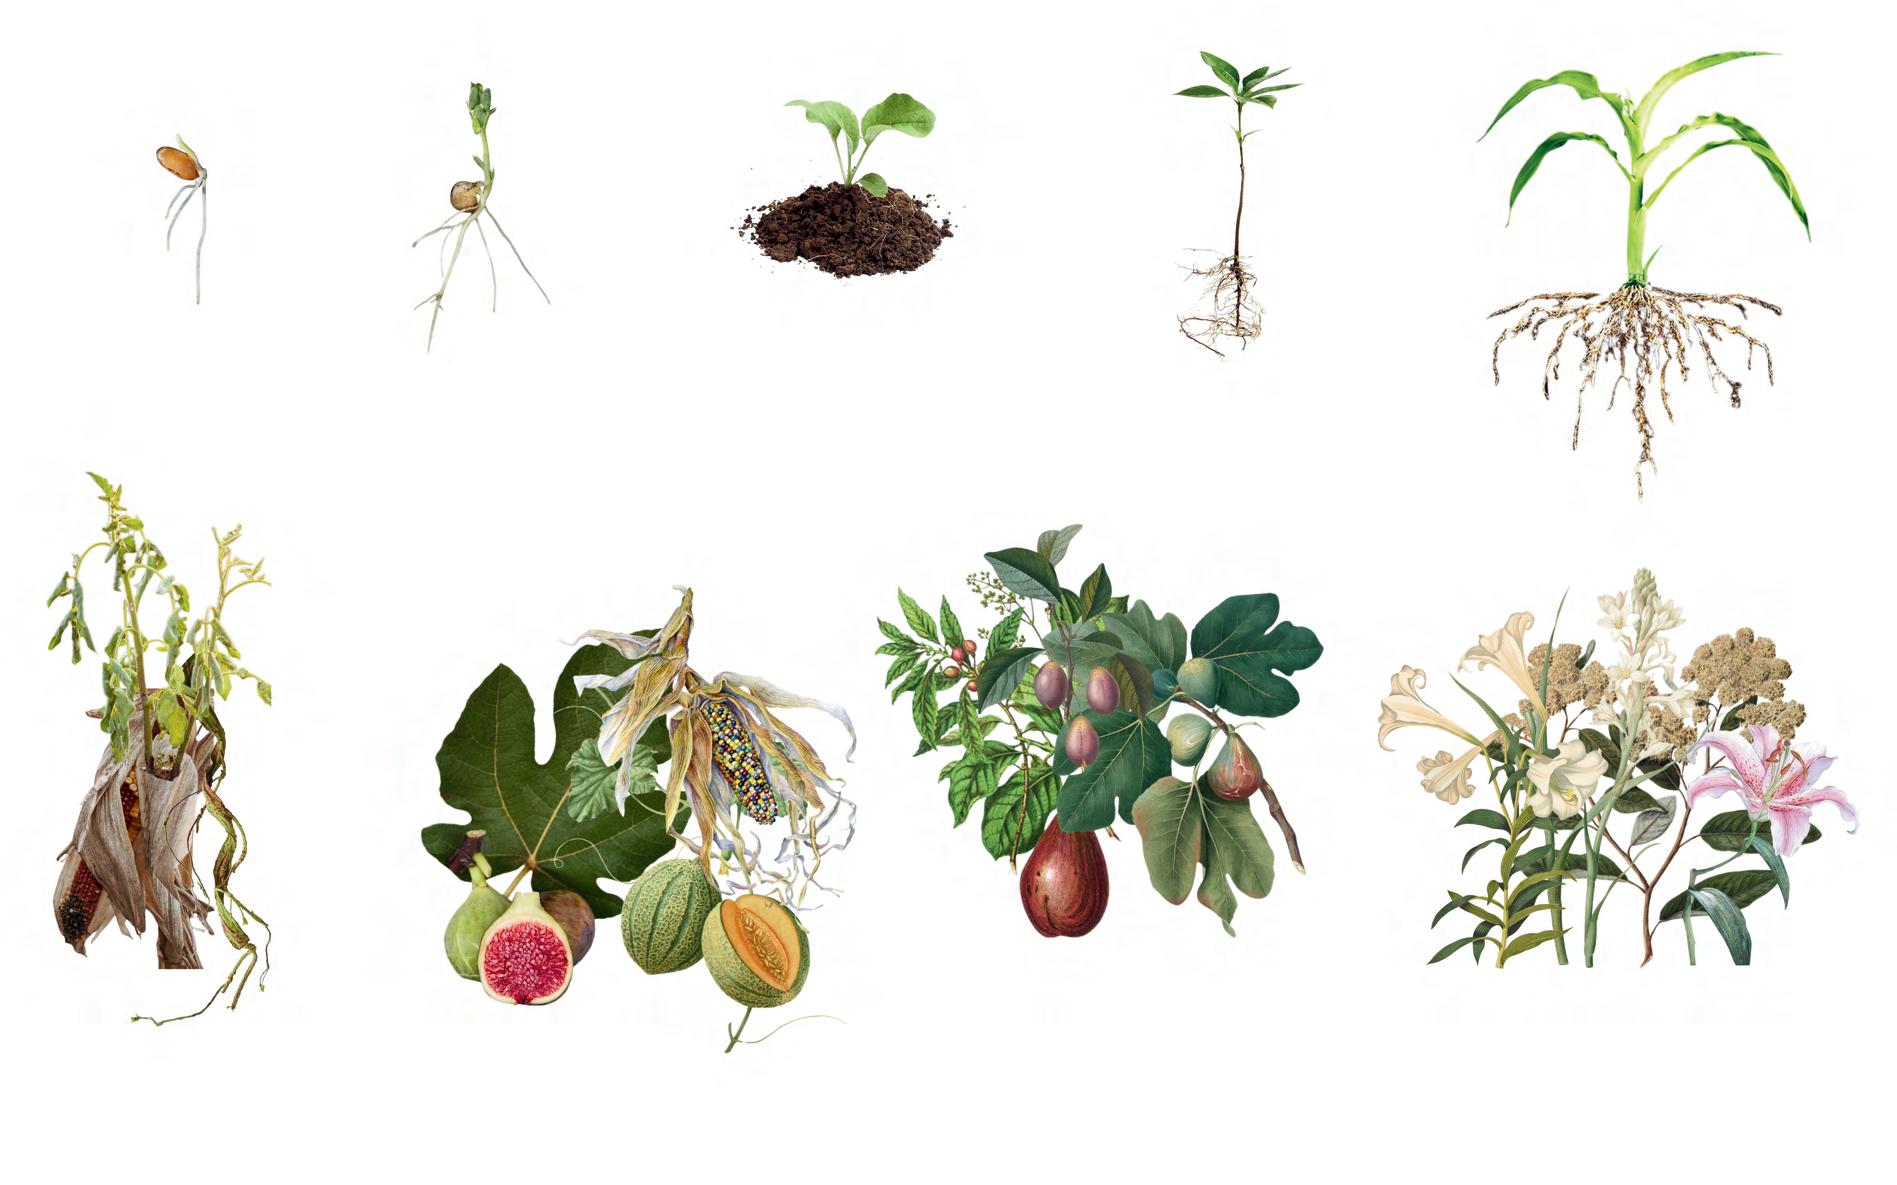
Figure # . Food time . Collage by Natalia Vega
Stage 3: Longitudinal Stem Growth or Rosette Growth, Shoot Development
Indeterminate growth allows stems and roots to continue to develop throughout the life of the plant, influenced by temperature and with variations according to the species.
At this stage, the fruit develops from the ovary after fertilization, passing through four stages until ripening, where phosphate and potassium are key to improving quality and yield.
Stage 4: Development of Harvestable Vegetative Parts of the Plant or Propagation Organs
Stage 5: Inflorescence (Main Stem) Emergence or Spiking
The vegetative stage is characterized by the development of strong stems and abundant green leaves, essential for photosynthesis, and benefits from the use of nitrogen fertilizers for vigorous growth.
At this stage, flowering plants develop their reproductive structures, a process influenced by gibberellin, temperature and photoperiod, with potassium as a key nutrient for flowering and fruiting.
Stage 6: Flowering
Stage 7: Fruit Development
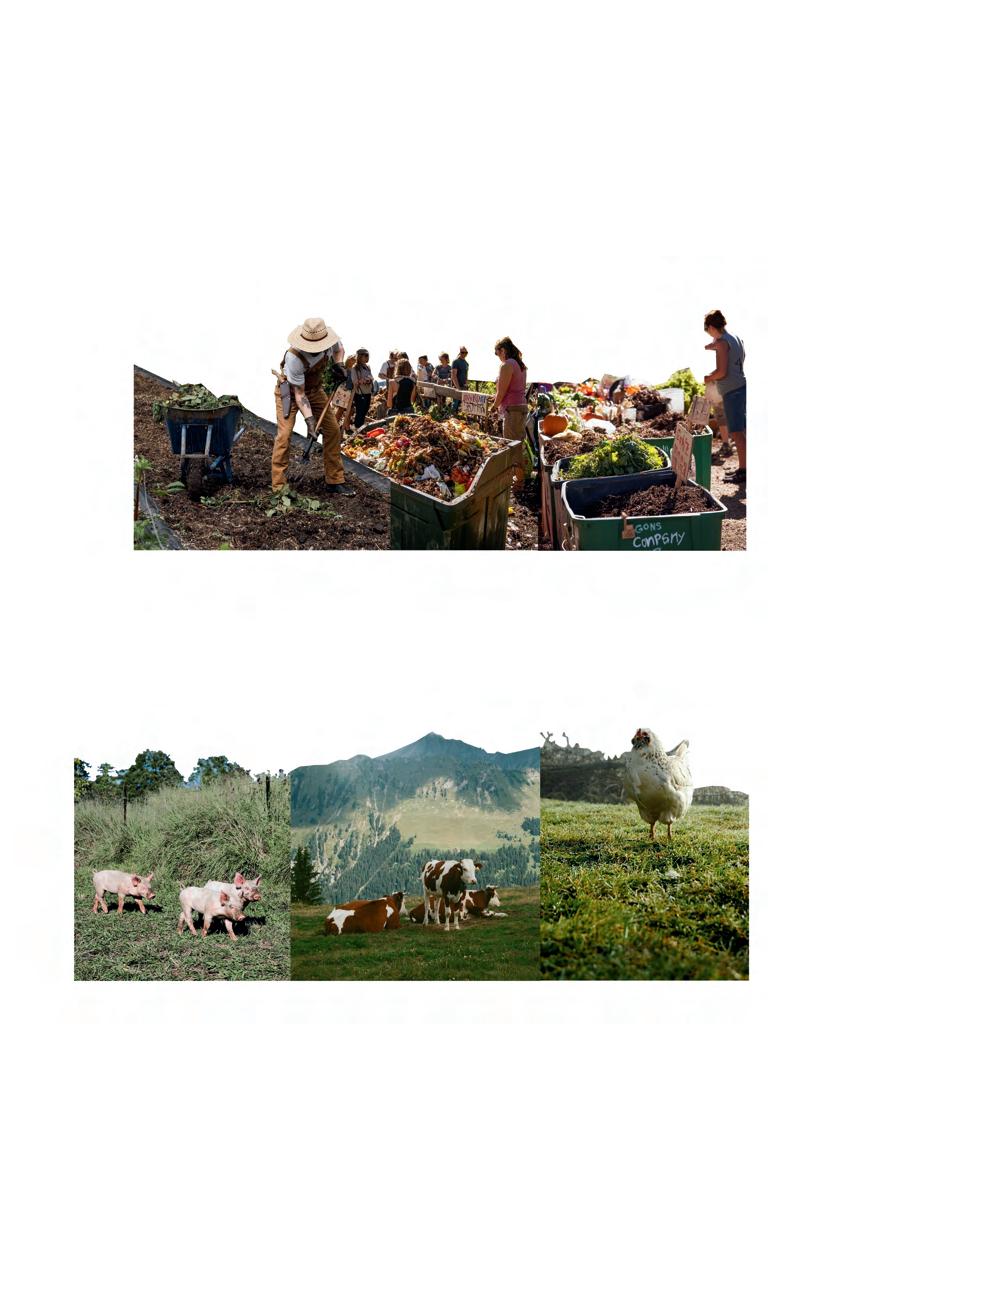
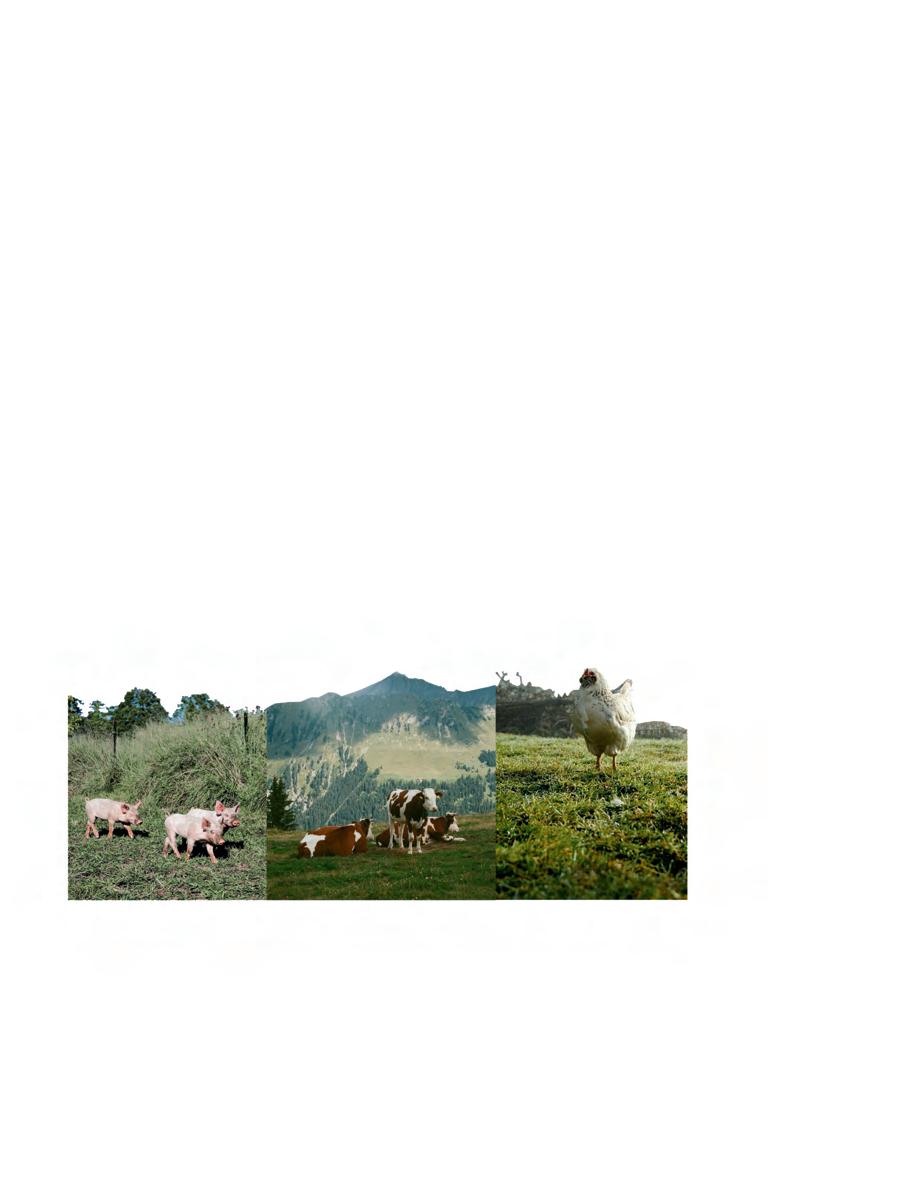
Food waste represents a significant environmental challenge; however, it concomitantly presents opportunities for innovation and economic benefits. By increasing awareness and education on the issue, businesses, producers, retailers, and consumers can implement effective strategies to reduce waste, lower costs, boost profits, and contribute to climate change mitigation. Integrating these solutions into foodscapes, where food production, distribution, and consumption intersect can create more sustainable and efficient food systems.
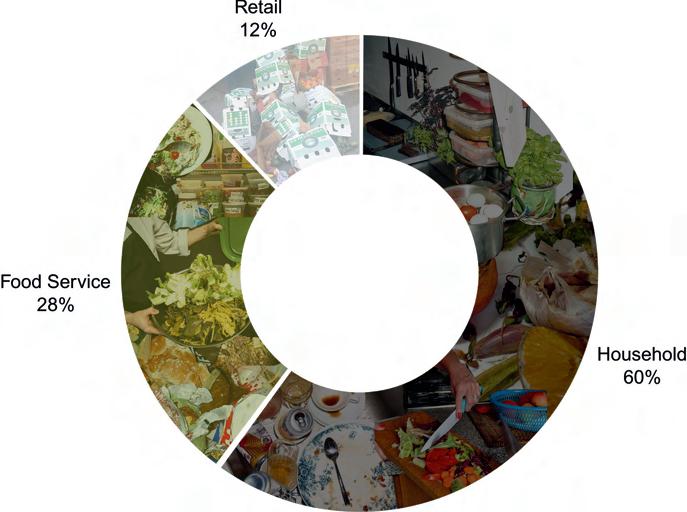
FOOD WASTE
The global estimate of food waste in 2022 was derived from per capita data and United Nations population statistics, although the lack of evidence on manufacturing waste prevented its full inclusion in the report.
The results show that approximately 1.05 billion metric tons of food will be wasted in 2022 across three key sectors: households, foodservice and retail. This equates to an average of 132 kilograms per person per year, with households contributing around 60% of the total waste, followed by foodservice at 28% and retail at 12%.
Figure # . Foodwaste. Collage by Natalia Vega
Programme, U. N. E. (2024, March 1). Food waste index report 2024. think eat save: Tracking progress to halve global food waste.
Tracking Food Storage
Businesses should utilize food waste tracking technology to identify financial losses resulting from wasted food.
Food Rescue System
A web-based platform facilitates the connection between surplus food and local needs, employing volunteers for distribution purposes.
Consumer and Producer Education
Educating the public on the value of food and waste through programs, particularly in educational institutions, raises awareness.
Food handling and processing infrastructure
Prioritize upcycling food (e.g., processing tomatoes into sauce) and enhancing infrastructure for transportation and storage.
Expanding composting alternatives
Local an statewide practices can significantly reduce landfill waste and save costs.
Effective and accessible on-farm storage
Facilities for farmers can reduce post-harvest losses, with potential financial support programs.
Upcycling products
Such as creating insect protein from organic waste, can reduce waste and enhance product value.
Secondary Markets
Farmers can collaborate with businesses offering direct food delivery services to control food production and reduce waste.
Farmers can donate excess produce with legal protections and incentives, helping to provide fresh food to those in need.
Food scraps can be used as animal feed, though methods like insect farming are needed to reduce methane emissions from livestock.
Figure # . Wasteoptions. Collage by Natalia Vega Lewis, J. (2024, March 5). 11 effective solutions for food waste. Earth.Org.
The global food system is marked by significant inequalities, leaving many populations vulnerable to food insecurity, malnutrition, and economic instability. This chapter investigates the factors that contribute to food vulnerability, including economic disparities, climate change, and political influences. We will explore how food access varies across different regions, the challenges of food deserts, and the consequences of an unequal distribution of resources. By understanding these vulnerabilities, we can identify solutions to build more equitable food systems that prioritize resilience and social justice.
Long & healthy life
DIMENSIONS
INDICATORS
- Life expenctancy at birth
DIMENSION INDEX
- Life expenctancy index
Knowledge
Decent standard of living
- Expected years of schooling
- Mean years of schooling - GNI per capita (PPP $)
Education index
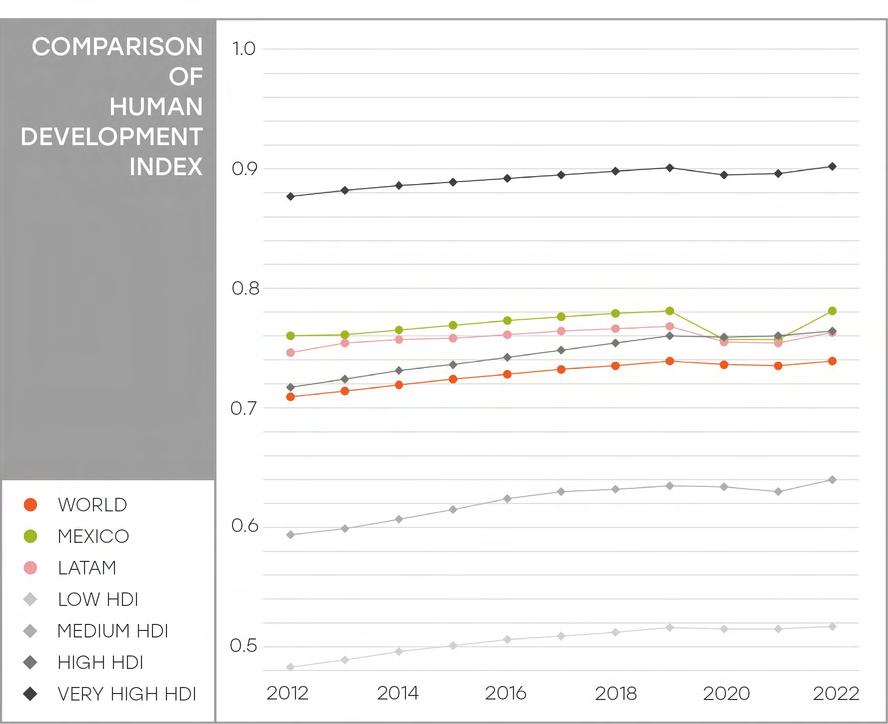
HUMAN DEVELOPMENT INDEX
GNI index
The Human Development Index (HDI) is a measure that evaluates a country’s average achievements in three key areas: health, education, and standard of living. It is calculated using the geometric mean of normalized indices for these dimensions. Health is assessed through life expectancy, education through years of schooling, and standard of living through gross national income (GNI) per capita. The HDI is useful for comparing development outcomes between countries with similar income levels and questioning policy choices. However, it does not account for inequalities, poverty, or empowerment, requiring additional indicators for a more comprehensive analysis.
To understand the context of the quality of life in our study area, it is important to have an overview of the HDI in Mexico and the world in order to understand the situation in Querétaro.
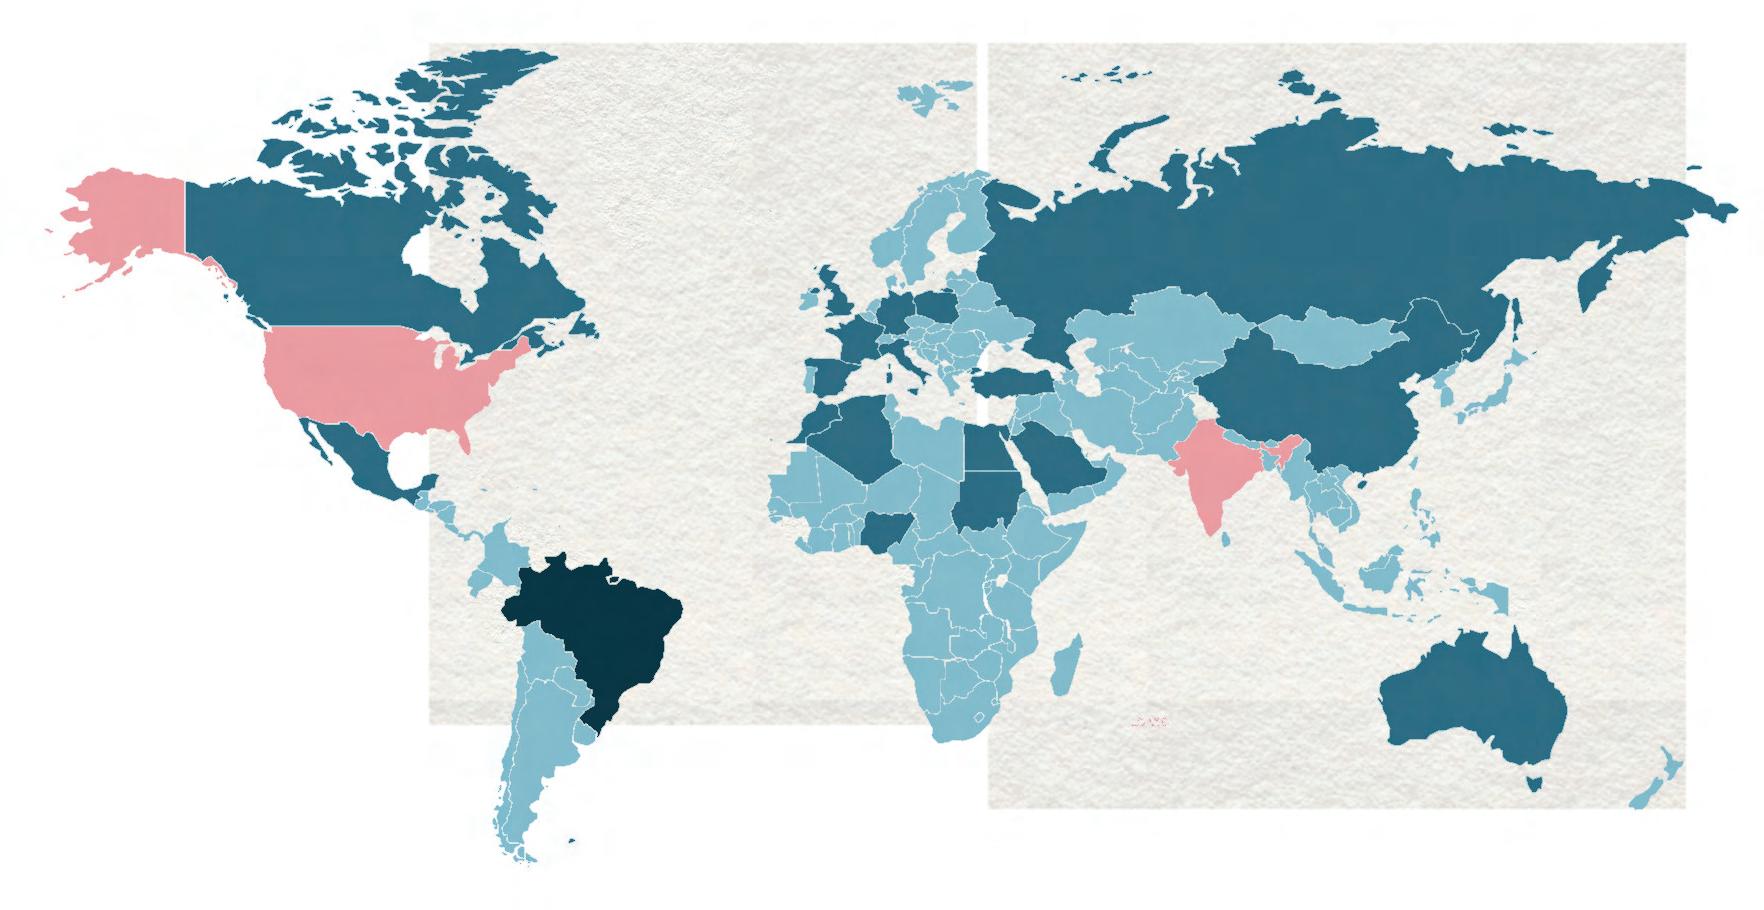
Mexico is ranked 77th in the world HDI ranking (out of 193). It is 8 positions away from reaching a very high level in the HDI (a group that includes countries such as Costa Rica, Uruguay, Argentina and Chile).
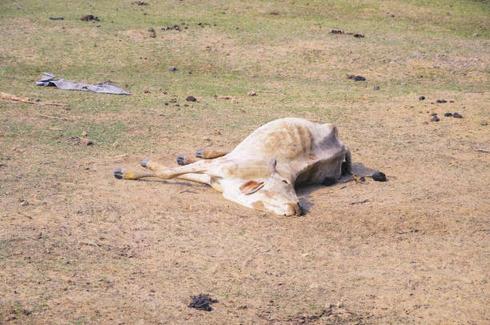
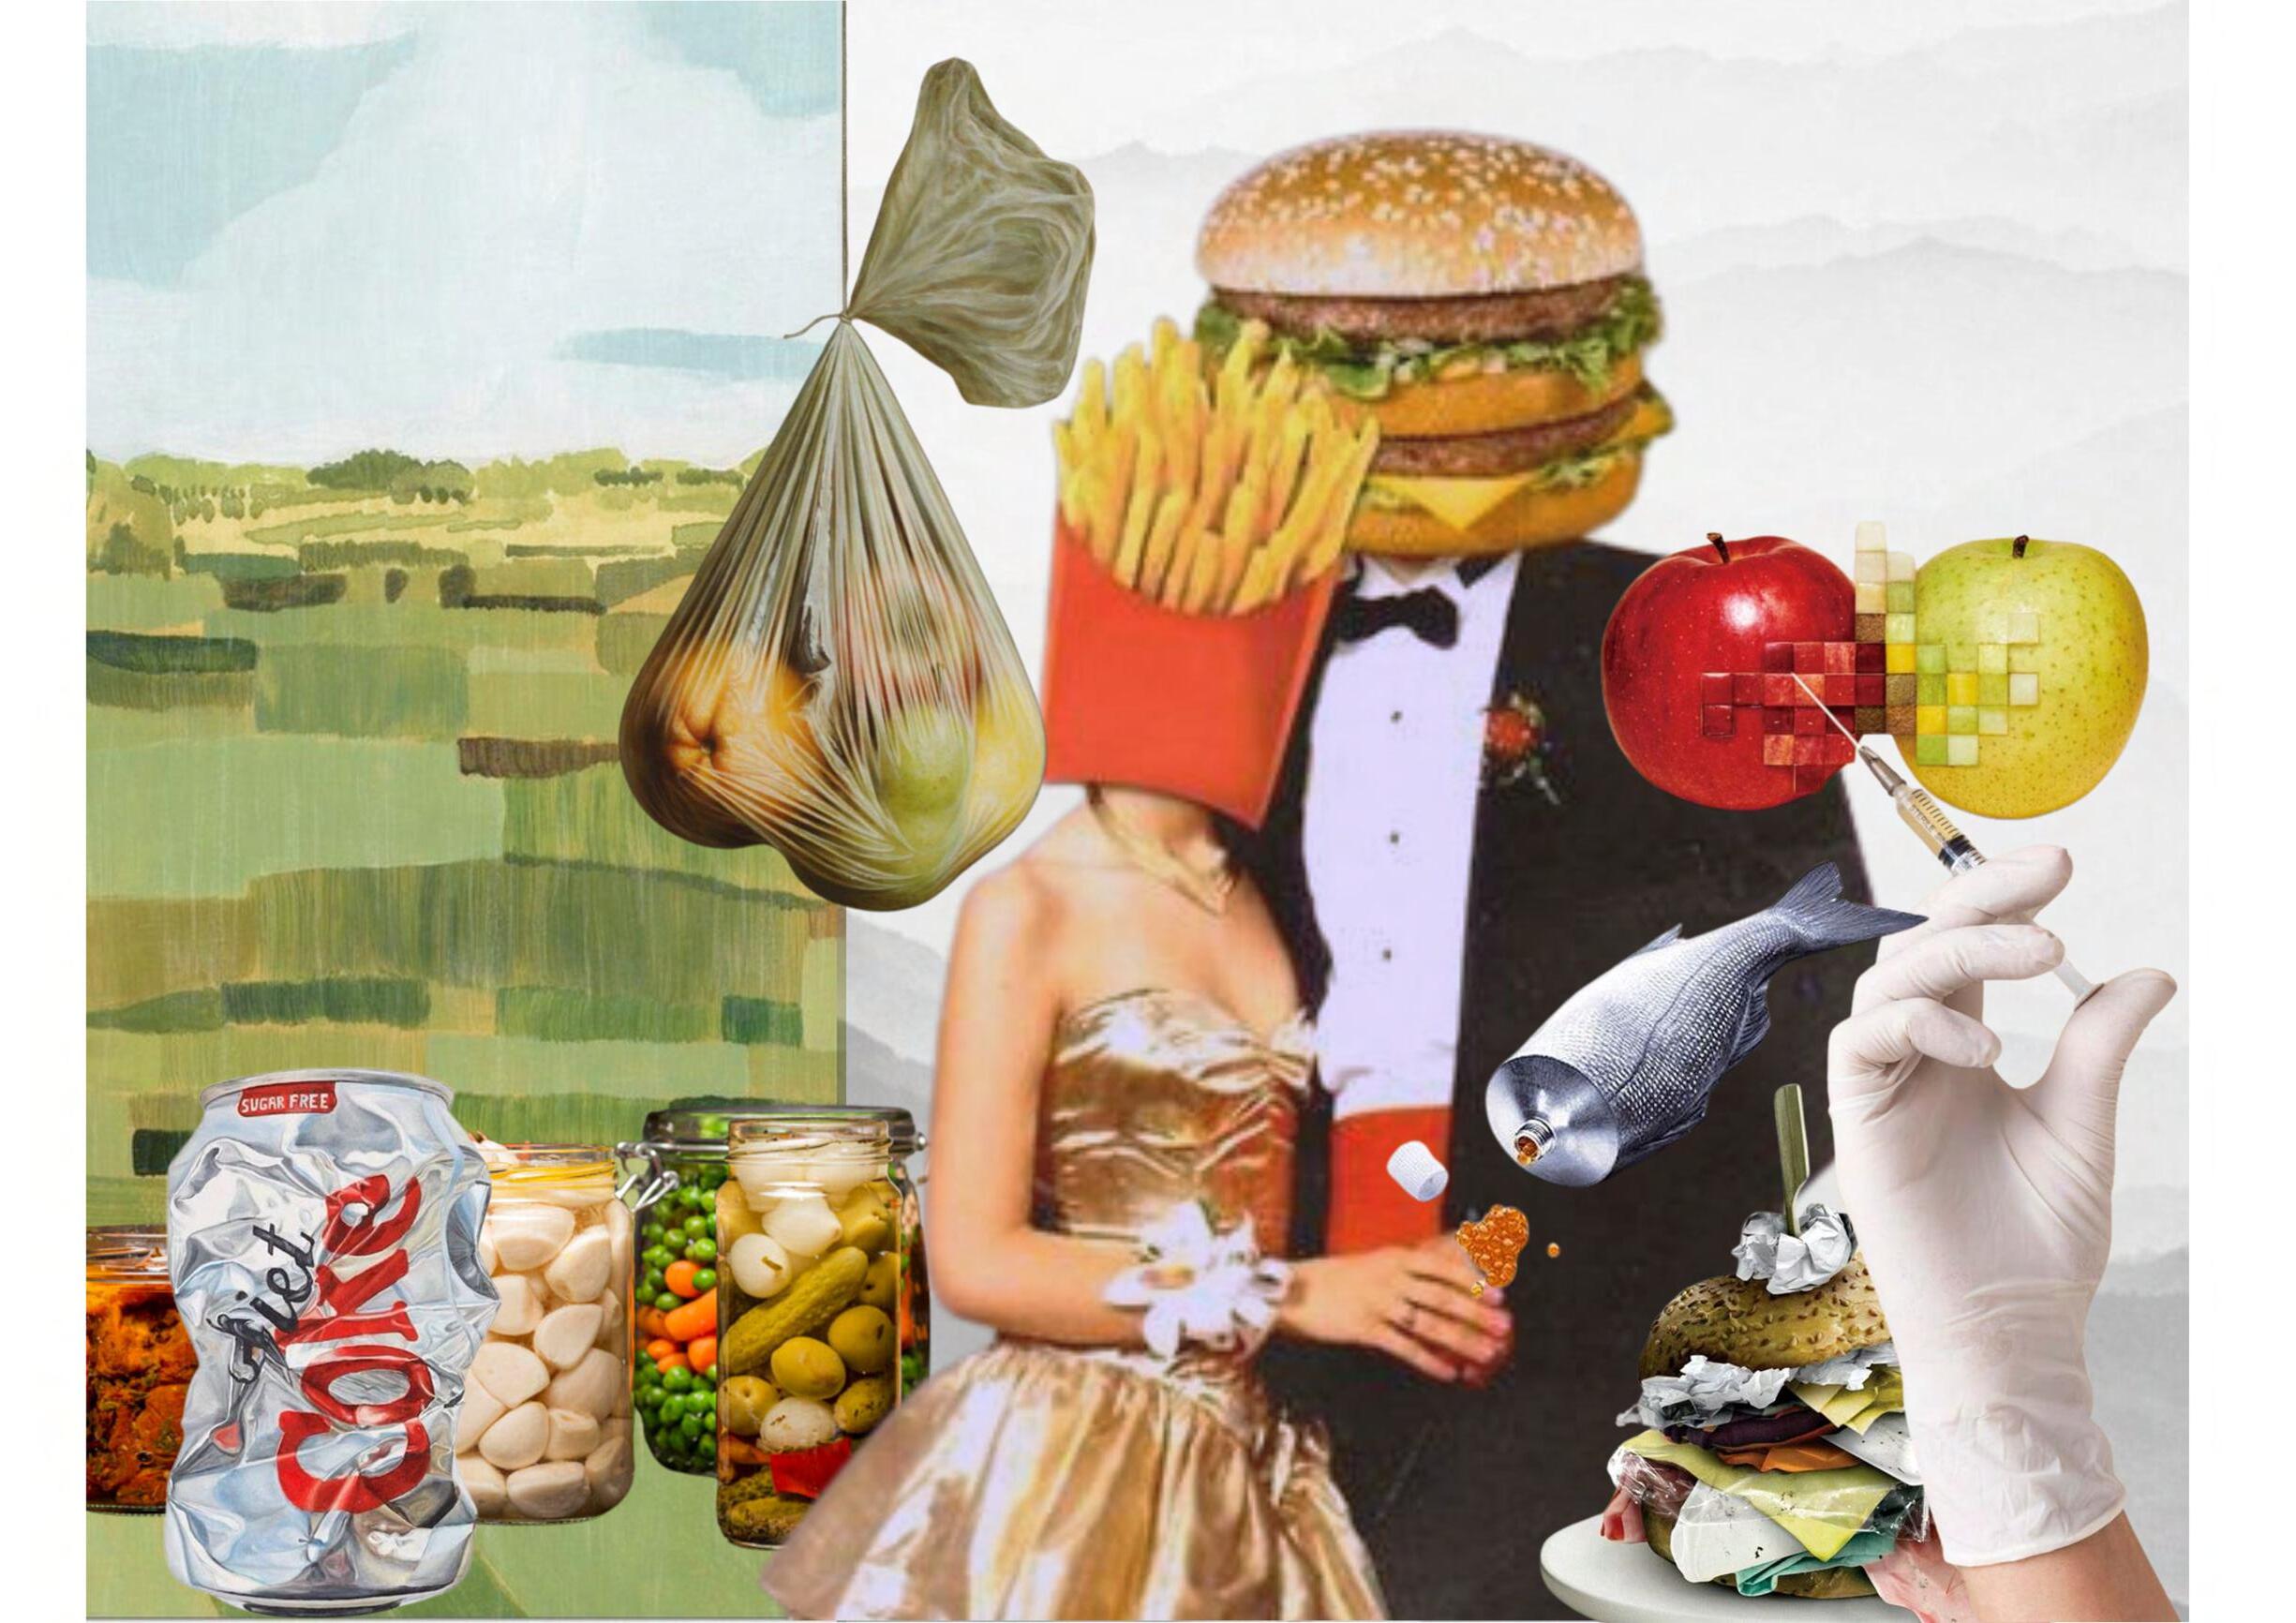
Food consumption is at the heart of human health, cultural identity, and economic stability. However, modern consumption patterns have led to rising health concerns, environmental degradation, and unsustainable demand for resources. In this chapter, we will examine the effects of processed foods, shifting dietary trends, and the growing divide between overconsumption and malnutrition. We will also discuss the role of food policies, education, and consumer awareness in shaping healthier and more sustainable consumption habits. By addressing these challenges, we can move toward a food system that nourishes both people and the planet.
Food is a fundamental component of human health, influencing physical growth, cognitive function, and overall well-being. However, modern food systems has lead to a increasing consumption of processed foods, often high in additives, refined sugars, and unhealthy fats, contributing to health risks. Socioeconomic factors like income, education, and food availability further influence dietary choices, exacerbating global health disparities. While some populations suffer from undernutrition, others are affected by obesity and chronic illnesses such as diabetes and cardiovascular diseases.
Figure # . Malnutrition. Collage by Valentina Bottle
Economic and physical access to food
Food
Food utilization
Stability of the other dimensions over time
Food security is defined when all people, at all times, have physical and economic access to sufficient safe and nutritious food that meets their dietary needs and food preferences for an active and healthy life.
dimensions of Food Security by Valetina Bottle
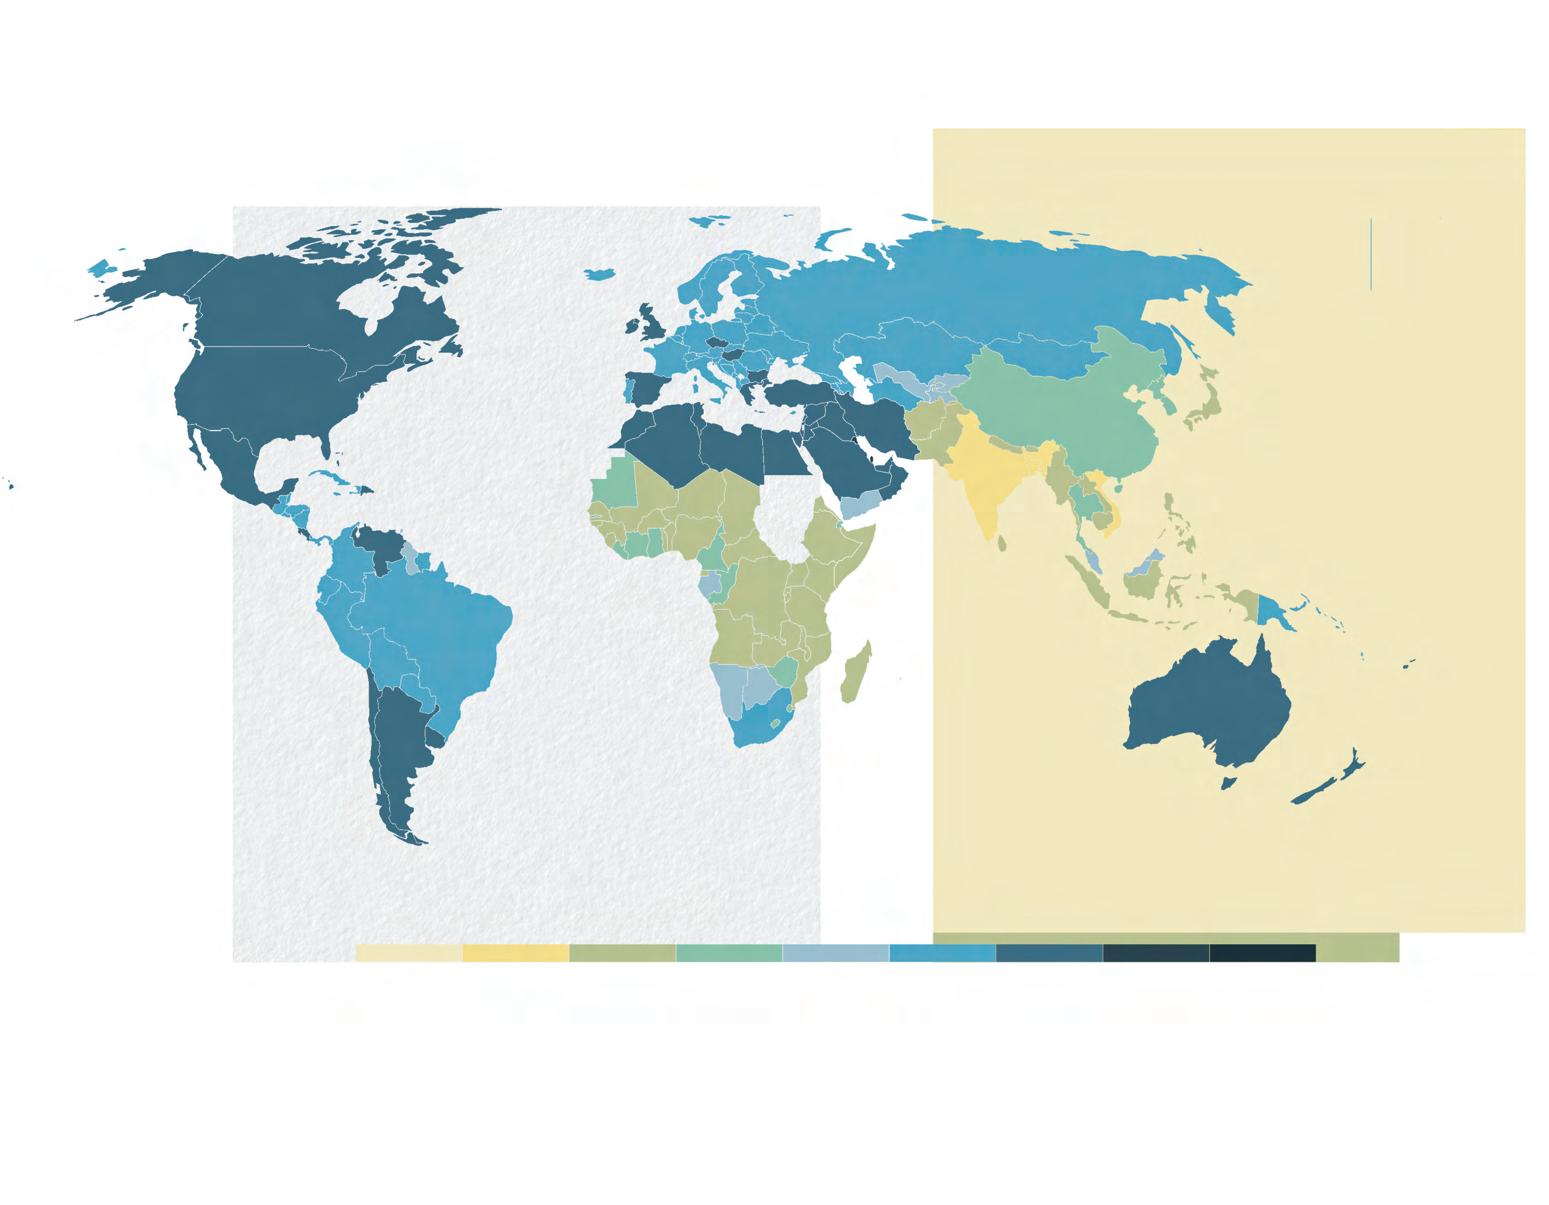
GLOBAL SECURITY FOOD SECURITY SCORES
Map tracking Affordability, Availability, Quality and Safety and Sustainability and Adaptation of food by GFSI.
Map tracking Affordability, Availability, Quality and Safety and Sustainability and Adaptation
ZERO HUNGER END HUNGER, ACHIEVE FOOD SECURITY AND IMPROVED NUTRITION AND PROMOTE SUSTAINABLE AGRICULTURE
ZERO HUNGER GOAL AT RISK
Little to no progress has been made in reducing anemia worldwide since 2000
Prevalence of anemia in woman aged 15 - 49. Around 30% has remained stagnant.
More than 600 million people are projected to face hunger in 2030.
1/3 people worldwide struggle with moderate to severe food insecurity
High food prices continue to plague many nations (21.5% of countries)
Children under age -5 affected by:
Malnutrition persists worldwide, jeopardizing children’s well-being and future development.
STUNTING 148 M - WASTING 45 M - OVERWEIGHT 37 M
Food security remains a critical global issue, with millions facing hunger, undernutrition, and food insecurity. By 2030, over 600 million people are projected to be hungry, while 1 in 3 people currently experience moderate to severe food insecurity. Efforts to combat malnutrition have been slow, particularly in addressing anaemia among women aged 15–49, which has stagnated at 30% since 2000.
In 2023, approximately 281.6 million people in 59 countries faced a food crisis or worse, according to the Global Report on Food Crises (GRFC 2024). Chronic hunger affects 783 million people globally, with the highest rates in Africa and Asia, underscoring the persistent and widespread nature of global food insecurity.
A person’s diet plays a critical role in physical and cognitive development, especially during childhood. Poor nutrition in early life can lead to stunting, cognitive delays, and weakened immunity.
Globally, 21.3% of children experience stunting, and 6.9% suffer from wasting due to insufficient nutrient intake.
Beyond childhood, malnutrition has lifelong consequences, including higher risks of chronic diseases, lower productivity, and economic burdens on healthcare systems. Societies with high levels of food insecurity often experience lower educational performance and reduced workforce efficiency, further perpetuating poverty cycles.
Noncommunicable diseases (NCDs), or chronic diseases, are longlasting conditions caused by genetic, physiological, environmental, and behavioral factors. The main types include cardiovascular diseases (heart attacks, strokes), cancers, chronic respiratory diseases (COPD, asthma), and diabetes. NCDs disproportionately affect low- and middle-income countries, accounting for nearly 75% of global NCD deaths (32 million), with 82% of premature deaths in these regions.
Key metabolic risk factors include unhealthy diets, physical inactivity, high blood pressure, elevated blood glucose, high blood lipids, and obesity. The rise of NCDs threatens poverty reduction efforts, especially in low-income countries, as healthcare costs increase. Vulnerable and disadvantaged populations are more affected due to limited access to health services.
Figure # . Impact of Food Health . Collage by Valentina Bottle
Infographic about Hunger Crisis and the Sustainable Development Goals Report 2023: Special Edition.
THE IMPACT OF FOOD ON HEALTH
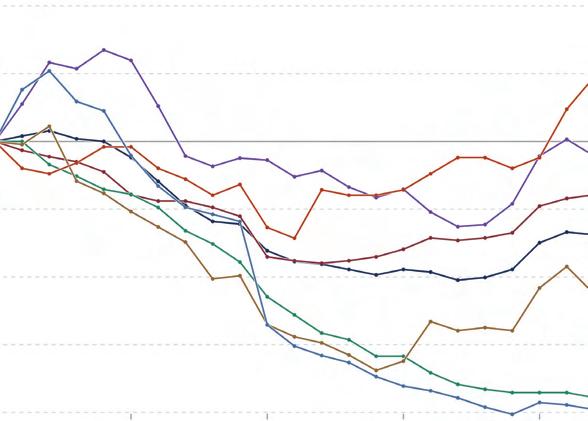
Age-standardized DALY (Disability-Adjusted Life Year) rates per 100,000 individuals from non-communicable diseases (NCDs). One DALY equals one lost year of healthy life.
DALY rates from non-communicable diseases (NCDs), 2020
Age-standardized DALY (Disability-Adjusted Life Year) rates per 100,000 individuals from non-communicable diseases (NCDs). One DALY equals one lost year of healthy life.
Rates of obesity are rising, but still relatively low in debeloping
The world faces a double burden of malnutrition, where undernutrition and obesity coexist, highlighting global nutritional inequalities. In 2022, more than 2.5 billion adults were overweight, including 890 million who were obese, while 390 million were underweight. This paradox stems from inequities in food access - some populations face hunger and nutrient deficiencies, while others consume excessive calorie-dense, ultraprocessed foods that drive obesity and metabolic disease.
Obesity has increased globally, particularly in the Americas, Europe and Oceania, where more than 25% of adults are obese. Widespread availability of inexpensive processed foods and sedentary lifestyles accelerate weight gain and diet-related diseases. Studies, including NIH research, link ultra-processed foods to overeating and weight gain, underscoring the role of the food environment in rising obesity rates.
Diagram illustrating the randomized crossover experiment showing increased energy intake and weight gain during the ultra-processed diet phase compared to the unprocessed diet, despite matched calories and nutrients.
Northern Africa (FAO)
Southern Asia (FAO)
Sub - Saharan Africa (FAO)
World
South America (FAO)
South - eastern Asia (FAO)
Central Asia (FAO)
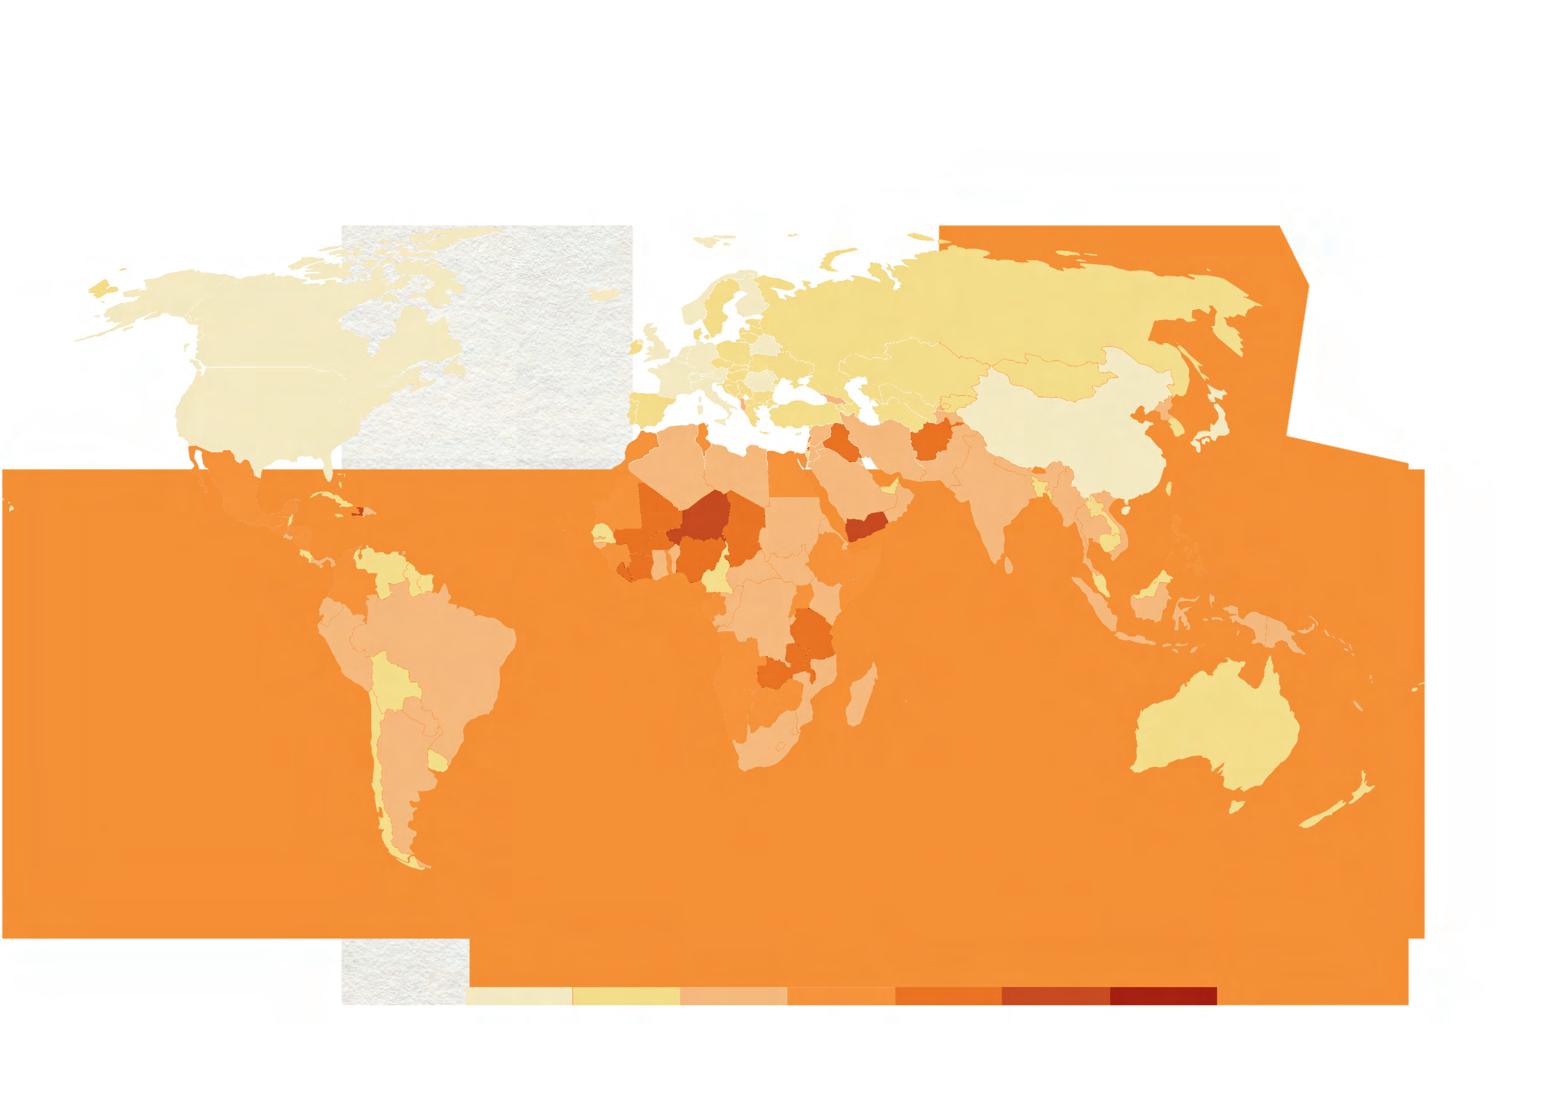
Undernourishment, a key sign of food insecurity, arises from inadequate intake of calories and nutrients, causing stunted growth, weakened immunity, and cognitive issues . Severe forms like marasmus and kwashiorkor are common in regions facing conflict, climate challenges, and economic instability, particularly in SubSaharan Africa and South Asia. While global rates have improved since the 1970s, progress has slowed, and hidden hunger persists when people consume enough calories but lack essential nutrients.
The FAO tracks undernourishment using calorie availability, energy needs, and calorie intake inequality via the Coefficient of Variation (CV).
A high CV indicates uneven food distribution, with some populations overconsuming while many go hungry. In 2020, these inequalities remained significant, especially in low-income regions, underscoring the need for more equitable food access.
Chart with share of the population that is undernourished by Hannah Ritchie, Food and Agriculture
Organization of the United Nations (2023).
South Asia
West and Central Asia
Middle East and North Africa
East and Southern Africa
East Asia and the Pacific Easter Europe and Central Asia
Child malnutrition and childhood diabetes are global health challenges marked by significant disparities. Stunting and wasting impair growth, cognitive development, and immunity, with nearly half of child deaths under five linked to undernutrition, driven by food insecurity and poor sanitation. Childhood diabetes cases are rising globally, with 222,310 new cases in 2021. Although mortality and DALYs have declined due to better care, many regions still face a high disease burden due to healthcare inequities.
From 2019 to 2021, diabetes incidence grew, especially among children aged 5–9 years, with higher rates in young females. Despite improved management, low- and middle-income regions experience greater mortality and disease burden. Projections to 2045 show a slight global decline in incidence but ongoing regional and demographic disparities, underscoring persistent child health challenges.
Figure # Child Development . Collage by Valentina Bottle
The increased consumption of processed foods has led to a rise in the use of food additives, including preservatives, artificial flavors, and sweeteners. While these additives help extend shelf life and enhance taste, they have been linked to negative health effects such as obesity, diabetes, and metabolic disorders.
Certain food preservatives, such as sodium nitrite, have been associated with increased cancer risk, while sulfites can cause allergic reactions. To minimize risks, experts recommend reducing processed food intake and choosing natural preservatives such as salt and vinegar.
Improving global food security and health requires sustainable policies that promote nutritious, minimally processed foods. Governments must invest in local agriculture, regulate ultra-processed food marketing, and implement educational programs to encourage healthy eating habits.
CONCLUSIONS ON FOOD AND HEALTH
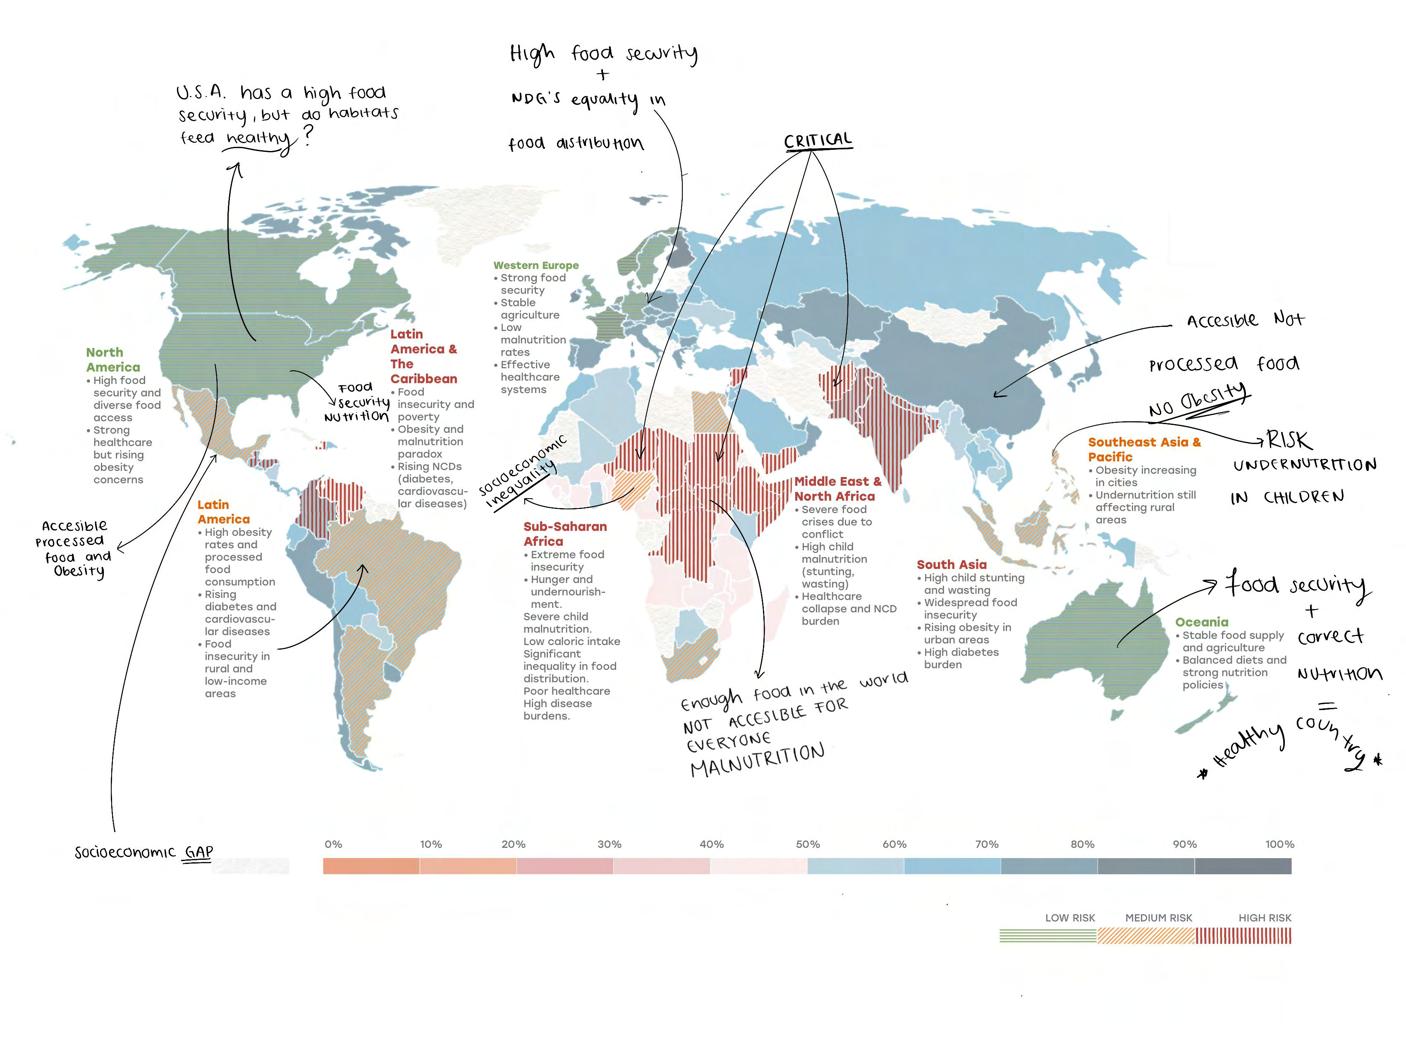
There are significant disparities in food security and health outcomes across different socioeconomic regions. Low-income countries continue to experience severe food insecurity, leading to undernourishment, child stunting, and developmental challenges that impact longterm economic growth. In middle-income nations, there is a double burden of malnutrition, where undernutrition persists alongside a rise in obesity and non-communicable diseases (NCDs) due to increased consumption of processed foods. High-income countries, while having lower levels of food insecurity, face rising obesity rates and health risks associated with ultra-processed food consumption. Additionally, childhood malnutrition in countries such as India, Nigeria, and the Democratic Republic of Congo poses long-term consequences for workforce productivity and national development.
The research also highlights a global paradox where obesity and undernutrition coexist, affecting different populations in varying ways. In Africa and South Asia, undernutrition remains a dominant issue, leading to weakened immune systems and cognitive delays, whereas Latin America and the Middle East experience an increase in obesity despite ongoing food insecurity. North America and Europe struggle with high rates of obesity and diet-related illnesses due to the widespread consumption of processed and energy-dense foods. Furthermore, NCDs, once considered diseases of affluence, are now rapidly increasing in developing nations such as India, Brazil, Mexico, and Egypt, largely due to dietary shifts toward processed foods. The rise in ultra-processed food consumption globally is contributing to obesity, metabolic disorders, and long-term health risks, marking a shift in the global food crisis from scarcity to the impact of poor-quality diets.
Concluding Map of Food Security and its impact on Human Health according to socioeconomic factors. Created by author.
Food environments consist of various opportunities, conditions, and factors, such as physical, economic, political, and socio cultural elements that shape the relationship between people and the food system,
The distance food travels from where it is grown or raised to where it is
Community with easy access to affordable, nutritious food, and many grocery stores.
Food Oasis
Food Desert
Underserved areas with limited access to healthy and affordable food. On the other hand, food oases are areas with ample access to nutritious foods. Lastly, food swamps are locations where food is abundant, but the available options are typically high-calorie, unhealthy choices that overshadow healthier alternatives.
Food Swamps
Neighborhood where unhealthy food options, like fast food and convenience stores, outnumber access to fresh and nutritious foods.
Urban Food Landscapes
Spaces where food is produced, sold, and consumed in cities, including markets, restaurants, and gardens.
Figure # . Food Definitions. Collage by Ivanna de la Torre
Figure # . Food Comparisons . Collage by Ivanna de la Torre
Physical Geography
Food production is based on diverse geographic characteristics, including soil composition, climate, terrain, land cover, access to fresh water, and seabed conditions.
Managment patterns
Methods farmers use to grow food, such as irrigation systems, tillage, and nutrient management.
Socioeconomic Influences
A broader perspective on the food system that considers market dynamics, distribution barriers, government policies, and the influence of local communities and cultures.
Figure # . FoodscapeLayers. Collage by Natalia Vega
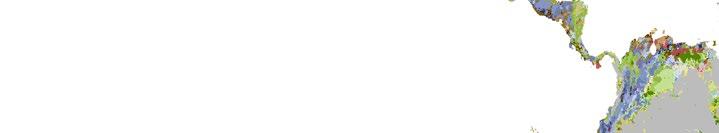
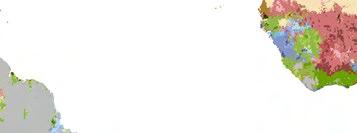
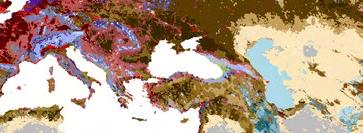
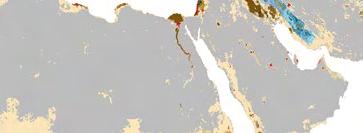
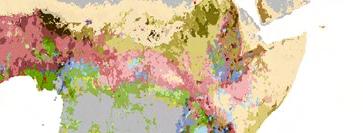
Figure 1. Map of global foodscapes. Taken from Bossio et al. (2021, pp. 9-10, 98). Retrieved from https://www.nature.org/content/dam/tnc/nature/en/documents/TNC_FoodscapesReport.pdf
Over 80 unique foodscape classes shaped by biogeographic and sociocultural factors.
AREAS WITH LITTLE OR ONLY SUBSISTENCE FOOD PRODUCTION
ENTISOLS ON PLAINS WITH BARE LAND, LITTLE FOOD PRODUCTION AND GRASS COVER
ENTISOLS ON PLAINS WITH GRAZED BARE LAND AND GRASS COVER
ENTISOLS ON PLAINS WITH BARE LAND AND SCATTERED MIXED CROP PRODUCTION AND LOW NUTRIENT APPLICATION RATE
ENTISOLS ON DRY PLAINS AND LARGE CULTIVATED FIELDS AND LIVESTOCK
ENTISOLS ON DRY RAINFED PLAINS WITH LEGUMES AND PULSES PRODUCTION AND OCCASIONALLY OTHER CROPS
ENTISOLS ON DRY PLAINS AND BARE LAND WITH MIXED IRRIGATED CROP PRODUCTION
ENTISOLS ON DRY PLAINS AND BARE LAND WITH IRRIGATED VEGETABLE PRODUCTION AND HIGH NUTRIENT APPLICATION RATES
INCEPTISOLS ON HUMID HILLY TREE-COVERED LAND WITH SCATTERED CROP PRODUCTION
INCEPTISOLS ON HUMID MOUNTAINOUS LAND WITH TREE COVER AND SCATTERED MIXED CROP PRODUCTION
INCEPTISOLS ON HUMID HILLY-MOUNTAINS WITH TREE COVER AND SMALL FARMED MIXED AND INTENSIVE DIVERSE PRODUCTION
INCEPTISOLS ON HUMID FORESTED HILLS WITH INTENSIVE MIXED CROP PRODUCTION AND GRAZING
INCEPTISOLS ON HUMID HILLY MIXED TREE-COVERED LAND WITH RAINFED PERENNIAL CROPS AND OTHER LIVESTOCK
MIXED RAINFED HIGHLY PRODUCTIVE LAND WITH AGROFORESTRY AND DIVERSE CROPS
INCEPTISOLS ON HUMID LAND WITH INTENSIVE MIXED PERENNIAL TREE CROPS AND NON-RUMINANT GRAZING
INCEPTISOLS ON HUMID HILLY LAND WITH INTENSIVE MIXED LIVESTOCK AND OTHER CROPS GROWN WITH HIGH NUTRIENT APPLICATION RATES
MIXED URBAN AND PERI-URBAN AREAS WITH SOME AGRICULTURE AND LIVESTOCK
PERI-URBAN AREAS WITH MARGINAL AGRICULTURE AND LIVESTOCK
PERI-URBAN AREA INTERSPERSED WITH INTENSIVE IRRIGATED AGRICULTURE AND LIVESTOCK
OXISOLS ON HUMID TREE-COVERED LAND WITH LITTLE FOOD PRODUCTION
OXISOLS AND ULTISOLS ON HUMID TREE-COVERED LAND WITH SCATTERED CROPLAND AND LIVESTOCK
OXISOLS AND ULTISOLS ON HUMID HILLY TREE-COVERED LAND WITH AGROFORESTRY AND SOME LIVESTOCK
OXISOLS AND ULTISOLS ON HUMID TREE-COVERED LAND WITH DIVERSE SMALL FIELD PRODUCTION AND AGROFORESTRY
OXISOLS AND ULTISOLS WITH RAINFED PERENNIAL CROPS AND AGROFORESTRY AND SOME LIVESTOCK
OXISOLS AND ULTISOLS WITH MIXED GRAZING AND CROP PRODUCTION ON LARGE FIELDS
OXISOLS AND ULTISOLS WITH RAINFED PERENNIAL CROPS AND AGROFORESTRY AND HIGH NUTRIENT RATES AND LIVESTOCK
OXISOLS AND ULTISOLS ON LAND WITH HUMID RAINFED AND IRRIGATED PERENNIAL PRODUCTION AND OTHER MIXED CROPS AND LIVESTOCK
OXISOLS AND ULTISOLS ON HUMID IRRIGATED INTENSIVE PERENNIAL PRODUCTION AND OTHER MIXED CROPS AND LIVESTOCK
ULTISOLS ON HUMID TREE-COVERED LAND WITH LITTLE CROP PRODUCTION
ULTISOLS ON HUMID TREE-COVERED LAND WITH SCATTERED CROP PRODUCTION
ULTISOLS ON HUMID TREE-COVERED LAND WITH SCATTERED CROP PRODUCTION ON LARGE FIELDS
ULTISOLS ON HUMID TREE-COVERED LAND WITH DIVERSE CROP PRODUCTION
ULTISOLS ON HILLY AND MOUNTAINOUS TREE-COVERED LAND WITH DIVERSE CROP PRODUCTION AND HIGH NUTRIENT APPLICATION RATES
ULTISOLS WITH MIXED CROP AND LIVESTOCK PRODUCTION AND HIGH NUTRIENT APPLICATION RATES
ULTISOLS ON HUMID TREE-COVERED LAND WITH DIVERSE CROP PRODUCTION AND SOME LIVESTOCK
ULTISOLS WITH MIXED CROPS INCLUDING PERENNIALS AND LIVESTOCK PRODUCTION
ULTISOLS WITH INTENSIVELY CULTIVATED RAINFED AND IRRIGATED MIXED CROP AND LIVESTOCK PRODUCTION
ULTISOLS WITH INTENSIVELY CULTIVATED RAINFED AND IRRIGATED MIXED CROP AND LIVESTOCK PRODUCTION AND HIGH NUTRIENT APPLICATION RATES
ALFISOLS IN PLAINS AND GRASSLANDS WITH LITTLE CROP PRODUCTION AND GRAZING
ALFISOLS IN SHRUBBY PLAINS THAT ARE GRAZED WITH SCATTERED CROPLAND
ALFISOLS IN MIXED FOOD PRODUCTION LANDSCAPES WITH SCATTERED GRAZING
ALFISOLS IN MIXED DIVERSE CROP SYSTEMS ON SMALL FIELDS WITH SOME LIVESTOCK AND AGROFORESTRY AND LOW NUTRIENT APPLICATION RATES
ALFISOLS WITH MIXED CROP PRODUCTION, SOME RUMINANTS, AND HIGHER NUTRIENT APPLICATION RATES
ALFISOLS WITH RAINFED CROP PRODUCTION ON LARGE FIELDS WITH SOME LIVESTOCK
ALFISOLS WITH RAINFED DIVERSE CROP PRODUCTION WITH SOME LIVESTOCK
ALFISOLS WITH IRRIGATED INTENSIVE MIXED CROP PRODUCTION AND RUMINANTS
ALFISOLS WITH MIXED IRRIGATED INTENSIVE CEREAL PRODUCTION AND LIVESTOCK WITH HIGH NUTRIENT APPLICATION RATES
ALFISOLS WITH RAINFED INTENSIVE CEREAL PRODUCTION AND LIVESTOCK WITH HIGH NUTRIENT APPLICATION RATES
ANDISOLS ON BARE LAND WITH LITTLE CROP PRODUCTION
ANDISOLS ON HILLY LAND WITH LITTLE CROP PRODUCTION
ANDISOLS ON HILLY AND MOUNTAINOUS LAND WITH SPARSE CROP PRODUCTION AND RUMINANTS
ANDISOLS ON HILLY TREE AND SHRUB LAND WITH SCATTERED CROP PRODUCTION
HISTOSOLS AND SPODOSOLS ON WET MOUNTAINOUS LAND WITH LITTLE CROP PRODUCTION
SPODOSOLS ON HILLY TREE-COVERED LAND WITH SCATTERED CROP PRODUCTION
HISTOSOLS AND SPODOSOLS WITH RAINFED MIXED CROP PRODUCTION AND LIVESTOCK INCLUDING RUMINANTS
HISTOSOLS AND SPODOSOLS IN TREE-COVERED LANDSCAPES WITH SCATTERED CROP PRODUCTION ON LARGE FIELDS
HISTOSOLS AND SPODOSOLS ON MOUNTAINOUS LAND WITH GRAZING AND INTERSPERSED FOOD PRODUCTION
HISTOSOLS AND SPODOSOLS ON HILLY TREE-COVERED LAND GRAZED AND CULTIVATED WITH HIGH NUTRIENT APPLICATION RATE
HISTOSOLS AND SPODOSOLS ON INTENSIVELY CULTIVATED LAND WITH HIGH LIVESTOCK PRODUCTION
SPODOSOLS ON INTENSIVELY CULTIVATED LAND HIGH LIVESTOCK PRODUCTION AND NUTRIENT APPLICATION RATE
MOLLISOLS IN MOUNTAINOUS BARE AREAS WITH LITTLE CROP PRODUCTION AND GRAZING
MOLLISOLS IN MOUNTAINOUS-HILLY AREAS WITH LOW DENSITY LIVESTOCK GRAZING AND SCATTERED CROP PRODUCTION
MOLLISOLS IN MOUNTAINOUS-HILLY CULTIVATED LAND WITH GRAZING RUMINANTS AND RAINFED MIXED CROPS
MOLLISOLS IN HILLY CONVENTIONALLY TILLAGED CULTIVATED LAND WITH INTERSPERSED GRAZING
MOLLISOLS AND INCEPTISOLS IN PLAINS WITH IRRIGATED INTENSIVE CROP PRODUCTION
MOLLISOLS IN PLAINS WITH INTENSIVE IRRIGATED CEREAL AND OIL CROP PRODUCTION AND HIGH NUTRIENT APPLICATION RATES
MOLLISOLS IN INTENSIVE RAINFED CEREAL AND OIL CROP PRODUCING LAND WITH HIGH NUTRIENT APPLICATION RATES
MOLLISOLS IN PLAINS WITH INTENSIVE RAINFED LARGE FIELD WITH CEREAL AND OIL CROP PRODUCTION
MOLLISOLS IN PLAINS WITH INTENSIVE RAINFED CEREAL AND OIL CROP PRODUCING LAND THAT IS SINGLE CROPPED
VERTISOLS IN PLAINS WITH GRAZED SHRUBBY LAND AND SCATTERED MIXED CROP PRODUCTION
VERTISOLS IN PLAINS DIVERSELY CULTIVATED LAND AND INTERSPERSED GRAZING
VERTISOLS IN PLAINS WITH MIXED CROP AND LIVESTOCK PRODUCTION
VERTISOLS IN PLAINS WITH MIXED IRRIGATED AND RAINFED PRODUCTION WITH MIXED CROP PRODUCTION
VERTISOLS IN PLAINS WITH RAINFED INTENSIVELY CULTIVATED LAND WITH MIXED PRODUCTION AND SPARSE GRAZING
VERTISOLS IN PLAINS WITH LARGER INTENSIVELY CULTIVATED FIELDS WITH REDUCED TILLAGE
INCEPTISOLS ON BARE GRASSY LAND WITH SCATTERED GRAZING
INCEPTISOLS ON MIXED FOREST AND GRASSLAND
INCEPTISOLS IN HILLY GRASSY LAND WITH SCATTERED GRAZING AND MARGINAL CROP PRODUCTION
INCEPTISOLS IN MOUNTAINOUS BARE LAND WITH SMALL FIELDS AND TRADITIONAL TILLAGE
INCEPTISOLS IN FORESTED LAND WITH FEW SCATTERED LARGE FARMS AND LOW CROP DIVERSITY
INCEPTISOLS IN HILLY LAND WITH MIXED PRODUCTION OF CONVENTIONAL TILLAGE AND HIGH NUTRIENT APPLICATION
INCEPTISOLS IN ARID HILLY LAND WITH RAINFED CEREAL AND LEGUME PRODUCTION AND OTHER LIVESTOCK
INCEPTISOLS IN HILLS AND MOUNTAINS WITH IRRIGATED INTENSIVE MIXED CROP PRODUCTION
INCEPTISOLS IN HILLY SHRUBLAND WITH IRRIGATED INTENSIVE MIXED CROP PRODUCTION AND HIGH NUTRIENT APPLICATION
MAP KEY
These indicators, provided by The Nature Conservancy, serve to differentiate various types of foodscapes, offering insights into how food systems interact with nature. By analyzing these factors, we can better understand the dynamics of food production and consumption, enabling the development of more sustainable solutions that nourish the world while safeguarding the environment.
Environmental Factors – Biodiversity, emissions, soil carbon, water management.
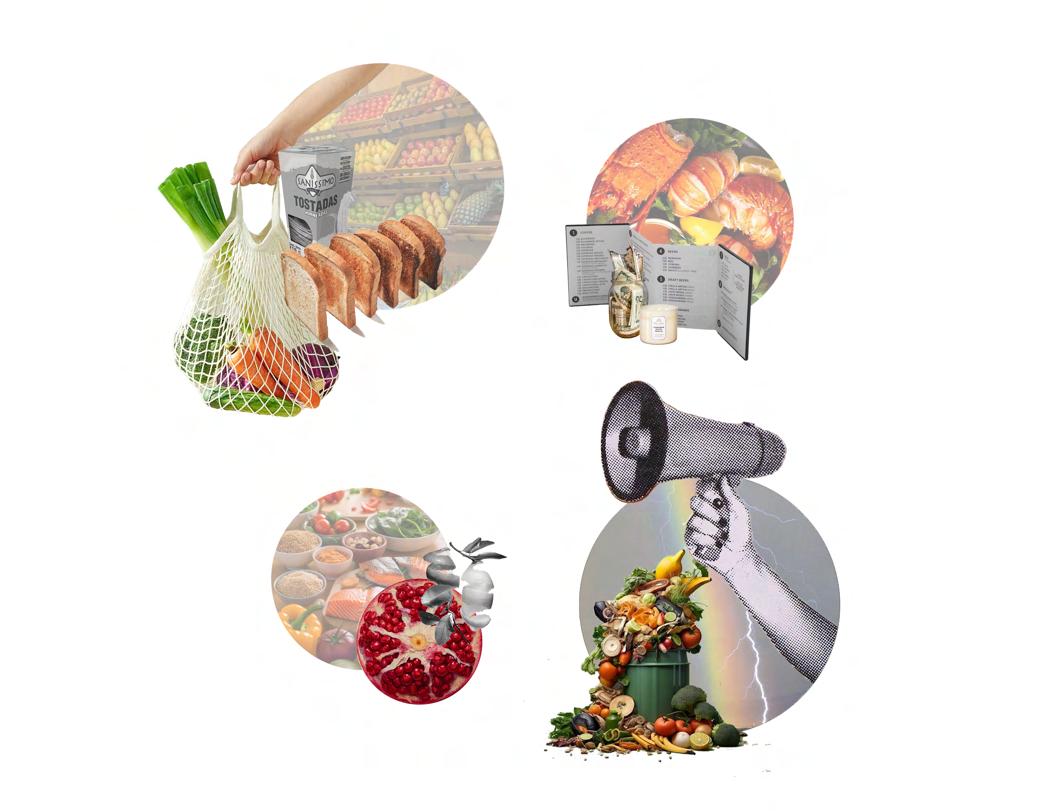
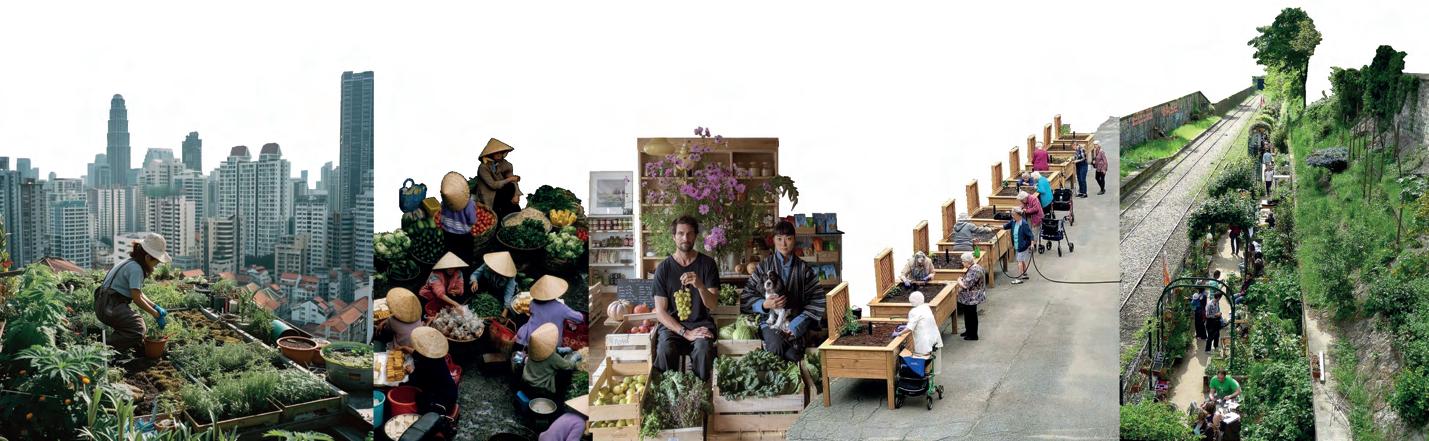
Case Studies
HIGH-TECH RURAL GROCERY SHOPS
HIGH-TECH RURAL GROCERY SHOPS
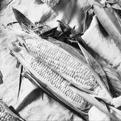
SIERRA MIXE CORN
SIERRA MIXE CORN BIOACTIVE TOTONTEPEC, OAXACA, MEXICO
TOTONTEPEC, OAXACA, MEXICO
STOCKHOLM, SWEDEN STUTTGART, STOCKHOLM, SWEDEN
small shops fully automated, with no staff attending the point of sale, open 24 hours a day in regions without small groceries
SMALL SHOPS FULLY AUTOMATED, WITH NO STAFF ATTENDING THE POINT OF SALE, OPEN 24 HOURS A DAY IN REGIONS WITHOUT SMALL GROCERIES
sierra mixe corn, grown in mexico, secretes nitrogen from its roots through bacteria, offering ecological benefits by reducing fertilizer use and water contamination
SIERRA MIXE CORN, GROWN IN MEXICO, SECRETES NITROGEN FROM ITS ROOTS THROUGH BACTERIA, OFFERING ECOLOGICAL BENEFITS BY REDUCING FERTILIZER USE AND WATER CONTAMINATION
A NEW PACKAGING CHARACTERISTICS
BIOACTIVE PAPER
BIOACTIVE PAPER
20.606 LAW
20.606 LAW
STUTTGART, GERMANY
STUTTGART, GERMANY
a new packaging for transporting food and preserving its characteristics
A NEW PACKAGING FOR TRANSPORTING FOOD AND PRESERVING ITS CHARACTERISTICS
SANTIAGO DE CHILE, CHILE
SANTIAGO DE CHILE, CHILE
In conclusion, our research highlighted various global fooduncovering fascinating case studies on the origins of food labeling and its introduction to the world. We also found that grocery stores are not always fully accessible provide nearby healthy alternative solutions like certain households a
chile’s labelling law has become a global model for food consumer protection
CHILE’S LABELLING LAW HAS BECOME A GLOBAL MODEL FOR FOOD ONSUMER PROTECTION
dditionally, innovative approaches in some German companies, such as the use of bioactive paper, demonstrate environmental pollution. These findings emphasize the ongoing challenges and creative solutions the food industry, accessibility, and sustainability.
The battle across these foodscapes involves finding ways to balance sustainability, efficiency, and socioeconomic viability. Each innovation seeks to address waste reduction, resource optimization, and the promotion of healthier practices, but they all face challenges of scalability, cost-effectiveness, and industry resistance. What they achieve collectively is the demonstration that innovative, eco-friendly approaches can reshape agricultural and food systems, but their true potential hinges on overcoming the hurdles of large-scale implementation and regulatory support.
URBAN
Underutilized spaces are transformed into urban gardens, local markets, and food corridors, significantly reducing the time required for food transportation and introducing green landscapes to the urban environment.
ENVIRONMENT
Foodscapes are essential to counteract today's environmental problems It increases biodiversity, improves air and water quality and helps reduce the carbon footprint. Leading to more sustainable resource management and a resilient urban environment.
SOCIAL
Foodscapes represent a necessary change in today's urban lifestyle They create community spaces that promote social encounters and raise awareness of sustainable practices, encouraging engagement with their communities.
HEALTH
Urban agriculture improves access to fresh, nutritious food, reduces food deserts, helps prevent diet-related diseases and facilitates maintaining a healthy diet
ECONOMIC
Urban agriculture supports job creation in local food production, distribution, and sales while promoting affordable prices and a circular economy through organic waste reuse.
Foodscapes and urban agriculture respond to different environmental issues related to the food industry, climate change and soil erosion. We can see positive impacts on the following areas.
This section explores the socioeconomic impact of food, examining how accessibility, affordability, and industry practices affect communities. To fully understand foodscapes, we analyze the health and environmental consequences of food production and consumption, from nutritional disparities to sustainability challenges.
The global food system has evolved into a complex network shaping the way food is produced, distributed, and consumed. While technological advancements and industrialization have allowed humanity to sustain a rapidly growing population, they have also introduced significant challenges related to environmental degradation, economic inequality, and public health crises. Foodscapes, the spaces and systems that define our relationship with food, have become a battleground where hunger coexists with excessive waste, and undernutrition persists alongside obesity. Without urgent reforms, the ability to sustainably nourish a global population projected to reach 9.7 billion by 2050 will be increasingly compromised.
One of the most pressing concerns in today’s food system is its environmental impact. Agriculture now occupies 50% of the world’s habitable land use, contributes to 26% of global greenhouse gas emissions, and is responsible for 70% of global freshwater withdrawals. While industrial farming has significantly increased food production, it has also led to 33% of global soil degradation, threatening long-term agricultural sustainability. Additionally, livestock production alone accounts for 94% of global mammal biomass, demonstrating the vast ecological footprint of meat production. These alarming statistics highlight the urgent need to shift towards regenerative agricultural practices, improved land management, and a drastic reduction of food waste, which currently surpasses 1.05 billion metric tons annually, equivalent to 132kg per person per year.
Ironically, despite producing enough food to feed 10 billion people, 780 million individuals still suffer from hunger, and projections indicate that 2 billion could experience food insecurity by 2050. This paradox is not due to food scarcity but inequitable distribution, economic barriers, and inefficiencies in global supply chains. The Green Revolution, while increasing crop yields and preventing famines, also contributed to soil depletion, water shortages, and widened economic disparities, favoring large-scale agribusiness while marginalizing small farmers. Today, government policies and corporate dominance continue to deepen food injustices, prioritizing profits over access to affordable, nutritious food.
The consequences of food insecurity extend beyond hunger, as the world now faces a double burden of malnutrition. 783 million people suffer from chronic hunger, with 21.3% of children experiencing stunted growth due to nutrient deficiencies. Meanwhile, over 2.5 billion adults are overweight, including 890 million classified as obese. The widespread consumption of ultra-processed foods, high in sugar, salt, and unhealthy fats, has contributed to rising rates of diabetes, cardiovascular diseases, and metabolic disorders, particularly in middle-income nations. This crisis is not merely a result of personal choices but is deeply shaped by food environments, where unhealthy, calorie-dense options are often more accessible and affordable than fresh, nutrient-rich foods.
Another critical issue threatening food security is water scarcity. Agriculture consumes 72% of the world’s freshwater, with certain foods, such as beef, requiring an astonishing 15,000 liters of water per kilogram. As 2.4 billion people already live in water-stressed regions, unsustainable irrigation practices pose a severe risk to future food production. The document also explores case studies of innovative food sustainability solutions, demonstrating how localized efforts can contribute to broader global change.
To address the failures of the global food system, urgent action is needed in several key areas. First, reducing food waste through better storage, distribution, and donation programs can help bridge the gap between food abundance and hunger. Second, reforming industrial agriculture by investing in regenerative farming, organic production, and biodiversity conservation is essential for longterm sustainability. Third, ensuring food justice by supporting small farmers, regulating corporate monopolies, and improving access to nutritious food can help combat systemic inequalities. Finally, promoting sustainable diets, such as reducing reliance on resource-intensive foods like beef and shifting toward plantbased alternatives, can alleviate both health crises and environmental damage.
Ultimately, food is more than just a commerce product, it is one of the pillars of human health, social equity, and ecological balance. The decisions made today regarding food production, policy, and consumption will shape the future of food security, policy, and environmental sustainability. By reimagining foodscapes, investing in sustainable innovations, and enforcing equitable food policies, humanity has an opportunity to build a more resilient, just, and thriving global food system for future generations.
Bossio, D., Obersteiner, M., Wironen, M., Jung, M., Wood, S., Folberth, C., Boucher, T., Alleway, H., Simons, R., Bucien, K., Dowell, L., Cleary, D., & Jones, R. (2021). Foodscapes: Toward food system transition [Map, pp. 9-10]. The Nature Conservancy, International Institute for Applied Systems Analysis, & SYSTEMIQ.
De Representación Arquitectónica, F. M. M. /. T. (n.d.). Paisaje | TRA. http://www.mindeguia.com/temas/paisaje_cs.html
De Rooden, P. (Ed.), Grubb, A., & Wiskerke, H. (2012). Food for the city: A future for the metropolis. nai010 publishers.
Division, I. a. E., Forbes, H., Peacock, E., Abbot, N., & Jones, M. (2024, March 1). Food Waste Index Report 2024. Think Eat Save: Tracking Progress to Halve Global Food Waste. https://wedocs.unep.org/handle/20.500.11822/45230
Downs, SM, Ahmed, S, Fanzo, J et al. (2020) Food environment typology: advancing an expanded definition, framework, and methodological approach for improved characterization of wild, cultivated, and built food environments toward sustainable diets. Foods 9, 532.CrossRefGoogle ScholarPubMed
Food History Timeline, Events in Food History, 50,000 BC to 2024. (n.d.). https://www.foodreference.com/html/html/yearonlytimeline.html
Fujs, T., & Kashiwase, H. (2024, March 16). Strains on freshwater resources: The impact of food production on water consumption. World Bank Blogs. https://blogs.worldbank.org/en/opendata/strains-freshwater-resources-impactfood-production-water-consumption#:~:text=Today%2C%20around%2070%20percent%20of,goes%20to%20the%20industrial%20sector.
Future Foodscapes Research Unit (FFRU). (n.d.). Future Foodscapes Compendium: An index of agro-architectural models for a viable planetary future. Retrieved from https://foodscapescompendium.es/
Rooden, P. (Ed.). (2012). Food for the City: A Future for the Metropolis. NAI Publishers.
Lewis, J. (2024, March 5). 11 Effective solutions for food waste. Earth.Org. https://earth.org/solutions-for-food-waste/
New cases of type 1 diabetes (0-14 Y), in 1,000s. Type 1 diabetes estimates in children and adolescents. (n.d.). https://diabetesatlas.org/data/en/indicators/9/
Méjean, C., & Recchia, D. (2022). Urban foodscape and its relationships with diet and health outcomes. Proceedings of the Nutrition Society, Cambridge University Press. Retrieved form: https://www.cambridge.org/core/journals/ proceedings-of-the-nutrition-society/article/urban-foodscape-and-its-relationships-with-diet-and-health-outcomes/CD7EA0A874D9210A66AE15703B8E7018
Ritchie, H., Rosado, P., & Roser, M. (2022, December 2). Environmental impacts of food production. Our World in Data. https://ourworldindata.org/environmental-impacts-of-food
Ritchie, H. (2022, February 4). What is undernourishment and how is it measured?. Our World in Data. https://ourworldindata.org/undernourishment-definition
Ritchie, H., Rosado, P., & Roser, M. (2023, June 19). Hunger and undernourishment. Our World in Data. https://ourworldindata.org/hunger-and-undernourishment
Sharma, S. (2015). Food preservatives and their harmful effects. International Journal of Scientific and Research Publications, 5(4), 1-2. Retrieved from https://citeseerx.ist.psu.edu/ document?repid=rep1&type=pdf&doi=5385ad183ba002dcc6d91b1fd228068dbcca31a2
Smoor, T. (2023, August 27). 6 facts you should know about water use in agriculture. Cargill. Retrieved February 17, 2025, from https://www.cargill.com/story/agriculture-water-use
World Health Organization: WHO. (2023, November 16). Food additives. https://www.who.int/news-room/fact-sheets/detail/food-additives
World Health Organization: WHO. (2024, March 1). Malnutrition. https://www.who.int/news-room/fact-sheets/detail/malnutrition
World Health Organization. (n.d.). Malnutrition in children. World Health Organization. https://www.who.int/data/nutrition/nlis/info/malnutrition-in-children