As seen in the previous chapter, the concept of foodscapes not only highlights how food production and consumption are influenced by geographical and cultural factors but also how agricultural practices interact with nature. In the case of Mexico, the diversity of its food landscapes is due to its vast territory, which has a wide climatic variability that contributes to the country’s agricultural production diversity.
However, according to a study on water body protection (2018), more than 70% of rivers, lakes, and reservoirs present some degree of contamination (National Human Rights Commission and the National Autonomous University of Mexico). The high demand for water resources, combined with a lack of education on the subject, has led to this issue directly affecting food production for the population. For this reason, this layer of information has been incorporated into most of the maps presented below. The following topics will be covered to explain the country’s physical context:
1. CLIMATOLOGY
2. HYDROLOGY
3. LAND USE FROM 1997 TO 2021, ALONG WITH SOIL DEGRADATION
4. RELATIONSHIP BETWEEN SOIL DEGRADATION AND THE EXPLOITATION OF WATER RESOURCES
5. DIVERSITY OF SOIL TYPES IN THE CENTER OF THE COUNTRY
6. DIFFERENCES BETWEEN OPEN-FIELD AND GREENHOUSE CULTIVATION
7. CROP PRODUCTION, HIGHLIGHTING AREAS WITH EXTREME DROUGHTS
8. LIVESTOCK PRODUCTION
9. WATER CONSUMPTION IN LIVESTOCK FARMING, IRRIGATION, AND URBAN USE
10. RAILWAY AND HIGHWAY INFRASTRUCTURE FOR THE DISTRIBUTION OF GOODS IN THE COUNT
Symbology
Base Map
Scale | 1: 11,000,000
Queretaro
The Bajío Region
State borders
Contour lines
Urban Areas
Territory of Mexico
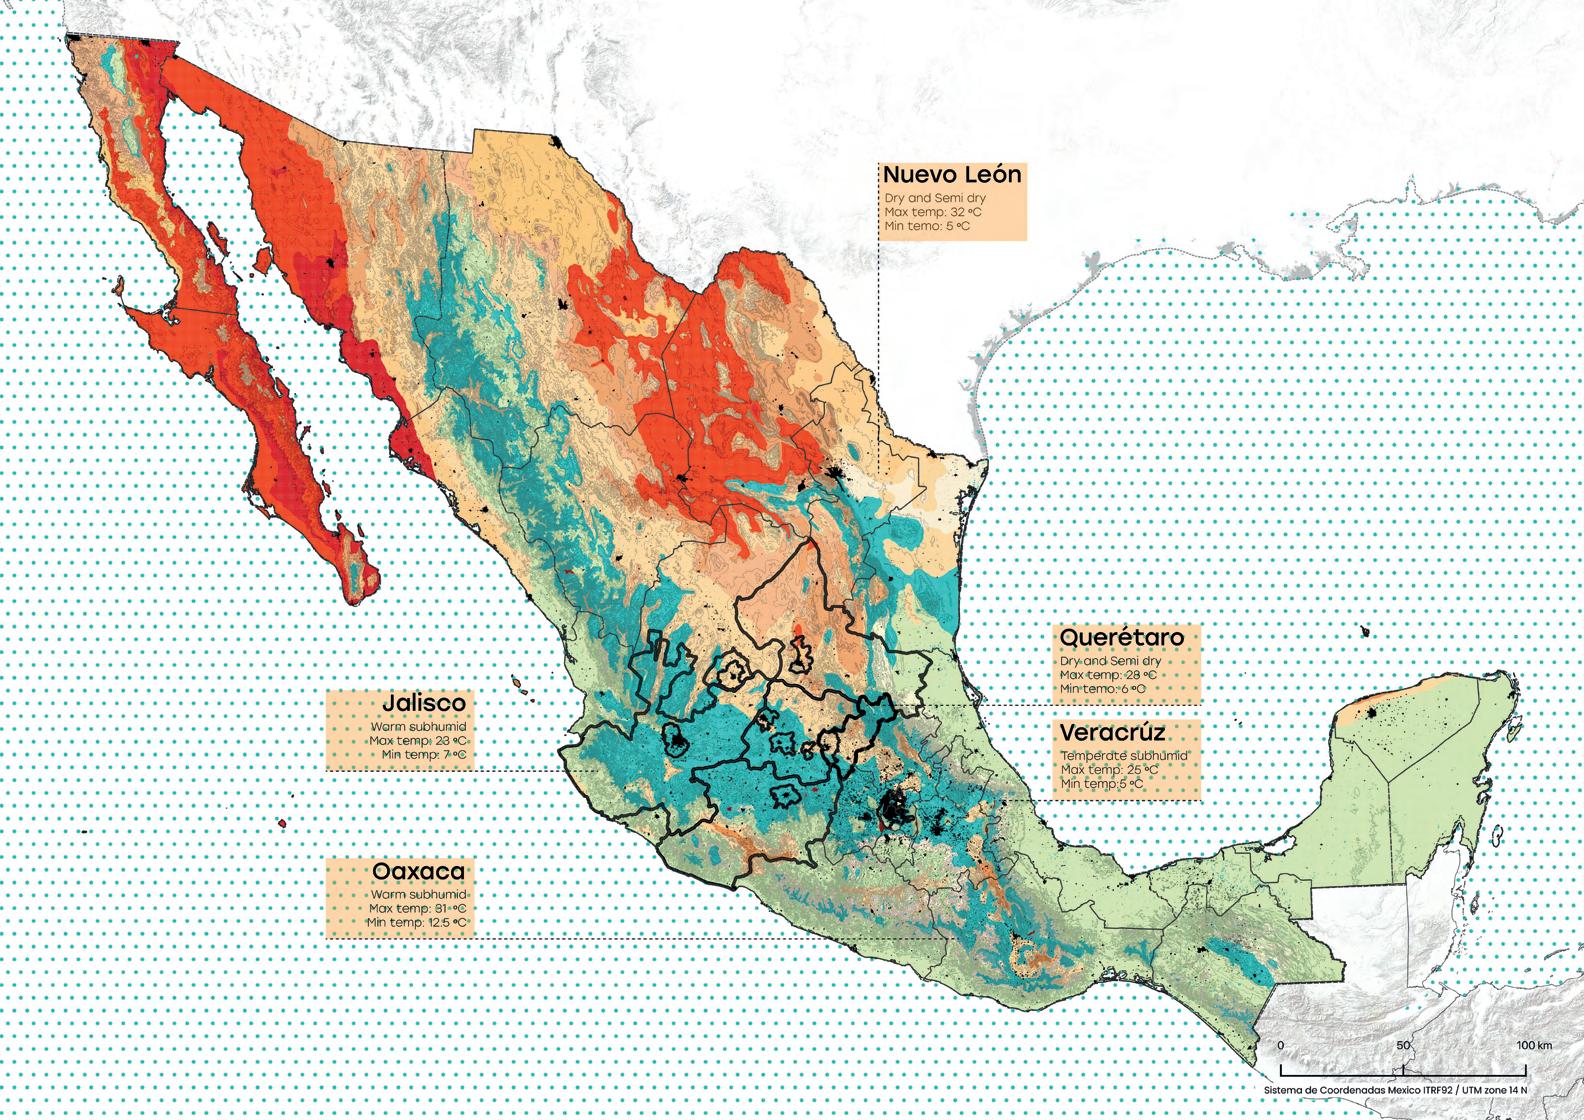
Three climate types dry, warm, and temperate as well as their variations exist in Mexico. In addition to its rocky terrain brought about by the Sierra Madre Occidental, the north of our nation is known for its arid climate. With a few arid areas, the climate in the middle is primarily temperate. Lastly, the climate in the south is generally warm.
According to Inegi (2022), the state of Queretaro has a “dry and semi-dry” climate, which affects 52% of its surface area. 25% of the warm-weathered Sierra Madre Oriental region is next.
Symbology
Hidrology
Perennial River
Non-perennial rivers
Waterbody
Annual Precipitation
1000-2000 mm
2000-4000 mm
+4000 mm
Base Map
Scale | 1: 11,000,000
Queretaro
The Bajío Region
State borders
Contour lines
Urban Areas
Water Deficit
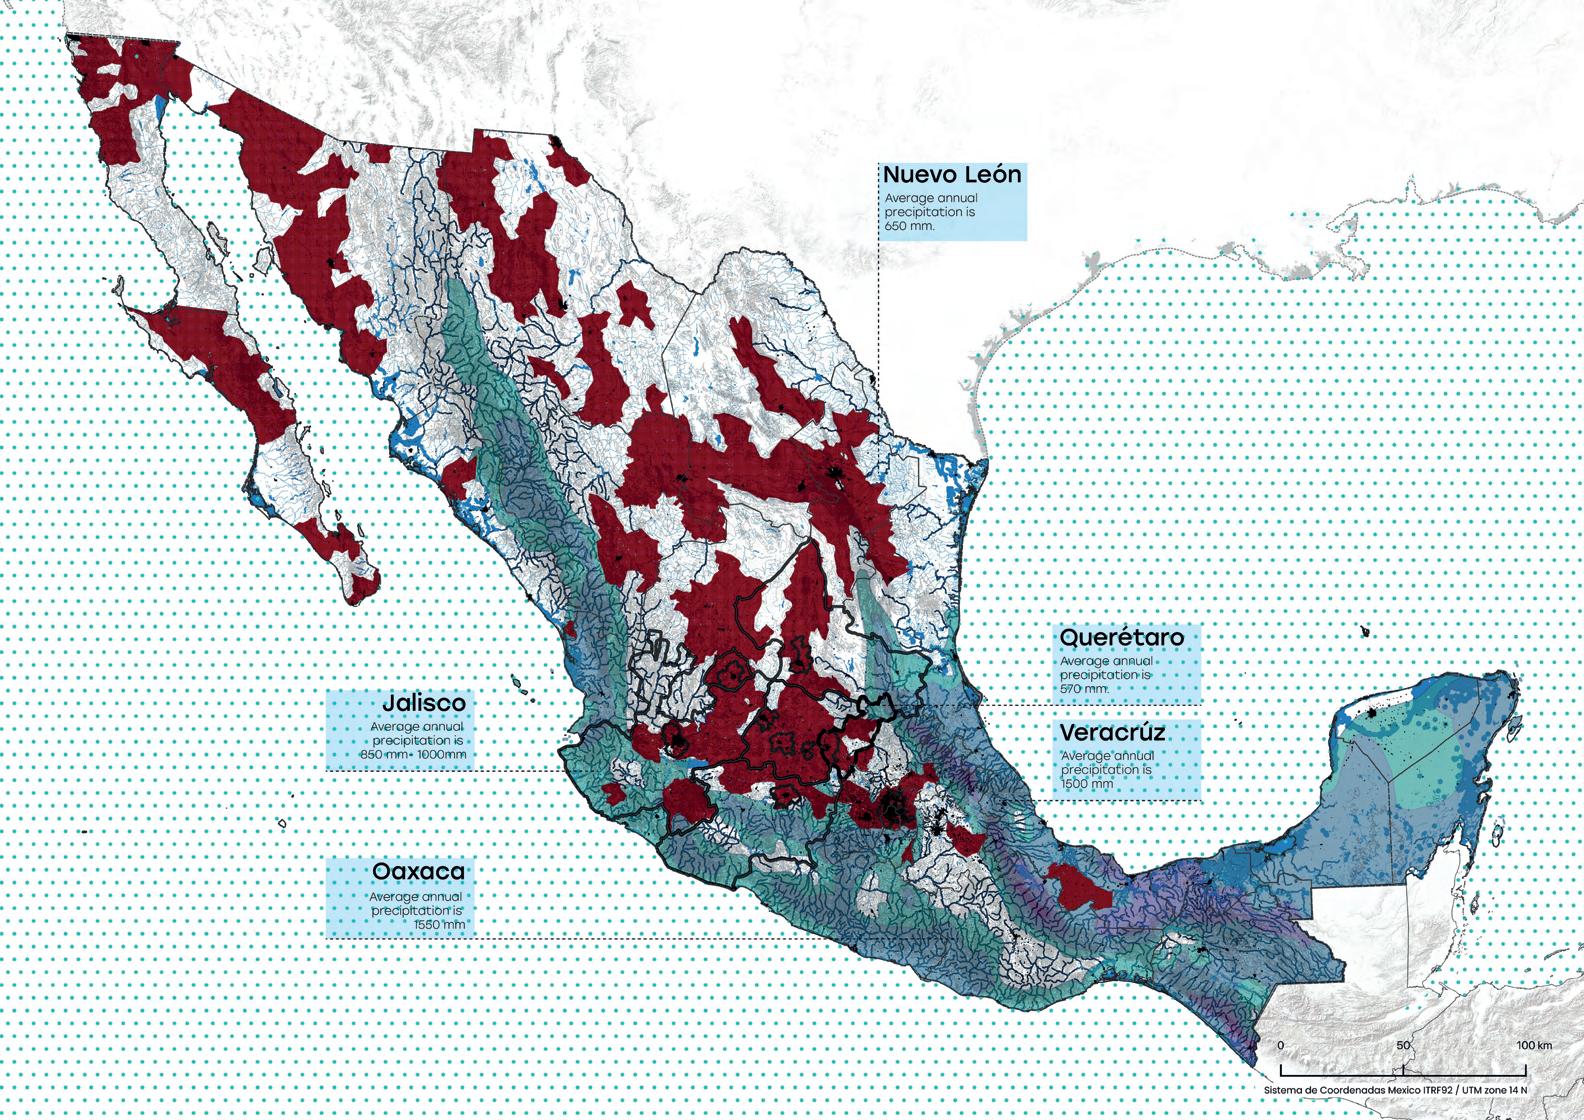
About 633,000 kilometers of rivers and streams make up Mexico’s vast water system. Lake Chapala is the largest lake, and the Bravo is the longest river. The nation is divided into 1,471 water basins and 37 hydrological zones, with the largest being the Bravo, Balsas, and Nazas rivers.
Chihuahua, Sonora y Jalisco has some of the most important aquifers. Although Mexico has a large expanse of hydraulic resources throughout the country, we can see how in some parts of the north, mainly, there is water scarcity due to the region and consumption demand.
Another problem the population faces regarding the country’s water sources is pollution due to industrial waste, wastewater, and agricultural pollutants within the running water.
Scale | 1: 11,000,000
Symbology
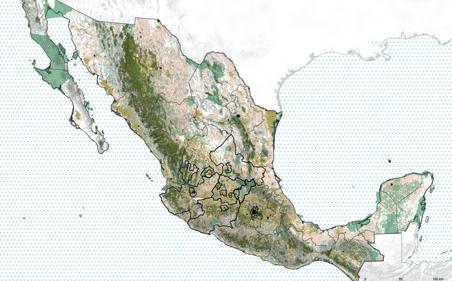
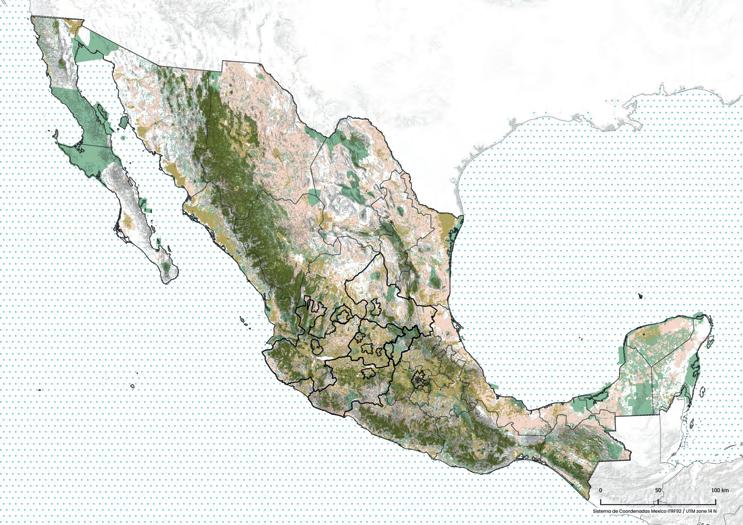
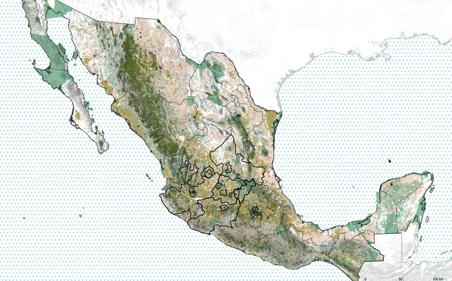
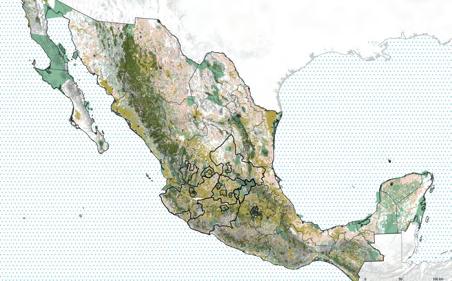
Land Use
Forest Agriculture
Urban Area
Protected natural areas
Soil degradation
Base Map
Queretaro
The Bajío Region
State borders
Contour lines
Urban Areas
Water Deficit
SERIE 2, 2001
SERIE 1, 1997
SERIE 3, 2005
SERIE 4, 2009
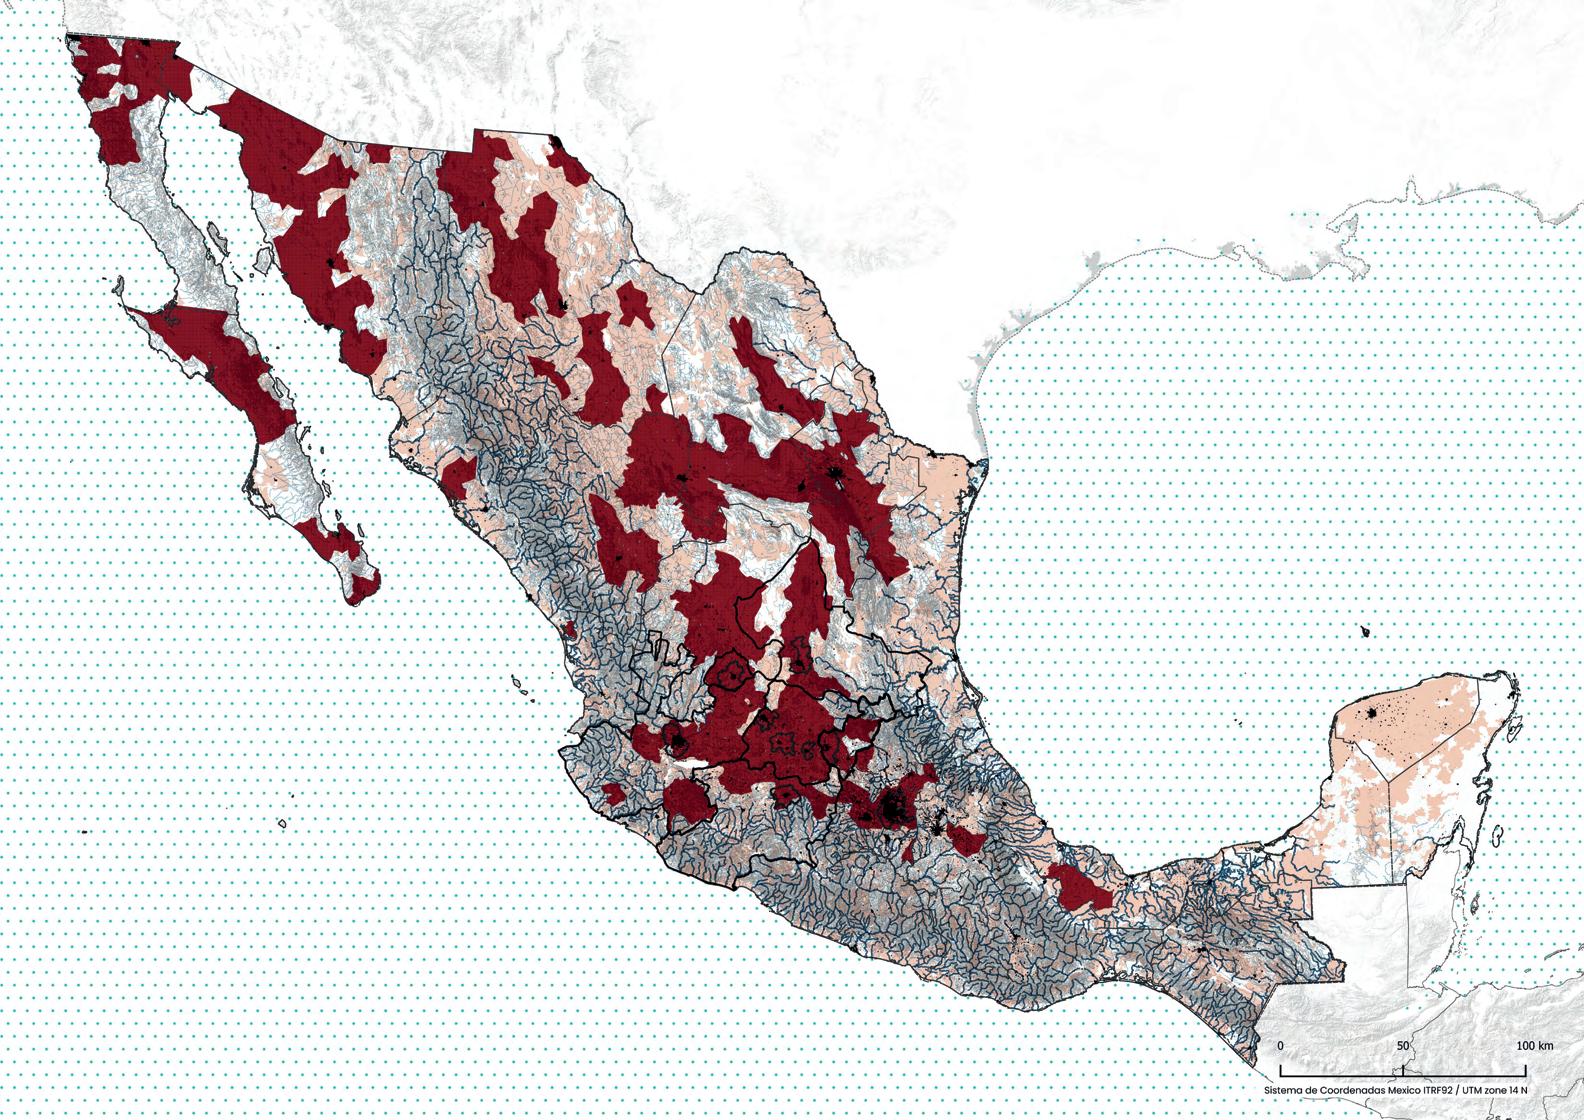
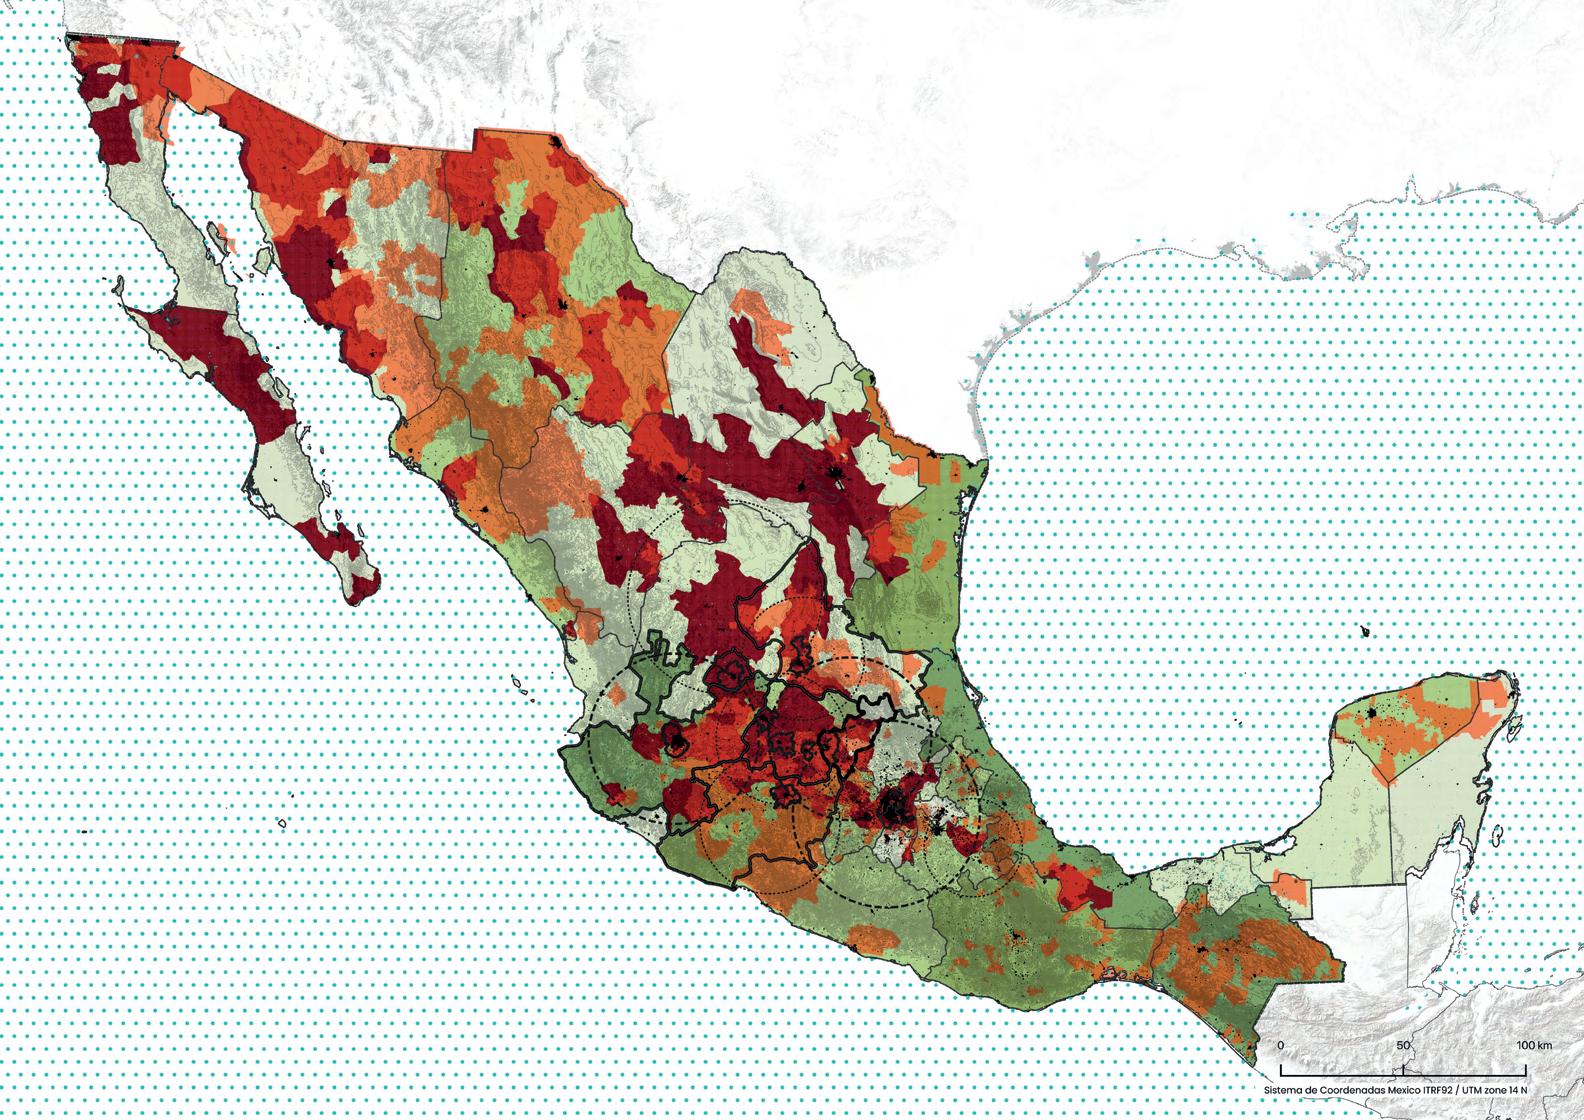
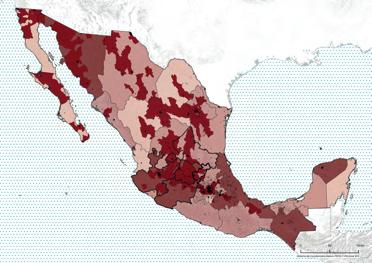
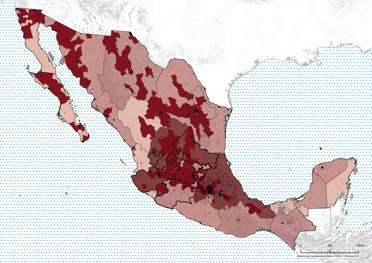
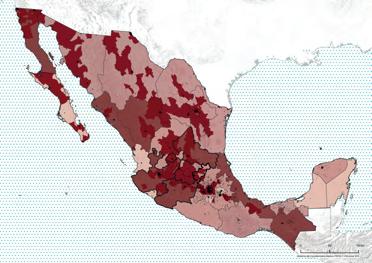
These maps show the soil status over time, specifying the areas that are forests, urban areas, agriculture related, and areas with soil degradation from 2001 to 2021. It is noticeable that due to soil degradation, protected areas had to be implemented.
The 2021 map highlights the most significant amount of soil degradation in the northern part of the country, where extreme weather conditions, civil development, and pollution have contributed to its expansion. However, the protected areas aim to preserve and create a balance to help restore sustainable soils.
SERIE 5, 2013
SERIE 6, 2016
SERIE 7, 2021
RELATIONSHIP BETWEEN SOIL DEGRADATION AND NATURAL RESOURCE EXPLOTATION
Symbology
Hydrology
Perennial River
Non- perennial rivers
Soil degradation
Base Map
Scale | 1: 11,000,000
Queretaro
The Bajío Region
State borders
Contour lines
Urban Areas
Water Deficit
Soil degradation can have a correlation with many factors, however, in particular in this map shows one of the most obvious and is related to the exploitation of soil in the agricultural sector, being an industry that is mainly one of the main consumers of water we can see that the water deficit is related to the most overexploited areas for this activity which in turn coincides with the main agricultural producing States of the country.
CROSS-SECTION OF THE LOWLOAD
Scale | 1: 11,000,000
Symbology
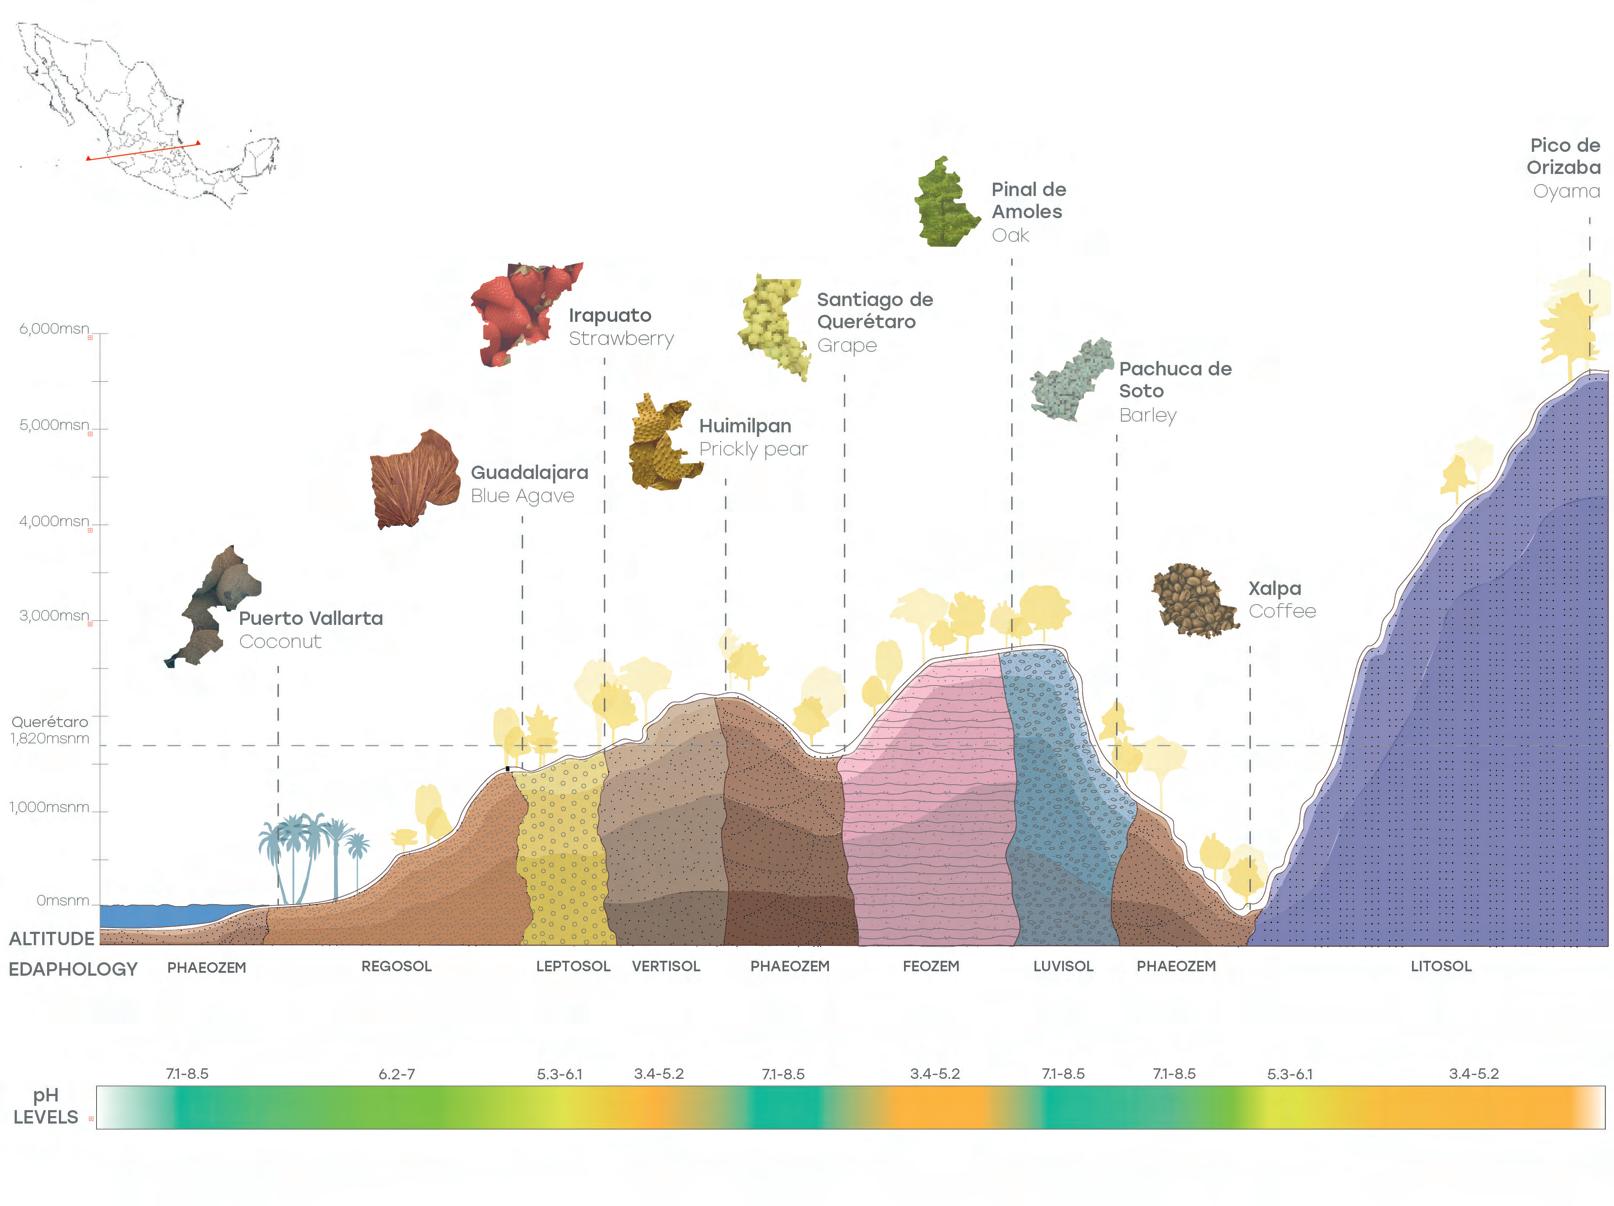
Edaphology
Regosol Leptosol Vertisol Feozem Luvisol Phaeozem Litosol
A Horizon – 0-10 cm → Sand, silt, and mineral fragments with low organic matter.
C Horizon – 10-30 cm → Unconsolidated sediments, coarse sands, and gravels.
Rocky Substrate – 30-60 cm → Slightly altered material, unstable soils.
Weathered Rock Base – 60 cm+ → Semi-consolidated bedrock with high permeability.
O Horizon – 0-3 cm → Decomposing organic matter.
A Horizon – 3-10 cm → Thin loamy-sandy soil with low water retention.
C Horizon – 10-30 cm → Weathered rock fragments.
R Horizon – 30 cm+ → Compact bedrock (limestone or basalt).
A Horizon – 0-15 cm → Clayey soil with high organic matter content.
C Horizon – 40-80 cm → Clayey parent material with carbonate accumulation. Bss Horizon (Crack Horizon) – 15-40 cm → Expansive clay with deep cracks.
R Horizon – 80 cm+ → Bedrock with hardened clay sediments.
O Horizon – 0-5 cm → Leaf litter and decomposing plant residues.
B Horizon – 30-70 cm → Clays and base accumulation. A Horizon – 5-30 cm → Black soil with high humus content.
C Horizon – 70-100 cm → Less developed soil with mineral deposits.
O Horizon – 0-5 cm → Decomposing organic matter.
E Horizon – 20-50 cm → Leached zone with nutrient loss. A Horizon – 5-20 cm → Brown soil with high iron and aluminum content.
B Horizon – 50-100 cm → Accumulation of clays and metallic oxides.
C Horizon – 100 cm+ → Weathered parent material with high permeability.
O Horizon – 0-5 cm → Decomposing organic matter.
A Horizon – 5-30 cm → Dark-colored soil, rich in humus.
B Horizon – 30-60 cm → Accumulation of minerals such as iron and aluminum.
C Horizon – 60-100 cm → Rock fragments and parent material.
R Horizon – 100 cm+ → Slightly altered bedrock.
A Horizon – 0-5 cm → Thin layer of organic material and volcanic ash.
C Horizon – 5-30 cm → Weathered rock fragments.
R Horizon – 30 cm+ → Solid, unaltered volcanic bedrock.
The geographical, climatic and soil characteristics of each region of the Bajío and surrounding areas influence the types of crops that can be sown and their profitability. Higher areas favour crops that are more resistant to cold and have moderate water needs, while low-lying and coastal areas allow the cultivation of tropical species that require stable temperatures and high humidity. The diversity of conditions between different places, such as altitude, soil type, pH, temperatures and precipitation, allows each region to develop an agricultural specialization, optimizing the production of specific crops that better adapt to their local conditions. For producers, understanding these variations is essential to choosing the right species and maximizing the profitability of their crops.
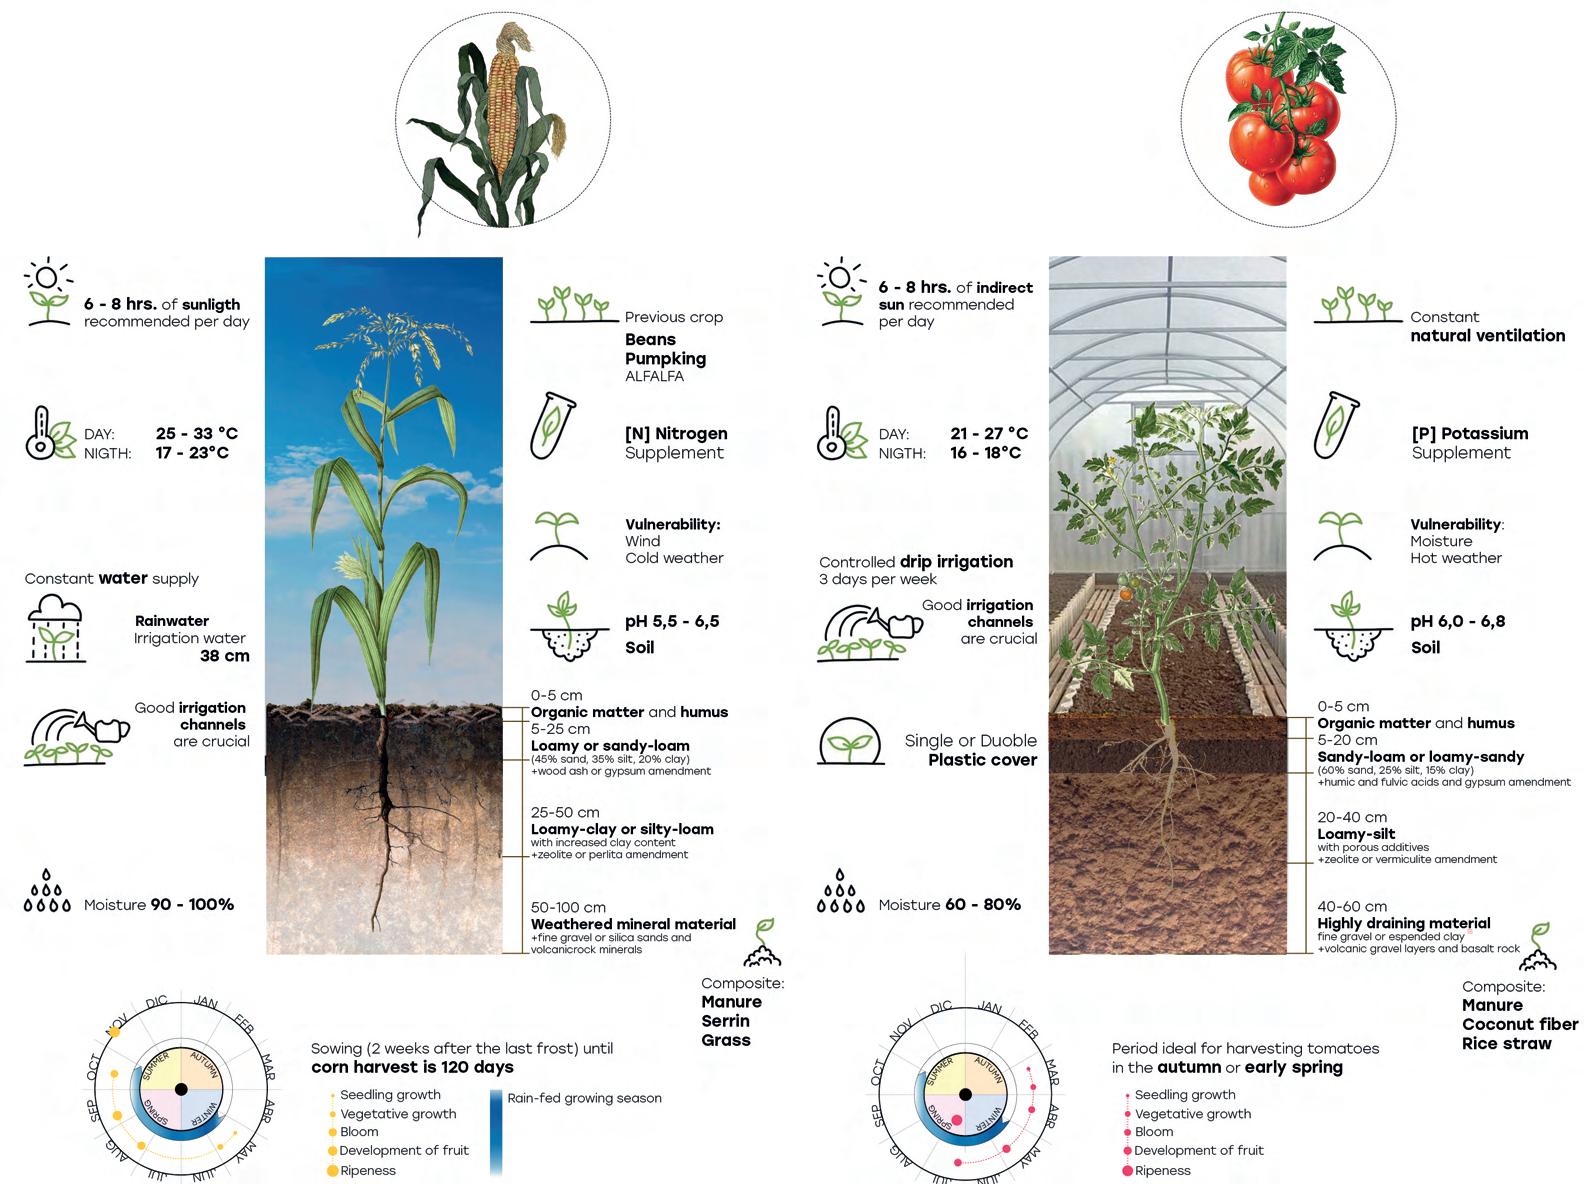
DIFFERENCES BETWEEN OPEN-TOP AND CONTROLLED CULTIVATION
Open-air and greenhouse farming have specific advantages and challenges. Open-air farming benefits from natural conditions and appropriate soil management, but is vulnerable to climatic factors and pests. In contrast, greenhouse cultivation provides more precise control over the environment, reducing vulnerability to extreme weather conditions and pests, but requires greater investment in infrastructure and management of humidity, temperature and ventilation. If the goal is to maximize production under controlled conditions and minimize climate risk, the greenhouse is the most appropriate option. However, open field cultivation remains a cost-effective option when space and climate conditions are favourable.
Symbology
Base map
Queretaro
The Bajio Region
State borders
LOCAL PRODUCTS
Scale | 1: 11,000,000
Contour lines
Urban Areas
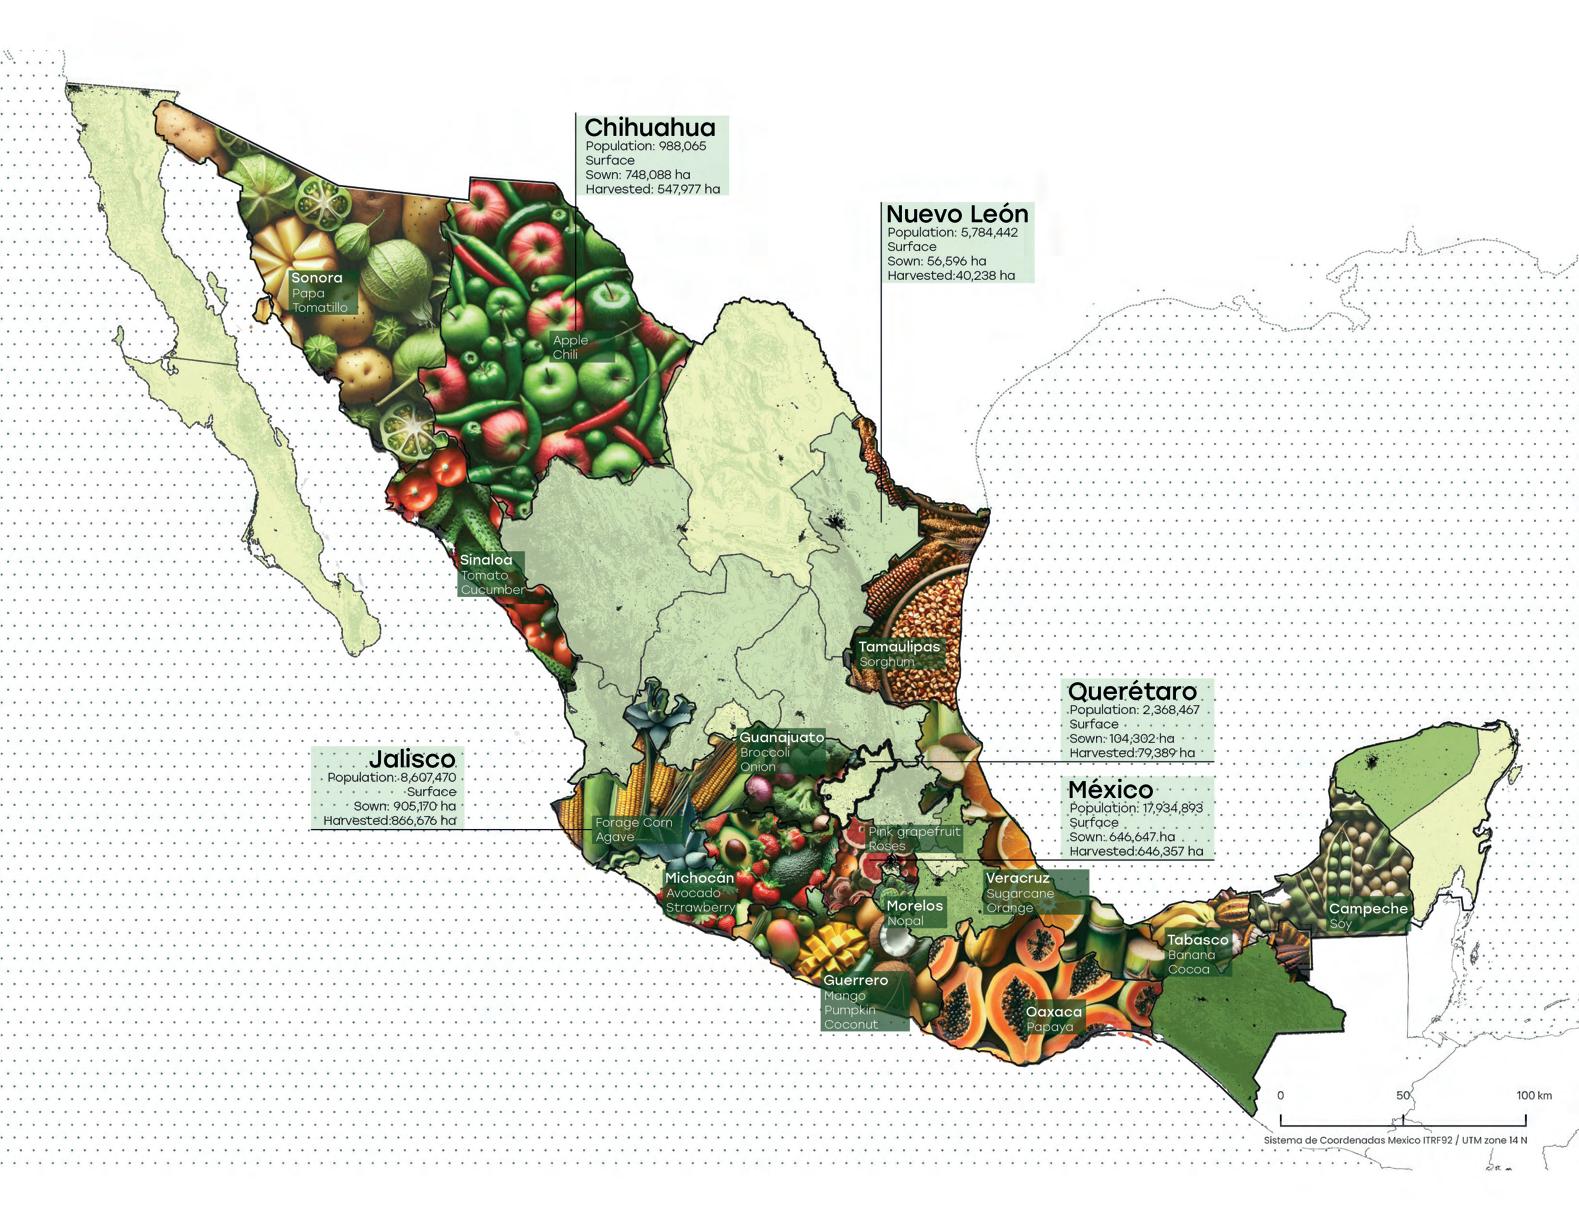
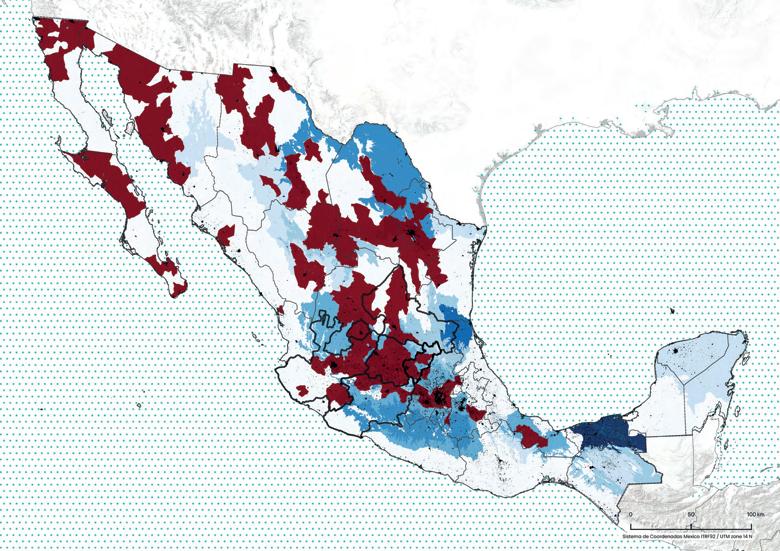
The first map shows the most important producing states in Mexico according to the INEGI 2022 agricultural census, highlighting their main crops. Some of these states belong to the metropolitan category. Climatic and geographical conditions influence the variety and quantity of production, as factors such as altitude, humidity, sun exposure, and water availability affect crop growth. Although water levels do not directly determine the quality and quantity of the harvest, other factors, such as biological resistance to extreme conditions, can limit the variety of species. Additionally, the profitability of products also influences production, with more profitable crops being produced in larger quantities.
Symbology
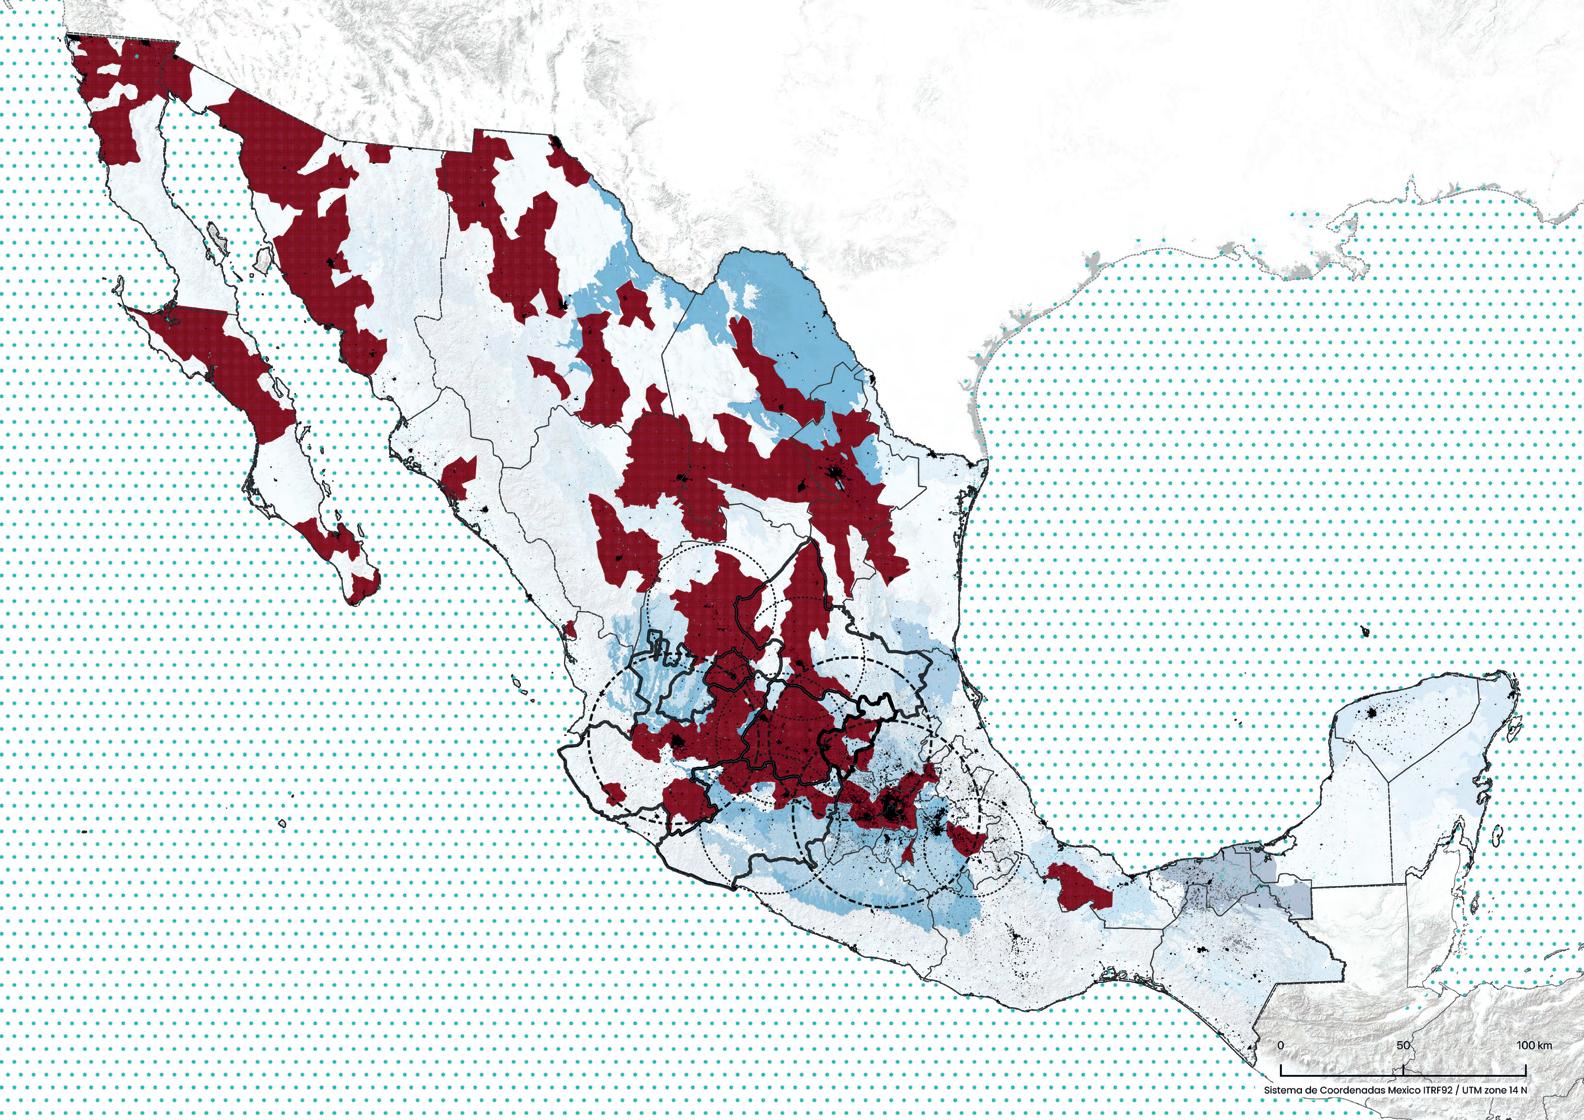
AGRICULTURE + SEVERE DROUGHT
National Agricultural Production 2023 (Percentage)
Base map
Scale | 1: 11,000,000
State borders
Contour lines
Urban Areas
Severe Drought
Agriculture in Mexico is undoubtedly a significant sector, occupying approximately 15% of the national territory (20.6 million hectares are under agricultural cultivation). The most representative products include corn, sugarcane, avocado, sorghum, green chili, tomato, beans, barley, and wheat, among others. Additionally, Mexico is the world’s leading exporter of tomatoes, watermelon, cucumber, avocado, onion, lime, papaya, tequila, and beer, ranking seventh globally in agricultural production. In 2023, corn production surpassed 27 million tons, making it the most harvested crop in the country.However, Mexico’s agricultural sector faces significant challenges such as water scarcity and climate change. The overexploitation of aquifers and pollution have contributed to the reduction of water availability for agriculture, raising concerns about production and food security. Furthermore, climate phenomena such as droughts and floods have negatively impacted crop yields.
The Bajio Region
Queretaro
Scale | 1: 11,000,000
Symbology
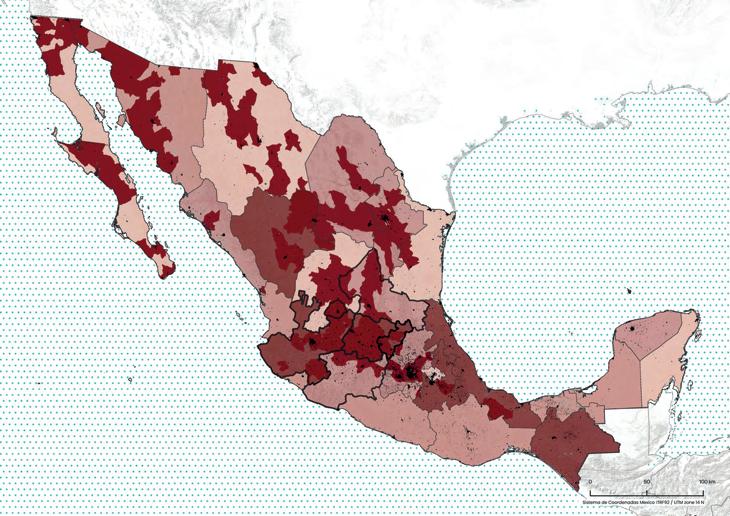
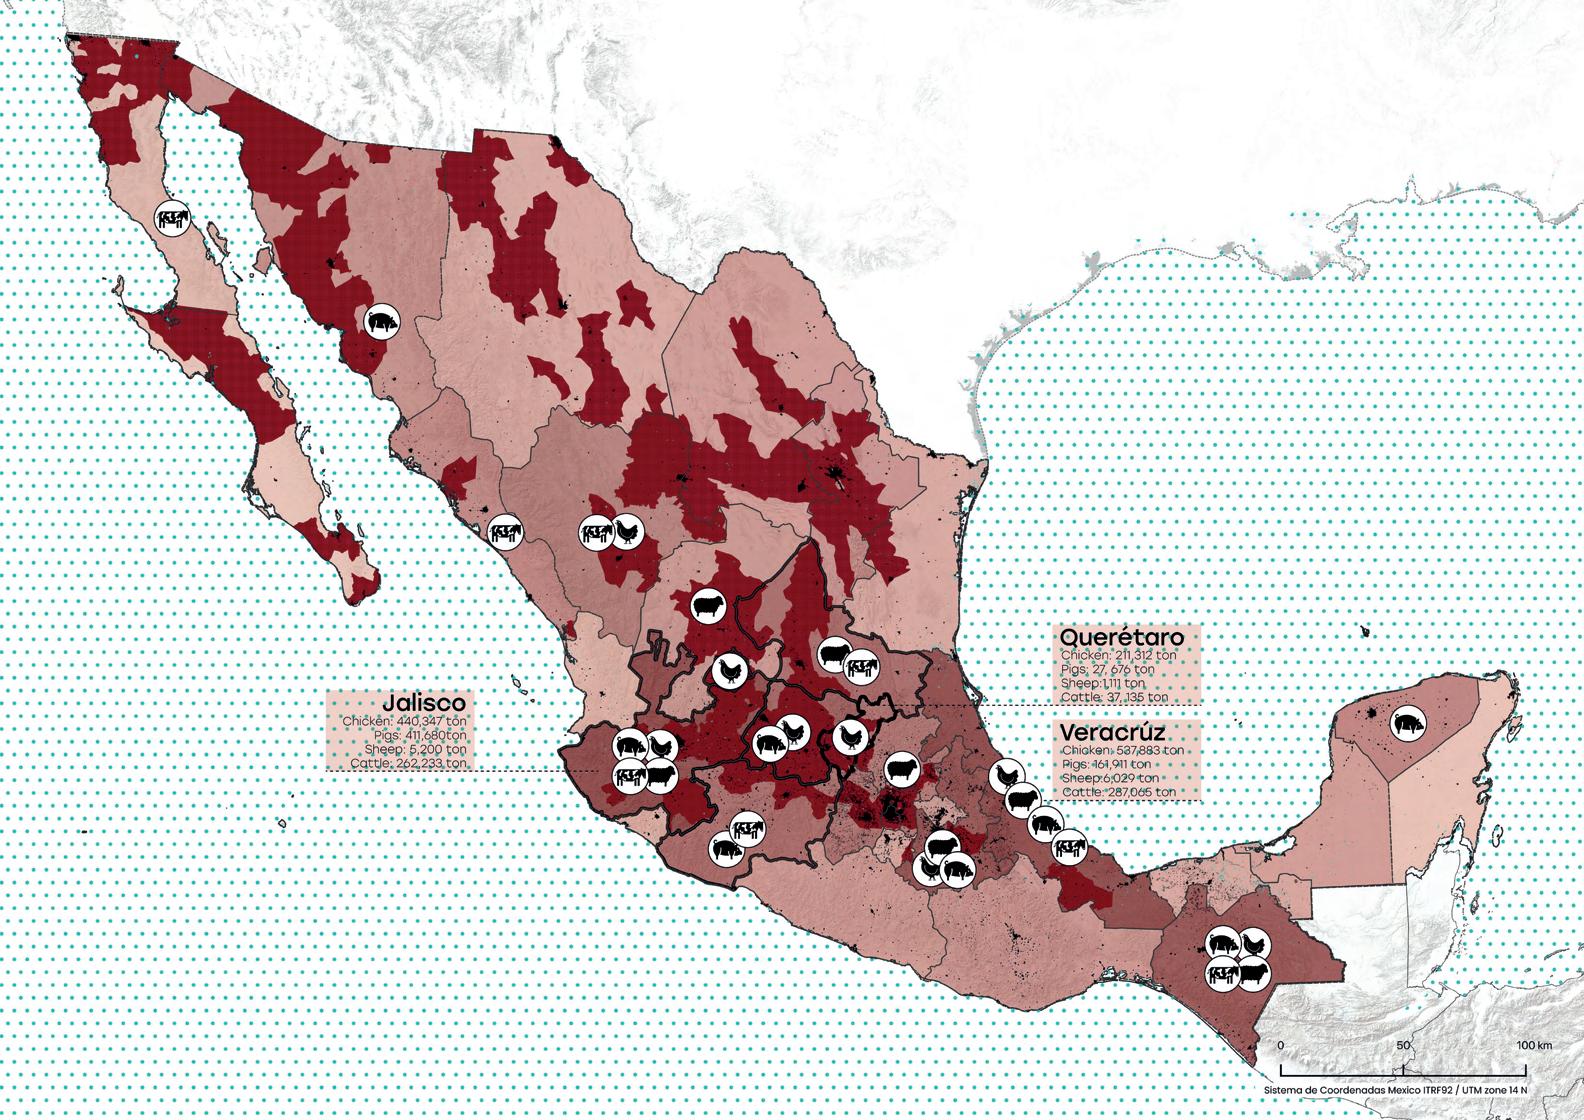
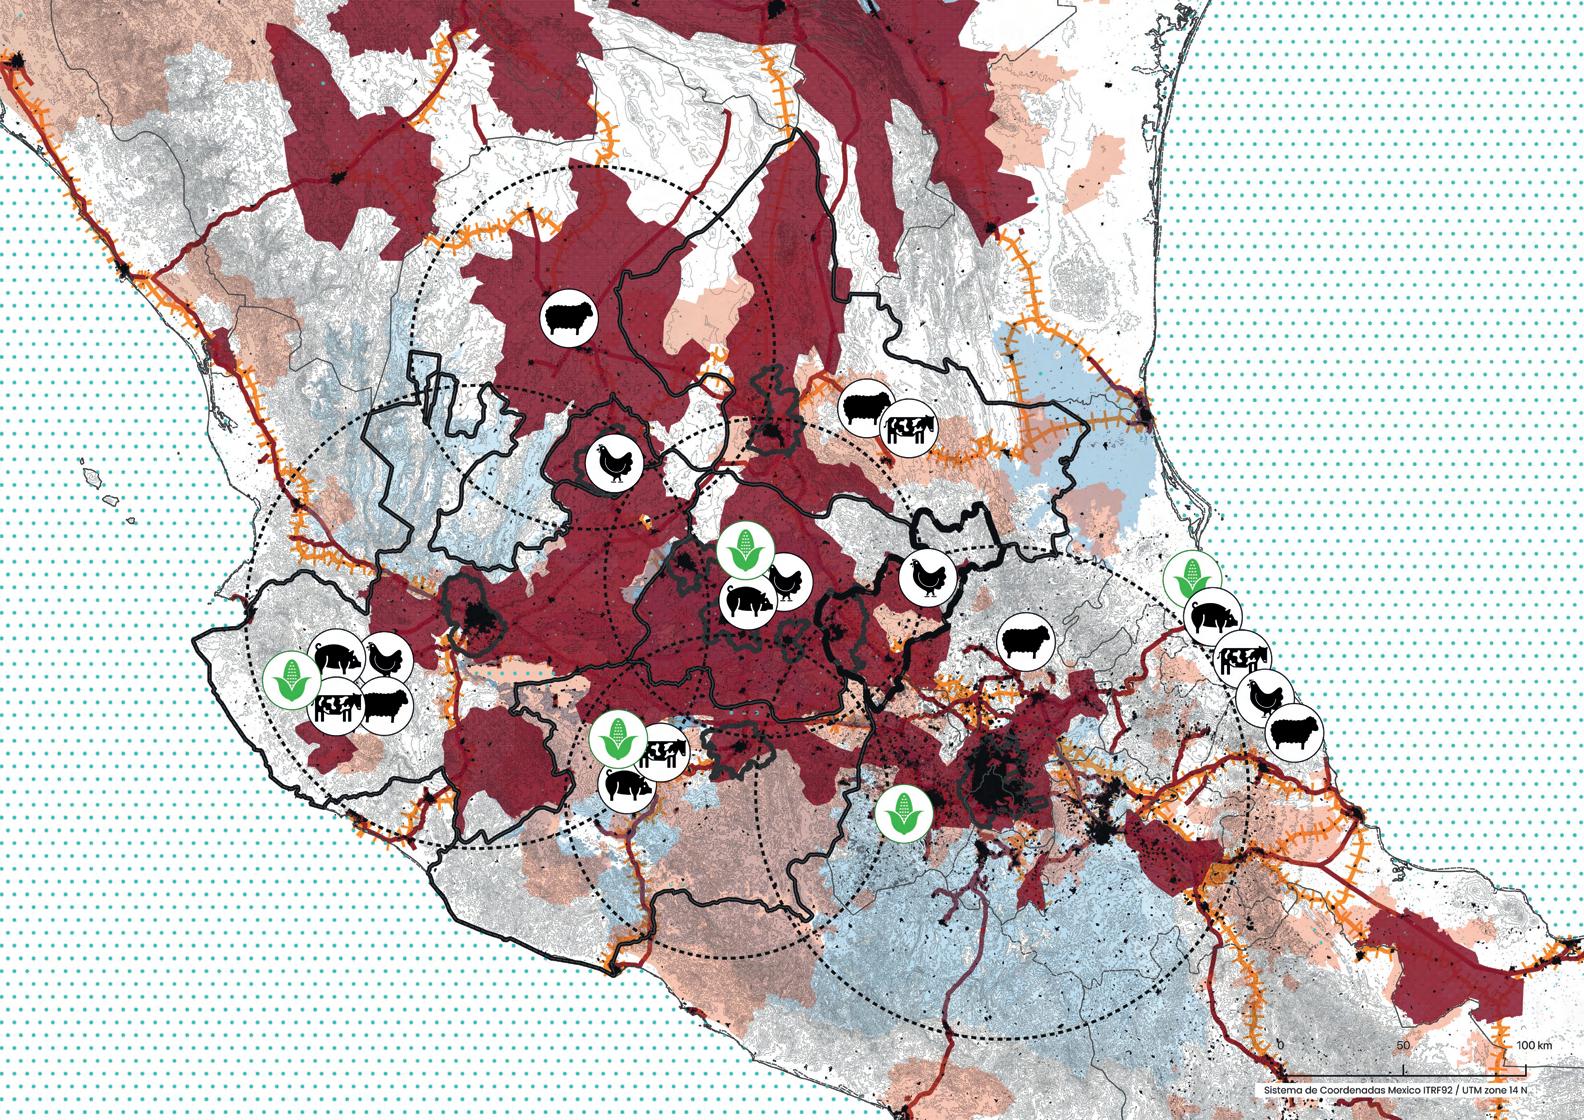
National Livestock Production 2023 (Percentage)
Livestock production plays an important role in Mexico, ncludes the raising of sheep, chickens, pigs, and cattle. Each type of livestock is raised in different regions, adapted to climatic and geographical conditions. Sheeps provide wool, meat, and milk, while chickens are raised primarily for eggs and meat. Pigs are a major source of pork, a basic meal in Mexican cuisine. Cattle are a major contributor to both beef and dairy production, supporting domestic consumption and export markets.
Chicken
Pigs Sheep
Cattle
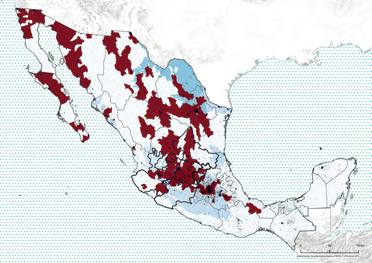
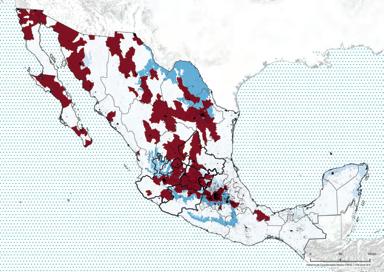
Water Consumption for Agriculture Water Consumption for Urban Use
Water Consumption for Livestock
Although the agricultural sector is the largest water consumer, the specific water consumption of the livestock sector is not clearly detailed in the available statistics. However, it is known that livestock, like agriculture, heavily relies on water for the supply and maintenance of animals. The lack of specific data on water consumption in the livestock sector makes it difficult to assess its precise impact on the country’s water resources.
Symbology
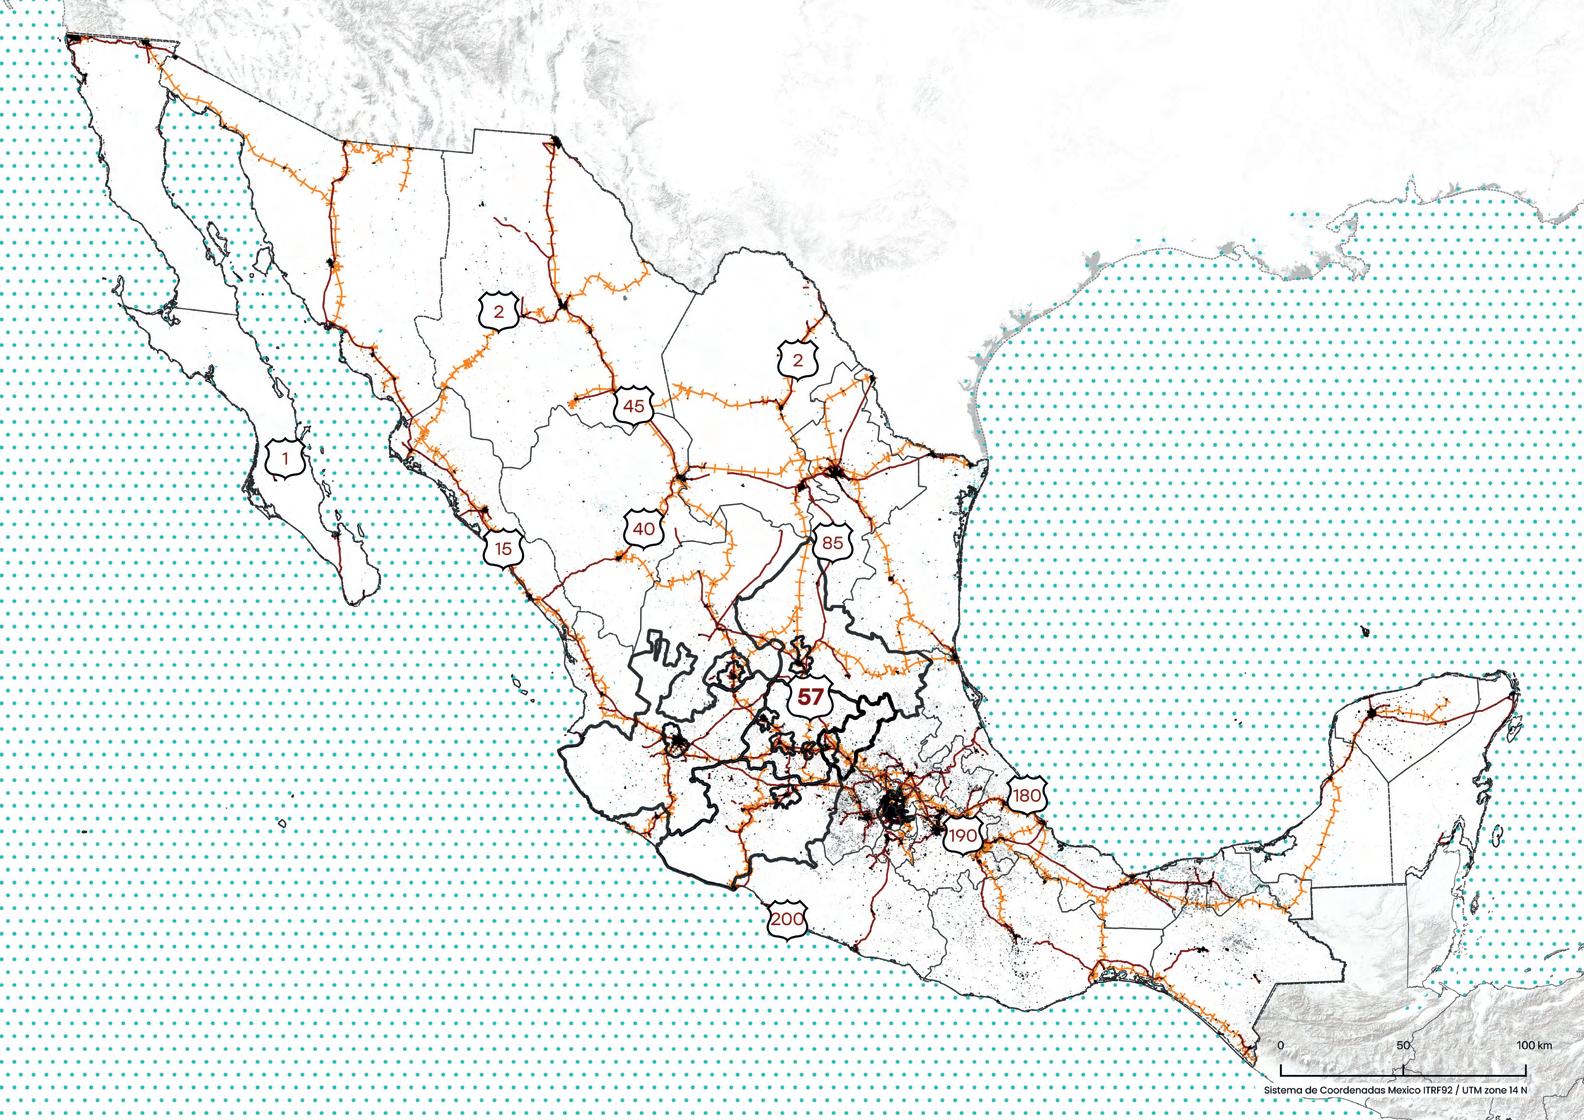
Nacional Road Network
Main Roads
Railway Roads
Base Map
Scale | 1: 11,000,000
Queretaro
The Bajío Region
State borders
Contour lines
Urban Areas
Mexico has its connectivity in the central region of the country, especially in “Estado de México”. The map highlights the national roads and rails network in order of priorities. In central Mexico, where the “Estado de México” is located, lanes and roads interact creating a strong link of inter connectivity, leading to a successful transfer of national products and transportation, along with passenger services and tourist purposes. Highlighting the FERROMEX route, the most relevant in the country, which crosses through the capital city, “Ciudad de México”.
The Bajío region is one of Mexico’s most vital agricultural hubs. However, the overexploitation of water resources and unsustainable farming practices have pushed it toward a critical tipping point. If these issues persist, the region—and potentially the entire country—faces the looming threat of a food security crisis, bringing the prospect of “Day Zero” closer than ever.
In light of this situation, several questions arise:
• What will happen when the Bajío’s resources are depleted and the agricultural sector is forced to decentralize? Where will these practices take place, and what consequences will they bring to other regions?
• What alternatives or possible futures can ensure food security in Mexico?
• Is the modernization of agriculture and soil regeneration the solution, or are more comprehensive strategies needed?
As we can see, Mexico is a country of great ecological and cultural diversity that faces complex challenges in relation to food security, natural resource management and the impact of industry.
The export and import of food products is another relevant factor in Mexican foodscapes. Through commercial exchanges, Mexico is positioned as one of the main actors in food exports to other countries, but this also implies a dependence on internal and external policies, as well as an effect on local availability and cost overruns. In addition, the growing food waste in the Mexican food industry is a serious problem that aggravates both food insecurity and environmental impact.
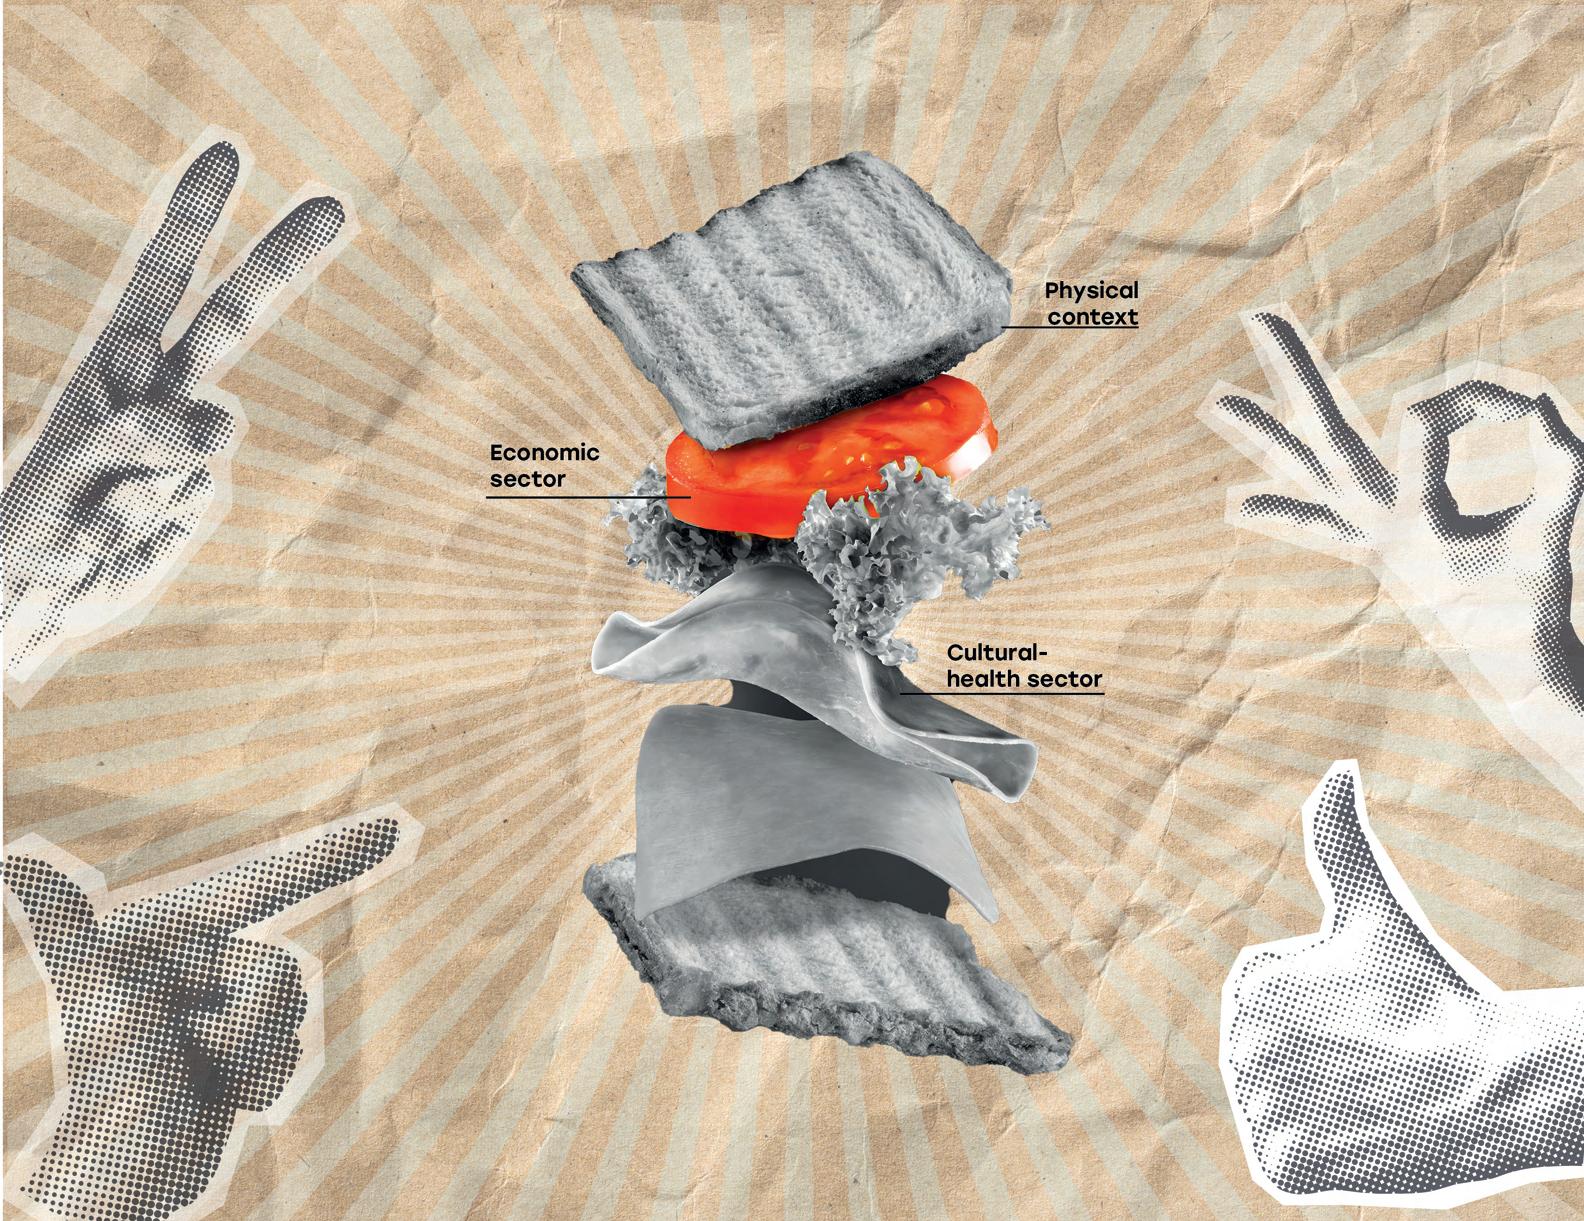
This chapter seeks to explore how these factors are interrelated in the context of Mexican foodscapes. It seeks to understand the implications of these processes on the sustainability of the country’s food system and its capacity to guarantee equitable access to sufficient, nutritious and culturally and economically adequate food for the entire population.
1. IMPORTS AND EXPORTS
2. EXPORTS AND WATER FOOTPRINT
3. FOOD INDUSTRY AND ITS WASTE
4. FOOD SECURITY
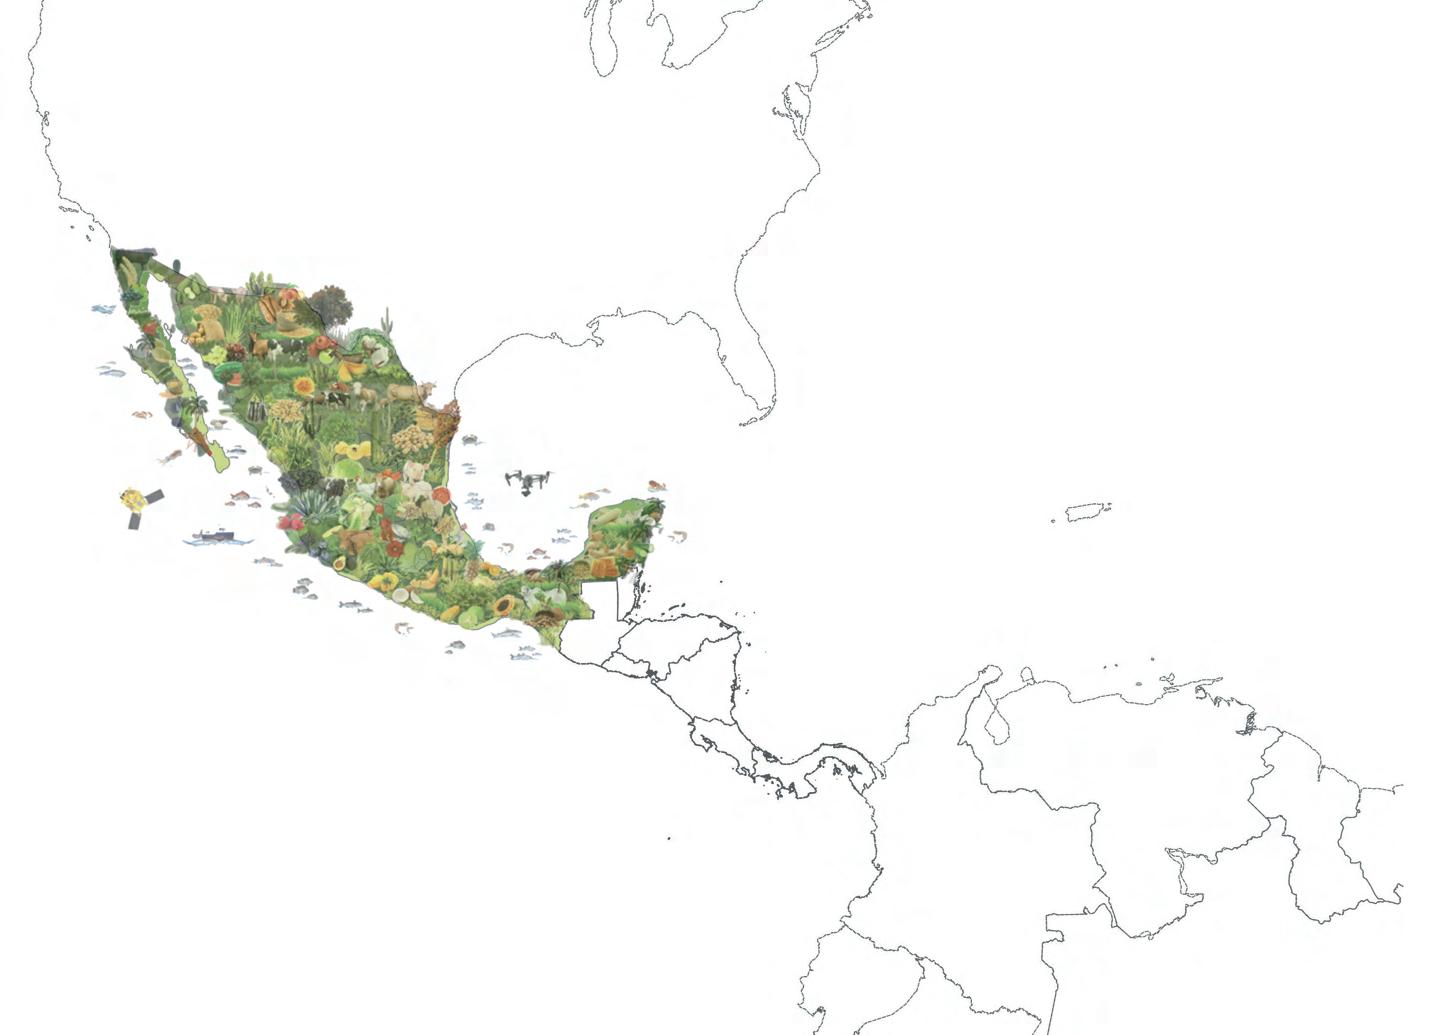
In this map we can see what is produced in each state of Mexico and also what exports and imports are made from Mexico
Made by actor.
Main countries that import food to Mexico (2023)
In the first diagram tells us that the majority of exports are made to the United States and that only smaller parts go around the world. We also realize that many products leave Mexico to the United States for packaging and return to supermarkets in Mexico.
In the second one We note how the United States is also our main importer and the great relationship we have with this country.
Main countries that Mexico exports food (2023)
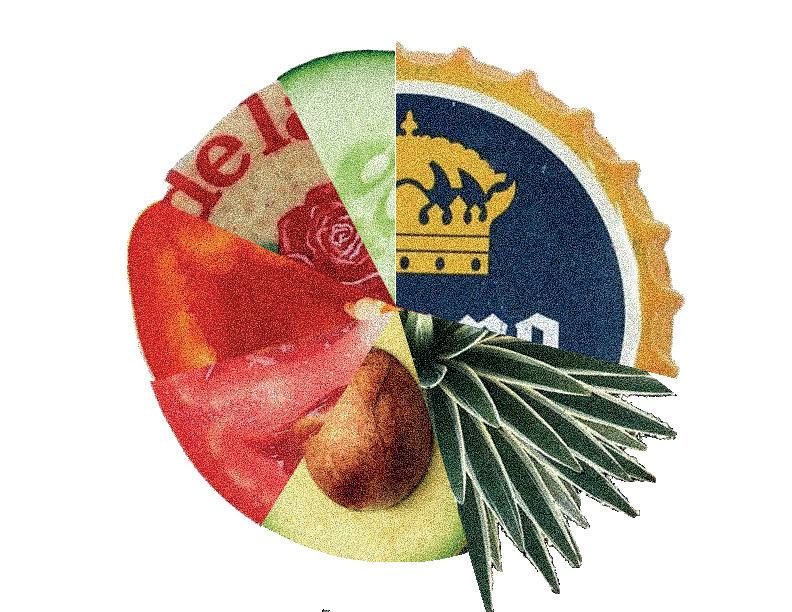
Mexican products with the highest exports (2024)
Millions of dollars
Sweets
-Units: No data
-900 mod
-Units: 880.34 million kilograms
-772 mod
Pepper -1,400 mod
-Units: 1,114.5 million kilograms
Beer
-Units: 3,150 million liters
-6,163 mod
Tomato -2,988 mod
-Units: 2.5 million tons of avocados
Avocado -3,200 mod
-Units: 2.5 million tons of avocados
Tequila -2,600 mod
-Units: 418.9 million liters
The production of our products has a great relationship with the exports and exports of our country, 3 of the products that we export the most, 2 of them are ultra-processed (beer and tequila) while the other is one of agricultural origin (avocado). Meaning that some of them mostly require additional processes and therefore more natural resources.
Cucumber
Made by actor.
Water footprint of Mexico's most exported foods
Water footprint of Mexico's most exported foods
of water
1L 4L of water
1L = 10L of water
1Kg = 2000L of water 1Kg 1Kg 1Kg = = = = 200L of water 560L of water 1500-2000L of water
of water
of water 1500-2000L of water
The consumption of water in the cultivation and processing of products is key to the development of the region, however the overexploitation of the hydrobasins should be an area of concern, for example if we put in comparison the 1kg of avocado and 1kg of traditional sweets consume the same level of water. This is especially relevant if we see that the use of water is similar for several ultra-processed products. 1L 10L of water 1Kg = 2000L of water
The food industry constitutes a substantial proportion of the nation’s economic activity, accounting for approximately 55.06% of total economic units, as indicated by data provided by the Secretaría de Economía (Ministry of Economy).Consequently, its substantial influence on Mexican society, both economically and environmentally, signifies a paramount concern due to its considerable size and impact within the national context.
Chart created with information obtained from DATA MEXICO and Secretaria de Economia (2022)
As it is a major industry, it is crucial to talk about the waste it can generate, to be more specific, according to the latest report of the Diagnostico Basico para la Gestión Integral de los residuos carried out by the Secretaría de Medio Ambiente y Recursos Naturales, the average percentage composition of waste related to food waste is 33.07%, while the rest is made up of materials that can be used and others.
Chart elaborated with information from “Diagnóstico de Básico para la Gestión Integral de los Residuos (2020)”
Food security is the right of all people to have access to safe, nutritious and sufficient food. Knowing this, focusing on Mexico, almost a third of the population suffers from moderate or severe food insecurity. This means that some 35 million Mexicans have not eaten for a day or more, they do not know if they will be able to eat today or they will sacrifice the quantity or quality of their food.
We observe the diversity that exists in the food sector and the great responsibility that comes with being one of the main economic forces of the country, especially in such a multidimensional issue as food.
Do companies have a shared responsibility for being the basis of food for millions of Mexicans?
Should alternative techniques that favor local production of products for consumption be explored?
Why are there not stricter regulations in a national context with regards to waste?
This raises a series of questions that present us with diverse scenarios that make us imagine and think about possible futures and concrete lines of action
Now it is time to delve into issues of social and cultural relevance with a broad vision of health, such as the relationship between the minimum wage and the basic food basket, which reflects one of the main barriers to adequate access to food. Despite the progress made, many sectors of the population face difficulties in meeting their basic nutritional needs, which contributes to problems such as malnutrition and increased obesity, especially among children. These challenges are increasingly serious due to poor dietary education and institutional practices, which reduce the ability of individuals to make informed decisions about their diet.
In this context, this chapter will delve into the food landscape of the country which encompasses both obesity and malnutrition, creating a cycle of inequality and public health that requires a comprehensive and multidimensional approach to its resolution with a shared vision for the future of the Mexican diet.
1. THE LINK BETWEEN THE MINIMUN WAGE AND THE BASIC FOOD BASKET 2. FOOD ACCESSIBILITY 3. FOOD EDUCATION