AUSTRALASIAN CLINICAL INDICATOR REPORT: 2012–2019: 21ST EDITION.
Published by ACHS, November 2020. 5 Macarthur Street Ultimo, NSW 2007 Australia
Copies available from the ACHS Performance and Outcomes Service
Telephone: + 61 2 9281 9955 Facsimile: + 61 2 9211 9633 E-mail: pos@achs.org.au
Electronic version available at: http://www.achs.org.au/publications-resources/australasianclinical-indicator-report/
DISCLAIMER
The expert commentary provided by the colleges, societies, and associations is contributed in response to a request from ACHS. Although ACHS appreciates the insights provided, it does not necessarily agree with or endorses the views expressed.
© The Australian Council on Healthcare Standards 2020. This work is copyright. Apart from any use as permitted under the Copyright Act 1968, no part may be reproduced by any process without prior written permission from the Australian Council on Healthcare Standards.
Requests and inquiries concerning reproduction and rights should be addressed to: The Chief Executive Officer
The Australian Council on Healthcare Standards, 5 Macarthur Street, Ultimo, NSW 2007, Australia
RECOMMENDED CITATION
Australian Council on Healthcare Standards (ACHS). Australasian Clinical Indicator Report: 2012–2019: 21st Edition. Sydney, Australia; ACHS; 2020.
ISBN Paperback: 978-1-875544-22-6
ISBN Electronic: 978-1-875544-23-3
Scan with a smart phone or device to access ‘Retrospective ACIR Data in Full’.

2 AUSTRALASIAN CLINICAL INDICATOR REPORT 2012 - 2019
Acknowledgments 5 Contributors 5
Clinical Indicator Working Parties 5 Foreword 8
About the Australasian Clinical Indicator Report 9 Key Results of 2019 10
The ACHS Clinical Indicator Program: Key Facts 2019 12
Feature Report: Maintaining Clinical Indicator Relevance 14 Clinical Indicator Trends and Variation 16 Summary of Results 23
About the ACHS Clinical Indicator Program 119
SUMMARY OF RESULTS
Anaesthesia and Perioperative Care version 6 24
Day Patient version 6 28
Emergency Medicine version 6 32
Gastrointestinal Endoscopy version 3 38


Gynaecology version 7 42
Hospital in the Home version 5 46
Hospital Wide version 13.1 50
Infection Control version 5 56
Intensive Care version 5 62
Internal Medicine version 6.1 68


Maternity version 8.1 72
Medication Safety version 4 78
Mental Health version 7 84
Ophthalmology version 6 88
Oral Health version 4 92
Paediatrics version 5.1 96
Pathology version 4.1 102

Radiation Oncology version 5 106
Radiology version 6 110
Rehabilitation Medicine version 6 114
3 CONTENTS, SUMMARY OF RESULTS
CONTENTS
TABLES
Table 1: List of Clinical Indicator Working Party Chairs and Participating Organisations 6
Table 2: Number of CI sets, CIs, HCOs reporting and data submissions in 2012-2019 12
Table 3: Number of HCOs reporting by state, sector and metropolitan/non-metropolitan characteristics in 2019 13
Table 4: HCOs providing data for one or more CIs within each CI set in 2012-2019 13
Table 5: Summary of the trends by CI set: CIs that have statistically significant (p<0.05) trends in the desirable or undesirable direction 16
Table 6: Relative Risk (RR) for CIs in each CI set – a high relative risk reveals high systematic variation between HCOs 17
Table 7: Number of CIs whose mean rates were statistically significantly different by Australian states and territories/ New Zealand, public/private, metropolitan/non-metropolitan in 2019 17
Table 8: Number of CIs, HCOs reporting and data submissions that were outliers in 2019 19
Table 9: Number of CIs that had six-monthly data submissions that were outliers in 2019 19
Table 10: Number of HCOs that had CIs that were outliers in 2019 20
4 AUSTRALASIAN CLINICAL INDICATOR REPORT 2012 - 2019
ACKNOWLEDGMENTS
The Australian Council on Healthcare Standards (ACHS) would like to thank the healthcare organisations (HCOs) participating in the ACHS Clinical Indicator Program for their data, which form the content of this report.
The ACHS Performance and Outcomes Service (POS) would also like to thank its collaborators in the development and review of the Clinical Indicators (CIs), particularly the Working Party Chairs and members. In addition, POS acknowledges the role played by the Health Services Research Group (HSRG) at the University of Newcastle in preparing this report.
CONTRIBUTORS
ACHS Executive
Dr Karen Luxford
Chief Executive Officer
Ms Linda O’Connor
Executive Director – Customer Services and Development
Dr Lena Low Executive Director – Corporate and Surveyor Workforce
Mr Michael Giuliano Executive Director – International Business
ACHS Board Editorial Group Prof Geoffrey Dobb
Dr Paul Scown
Layout and Design
Mr Aiden DeStefano
ACHS Designer
Content and Editing
Ms Linda O’Connor
Executive Director – Customer Services and Development
Mr Simon Cooper Manager – Performance and Outcomes Service
Dr Kriscia Tapia Project Officer - Performance and Outcomes Service
Dr Brian Collopy Clinical Advisor – Performance and Outcomes Service
Mr Ian McManus Communications Manager
Data Analysis Prof Robert Gibberd Director – Health Services Research Group, University of Newcastle
Mr Stephen Hancock Senior Statistician – Health Services Research Group, University of Newcastle
Ms Phoebe Zhang Data Analyst – Performance and Outcomes Service
CLINICAL INDICATOR WORKING PARTIES
ACHS CIs are developed by Working Parties comprising practising clinicians (medical officers, nurses and allied health professionals in the relevant specialty field), representatives of the relevant Australian and New Zealand colleges, associations and societies, consumer representatives, statisticians and ACHS staff.
Selected Working Parties meet several times throughout the year, both in person and via teleconference, to review the existing CIs and explore areas for new CIs. The revised version of the CI set and its User Manual are then endorsed by the relevant colleges, associations or societies prior to implementation.
CI sets are regularly reviewed to ensure:
• they are relevant for clinicians
• they continue to reflect today’s healthcare environment
• there is consensus on collection and reporting requirements
• they are regarded as useful for quality improvement.
5 TABLES,
ACKNOWLEDGMENTS, CONTRIBUTORS, CLINICAL INDICATOR WORKING PARTIES
TABLE 1: List of Clinical Indicator Working Party Chairs and Participating Organisations
CI SET WORKING PARTY CHAIR PARTICIPATING ORGANISATIONS
Anaesthesia and Perioperative Care V6
Day Patient V5
Emergency Medicine V6
Gastrointestinal Endoscopy V2
Dr Joanna Sutherland (ANZCA)
Ms Mary Kirkwood (APHA)
A/Prof Melinda Truesdale (ACEM)
A/Prof William Tam (GESA)
Australian and New Zealand College of Anaesthetists Australian Society of Anaesthetists
Australian Private Hospitals Association Day Hospitals Australia Australian Day Surgery Nurses Association
Australasian College for Emergency Medicine College of Emergency Nursing Australasia
Day Hospitals Australia Gastroenterological Society of Australia Gastroenterological Nurses College of Australia
The Royal Australian and New Zealand College of Obstetricians and Gynaecologists Australian College of Nursing Hospital in the Home V5 A/Prof Mary O’Reilly (HITHSA) Hospital in the Home Society Australasia
Gynaecology V7 Dr Martin Ritossa (RANZCOG)
Hospital-Wide V12.1 Dr David Rankin (RACMA)
Infection Control V5 Dr Philip Russo (ACIPC)
Intensive Care V5
A/Prof Mary White (ANZICS)
Internal Medicine V6.1 Prof Donald Campbell (IMSANZ)
Maternity V8 Prof Michael Permezel (RANZCOG)
Medication Safety V4 Dr Sasha Bennett (NSW TAG)
Mental Health V7 Dr Bill Kingswell (RANZCP)
Ophthalmology V6 Dr Michael Hennessy (RANZCO)
The Royal Australasian College of Medical Administrators
The Royal Australasian College of Surgeons Australian College of Nursing
Australasian College for Infection Prevention and Control Australian College of Nursing
Australian and New Zealand Intensive Care Society College of Intensive Care Medicine of Australia and New Zealand Australian College of Critical Care Nurses
Internal Medicine Society of Australia and New Zealand Australian College of Nursing
The Royal Australian and New Zealand College of Obstetricians and Gynaecologists Australian College of Midwives
NSW Therapeutic Advisory Group Clinical Excellence Commission Australian Commission on Safety and Quality in Health Care
Royal Australian and New Zealand College of Psychiatrists Australian College of Mental Health Nurses
The Royal Australian and New Zealand College of Ophthalmologists Australian Ophthalmic Nurses' Association
Oral Health V4 Dr Hugo Sachs (ADA) Australian Dental Association Royal Australasian College of Dental Surgeons
Paediatrics V5.1 Dr Simon Fraser (PCHD, RACP)
Paediatrics and Child Health Division of The Royal Australasian College of Physicians Australian College of Children and Young People's Nurses Women’s and Children’s Healthcare Australasia
6 AUSTRALASIAN CLINICAL INDICATOR REPORT 2012 - 2019
TABLE 1: List of Clinical Indicator Working Party Chairs and Participating Organisations
CI SET WORKING PARTY CHAIR PARTICIPATING ORGANISATIONS
Pathology V4.1
A/Prof Peter Stewart (RCPA)
Radiation Oncology V4 Prof Jeremy Millar (RANZCR)
Radiology V6 Prof Stacy Goergen (RANZCR)
Rehabilitation Medicine V6 Ms Frances Simmonds (AROC, AFRM)
The Royal College of Pathologists of Australasia Australian College of Nursing
Faculty of Radiation Oncology of The Royal Australian and New Zealand College of Radiologists Australian College of Physical Scientists and Engineers in Medicine Australian Society of Medical Imaging and Radiation Therapy
Faculty of Clinical Radiology of The Royal Australian and New Zealand College of Radiologists Medical Imaging Nurses Association Australian Society of Medical Imaging and Radiation Therapy I-MED Radiology Network
Australasian Rehabilitation Outcomes Centre Australasian Faculty of Rehabilitation Medicine
7
TABLES,
ACKNOWLEDGMENTS, CONTRIBUTORS, CLINICAL INDICATOR WORKING PARTIES
FOREWORD

On behalf of the Australian Council on Healthcare Standards (ACHS), I would like to present the Australasian Clinical Indicator Report 21st Edition 2012-2019. The report examines data sourced from a broad range of clinical specialty areas. As in previous years, the 21st Edition of the Australasian Clinical Indicator Report provides key points on significant trends, strata differences and outlier effects between 2012 and 2019 for a broad range of Clinical Indicators.
The report also includes commentary by professionals within the respective healthcare specialty to provide context to the complex and ever-changing healthcare environment and provide insight for the potential to improve quality and safety within their facility.
During the 31-year history of developing the Clinical Indicators and this new Australasian Clinical Indicator Report, ACHS has proudly collaborated with medical colleges, societies, and associations. These key stakeholders have been offered the opportunity to contribute comments within their specialist area for each of the 20 Clinical Indicator sets, which contain 324 individual Clinical Indicators.
Dr Brian Collopy and Simon Cooper have written the feature report contained within this year’s Report. It discusses maintaining Clinical Indicator relevance in a period of significant technological change and when the use of data is growing exponentially.
The ACHS provides the Australasian Clinical Indicator Report to key health industry bodies, Federal and State Governments, our members and assessors, and other interested parties. The report is available to download on the ACHS website. A full retrospective report for each Clinical Indicator set is also available on the website.
To conclude, I have confidence that the Australasian Clinical Indicator Report 21st Edition 2012-2019 will provide you with valuable knowledge of our healthcare industry for which it was intended. In providing this insight, I would like to extend my appreciation to all collaborating colleges, associations, and societies. Their continued support of the Clinical Indicator Program allows us to continue our efforts to improve healthcare standards in Australia and internationally.
Prof Len Notaras AM ACHS President September 2020
8 AUSTRALASIAN CLINICAL INDICATOR REPORT 2012 - 2019
ABOUT THE AUSTRALASIAN CLINICAL INDICATOR REPORT (ACIR)
This Australasian Clinical Indicator Report 21st Edition 2012-2019 provides an overview of the results for each CI set for the last eight years, with additional commentary from the collaborating medical colleges, associations, specialist societies and other clinical organisations. Their expertise provides context for the trends or variations observed in the data.
A Printed Report
This report summarises the CI data submitted to the ACHS Clinical Indicator Program for the years from 2012-2019. The report highlights significant trends or variation in the data over time, which can suggest areas where there is scope to improve practice.
The Summary of Results section, commencing on page 23, describes observations drawn from the data of each CI. To capture the context and circumstances that influence the data, ACHS draws upon the expertise of the specialist healthcare colleges, societies, and associations, in addition to the other clinical organisations with which it collaborates. Their comments and expert feedback precede the summaries of the data and share subheadings within the Summary of Results and the ACIR Retrospective Data in Full Report, to assist cross-referencing.
The expert commentators review the retrospective data in full and respond to questions from ACHS. The views expressed in the commentaries are those of the authors, and not necessarily shared by ACHS.
ACIR Retrospective Data in Full Report
Every year, the Australasian Clinical Indicator Report (ACIR) lists collective performance against each of the ACHS CIs. This information is published on the ACHS website: https://www. achs.org.au/programs-services/clinical-indicator-program/ acir-australasian-clinical-indicator-report/ and can be accessed by scanning this QR code with a smartphone or device.
An ACIR Retrospective Data in Full Report is created for every Clinical Indicator set and provides detailed information about
each CI collected in 2019. Listed within the report are the CI, its intent, the numerator, and denominator. Tables summarise the data submitted in every year since 2012 that the CI has been available for reporting.
Trends in the rates over time are reported with statistical significance, and the data are displayed in a graph if four or more years of data are available from five or more HCOs. There are three measures of variation in rates between HCOs included in this report. These are quantified by the differences between the 20th and 80th centiles.
Where significant differences between strata have occurred in 2019, these data are reported in additional tables, and the information is illustrated graphically using box plots. The absence of a specific comparator table means that the differences between strata were not statistically significant at three standard deviations or that the minimum number of contributors to enable comparison was not met. Outlier information is displayed through funnel plots.
The full report also statistically estimates the potential improvement (gains) for all eligible CIs, if changes in the distribution of rates were achieved.
Statistical Methods
The statistical methods used to analyse and report these data are also available online at https://www.achs.org.au/programsservices/clinical-indicator-program/acir-australasian-clinicalindicator-report/ , along with a description of how to read, understand and use the retrospective data.
FOREWORD, ABOUT THE AUSTRALASIAN CLINICAL INDICATOR REPORT (ACIR)
9
KEY RESULTS OF 2019
IMPROVEMENTS
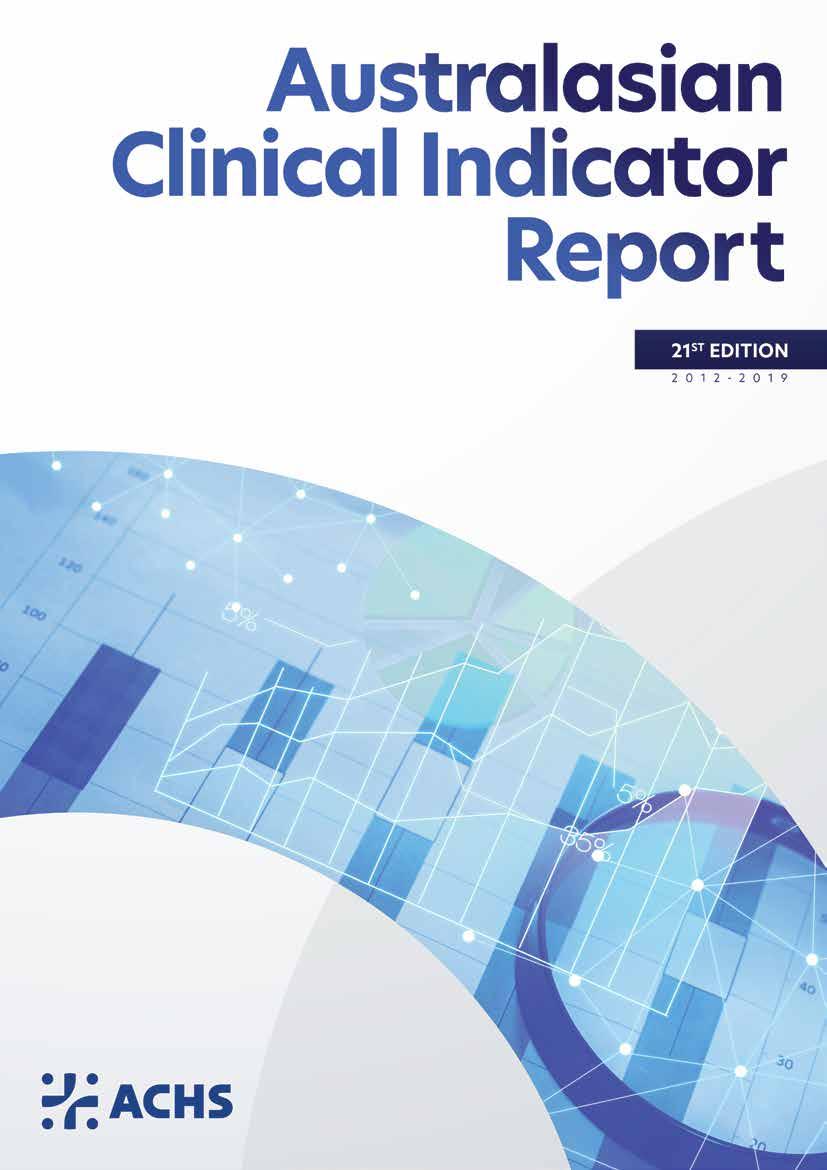
In 2019, there were 114 CIs which showed statistically significant trends in the desired direction. Of these, 59 CIs remained significant after allowing for changes in the composition of HCOs contributing over the period. There were 8 CI sets that had an improvement in at least two-thirds of all significantly trended CIs. They were Anaesthesia and Perioperative Care, Day Patient, Emergency Medicine, Gynaecology, Hospital in the Home, Hospital-Wide, Infection Control and Intensive Care. For the CIs denoted below (L) means low desirable rate while (H) means high desirable rate. There were noteworthy improvements in the following sets:
Trend plot of rates and centiles by year
Day Patient
4.1 Patients who experience an adverse event during care delivery (L)
This well reported indicator shows that the rate of adverse events reported during care delivered for day procedure centres approximately halved. The fitted rate has dropped from 0.12 in 2013 to 0.068 in 2019. There was a decrease in system wide variation as measured by the difference between the 80th and 20th centiles, showing a significant improvement in the previous poorer performers.
Hospital-Wide
3.1
Inpatients who develop 1 or more pressure injuries
(L)
The rate of inpatients who develop 1 or more pressure injuries has decreased significantly since 2015.The fitted rate decreased by approximately one third from 0.078 to 0.053 per 100 bed days. The rate of both the 20th and 80th centiles continues to improve. In 2019, 366 HCOs reported 4,868 pressure injuries in 11,259,237 bed days (0.0432 per 100 bed days).
Hospital-Wide
6.1
Significant adverse blood transfusion events (L)

The rate of significant adverse events from blood transfusion in healthcare organisations has decreased significantly since 2012, with a decrease from 0.19 to 0.11 per 100 transfusions. The decrease was accompanied by improvements in both the 20th and 80th centiles over the review period.
Mental Health
3.7 Monitoring of metabolic side effects for consumers taking regular antipsychotic medications (H)


The rate of monitoring of metabolic side effects for consumers taking regular antipsychotic medications has improved over the short period the indicator has been in use. The four-year period shows an improvement in the fitted rate from 29.3 to 70.7 percent. There was a significant improvement in the 20th and 80th centiles, showing industry-wide improvement.
10 AUSTRALASIAN CLINICAL INDICATOR REPORT 2012 - 2019
KEY RESULTS OF 2019
DETERIORATIONS
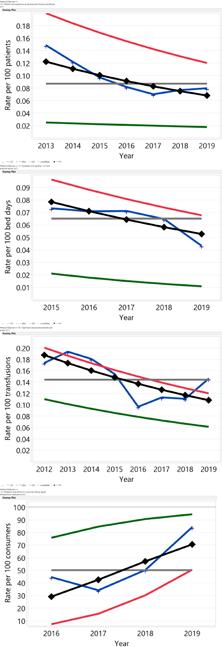
In 2019, there were 47 CIs which showed statistically significant trends in the undesirable direction. Of these, 15 remained significant after allowing for changes in the composition of HCOs contributing over the period. It is recommended that HCOs give consideration to determining and to addressing the reasons for the deterioration. There were noteworthy deteriorations in the following sets:
Trend plot of rates and centiles by year Infection
Control
3.1 Haemodialysis – Arteriovenous-fistula access-associated blood-stream infection (L)

The rate of patients on haemodialysis with an arteriovenous fistula access-associated blood-stream infection grew from a low fitted rate in 2012 of 0.023 to 0.071 per 100 patient-months in 2019. There has also been a corresponding increase in variability in the data with divergent 20th and 80th centiles.
Maternity
1.2 Selected primipara - induction of labour (L)


The rate of induction of labour for the selected set of primipara mothers has increased since 2012 with a deterioration from 30 to 45.6 percent of births. There has been a steady increase in both the 20th and 80th centile rates during the period and the trend does not appear to be flattening, which indicates this is an ongoing trend.
Mental Health
5.4 Physical restraint - 1 or more episodes (L)
There is an ongoing increase in the rate of physical restraint. The fitted rate increased from 1.9 to 5.7 per 100 episodes of care between 2012 and 2019. In 2019, there were 35 records from 22 HCOs. The annual rate was 4.8 per 100 episodes of care. Both the poorest 80th centile rate and the best 20th centile rate deteriorated over the period.
Oral Health
1.1 Restorative treatment - teeth retreated within 6 months (L)
The rate of teeth needing repeated restorative treatment within 6 months of the primary treatment has deteriorated with a fitted increase from 6.2 to 6.9 per 100 teeth restored. The best 20th centile rate has remained steady.

11 KEY RESULTS OF 2019 - IMPROVEMENTS / DETERIORATIONS
THE CLINICAL INDICATOR PROGRAM: KEY FACTS 2019
In this Australasian Clinical Indicator Report 21st Edition 2012-2019, there are a total of 20 Clinical Indicator (CI) sets. In 2019 there were data submitted for 313 of the possible 324 CIs across these sets. Data within this report are submitted from healthcare organisations (HCOs) from every state and territory within Australia, HCOs within New Zealand and member organisations located in Asia. These HCOs are from both the public and private sectors, and from metropolitan and non-metropolitan regions.
Clinical Indicators and data submissions
Participation in the Clinical Indicator Program is voluntary for HCOs. An eight-year trend of number of HCOs participating in the program demonstrates a consistent level of participation in the program. Variation of increased participation is noted in 2014 – 2016, due to the NSW Ministry of Health (MOH) Occupational Exposure initiative, which mandated that NSW public hospitals collect two occupational exposure indicators within the Infection Control clinical indicator set. ACHS was contracted to collate and generate occupational exposure data for the 203 eligible public health organisations in NSW. From 2016, NSW Workcover no longer required the NSW MOH to collect this data.
A review of state by state participation at this time noted that the increase in collection from 2014 – 2016 is only in NSW, and directly related to the NSW MOH project. In this edition of the report, ACHS has excluded HCOs participating only in the NSW MOH project that was running in parallel to the Clinical Indicator program, to more accurately reflect trends of participation. HCOs participating in the MOH project and also collecting one or more other ACHS indicators have been retained in the data, contributing to the increase in HCO participation in 2015.
The number of participating private hospitals remained steady between 2012 to 2019. With recent increased engagement
of private hospitals in the program, it is likely that number of HCOs reporting in this sector will be reflected as an increase in subsequent reports. Recent mergers and reorganisation of smaller individual facilities now reporting as one larger HCO has consolidated the number of HCOs reporting, in some cases. High retention of HCOs participating in the Clinical Indicator program is noted.
While most organisations make two submissions to each of their selected CIs in a year, it should be noted that some organisations submit intermittently. The data are analysed and comparison reports are prepared for submitting HCOs every six months. A slight increase in the average number of actual CIs reported by an HCO is noted.
In 2019, the total number data submissions was 28,459. The number of submissions from the private and public sectors were 16,740 and 11,719 respectively.
Table 2 gives the number of CIs and sets by sector, the number of reporting HCOs and the number of six-monthly CI data submissions. Table 2 gives the number of CIs and sets by sector, the number of reporting HCOs and the number of six-monthly CI data submissions.
Table 2: Number of CI sets, CIs, HCOs reporting and data submissions in 2012-2019 2012 2013 2014 2015 2016 2017 2018 2019
Clinical Indicator Sets 22 22 22 21 20 20 20 20
Clinical Indicators 335 338 328 314 318 324 332 324
Reporting HCOs
Private 335 323 325 328 323 326 326 317 Public 345 346 407 439 404 351 329 322 Total 670 669 732 767 727 677 655 639
Submissions *
Private 18,427 17,723 17,963 17,041 16,869 17,218 17,546 16,740 Public 20,435 18,563 17,102 15,404 14,772 13,647 12,614 11,719 Total 38,862 36,286 35,065 32,445 31,641 30,865 30,160 28,459 * CI data are submitted every six months. Most HCOs submit data twice a year; however, some submit data for one-half of the year only.
HCOs reporting
In 2012 and 2013 there were similar numbers of public and private HCOs reporting. From 2014 – 2016, there were more public than private HCOs reporting, due to the NSW MOH project. Between 2017 – 2019 there were similar numbers of public and private HCOs reporting.
The geographic breakdown of the number of public and private HCOs submitting data is presented in Table 3. There were 412 metropolitan HCOs and 227 non-metropolitan HCOs participating in the Clinical Indicator Program in 2019.
12 AUSTRALASIAN CLINICAL INDICATOR REPORT 2012 - 2019
Table 3: Number of HCOs reporting by state, sector and metropolitan/non-metropolitan characteristics in 2019
Location Private Public Metropolitan Non-metropolitan Total
New South Wales 120 90 151 59 210
Victoria 61 96 80 77 157
Queensland 65 29 62 32 94 South Australia 19 71 49 41 90 Western Australia 17 25 38 4 42
Tasmania 7 4 0 11 11
Australian Capital Territory 8 2 10 0 10 Northern Territory 1 2 0 3 3 New Zealand 1 2 3 0 3 Asia 18 1 19 0 19
Total 317 322 412 227 639
Clinical Indicators reported by each HCO
In 2019, the average number of individual CIs reported was 23.3, with half of all HCOs reporting between nine and 32 CIs (25th and 75th centiles). The variation in the number of CIs reported by each HCO is mostly due to the different services provided by the HCO. For example, not all HCOs have an emergency department, intensive care unit, obstetrics, paediatrics or other specialities. During the last three years, the mean and median number of CIs collected by individual HCOs in each year has remained relatively stable. The median number of CIs collected varied between 14
and 16 and the mean varied between 20.3 and 23.3. Table 4 shows that in 2019 there were five CI sets with at least 150 HCOs providing data. While there are five CI sets where fewer than 50 HCOs participate, a small number of HCOs may still provide a representative sample of all HCOs in Australia and New Zealand for some CIs. However, from a quality improvement perspective, it means that these HCOs have less data with which to determine whether the clinical areas in these sets could potentially improve their performance.
Table 4 : HCOs providing data for one or more CIs within each CI set in 2012-2019
Clinical Indicator Set 2012 2013 2014 2015 2016 2017 2018 2019 Anaesthesia and Perioperative Care 288 273 261 250 241 241 242 231 Day Patient 370 337 318 308 290 280 277 282 Emergency Medicine 181 174 150 137 137 112 96 100 Gastrointestinal Endoscopy 91 77 78 76 80 79 77 85 Gynaecology 65 58 52 58 61 66 60 56 Hospital in the Home 37 39 34 30 17 19 20 20 Hospital-Wide 478 466 468 525 486 431 418 416 Infection Control† 334 424 424 401 351 345 343 339 Intensive Care 104 102 107 96 93 91 89 95 Internal Medicine 74 62 46 36 32 25 25 24 Maternity 188 184 175 170 166 157 144 135 Medication Safety 259 260 269 276 265 268 275 275 Mental Health 125 119 118 105 84 93 93 96 Ophthalmology 77 72 75 64 66 55 53 58 Oral Health 15 14 84 90 92 86 88 85 Paediatrics 40 37 11 29 27 21 35 39 Pathology 42 40 44 39 35 38 34 25 Radiation Oncology† 20 17 14 14 13 8 9 8 Radiology† 69 64 41 40 41 35 23 23 Rehabilitation Medicine 122 115 105 102 122 120 121 124 Any Clinical Indicator 670 731 807 825 736 681 656 633 †Revised Clinical Indicator set introduced in 2017 Infection Control, Radiology and Radiation Oncology were revised and combined in 2017
13 THE CLINICAL INDICATOR PROGRAM: KEY FACTS 2019
FEATURE REPORT
MAINTAINING CLINICAL INDICATOR RELEVANCE
B Collopy FRACS, FRACMA. Clinical Advisor, Performance & Outcomes Service, ACHS S Cooper B Biotech, MBM. Manager, Performance & Outcome Service, ACHS
Introduction
Just as with the development of clinical practice guidelines (CPGs) there is a need and an obligation on the part of the developers of performance measures, such as clinical indictors (CIs), to ensure that they remain relevant to current clinical practice. Whilst there is a moderate amount of literature in this regard for CPGs1, 2, only a small number of articles address methods for updating CIs and provide limited value in the identification of assessable criteria 3 . For a program that is now in its 27th year of operation, the Australian Council on Healthcare Standards (ACHS) early on had established a process of approximately three-yearly reviews of each CI set, addressing individual CIs for evidence of their value as flags to indicate the quality of patient care. Table A lists 11 CI sets which have had more than five revisions.
Signs of effectiveness/importance of a Clinical Indicator
i. A high return of data. For example, 365 health care organisations (HCOs) returned data on inpatient falls and 249 HCOs returned data on unplanned readmissions to hospital in the first half of 2019
ii. A desirable trend, as demonstrated in the 2018 and 2019 data for bile duct injury at cholecystectomy, and for central line infections in ICU4
iii. An undesirable trend, as demonstrated in the 2019 data for aspiration following endoscopy and for episodes of physical restraint4
iv. HCO reported actions. Prior to a review of the CI set a survey of HCOs is conducted, requesting information on actions taken following review of their peer-comparative data. An example of HCO-reported actions for the HospitalWide CI set in 2017, is shown in Table B.
v. Early response to a CI’s introduction. With a number of CIs a marked response can be seen within the first 2-3 years following their introduction, as was seen with the pre-anaesthetic consultation rate and with patients being discharged on three or more psychotropic drugs5
Signs of ineffectiveness of a Clinical
Indicator
i. A low return of data. For example, in 2018 only four HCOs returned data on documented discharge plans for acute asthma patients.
ii. No change in the rate. For example, in 2018 the rate for cancellation of a day procedure due to the presence of an acute medical condition remained unchanged whilst the rate for cancellation due to a pre-existing medical condition decreased over the same period. Clearly the issue in the latter group was foreseeable and therefore correctable, but the circumstances in the former group were unlikely to be within the control of the providers.
iii. A plateau reached. An important attribute of a CI is its responsiveness. This is reduced when a rate approaches 100% (for process CIs) or zero (for outcome CIs) as shown in Figure 1.
iv. Rate deterioration after initial improvement. This may occur due to a change in clinical practice, as is seen in Figure 2. In this example the change resulted from HCOs introducing percutaneous coronary intervention (PCI) as the initial urgent management for patients with ST elevation in acute myocardial infarction (STEMI)6. “Door to balloon time” CIs have now been introduced to address this, the thrombolysis CI remaining for those HCOs without the facility for PCI.
Review process for a Clinical Indicator set
i. Contributing HCOs are surveyed for opinions on the current set including possible revisions, deletions and suggestions for new CIs
ii. Peak body representation is sought for the Chair and membership of a multidisciplinary working party, which would include a University health care statistician and a consumer representative, as well as members of the ACHS Performance and Outcome Service (POS)
iii. Once formed, a similar survey (as in i.) of the working party members is then conducted
iv. A one day Working Party meeting is held, the members having been provided with results of the two surveys, the set’s ‘Long Report’ (containing the previous 8 years of data), the current User Manual and suggestions for retention, revision or deletion, from the POS Clinical Advisor
v. Correspondence with the Working Party members to confirm the content of the revised (or new) set of CIs
14 AUSTRALASIAN CLINICAL INDICATOR REPORT 2012 - 2019
FEATURE REPORT
Production of the revised set
i. A literature review is performed for each new or revised CI ii. A new User Manual is developed
iii. The User Manual is endorsed by the relevant peak body or bodies
iv. Confirmation of the set by the ACHS Board, v. Release of the User Manual for data collection in the next appropriate six-month period
The process from the commencement of the first survey to the release of the revised User Manual is generally 6-8 months. The cost of the exercise is borne by the ACHS. Nevertheless the process is essential to maintain the interest and co-operation of the HCOs and their clinical staff, in the pursuit of optimal clinical care.
Table A. CI sets with more than 5 revisions
Clinical Indicator Set Version Hospital-Wide 13 Maternity 8 Gynaecology 8 Mental Health 7 Anaesthesia & Perioperative Care 7 Emergency Medicine 6 Intensive Care 6 Internal Medicine 6 Ophthalmology 6 Radiology 6 Rehabilitation 6
Table B. 120 actions by 48 HCOs after data review for the Hospital-Wide CI set (2017)
Action Number Quality activity 29 Education 33 Policy/Procedure change 37 Staff change 3 Equipment change 10 Other 8
Figure 1. Rate of change after introduction of a CI
Performance
Desirable Trend (Mainly Process CIs)
Figure 2. Rate deteriorated after initial improvement
Thrombolysis for AMI within 1 hour
Early improvement then later fall influenced by PCI ‘Door to Balloon Time’ CIs have been introduced.
REFERENCES
1. Martinez Garcia L, Pardo-Hernandez H, Sanabria AJ, et al. Guideline on terminology and definitions of updating clinical guidelines: The Updated Glossary. J Clin Epidemiol. 2018; 95: 28-33
2. Gurgel RK. Updating clinical Practice Guidelines: How do we stay current? Otolaryngol Head Neck Surg. 2015; 153: 488-90
3. Min JK, Cha JM, Cho YK, et al. Revision of Quality Indicators for the Endoscopy Quality Improvement Program of the National Cancer Screening Program in Korea. Clin Endosc. 20018; 51: 239-252
4. Australasian Clinical Indicator Report:2012-2019 , 21st Edition, Sydney, Australia, ACHS 2020
5. Australasian Clinical Indicator Report: 2011-2018, 20th Edition, Sydney, Australia, ACHS 2019
6. Silber S, Albertsen P, Aviles FF, et al. Guidelines for Percutaneous Coronary Interventions. The Task Force for Percutaneous Coronary Interventions of the European Society of Cardiology. Eur Heart J. 2005; 26: 804-47
15 ABOUT THE ACHS CLINICAL INDICATOR PROGRAM, FEATURE REPORT
50% 55% 60% 65% 70% 75% 80% 85% 1996 1998 2000 2002 2004 2006 2008 2010 2012
Desirable Trend (Mainly Outcome CIs) Time Early improvement then later fall (i) influenced by PCI ‘Door to Balloon Time’ CIs have been introduced
THE CLINICAL INDICATOR PROGRAM: TRENDS AND VARIATIONS
Revealing the potential to improve performance
Within an individual facility, fluctuations in performance compared to the overall performance of the submitting HCOs may focus attention on areas for further investigation.
From a health system perspective, the goal would be to see an overall trend in the desired direction. For the majority of CIs which are process-based, a decrease in variation between the best performing HCOs and the remainder would demonstrate improvement across the system.
Using trends and variation from a systems perspective
The Australasian Clinical Indicator Report shows the trends in the rates for each CI (if four or more years of data are available) and three measures of the variation in rates between HCOs. The variations in clinical practice are quantified by the differences between the 20th and 80th centiles, the differences between the strata, and the rates for the HCOs that are outliers.
The report also estimates the potential improvement if: • the mean rate was shifted to the better centile rate, • the mean rate was shifted to the best stratum rate, and • outlier HCOs with less desirable rates were to shift their rate to the mean rate.
This is calculated for each year and is reported using tables and graphs. The text that summarises the results is divided into: • a summary of the trends in the mean rates and centiles, • a table of the differences in the strata rates if they are statistically significant, and • the number of outlier HCOs.
To view the results in full and for more information on the methodology used in this report, refer to the documentation available on the ACHS website (www.achs.org.au/publicationsresources/australasian-clinical-indicator-report/) located with this summary report.
Clinical Indicator trends 2012-2019
Of the 324 CIs in 2019, 313 are rate-based CIs, whereby data were collected for all but 9 of these CIs. Of the 304 CIs collected in 2019, 294 had a desirable direction specified (high or low rates indicating better care). Trends could be analysed for 197 of the rate-based CIs. The CIs were not analysed for trends if there were less than four years of data, no desirable direction specified or less than five HCOs reporting. Of the 20 sets, 19 had CIs that were tested for trend. Of these, there were 15 CI sets which had more CIs moving in the desirable direction than in the undesirable direction. There were eight CI sets that had an improvement in at least two-thirds of all trended CIs. They were Anaesthesia and Perioperative Care, Day Patient, Emergency Medicine, Gynaecology, Hospital in the Home, Hospital-Wide, Infection Control and Intensive Care.
Since the trend in CIs can be due to a changing mix of contributing HCOs, the CIs were tested again to determine whether the trend remained statistically significant after allowing for changes in the HCOs submitting data. Of those 114 statistically significant trends in the desirable direction, 59 remained significant after allowing for changes in the HCOs submitting, and of those 47 CIs whose trends were deteriorating, 15 remained significant. There were 36 CIs that showed no statistically significant trend. The trend results are summarised in Table 5
16 AUSTRALASIAN CLINICAL INDICATOR REPORT 2012 - 2019
THE CLINICAL INDICATOR PROGRAM: TRENDS AND VARIATIONS
Table 5: Summary of the trends by CI set: CIs that have statistically significant (p<0.05) trends in the desirable or undesirable direction
Clinical Indicator Set
Number of CIs* Number analysed† Desirable trend‡ Undesirable trend‡ No Trend
Anaesthesia and Perioperative Care 18 16 10 (4) 3 (0) 3 Day Patient 14 9 8 (2) 1 (1) 0
Emergency Medicine 21 14 6 (4) 5 (1) 3 Gastrointestinal Endoscopy 11 7 2 (2) 0 (0) 5 Gynaecology 8 8 6 (5) 0 (0) 2 Hospital in the Home 9 5 4 (2) 0 (0) 1 Hospital-Wide 26 15 9 (8) 3 (0) 3 Infection Control 26 20 15 (7) 2 (1) 3 Intensive Care 15 14 10 (2) 1 (0) 3
Internal Medicine 18 6 4 (2) 1 (1) 1 Maternity 20 16 6 (5) 7 (6) 3 Medication Safety 20 13 7 (2) 5 (1) 1
Mental Health 27 14 4 (0) 6 (2) 4 Ophthalmology 17 7 4 (4) 2 (0) 1
Oral Health 9 5 4 (3) 1 (0) 0 Paediatrics 14 4 2 (1) 1 (0) 1 Pathology 16 16 6 (1) 8 (2) 2
Radiation Oncology 9 2 1 (1) 1 (0) 0 Radiology 9 0 - -Rehabilitation Medicine 6 6 6 (4) 0 (0) 0
Total 313 197 114 (59) 47 (15) 36
Percent of tested 100% 58% (30%) 24% (8%) 18%
* Includes only rate-based CIs where the desired rate is specified as either high or low.
† Trends are not reported for CIs with less than four years of data, or fewer than five HCOs reporting, and only rate-based indicators with desirable rate High (H) or Low (L) were tested.
‡ The number in brackets is the number of CIs that had statistically significant trends after allowing for changes in the HCOs contributing the data.
Variation in Clinical Indicator rates
Calculating relative risk from the centiles
Given that HCOs may be large or small, there is a need to control for the differences in the random variations or confidence intervals for each HCO. To this end, ‘shrunken rates’ are used. The standard deviations of these ‘shrunken rates’ could be presented as a measure of variation between HCOs. These distributions are not symmetrical so the 20th and 80th centiles are reported. The region between these centiles contains the ‘shrunken rates’ for 60% of HCOs and the difference between the 20th and 80th centiles is approximately twice the standard deviation of the rates.
A measure that can be used from the centiles is the relative risk (RR) of having an event when the poorer centile applies compared to when the better centile applies. The relative risk is used to identify CIs where there is large systematic variation
in rates. If the better rate is the 20th centile, then the RR is the ratio of the 80th centile to the 20th centile rates, R (80) and R (20). The formula is as follows:
When the desired level is low: R(20) is the better rate of undesirable events (rates are usually less than 0.5).
When the desired level is high: 1-R(80) is the better rate of non-occurring events.
RR = R(80) R(20)
RR = 1-R(20) 1-R(80)
The RR will be calculated for CIs where there were 20 or more submissions and potential gains of at least five events. The RR was thus calculated for 174 CIs.
17 TRENDS AND VARIATIONS
THE CLINICAL INDICATOR PROGRAM: TRENDS AND VARIATIONS
While the formulae may appear somewhat daunting, the interpretation is clear. Greater values in the RR indicate greater systematic variation in rates for a given CI, and it may be appropriate to determine the causes of these variations.
Table 6 shows that there are 66 CIs (39% of those tested) with high RR (≥10). These CIs occur in 15 of the 18 CI sets tested, and six CI sets with more than half the CIs having high RR.
Table 6: Relative Risk (RR) for CIs in each CI set – a high relative risk reveals high systematic variation between HCOs
Clinical Indicter Set
Number of CIs CIs tested* RR: 1 to <2 RR: 2 to <10 RR: ≥10 % ≥10
Anaesthesia and Perioperative Care 18 11 - 4 7 64% Day Patient 12 12 - 4 8 67% Emergency Medicine 22 12 3 8 1 8%
Gastrointestinal Endoscopy 9 6 1 5 - 0% Gynaecology 8 6 1 5 - 0% Hospital in the Home 9 2 - 1 1 50% Hospital-Wide 19 14 3 6 5 36% Infection Control 26 20 3 6 11 55% Intensive Care 16 8 - 2 6 75% Internal Medicine 18 - - - - 0% Maternity 20 17 13 3 1 6% Medication Safety 19 7 - 4 3 43% Mental Health 30 19 - 10 9 47% Ophthalmology 17 8 1 5 2 25%
Oral Health 9 9 5 4 - 0% Paediatrics 14 3 - 1 2 67% Pathology 17 10 - 6 4 40% Radiation Oncology 9 - - - -Radiology 15 4 - 2 2 50% Rehabilitation Medicine 6 6 - 2 4 67%
Total 313 174 30 78 66 38%
Percent of tested 17% 44% 39%
* The relative risk can only be calculated where the centiles are not zero or 100%. CIs with 20 or more submissions and where the potential gains of the CI are at least five are included in this analysis. Only rate-based indicators with desirable rate High (H) or Low (L) were tested.
Clinical Indicators with significant variations between strata
For each CI, the detailed results identify whether there were statistically different mean rates for 2019 between the three strata: Australian states and territories/NZ, public/private and metropolitan/non-metropolitan. This section summarises those
results, by identifying the stratum that explains most of the variation in 2019. Table 7 shows the number of CIs that were analysed, and how many had significant stratum differences by CI set.
18 AUSTRALASIAN CLINICAL INDICATOR REPORT 2012 - 2019
THE CLINICAL INDICATOR PROGRAM: TRENDS AND VARIATIONS
Table 7: Number of CIs whose mean rates were statistically significantly different by Australian states and territories/New Zealand, public/private, metropolitan/non-metropolitan in 2019
Clinical Indicator Set
Number of CIs CIs tested# State / NZ Public / private Metropolitan / non-metropolitan Any Stratum
Anaesthesia and Perioperative Care 18 11 2 4 2 5 Day Patient 12 12 1 5 0 6
Emergency Medicine 22 10 8 1 0 9
Gastrointestinal Endoscopy 9 8 3 2 0 2 Gynaecology 8 6 1 1 1 3 Hospital in the Home 9 3 2 0 2 3 Hospital-Wide 19 15 6 3 1 5
Infection Control 26 23 4 1 1 4 Intensive Care 16 10 6 7 2 8
Internal Medicine 18 0 0 0 0 0 Maternity 20 18 11 9 0 12 Medication Safety 19 6 5 4 3 5
Mental Health 30 17 9 4 0 7 Ophthalmology 17 8 5 2 1 6
Oral Health 9 9 7 0 1 7 Paediatrics 14 3 2 2 0 3 Pathology 17 9 5 0 1 6 Radiation Oncology 9 0 0 0 0 0 Radiology 15 3 3 0 0 2 Rehabilitation Medicine 6 6 0 4 0 4
Total 313 177 80 49 15 97
Percent of tested 45% 28% 8% 55%
#At least ten HCOs must submit for the CI to be tested. Only rate-based indicators with desirable rate High (H) or Low (L) were tested.
Outliers
In 2019 there were 80 CIs with significant differences in mean rates between states and territories of Australia/New Zealand, notably in Emergency Medicine (8), Hospital-Wide (6), Maternity (11), Mental Health (9), Oral Health (7) and Pathology (5).
Significant differences between the mean rates for the public and private strata were found in 49 CIs, notably in Day Patient (5), Intensive Care (7) and Maternity (9). There were 15 CIs with significant differences between metropolitan and nonmetropolitan participants.
Clinical Indicators and HCOs with significantly different rates
This section uses the data for 2019 to identify desirable and less desirable rates. If a shrunken rate was more than three standard errors from the overall rate, this was considered to be statistically significant. These rates are called outliers.
The reporting of HCOs that are outliers is more relevant to the individual HCOs. Participating HCOs receive reports identifying those areas where their rates are statistically significantly different from the overall rate. Outliers are summarised in this report to show that they occur in all sets, and in sufficiently large numbers to suggest that all HCOs would benefit from reviewing their results.
19 TRENDS AND VARIATIONS
THE CLINICAL INDICATOR PROGRAM: TRENDS AND VARIATIONS
Of the 304 rate-based CIs (with rates that are not 0 or 100%) and 25,878 six-monthly data submissions, those CIs with no preferred direction or CIs that had less than 20 six-monthly data submissions in 2019 were excluded. There remained 192 CIs and 23,925 individual data submissions.
For the 192 rate-based CIs that had a desirable direction and more than 20 six-monthly data submissions, a summary of the number of outlier data submissions is given in Table 8. The proportion of data submissions that were outliers with a desirable direction was 13.8%, the proportion with less desirable rates was 10.6% and the remaining 75.7% of submissions were not outliers in either direction. These proportions varied between the specialities.
In 2019, six sets had more than 15% of submissions classified as outliers in the undesirable direction. They were Emergency Medicine (21%), Intensive Care (17%), Mental Health (19%), Pathology (31%), Hospital in the Home (25%) and Rehabilitation Medicine (16%). Eight CI sets, including the first four just mentioned sets, had a greater number of six-monthly data submissions in the favourable direction than in the unfavourable direction.
Table 8: Number of CIs, HCOs reporting and data submissions that were outliers in 2019
Clinical Indicator Set Number of CIs CIs tested# HCOs Data submissions Undesirable Desirable*
Anaesthesia and Perioperative Care 18 11 229 1,781 12% 23% Day Patient 12 12 282 2,891 11% 18% Emergency Medicine 22 12 99 1,034 21% 45% Gastrointestinal Endoscopy 8 8 84 745 4% 0% Gynaecology 8 6 56 299 5% 1% Hospital in the Home 10 2 19 53 25% 8% Hospital-Wide 18 15 416 4,630 9% 12% Infection Control 26 25 339 2,832 7% 5% Intensive Care 15 9 95 971 17% 31% Internal Medicine 20 - - - -Maternity 18 18 135 3,377 6% 6% Medication Safety 19 7 266 845 11% 9% Mental Health 29 22 96 1,170 19% 26% Ophthalmology 17 12 58 605 5% 6% Oral Health 10 9 85 969 7% 4% Paediatrics 13 3 34 126 10% 13% Pathology 16 10 24 293 31% 44%
Radiation Oncology 9 - - - -Radiology 17 5 23 139 12% 2% Rehabilitation Medicine 6 6 124 1,165 16% 9%
Total 311 192 633 23,925 10.6% 13.8%
#CIs with less than 20 six-monthly data submissions were excluded. Only rate-based indicators with desirable rate High (H) or Low (L) were tested *Values I bold when there were a greater number of six-monthly data submissions in the favourable direction than in the unfavourable direction.
20 AUSTRALASIAN CLINICAL INDICATOR REPORT 2012 - 2019
THE CLINICAL INDICATOR PROGRAM: TRENDS AND VARIATIONS
Those CIs with a high proportion of outliers were usually associated with process measures such as access block in emergency departments and intensive care units, delays in reporting test results in pathology, and documentation and processes in mental health and medication safety.
Each of the 192 CIs tested were categorised according to whether there were:
• no outlier six-monthly data submissions
• at least one outlier with undesirable rates, none with desirable rates
• at least one outlier with desirable rates, none with undesirable rates
• outliers with both desirable and undesirable rates
Table 9 reveals that 16 of the 192 CIs had no six-monthly data submissions that were outliers and 129 CIs included both undesirable and desirable six-monthly data submissions as outliers.
Table 9: Number of CIs that had six-monthly data submissions that were outliers in 2019*
Outlier category
Data submissions to CIs
Number of CIs Per cent of CIs Range Median Mean
No outliers 16 8.3% 20-290 67.5 85
Undesirable rates only 46 24.0% 20-688 94 137 Desirable rates only 1 0.5% 24-24 24 24 Outliers – undesirable and desirable rates 129 67.2% 20-721 86 126 Total 192 100% 20-721 86 125
*CIs with no less than 20 six-monthly data submissions were excluded. Only rate-based indicators with desirable rate High (H) or Low (L) were tested.
Can outlier rates be used to rank HCOs? This has been suggested as a way to improve quality, even though the research literature, in general, does not support the use of ‘league tables’.
For the 16 CIs with no outliers, the variation between HCOs was not statistically significant. This means that any ranking would be equivalent to that obtained from tossing a coin or dice. The remaining 176 CIs have six-monthly data submissions that are outliers in the undesirable direction (with or without other outlier submissions in the desirable direction – Table 9).
Each of the 633 HCOs that submitted one or more of the 192 CIs tested were categorised according to whether there were:
• no outlier data submissions
• at least one outlier with undesirable rates, none with desirable rates
• at least one outlier with desirable rates, none with undesirable rates
• outliers with both desirable and undesirable rates
The analyses of the outlier rates by HCO reveal that the desirable rates do not cluster into HCOs that have better performance, but that both desirable and undesirable rates occur in 54.7% of HCOs (Table 10). Furthermore, the table shows that HCOs that report fewer CIs have less likelihood of having both desirable and undesirable rates compared to those reporting a greater number of CIs.
From Table 10, it can be seen that of the 633 HCOs considered, 346 (54.7%) HCOs have both desirable and undesirable rates whereas only 97 (15.3%) HCOs have outliers only in the undesirable direction, a total of 440 HCOs (70%) having at least one outlier in the undesirable direction.
21
TRENDS AND VARIATIONS
THE CLINICAL INDICATOR PROGRAM: TRENDS AND VARIATIONS
Table 10: Number of HCOs that had CIs that were outliers in 2019*
Outlier category
Number of HCOs
Per cent of HCOs
Number of CIs HCO data submissions
Range Median Mean Range Median Mean
No outliers 96 15.2% 1 – 18 3 5 2 – 35 6 9
Undesirable rates only 94 14.8% 1 – 37 9 10 1 – 73 15 17
Desirable rates only 97 15.3% 2 – 34 13 15 3 – 64 25 28
Outliers – undesirable and desirable rates 346 54.7% 3 – 94 26.5 30 3 – 176 46 54
Total 633 100% 1 – 94 15 21 1 – 176 26 38
*CIs with less than 20 six-monthly data submissions were excluded. Only rate-based indicators with desirable rate High (H) or Low (L) were tested. Hence some of the contributing HCOs are represented in the above table.
The results from Table 8 and Table 10 show that:
• 13.8% of submissions are in the desirable direction and 10.6% in the undesirable direction. Thus the majority of six-monthly data submissions (the remaining 75.7%) are not statistically different from the average (Table 8),
• 70% of the 633 HCOs have some clinical areas with rates that are outliers in the undesirable direction (Table 10).
THIS SUGGESTS THAT CLINICAL INDICATORS HAVE A GREATER ROLE IN IDENTIFYING AREAS FOR REVIEW, RATHER THAN FOR RANKING PERFORMANCE.
22 AUSTRALASIAN CLINICAL INDICATOR REPORT 2012 - 2019
SUMMARY OF RESULTS
Anaesthesia and Perioperative Care version 6 29
Day Patient version 5 35
Emergency Medicine version 6 41
Gastrointestinal Endoscopy version 2 49
Gynaecology version 7 53
Hospital in the Home version 5 57

Hospital-Wide version 12.1 61
Infection Control version 5 67
Intensive Care version 5 73
Internal Medicine version 6.1 79


Maternity version 8 83
Medication Safety version 4 89
Mental Health version 7 95
Ophthalmology version 6 101


Oral Health version 4 105


Paediatrics version 5.1 109

Pathology version 4.1 117

Radiation Oncology version 4 121


Radiology version 6 127
Rehabilitation Medicine version 6 131
23
GENERAL COMMENTS
Dr Joanna Sutherland
Deputy Chair of Safety and Quality Committee

Deputy Chair of the Fellows of the Australian and New Zealand College of Anaesthetists
Member, ACHS Anaesthesia and Perioperative Care Working Party Version 7
Although clinical indicators have been used in hospital care for many years, clinical indicator development for perioperative care is an emerging science. Haller et al1 in 2009 described the relative paucity of high-level evidence underpinning available indicators in anaesthesia practice. More recently, Chazapis et al2 in a systematic review have reflected on the continued widespread lack of evidence ascribed to indicators in use, and the lack of clear patient-centred metrics in available indicator sets for perioperative care.
In order to enable performance assessment and benchmarking, and to support improvement in outcomes which are important to patients, ideal clinical indicators for perioperative care should be well defined and easy to collect, evidence-based, specific, sensitive, valid and reliable3. Perioperative care relates to a heterogeneous range of activities, from simple and often process driven (e.g. many day surgery and low risk procedures) to complex and highly specialised. Mahajan et al4 have described the challenges in distinguishing indicators which may have been useful for "factory-like processes", and the increasing need for other measures which might be more suitable for "self-organized based complex adaptive systems". For more complex improvement processes, the concept of traditional unidimensional clinical indicators may be obsolete, and we are likely to need more sophisticated measures of institutional culture and leadership, and hence ability to learn, transform and improve.
REFERENCES
1. Haller G, Stoelwinder J, Myles P et al. Quality and Safety Indicators in Anesthesia. A Systematic Review. Anesthesiology 2009; 110: 1158-1175
2. Chazapis M, Gilhooly D, Smith A et al. Perioperative Structure and Process Quality and Safety Indicators. A Systematic Review. British Journal of Anaesthesia 2018; 120(1): 51-66
3. Mainz J. Defining and Classifying Clinical Indicators for Quality Improvement. International Journal for Quality in Health Care 2003; 15 (6): 523-530
4. Mahajan A, Islam S, Schwartz M et al. A Hospital is not just a Factory but a Complex Adaptive System- Implications for Perioperative Car Anesthesia and Analgesia 2017; 125 (1): 333-341
24 AUSTRALASIAN CLINICAL INDICATOR REPORT 2012 - 2019
ANESTHESI AND PERIOPERATIVE CARE


25
SUMMARY OF RESULTS
In 2019 there were 1,856 submissions from 232 HCOs for 20 CIs. Eighteen were analysed for trend, 11 of which improved, 4 deteriorated and the remainder showed no evidence of trend. In 2019, significant stratum variation was observed in 6 CIs.
Table of Indicator Results
Sixteen CIs showed greater systematic variation, with centile gains in excess of 50% of all events. Outlier gains in excess of 25% of all events were observed in 15 CIs. See Table of Indicator Results below.
Indicator Aggregate rate % Best Stratum Outlier HCOS (%)* Outlier Gains (%)+ Centile Gains (%)+ Events# Trend
Preanaesthesia period
1.1 Preanaesthesia consultation completed by anaesthetist (H) 99.7 5 (12%) 204 (77%) 263 (99%) 265
1.2 Smoking cessation advised in preanaesthesia consultation (H) 100.0 Intraoperative period

2.1 Presence of a trained assistant (H) 94.7 Metropolitan 2 (11%) 3,077 (71%) 4,362 (100%) 4,364
2.2 Anaesthesia record compliance with ANZCA requirements (H) 99.8 7 (16%) 251 (78%) 316 (99%) 320
2.3 Time-out procedure: regional anaesthesia (H) 99.1 2 (17%) 100 (79%) 126 (100%) 126
2.4 Prophylactic anti-emetic administered to patients with history of PONV (H) 65.7 1 (14%) 7 (30%) 20 (87%) 23
Patient recovery period
3.1 Relief of respiratory distress in the recovery period (L) 0.0 Private 8 (5%) 99 (32%) 220 (71%) 310
3.2 PONV treatment in the recovery period (L) 0.8 22 (20%) 2,668 (54%) 4,688 (94%) 4,980
3.3 Temperature less than 36 degrees Celsius in the recovery period (L) 1.5 23 (18%) 7,900 (68%) 11,520 (99%) 11,649
3.4 Severe pain not responding to pain protocol in the recovery period (L) 0.33
Private 25 (14%) 1,374 (35%) 3,257 (84%) 3,891
3.5 Unplanned stay in recovery room longer than 2 hours (L) 1.0 25 (18%) 3,220 (40%) 6,838 (85%) 8,031 # Number of undesirable or non-compliant events + % of events accounted for by outlier/centile gains * % of HCOs that are outliers
26 AUSTRALASIAN CLINICAL INDICATOR REPORT 2012 - 2019
ANESTHESIA AND PERIOPERATIVE CARE

Summary of Indicator Results
continued Indicator Aggregate rate % Best Stratum Outlier HCOS (%)* Outlier Gains (%)+ Centile Gains (%)+ Events# Trend
Postoperative period
4.1 Unplanned ICU admission within 24 hours after procedure (L) 0.1 12 (11%) 354 (26%) 1,041 (76%) 1,369
4.2 Documented patient handover - operating suite to recovery area (H) 99.4 Private 5 (21%) 221 (85%) 259 (99%) 261
4.3 Documented patient handover - recovery area to ward (H) 94.6 3 (17%) 1,764 (80%) 2,192 (100%) 2,196
Management of acute pain
5.1 Pain intensity scores recorded for surgical patients (H) 98.8 2 (22%) 39 (64%) 60 (98%) 61
5.2 Daily anaesthetist review following postoperative epidural analgesia (H) 100.0Obstetric anaesthesia care
6.1 Obstetric patients experiencing post-dural puncture headache (L) 0.7 1 (11%) 15 (22%) 40 (58%) 69
6.2 Obstetric patients with risks and benefits of analgesia documented (H) 98.1 1 (25%) 55 (73%) 74 (99%) 75 # Number of undesirable or non-compliant events + % of events accounted for by outlier/centile gains * % of HCOs that are outliers
27
GENERAL COMMENTS
Gabby Moreland Day Hospitals Association
The Day Patient indicator set collects data from a broad range of health care organisations (HCOs) conducting procedures with a discharge intent of one day. These HCOs can be categorised as public or private, free standing or collocated, single or multispecialty. In 2019 it was reported that there had been a 12% growth in the number of registered day hospitals in Australia over the previous five years, performing 1.2 million procedures in 2017-2018 alone 1 . More recently there has been a shift towards 23-hour licensing and collaborative, multi-specialty perioperative care processes allowing more complex procedures to be performed in a Day Patient setting. This is evidenced by the introduction of joint replacement surgery in selected trial facilities.
ACHS, and the broader health community, has recognised the expansion of the Day Patient sector, noting the improved patient outcomes associated with this care delivery model. In 2019, version 6 of the Day Patient indicators were implemented introducing and/or refining three data sets relating to post-procedure care: Indicator 8.2 Departure without an overnight carer; 9.1 Follow up contact within 48 hours; and 9.2 Completeness of follow up instructions form for patients. The area of post-procedure care being closely associated with outcomes of care for day patients.2
Across the twelve Day Patient Indicators, over the seven-year reporting period, it was noted that the number of participating HCOs varies markedly by Indicator. Low submission rates for the newly revised or introduced indicators may reflect a need for greater lead time for HCOs to revise their data collection systems. Low submission rates for unchanged indicators may
REFERENCES
1. Profile Day Hospitals Australia and the Day Hospital Industry https://www.dayhosppitalsaustralia.net.au/DHA-Profile-2019.pdf
2. Day Patient Version 6 Clinical Indicator Manual, Australian Council on Healthcare standards. 2018, p.5

28 AUSTRALASIAN CLINICAL INDICATOR REPORT 2012 - 2019


DAY
29
PATIENT
SUMMARY OF RESULTS
In 2019 there were 2,882 submissions from 280 HCOs for 12 CIs. Nine were analysed for trend, 8 of which improved, 1 deteriorated and the remaining CI showed no evidence of trend. In 2019, significant stratum variation was observed in 5 CIs.
Table of Indicator Results
Twelve CIs showed greater systematic variation, with centile gains in excess of 50% of all events. Outlier gains in excess of 25% of all events were observed in 10 CIs. See Table of Indicator Results below.
Indicator Aggregate rate % Best Stratum Outlier HCOS (%)* Outlier Gains (%)+ Centile Gains (%)+ Events# Trend
Preadmission preparation
1.1 Booked patients assessed before admission (H) 89.2 Private 17 (22%) 13,956 (67%) 20,845 (100%) 20,858
Procedure non-attendance
2.1 Booked patients who fail to arrive (L) 0.60 22 (12%) 2,661 (60%) 4,315 (97%) 4,444
Procedure cancellation
3.1 Cancellation of the procedure after arrival due to pre-existing medical condition (L) 0.22 Private 29 (14%) 626 (28%) 1,560 (70%) 2,220
3.2 Cancellation of the procedure after arrival due to an acute medical condition (L) 0.45 Private 33 (16%) 1,865 (52%) 3,167 (89%) 3,575
Episode of care adverse events

4.1 Patients who experience an adverse event during care delivery (L) 0.1 11 (9%) 74 (19%) 280 (72%) 388 # Number of undesirable or non-compliant events + % of events accounted for by outlier/centile gains * % of HCOs that are outliers
30 AUSTRALASIAN CLINICAL INDICATOR REPORT 2012 - 2019
DAY PATIENT
SUMMARY OF RESULTS
Summary of Indicator Results continued
Indicator
Unplanned return to the operating room
Aggregate rate % Best Stratum Outlier HCOS (%)* Outlier Gains (%)+ Centile Gains (%)+ Events# Trend
5.1 Unplanned return to operating room on same day as initial procedure (L) 89.2 Private 17 (22%) 13,956 (67%) 20,845 (100%) 20,858
Unplanned transfer / admission
6.1 Unplanned transfer or overnight admission related to procedure (L) 0.68 Private 46 (19%) 3,618 (46%) 7,099 (90%) 7,890
Discharge
7.1 Unplanned delayed discharge for clinical reasons greater than 1 hour beyond expected (L) 0.37 Private 15 (12%) 789 (52%) 1,392 (92%) 1,518
Departure
8.1 Departure without an escort (L) 0.50 7 (8%) 912 (75%) 1,200 (99%) 1,218 8.2 Departure without an overnight carer (L) 0.08 3(6%) 49(51%) 85 (88%) 97
Post-discharge follow-up
9.1 Follow-up phone call within 7 days (H) 87.7 20 (26%) 10,663 (62%) 17,250 (100%) 17,277 9.2 Follow-up phone call received by patient or carer within 7 days (H) 99.0 6 (13%) 942 (78%) 1,213 (100%) 1,215 # Number of undesirable or non-compliant events + % of events accounted for by outlier/centile gains * % of HCOs that are outliers

31
GENERAL COMMENTS
Dr Rachel Goh
Quality and Patient Safety Committee – Trainee Representative
Australasian College for Emergency Medicine
Accredited Emergency Registrar (Advanced Trainee), St Vincent's Hospital Melbourne

Area 1
- Waiting Time
This area continues to be the group of clinical indicators with the highest number of records and contributing HCOs. There is a concerning downward trend over the past decade in terms of overall number of contributing HCOs, although overall denominator numbers remain fairly stable. CI 1.1 continues to show a positive trend with Public performing better than Private organisations. Similarly, Category 5 patients (CI 1.5) show a consistently positive trend. There is stable performance for Category 4 (CI 1.4), despite there being 187,000 more patients. The slight downward trend in performance for Category 2 (CI 1.2) and Category 3 (CI 1.3) patients is particularly pronounced in Queensland (for Category 2), and in Western Australia (for Categories 3 and 4). This may be because of the 50,000 more patients allocated to Category 2 and 286,000 more patients allocated to Category 3 in 2019, thus overwhelming HCOs. Victoria continues to perform particularly well for Categories 1 to 4. There is overall stable performance in the past decade for CI 1.6, patients who left the ED after triage without being seen, although the number of HCOs contributing to this data is almost halved compared to the Category data, with most data from NSW.
Area 2 - STEMI Management
Time to balloon opening was limited by the small number of HCOs contributing to these indicators. The ongoing low rate of STEMI patients who received thrombolysis within 30 minutes is a concern (CI 2.1), however this rate has shown signs of improvement in the last 3 years. There is a relatively stable rate of time to balloon opening within 90 minutes (CI 2.2) and an improvement in the rate of time to balloon opening within 60
minutes (CI 2.3), although data has come from only three HCOs.
Area 3 - ED Mental Health Presentations
The results in this area are somewhat limited by the small number of HCOs contributing to this data. Ongoing poor rate of mental health patients being admitted from the ED within four hours is shown and outliers had an extremely poor rate of 9.7 per 100 patients (CI 3.1). The rate of mental health patients being discharged from the ED within four hours deteriorated with outliers having performed half as well (CI 3.2). We are seeing an ongoing very low rate of mental health patients who did not wait following clinical documentation (CI 3.3), a trend that is improving.
Area 4 - Critical Care
There is a consistent low rate of ED time within four hours for ICU admission (CI 4.1). The ongoing low rate of rapid response system call within four hours of admission to the ward from the ED (CI 4.2) is reassuring. No trend data could be established due to the low number of HCOs contributing to these indicators.
Area 5 - Sepsis Management
Similarly, no trend data could be established due to the low number of HCOs contributing to these indicators. However, we see ongoing abysmal (worst ever) performance for CI 5.1, time of antibiotic resistance for paediatric patients within 60 minutes. In 2019 there was no improvement in CI 5.2, time to antibiotic administration for adult patients within 60 minutes compared to 2018, but this rate is almost three times better than for paediatric patients.
32 AUSTRALASIAN CLINICAL INDICATOR REPORT 2012 - 2019


33
EMERGENCY MEDICINE
Area 6 - Discharge Communication
There was relatively high ongoing documented evidence of clinical management plan provided to ongoing care provider (CI 6.1), however the rate in 2018 was better than in 2019. Similarly, there were relatively high ongoing documented evidence of patient-centred discharge information and instructions provided to patient or carer (CI 6.2), with the 2018 rate better than in 2019. These indicators had a small number of submissions as well.
Area 7 - Pain Management
CI 7.1 was the best performing indicator in 2019 with HCOs reporting an excellent rate of documented initial pain assessment at triage. Poor performance for analgesic therapy within 30
minutes for all patients with moderate or severe pain was shown (CI 7.2) and a very low rate of documented pain reassessment within 30 minutes of analgesic therapy (CI 7.3).

Area 8 - Unplanned Re-attendance
CI 8.1 has shown a positive trend with the lowest rate in 2019 of patients who have an unplanned re-attendance to the ED within 48 hours of initial presentation and who require admission.
Characteristics
There was a good split of contribution between metro and nonmetro HCOs.
34 AUSTRALASIAN CLINICAL INDICATOR REPORT 2012 - 2019
EMERGENCY MEDICINE
Mr Wayne Varndell Clinical
Within the realm of Waiting Time, patients with undifferentiated illness assigned to ATS Category 2 and Category 3 are not all being seen within the benchmark. While local models of triage practice may include nurse-initiated treatment, ATS Category 2 and 3 can be very unwell and have the potential to deteriorate rapidly1, 2.
The decreasing trend in the number of patients not waiting to commence care following triage is noted. A factor contributing to this could be enhanced communication both on arrival to the ED and during the triage process, such as the Patient Experience Office3, and early access to symptom management at the point of access4
In 2019, the number of patients receiving thrombolysis within 30 minutes from arrival to the emergency department and time to percutaneous coronary intervention within 60 minutes has increased. Triage decision accuracy of patients presenting with chest pain and streamlined access to interventional services is of great importance to optimise positive patient outcomes.
For many, the emergency department is the main access point to mental health services for patients experiencing mental illness, especially outside business hours. Patients presenting with mental illness continue to experience extended lengths of stay in the emergency department in a highly stimulating environment; potentially resulting in increased acute behavioural disturbances and use of restraint. Solutions to improving timely
REFERENCES
access to specialised care are urgently needed. Workable evidence-based nurse-led solutions translatable between metropolitan and rural emergency care settings, offer a potentially effective solution5
The frequency of pain being assessed documented at triage remains high, with administration of appropriate analgesic therapy within 30 minutes for patients with moderate to severe pain unchanged. While pain management is the responsibility of all healthcare professionals, it is a core role of emergency nursing. However, the use of nurse-initiated analgesia protocols within emergency departments is not consistent6; potentially decreasing patient access to timely analgesia.
Sepsis management saw a slight decrease in time to antibiotic administration in adult patients with a rate of 61.3 per 100 patients in 2019. However, time to antibiotics within the paediatric patient cohort has continued to deteriorate with a rate of 28.3 per 100. Sepsis is a significant and time-sensitive emergency. Paediatric patients have less physiological reserve and typically deteriorate more quickly than the adult patient. The first point of risk assessment and prioritisation in the emergency department is the emergency nurse. Current guidelines do not recognise the potential role of emergency nurses within the multidisciplinary team in detecting and responding to paediatric patients with possible sepsis7. The results suggest a body of work needs to be urgently undertaken to improve sepsis management in paediatric patients.

1. Varndell, W., A. Hodge, and M. Fry, Triage in Australian emergency departments: Results of a New South Wales survey. Australasian Emergency Care, 2019. 22(2): p. 81-86.
2. Berendsen Russell, S., M.M. Dinh, and N. Bell, Triage, damned triage... and statistics: Sorting out redundancy and duplication within an Emergency Department Presenting Problem Code Set to enhance research capacity. Australas Emerg Nurs J, 2017. 20(1): p. 48-52.
3. Nsw Health. Improving patient experience in NSW. 2019 [cited 2020 July]; Available from: https://www.health.nsw.gov.au/Performance/Pages/experience.aspx.
4. Shaban, R.Z., et al., Characteristics of effective interventions supporting quality pain management in Australian emergency departments: an exploratory study. Australas Emerg Nurs J, 2012. 15(1): p. 23-30.
5. Wand, T., et al., Evaluating an emergency department-based mental health liaison nurse service: A multi-site translational research project. Emergency Medicine Australasia, 2020. In Print.
6. Varndell, W., M. Fry, and D. Elliott, Pain Assessment and Interventions by Nurses in the Emergency Department: A National Survey. Journal of Clinical Nursing, 2020. n/a(n/a).
7. Harley, A., et al., Emergency nurses' knowledge and understanding of their role in recognising and responding to patients with sepsis: A qualitative study. Int Emerg Nurs, 2019. 43: p. 106-112.
Nurse Consultant at Prince of Wales Hospital Emergency Department NSW Branch Director and Associate Executive Director for the College of Emergency Nursing Australasia
35
SUMMARY OF RESULTS
In 2019 there were 1,128 submissions from 100 HCOs for 22 CIs. Twelve were analysed for trend, 6 of which improved and 4 deteriorated. In 2019, significant stratum variation was observed in 0 CIs. Ten CIs showed greater systematic variation, with centile
Table of Indicator Results
Indicator
Waiting time
gains in excess of 50% of all events. Outlier gains in excess of 25% of all events were observed in 3 CIs.
See Table of Indicator Results below:
Aggregate rate % Best Stratum Outlier HCOS (%)* Outlier Gains (%)+ Centile Gains (%)+ Events# Trend
1.1 ATS Category 1 - medically assessed and treated immediately (H) 99.6 5 (5%) 57 (71%) 74 (93%) 80
1.2 ATS Category 2 - medically assessed and treated within 10 minutes (H) 75.6 27 (28%) 18,852 (18%) 52,288 (49%) 106,755
1.3 ATS Category 3 - medically assessed and treated within 30 minutes (H) 63.2 26 (27%) 90,731 (20%) 285,978 (63%) 450,380
1.4 ATS Category 4 - medically assessed and treated within 60 minutes (H) 72.5 28 (29%) 65,033 (21%) 187,062 (61%) 309,148
1.5 ATS Category 5 - medically assessed and treated within 120 minutes (H) 90.1 29 (31%) 5,021 (27%) 13,500 (72%) 18,870
1.6 Patients who left the ED after triage without being seen (L) 3.5 17 (31%) 13,495 (24%) 35,796 (65%) 55,442
ST-segment elevated myocardial infarction (STEMI) management
2.1 STEMI patients who receive thrombolytic therapy within 30 minutes (H) 48.7 6 (8%) 77
2.2 Time to balloon opening within 90 minutes (H) 87.2 15
2.3 Time to balloon opening within 60 minutes (H) 61.5 45
Emergency
department mental health presentations
3.1 Mental health patients admitted from the ED within 4 hours (H) 28.7 2 (13%) 350 (11%) 1,092 (36%) 3,059
3.2 Mental health patients discharged from the ED within 4 hours (H) 51.0 2 (13%) 941 (18%) 3,400 (65%) 5,232
3.3 Mental health patients who did not wait following clinical documentation (L) 0.7 2 (17%) 17 (20%) 52 (62%) 84
36 AUSTRALASIAN CLINICAL INDICATOR REPORT 2012 - 2019
Table of Indicator Results continued
Indicator
EMERGENCY MEDICINE
Aggregate rate % Best Stratum Outlier HCOS (%)* Outlier Gains (%)+ Centile Gains (%)+ Events# Trend
Critical care
4.1 ED time within 4 hours for ICU admissions (H) 41.4 2 (14%) 187 (6%) 860 (25%) 3,382
4.2 Rapid response system call within 4 hours of admission to the ward from the ED (L) 0.3 2 (2%) 127
Sepsis management
5.1 Time of antibiotic administration for paediatric patients within 60 minutes (H) 26.7 11
5.2 Time of antibiotic administration for adult patients within 60 minutes (H) 61.3 1 (0%) 379
Discharge communication
6.1 Documented evidence of clinical management plan provided to an ongoing care provider (H) 80.4 1 (11%) 15 (0%) 2,344 (59%) 3,949
6.2 Documented evidence of patient-centred discharge information and instructions provided to the patient or carer (H) 83.8 2 (22%) 35 (1%) 1,493 (46%) 3,264
Pain management
7.1 Documented initial pain assessment at triage (H) 100.0 1 (33%) 2 (33%) 6 (100%) 6
7.2 Analgesic therapy within 30 minutes for all patients with moderate or severe pain (H) 53.4 30 (24%) 124
7.3 Documented pain reassessment within 30 minutes of analgesic therapy (H) 21.3 118
Unplanned re-attendance
8.1 Patients who have an unplanned re-attendance to the ED within 48 hours of initial presentation and who require admission (L) 1.2 6 (40%) 819 (20%) 2,687 (66%) 4,088
# Number of undesirable or non-compliant events + % of events accounted for by outlier/centile gains * % of HCOs that are outliers
37
GENERAL COMMENTS
Associate Professor Stephen Pianko Gastroenterological Society of Australia
The ACHS clinical Gastrointestinal indicators provide important information about the provision of endoscopic services in Day surgeries and integrated facilities within a member HCO. The report examines six indicators and provides comparative data over the last seven years. To avoid bias between free standing facilities and overnight hospitals only day procedures were included in the analysis. The report provides information about the overall results for each indicator with some overall outlier information. Individual institutions were provided with feedback about their own data, but these are not included in this report. The data was however reviewed by the statistician and if a HCO was an outlier in one indicator they were not consistently outliers in other indicators.
The first indicator assessed was the failure to reach the cecum due to inadequate bowel preparation. This indication was assessed in 111,221 individuals making it a powerful assessment. The adequacy of bowel preparation is an essential requirement for performing high quality diagnostic and therapeutic colonoscopy. Over the last seven years the failure to reach the cecum rate has been steady at around 0.42 per 100 colonoscopies with virtually no fluctuation over this period despite an increase in colonoscopy numbers from approximately 40,000 to 111,000. Unfortunately, no data is provided about the timing and introduction of split bowel preparation in the HCOs as this might have improved this rate. In future, the quality of the bowel preparation should also be included in this or a new indicator. As in previous years, the public hospital patients fared worse than private day surgery/hospital patients (1.15 per 100

38 AUSTRALASIAN CLINICAL INDICATOR REPORT 2012 - 2019


ENDOSCOPY 39
GASTROINTESTINAL
Post polypectomy bleeding was limited to the time frame of post colonoscopy until 24 hours. Delayed bleeding was excluded and intra-procedure bleeding that was controlled was excluded. Excluding delayed bleeding creates a potential failure of the indicator but it is difficult to collect accurate data as patients do not always represent to site of original colonoscopy. The post polypectomy bleeding rate has also continued to fall over the seven-year period and now sits at 0.047 per 100 colonoscopies which is very respectable. Once again improvements in the post polypectomy bleeding rates may be influenced by education, clips and the introduction of cold snaring for smaller polyps.
Adenoma detection rate 1 was assessed for the first time as a clinical indicator. This important indicator is now one of the hallmarks of quality colonoscopy and the basis of endoscopist recertification. A minimum standard of 25% adenoma detection in over 50-year old individuals is required for accreditation in Australia. The adenoma detection rate was 41% in the report which is excellent but unfortunately the denominator is only 41,472 compared with the failure to reach the cecum denominator of 111,000. This raises the possibility of reporter bias in that the better endoscopists/HCOs may have been more likely to report their data.
Oesophageal perforation tends to fluctuate through a small range over the seven years but remains low in 2019 at 0.094 per 100 dilatations which is certainly acceptable.
Aspiration post endoscopy is one of the most serious endoscopic complications. Interestingly, unlike the other adverse
outcomes aspiration rates have increased slowly over the seven years from 0.025 to 0.039 per 100 patients. The reasons for this are not obvious from the report but the increased use of propofol and the increasing BMI of the patients need to be assessed given the importance of this adverse outcome.
The final indicator assessed was the use of reversal agents in endoscopy. This was the first time this was assessed and was at a rate of 0.03 per 100 patients and whilst low may reflect the persistent use of fentanyl or midazolam in endoscopy rather than pure propofol anaesthesia. Perhaps this needs to be evaluated and may be a practice that should be reconsidered.
Overall despite some potential flaws in data collection for certain indicators the report demonstrates a high quality of endoscopy in the participating HCOs. Perhaps the most important areas for future improvement relate to assessing the benefits of split bowel preps2 and the correlation of adenoma detection rate with withdrawal times 3 and endoscopist experience and ensuring a complete data set for adenoma detection. The difference between the public and private sector with respect to the bowel preparation needs to be reviewed and improved if possible, in the public sector. The slow and small increase in endoscopy associated aspiration warrants further assessment to determine whether anaesthetists were administering the anaesthetic and whether any particular type of anaesthetic may be involved. For most of the colonoscopy associated adverse outcomes the HCO's appear to have reached an excellent performance level.
REFERENCES
1. Detection Measures for Colonoscopy: Considerations On the Adenoma Detection Rate, Recommended Detection Thresholds, Withdrawal Times, and Potential Updates to Measures. Douglas K Rex 1. J Clin Gastroenterol. 2020 Feb;54(2):130-135.

2. Split-dose bowel preparation improves adequacy of bowel preparation and gastroenterologists' adherence to National Colorectal Cancer Screening and Surveillance Guidelines. Stacy Bartnik Menees 1, H Myra Kim 2, Philip Schoenfeld 3. World J Gastroenterol 2018 Feb 14;24(6):716724. doi: 10.3748/wjg.v24.i6.716.
3. Serrated and adenomatous polyp detection increases with longer withdrawal time: results from the New Hampshire Colonoscopy Registry. Lynn Butterly 1, Christina M Robinson 2, Joseph C Anderson 3, Julia E Weiss 2, Martha Goodrich 2, Tracy L Onega 4, Christopher I Amos 2, Michael L Beach 5. Am J Gastroenterol. 2014 Mar;109(3):417-26. doi: 10.1038/ajg.2013.442.
40 AUSTRALASIAN CLINICAL INDICATOR REPORT 2012 - 2019
GASTROINTESTINAL ENDOSCOPY
SUMMARY OF RESULTS
In 2019 there were 800 submissions from 85 HCOs for 9 CIs. Eight were analysed for trend, 3 of which improved, 0 deteriorated and the remainder showed no evidence of trend. In 2019, significant stratum variation was observed
Table of Indicator Results
Indicator
Failure to reach caecum
in 3 CIs. Six CIs showed greater systematic variation, with centile gains in excess of 50% of all events. Outlier gains in excess of 25% of all events were observed in 4 CIs. See Table of Indicator Results below.
Aggregate rate % Best Stratum Outlier HCOS (%)*
Outlier Gains (%)+
Centile Gains (%)+ Events# Trend
1.1 Failure to reach caecum due to inadequate bowel preparation (L) 0.42 Private 12 (18%) 104 (22%) 274 (58%) 469
1.2 Failure to reach caecum due to diseased colon (L) 0.33 9 (15%) 92 (28%) 246 (75%) 329
Adverse outcomes - colonoscopy / polypectomy
2.1 Treatment for possible perforation post-polypectomy (L) 0.013 4 (40%) 10
2.2 Treatment for possible perforation post-colonoscopy (L) 0.017 2 (3%) 3 (25%) 7 (58%) 12

2.3 Post-polypectomy haemorrhage (L) 0.047 1 (2%) 2 (6%) 12 (39%) 31
Adenoma detection
3.1 Adenoma detection rate (N) 41.0
Oesophageal dilatation - perforation
4.1 Oesophageal dilatationpossible perforation (L) 0.09 NSW
Aspiration following GI endoscopy
5.1 Aspiration following endoscopy (L) 0.039 1 (2%) 11 (28%) 26 (67%) 39
Sedation in GI endoscopy
6.1 Sedation in GI endoscopy (L) 0.030 2 (7%) 4 (36%) 7 (64%) 11
# Number of undesirable or non-compliant events + % of events accounted for by outlier/centile gains * % of HCOs that are outliers
41
GENERAL COMMENTS
Dr Martin Ritossa
Royal Australian and New Zealand College of Obstetricians and Gynaecologists Chair, ACHS Gynaecology Working Party Version 7
Dr Vijay Roach
President, Royal Australian and New Zealand College of Obstetricians and Gynaecologists
Thank you to the HCOs that contributed to Gynaecological indicators in 2019. Participation continues to remain strong and it was good to see the greatest number of units choosing to participate in 2.1 Gynaecological surgery, injury to a major viscus which shows a strong focus on surgical quality.
Unplanned blood transfusion rates following surgery for benign conditions continue to fall, with a rate of 0.57 per 100 patients being the second lowest rate recorded. Unplanned blood transfusions following malignant disease remains stable at a rate of 6.5 per 100 cases, lower than last year. The outlier HCO rate for unplanned blood transfusion in benign disease was 3 times that of the average, suggesting room for improvement at some institutions. Whether this is due to surgical bleeding rates or transfusion protocols cannot be determined from this data but outlier HCO's should review their policies and procedures regarding blood transfusions.
Injury to a major viscus at gynaecology continues to trend down after a worrying spike in 2015/16. The rate of 0.18 per 100 cases suggests a high standard of surgical care in the participating units. One confounding factor may be the denominator which includes all gynaecological procedures. Given the decreasing hysterectomy rate and the increase of safer surgical alternatives such as endometrial ablation, the falling rate may be due to procedure selection rather than surgical technique.

42 AUSTRALASIAN CLINICAL INDICATOR REPORT 2012 - 2019
GYNAECOLOGY


43
The rate of mesh repair for pelvic organ prolapse, which includes trans-abdominal mesh for prolapse repair, has fallen in 2019 to 4.1 per 100 patients. This is a procedure that should only be performed for very specific indications in specialised units by appropriately credentialed surgeons. Of note all trans-vaginal mesh products for the repair of prolapse have been removed from the market. Even though abdominal placement of mesh is a recognised procedure for recurrent prolapse, we would expect this procedure to be performed in a small number of patients. Any outlier HCOs should undertake a review of procedures and policies in regard to mesh procedures for prolapse. It should be noted that urogynaecology subspecialty units would be expected to have a higher rate due to a referral bias.
The indicators would suggest that hysterectomy rates are continuing to fall and although the rate of 21.2 per 100 was

higher than last year it is the second lowest recorded. Nonmetropolitan hospitals had a lower rate than metropolitan hospitals, which has not always been the case. There were two outlier HCOs with twice the rate of hysterectomy resulting in potentially 40 more women undergoing a hysterectomy than required. It is difficult to say whether this is a true difference or whether the variations are due to patient demographics. Overall the decreasing rate show an increased uptake in conservative treatments for menorrhagia.
In summary all the indicators are trending in the correct direction which is a credit to these indicators and all the participating HCOs.
44 AUSTRALASIAN CLINICAL INDICATOR REPORT 2012 - 2019
SUMMARY OF RESULTS
In 2019 there were 328 submissions from 56 HCOs for 8 CIs. Seven were analysed for trend, 6 of which improved and the remainder showed no evidence of trend. In 2019, significant stratum variation was observed in 2 CIs.
Table of Indicator Results
Indicator
Blood transfusion
Four CIs showed greater systematic variation, with centile gains in excess of 50% of all events. Outlier gains in excess of 25% of all events were observed in 1 CI. See Table of Indicator Results below.
Aggregate rate % Best Stratum Outlier HCOS (%)*
Outlier Gains (%)+
Centile Gains (%)+ Events# Trend
1.1 Gynaecological surgery for benign diseaseunplanned intraoperative or postoperative blood transfusion (L) 0.57 Private 2 (5%) 18 (8%) 160 (75%) 212
1.2 Gynaecological surgery for malignant disease - unplanned intraoperative or postoperative blood transfusion (L) 6.5 1 (6%) 8 (9%) 21 (25%) 85
Injury to a major viscus
2.1 Gynaecological surgery - injury to a major viscus with repair (L) 0.18 5 (9%) 30 (24%) 89 (72%) 124
Laparoscopic management of an ectopic pregnancy
3.1 Ectopic pregnancy managed laparoscopically (H) 91.4 NSW 2(7%) 9(17%) 34(63%) 54
Thromboprophylaxis for major gynaecological surgery

4.1 Thromboprophylaxis for major gynaecological surgery (H) 99.4 6 4.2 Re-admission for venous thromboembolism within 28 days (L) 0.041 1
Mesh repair
5.1 Use of mesh repair for pelvic organ prolapse (L) 4.0 2 (15%) 9 (33%) 22 (81%) 27
Menorrhagia
6.1 Surgical intervention for menorrhagia (L) 21.2 2 (15%) 40 (10%) 111 (29%) 389 # Number of undesirable or non-compliant events + % of events accounted for by outlier/centile gains * % of HCOs that are outliers
GYNAECOLOGY
45
GENERAL COMMENTS
Dr Daryl Kroschel National Medical Director Silver Chain Group Vice President Hospital in the Home Society of Australasia

In the context of the COVID-19 global pandemic, there has been renewed interest in the Hospital in the Home model of care. An international webinar was held in 2020 enabling select attendees of the inaugural World Hospital at Home Congress to share their experience of managing patients at home within COVID-19 hotspots. This demonstrates the global nature of this emerging field and that it is agile, enabling a rapid expansion of the capacity of the health system. This apparent global renaissance in Hospital in the Home is built on a strong foundation, and in the Australian context demonstrates two decades of experience and safe care as monitored by ACHS Clinical Indicators (CIs).
The 2019 data set is compiled from version 5 of the Hospital in the Home Indicators, permitting four years of data on which to draw comparison and trends for a number of clinical indicators. In 2019 there were 117 submissions from 20 Health Care Organisations (HCOs) for nine CIs, reflecting a good split of both metropolitan (55%) and non-metro (45%) representation.
In relation to the domain of patient safety, selection, communication and care co-ordination, the most notable change in trend was in relation to CI 1.5 Unscheduled clinical assessment - adult/paediatric patient with a rate of 0.09 per 100 bed days, most probably due to the significant reduction in the HCO outlier rate relative to previous two years, with a comparable number of HCOs contributing data for this CI.
46 AUSTRALASIAN CLINICAL INDICATOR REPORT 2012 - 2019
HOSPITAL IN THE HOME


47
It is worth noting that only ten HCOs have contributed data for this CI over the past three years; other contributing HCOs are encouraged to contribute data to CI 3.1 so that it may be observed closely across a broader patient population. Historically it has been shown that mortality outcomes are not significantly different between HITH and hospital-based care1 and that mortality rates within HITH services is low2,3. Clearly in the event of patient death within a HITH program, the service is required to comply with the broader organisational process for reviewing the case.
Forced by global events and enabled by technology, the model of Hospital in the Home will be reinforced as an important component of the health eco-system. International collaboration and consistent definitions of patient complexity and acuity will in time allow international benchmarking; for now the ACHS Clinical Indicators set the standard for measures of safe and effective care in the Australian context.
REFERENCES
1. Aimonino Ricauda N, Tibaldi V, Leff B et al. Substitutive “Hospital at Home” Versus Inpatient Care for Elderly Patients with Exacerbations of Chronic Obstructive Pulmonary Disease: A Prospective Randomized, Controlled Trial. Journal of the American Geriatrics Society 2008; 56(3): 493-500.
2. Tran A and Taylor DM. Medical model for hospital in the home: effects on patient management. Australian Health Review 2009; 33(3): 494-501.
3. Liu AL and Taylor DM. Adverse events and complications among patients admitted to hospital in the home directly from the emergency department. Emergency Medicine 2002; 14(4): 400-405.

48 AUSTRALASIAN CLINICAL INDICATOR REPORT 2012 - 2019
HOSPITAL IN THE HOME
SUMMARY OF RESULTS
In 2019 there were 117 submissions from 20 HCOs for 9 CIs. None were analysed for trend. In 2019, significant stratum variation was observed in 4 CIs. Seven CIs showed greater
systematic variation, with centile gains in excess of 50% of all events. Outlier gains in excess of 25% of all events were observed in 3 CIs. See Table of Indicator Results below.
Table of Indicator Results Indicator Aggregate rate % Best Stratum Outlier HCOS (%)*
Patient safety, selection, communication and care co-ordination

1.1 Unexpected clinical telephone calls - adult/ paediatric patient (N) 0.71
Outlier Gains (%)+
1.2 Unexpected clinical telephone calls - neonatal patient (N) No data since 2017
Centile Gains (%)+ Events# Trend
1.3 Unexpected administrative telephone callsadult/paediatric patient (L) 0.12 3 (43%) 21 (81%) 25 (96%) 26
1.4 Unexpected administrative telephone callsneonatal patient (L) No data since 2017
1.5 Unscheduled clinical assessment - adult/ paediatric patient (L) 0.090 VIC 2 (18%) 8 (22%) 11 (31%) 36
Service interruption
2.1 Unplanned return to hospital - adult/ paediatric patient (L) 0.50 Metropolitan 9 (47%) 131 (31%) 304 (71%) 428
2.2 Unplanned return to hospital - neonatal patient (L) 0.77 2 (67%) 4 (18%) 21 (95%) 22
2.3 Unplanned return to hospital within 24 hours - adult/paediatric patient (L) 0.057 Metropolitan 1 (7%) 8 (20%) 22 (55%) 40
2.4 Unplanned return to hospital within 24 hours - neonatal patient (L) 0.21 5 (83%) 6
Unexpected deaths
3.1 Unexpected deaths during HITH admissionadult/paediatric patient (L) 0.011 1 (20%) 5
3.2 Unexpected deaths during HITH admissionneonatal patient (L) 0 -
# Number of undesirable or non-compliant events + % of events accounted for by outlier/centile gains * % of HCOs that are outliers
49
GENERAL COMMENTS
Dr David Rankin
Director Clinical Governance and Informatics, Cabrini Health Royal Australasian College of Medical Administrators

Chair, ACHS Hospital-Wide Working Party Version 13
The Australasian Clinical Indicator Report provides Australian hospitals with invaluable data on risk and trends in hospital performance. The 2019 data for the Hospital Wide Indicator Set reinforces the value of these reports.
One of the key challenges in using this data is translating it into action. Creating reports for Clinical Governance committees and Boards, highlighting comparative performance and trends does not change outcomes for the patient. Taking the data for each of our hospitals and engaging clinical staff, creating action plans, implementing change and monitoring progress is the ongoing mission of the clinical leader. To effect change requires the engagement of all staff, not just nursing, clinical risk or infection control, but specialists, VMOs, service and support staff across the organisation.
It is pleasing to see the number of participating healthcare organisations appears to have stabilised. Although well down from a peak of 525 in 2015, this year’s numbers at 418 is similar to the number of HCOs reporting in 2018.
Each hospital is different – in size, case mix, patient age, funding arrangements and mission. Each of these factors has the potential to introduce bias. It is therefore tempting to dismiss comparisons with the excuse that the data is not case mix adjusted, is not stratified by hospital peer group or does not take into accounts your unique circumstances. However, the value of the report comes from the number of participating organisations and the indicators of high and low performance.
One of the concerns with data sets like this is that reporting is voluntary and relies on customised reports from each hospital. Although 391 hospitals provided data on inpatient falls, only 51 hospitals responded to the tonsillectomy question and 22 (12 private) to the appendectomy indicator.
50 AUSTRALASIAN CLINICAL INDICATOR REPORT 2012 - 2019
HOSPITAL WIDE


51
4.2 Inpatient Falls Resulting in Fracture or Closed Head Injury
While the overall rate of inpatient falls appears to have reduced from 0.35 to 0.29 (17%) per hundred bed days over the past five years, the rate of falls with harm has increased from a low of .008 in 2016 to 0.011 in 2019. This 37% rise has occurred despite national consistent and concerted focus on falls prevention.
While the 80th centile rate has fallen slightly over the five-year period, the 20th centile has risen significantly.
It would be helpful to know if this increase is across all hospital types or focused in one particular sector. It would also be helpful to see this figure adjusted for age.
8.1 Rapid Response System Calls to Adult Patients

There appears to be a 30% increase in the rate of rapid response calls over the past 5 years. It is unknown if this trend has come about due to the altered patient type from the additional eleven HCOs that are reporting, a change in the criteria for initiating a rapid response call or a change in the clinical care that is provided to patients.
The increase in both the 20th and 80th centiles may indicate a change in the criteria for initiating a rapid response call.
8.2 Rapid Response System Calls within 24 hours of Admission
Although there has been a small (5%) increase in the number of reporting HCOs, the denominator has remained relatively constant.
The gradual increase may reflect a wide range of changes in healthcare delivery, from inadequate triage and stabilisation in the emergency department, more fragile or high-risk patients presenting for admission, patients proceeding directly to surgery with inadequate workup or altered patient monitoring.
It would be interesting to know if increase in RRS calls is related to changes in admissions arising from the Emergency Department. It would also be of interest to know if they are primarily medical or surgical patients.
8.3 Rapid Response System Attendances within 5 minutes
The 5% reduction in the rate from the mid-90s to 89.1% appears of concern. This may be related to the comparatively low rate in Queensland – at just 68.8%.
With just 56 hospitals reporting against this indicator, 16 public and 42 private, the low response time in Queensland may reflect the mix of their reporting hospitals. Victorian’s 16 hospitals averaged 264 RRS calls per year, while Queensland’s nine hospitals record an average of 713.
Once again ACHS must be congratulated on their work in collating this very important contribution to quality and safety in Australian hospitals. I would challenge you to review the data and collaborate with your clinical staff to move towards achievable high performance.
52 AUSTRALASIAN CLINICAL INDICATOR REPORT 2012 - 2019
GENERAL COMMENTS
Associate Professor Virginia Plummer Australian College of Nursing
AREA
4: Inpatient falls
Falls by hospitalised patients are a common adverse event1, often under-reported, costly in human and fiscal terms and a major safety issue for health services2. Death, serious injury, and psychosocial outcomes may result, including fear of falling again2. Contributing risk factors may be multi-factorial1, 2, 3, 4 and modifiable risk factors require falls prevention strategic management. Screening of patients for factors to predict falls risk and target interventions to prevent falls5 is one approach, yet some assessments are a ‘yes/no’ answer about occurrence of a fall6. There are various views on the success of this approach; others suggest that clinician judgement has been shown to be more predictive7
Recent data from 2019, includes 20,649 fewer inpatient falls, a reduction of approximately one third. There were 720 records from 391 HCOs, an annual rate of 0.29 per 100 bed days. The
REFERENCES
fitted rate improved from 0.35 to 0.29, a change of 0.056 per 100 bed days, which was also significant allowing for the composition of contributing HCOs. There were 163 outlier records from 114 HCOs whose combined excess was 7,703 more inpatient falls. The outlier HCO rate was 0.50 per 100 bed days. There were no significant stratum differences in 2018 or 2019.
Ongoing evaluation of knowledge of falls risk factors and falls prevention strategies is important in preventing falls. Increasing admissions in the at-risk age groups and clinical categories such as the very frail will be expected. There is new evidence that well designed education programs for patient education about their role in hospital falls prevention can reduce falls and associated injuries8
1. Matarese M., Ivziku D., Bartolozzi F., Piredda M. & De Marinis M.G. (2015) Systematic review of fall risk screening tools for older patients in acute hospitals. Journal of Advanced Nursing 71(6), 1198–1209. doi: 10.1111/ jan.12542
2. da Costa BR, Rutjes AW, Mendy A, Freund-Heritage R, Vieira ER. (2012) Can falls prediction tools correctly identify falls prone elderly rehabilitation patients? A systematic review and meta-analysis. PloS One. 7 (7) e$1061.
3. Tiase VL, Tang K, Vawdrey DK, Raso R, Adelman JS, Yu SP, Applebaum JR, Lalwani AK. (2020) Impact of Hearing Loss on Patient Falls in the Inpatient Setting. Am J Prev Med 2020;58(6):839−844

4. Cameron ID, Dyer SM, Panagoda CE, Murray GR, Hill KD, Cumming RG, Kerse N (2018) Interventions for preventing falls in older people in care facilities and hospitals
Cochrane Database of Systematic Reviews. John Wiley & Sons, Ltd SN: 1465-1858
5. Williams C, Jellett, J, Clayton D, Plummer V, Haines T. (2020) Removing risk score from falls risk assessment does not impact inpatient falls: A stepped-wedge, cluster randomised trial. Journal of Clinical Nursing. In Press.13th August 2020
6. Hunter SW, Higa J, Frengolpoulos C, Fiana R, Payne MWC (2020) Evaluating knowledge of falls risk factors and falls prevention strategies among lower extremity amputees after in-patient prosthetic rehabilitation: a prospective study. Disability and rehabilitation. 42:16.2252-2261.
7. Haines TP, Hill KP, Walsh W, Osborne R. (2007) Design related bias in hospital fall risk screening tool predictive accuracy evaluations: systematic review and meta-analysis. The Journals of Gerontology Series A: Biological Sciences and Medical Sciences 2007: 62 (6) 664-72.
8. Heng H, Jazayeri D, Shaw L, Kiegaldie D, Hill A, Morris ME. (2020). Hospital falls prevention with patient education: a scoping review BMC Geriatrics. April 15:20 (1): 140.
HOSPITAL WIDE
53
SUMMARY OF RESULTS
In 2019 there were 4,994 submissions from 414 HCOs for 19 CIs. Sixteen were analysed for trend, 10 of which improved, 3 deteriorated and the remainder showed no evidence of trend. In 2019, significant stratum variation was observed
Table of Indicator Results
in 6 CIs. Fourteen CIs showed greater systematic variation, with centile gains in excess of 50% of all events. Outlier gains in excess of 25% of all events were observed in 11 CIs. See Table of Indicator Results below.
Indicator Aggregate rate % Best Stratum Outlier HCOS (%)*
Hospital readmissions
Outlier Gains (%)+ Centile Gains (%)+ Events# Trend
1.1 Unplanned and unexpected readmissions within 28 days (L) 1.2 Private 43 (16%) 22,351 (50%) 41,561 (93%) 44,751
Return to the operating room
2.1 Unplanned return to the operating room during the same admission (L) 0.22 23 (12%) 886 (20%) 3,049 (68%) 4,517
Pressure injuries
3.1 Inpatients who develop 1 or more pressure injuries (L) 0.04 58 (16%) 1,882 (39%) 4,155 (87%) 4,790
Inpatient falls
4.1 Inpatient falls (L) 0.29 114 (29%) 7,704 (17%) 20,686 (47%) 44,229 4.2 Inpatient falls resulting in fracture or closed head injury (L) 0.01 9 (2%) 271 (18%) 800 (53%) 1,514
Patient deaths
5.1 Patient deaths addressed within a clinical audit process (H) 95.5 21 (10%) 785 (80%) 969 (98%) 984 5.2 Deaths in adult patients who do not have a resuscitation plan (L) 0.10 16 (21%) 244 (37%) 538 (81%) 664 # Number of undesirable or non-compliant events + % of events accounted for by outlier/centile gains * % of HCOs that are outliers
54 AUSTRALASIAN CLINICAL INDICATOR REPORT 2012 - 2019
HOSPITAL WIDE
Table of Indicator Results continued
Indicator Aggregate rate % Best Stratum Outlier HCOS (%)*
Outlier Gains (%)+
Centile Gains (%)+ Events# Trend
Blood transfusion
6.1 Significant adverse blood transfusion events (L) 0.1 4 (2%) 16 (17%) 46 (49%) 93
6.2 Transfusion episodes where informed patient consent was not documented (L) 1.6 11 (10%) 208 (49%) 332 (78%) 426
6.3 RBC transfusion where Hb reading is 100 g/L or more (L) 1.8 NSW 7 (8%) 178 (48%) 274 (74%) 370
Thromboprophylaxis
7.1 VTE risk assessment (H) 77.5 2 (22%) 1,139 (45%) 2,321 (93%) 2,507
Minimum standards for rapid response system calls
8.1 Rapid response system calls to adult patients (N) 3.6 8.2 Rapid response system calls to adult patients within 24 hours of admission (N) 0.8
8.3 Adult patients experiencing cardiopulmonary arrest (L) 0.1 7 (4%) 144 (13%) 493 (45%) 1,101
8.4 Rapid response system attendances within 5 minutes (H) 89.1 NSW 3 (5%) 442 (42%) 926 (87%) 1,060
Surgery
9.1 Pre-operative acute appendicitis - normal histology (L) 8.8 NSW 1 (5%) 4 (3%) 5 (4%) 136 9.2 Laparoscopic cholecystectomy - bile duct injury requiring operative intervention (L) 0.18 2 (4%) 4 (20%) 11 (55%) 20
9.3 Tonsillectomy - significant reactionary haemorrhage (L) 0.31 Metropolitan 5 (16%) 32
9.4 Hip fracture care (H) 75.44 56
Risk assessment
10.1 Frailty assessment (H) No data submitted in 2019 # Number of undesirable or non-compliant events + % of events accounted for by outlier/centile gains * % of HCOs that are outliers
55
GENERAL COMMENTS
Ms Ann Whitfield Board Director, Australasian College for Infection Prevention and Control
Ms Kylie Robb Board Director, Australasian College for Infection Prevention and Control
Each year in Australia 180,000 patients suffer healthcare associated infections (HAIs) that prolong hospital stay and consume two million hospital bed days. Healthcare associated infections are one of the most common, significant and preventable patient safety issues today1

HAIs surveillance remains critical to healthcare organisations (HCO) to improve the patient experience and outcomes However, there remains inconsistencies in data collection and methodology across Australia with many HCOs only having to report voluntarily on many indicators 2 . A national study in 2018 demonstrated a higher prevalence of HAIs than previous studies 3 and variance in reported data highlights the need for national reporting. This study was the first national study in 34 years highlighting the need for further research.
The National Safety and Quality Health Service (NSQHS) Standard, Preventing and Controlling Health Care Associated Infections, identify the need for surveillance such as Multiresistant organisms (MRO), Pneumonia, Catheter Associated Urinary Tract Infections (CAUTI) as well as Surgical Site Infections (SSIs) 4 . However, they do not recommend surveillance of all HAIs and are not specific to the frequency of surveillance. This results in variance with HCOs choosing the type of surveillance required. This can be considered as effective use of the workforce with a HCOs, but it may result in patient risk not being identified. There is also the human factor of error with the lack of definition/methodology, acknowledging the workforce experience and understanding can vary5 and therefore result in variance in reporting.
56 AUSTRALASIAN CLINICAL INDICATOR REPORT 2012 - 2019
INFECTION CONTROL


57
There is a significant variance in the lower segment Caesarean section data SSI (LSCS) - 2017 data. It is important to highlight why the denominator is so high. It would be beneficial if data were broken down into elective or emergency for the same associated risk factor with emergency surgery and the link to more complications, such as prolonged labour and broken membranes.
The Open Colon rate reduced within the criteria SSI (open colon). It could be useful to understand why there were no potential gains captured. This surgery is normally planned and therefore, there is more control for safer surgery.
Antibiotic use, dose and timing are advised by the national therapeutic guidelines 6 however there continues to be poor compliance with HCOs not reaching 100% compliance. This results in sub optimal care and increases risk of HAIs which can result in additional antibiotic use. This is a significant noting as there is international concern with overuse of antibiotics and the increase in MROs.
The National Immunisation Program (NIP) which includes children and adult’s vaccination programs 7 and a National
REFERENCES
Database Australian Childhood Immunisation Register (ACIR) since 1996 8 has traditionally been utilised for childhood immunisations. However, if States mandated that all HCOs and community sites need to report, this could support targeted immunisation programs and provide data for emerging diseases/virus’s for additional vaccination programs. The data demonstrate vaccination increases; however, it is important to acknowledge that 2019 has been the worst influenza season in years. There is a low number of HCOs reporting within the criteria, however 2020 should demonstrate a significant increase.
Whilst the Work Health and Safety Act 20119 is clear on reporting harm occurring within the workplace, there is a lack of national data regarding Occupational Exposures. This could potentially be due to different reporting systems and culture with effective/ ineffective reporting systems at HCO level. Data on occupational exposures is showing a positive downward trend but it is disappointing to see a low number of public hospitals reporting occupational exposures. It would be meaningful if there was an indicator to capture how many resulted in a Blood Borne Virus within the healthcare worker affected. This data would a powerful tool to change practice, culture and increase safety for healthcare workers.
1. Australian Commission on Safety and Quality in Health Care (ACSQHC). (2018). Australian Safety and Quality Goals for Health Care. Darlinghurst: ACSQHC.
2. Russo, P. L., Cheng, A. C., Mitchell, B. G., & Hall, L. (2017). Healthcare-associated infections in Australia: tackling the 'known unknowns'. Australian Health Review, pp. 178-180. doi:https://doi.org/10.1071/AH16223
3. Russo, P. L., Stewardson, A. J., Cheng, A. C., Bucknall, T., & Mitchell, B. G. (2019). The prevalence of healthcare associated infections among adult inpatients and nineteen large Australian acute-care public hospitals: a point prevalence survey. Antimicrobial Resistance & Infection Control, 8.
4. Australian Commission for Safety and Quality in Health Care (ACSQHC). (2017). The National Safety and Quality Health Service (NSQHS) Standards (Second ed.). Darlinghurst, NSW: ACSQHC.
5. Russo, P. L., Cheng, A. C., Richards, M., Graves, N., & Hall, L. (2015). Healthcare-associated infections in Australia: time for national surveillance. Australian Health Review, 37-43. doi:https://doi.org/10.1071/AH14037
6. Therapeutic Guidelines Limited. (2020). Antibiotic. Retrieved from Therapeutic Guidelines eTG complete: https://tgldcdp.tg.org.au/ guideLine?guidelinePage=Antibiotic&frompage=etgcomplete
7. Australian Government. (2020). Australian Immunisation Register. Retrieved from Services Australia: https://www.servicesaustralia.gov.au/ individuals/services/medicare/australian-immunisation-register

8. Australian Government Department of Health. (2020). Immunisation. Retrieved from Australian Government Department of Health: https://www. health.gov.au/health-topics/immunisation
9. Work Health and Safety Act. (2011).
58 AUSTRALASIAN CLINICAL INDICATOR REPORT 2012 - 2019
INFECTION CONTROL
SUMMARY OF RESULTS
In 2019 there were 2,846 submissions from 338 HCOs for 26 CIs. Twenty were analysed for trend, 15 of which improved, 2 deteriorated and the remaining CI showed no evidence of trend. In 2019, significant stratum variation was observed
of

Infection surveillance
in 2 CIs. Fifteen CIs showed greater systematic variation, with centile gains in excess of 50% of all events. Outlier gains in excess of 25% of all events were observed in 13 CIs. See Table of Indicator Results below:
1.1 Deep or organ / space SSI - hip prosthesis procedure (L) 0.6 27 (17%) 160
1.2 Deep or organ / space SSI - knee prosthesis procedure (L) 0.29 1 (1%) 2 (2%) 23 (20%) 113
1.3 Deep or organ / space SSI to chest incision site - CABG (L) 0.73 Private 4 (11%) 35
1.4 Deep or organ / space SSI - LSCS (L) 0.14 4 (6%) 6 (15%) 24 (60%) 40
1.5 Deep or organ/space SSI - open colon surgery (L) 0.74 2
1.6 Deep or organ/space SSI - open rectal surgery (L) 4.13 16
1.7 Deep or organ/space SSI - laparoscopic-assisted large bowel resection (L) 1.24 6
Surgical antibiotic prophylaxis (SAP)
2.1 Timing of SAP for the hip prosthesis procedure (H) 97.84 3 (8%) 28 (39%) 61 (85%) 72
2.2 Correct SAP and dose for the hip prosthesis procedure (H) 92.69 NSW 6 (16%) 115 (47%) 211 (86%) 246
2.3 Discontinuation of SAP within 24 hours of the hip prosthesis procedure (H) 90.07 8 (22%) 141 (43%) 284 (86%) 331
2.4 Timing of SAP for the knee prosthesis procedure (H) 93.8 5 (14%) 188 (71%) 256 (97%) 264
2.5 Correct SAP and dose for the knee prosthesis procedure (H) 90.5 4 (11%) 225 (55%) 380 (94%) 406
Summary of Indicator Results
continued
# Number of undesirable or non-compliant events + % of events accounted for by outlier/centile gains * % of HCOs that are outliers
Table
Indicator Results Indicator Aggregate rate % Best Stratum Outlier HCOS (%)* Outlier Gains (%)+ Centile Gains (%)+ Events# Trend
59
Summary of Indicator Results continued
Indicator
Surgical antibiotic prophylaxis (SAP) (Cont.)
Aggregate rate % Best Stratum Outlier HCOS (%)*
Outlier Gains (%)+
Centile Gains (%)+ Events# Trend
2.6 Discontinuation of SAP within 24 hours of the knee prosthesis procedure (H) 84.2 7 (19%) 346 (52%) 610 (91%) 668
2.7 Timing of SAP for the LSCS procedure (H) 91.0 6 (23%) 185 (47%) 346 (88%) 392
2.8 Correct SAP and dose for the LSCS procedure (H) 93.9 3 (12%) 116 (44%) 194 (73%) 265
2.9 Discontinuation of SAP within 24 hours of the LSCS procedure (H) 90.4 3(12%) 183 (44%) 366 (88%) 415
Haemodialysis access-associated bloodstream infection surveillance
3.1 Haemodialysis - AV-fistula access-associated BSI (L) 0.05 5
3.2 Haemodialysis - CI cuffed line access-associated BSI (L) 0.35 1 (6%) 3 (14%) 21
Vancomycin Resistant Enterococci (VRE)
4.1 VRE infection within the ICU (L) 0.99 1 (2%) 1 (6%) 6 (33%) 18
Staff Immunisation
5.1 Flu vaccination for permanent staff (H) 64.0 19 (33%) 2,450 (19%) 8,457 (64%) 13,140
5.2 Hepatitis B vaccination for permanent staff (H) 86.3 10 (33%) 1,322 (44%) 2,518 (85%) 2,974
5.3 MMR vaccination for permanent staff (H) 87.6 Metropolitan 8 (38%) 729 (39%) 1,525 (81%) 1,879
5.4 Pertussis vaccination for permanent staff (H) 81.8 8 (38%) 986 (36%) 1,775 (64%) 2,775
5.5 Varicella vaccination for permanent staff (H) 85.6 10 (48%) 877 (40%) 1,819 (83%) 2,195 # Number of undesirable or non-compliant events + % of events accounted for by outlier/centile gains * % of HCOs that are outliers
60 AUSTRALASIAN CLINICAL INDICATOR REPORT 2012 - 2019
Table of Indicator Results continued
Indicator
Occupational exposures to blood and/or body fluids
INFECTION CONTROL
Aggregate rate % Best Stratum Outlier HCOS (%)*
Outlier Gains (%)+
Centile Gains (%)+ Events# Trend
6.1 Reported parenteral exposures sustained by staff (L) 0.028 18 (6%) 415 (12%) 2,562 (76%) 3,382 6.2 Reported non-parenteral exposures sustained by staff (L) 0.010 20 (7%) 225 (19%) 1,012 (85%) 1,187
# Number of undesirable or non-compliant events + % of events accounted for by outlier/centile gains * % of HCOs that are outliers
61
GENERAL COMMENTS
Associate Professor Mary White
Australian and New Zealand Intensive Care Society Chair, ACHS Intensive Care Working Party Version 5
Dr Felicity Hawker
College of Intensive Care Medicine of Australia and New Zealand Member, ACHS Intensive Care Working Party Version 5
There are 188 intensive care units in Australia of which 111 are accredited for intensive care training by the College of Intensive Care Medicine (CICM). The number of HCOs submitting data for the ACHS clinical indicators ranges from 12 to 73 with a mean of 50.3. This number looks to be less than in previous years and it may be related to reduced data collection/analysis because of COVID-19. Although less of a problem than for paediatric ICUs, the small number of HCOs submitting data for some adult ICU indicators raises questions about generalisability and particularly limits interpretation of regional subgroups. However, the present findings still provide some useful insight into overall practice.

The report shows that the five clinical indicators assessing adult access and exit block (CI1.1-1.5) have been relatively constant since 2012 (at least) but 74 of the 275 HCOs (27%) who contribute data to CIs 1.1-1.5 are outliers. Access to and exit from ICU is dependent on both ICU and hospital-wide systems. The data continue to demonstrate the bimodal distribution described in 2019. Better resourced HCOs that are more likely to be private and metropolitan have rates that are lower and therefore more desirable. On the other hand, HCOs that are public and non-metropolitan tend to have higher rates that on the face of it look less desirable. It is likely that the outliers are all the same HCOs and they are clearly under resourced.
Discharge delay appears to be a particular problem in NSW. This is also the area of the country with one of the highest numbers of ICU beds when indexed to population. Recent evidence about
62 AUSTRALASIAN CLINICAL INDICATOR REPORT 2012 - 2019
INTENSIVE CARE


63
Twelve HCOs contributed data to CI 6.1 Empathetic practice toward families of ICU patients which is an increase from nine in 2018. In 2019 the number of occasions when a family member has received follow-up contact after a patient’s death has doubled since this indicator was introduced in 2016. This is encouraging and the overall rate of 86.3% up from 52.2% in 2016 suggests that the HCOs that do this do it very well. This is a key part of good end-of life care and the trend is extremely encouraging.

This year again, the dataset reflects only a small fraction of the paediatric intensive care that is delivered in Australia, and institutions submitting data treat few critically ill children. As a consequence of the small numbers of patients and submitting institutions, the data cannot be interpreted with confidence. None of the five indicators pertaining to paediatric intensive care was concerning, but the confidence intervals around such data are extremely wide.
Adult access and exit block CI 1.1-1.5
The adult access and exit block indicators are very revealing and as we said last year are far more likely to be indicative of under-resourcing with a great divide between private and public. It is difficult then to interpret any of the statistically calculated indicative rates of improvement as being clinically relevant. These improvements may well disappear if private and public hospitals are looked at separately. It may be appropriate that they be considered separately in all parts of the report. The private system caters primarily to elective surgical patients with short stays in ICU without attendant issues of access and exit block while the public ICUs are rife with exit block and after hours discharges. Looking at the outliers for access and exit indicators it is likely that the same ICUs that have exit block and after hours discharge will have access block issues. Analysis of the dataset after removing outliers may also be very revealing.
The Intensive Care Working Party would strongly recommend that demonstrable exit block mitigation strategies in outliers be reviewed regularly (possibly every six months). This is the only way in which to effect a meaningful difference with these indicators and their attendant clinical implications.
REFERENCES
1. Forster GM, Bihari S, Tiruvoipati R, Bailey M, Pilcher D. The Association Between Discharge Delay from Intensive Care and Patient Outcomes. Am J Respir Crit Care Med. 2020 Jul 10. doi: 10.1164/rccm.201912-2418OC. Epub ahead of print. PMID: 32649212.
GENERAL COMMENTS
On behalf of the Australian College of Critical Care Nurses (ACCCN), we are pleased to provide this commentary on the Intensive Care Clinical Indicator Report included in The Australasian Clinical Indicator Report 2012–2019 . The data set provides important information for intensive care units of contributing healthcare organisations (HCOs) regarding their
performance in these areas. Monitoring the ongoing trend of the collected clinical indicators' data enables clinicians to respond promptly to issues, such as an increase in adverse events or lack of patient admission due to inadequate resources. It is good to see that most facilities are demonstrating positive trends in the clinical indicators over time.
Dr Frances Lin Associate Professor in Nursing, School of Nursing, Midwifery, and Paramedicine, University of the Sunshine Coast Fellow, Australian College of Critical Care Nurses
Professor Elizabeth Manias School of Nursing and Midwifery, Centre for Quality and Patient Safety Research, Institute for Health Transformation, Deakin University
64 AUSTRALASIAN CLINICAL INDICATOR REPORT 2012 - 2019
INTENSIVE CARE

We noted that the clinical indicators' data set was last reviewed in 2015. We comment on the following trends in clinical indicators.
For indicator 1.1, ICU adult non-admission due to inadequate resources, the fitted rate improved from 0.80 to 0.67, a change of 0.13 per 100 admissions. The difference among public and private hospitals shows a similar trend compared with last year, with public hospitals having higher annual rates than private hospitals (rate 2.48% vs 0.078%). It is also worth noting that the annual rate for Non-metropolitan HCOs (stratum rate 5.31%) is much worse than the metropolitan HCOs (rate 1.27). This disparity could be related to the issue of supply and demand however, it could also be related to patient flow issues. For example, discharge delays in ICUs due to the lack of beds on the wards, could have a follow-on effect on this clinical indicator. Research evidence continues to show that delayed admission to ICUs is associated with increased mortality1. HCOs that had a higher rate in this indicator should thoroughly examine the barriers of admitting patients into their intensive care units, so that targeted interventions can be implemented to address the issue. Also, of interest would be to determine if inadequate resources are more apparent during times of the year or days of the week so that further preemptive measures can be taken to prevent this issue in the future. Overall, there were 1,012 fewer adult patients who could not be admitted to an ICU due to inadequate resources, which was a positive result.
For indicator 1.4, ICU - adult discharge delay more than 12 hours, the fitted rate improved from 14.8 to 14.1, a change of 0.67 per 100 adult patients. Nationally, NSW had the highest annual rate of delay (22.9%), followed by Victoria (12.0%) and
Queensland (7.75%). Although there were 8,869 fewer patients whose discharge was delayed more than 12 hours in 2019, the rate in the past few years has been high, which indicates the need to better understand the barriers to reducing discharge delays, especially the HCOs that had higher rates in this indicator. There were large variations for this indicator, which could relate to marked variability in intensive care practices. Opportunities exist for major learnings between HCOs about ways in which to manage this indicator.
Indicator 4.1 Adult ICU-associated CI-CLABSI annual rate was 0.41 per 1000 line days which is in a downward trend, and variations across HCOs were small. This result indicates an overall strong effort from contributing HCOs in their CLABSI prevention efforts.
Indicator 6.1 Empathetic practice toward families of ICU patients at end-of-life care, shows a promising continuing upward trend since the indicator was introduced to the data set in 2015, with an annual rate of 86.3%. Increased focus about communicating with families during end-of-life care, especially those of marginalised backgrounds, has helped to encourage clinicians to understand the importance of this issue2
Overall, this current report shows that out of the 16 indicators, most showed positive trends. We encourage all HCOs to carefully monitor their own facilities' trends in all clinical indicators, and for those HCOs that did not produce desired trends, investigations can be conducted to better understand factors associated with results, such as the inability to admit patients into ICUs in a timely manner and discharge delays.
REFERENCES
1. Hsieh, C.-C., Lee, C.-C., Hsu, H.-C., Shih, H.-I., Lu, C.-H., & Lin, C.-H. (2017). Impact of delayed admission to intensive care units on patients with acute respiratory failure. The American Journal of Emergency Medicine, 35(1), 39-44. doi:10.1016/j.ajem.2016.09.066
2. Brooks, L., Bloomer, M., & Manias, E. (2019) Culturally sensitive communication at the end of life in the ICU: A systematic review. Australian Critical Care, 32(6), 516-523
65
SUMMARY OF RESULTS
In 2019 there were 1,060 submissions from 94 HCOs for 16 CIs. Fifteen were analysed for trend, 11 of which improved, 1 deteriorated and the remainder showed no evidence of trend. In 2019, significant stratum variation was observed
Table of Indicator Results
Indicator
Access and exit block
in 8 CIs. Eleven CIs showed greater systematic variation, with centile gains in excess of 50% of all events. Outlier gains in excess of 25% of all events were observed in 10 CIs. See Table of Indicator Results below.
Aggregate rate % Best Stratum Outlier HCOS (%)*
Outlier Gains (%)+
Centile Gains (%)+ Events# Trend
1.1 ICU - adult non-admission due to inadequate resources (L) 1.6 Metropolitan 12 (24%) 505 (53%) 926 (97%) 950
1.2 ICU - elective adult surgical cases deferred or cancelled due to unavailability of bed (L) 1.3 Private 13 (27%) 223 (53%) 405 (96%) 421
1.3 ICU - adult transfer to another facility / ICU due to unavailability of bed (L) 0.7 Private 9 (18%) 209 (51%) 382 (92%) 413
1.4 ICU - adult discharge delay more than 12 hours (L) 15.2 Private 17 (28%) 3,300 (33%) 8,869 (89%) 9,997
1.5 ICU - adult discharge between 6pm and 6am (L) 15.1 Private 23 (35%) 3,254 (31%) 7,834 (75%) 10,472
1.6 ICU - paediatric discharge between 6pm and 6am (L) 9.3 2 (18%) 5 (13%) 38
1.7 ICU - elective paediatric surgical cases deferred or cancelled (L) 0.0# Number of undesirable or non-compliant events + % of events accounted for by outlier/centile gains * % of HCOs that are outliers
66 AUSTRALASIAN CLINICAL INDICATOR REPORT 2012 - 2019
INTENSIVE CARE
SUMMARY OF RESULTS
Table of Indicator Results continued Indicator
Intensive care patient management
Aggregate rate % Best Stratum Outlier HCOS (%)*
Outlier Gains (%)+
Centile Gains (%)+ Events# Trend
2.1 Rapid response system calls to adult ICU patients within 48 hours of ICU discharge (L) 5.2 Private 10 (19%) 1,127 (36%) 2,745 (87%) 3,158
2.2 Rapid response system calls to paediatric ICU patients within 48 hours of ICU discharge (L) 0.2 2
Intensive care patient treatment
3.1 VTE prophylaxis in adult patients within 24 hours of ICU admission (H) 94.6 Private 16 (24%) 1,823 (48%) 3,708 (98%) 3,788 Central line-associated bloodstream infection
4.1 Adult ICU-associated CI-CLABSI (L) 0.4 NSW 3 (7%) 43
4.2 Paediatric ICU-associated PI-CLABSI (L) 0.9 1
Utilisation of patient assessment systems
5.1 Participation in the ANZICS CORE Adult Patient Database (APD) (H) 96.7 12 (20%) 1,750 (83%) 2,107 (100%) 2,114
5.2 Participation in the ANZICS CORE Paediatric Intensive Care (ANZPIC) registry (H) 94.9 3 (38%) 17 (85%) 17 (85%) 20
Empathetic practice
6.1 Empathetic practice toward families of ICU patients (H) 86.3 3 (25%) 22 (30%) 56 (76%) 74 # Number of undesirable or non-compliant events + % of events accounted for by outlier/centile gains * % of HCOs that are outliers
67
GENERAL COMMENTS
CI 4.1 Assessment of cognitive function for all general medical patients 65 years or over at admission
CI 4.2 Geriatric patients-documented assessment of physical function
People are living longer today than in previous generations and most are living with one or two chronic conditions Older people aged > 65 years 2 are individuals with diverse care needs not defined by age alone 3 and generally engage with more health services, more often than those < 65years Cognitive impairment increases with aging 1, 5. The evaluation of cognition should be included for functional decline among older adults, in addition to physical assessment on admission to hospital 1 . Important parameters can then be measured, enabling prediction of functional outcomes and prevention of complications.

There were seven records from four HCOs, the number gradually declining over seven years from 12 in 2012 for CI 4.1 (Cognition assessment) and eight records from 5 HCOs declining at a similar rate from 14 in 2012 for CI 4.2 (Physical assessment). Declining numbers of HCOs is unlikely to be perceived as lack of importance of the indicator, rather it may be due to mandatory reporting of the same data to other agencies such as Aged Care Assessment Screening (ACAS).
REFERENCES
1. Oh-Park M. (2017) Interplay between cognition and mobility in older adults, AGMR 21 (1) : 2-9
2. World Health Organisation (2015) World report on health and ageing. https://www.who.int/ageing/events/world-report-2015-launch/en/
3. Tocchi (2015) Frailty in older adults. An evolutionary concept analysis. Research and Theory for Nursing Practice: An International Journal. 29 (1) 66-84
4. AIHW (2017) https://www.aihw.gov.au/reports/older-people/older-australia-at-a-glance/contents/service-use/health-care-hospitals
5. Ravona-Springer R, Luo X, Schmeidler J, Wysocki M, Lesser G, Rapp M, Dahlman K, Grossman H, Haroutunian V, Beeri M. (2011). The Association of Age with Rate of Cognitive Decline in Elderly Individuals Residing in Supporting Care Facilities. Alzheimer Disease & Associated Disorders. 25(4):312–316, OCT 2011
Associate Professor Virginia Plummer Australian College of Nursing Member, ACHS Internal Medicine Working Party Version 6
68 AUSTRALASIAN CLINICAL INDICATOR REPORT 2012 - 2019


69
INTERNAL MEDICINE
SUMMARY OF RESULTS
In 2019 there were 114 submissions from 24 HCOs for 18 CIs. Five were analysed for trend, 3 of which improved, 1 deteriorated and the remaining CI showed no evidence of trend. In 2019, significant stratum variation was observed in 0 CIs.
Four CIs showed greater systematic variation, with centile gains in excess of 50% of all events. Outlier gains in excess of 25% of all events were observed in 2 CIs. See Table of Indicator Results below.
Table of Indicator Results Indicator Aggregate rate % Best Stratum Outlier HCOS (%)*
Cardiovascular disease
Outlier Gains (%)+
Centile Gains (%)+ Events# Trend
1.1 CHF - prescribed ACEI / A2RA (H) 95.6 3 (30%) 10
1.2 CHF - prescribed beta blocker (H) 98.0 2 (33%) 6
1.3 CHF and AF - prescribed warfarin (H) 94.7 3
1.4 CHF - chronic disease management referral including physical rehabilitation (H) 71.0 23 (38%) 61
1.5 PTCA - vessels where primary success achieved (H) 96.4 24 (20%) 122
Endocrine disease

2.1 Hospitalised patients with severe hypoglycaemia less than 2.8 mmol/L (L) 17.4 49
Acute stroke management
3.1 Acute stroke - documentation of swallowing screen conducted within 24 hours prior to food or fluid intake (H) 78.2 23 (10%) 229
3.2 Acute stroke - documented physiotherapy assessment within 48 hours of presentation (H) 74.3 57 (21%) 270
3.3 Acute stroke - plan for ongoing community care provided to patient / family (H) 83.4 1 (17%) 23 (18%) 69 (53%) 129
3.4 Acute stroke - documented treatment in a stroke unit during hospital stay (H) 88.9 1 (14%) 22 (20%) 39 (35%) 110
# Number of undesirable or non-compliant events + % of events accounted for by outlier/centile gains * % of HCOs that are outliers
70 AUSTRALASIAN CLINICAL INDICATOR REPORT 2012 - 2019
Summary of Indicator Results
Indicator
Care of the elderly
continued
INTERNAL MEDICINE
Aggregate rate % Best Stratum Outlier HCOS (%)*
Outlier Gains (%)+
Centile Gains (%)+ Events# Trend
4.1 Medical patients 65 years or older - cognition assessment using validated tool (H) 78.0 1 (25%) 324 (49%) 651 (98%) 667
4.2 Geriatric patients - documented assessment of physical function (H) 98.3 1 (20%) 33 (59%) 51 (91%) 56
4.3 Documentation of delirium plan (H) No data has been submitted for this indicator since 2015
4.3 Documentation of delirium plan (H) No data has ever been submitted for this indicator Respiratory disease

5.1 COPD - chronic disease management service referral (H) 64.9 1 (50%) 11 (18%) 23 (38%) 61
5.2 Acute asthma - assessment of severity documented on admission (H) 91.6 1 (25%) 2 (17%) 7 (58%) 12
5.3 Acute asthma - appropriate discharge plan documented (H) 60.1 9 (16%) 57 Gastrointestinal disease
6.1 Haematemesis / melaena with blood transfusion - gastroscopy within 24 hours (H) 75.2 17 (45%) 38
6.2 Haematemesis / melaena with blood transfusion & subsequent death (L) 4.6 7
Oncology
7.1 Time to administration of antibiotics for patients admitted with febrile neutropenia (H) 83.3 1 # Number of undesirable or non-compliant events + % of events accounted for by outlier/centile gains * % of HCOs that are outliers
71
GENERAL COMMENTS
Dr Vijay Roach President, Royal Australia and New Zealand College of Obstetricians and Gynaecologists
The Royal Australian and New Zealand College of Obstetricians and Gynaecologists (RANZCOG) is again pleased to have the opportunity to comment on the maternity indicators in the Australian Council on Healthcare Standards (ACHS) / HSRG Australasian Clinical Indicator Report for 2012-2019 women want to know what to expect on their pregnancy and birth journey and the data in this report makes an important contribution to the information women can be given to allow key decisions to be made regarding their care. It enables women to manage expectations with respect to the likelihood of needing specific treatments and the outcomes that might be reasonably expected along the way. Again, we congratulate ACHS for another year of excellent work.
The 2019 report is reassuring in many areas. In 2011, ACHS introduced a clinical indicator that reports the rate of severe fetal growth restriction (FGR) at, or beyond, the expected due date for the pregnancy. This is important because we know that the mortality of the FGR fetus increases exponentially as the gestation advances beyond 39 weeks’ gestation improvement in this statistic continued in 2019 so that the incidence was down to 1.16% (the lowest ever) after beginning at 1.62%. Well done to ACHS for encouraging clinicians (both obstetricians and midwives) to focus on the detection of FGR, and to the clinicians for almost certainly impacting on the mortality and long-term morbidity in this significantly at-risk population.

72 AUSTRALASIAN CLINICAL INDICATOR REPORT 2012 - 2019


73
MATERNITY
Finally, the caesarean section rate in selected primipara continues to increase, reaching 32.4% of all births in that patient group, after beginning at 28.9% in 2012. The corresponding downward trends in the rates of transfusion for haemorrhage, 4th degree tears and caesarean section under general anaesthesia all reflect a change in perception, and acceptance, of risk with mothers opting for caesarean section in preference to a long, difficult labour and the potential of a midcavity instrumental birth that is often accompanied by a postpartum haemorrhage and serious trauma to the pelvic floor.
There are many factors at play. Clinicians (midwives and obstetricians) are more responsive to the need for womencentred care and communication of risk has improved. The maternal population, who are older, more obese, and with a lower planned future parity, are better informed and have a better understanding of potential risks. Caesarean section is now an acceptable outcome, contrasting with a past approach of “vaginal birth at all costs”. The changing statistics reflect women exercising choice.
REFERENCES
1. Vashevnik, S., Walker, S. and Permezel, M. (2007), Stillbirths and neonatal deaths in appropriate, small and large birthweight for gestational age fetuses. Australian and New Zealand Journal of Obstetrics and Gynaecology, 47: 302-306. doi:10.1111/j.1479-828.2007.00742.
2. Darney BG, Snowden JM, Cheng YW, Jacob L, Nicholson JM, Kaimal A, Dublin S, Getahun D, Caughey AB. Elective induction of labor at term compared with expectant management: maternal and neonatal outcomes. Obstet Gynecol. 2013 Oct;122(4):761-9.
3. Boulvain M, Senat M-V, Perrotin F, et al, for the Groupe de Recherche en Obstetrique et Gynecologie (GROG). Induction of labour versus expectant management for large-for-date fetuses: a randomised controlled trial. Lancet 2015; published online April 9. http://dx.doi.org/10.1016/ S0140- 6736(14)61904-8.
4. Walker SP, McCarthy EA, Ugoni A, Lee A, Lim S, Permezel M. Cesarean delivery or vaginal birth: a survey of patient and clinician thresholds. Obstet Gynecol. 2007 Jan;109(1):67-72.
5. Australian Commission for Safety and Quality in Health Care. https://www.safetyandquality.gov.au/sites/default/files/migrated/3.5-Third-and-fourth-degree-perineal-tears.pdf

74 AUSTRALASIAN CLINICAL INDICATOR REPORT 2012 - 2019
GENERAL COMMENTS
Dr Helen Cook
Ms Maureen Hutchinson
Australian College of Midwives
The Australian College of Midwives thanks the ACHS for the opportunity to comment on the Maternity Clinical Indicators. We note that the denominator in most of these indictors represent approximately 10% of the total birthing population and these numbers appear to be reducing each year. We are concerned that the value of these outcomes is diminished and has become less relevant as a guide to clinical outcomes. We would welcome a review of the data collection processes to ensure more robust and comprehensive data collection can occur into the future.
CI 1.2: Induction of labour
We are concerned about the increasing rate of induction of labour (IOL) in selected primips. These are women who start their first pregnancy without risk factors and the reasons for what appears to be unnecessary IOL in this group requires further investigation. Further clarification as to whether the new stillbirth information and ARIVE trial are impacting on these findings1 would be beneficial.
CI 2.1: Vaginal birth after caesarean section
VBAC rates continue to decrease. We note a 2018 paper by Fitzpatrick et al which shows a statistical increase in adverse outcomes for VBAC v ERCS. The numbers in this study for poor outcomes, although statistically significant, are still very low with 2/1,000 risk of uterine rupture for VBAC and a rate of 4/10,000 for ERCS2
AREA 3: Major perineal tears and surgical repair of the perineum

With regard to perineal outcomes, we note that the increase in episiotomy rates appears to have had no impact on the rates of 3rd and 4th degree tears. Indeed, all that has changed is an increase in episiotomies for the sake of a decrease in intact perineum.
CI 10.1: Term neonates - transferred or admitted to a NICN or SCN
This indicator has remained unchanged now over many years and provides little useful information. Acuity of babies would be more helpful for understanding neonatal outcomes and how best to direct care. More valuable information is collected via the ANZNN around this indicator1. It may be timely to review this indicator.
REFERENCES
1. Grobman, 2018 https://www.nejm.org/doi/pdf/10.1056/NEJMoa1800566
2. Fitzpatrick 2018 https://www.ncbi.nlm.nih.gov/pmc/articles/PMC6759152/#:~:text=Broad%20policy%20consensus%20in%20high,after%20 previous%20cesarean%20(VBAC)%2C
3. ANZZN Report https://anznn.net/Portals/0/AnnualReports/Report%20of%20the%20Australian%20and%20New%20Zealand%20Neonatal%20 Network%202018.pdf
MATERNITY
75
SUMMARY OF RESULTS
In 2019 there were 3,717 submissions from 135 HCOs for 21 CIs. Seventeen were analysed for trend, 7 of which improved, 7 deteriorated and the remaining CI showed no evidence of trend. In 2019, significant stratum variation was observed in 10 CIs.
Table of Indicator Results
Five CIs showed greater systematic variation, with centile gains in excess of 50% of all events. Outlier gains in excess of 25% of all events were observed in 4 CI. See Table of Indicator Results below.
Indicator Aggregate rate % Best Stratum Outlier HCOS (%)*
Outcome of selected primipara
Outlier Gains (%)+
Centile Gains (%)+ Events# Trend
1.1 Selected primipara - spontaneous vaginal birth (H) 41.3 13 (11%) 838 (4%) 2,306 (11%) 20,923
1.2 Selected primipara - induction of labour (L) 44.9 2 (2%) 174 (1%) 1,916 (12%) 16,185
1.3 Selected primipara - instrumental vaginal birth (L) 26.0 1 (1%) 36 (0%) 1,210 (13%) 9,360
1.4 Selected primipara - caesarean section (L) 32.4 15 (13%) 920 (8%) 2,627 (22%) 11,701
Vaginal birth after caesarean section (VBAC)
2.1 Vaginal delivery following previous birth of caesarean section (N) 10.4 Major perineal tears & surgical repair of the perineum
3.1 Selected primipara - intact perineum (H) 11.5 9 (9%) 211 (1%) 2,242 (11%) 19,863
3.2 Selected primipara - episiotomy and no perineal tear (N) 36.8
3.3 Selected primipara - perineal tear and NO episiotomy (L) 42.3 NSW 6 (7%) 189 (2%) 1,936 (23%) 8,397
3.4 Selected primipara - episiotomy and perineal tear (L) 7.2 NSW 4 (5%) 75 (5%) 530 (38%) 1,403
3.5 Selected primipara - surgical repair of perineum for third degree tear (L) 4.5 Private 3 (3%) 74 (7%) 317 (31%) 1,030
3.6 Selected primipara - surgical repair of perineum for fourth degree tear (L) 0.2 2 (4%) 56
# Number of undesirable or non-compliant events + % of events accounted for by outlier/centile gains * % of HCOs that are outliers
76 AUSTRALASIAN CLINICAL INDICATOR REPORT 2012 - 2019
Table of Indicator Results continued
Indicator
General anaesthesia for caesarean section
Aggregate rate % Best Stratum Outlier HCOS (%)*
Outlier Gains (%)+
Centile Gains (%)+ Events# Trend
4.1 General anaesthetic for caesarean section (L) 5.5 Private 17 (15%) 459 (16%) 1,503 (53%) 2,846
Antibiotic prophylaxis & caesarean section
5.1 Appropriate prophylactic antibiotic at time of caesarean section (H) 93.7 14 (15%) 1,074 (46%) 2,111 (91%) 2,322
Exclusive breastfeeding
6.1 Selected primipara - exclusive breastfeeding (H) 69.7 6 (13%) 327 (7%) 1,419 (30%) 4,756
Postpartum haemorrhage / blood transfusions
7.1 Vaginal birth - blood transfusion (L) 1.3 Private 5 (4%) 159 (14%) 416 (37%) 1,114 7.2 Caesarean section - blood transfusion (L) 1.1 Private 3 (3%) 57 (10%) 181 (31%) 589
Intrauterine growth restriction (IUGR)
8.1 Babies - birth weight less than 2,750 g at 40 weeks gestation or beyond (L) 1.2 1 (1%) 9 (2%) 64 (15%) 416
Apgar score
9.1 Term babies - Apgar score of less than 7 at 5 minutes post-delivery (L) 1.3 Private 5 (4%) 82 (5%) 580 (33%) 1,740
All admissions of a term baby to special care nursery or neonatal intensive care nursery
10.1 Term babies - transferred or admitted to NICN or SCN (L) 10.4 29 (25%) 2,088 (16%) 6,486 (48%) 13,395
Specific maternal peripartum adverse events
11.1 Specific maternal peripartum adverse events addressed within peer review process (H) 67.3 2 (8%) 55 (54%) 97 (95%) 102 # Number of undesirable or non-compliant events + % of events accounted for by outlier/centile gains * % of HCOs that are outliers
MATERNITY 77
GENERAL COMMENTS
Dr Sasha Bennett NSW Therapeutic Advisory Group Chair, ACHS Medication Safety Working Party
Two hundred and seventy-four health care organisations (HCOs) undertook at least one clinical audit using the ACHS Clinical Indicators (CIs) for Medication Safety Version 4 during 2019. Private HCOs remain the major users (70%) as compared to public hospitals and two-thirds of all HCOs were based in metropolitan areas. In general, there appears to be stability or improvement across the system with regard to medication safety as reflected by 2019 audit results, although results regarding medication-related processes at admission (CIs 3.1 and 6.1), discharge patient medication lists (CI 5.6) and prescriptions for guideline-concordant antibiotics (CIs 2.1 and 2.3) and the low uptake of CIs in specific therapeutic areas are concerning. A review of the collated CI results can be found in the next section.
Clinical auditing provides a number of important outcomes. It assists health care organisations (HCOs) to understand the processes, systems and outcomes of care that they deliver and ensure it is reliable, safe and of high quality; they ensure HCOs comply with National Safety and Quality Health Service (NSQHS) standards of care; they drive continuous quality improvement; they inform jurisdictions of performance and drive changes in policy and investment around safety and quality; and lastly, they have the potential to identify emerging issues. Given the limited resources and increasing demand for audits, hospitals need to carefully consider how often and which clinical indicators need to be measured to ensure that they are targeting their gaps and demonstrating improvements over time.
Medication-related accreditation assessments since 2013 have focused on evaluation of an organisation’s systems and

78 AUSTRALASIAN CLINICAL INDICATOR REPORT 2012 - 2019


79
MEDICATION SAFETY
The implementation of electronic medical records and medication management systems (eMR and eMMS, respectively) not only represents the ability to improve acquisition of data but may also represent diversion of existing resources, need for new resources and systems, the upskilling of staff to ensure appropriate utility, and the development of new relationships and workflows. The need for clinical auditing is even more critical given the huge change in workflow that these new technologies present. Many of these CIs may be used for ‘before and after’ studies of eMR and/or eMMS implementations and the results in 2019 suggest that this has been occurring in some jurisdictions. Some CIs should become less important with the implementation of eMMS e.g. use of error-prone abbreviations, ADR charting; however, emergence and measurement of other potential medication safety issues need to be considered.
The most commonly reported Clinical Indicator (CI) continues to be CI 6.3, Number of medication errors resulting in an adverse event requiring intervention per number of occupied bed days, which was undertaken by 252 HCOs. How hospitals use this ‘automated’ indicator to guide their medication safety practices requires investigation.
Similar to 2018 results, the most popular non-automated indicators (CIs 1.1 - 6.1) during the 2019 audit year were CIs 3.1, 3.2, 3.3, 5.5, and 5.6 demonstrating a focus on processes that target medication reconciliation at admission, inpatient medication charting and communication of medication information for ongoing care after discharge. There is an increasing trend for HCOs to measure CIs 3.1 (medication reconciliation at admission), 3.2 (ADR documentation on medication chart) and 5.6 (current accurate and comprehensive patient medication list at discharge).
It was reassuring to see a much greater number of patient records in 2019 were audited for CI 6.1 (the review of patients
by a clinical pharmacist within one day of admission) compared to previous years although the number of auditing HCOs were similar to previous years. Of concern, the rate of pharmacist review within one day of admission continues to deteriorate and there was one HCO which had particularly low rates of 25%. Given that this review process should accompany medication reconciliation processes at admission (measured by CI 3.1), it is not surprising that results for CI 3.1 do not significantly improve. The processes at admission indicate the potential for increasing risk of medication-related harm at admission and should be of concern to health administrators and clinicians. The results for CI 3.1 were worse in public HCOs compared to private HCOs (whose involvement increased in 2019) and Victoria and Western Australia performed very well whereas Queensland results suggest room for significant improvement.
Medication charting of adverse drug reactions (CI 3.2) remains high (96%) and increasing numbers of HCOs are using this CI and, unlike in previous years, there was little difference between metropolitan hospitals and non-metropolitan hospitals. There was also little jurisdictional variation although WA HCOs continues to demonstrate significant potential for improvement. The patient numbers suggest that electronic Medication Management Systems (eMMS) assisted auditing in NSW and Victoria.
Fewer HCOs used CI 3.3 (rate of error-prone abbreviations (EPA) in medication orders) in 2019 and there has been a trend of increasing EPAs over the last 4 years. Further, the rate of EPA use continues to be higher in non-metropolitan hospitals (8.3%) compared to metropolitan hospitals (2.3%). This may indicate the implementation of eMMS in metropolitan sites and possible de-skilling of prescribers leading to more errors when they are on non-metropolitan placements. There remains further room for improvement although the implementation of eMMS in many hospitals should reduce this source of medication error.

80 AUSTRALASIAN CLINICAL INDICATOR REPORT 2012 - 2019
MEDICATION SAFETY

The results from audits using Clinical Indicators 5.5 and 5.6, Percentage of patients who receive a current, accurate and comprehensive medication list at discharge summaries and Percentage of patients who receive a current, accurate and comprehensive medication list at the time of hospital discharge are interesting. Laudably, uptake of CIs 5.5 and 5.6 continues to grow in terms of HCOs and patient numbers. Audit results of CI 5.6 (51%) continue to show substantial room for improvement. Similar numbers of public and private HCOs used CI 5.6 but public hospitals reviewed a 10-fold increased number of patients suggesting that eMMS analysis was again used to obtain the result.
In contrast to the suboptimal result for CI 5.6 (concerning the medication list provided to patients), the result for CI 5.5 (concerning the medication list in discharge summaries) was 95%, similar to the 2018 result of 97%. As stated in the 2019 commentary, the CI 5.5 result continues to be dubious and warrants further investigation. Far fewer patient records are audited in CI 5.5 compared to those in CI 5.6. There would be benefit in auditing these two indicators at the same time.
The numbers of HCOs undertaking audits involving antibiotic therapy, antithrombotic therapy and pain management were low [average 4.9, (range 0-8)]. This is of significant concern given that these CIs target commonly encountered medication safety issues; although it may be that other measures are being used by HCOs to measure the safety and quality of care involving use of these medications.
Although 70% of all HCOs represented the private HCO sector, there were generally far greater indicator denominator numbers (patients, charts, orders) in the public HCO sector. This may or may not be appropriate.
It is unclear which hospitals were undertaking accreditation during 2019 and what impact this has on the use of the CIs. Only one CI appears to be routinely used by the majority of hospitals: CI 6.3, Reporting of medications errors resulting in an adverse event requiring intervention. Given the high level reporting of this indicator and the variation in results (public versus private and between jurisdictions), reporting of how this CI influences care would be useful. This also applies to Clinical Indicator 6.2 Reporting of adverse drug reactions to TGA which, while being easily obtained, is only reported by 82 HCOs in 2019.
The ACHS CI set provides the use of validated CIs targeted at well-recognised gaps in medication safety. The collation of CI results provides benchmarking information but importantly hospitals need to look at their results and previous results to assess their need for further quality improvement intervention. Comparisons of the results between sectors, whether public versus private or metropolitan versus rural, need to interpreted very cautiously as they may not have been measured using the same methodology or have the same casemix.
It remains critically important that clinical audits that address local issues as well as well-recognised evidence-based gaps are well-resourced in busy resource-limited health care environments. Recent implementation of technology such as eMMS are beginning to have a substantial impact on clinical auditing processes and results and information regarding their impact is required. Feedback from HCOs regarding audits in the area of medication safety should be regularly obtained to ensure appropriate responsiveness in the health care system.
81
SUMMARY OF RESULTS
In 2019 there were 1,079 submissions from 274 HCOs for 19 CIs. Thirteen were analysed for trend, 6 of which improved, 5 deteriorated and the remainder showed no evidence of trend. In 2019, significant stratum variation was observed in 4 CIs.
Table of Indicator Results
Antithrombotic therapy
Fourteen CIs showed greater systematic variation, with centile gains in excess of 50% of all events. Outlier gains in excess of 25% of all events were observed in 4 CIs. See Table of Indicator Results below.
Indicator Aggregate rate % Best Stratum Outlier HCOS (%)*
Outlier Gains (%)+
Centile Gains (%)+ Events# Trend
1.1 Percentage of patients prescribed enoxaparin whose dosing schedule is appropriate (H) 75.9 1 (17%) 45 (36%) 116 (94%) 124
1.2 Percentage of patients prescribed hospital initiated warfarin whose loading doses are consistent with a Drug and Therapeutics Committee approved protocol (H) 79.8 17 (77%) 22
1.3 Percentage of patients with an INR above 4 whose dosage has been adjusted or reviewed prior to the next warfarin dose (H) 98.8 2
Antibiotic therapy
2.1 Percentage of prescriptions for restricted antibiotics that are concordant with drug and therapeutics committee approved criteria (H) 46.8 1 (14%) 53 (29%) 145 (80%) 182
2.2 Percentage of patients in whom doses of empirical aminoglycoside therapy are continued beyond 48 hours (L) 0.0 -
2.3 Percentage of patients presenting with community acquired pneumonia that are prescribed guideline concordant antibiotic therapy (H) 57.1 12 (67%) 18
Medication ordering
3.1 Percentage of patients whose current medications are documented and reconciled at admission (H) 61.5 Private 7 (12%) 8,900 (26%) 28,876 (85%) 33,964
3.2 Percentage of patients whose known adverse drug reactions are documented on the current medication chart (H) 96.1 24 (29%) 1,034 (63%) 1,277 (77%) 1,649
3.3 Percentage of medication orders that include errorprone abbreviations (L) 5.4 Metropolitan 7 (44%) 743 (40%) 1,419 (76%) 1,870
3.4 Percentage of patients receiving cytotoxic chemotherapy whose treatment is guided by a hospital approved chemotherapy treatment protocol (H) 99.4 3
# Number of undesirable or non-compliant events + % of events accounted for by outlier/centile gains * % of HCOs that are outliers
82 AUSTRALASIAN CLINICAL INDICATOR REPORT 2012 - 2019
Table of Indicator Results continued
Indicator
Pain management
MEDICATION SAFETY
Aggregate rate % Best Stratum Outlier HCOS (%)*
Outlier Gains (%)+
Centile Gains (%)+ Events# Trend
4.1 Percentage of postoperative patients that are given a written pain management plan at discharge AND a copy is communicated to the primary care clinician (H) No data in in 2019 Continuity of care
5.1 Percentage of discharge summaries that include medication therapy changes and explanations for changes (H) 77.3 1 (8%) 13 (5%) 182 (75%) 244
5.2 Percentage of patients discharged on warfarin that receive written information regarding warfarin management prior to discharge (H) 77.3 1 (13%) 19 (36%) 48 (91%) 53
5.3 Percentage of patients with a new adverse drug reaction (ADR) that are given written ADR information at discharge AND a copy is communicated to the primary care clinicia (H) 89.1 1 (20%) 9 (90%) 10 (100%) 10
5.4 Percentage of patients receiving sedatives at discharge that were not taking them at admission (L) 5.3 1 (25%) 3 (38%) 5 (63%) 8
5.5 Percentage of patients whose discharge summaries contain a current, accurate and comprehensive list of medicines (H) 95.0 NSW 13 (65%) 336 (69%) 190 (39%) 489
5.6 Percentage of patients who receive a current, accurate and comprehensive medication list at the time of hospital discharge (H) 51.5 NSW 1 (4%) 4,574 (11%) 39,355 (95%) 41,474
Hospital wide policies
6.1 Percentage of patients that are reviewed by a clinical pharmacist within one day of admission (H) 54.9 1 (9%) 114 (2%) 4,302 (64%) 6,689
6.2 Adverse drug reactions reported to TGA (N) 0.08
6.3 Medication errors - adverse event requiring intervention (L) 0.01 15 (6%) 380 (55%) 629 (91%) 693
# Number of undesirable or non-compliant events + % of events accounted for by outlier/centile gains * % of HCOs that are outliers
83
GENERAL COMMENTS
Dr William John Kingswell
Royal Australian and New Zealand College of Psychiatrists Deputy Chair Committee for Education, RANZCP Chair, ACHS Mental Health Working Party Version 8
This year’s publication of the 2012-2019 Australasian Clinical Indicator Report is the result of the strenuous efforts of those HCOs who collect and contribute data (96 in 2019 up from 93 the previous year) and the ACHS staff and volunteers who create the valuable information presented in this comprehensive report. However, to realise the value of this investment HCOs must reflect on the information provided and drive improvement1

There are nine groups of indicators that can be further grouped into four broad areas: those that attempt to measure consumer/ carer engagement (diagnosis and care planning, continuity of care, community care), those that measure treatment interventions (physical examination, prescribing and ECT), those that measure restrictive practice (seclusion and restraint, mental health act status) and those that measure critical incidents.
Engagement with consumers as measured by the proportion of consumers with an individual care plan that they have signed is consistently high. However, engagement with their nominated carers is disappointingly low with less than one in three carers signing an individual care plan and in the outlier HCO less than one in ten.
This year's report has, for the first time, split the polypharmacy indicators out into four categories, antidepressants, mood stabilisers, anxiolytics (inclusive of all drugs that might be captured as sedatives, hypnotics or anxiolytics) and antipsychotics. With the exception of antipsychotic polypharmacy which showed
REFERENCES
1.
84 AUSTRALASIAN CLINICAL INDICATOR REPORT 2012 - 2019
Philip Burgess, Jane Pirkis & Tim Coombs (2015) Routine outcome measurement in Australia, International Review of Psychiatry, 27:4, 264-275
MENTAL HEALTH


85
SUMMARY OF RESULTS
In 2018 there were 1,591 submissions from 93 HCOs for 27 CIs. Three were analysed for trend, 1 of which improved and 2 deteriorated. In 2018, significant stratum differences were observed in 5 CIs. Eighteen CIs showed greater systematic
Table of Indicator Results Results
Indicator
Diagnosis and care planning
variation, with centile gains in excess of 50% of all events. Outlier gains in excess of 25% were observed in 16 CIs. See Summary of Indicator Results below.
Aggregate rate % Best Stratum Outlier HCOS (%)*
Outlier Gains (%)+
Centile Gains (%)+ Events# Trend
1.1 Individual care plan (H) 86.0 15 (22%) 3,787 (34%) 10,526 (95%) 11,077
1.2 Individual care plan signed by consumer (H) 74.6 17 (36%) 2,528 (30%) 6,233 (73%) 8,556
1.3 Individual care plan signed by carer (H) 30.7 12 (38%) 1,387 (17%) 5,122 (61%) 8,367
Physical examination of patients
2.1 Physical examination documented within 24 hours of admission (H) 79.2 NSW 10 (18%) 3,033 (40%) 7,002 (92%) 7,592
Prescribing patterns
3.1 Discharged on 2 or more psychotropic medications from sub-group I (Antidepressants) (L) 30.3 6 (25%) 430 (19%) 765 (34%) 2,263
3.2 Discharged on 2 or more psychotropic medications from sub-group II (Mood Stabilisers) (L) 10.5 4 (27%) 261 (43%) 407 (67%) 612
3.3 Discharged on 2 or more psychotropic medications from sub-group III (Sedatives, Hypnotics or Anxiolytics) (L) 22.5 NSW 4 (24%) 455 (32%) 1,062 (75%) 1,424
3.4 Percentage of patients who receive written and verbal information on regular psychotropic medicines initiated during their admission (including antipsychotics) (H) 84.1 7 (47%) 325 (55%) 530 (90%) 586
3.5 Discharged on 2 or more antipsychotic medications (L) 26.4 NSW 6 (18%) 697 (24%) 1,357 (47%) 2,898
3.6 Metabolic side effects for consumers commencing antipsychotic medications (H) 82.0 6 (43%) 227 (45%) 476 (93%) 510
3.7 Metabolic side effects for consumers taking regular antipsychotic medications (H) 84.2 4 (29%) 196 (33%) 523 (88%) 597
Electroconvulsive therapy
4.1 ECT treatments (L) 10.9 19 (58%) 635 (34%) 1,185 (64%) 1,842 # Number of undesirable or non-compliant events + % of events accounted for by outlier/centile gains *% of HCOs that are outliers

86 AUSTRALASIAN CLINICAL INDICATOR REPORT 2012 - 2019
Table of Indicator Results continued Indicator
Use of seclusion and restraint

MENTAL HEALTH
Aggregate rate % Best Stratum Outlier HCOS (%)*
5.1 Average duration of seclusion episodes (Hours per episode) (L) 42.0^
Outlier Gains (%)+
Centile Gains (%)+ Events# Trend
5.2 Rate of seclusion (Seclusion episodes per 1,000 bed days) (L) 4.8@ 437 (36%) 943 (78%) 1,210
5.3 Percent of persons secluded (L) 3.9 7 (39%) 144 (34%) 241 (56%) 429
5.4 Physical restraint - 1 or more episodes (L) 4.8 7 (32%) 166 (28%) 330 (56%) 592
5.5 Rate of physical restraint (per 1,000 bed days) (L) 3.6@ 4 (40%) 134 (54%) 207 (83%) 249
5.6 Mechanical restraint - 1 or more episodes (L) 0.33 1 (6%) 16 (43%) 31 (84%) 37
5.7 Rate of mechanical restraint (per 1,000 bed days) (L) 3.5@ 1 (50%) 2
Major critical incidents
6.1 Percent of consumers who die by suicide (L) 0.013@ 12 6.2 Rate of suicide (per 1,000 bed days) (L) 0.002@ 1
6.3 Consumers who assault (per 1,000 bed days) (L) 0.59@ Private 6 (14%) 126 (68%) 181 (97%) 186
6.4 Consumers assaulted (per 1,000 bed days) (L) 0.27@ Private 5 (13%) 55 (69%) 76 (95%) 80
6.5 Sexual assault (per 1,000 bed days) (L) 0.017@ 5
6.6 Significant self-harm (per 1,000 bed days) (L) 0.21@ 5 (8%) 25 (29%) 62 (73%) 85
Mental Health Act status
7.1 Involuntary admission status (N) 16.8 7.2 Consumers detained as involuntary patients (per 1,000 bed days) (L) No data submitted in 2019
Continuity of care
8.1 Discharge summary / letter provided to consumer or nominated carer (H) 78.5 13 (28%) 3,096 (41%) 6,343 (84%) 7,541
8.2 Discharge summary / letter provided to service providing ongoing care (H) 74.4 15 (35%) 2,930 (37%) 6,330 (81%) 7,849
8.3 Three-monthly multidisciplinary review (H) 89.0 1 (11%) 47 (54%) 80 (92%) 87
Community care
9.1 Consumers seen face-to-face by community service (N) 88.2
# Number of undesirable or non-compliant events + % of events accounted for by outlier/centile gains *% of HCOs that are outliers ^ Hours per episode @ per 1,000 bed days (L)
87
GENERAL COMMENTS
A/Prof R.C. Andrew Symons Royal Australian and New Zealand College of Ophthalmologists
This year the clinical indicators are very pleasing with continuation of downward trends for unplanned overnight admissions and readmissions after cataract surgery, anterior vitrectomy as part of cataract surgery and readmission after retinal detachment surgery. It is noted that there is wide variation between institutions for both unplanned admission after cataract surgery and anterior vitrectomy as part of cataract surgery, and institutions could use both as internal quality metrics.
Pleasingly there were very few cases of both toxic anterior segment syndrome and admissions for endophthalmitis after cataract surgery. Very few patients required unplanned readmission after glaucoma surgery.
It is interesting that the rate of unplanned re-operation after retinal detachment surgery remains stable, and this is related to a lack of major technical advances in surgical management of retinal detachment. It is interesting that the median rate of reoperation is overall higher in NSW than in the rest of the country, and the mechanisms of data collection in centres across the country should be examined.
REFERENCES
1. Australian Commission on Safety and Quality in Health Care. Cataract Clinical Care Standard Consultation Draft. Sydney: ACSQHC; 2019
2. Lipsky L, Barret G, Intracameral antibiotics for prophylaxis of postoperative endophthalmitis in Australia: a review, Clinical and Experimental Ophthalmology, 2019;47:537–541Ferris JD, Donachie PH, Johnston RL, et al. Royal College of Ophthalmologists' National Ophthalmology Database study of cataract surgery: report 6. The Impact of EyeSi Virtual Reality Training on Complications Rates of Cataract Surgery Performed by First and Second Year Trainees. British Journal of Ophthalmology. 2019 May 29; doi: 10.1136/bjophthalmol-2018-313817.

88 AUSTRALASIAN CLINICAL INDICATOR REPORT 2012 - 2019
OPHTHALMOLOGY


89
SUMMARY OF RESULTS
In 2019 there were 697 submissions from 58 HCOs for 17 CIs. Eight were analysed for trend, 5 of which improved, 2 deteriorated and the remainder showed no evidence of trend. In 2019, significant stratum variation was observed
Table of Indicator Results
Indicator
Cataract surgery
in 5 CIs. Ten CIs showed greater systematic variation, with centile gains in excess of 50% of all events. Outlier gains in excess of 25% of all events were observed in 3 CIs. See Table of Indicator Results below.
Aggregate rate % Best Stratum Outlier HCOS (%)*
Outlier Gains (%)+
Centile Gains (%)+ Events# Trend
1.1 Cataract surgery - unplanned readmissions within 28 days (L) 0.11 2 (4%) 14 (26%) 32 (59%) 54
1.2 Cataract surgery - treatment within 28 days due to endophthalmitis (L) 0.008 4
1.3 Cataract surgery - unplanned overnight admission (L) 0.098 3 (7%) 15 (31%) 40 (83%) 48
1.4 Cataract surgery - anterior vitrectomy (L) 0.38 Private 5 (10%) 42 (20%) 117 (55%) 211
1.5 Cataract surgery - antibiotic prophylaxis (H) 93.8 4 (15%) 1,520 (75%) 2,034 (100%) 2,036
1.6 Cataract surgery - toxic anterior segment syndrome (TASS) (L) 0.007 2
1.7 Cataract surgery - planned second eye cataract surgery (L) 0.12 1 (14%) 7 (78%) 8 (89%) 9
Intraocular glaucoma surgery

2.1 Intraocular glaucoma surgery - unplanned readmissions within 28 days (L) 0.95 NSW 1 (5%) 9 (50%) 16 (89%) 18
2.2 Intraocular glaucoma surgery - micro-invasive glaucoma surgery (MIGS) (H) 78.2 2 (13%) 81 (25%) 208 (65%) 321
2.3 Intraocular glaucoma surgery - treatment within 28 days due to endophthalmitis (L) 0 -
2.4 Intraocular glaucoma surgery - more than one overnight stay (L) 0 -
# Number of undesirable or non-compliant events + % of events accounted for by outlier/centile gains * % of HCOs that are outliers
90 AUSTRALASIAN CLINICAL INDICATOR REPORT 2012 - 2019
Table of Indicator Results continued
Indicator
Retinal detachment surgery
Aggregate rate % Best Stratum Outlier HCOS (%)*
Outlier Gains (%)+
Centile Gains (%)+ Events# Trend
3.1 Retinal detachment surgery - readmissions within 28 days (L) 3.11 1 (8%) 9 (16%) 58
3.2 Retinal detachment surgery - treatment within 28 days due to endophthalmitis (L) 0.037 1
3.3 Retinal detachment surgery - more than one overnight stay (L) 0 -
3.4 Retinal detachment surgery - unplanned reoperation within 28 days (L) 2.5 2 (14%) 13 (27%) 49
Toric intraocular lens implantation

4.1 Intraocular lens implantation with planning record present at time of surgery (H) 99.7 Metropolitan 1 (4%) 95 (97%) 98 (100%) 98
4.2 Toric intraocular lens implantation with planning record present at time of surgery (H) 99.9 1 (5%) 7 (88%) 8 (100%) 8 # Number of undesirable or non-compliant events + % of events accounted for by outlier/centile gains * % of HCOs that are outliers
OPHTHALMOLOGY
91
GENERAL COMMENTS
Dr Hugo Sachs
Past President, Australian Dental Association
Chair, ACHS Oral Health Working Party Version 4
In general, there are no significant variations of concern. There have been some improvements in outcomes for various indicators and some declines. It is impossible to pin point the causatives for both scenarios using this analysis. I note that there is reference to the 11th edition of the Australian Dental Schedule which has been superseded by the 12th edition (introduced in April 2017) and is currently being reviewed for the 13th edition. Cognisance of these changes should be taken into account for future reviews.
Minimum intervention dentistry (MID), particularly the use of concentrated remineralisation and/or cariostatic agents, application – single tooth (Item 123) has been recognised in the latest review (4th) of the Dental Benefits Act. This item

REFERENCES
1. Australian Dental Schedule and Glossary 2017
2. 4th Review Dental Benefits Act 2020
92 AUSTRALASIAN CLINICAL INDICATOR REPORT 2012 - 2019


93
ORAL HEALTH

94 AUSTRALASIAN CLINICAL INDICATOR REPORT 2012 - 2019
SUMMARY OF RESULTS
In 2019 there were 969 submissions from 85 HCOs for 9 CIs. Five were analysed for trend, 4 of which improved and 1 deteriorated. In 2019, significant stratum variation was observed in 2 CIs. One CI showed greater systematic variation,
Table of Indicator Results
with centile gains in excess of 50% of all events. Outlier gains in excess of 25% of all events were observed in 0 CIs. See Table of Indicator Results below.
Indicator Aggregate rate % Best Stratum Outlier HCOS (%)*
Unplanned returns to the dental centre
Outlier Gains (%)+
Centile Gains (%)+ Events# Trend
1.1 Restorative treatment - teeth retreated within 6 months (L) 6.6 11 (17%) 1,794 (8%) 7,516 (34%) 21,856
1.2 Routine extraction - complications within 7 days (L) 1.3 8 (13%) 142 (11%) 614 (48%) 1,290
1.3 Surgical extraction - complications within 7 days (L) 2.6 6 (15%) 44 (16%) 99 (36%) 274
1.4 Denture remade within 12 months (L) 2.4 4 (10%) 95 (14%) 402 (60%) 674
Endodontic treatment

2.1 Endodontic treatment - same tooth within 6 months of initial treatment (H) 69.6 Qld 3 (6%) 483 (23%) 869 (41%) 2,104
2.2 Endodontic treatment - teeth extracted within 12 months (L) 2.9 23 (12%) 197
Children’s dental care
3.1 Restorative treatment (children) - teeth retreated within 6 months (L) 2.1 6 (8%) 472 (10%) 1,616 (33%) 4,860
3.2 Pulpotomy (children) - deciduous teeth extracted within 6 months (L) 2.7 1 (2%) 3 (2%) 27 (21%) 129
3.3 Fissure sealant treatment (children) - retreatment within 24 months (L) 2.4 18 (25%) 697 (7%) 1,674 (18%) 9,379
Radiographs
4.1 Bite-wing radiographs that meet the specified criteria (H) No data since 2015 # Number of undesirable or non-compliant events + % of events accounted for by outlier/centile gains * % of HCOs that are outliers
ORAL HEALTH
95
GENERAL COMMENTS
Dr Sharon Anne McAuley
Paediatric and Child Health Division, Royal Australasian College of Physicians Paediatric Medical Lead, Patient Safety & Quality Service, Clinical Excellence Queensland Member, ACHS Paediatrics Working Party Version 5
The recent revisions resulting in Version 5.1 are very welcome: the Clinical Indicator (CI) set is clinically more relevant, generating some useful comparative data. Shifting the focus from paediatric asthma presenting through Emergency Departments to capturing the number of asthma action plans completed provides cleaner quality data, avoiding potential blurring of diagnoses such as pre-school wheeze/viral-induced wheeze. This would improve the ability for organisations to compare their surrogate markers of good asthma care.
It is disappointing that less HCOs are contributing to the eight-year data set, with an attrition rate of more than half of the HCOs. However, fortunately the total number of patients represented by the data has decreased negligibly. It would be interesting to understand the reasons behind this and whether the hypothesis that larger HCOs are finding the data more useful is true and what the risks might be associated with this for the smaller organisations.
CI 1.1 Registered nurses with paediatric basic life support (BLS) qualifications
In 2019, twenty five HCOs provided data to show that of 4,629 registered nurses in Australasia, 83.5% had paediatric BLS qualifications. The fitted rate deteriorated from 94.1 in 2014 to 82.4 in 2019, a change of 11.7 per 100 registered nurses having the essential qualifications. This downward trend provides useful data to highlight the importance of mandatory staff BLS training and the need to identify nurses who may need further support and education in BLS. Clarification regarding what constitutes BLS qualifications and whether the organisation must report on numbers of nurses trained in BLS or indeed whether they hold up-to-date BLS qualifications 1,2. It is also worth noting that having been trained in BLS does not necessarily equate
to competency in BLS provision. Therefore, data on whether the nurses have demonstrated that they are competent in BLS would be an excellent clinical indicator to help inform quality improvement initiatives. During this COVID-19 pandemic, National Safety and Quality Health Service Standard 8 (Recognising and Responding to Acute Deterioration) remains just as important for all organisations of such training allowing for social distancing and safe skills acquisition need to be overcome by HCOs to ensure safe, high quality care is provided.
CI 3.1 Completed asthma action plan-paediatrics
In 2014, only three HCOs contributed data on whether patients had been provided with a completed asthma action plan This rate of contribution has been consistent over the eightyear period (except for 2014, when 4 HCOs submitted data). Such low denominators inhibit the ability for organisations to benchmark their performance. It is not clear from the report what the definition is regarding a completed plan. Does that mean a plan was filled in on paper? Electronically? Given to the patient/parent/carer? A plan may have been completed, but does that mean the family understood it let alone left with the plan? If the parents say they already have one, is another one issued? Finding a robust clinical indicator set is challenging and ideally the least cumbersome, least time-consuming method of collecting the data for the HCO e.g. electronically is preferable.
Such plans have traditionally been deemed key to providing exemplary care for patients with asthma studies, however, have shown that a formal written asthma action plan does not lead to better outcomes and may even lead to worse outcomes

96 AUSTRALASIAN CLINICAL INDICATOR REPORT 2012 - 2019


97
PAEDIATRICS
The actual terminology is fraught with challenges also. Asthma, as a diagnosis can be interpreted differently in different centres, by different clinicians with no clear consensus regarding age of onset9. Most asthma action plans generated are for pre-school wheezers and the term ‘asthma’ may not be used until the child is older and the clinical course/phenotype has become manifest.
Interestingly, data from the Australian Bureau of Statistics (ABS) 2017-2018 National Health Survey showed that an estimated 839,000 (31%) of people with asthma across all ages had a written asthma action plan. Children aged between 0-14 with asthma were significantly more likely to have an asthma action plan (67%) 10. These plans could have been provided by any healthcare worker including a General Practitioner.
In the ACIR 2012-2019, three out of 144 HCOs in 2014 provided data on this set with 217/247 patients receiving a plan, giving a rate of 87.9%. In 2019, 123 out of 127 (96.9%) patients had a plan. We are unable to conclude that hospitals provide asthma action plans to nearly every child on discharge as the dataset is too small. Variation in clinical practice can be a poor quality indicator. However, there was relatively little variation between HCOs, with no outliers found and so potential gains in quality were small in 2019. This information could help organisations when choosing where to focus their efforts in the quality improvement sphere.
REFERENCES
1. All staff should undergo regular resuscitation education to a level appropriate for their clinical responsibilities (Australian Resuscitation Council Guideline 10.1; Australian Commission on Safety and Quality in Healthcare, 2012)
2. https://www.safetyandquality.gov.au/standards/nsqhs-standards/recognising-and-responding-acute-deterioration-standard
3. https://www.safetyandquality.gov.au/standards/national-safety-and-quality-health-service-nsqhs-standards/implementation-nsqhs-standards/ nsqhs-standards-updates-and-consultations#faq:-covid-19-pandemic-and-accreditation
4. NACA (National Asthma Council Australia) 2019. Australian Asthma Handbook, Version 2.0 Melbourne: National Asthma Council Australia
5. Gibson PG, Powell H. Written action plans for asthma: an evidence-based review of the key components. Thorax 2004; 59: 94–99.
6. Global Initiative for Asthma. Global strategy for asthma management and prevention. www.ginasthma.org 2015
7. Kelso JM. Do Written Asthma Action Plans Improve Outcomes?. Pediatr Allergy Immunol Pulmonol. 2016;29(1):2-5. doi:10.1089/ped.2016.0634
8. Sheares BJ, Mellins RB, Dimango E, Serebrisky D, Zhang Y, Bye MR, et al. . Do patients of subspecialist physicians benefit from written asthma action plans? Am J Respir Crit Care Med 2015; 191:1374–1383
9. https://www.who.int/respiratory/asthma/definition/en/
10.Australian Bureau of statistics (ABS) 2017-2018 National Health Survey https://www.aihw.gov.au/reports/chronic-respiratory-conditions/asthmamonitoring-based-on-current-indicators/contents/indicators/indicator-7-asthma-action-plans

98 AUSTRALASIAN CLINICAL INDICATOR REPORT 2012 - 2019
PAEDIATRICS
GENERAL COMMENTS
Ms Sandra Miles
Senior Lecturer, Australian Catholic University Australian College of Children and Young People’s Nurses
The clinical indicators comprise an important set of indicators of the state of paediatric hospital care. Please see my comments about some specific indicators.

1.1 Registered nurses with paediatric basic life support qualifications (H)
This is a very important requirement for paediatric care. It is pleasing to see an increase in numbers, however an annual rate of 83.5 per 100 registered nurses is disappointing given that this is usually a yearly mandatory qualification.
On another note, however, BLS is not usually effective. It is often too late when a child required BLS. Better monitoring and early intervention prevent the need for BLS. We propose it would be ideal to add a further/better indicator - to include the number of registered nurses who have undertaken training/qualification in a course related to recognising deterioration in a paediatric patient. Children can physiologically compensate for many adverse conditions until a crisis point and sudden deterioration is reached. Many hospitals have implemented the use of early warning system tools (e.g. modified early warning system [MEWS] or paediatric early warning score [PEWS]) to assist staff to recognise the subtle signs of deterioration, signalling when a patient should be reviewed and changes to care implemented. For example, please see the overview in the work by Chapman et al (2019)1
1.2 Medical practitioners with paediatric basic life support qualifications (H)
It is curious that 100% of medical practitioners have completed BLS qualifications compared to 83.5% of registered nurses. The difference in the rates of BLS training between medical and nursing staff warrants investigation. It would be beneficial for all RN staff to complete BLS qualifications, including regular refresher training.
3.5 Medical discharge summary completed - paediatrics (H)
The annual rate of 61.4 per 100 separations is fairly low when one considers how important this summary is for ongoing focused care for that child. A discharge summary can be commenced on admission to hospital with additions made during the hospitalisation, so that an additional overall summary statement is required on discharge. This helps inform GPs and other health care professionals of important ongoing considerations for care, so its importance should be emphasised across HCO.
REFERENCES
1. Chapman SM, Maconochie IK. Early warning scores in paediatrics: an overview. Arch Dis Child 2019;104:395–399.
99
SUMMARY OF RESULTS
In 2019 there were 170 submissions from 39 HCOs for 14 CIs. Four were analysed for trend, 3 of which improved and 1 deteriorated. In 2019, significant stratum variation was observed in 4 CIs. Ten CIs showed greater systematic variation,
with centile gains in excess of 50% of all events. Outlier gains in excess of 25% of all events were observed in 9 CIs. See Table of Indicator Results below.
Table of Indicator Results Indicator Aggregate rate % Best Stratum Outlier HCOS (%)*
Appropriateness
Outlier Gains (%)+
Centile Gains (%)+ Events# Trend
1.1 Registered nurses with paediatric basic life support qualifications (H) 83.5 NSW 4 (16%) 320 (42%) 686 (90%) 765
1.2 Medical practitioners with paediatric basic life support qualifications (H) 100.0 -
1.3 Paediatric patients admitted to a paediatric ward/area (H) 95.1 3 (25%) 510 (44%) 1,168 (100%) 1,169
Adverse events
2.1 Medication errors (L) 0.3 Private 4 (13%) 74 (57%) 125 (96%) 130
2.2 Adverse events when not in a paediatric ward/ area (L) 1.3 1 (20%) 23 (70%) 32 (97%) 33
2.3 Adverse events in a paediatric ward/area (L) 0.9 Private 2 (9%) 145 (55%) 259 (98%) 264
Documentation
3.1 Completed asthma action plan - paediatrics (H) 96.9 3 (75%) 4
3.2 Paediatric surgery post-procedural report (H) 100.03.3 Physical assessment completed by medical practitioner and documented (H) 100.0 -
3.4 Physical assessment completed by registered nurse and documented (H) 100.0 -
3.5 Medical discharge summary completedpaediatrics (H) 61.4 1 (25%) 386 (45%) 767 (88%) 867 # Number of undesirable or non-compliant events + % of events accounted for by outlier/centile gains * % of HCOs that are outliers
100 AUSTRALASIAN CLINICAL INDICATOR REPORT 2012 - 2019
Table of Indicator Results continued
Indicator
Paediatric anaesthesia
PAEDIATRICS
Aggregate rate % Best Stratum Outlier HCOS (%)*
Outlier Gains (%)+
Centile Gains (%)+ Events# Trend
4.1 Paediatric patients who fast 6 hours prior to anaesthesia (H) 69.1 2 (67%) 51 (44%) 115 (99%) 116
4.2 Adverse event due to non-adherence to paediatric fasting guidelines (L) 0.0 -
4.3 Parent/guardian present at induction of anaesthesia (N) 100.0 # Number of undesirable or non-compliant events + % of events accounted for by outlier/centile gains * % of HCOs that are outliers
101
GENERAL COMMENTS
Dr Daman Langguth
Chair, Board of Professional Practice and Quality, Royal College of Pathologists of Australia ACHS Chair, Working Party for Pathology Version 5
The Royal College of Pathologists of Australasia (RCPA) has been pleased to work with The Australian Council on Healthcare Standards (ACHS) in enabling assessment of the performance of pathology services in Australian healthcare.

Chemical Pathology
There has been a significant fall in the numbers of samples being reported out from the lab within the specified time for both potassium and troponin while the sample to lab time has remained stable. The number of labs that report in the program has reduced. This result is disappointing and reporting entities should examine the reason for the above decline.
Haematology
There has been a decline in the measures of in lab performance with no change in the time taken for the sample to reach the laboratory. There is wide variation from reporting entities. This should be examined by HCOs with large numbers of samples that neither meet the standard nor have the processes for performance improvement. The number of blood group samples required to be recollected also increased. This will need to be addressed.
102 AUSTRALASIAN CLINICAL INDICATOR REPORT 2012 - 2019
PATHOLOGY


103
SUMMARY OF RESULTS
In 2019 there were 393 submissions from 25 HCOs for 16 CIs. Sixteen CIs were analysed for trend, of which 6 improved, 8 deteriorated, and the remainder showed no evidence of trend. In 2019, significant stratum variation was observed in 2 CIs.
Table of Indicator Results
Indicator
Chemical pathology

Ten CIs showed greater systematic variation, with centile gains in excess of 50% of all events. Outlier gains in excess of 25% of all events were observed in 8 CIs. See Table of Indicator Results below.
Aggregate rate % Best Stratum Outlier HCOS (%)*
Outlier Gains (%)+
Centile Gains (%)+ Events# Trend
1.1 Serum / plasma potassium for ED - in lab to validated time less than 40 minutes (H) 49.2 NSW 8 (38%) 7,198 (17%) 18,654 (45%) 41,914
1.2 Serum / plasma potassium from ED - collected to in lab time less than 60 minutes (H) 87.3 9 (43%) 6,057 (58%) 9,211 (88%) 10,467
1.3 Serum / plasma troponin for ED - in lab to validated time less than 50 minutes (H) 64.0 6 (30%) 1,805 (16%) 4,962 (43%) 11,579
1.4 Serum / plasma troponin from ED - collected to in lab time less than 60 minutes (H) 83.4 8 (42%) 2,058 (41%) 4,225 (84%) 5,045
Haematology
2.1 Haemoglobin for ED - in lab to validated time less than 40 minutes (H) 90.9 Metropolitan 9 (43%) 1,827 (24%) 4,078 (54%) 7,563
2.2 Haemoglobin from ED - collected to in lab time less than 60 minutes (H) 88.9 8 (38%) 5,501 (54%) 9,022 (88%) 10,204
2.3 Blood group for ED - in lab to validated time less than 60 minutes (H) 47.6 4 (31%) 468 (17%) 1,222 (44%) 2,785
2.4 Blood group from ED - collected to in lab time less than 60 minutes (H) 86.8 4 (29%) 515 (53%) 848 (88%) 967
2.5 Blood group from ED - recollections (L) 7.6 1 (8%) 75 (19%) 156 (39%) 396 # Number of undesirable or non-compliant events + % of events accounted for by outlier/centile gains * % of HCOs that are outliers
104 AUSTRALASIAN CLINICAL INDICATOR REPORT 2012 - 2019
PATHOLOGY
Table of Indicator Results continued
Indicator Aggregate rate % Best Stratum Outlier HCOS (%)*
Anatomical pathology
Outlier Gains (%)+
Centile Gains (%)+ Events# Trend
3.1 AP complexity level 4 MBS item - received to validated time less than 96 hours (H) 79.6 7 (58%) 811 (20%) 3,674 (88%) 4,152
3.2 AP complexity level 6 & 7 MBS item - received to validated time less than 7 days within a calendar month (H) 78.7 2 (18%) 28 (11%) 104 (41%) 251
3.3 Structured reporting for Anatomical Pathology (H) 97.8 1 (17%) 3 (50%) 5 (83%) 6
Microbiology
4.1 Urine microscopy for ED - in lab to validated time less than 4 hours (H) 90.9 4 (44%) 358 (49%) 580 (80%) 729
4.2 Urine microscopy from ED - collection to in lab time less than 60 minutes (H) 60.3 4 (40%) 1,401 (43%) 2,869 (89%) 3,241
4.3 HIV antigen-antibody screening - in lab to validated time less than 24 hours (H) 78.9 1 (10%) 91 (14%) 166 (25%) 669
Whole of service
5.1 Point of care testing register (N) 83.3
5.2 Misidentified episodes (L) 0.46 4 (27%) 1,058 (34%) 1,716 (55%) 3,122 # Number of undesirable or non-compliant events + % of events accounted for by outlier/centile gains * % of HCOs that are outliers

105
GENERAL COMMENTS
A/Prof Jeremy Millar
Royal Australian and New Zealand College of Radiologists
Chair, Quality Improvement Committee, Faculty of Radiation Oncology, Royal Australian and New Zealand College of Radiologists Chair, ACHS Radiation Oncology Working Party Version 5
The quality indicators reported in this year's Australasian Clinical Indicator Report are positive and reflect well on the participating radiation oncology units. Reported multidisciplinary meeting discussion is higher this year than last year. Overall, almost half of patients are discussed in MDMs (compared with just over 40% last year). Waiting times have improved over the last eight years, albeit probably stabilising over the last few years. There are high rates of appropriate tumour staging. Rates of peerreview of plans have increased over the two years we have data. Rates of hypofractionation for bone metastases are increasing. Motion management is increasingly commonly employed during treatment delivery, and, as suggested by multiple randomised controlled trials, long-term androgen deprivation is increasingly used as an adjunct to radical radiation therapy for localised highrisk prostate cancer.
One clinical indicator in which there nominally seems to have been a deterioration is in treatment prolongation. This is a new indicator, developed for the fifth version of the Radiation Oncology clinical indicator sets. In 2018, 11.2% of patients having radical radiation therapy for a Royal College of Radiologists “category 1” cancer had more than two days prolongation in their prescribed treatment. In 2019, this was 12.8%. This difference is too small to conclude that the proportion of category treatment prolongations is actually worsening (Pearson Chi-square statistic 0.56, p=0.455).
The last two years of data allow us to review the utility of the new clinical indicators in version 5, introduced for use for the

106 AUSTRALASIAN CLINICAL INDICATOR REPORT 2012 - 2019
RADIATION ONCOLOGY


107
GENERAL COMMENTS
Ms Rachel Kearvell
Professional Standards Committee, Australian Society of Medical Imaging and Radiation Therapy Member, ACHS Radiation Oncology Working Party Version 5
The Australian Institute of Health and Welfare collate data annually on waiting times from almost all radiation therapy providers in Australia. Intention of treatment is defined in this national minimum dataset as either prophylactic, curative or palliative1. Clinical indicators that align with this nomenclature may be more appropriate as "radical" is an old-fashioned term that nowadays more commonly describes the complexity of a treatment plan as opposed to the intent.
Treatment plan peer review had a low number of HCOs provide data for this clinical indicator (CI). Anecdotally this may be due to the difficulty in retrieving this data from the HCOs' patient information system. If discussion at peer review is not documented in the patient information system in such a way as to enable easy extraction via a query of the database, HCOs may choose to not respond to this CI as to do so is too time consuming.
The 2015 consensus guidelines developed by the ANZ Faculty of Radiation Oncology Lung Interest Cooperative (FROLIC) include the use of 4DCT as the preferred method of motion management for non-small cell lung cancer 2. A 2016 survey of radiation therapy centres in Australia reported that 97% of respondents used PET images to assist with motion management in treatment planning3
Since then, there have been a myriad of papers published extolling the virtue of 4DCT to delineate lung tumour volumes for radiation therapy planning. As a result, the prevalence of 4DCT is becoming increasingly more common among radiation oncology sites across Australia. Mandated use of motion management techniques in clinical trials particularly for stereotactic lung (CHISEL, SAFRON), may have also helped increase the uptake and installation of CT scanners with this functionality. It is therefore pleasing to see that the rate for CI 3.2 Motion management has increased accordingly.
REFERENCES
1. meteor.aihw.gov.au/content/index.phtml/itemId/583857
2. Dwyer, P et al. Australia and New Zealand Faculty of Radiation Oncology Lung Interest Cooperative: 2015 consensus guidelines for the use of advanced technologies in the radiation therapy treatment of locally advanced non‐small cell lung cancer. Journal of Medical Imaging and Radiation Oncology 60(50 Oct 2016.
3. Batumalai, V et al. Survey of image guided radiation therapy use in Australia. Journal of Medical Imaging and Radiation Oncology 61(3) Nov 2016.

108 AUSTRALASIAN CLINICAL INDICATOR REPORT 2012 - 2019
RADIATION ONCOLOGY

SUMMARY OF RESULTS
In 2019 there were 80 submissions from 8 HCOs for 9 CIs. Two were analysed for trend, 1 of which improved, 1 deteriorated. In 2019, significant stratum variation was observed in none of the CIs. Five CIs showed systematic variation, with
Table of Indicator Results
Consultation process
centile gains in excess of 50% of all events. Outlier gains in excess of 25% of all events were observed in 3 CIs. See Table of Indicator Results below.
Indicator Aggregate rate % Best Stratum Outlier HCOS (%)*
Outlier Gains (%)+
Centile Gains (%)+ Events# Trend
1.1 Patients for radical treatment - waiting time from the 'ready for care' date more than the faculty guidelines (L) 9.4 3 (38%) 167 (25%) 262 (39%) 675
1.2 Patients for palliative treatment - waiting time from the ‘ready for care’ date more than the faculty guidelines (L) 11.6 4 (50%) 217 (38%) 329 (57%) 575
1.3 Multidisciplinary meeting involvement (H) 48.6 39 (12%) 323
Treatment process
2.1 Staging annotation for current radiotherapy course (H) 90.9 2 (33%) 87 (24%) 330 (91%) 364
2.2 Treatment prolongation (L) 12.8 1 (25%) 11 (19%) 36 (61%) 59
2.3 Treatment plan peer review (H) 39.5 22 (18%) 121
Treatment delivery
3.1 Single fractionation for bone metastases (H) 43.7 40 (33%) 120
3.2 Motion management (H) 83.7 1 (17%) 9 (26%) 32 (94%) 34
3.3 Androgen deprivation therapy (H) 81.7 1 (17%) 10 (36%) 18 (64%) 28 # Number of undesirable or non-compliant events + % of events accounted for by outlier/centile gains * % of HCOs that are outliers
109
GENERAL COMMENTS
In 2019 there were twenty three HCOs submitting data on the Radiology Clinical Indicators. There were no events in either interventional radiology or diagnostic radiology which were of the highest severity assessment code of SAC1. Although some events were reported as SAC2 (a lower risk event), the number of adverse events were low, reflecting high performance amongst the HCOs submitting data.
Extravasation during an intravenous contrast CT procedure is one of the risks when receiving contrast agents. The data from the submitting HCOs indicates that there is an increasing variability amongst the cohort, but the overall rate remains low. There is a large amount of case-mix risk with extravasation, so it is likely that these factors contribute to the variability within the set.
The number of organisations submitting data on image guided biopsy adverse events remains low and greater encouragement for HCOs to measure these incidents should be explored in future. It is vital to collect data on these imaging incidents as these should help to identify contributing and ameliorating factors that can reduce the likelihood of recurrence of such events in the future.
Computed Tomography (CT) dosimetry is used to measure the dose index of radiation output from CT scanners. This measurement of output is to ensure that patients are not receiving too much radiation during their imaging procedures. This radiation dose should be within the reference levels in the National Diagnostic Reference Levels (NDRLs).

110 AUSTRALASIAN CLINICAL INDICATOR REPORT 2012 - 2019
RADIOLOGY


111
SUMMARY OF RESULTS
In 2019 there were 291 submissions from 23 HCOs for 15 CIs. None were analysed for trend. In 2019, significant stratum variation was observed in 1 CI. Five CIs showed greater systematic variation, with centile
Table of Indicator Results
gains in excess of 50% of all events. Outlier gains in excess of 25% of all events were observed in 2 CIs. See Table of Indicator Results below.
Indicator Aggregate rate % Best Stratum Outlier HCOS (%)*
Adverse Patient Events
Outlier Gains (%)+
Centile Gains (%)+ Events# Trend
1.1 Number of Severity Assessment Code (SAC) 1 or Incident Severity Rating (ISR) 1 incidentsinterventional radiology examinations (L) 0 -
1.2 Number of Severity Assessment Code (SAC) 1 or Incident Severity Rating (ISR) 1 incidents - diagnostic radiology examinations (L) 0 -

1.3 Number of Severity Assessment Code (SAC) 2 or Incident Severity Rating (ISR) 2 incidentsinterventional radiology examinations (L) 0.021 2 (33%) 6
1.4 Number of Severity Assessment Code (SAC) 2 or Incident Severity Rating (ISR) 2 incidents - diagnostic radiology examinations (L) 0.001 1 (5%) 2 (11%) 10 (56%) 18
1.5 Contrast extravasation during an IV contrast enhanced CT procedure (L) 0.23 3 (17%) 35 (13%) 160 (58%) 276
1.6 Percutaneous trans pleural biopsy of lung or mediastinum requiring unexpected overnight admission (L) 3.53 9 (82%) 11
1.7 Image-guided percutaneous core biopsy of liver requiring unexpected overnight admission (L) 0 -
# Number of undesirable or non-compliant events + % of events accounted for by outlier/centile gains * % of HCOs that are outliers
112 AUSTRALASIAN CLINICAL INDICATOR REPORT 2012 - 2019
Table of Indicator Results continued
Indicator
CT Dosimetry
Aggregate rate % Best Stratum Outlier HCOS (%)*
Outlier Gains (%)+
Centile Gains (%)+ Events# Trend
2.1 CTDIvol for non-contrast CT head examinations (L) 1.7 Vic 7 (41%) 149 (60%) 141 (57%) 248
2.2 CTDIvol for portal venous phase of abdominal pelvic CT examinations (L) 8.8 3 (18%) 49 (31%) 138 (87%) 159
Patient identification and consent
3.1 Patient identification and consent (1) (H) 100
3.2 Patient identification and consent (2) (H) 100
3.3 Patient identification and consent (3) (H) 90.9
3.4 Patient identification and consent (4) (H) No data submitted in 2019
Critical test result notification
4.1 Critical test result notification (1) (H)

4.2 Critical test result notification (2) (H)
4.3 Critical test result notification (3) (H)
4.4 Critical test result notification (4) (H) No data submitted in 2019 # Number of undesirable or non-compliant events + % of events accounted for by outlier/centile gains * % of HCOs that are outliers
RADIOLOGY
113
GENERAL COMMENTS
Dr Jennifer Mann
President Elect Australasian Faculty of Rehabilitation Medicine
The Australasian Faculty of Rehabilitation Medicine and the Australasian Rehabilitation Outcomes Centre (AROC) are pleased to note the high rate of compliance with the ACHS Rehabilitation Medicine Clinical Indicators (CI). This high level of compliance is in keeping with previous years and is testament to not only the ongoing strong culture of continuous improvement within the Rehabilitation Medicine community but also a continuing commitment to provide best-practice, evidence based clinical care to our population of individuals. We acknowledge that this result is due to the continued significant effort of clinicians to maintain very high compliance in provision of detailed outcome data (including data items required to calculate the CIs) to AROC.

114 AUSTRALASIAN CLINICAL INDICATOR REPORT 2012 - 2019
REHABILITATION MEDICINE


115

116 AUSTRALASIAN CLINICAL INDICATOR REPORT 2012 - 2019
REHABILITATION MEDICINE
SUMMARY OF RESULTS
In 2019 there were 1,164 submissions from 124 HCOs for 6 CIs. Six were analysed for trend, 6 of which improved. In 2019, significant stratum variation was observed in 4 CIs. Six CIs showed greater systematic variation, with
Table of Indicator Results
centile gains in excess of 50% of all events. Outlier gains in excess of 25% of all events were observed in 6 CIs. See Table of Indicator Results below.
Indicator Aggregate rate % Best Stratum Outlier HCOS (%*)
Timely assessment of function on admission
Outlier Gains (%+)
Centile Gains (%+) Events# Trend
1.1 Functional assessment within 72 hours of admission (H) 98.4 18 (17%) 772 (68%) 1,096 (97%) 1,129
Assessment of function prior to episode end
2.1 Functional assessment within 72 hours before end of rehabilitation (H) 98.9 Private 15 (15%) 329 (48%) 643 (93%) 691
Timely establishment of a multidisciplinary team rehabilitation plan
3.1 Multidisciplinary team plan within 7 days (H) 98.4 23 (22%) 629 (61%) 991 (96%) 1,031
Multidisciplinary discharge documentation
4.1 Discharge plan on separation (H) 97.6 Private 16 (16%) 1,151 (77%) 1,481 (99%) 1,501
Functional gain achieved by rehabilitation program

5.1 Functional gain following completed rehabilitation program (H) 98.2 Private 29 (24%) 418 (33%) 891 (70%) 1,273
Discharge destination
6.1 Destination after discharge from a rehabilitation program (H) 94.7 Private 31 (33%) 1,021 (34%) 1,994 (67%) 2,974 # Number of undesirable or non-compliant events + % of events accounted for by outlier/centile gains * % of HCOs that are outliers
117

118 AUSTRALASIAN CLINICAL INDICATOR REPORT 2012 - 2019
ABOUT THE ACHS CLINICAL INDICATOR PROGRAM
The Australian Council on Healthcare Standards (ACHS) provides the world’s largest dedicated Clinical Indicator (CI) data collection and reporting service. The Clinical Indicator Program (CIP) examines data sourced from a broad range of clinical speciality areas. It includes CIs developed by specialist clinicians and as relevant to inpatient, outpatient, and community health facilities. The program is highly valued by participating healthcare organisations (HCOs) and is developed by Australian and New Zealand clinicians.
History
The ACHS CIP was established in 1989 through the initiative of Dr Brian Collopy, a surgeon and then Chairman of the ACHS Board, who still remains involved in the program today.
The rationale for introducing the program was to provide measures to support the clinical component of the ACHS accreditation standards and to increase the involvement of medical practitioners in quality improvement initiatives within HCOs. At the time of its introduction, medical staff were familiar with the use of measures to assess a patient’s health status; however, there were almost no tools to assess the performance of an HCO when delivering clinical care.
The first set of CIs, the Hospital-Wide Medical CIs, was introduced in 1993 and the program has continued to evolve since its inception nearly three decades ago. The program has expanded by working in collaboration with specialist colleges, societies, and associations, to include a wide range of speciality areas, totalling 21 CI sets by 2020. The CIP is now strongly supported by all clinician groups who make significant contributions to the development and application of the CIs.
Clinical Indicators and Healthcare Organisations
CIs are designed to indicate potential problems that may need addressing, rather than to provide definitive answers for HCOs. This is achieved by identifying variations within the data results. CIs are used to assess, compare and determine the potential to improve care within an organisation. They are, therefore, a tool to assist in assessing whether or not a standard of patient care is being met and can provide evidence for accreditation. HCOs select those CIs that are relevant to their organisation.


Clinical Indicators and Accreditation
Accreditation with ACHS has always had a focus on quality improvement. The CIP continues to be free for all HCOs that are accredited by ACHS. The program is one of a number of tools that facilitate the review and improvement of HCO performance. While the data are not a focus for accreditation, assessors are able to monitor the HCO’s response to an outlier measure or a deteriorating trend. HCOs and assessors are able to question what was investigated, what was learnt, what action had been, or would be, taken, and finally what was the outcome of those actions.
Supporting Clinical Indicator Program Customers
The Performance and Outcomes Service (POS) at ACHS provides email, telephone, webinar and workshop support to its members, including user access, CI collection assistance clarification on the User Manuals and generation of customised reports.
119


120 AUSTRALASIAN CLINICAL INDICATOR REPORT 2012 - 2019
ABOUT THE ACHS CLINICAL INDICATOR PROGRAM
Developed by Clinicians for Clinicians
Decisions are made on each CI set by a Working Party selected to provide broad representation. The ACHS Performance and Outcomes Service facilitate the process by providing secretariat support. When developing CIs, ACHS relies on practising clinicians from specialist areas in public and private HCOs. Members of CI Working Parties encompass relevant professions and include personnel from non-metropolitan centres and from a number of different states and territories. The Working Party Chair is selected by the lead college, society or association, which will also oversee and endorse the revised CI User Manual.
Assisting with data analysis and offering support and advice to the Working Parties is the HSRG at the University of Newcastle. Prof Robert Gibberd, who has consulted on the ACHS program for more than 17 years, is supported by Mr Stephen Hancock and a team that has made healthcare data its focus.
Comparisons of Performance
The focus when collecting CI data should always be to identify opportunities for improvement. All participating HCOs receive benchmarking reports that compare their performance to that of all other HCOs submitting data for the CI, and to HCOs from their peer group. Peer groupings are determined by the Working Party and the HCO is then able to select the most appropriate stratification for their organisation. Reports are prepared every six months following data submission. In addition, trend reports are developed annually for HCOs submitting regularly, which enable the HCOs to compare their own trended performance against that of the group overall.
By definition, 20% of all contributors of CI data must be in the poorer performing centile. If an HCO has rates in the poorest 20% of rates it is not necessarily an indicator of poor performance, especially when variation between HCO rates is relatively small. In the latter case centile gains will be relatively small. However, being in the poorer performing centile may indicate a greater opportunity for improvement.
As participation in the ACHS program is voluntary, the number of HCOs submitting data for any single CI may be small; therefore the sample may not represent the overall population. Furthermore, participating HCOs are not identified during statistical analysis, which limits comparisons between HCOs. The program’s statisticians believe that, in most specialities, with greater numbers comes greater confidence that the data are representative. For this reason, ACHS reports also include outlier data which notify an HCO that their rate is more than three
REFERENCE
1. Berwick DM, James B,
standard deviations from the mean. In conjunction with the centile data, outlier status provides HCOs with a realistic ‘snapshot’ of their performance against all other reports submitted for a specific CI.
Research in the area of organisational response to CI outcomes has identified the phenomenon of ‘data denial’, where HCOs are sometimes reluctant to accept the implications of CI data and reject the findings rather than investigate their implications, or seek explanations that are not associated with their own performance. Acceptance of the data as both correct and relevant is the first step towards positive action and change.1
It is necessary that clinicians and healthcare executives recognise that a CI result is a marker of change over time, rather than the equivalent of an ‘exam result’ with its designated pass/fail outcome. Although the ACHS CI reports provide data from multiple HCOs, CI data outcomes should not be considered as ‘league tables’.
CIs are so named because they do not provide answers; they ‘indicate’. This means an HCO’s rate can raise questions for further evaluation. A considered analysis of potential reasons for trends over time and/or variation between HCOs can then be used to highlight quality issues or monitor the progress of quality improvement initiatives.
Clinical Indicator User Manuals
The ACHS CI User Manuals contain greater information about the CIs. Members can access the User Manuals from the ACHS website. The User Manuals include information such as: the rationale for CI development suggested sources for data collection (including ICD10-AM codes where applicable) desired rates (i.e. whether the organisation should be aiming for a high or low rate) stratification variables data cleaning rules definition of terms numerator and denominator details including inclusion and exclusion criteria evidence-based information about the CI area Accompanying resources to the User Manuals are blank templates to assist HCOs to collect their data and retain details of their collection.
MJ. Connections between Quality Measurement and Improvement. Medical care. 2003 Jan 1; 41 (Suppl 1): 30-38.
121
Coye
122 AUSTRALASIAN CLINICAL INDICATOR REPORT 2012 - 2019
123

