Driving for work: casualty trends and dangerous behaviours.
Driving for work seminar, November 2024

Casualty trends

Trip purpose ‘driving for work’
Vehicle type

Driving for work seminar, November 2024


Trip purpose ‘driving for work’
Vehicle type
9% of drivers killed were driving for work – male, mostly 36-45yrs, LGV and car drivers.
25% of drivers involved in fatal collisions were driving for work – male, 36-55, 50% HGV drivers.
2019-2023
Of vehicles involved in fatal collisions, HGVs represent 11%.
The corresponding figure for HGVs in serious injury collisions is 3%.
Figures are provisional and subject to change.
The driver of the other vehicle is most likely to be seriously injured, but passengers and VRUs also feature.
Note, 284 HGVs were identified but there are only 275 corresponding drivers in the data at present.

International evidence

Speed (Safe Speeds) - 5% reduction in average speed ≈ 30% reduction in fatal collisions (WHO, 2017).


Distracted Driving (Safe Road Use)
Mobile phone use - Approximately 4 times more likely to be involved in a collision (WHO, 2022).

Fatigue (Safe Road Use) - Estimated to be a contributing factor in 15-20% of serious road crashes (ERSO, 2021).


Impaired Driving (Safe Road Use)
Intoxicants - Drivers with a BAC between 50-80mg alcohol per 100ml blood are between 5-10 times more likely to be involved in a fatal collision (ETSC, 2022).
Protective Equipment (Safe Road Use)
Seat belt wearing - Wearing a seat belt reduces the risk of fatal or serious injuries by approx. 60% (ERSO, 2022).


On all road types non-compliance highest between 8pm-8am, specifically between 4am-8am
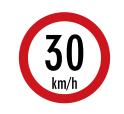
Majority of non-compliance on all road types exceeded the speed limit by up to 10km/h
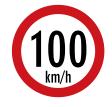
80% of HGV drivers exceed the speed limit on 100km/h roads (limit 80km/h).
Observation survey
▪ Almost 1 in 10 motorists using a mobile device.
▪ Consistent across urban roads, rural roads, and motorways
Mobile device usage (mobile phones and other mobile devices) -
20,551 vehicles at 145 sites
Fieldwork was conducted in September and October 2023
Nationally representative online survey

This national survey establishes the incidence of errant driving behaviour among Irish motorists.


It is used to determine motorist's attitudes to a series of road safety measures; and analyses the extent to which these attitudes and behaviours are consistent both across demographic criteria and over time.

The research comprised a nationally representative online survey of 1,252 motorists aged 17+:

Quota controlled in terms of gender, age, region and area.

Fieldwork was conducted in November 2023.
Driver Attitude & Behaviour Survey 2023
Transporting myself*
Transporting goods
Transporting other person(s)
I use vehicles as part of my job (e.g. drive construction/agricultural vehicles)
Other
Base: Motorists who drive for work, n
*(e.g., visiting patients, salesperson,…)

• 66% male
• 39% aged 17-34 years
• 34% aged 35-49 years
Type of vehicle?
• 76% drive a car for work
• 23% used other types of vehicles when they drive for work
How far?
• 55% drove less than 5,001 km
• 45% drove 5,001+ km in the last 12 months
Behaviours Scale Statement
1 in
(20%)
All Motorists n – 1,252, Drive for work – 304 At least sometimes...
Q. How often do you use your mobile phone while driving to do the


In a fatal collision with a HGV Driver the other party is more likely to die, rather than the HGV driver.

In serious injury collisions where a HGV driver is involved, it is the driver of the other vehicle who is most likely to sustain the serious injury.

Concerning level of speeding noted among HGV drivers on 100km/h roads.

Survey data shows significantly higher levels of engagement in all dangerous behaviours among those who drive for work.

Education and awareness around safe driving behaviours required for all those who drive for work, not just HGV/LGV drivers.

More Irish research required.
This survey will include several areas specific to the work of commercial drivers as well as general driver behaviour questions as found in the Driver Attitude and Behaviour survey
The survey will include areas such as a
o work profile – type of vehicles driven, kilometres nationally & internationally
o driving for work policy – topics covered, training
o working hours – working time both as a commercial driver and in other employment
o enforcement – commercial driving enforcement
o use of technology – ADAS, map systems, training
o driver behaviour – fatigue, seat belt use, speeding
Plan to go live end November 2024
It will be available online through the RSA website
Responses will be completely anonymous
Velma Burns Research Manager
