2.2.1 Microclimate measurement
Microclimate conditions of the soccer fields were measured on hot, sunny summer days (Sep 7th, 8th, 21st, and 22nd of 2021). Two sets of weather sensors (Maximet 501 and ATOMS 41) were installed at the center of each natural turfgrass and artificial turf field. The microclimate air temperature (°F), relative humidity (%), wind speed (mph), wind direction, and solar radiation (W/m2) was collected from 11:00 AM to 6:00 PM CST with a 1 minute recording interval. In addition, the surface temperature was measured every 15 minutes on both filed types by two trained surveyors using a thermal infrared camera (FLIR IR E5). The measurement height of those sensors was five feet above the ground to represent the thermal conditions at an athlete’s chest level. The summary of measured microclimate over four days is presented in Table 1. Although the same weather sensors were not used for data collection, they were thoroughly calibrated prior by multiple field tests.
Table 1) Summary of Microclimate condition on Penberthy soccer field

2.2.2 Questionnaire survey
An on site questionnaire survey was adopted to measure the perceived thermal stress that the soccer players felt during matches. Over the four days of data collection, six soccer matches (6 vs. 6) were played with TAMU Men’s Club Soccer players who volunteered as study participants. Two matches were held approximately 11:00 AM to 1:00 PM CST, and the other four matches approximately 2:00 to 4:00 PM CST to have a wide range of daytime field thermal conditions. Matches consisted of four quarters, where each quarter of a match lasted 22.5 minutes with a 10 minute break in between. At each break, 3 out of 12 players were randomly asked to respond to eight questions about how thermally comfortable they
were during the matches with a 10 point rating scale, where 0 represented “much too cold” and 10 represented “much too hot”. These questions can be grouped in three parts: 1) perceived exertion (i.e., a laborious or perceptible effort), 2) perceived surface heat conditions, 3) perceived thermal stress. The response rate was 87.5%, meaning 63 out of 72 participants responded to the survey without missing values.
2.3. Estimation of objective thermal stress

To evaluate the athlete’s physiological thermal stress, the COMFA energy budget model was employed. It is an outdoor thermal comfort index that estimates the objective thermal comfort of a person based on energy budget equation. In other words, it calculates the physiological thermal load that the human body receives to maintain thermal balance with the surrounding outdoor environment. The energy budget is described as follows:
where ∆S is the change in heat storage (W/m2). When the change in heat storage is near 0, the inputs and outputs of energy would nearly balance, and a person would be thermally comfortable. A large positive value would suggest that a person is receiving much more heat than they are giving off, and they would feel too hot. A large negative value would have the opposite effect. The major energy streams are convective heat loss (C), evaporative heat loss (E), conductive heat loss (K), radiative exchange (R), and metabolic heat production (M) (Kenny et al, 2009). The estimated physiological thermal stress, also called energy budget value, can be measured as watt per square meter of a person’s surface area (W/ m2), a unit of energy density. The measured microclimate and the athlete’s surveyed exertion level were the main inputs to the COMFA model estimation. The metabolic rate of a running person ranged between 300 – 650 W/m2 depending on exertion level, and the summer uniform was selected to determine the clothing insulation level.
3. Results
3.1. Microclimate condition
Surface temperature showed a significant difference between NT and AT. The differences in microclimate between the two field types are summarized in Table 2. Regarding the overall pattern, all the measurement values of AT’s microclimate (e.g. air temperature, solar radiation, relative humidity, and wind speed) were slightly higher than NT. However, except for surface temperature, the degree of their difference is not significant considering their error ranges of measurement. In contrast, the surface temperature presented a large deviation between AT and NT, whose average difference was over 70.0 °F.
The daytime pattern of AT and NT surface temperature was further explored to identify the difference in variation over the day (Figure 2). AT’s surface temperature showed considerable fluctuation over time compared to NT’s. Over the four days of measurements, the surface temperature ranged between 104.6 ° F and 161.6 ° F for AT and between 86.8 ° F and 102.6 ° F for NT. It seems that their daytime mean surface temperature was primarily affected by cloud cover. Overall, the surface temperatures peaked on Sep 7 when the cloud cover was at the lowest at 10%. Meanwhile, surface temperatures were lowest on Sep 22 when the cloud cover was relatively higher at 40%, with a somewhat cooler ambient temperature.
Continued on next Page
The AT – NT difference in surface temperature showed similar daytime patterns with the mean surface temperature. Their difference reached a peak of 96.5 °F at 2:30 PM CST, Sep 7 and lowest at 46.8 °F on 3:30 PM CST, Sep 22. The degree of temperature gap was likely due to increase from morning to high solar noontime at around 1:00 PM CST and after then declining toward evening time at 4:00 PM CST. As surface temperature was the microclimate component primarily determined by field characteristics, we expected it to be a crucial driver causing differences in players’ thermal stress. Soccer players felt higher thermal stress when playing on artificial turf (AT) than natural turf (NT). Figure

3 presents the frequency distributions of players' perceived level of surface temperature and thermal stress for AT and NT. The X axis is the heat scores of perceived surface temperature (upper figure) and perceived thermal comfort (bottom figure), respectively. These values reflect how thermally comfortable they were on each field type during match. And the Y axis is the number of players choosing each score. The upper histogram shows that AT has a relatively higher perceived surface temperature score with a
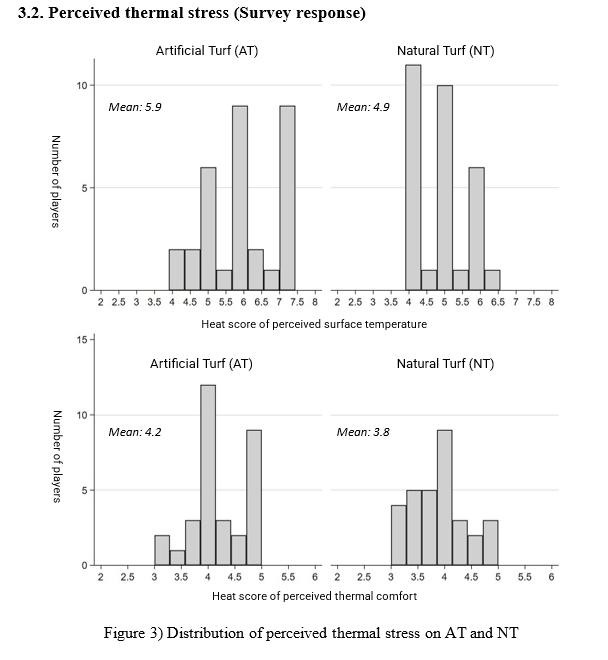
Continued on Next Page
broader range than NT. The frequency distribution curve also indicates that the mean AT's heat score is 6 points which is one point higher than the mean NT's. Moreover, the heat score of the AT ranges between 4 to 7.5, which is slightly broader than that of the NT. Regarding the perceived thermal comfort, although the range of heat score range is identical as it ranges between 3 to 5, the mean AT score is at 4.3 points, which is higher than the mean NT score of 3.8.
3.3. Objective thermal stress (Energy budget model)

3.3.1
Evaluation of thermal stress on natural and artificial turf
Physiological thermal stress of soccer players on the two field types were evaluated using the COMFA model. The estimated COMFA output was described as energy budget values that can be categorized into four classified thresholds of heat stress values (Harlan et al., 2006): Caution (65 120 W/m2), Extreme caution (121 200 W/m2), Danger (201 339 W/m2), and Extreme Danger (340 or higher W/m2).
According to the classification, Figure 4 showed that, for the majority of the match, the players felt very hot and had Extreme Danger levels of thermal stress. Energy budget values reached the peak of 620 W/ m2 at 2:00 PM CST, Sep 7 and arrived at the low of 300 W/m2 at 4:00 PM CST, Sep 8, and 2:00 PM CST, Sep 22. Only limited periods, from 2:00 to 4:00 PM CST on Sep 8 and from 2:00 to 2:30 PM CST on Sep 22, fell into Danger level of thermal. Their daytime patterns with peak and bottom hours were highly coupled with surface temperature.
When it comes to the AT NT difference in physiological thermal stress, it was found that NT can reduce the thermal stress of soccer players by up to 20% compared to AT. Overall daytime patterns of thermal stress demonstrated that the difference in energy budget values between AT and NT was 10.6 % higher in the afternoon than the noon during clear sunny days. Their highest difference was on Sept 7 around 3:00 PM CST at 124 W/m2, while their lowest difference was on Sep 22 around 4:00 PM CST at 25 W/m2. It seemed that the magnitude of disparities in thermal stress was likely to increase when the shortwave solar radiation (or direct solar beam) coming from the sky was strong. Meanwhile, their disparities tended to decline when the cloud cover was relatively larger with high wind speed.
on Next Page
Continued
The most significant components of thermal loading to which players are exposed are Kabs for NT and Labs for AT. The Figure 4 indicates individual contribution of four energy components (absorbed solar radiation (Kabs), absorbed terrestrial radiation (Labs), convective heat loss (C), and evaporative heat loss (E)) to thermal loadings that athletes received during daytime hours. The Kabs are the amount of incoming shortwave solar radiation that a player absorbs, and the Labs are the amount of absorbed longwave ground radiation emitted from field. Evaporative heat loss is the loss of body heat that occurs through respiration and perspiration, whereas convective heat loss is the transfer of heat from the body due to the wind. Kabs and Labs comprise the largest proportion of the net energy budget, leading to the overall increase in thermal stress of players. As the Kabs was determined by exposure level to direct solar radiation, no difference was observed between the field types. Meanwhile, the Labs of AT was 97.7% and 91.5% higher at the noon and the afternoon, respectively, compared to NT. The impact of AT and NT surface temperature on players' thermal stress was estimated using a statistical modeling procedure called multiple linear regression, where time of day and day of week were con-

sidered. Two sets of models were developed for players on each field type physiological thermal stress and perceived thermal stress. Particular attention was given to (1) the comparison of the impact of turf surface temperature on different types of thermal stress, as well as to (2) investigate the explanatory capacity of turf surface temperature as a proxy of thermal stress. Upper plots showed the predicted changes in physiological thermal stress (W/m2) by an increase in one Fahrenheit degree of AT and NT surface temperature, whereas the bottom plot indicated the predicted shifts in perceived thermal stress. All models were statistically significant, indicating that both filed types affects physiological and perceived thermal stress significantly.
The impact of surface temperature on athletes' thermal stress is higher on NT than AT. The coefficient slope of NT is 11.6 for physiological thermal stress, meaning that the 1 °F increase in surface temperature led to 11.6 growth in energy budget values (W/m2). The coefficient slope of AT was 6.9m which was three times less than NT. Interestingly, a similar outcome was found in perceived thermal stress, where NT's coefficient slope (0.014) was higher than AT’s (0.008). These findings indicate that the both perceived and physiological thermal stress of the players are more sensitive when they are performing on NT. We assume that this is mainly due to the higher thermal stress level on AT that may result in the reduced performance (or amount of activity) and lower metabolic rates leading to decreases in thermal stress of players compared to NT.
Explanatory power of surface temperature for thermal stress varies on the types of thermal stress. In this study, explanatory power indicates the ability on how much variations in players' thermal stress can be explained by the surface temperature. Overall, the surface temperatures showed better performance in explaining athletes’ physiological thermal stress than the perceived thermal stress model. In the physiological thermal stress model, the explanatory power (or adjusted r-squared) values are 57% and 49% for AT and NT respectively, which are around 30% higher than the perceived thermal stress model. This implies that, considering their high explanatory power of around 50%, surface temperature can be considered a superior proxy when it is used for measuring the physiological thermal stress of soccer players.
4. Conclusion
This study compared the perceived and physiological thermal stress of soccer players performing on AT and NT. Microclimate was measured on each field type during four hot, sunny, summer days in 2021. Questionnaire surveys and the COMFA model were adopted to measure perceived and physiological thermal stress, respectively. Our findings confirmed that surface temperature is the main driving factor that leads to an increase in both perceived and physiological thermal stress of the soccer players in summer daytime. The highlights of the key findings are as follows:
• Mean AT NT difference in surface temperature was over 68.0 °F, which tends to be more pronounced when the direct solar beam is stronger, and the time reaches solar noon at around 1:00 PM CST
• Athletes performing on AT had higher perceived and physiological thermal stress than those on NT. Compared to AT, NT can reduce the physiological thermal stress by up to 20% in a setting of a clear, hot, and sunny day.
• The impact of NT surface temperature on player’s perceived and physiological thermal stress is higher than that of AT. This implies that athletes are likely to be more sensitive to field heat conditions when performing on NT.
Continued on Next Page
The findings of this study are useful for biometeorology and sports field management to enhance the athletes’ safety from heat stress and increase their match performance. Future studies need to address how the difference in thermal stress induced by AT and NT affects the athlete’s physical performance and physiological body changes, such as hydration.
REFERENCES
• Francis, R. A. (2018). Artificial lawns: Environmental and societal considerations of an ecological simulacrum. Urban Forestry & Urban Greening, 30, 152 156.

• Guyer, H. (2020). Athletic Surfaces‘ Influence on the Thermal Environment: An Evaluation of Wet Bulb Globe Temperature in the Phoenix Metropolitan Area. Arizona State University, Temple, AZ
• Harlan, S. L., Brazel, A. J., Prashad, L., Stefanov, W. L., & Larsen, L. (2006). Neighborhood microclimates and vulnerability to heat stress. Social science & medicine, 63(11), 2847 2863.
• Jim, C. Y. (2017). Intense summer heat fluxes in artificial turf harm people and environment. Landscape and Urban Planning, 157, 561-576.
• Kenny, N. A., Warland, J. S., Brown, R. D., & Gillespie, T. G. (2009). Part A: Assessing the performance of the COMFA outdoor thermal comfort model on subjects performing physical activity. International Journal of Biometeorology, 53(5), 415 428.
On August 29th the Austin Turf Team joined the United Ag & Turf family. Established in 1992, Austin Turf has worked hard to earn the trust and business of our clients. Through our valued relationships, Austin Turf has become one of John Deere’s Premier Dealers in Golf, Sports Turf, and Commercial Mowing equipment.
There will be no changes in our locations and most importantly, our team. We are proud to continue world class sales, parts, and service support, while adding the technology expertise, inventory, and strength of the forty plus location United Ag &Turf John Deere Group.
"The addition of the Golf & Turf line is exciting news for all of us," said United Ag & Turf CEO, Brody Pettit. "John Deere entered the golf industry in 1987 and has been leading the industry in innovation for precision turf solutions ever since." United’s new Director of Golf Sales & Marketing, Chad Mobley, and the entire Sales Team look forward to continue serving our clients while Harry Jukes, Director of Golf & Sports Turf Operations, and our service & parts teams are here to continue providing the service you have come to expect and count on. For 30 years our motto has been to “Sell the Best & Grind the Rest!” We intend to continue that Tradition as a part of the United Ag & Turf Family.
Give us a call today!
Central & South Texas / New Mexico (Marble Falls): 800-528-4290
North & West Texas (Farmers Branch): 800-648-6757
WEARE PLEASED TO ANNOUNCE THAT AUSTIN TURF & TRACTOR IS JOINING THE UNITED AG & TURF FAMILY!!


Registration Open October 12, 2022 Scotts Miracle-Gro Center for Lawn and Garden Research 3100 F and B Road, College Station, TX 77845 Turfgrass Field Day Turfgrass faculty, staff, and students will present a field tour of topics on: • Turfgrass selection & management • Irrigation management and drought recovery • Turfgrass and Ornamental Pest management • Golf Course Fairway and Sports Field Construction • New technologies and educational demonstrations • Turf Weed/Disease Control Research • Turf Fertility Research • And Much More! CEU’s to be offered!! Click here for more information and registration
Thinking of scrapping your grass for cash? You might want to think again!
In recent years, landscape water conservation has become a high priority for many U.S. Cities. Rebate programs incentivizing removal of turfgrass from landscapes have been developed by many municipalities in an effort to meet water conservation goals. These programs encourage homeowners to replace turfgrass with more ‘water efficient’ alternatives, which may include some combination of native plants, mulch, decomposed granite, gravel, or even artificial turf. Unfortunately, there has been little to no research
Figure 1. Lawn and alternative landscape treatments being tested in the Texas A&M ecosystem services research.

 Baoxin Chang1 and Ben Wherley2 Postdoctoral Researcher1 and Professor2 of Turfgrass Science & Ecology Texas A&M University Department of Soil & Crop Sciences
examining the consequences of these conversions. While some degree of outdoor water savings may be realized, the saying still holds true, ‘lawns don’t waste water, people waste water’. It is important that landscape architects, water purveyors, and homeowners recognize that turfgrass lawns are a resource that not only provide aesthetic/recreational value, but also contribute numerous ecosystem services including carbon sequestration, oxygen generation, heat and dust mitigation, soil stabilization, flood control, and numerous others (1).
Over the past decade, a multidisciplinary team of Texas A&M Soil & Crop faculty have collaborated on research examining environmental impacts lawn and landscape management practices. These studies have been carried out at the Urban Runoff Facility located at the Scotts Miracle Gro Center for Lawn and Garden Research in College Station. In 2012, this 24 plot facility was originally constructed and established with Raleigh St. Augustinegrass. In 2018, some of the previously grassed plots were stripped out and converted to various alternative residential landscapes, using procedures and guidelines consistent with many of the rebate programs in the region. Landscape treatments include xeriscaping, water-efficient mulch, artificial turf, and sand-capped lawn plots (Fig. 1). During the initial 3 4 years since conversions have taken place, ongoing studies have characterized ecosystem services of these landscapes, including rainfall retention/runoff dynamics, runoff quality, energy balance, and greenhouse gas emissions. Details of the studies as well as more comprehensive results can be found in the links provided at the end of this article (2,3,4).
To date, our findings consistently demonstrate the excellent potential of natural grass systems to mitigate stormwater runoff. Figure 2 shows the comparative ability of the landscape treatments to capture rainfall. St. Augustinegrass lawn plots, on average, did not produce runoff unless rainfall exceeded 0.6”, and nearly an inch (0.9”) of rain was needed to produce runoff from Sandcapped (washed St. Augustinegrass atop a 4” sandcap) lawns. In comparison, runoff occurred with as little as 0.4 to 0.5” of rain from Xeriscaping and Artificial Turf landscape treatments. Mulched surfaces also showed good ability to absorb rainfall, similar to that of the natural grass treatments. Rainfall retention/runoff differences in the study were mostly attributable to physical characteristics of turfgrass system, which behaves very much like a sponge during rainfall events, as well as the greater permeability of native soil (and coarse sand for Sandcapped lawn) compared to the decomposed granite based Xeriscape and Artificial Turf systems. These results have implications for ur-

ban areas where flash flooding may be of concern following brief cloud bursts or more extensive rainfall events.
Another potential impact of surface runoff from landscapes is loss of nutrients such as N and P into surface waters. One surprising observation from our research has been the elevated levels of nitrate emanating from artificial turf landscapes, despite never having fertilizer applied to them (data not shown) (4). Previous studies from Arizona have shown that soil nitrate may build up for 5 10 years following grass removal due to lack of active plant roots and continued decomposition of organic matter, representing a groundwater leaching concern (5). Although we did not directly measure leachate in our study, we hypothesize that the elevated nitrate detected in runoff from artificial turf plots could have resulted from a combination of atmospheric N deposition as well as oxidation of organic matter. Unlike natural grass landscapes, artificial turf is unable to filter out nutrients from rainfall or irrigation before it passes through and enters ground or surface waters.
One often overlooked consequence of altering landcover is the potential effects on surface temperatures, which can impact human comfort and cooling costs. During a typical summer day in our study, surface temperatures of natural grass plots remained at or slightly above ambient air temperatures due to the evaporative cooling effect of grass, while other treatments generated substantial heat loads (Fig. 3). For example, during the afternoon of August 30, 2018, when air temperatures were in the mid 90’s, St. Augustinegrass measured 95 oF, while artificial turf (with green sand infill) and mulch plots approached 160 oF! Surface temperatures of xeriscaped plots generally were intermediate to natural grass and artificial turf plots on most summer dates.
Figure 3. Surface temperatures of each landscape, measured during the afternoon hours on clear days.
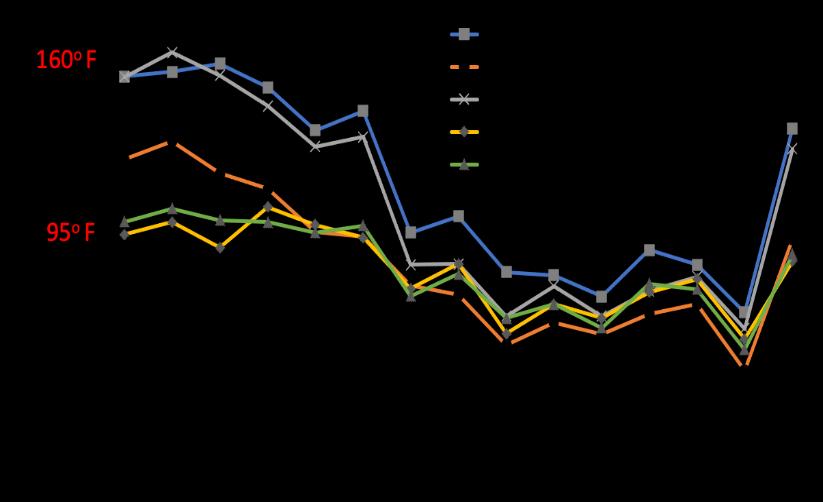
Although we intend to take a longer term approach with this work, the findings from the initial 3 4 years of the study emphasize that while water may be saved through landscape conversion, there are numerous other consequences to turfgrass removal that should not be overlooked. As our urban areas continue to rapidly expand, it is our job as in industry to educate decision makers including landscape designers, community planners, and water purveyors on the many envi-

ronmental benefits offered by natural grass in the landscape.

References
Beard, J.B. and R.L. Green, R.L. 1994. The role of turfgrasses in environmental protection and their benefits to humans. Journal of environmental quality, 23(3), 452-460. https://doi.org/10.2134/ jeq1994.00472425002300030007x
Chang B., B.G. Wherley, J.A. Aitkenhead Peterson, and K.J. McInnes. 2021. Effects of Urban Residential Landscape Conversion on Surface Runoff Dynamics. Science of the Total Environment. 783:1-11. https:// doi.org/10.1016/j.scitotenv.2021.146977
Da Ros Carvalho H., B. Chang, K.J. McInnes, J.L. Heilman, B. Wherley, and J.A. Aitkenhead-Peterson 2021. Energy Balance and Temperature Regime of Different Materials used in Urban Landscaping. Urban Climate. 37:1 16. https://doi.org/10.1016/j.uclim.2021.100854
Chang B., B.G. Wherley, J.A. Aitkenhead Peterson, K. McInnes, and P. Dwyer. 2022. Short Term Impacts of Urban Landscape Conversion on Surface Runoff Quality. Urban Ecosystems. 1 16. https:// link.springer.com/article/10.1007/s11252-022-01247-2
Heavenrich H. and S.J. Hall (2016) Elevated soil nitrogen pools after conversion of turfgrass to water efficient residential landscapes. Environmental Research Letters 11:084007. https://iopscience.iop.org/

EXTENDED TO SEPTEMBER 30


 Howdy ,


 field layouts, photographs of the weather sensors used, and infrared thermal imagery taken from grass and turf are shown in Figure 1.
Figure
measurement on Penberthy Rec Sports Soccer fields in College Station, Texas
field layouts, photographs of the weather sensors used, and infrared thermal imagery taken from grass and turf are shown in Figure 1.
Figure
measurement on Penberthy Rec Sports Soccer fields in College Station, Texas