


In today’s rapidly evolving business landscape, the ability to harness the power of data has become paramount for success. As the business environment continues to grow in complexity, the demand for professionals skilled in deciphering data patterns and transforming them into actionable strategies has never been higher. As we delve into the intricacies of this dynamic field through this book, our aim is to equip students with a solid foundation in both the theoretical concepts and practical applications of Business Analytics.
This book serves as a comprehensive guide to Business Analytics tailored for undergraduate and postgraduate students, with a special focus on new syllabus under UGCF 2022 based on National Education Policy (NEP), 2020 by the University of Delhi.
This book has been divided into 8 chapters. From data collection and preprocessing to advanced predictive modelling and data visualization using R, this book covers a wide spectrum of topics relevant to Business Analytics. In this book, we strike a balance between theory and application, providing a solid theoretical foundation while emphasizing the practical aspects of Business Analytics. Real-life case studies, hands-on examples, and exercises are woven throughout the book to help students bridge the gap between concepts and their real-world implementation.
As authors, we invite you to embark on this educational journey of Business analytics, exploring the world of data-driven insights and strategic thinking. We would like to thank and appreciate the efforts of the editorial and production departments at Taxmann Publishing for bringing out this book.
H. K. Dangi Gurveen Kaur


After completing chapter 3, you should be able to:
Define the term ‘Data Summarisation’
Understand the concept of ‘Data Visualisation’
Learn data visualisation using Tableau
Learn data visualisation using advanced MS-Excel spreadsheet
“Visualization gives you answers to questions you didn’t know you had.”
-Ben Schneiderman, American computer scientistToday, the world is drowning in the sea of data, where data transfers take place every one millionth of a second. As per Statista 2022 report, over 90% data of world has been generated merely, in past two years. This is credited to the ever-increasing size of world internet users, web searches, explosion of smart devices, online services, social media, and digital media etc. Drawing on the same report, there are approximately 22 billion connected smart devices worldwide, and is estimated to reach 50 billion by the year 2030.
Data is a valuable resource for every business across the sectors. On a day-to-day basis, businesses came across diverse types of data like feature - rich data, large - scale data, and high - value data etc. Businesses leverage these information intensive data sets to devise strategies for
their organisations. For example, various leading apparel companies, retail companies, and food companies etc. had gigantic amount of data in the form of customer information, product details, promotional activities and so on. These companies leverage this data to devise customised promotion strategies.
Well timed interpretation and comprehension of the data enables organisations in numerous ways. For instance, expanding customer base, devising business strategies, developing brand loyalty, setting competitive prices, cutting down costs, and improving overall efficiency etc.
Despite, the numerous advantages that a data offers, most of the companies are unable to take the full advantage of their data due to following reasons:
It is practically not feasible to analyse such large volume of data viz. real time data, current data, or historical data. This is where data summarisation and visualisation prove useful. The crisp, insightful, and comprehensive summaries of the data help firm to identify the existing opportunities and device strategies accordingly.
Also, in the realistic world, things are variable. To understand or get an idea of a situation, one needs to take several measurements. After taking these several measurements, they need to summarise the results and make meaningful inferences therefrom.
Data summarisation refers presenting a compact description of a dataset. In other words, data summarisation is the presentation of a dataset in an easy, informative, and comprehensive manner. It can be contemplated as abridged form of the dataset wherein the data is compressed into smaller sets while maintaining the maximum possible information. Data summarisation is a meticulously performed summary that is obtained from the entire data set and will divulge significant patterns and trends in a clarified manner.
Data summarisation is the foremost step of data mining and helps in choosing an appreciate statistical tool or technique based on the trends put on view by summarisation. Some examples where data summarisation can act as an auxiliary are as following:
A media house ought to find out how effectively its various channels are performing on the basis of certain variables like viewership, number of shows aired, and target audience etc.
The HR manager of a company wants to keep a record of the company’s workforce and monitor them based on various attributes like vacancies, employee turnover, and transfers etc.
A pharmaceutical company wants to keep a track of its MRs (Medical representative) on the basis of variables like targets achieved, coverage, and outreach etc.
A retail company required to test the market sentiment for its newest product based on the data gathered from various social networking accounts of the consumers.
In all the above examples data summarisation tools and techniques come to rescue by providing deep insights of the situation.
Based on the statistical operations, there are three ways in which data can be summarised (Figure 1).
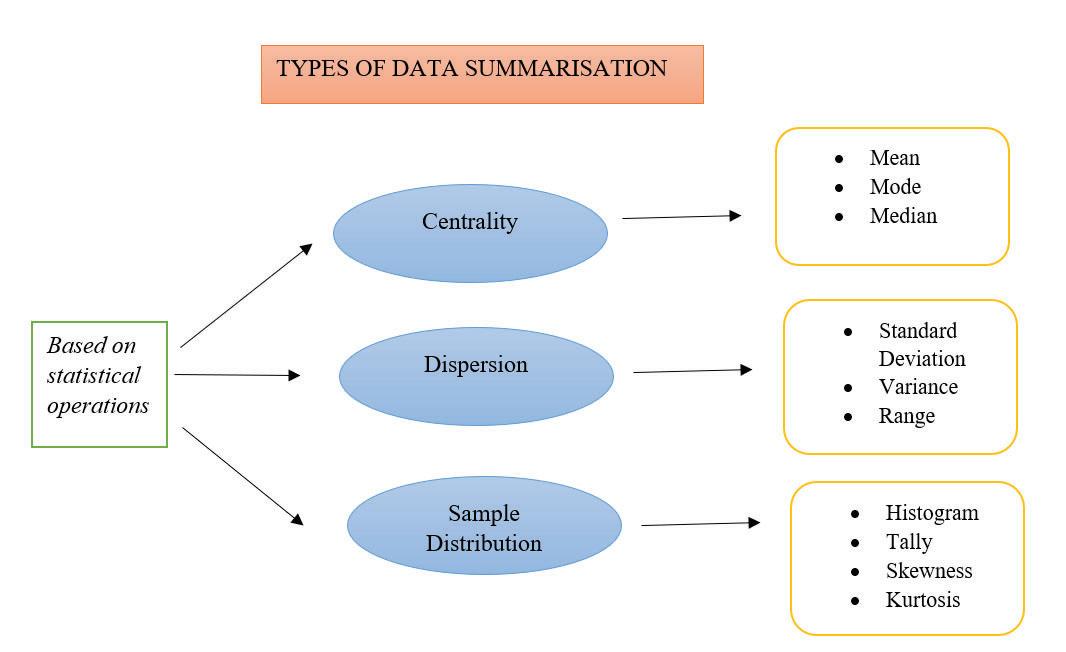
Figure 1 : Types of Data Summarisation
Source: Compiled by authors
These are discussed as follows:
1. Based on Centrality
A data can be summarised on the basis of its centrality. Centrality of a data describes the centre or middle value of the data set. In other words, it ascertains one central value around which all other values of a dataset revolve. The other name for centrality is ‘average.’
There several ways to find the centrality of a data. However, the most popular ones are mean, mode and median. These three summarises the distribution of the dataset.
Mean
Mean is used to calculate the numerical average of a dataset. Arithmetic mean is calculated by adding all the values of the given dataset and dividing it by the by number of items therein. The mathematical formula is as follows:
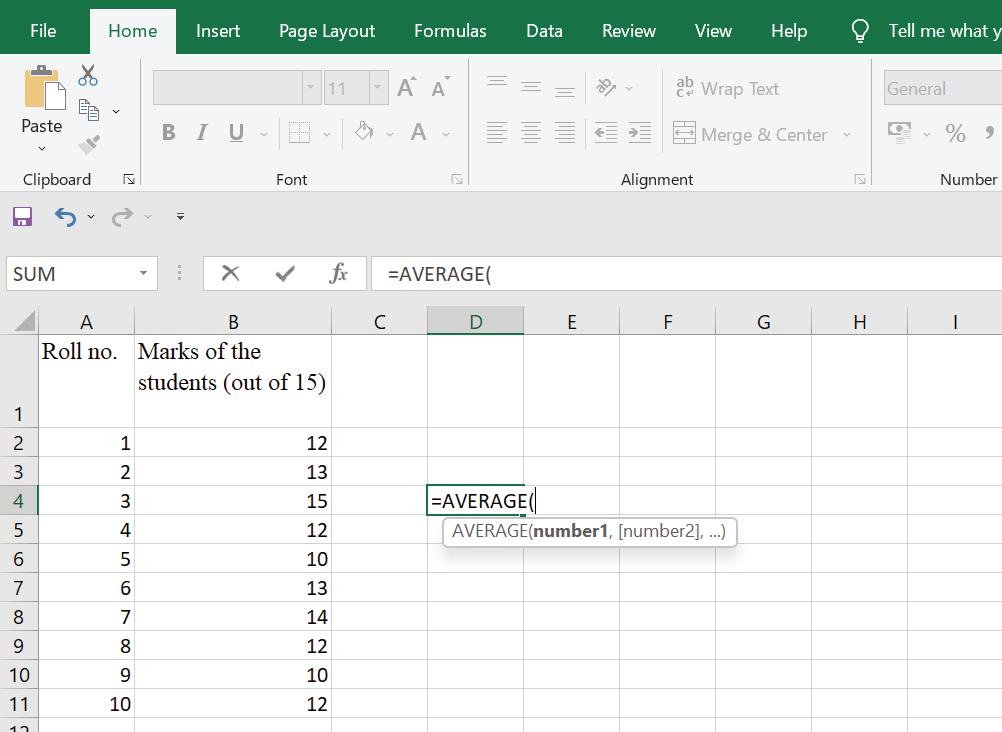
The following steps are used to calculate mean using MS-Excel:
Step 1: Click on an empty cell
Step 2: Type ‘=AVERAGE (cell range)’ for example: (A1:A15)
Step 3: Press ‘ENTER’ and mean will be displayed.
For example, Calculate the average marks of the students (out of 15) from the below given sample:
12, 13, 15, 12, 10, 13, 14, 12, 10, 12
Step 1: Click on empty cell (Figure 2)
Step 2: Type ‘=AVERAGE (B2:B11) (Figure 3)
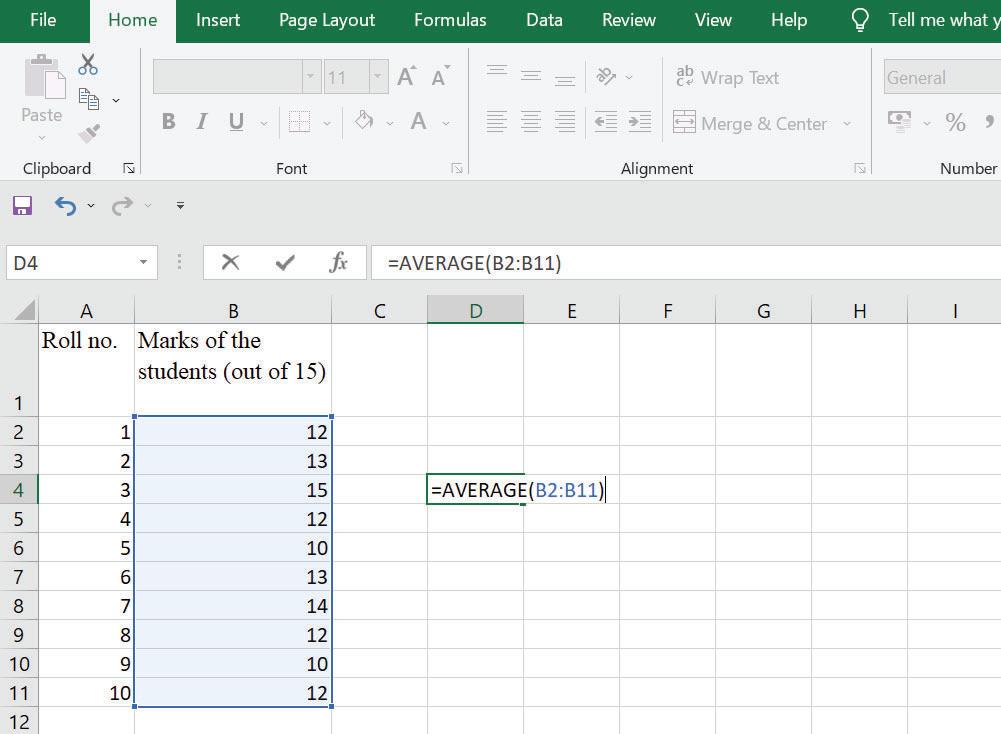
Figure 3
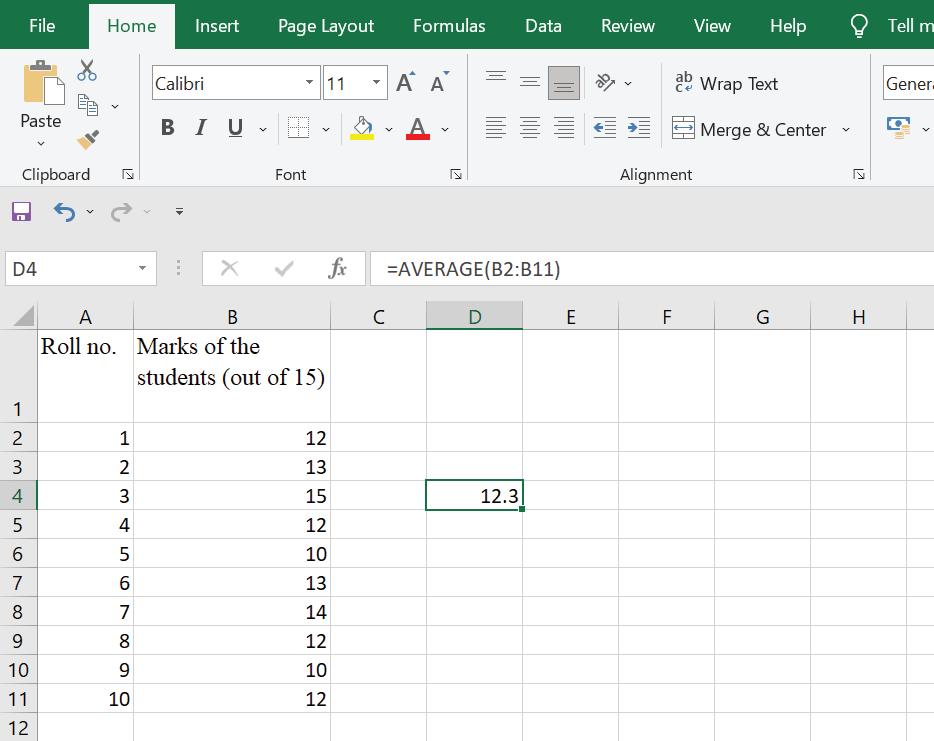
Step 3: Press ‘ENTER’. Mean of the dataset is 12.3 (Figure 4)
Mode
Mode refers to the most recurring value in the sample. In other words, it refers to the most frequent number of the given dataset. Mode is comparatively less preferred in statistical analysis. Although it can be calculated for any type of sample, but it is mostly used where the sample size is large or the given values are integers.
The following steps are used to calculate mean using MS-Excel:
Step 1: Click on an empty cell
Step 2: Type ‘=MODE (cell range)’ for example: (C1: C15)
Step 3: Press ‘ENTER’ and MODE will be displayed.
For example, following are marks of 10 students in the class:
12, 13, 15, 12, 10, 13, 14, 12, 10, 12
Calculate its mode.
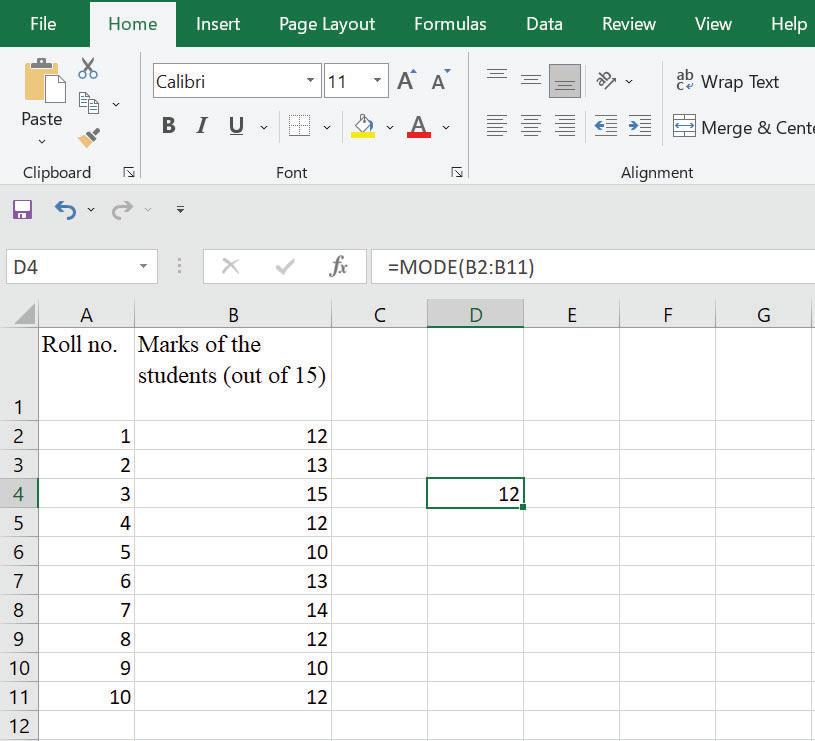
Step 1: Click on empty cell (Figure 5)
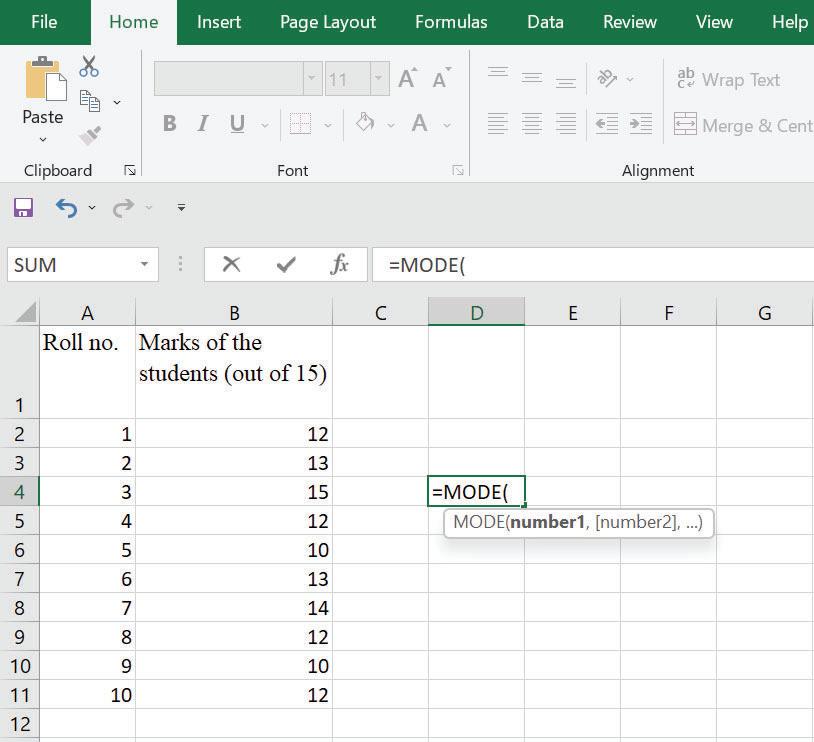
Step 2: Type =MODE (B2: B11) (Figure 6)
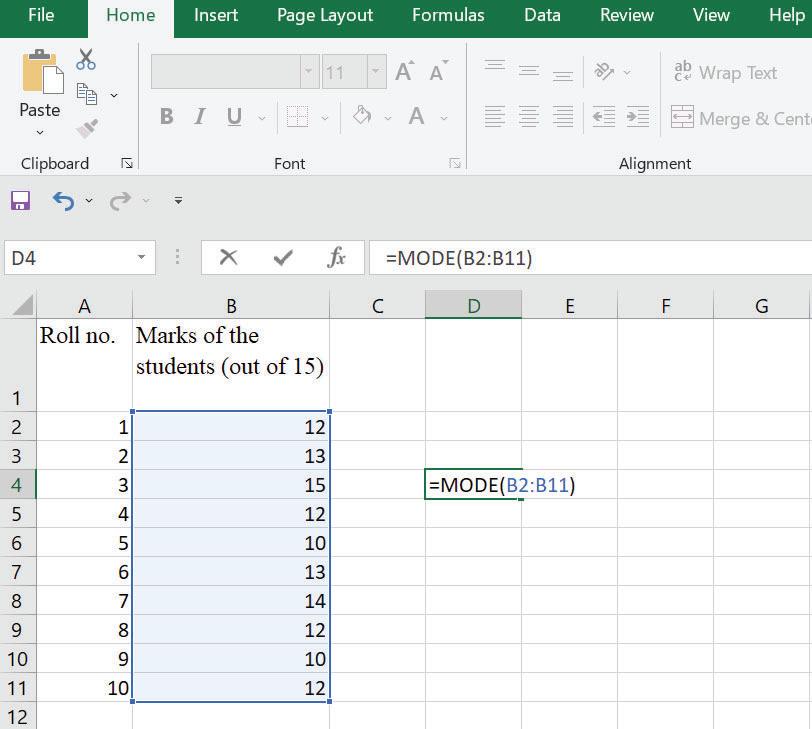
Step 3: Press ‘ENTER’ MODE= 12 (Figure 7)
Median refers to the middle value of the series when arranged in ascending or descending order. When the distribution is normal, the mean and median tend to coincide.
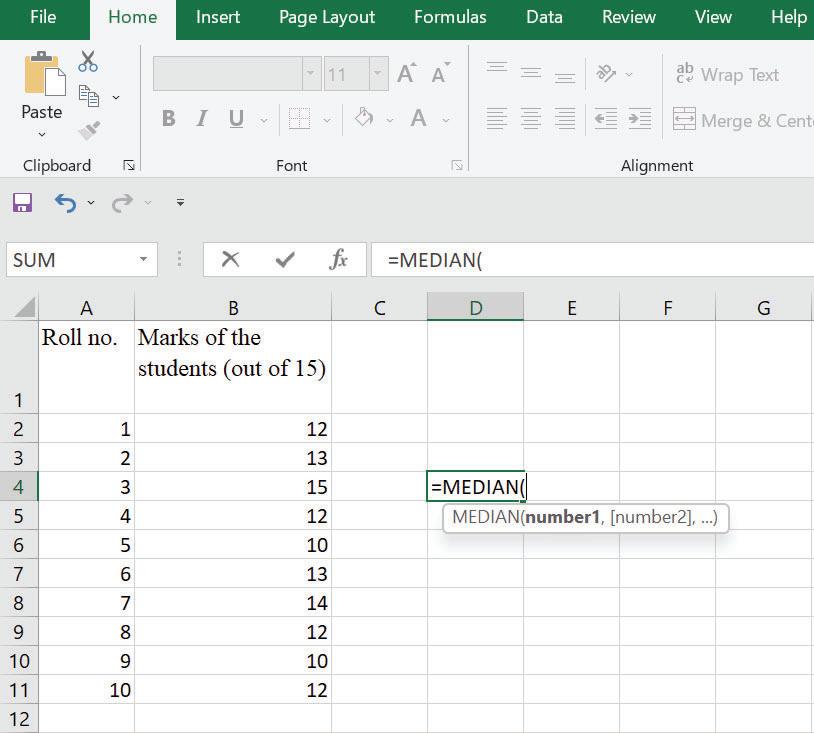
The following steps are used to calculate median using MS-Excel:
Step 1: Click on an empty cell
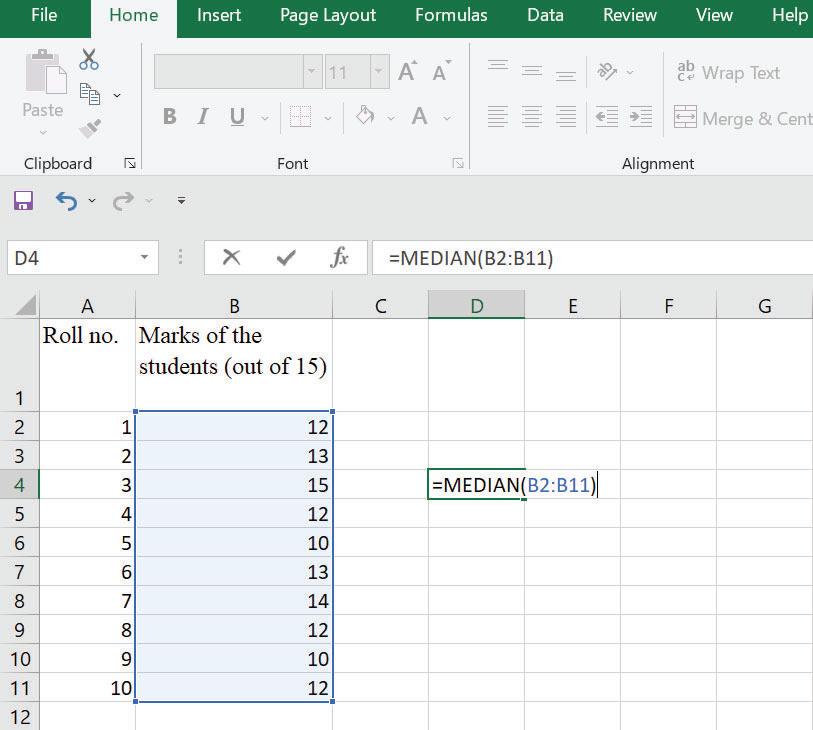
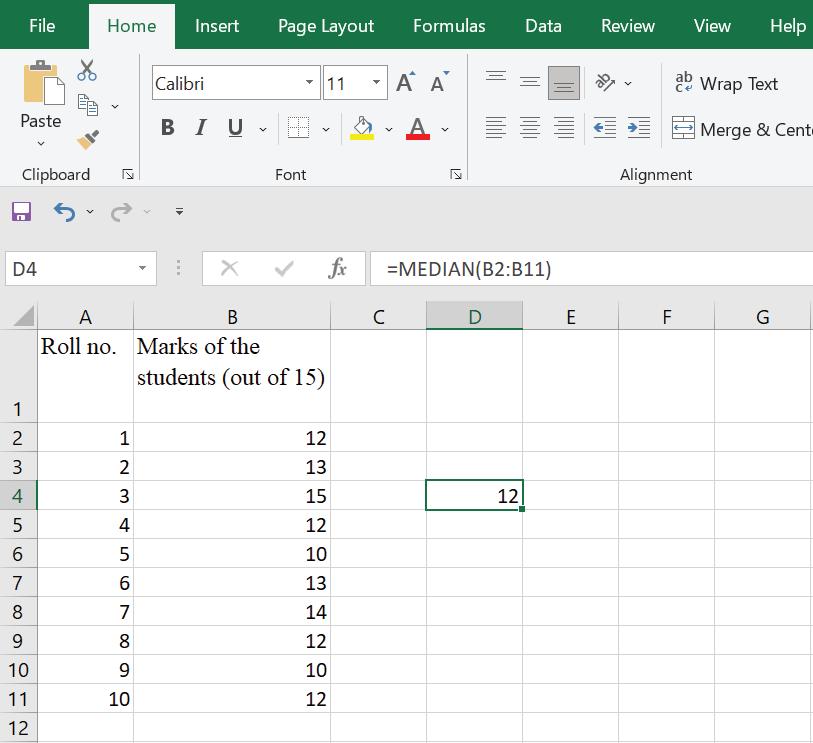
Step 2: Type ‘=MEDIAN (cell range)’ for example: (C1: C15)
Step 3: Press ‘ENTER’ and MEDIAN will be displayed.
For example, following is the marks of 10 students in the class: 12, 13, 15, 12, 10, 13, 14, 12, 10, 12
Step 1: Click on an empty cell (Figure 8)
The term ‘dispersion’ means ‘spread.’ To elaborate, dispersion means how scattered the sample values are around the mean. It shows the variability present within the
given data. If the values are scattered far away from the mean, then the dispersion of the sample is said to be low. While, values closer to average means low dispersion.
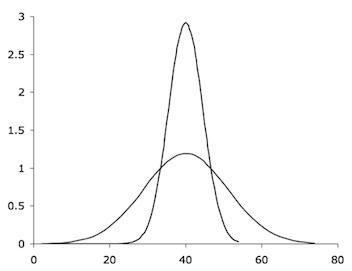
Figure 11 depicts two normally distributed samples i.e., symmetrical distributions. However, the principle of dispersion remains the same for any shape of the distribution. Different measures of dispersion are considered for different data distribution.
Various measures of dispersion include the following:
Standard Deviation (SD)
Standard deviation is the most used measure of dispersion. It is used in normally distributed data and shows how spread the values are from the mean. To rephrase, it shows extra small or extra-large values of the data. Thus, gives an understanding of how scattered a data is. It is also known as ‘average deviation’ from mean. The formula for SD is
Here, s represents sample SD
Generally, a sample is taken from a larger population. Thus, a sample standard deviation (s) is estimated in most of the statistical analyses. Also, n-1 is taken as the denominator. However, in case of population SD, also known as ‘True SD,’ standard deviation is divisor is considered as a ‘compensation factor’ as ‘n’ larger and thus closer to the population. In such a case, subtracting 1 from ‘n’ does not affect the result much.
The following steps are used to calculate SD using MS-Excel:
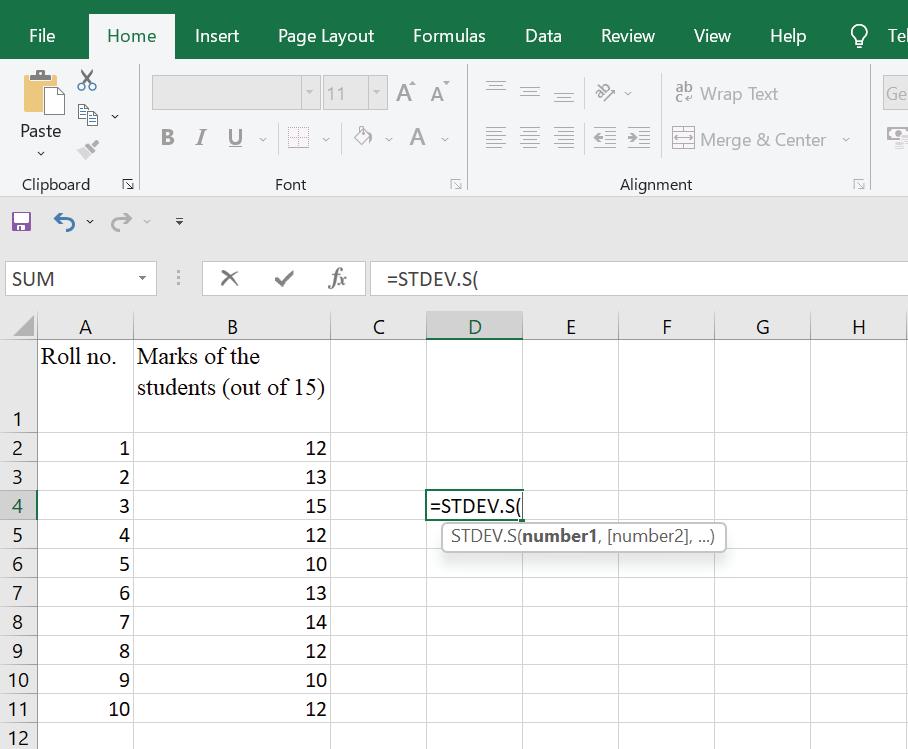
Step 1: Click on an empty cell
Step 2: Type ‘=STDEV.S (cell range)’ for example: (D1: D5)
Step 3: Press ‘ENTER’ and SD will be displayed.
For example, following is the marks of 10 students in the class: 12, 13, 15, 12, 10, 13, 14, 12, 10, 12
Calculate Standard deviation.
Step 1: Click on an empty cell (Figure 12)
PUBLISHER : TAXMANN
DATE OF PUBLICATION : APRIL 2024
EDITION : 2024 EDITION
ISBN NO : 9789357786690
NO. OF PAGES : 264
BINDING TYPE : PAPERBACK
Rs. 425 | USD 6
This book emphasises the critical role of data in today’s evolving business landscape. It highlights the increasing complexity of the business environment and the growing demand for professionals adept at analysing data patterns and translating them into actionable strategies.
This book is designed to progressively build the reader’s knowledge in business analytics, from fundamental concepts to specialised techniques and ethical considerations, complete with practical applications and exercises for reinforcement.
The Present Publication is the Latest Edition, focusing on the latest syllabus under UGCF 2022, aligning with the National Education Policy (NEP) adopted by the University of Delhi. This book is authored by Prof. H.K. Dangi and Gurveen Kaur, with the following noteworthy features:
u [Balanced Approach Between Theory and Practice] The book maintains an equilibrium between theoretical knowledge and practical application. It lays a solid theoretical foundation in Business Analytics while also emphasising its practical aspects
u [Real-World Application and Hands-On Learning] Incorporating reallife case studies, hands-on examples, and exercises, the book ensures that students can connect theoretical concepts with their implementation in the real world
u [Educational Journey in Business Analytics] This book offers insights into data-driven decision-making and strategic thinking
The structure of the book is as follows:
u [Learning Outcomes] Every chapter begins with the list of learning outcomes which the readers will achieve after the completion of the chapter
u [Headings/Sub-headings] Chapters are further divided into headings and sub-headings to increase the reader’s comprehension
u [Practice & Discussion Questions] Each chapter contains a series of practice/discussion questions to help the reader review the material
u [Case Studies] are provided at the end of each chapter to help readers implement their learning into hypothetical real-life situations
ORDER NOW