FINANCIAL STABILITY

Definitions: Income, Wages, Poverty
Living Wage
Median Family Income
• The minimum income required for individuals or families to meet basic standards of living based on local expenditures without public or private assistance.
• Average family income representing the “middle” – half of families earn more, half earn less.
Minimum Wage
Poverty/FPL
(Federal Poverty Level)
• The lowest salary an employer can legally pay a worker; varies by state.
• A statistical marker for measuring population living below a specified income level.
• Based on 1950’s distribution of expenses with food accounting for 1/3 of budget.
200% of FPL
• An income measure equal to 2x the poverty level.
300% of FPL
• An income measure equal to 3x the poverty level.
How much do Tulsa area families ACTUALLY earn?ACTUALLY
$80,332
Source: US Census Bureau, 2022 American Community Survey.
21,089 8% 44,622 17% 29,755 11% 27,146 11% 140,042 53% Less than $20,000 $20,000 to $44,999 $45,000 to $59,999 $60,000 to $74,999 $75,000 or more
of Families (% of Families)
Categories
Number
Income
( ) ( ) ( ) ( ) ( ) Family Income Distribution
=
Median Family Income
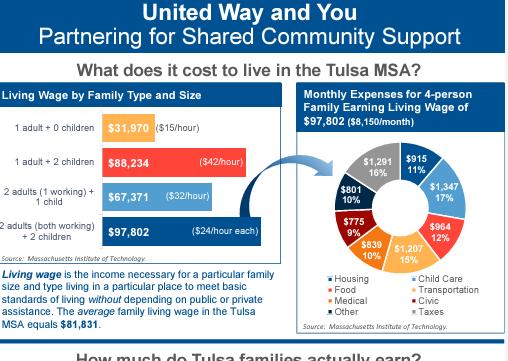
What does it cost to live in the Tulsa area in 2023?
Living Wage by Household Type and Size
1 adult + 0 children
1 adult + 2 children
$31,970
($15/hr)
2 adults (1 working) + 1 child
$88,234
2 adults (both working) + 2 children
$67,371
$97,802
Source: Massachusetts Institute of Technology, Department of Urban Studies and Planning, Amy Glasmeier, "Living Wage Calculator" 2023 Update (accessed 4/13/23).
($32/hour)
($42/hour)
($24/hour each)
What are expenses for a family earning Living Wage in the Tulsa area?
Source: Massachusetts Institute of Technology, Department of Urban Studies and Planning, Amy Glasmeier, "Living Wage Calculator" 2023 Update.
$915 11% $1,347 17% $964 12% $1,207 15% $839 10% $775 9% $801 10% $1,291 16% Monthly Expenses 4-person Family at Living Wage: $97,802/year ($8,150/month)
Housing Child Care Food Transportation Medical Civic Other Taxes
Monthly Expenses
Income of 4-person family earning:
LIVING WAGE
Source: US Census Bureau, 2021 American Community Survey; Massachusetts Institute of Technology, Department of Urban Studies and Planning, Amy Glasmeier, "Living Wage Calculator" 2023 Update; Federal Register, “Annual Update of the HHS Poverty Guidelines,” 01/19/2023.
$0
$20,000 $40,000 $60,000 $80,000 $100,000 Wage Levels Living Wage (2 earners) = $98,000 Living Wage (1 earner) = $78,000
Income of 4-person family earning:
MINIMUM WAGE
Source: US Census Bureau, 2021 American Community Survey; Massachusetts Institute of Technology, Department of Urban Studies and Planning, Amy Glasmeier, "Living Wage Calculator" 2023 Update; Federal Register, “Annual Update of the HHS Poverty Guidelines,” 01/19/2023.
$0 $20,000 $40,000 $60,000 $80,000
$100,000 Wage Levels Minimum wage = $15,000 Living Wage (2 earners) = $98,000 Living Wage (1 earner) = $78,000
Income of 4-person family earning:
$15/HOUR
Source: US Census Bureau, 2021 American Community Survey; Massachusetts Institute of Technology, Department of Urban Studies and Planning, Amy Glasmeier, "Living Wage Calculator" 2023 Update; Federal Register, “Annual Update of the HHS Poverty Guidelines,” 01/19/2023.
$0 $20,000 $40,000 $60,000 $80,000 $100,000
Wage Levels
$15/hour = $31,000 Minimum wage = $15,000 Living Wage (2 earners) = $98,000 Living Wage (1 earner) = $78,000
Income of 4-person family earning:
$30/hour = $62,000
Source: US Census Bureau, 2021 American Community Survey; Massachusetts Institute of Technology, Department of Urban Studies and Planning, Amy Glasmeier, "Living Wage Calculator" 2023 Update; Federal Register, “Annual Update of the HHS Poverty Guidelines,” 01/19/2023.
$0 $20,000 $40,000 $60,000 $80,000 $100,000
$30/HOUR
Wage Levels
$15/hour = $31,000 Minimum wage = $15,000 Living Wage (2 earners) = $98,000 Living Wage (1 earner) = $78,000
How do compare to wage levels?
Wage Levels
Source: US Census Bureau, 2021 American Community Survey; Massachusetts Institute of Technology, Department of Urban Studies and Planning, Amy Glasmeier, "Living Wage Calculator" 2023 Update; Federal Register, “Annual Update of the HHS Poverty Guidelines,” 01/19/2023.
$0 $20,000 $40,000 $60,000 $80,000 $100,000
$30/hour = $62,000 $15/hour = $31,000 Minimum wage = $15,000
100% FPL = $30,000 200% FPL = $60,000 300% FPL = $90,000 Living Wage (2 earners) = $98,000 Living Wage (1 earner) = $78,000
POVERTY LEVELS
What share of Tulsa area residents struggle financially?
Source: US Census Bureau, 2022 American Community Survey.
14.6% 33.3% 50.9%
Below 100% of Poverty
Below 200% of Poverty Below 300% of Poverty
Living Wage
Estimated
Below 300% of Poverty
How do TAUW Partner Nonprofits help with Financial Stability?


$80,332 $89,287 $74,804 $73,866 $66,928 $54,633 $53,884 $53,229 $$10,000 $20,000 $30,000 $40,000 $50,000 $60,000 $70,000 $80,000 $90,000
Hispanic Other
: US Census Bureau, 2022 American Community Survey.
Median Family Income by Race/Ethnicity, Tulsa MSA, 2022
Total NH White Asian Native American 2+ races
race Black Source
Poverty Rates by Race/Ethnicity, Tulsa MSA, 2022
Source: US Census Bureau, 2022 American Community Survey.
15% 28% 22% 21% 19% 18% 16% 11% Total Black Other race Hispanic Native American 2+ races Asian NH White
Home Ownership by Race/Ethnicity, Tulsa MSA, 2022
Source: US Census Bureau, 2022 American Community Survey.
66% 71% 69% 59% 59% 57% 55% 39% Total NH White Native American Asian Other race 2+ races Hispanic Black