This report was prepared by Tulsa Area United Way in partnership with the City of Tulsa. The Tulsa Equality Indicators 2024 Annual Report and data are available online at tulsaei.org.
Photo courtesy of City of Tulsa Communications Department
ANNUAL REPORT 2024
LETTER FROM MONROE NICHOLS
MAYOR, CITY OF TULSA
Dear Tulsans,
I am pleased to share the 7th edition of the City of Tulsa Equality Indicators Report. Over the years since the first Equality Indicators report was released in 2018, it has become an important tool that Tulsans from every sector and part of the city have used to advocate for change, focus resources, and drive decision-making. The report serves as a marker of our progress, as well as reminder of the work we will need to continue to ensure all Tulsans have opportunities to live their best lives.
This year’s report is being released at a time when we are full swing in implementing meaningful steps toward our ambitious goals to end homelessness by 2030; improve student outcomes and better the lives of our children, youth and families; expand economic opportunity for everyone in our city; make Tulsa the safest big city in America; increase affordable housing; and improve relations and co-governance models with our tribal governments. Many of the 54 indicators outlined in this report will be metrics we will monitor to ensure we are making progress on these key priorities and goals.
Being the first report of my administration, I’m pleased to see that Tulsa has improved its Equality Score since 2018 with the highest score yet at 43.09. This trend toward greater equality indicates we are closing disparities in some of these indicators such as homelessness by veteran status or business ownership by race. And yet, we are seeing gaps in other areas, such as the widening of inequality as it relates to child abuse and infant mortality rates. In both instances, the Equality Score is just part of the full story, and further research is needed to further understand these changes.
For example, a narrowing of a gap could be due to the group experiencing the worst outcome staying the same, and the group with the best outcome doing worse than before. An Equality Indicator is a great numerical reminder of what we mean by equity: outcome gaps closing and at the same time outcomes improving for all groups. And that is the lens I hope all Tulsans take who read this report and are worried about low scores in things like payday lending institutions or food deserts by geography.
This report also spurs questions about the macro factors impacting these outcomes, and we welcome these inquiries and look forward to digging into the data and exploring what actions we could take in the year ahead.
My biggest takeaway from all of this is that the Equality Indicators Report is just one piece of the bigger picture, that includes all of us. Every day, Tulsa’s nonprofit organizations, local businesses, faith-based institutions, and government workers are moving the needle on issues and matters of importance. I am grateful that we live in a city that has such dedicated and compassionate people and organizations who are driven to make a difference. While we have more work to do to ensure that every Tulsan, no matter their race, ethnicity, zip code or other identity, has an opportunity for a long, healthy life – I'm grateful that we’re charting the path forward, together, with a focus on a more equal and equitable Tulsa in mind.
Sincerely,
Monroe Nichols, IV Mayor of Tulsa
A LOOK BACK OVER THE PAST YEAR SINCE THE RELEASE OF THE 2023 REPORT
CONFRONTING HISTORIC RACISM
• Equity Dialogue facilitators hosted dialogues on the National Day of Racial Healing in January 2024. Training for facilitators was also held during Welcoming Week in September, increasing the number of facilitators by 35. Since 2018, the City of Tulsa has trained more than 130 facilitators and engaged over 500 Tulsans in dialogues.
• The City made its first identification of a victim from the 1921 Tulsa Race Massacre, C.L. Daniel. The City hosted a memorial service with his family present. Additionally, genealogy workshops for community members helped Tulsans understand how DNA analysis is used in the 1921 Mass Graves investigation. Also a burial map of Oaklawn Cemetery was completed as part of the City’s search for victims from the 1921 Tulsa Race Massacre — a move that further moves the needle on the City’s search and one that solidifies the City’s commitment to find answers from more than 100 years ago.
• The Beyond Apology Commission was established by Mayoral executive order to reconcile, restore, and unite Tulsa in a goal of shared prosperity for all Tulsans by advancing and restoring economic mobility and intergenerational wealth for the 1921 Race Massacre survivors, their descendants, and residents of North Tulsa, in particular the historic Greenwood District and surrounding neighborhoods. The Commission’s first deliverable was a recommendation for a housing reparations program, which was submitted to the Mayor on November 30th.
ECONOMIC OPPORTUNITY
• The Office of Financial Empowerment doubled the Financial Empowerment Center’s (FEC) capacity by bringing on a second provider partner. From the opening of the FEC to January 31, 2025, FEC counselors have seen 1,548 clients, held 4,704 counseling sessions, helped Tulsans reduce their non-mortgage debt by $1,582,075 and increase their savings by $579,746. Additionally, an FEC team member is at the Municipal Courthouse multiple days a week to schedule appointments. This program integration has resulted in 575 referrals and 316 active clients, leading to $33,699 in court fines forgiven.
• Progressed on the Kirkpatrick Heights - Greenwood Master Plan, which reserved 56 acres of publicly owned property in the Kirkpatrick Heights and Greenwood areas of North Tulsa for shared ownership and development. In 2024, the City codified a community governance structure for the land with the formal establishment of a Community Development Corporation (CDC) known as Greenwood Legacy corporation. The CDC is comprised of North Tulsa and Greenwood residents who will help decide what to do with the land, some of which the community lost due to the 1921 Tulsa Race Massacre.
• The Tulsa Women’s Commission continued their work to understand key barriers to women in the workforce, culminating in the publication of a comprehensive Childcare Access Report. The report compiles data illuminating the effects of childcare availability on the economy, stories of families struggling with lack of quality childcare options, and recommendations to employers to support working families.
• The U.S. Department of Commerce awarded the Tulsa Economic Development Corporation (TEDC) $3 million to continue construction and the development of Greenwood Entrepreneurship at Moton (GEM) — a new entrepreneurship hub in North Tulsa. The effort is revitalizing a historic building in North Tulsa and is expected to continue to create opportunity for North Tulsa and Greenwood residents for years to come.
• The Tulsa Housing Authority (THA) awarded $950,000 to PartnerTulsa to fund a facade grant program in the 36th Street North and Peoria corridors linked to the Envision Comanche Choice Neighborhoods program. This program provides an incentive to building owners or lessees to make exterior physical improvements in the area. Additionally, PartnerTulsa secured $1 million in additional commercial Revolving Loan Program capital for TEDC through THA and Housing and Urban Development (HUD) funds. Together, these awards represent about $2M in commercial revitalization.
• PartnerTulsa offered microgrants through partners Avanzando Juntos, Tulsa Development Authority (TDA), and TEDC to support dozens of small business owners grow or start their businesses in target areas identified by previous Equality Indicator Reports.
A LOOK BACK OVER THE PAST YEAR SINCE THE RELEASE OF THE 2023 REPORT
HOUSING
• Key recommendations of the Housing, Homelessness and Mental Health (3H) Task Force are implemented or ongoing, with more than 90% already underway or in progress. Some of the work includes progress on standing up a Residential Care Center, implementing a Pre-Approved Plans Program known as T-Town Home Catalog, and expanding Tulsa Fire Department Alternative Response Teams.
• Tulsa City Council passed a set of amendments to the zoning code designed to encourage more housing development in Tulsa. The amendments will allow more housing types in commercial districts, facilitate the conversion of office buildings and hotels to housing, and make it easier to build garage apartments and backyard cottages, among other changes.
• Mayor and City Council passed a resolution formally earmarking $75 Million of Improve Our Tulsa funds into five housing programs.
• The Office of the Mayor expanded organization capacity to address housing and homelessness by creating two key positions: Senior Advisor on Housing and Senior Advisor on Homelessness.
• Tulsa Day Center expanded accommodations and reduced barriers for individuals experiencing homelessness to access emergency shelter by building out a facility for animals, including kennels, a wash station, and more.
• Tulsa Housing Authority broke ground on 36N, the largest investment in affordable housing in Tulsa’s history. Formerly Comanche Park Apartments, 36N will be comprised of 545 mixed-income housing units, including single-family homes and mixed-use commercial space. The project offers former Comanche Park residents the first right to return and expands housing capacity by adding 274 additional units. Located at East 36th Street North and North Peoria Avenue, 36N will bring the first market-rate multifamily housing to this area of Tulsa.
• Mayor Nichols issued an executive order in February 2025 creating a Housing Permitting Tracker system, Community Builder Program, and Housing Acceleration Team—all aimed increasing affordable housing stock, reducing blighted properties, and reducing cost burden for developers.
PUBLIC HEALTH
• City of Tulsa completed year one of the four-year Substance Abuse and Mental Health Services Administration Children’s Mental Health Initiative (CMHI). This grant provides intensive home-based care and wraparound services for children and youth with or at-risk for severe emotional disturbance or severe mental illness and their families. Providers at Family & Children’s Services, Counseling & Recovery Services of Oklahoma, and Oklahoma Family Network enrolled more than 141 youth who received supports such as crisis stabilization, inpatient care transition, and in-home community-based services.
• Tulsa City Council approved funding to expand the Tulsa Fire Department’s Alternative Response Team 2 (ART-2), a dedicated unit designed to decrease high utilizers of the 911 system. ART-2 operates in Downtown Tulsa and decreases 911 medical call volume by providing advanced life support medical care while connecting individuals in need to crucial community services. The unit conducts wellness checks, provides outreach services, and educates the community.
• The Tulsa Sobering Center merged with Grand Mental Health’s Urgent Recovery Center to enable direct access to mental health and substance abuse services when being diverted from jail.
A LOOK BACK OVER THE PAST YEAR SINCE THE RELEASE OF THE 2023 REPORT
SERVICES
• The City hosted “City Hall on the Go” in Council District 1 to bring City services and information directly into neighborhoods. The event coincided with the Tulsa Dream Center’s Back to School Splash.
• Mayor Nichols issued an executive order to establish the Neighborhood Conditions Index (NCI) Pilot Program and cross-departmental task force to strengthen Tulsa’s neighborhoods. The program will pilot innovative neighborhood revitalization strategies, launch community workshops for residents to better understand NCI as it relates to their neighborhoods, and foster collaboration among residents, City departments, and community partners.
• The Mayor’s Office of Resilience and Equity partnered with local organizations Leadership Tulsa, El Centro, Uma Tulsa, Mastermind Organization and the League of Women Voters to offer voter and civic education workshops and a sixweek civic engagement academy for 60 immigrant residents to help demystify city government and encourage civic participation.
JUSTICE
• Tulsa Police Academy hosted a “Women In Policing” event to provide potential female recruits insight into benefits and opportunities available within Tulsa Police Department (TPD). Additionally, TPD increased recruitment from Historically Black Colleges and Universities and Hispanic Serving Institutions. These efforts led to a significant increase in Black, Hispanic/Latinx, and women applicants.
• TPD hosted a “Beyond the Badge” event inviting area residents between 18 and 45 years old to explore what a career in law enforcement could look like. Recruiters spoke at area high schools, colleges, and tech schools to bring a diverse group to the event.
• Staff from the Mayor’s Office of Resilience and Equity conducted training for all TPD patrol officers on the City’s Language Access Policy and interpretation resources to better serve residents with limited English proficiency.
• Tulsa Municipal Court hosted a "Clear Your Warrants" event helping individuals who had unpaid traffic and parking citations clear their outstanding fines and avoid additional fees or warrants.
• TPD partnered with ACTION Tulsa on an initiative to prevent firearms from being stolen from vehicles and used in violent crimes. The subsequent “Where’s your gun Wednesday?” media campaign resulted in a 30% reduction in thefts of firearms from vehicles.
• City of Tulsa, TPD, and partners were awarded a $2 million federal grant to launch the Tulsa Community-Based Youth Violence Initiative focused on mentorship and community engagement. Funds will help community groups reach young people and address some root causes of violence.
• TPD received a $2.5 million grant from the Department of Justice to further investigate sexual assault kits. The grant will allow the Tulsa Police Department to continue working on the prosecution of unsolved sexual assault cases. This is critical to enhancing the response to sexual assaults and ensuring justice for victims.
EXECUTIVE SUMMARY
THE TULSA EQUALITY INDICATORS 2024 ANNUAL REPORT
Tulsa’s seventh annual data report in the Equality Indicators series designed to measure and track the level of inequality in the areas of economic opportunity, education, housing, justice, public health, and services in Tulsa. This report was produced through the joint efforts of the City of Tulsa Mayor’s Office of Resilience and Equity and Tulsa Area United Way, using the Equality Indicators tool and methodology created in 2015 by the City University of New York Institute for State and Local Governance.
The purpose of the Tulsa Equality Indicators report is to inform community leaders, institutions, and residents about some of the most important disparities persistently and negatively impacting life for groups of Tulsans, helping focus public discourse around developing innovative and collaborative solutions that lead to more equitable opportunities and outcomes for all Tulsans.
SUMMARY OF 2024 SCORES
For 2024, Tulsa received an aggregate score of 43.09 out of 100 based on levels of equality measured across 54 indicators. Among the six themes, Education scored the highest at 55.11, followed by Economic Opportunity at 48.44, Housing at 45.11, Public Health at 41.11, Services at 38.33, and Justice at 30.44.
At 43.09, the total City Score for 2024 is 4.4 points higher than in 2018, and greater than the city score of any of the previous report years. This positive trend may be an indication that Tulsa is improving overall with regard to equality on the 54 indicators. Since Equality Indicators began in Tulsa in 2018, the city has shown increased scores in five of the six themes. Education has increased by 16 points, Economic Opportunity by 11 points, Housing by nearly four points, Services by two points, and Public Health by one point. The Justice theme has experienced a score decline of eight points since 2018. Five indicators in the 2024 report have scores of 100, indicating equality or a reversal of positions of advantage between the two comparison groups.
Highest scoring indicators:
Indicator 2: Business ownership by race (100)
Indicator 11: Chronic absenteeism by race (100)
Indicator 12: Dropping out by income (100)
Indicator 23: Homelessness by veteran status (100)
Indicator 39: VA appt. wait time vs ntl. avg. (100)
Indicators with greatest positive change scores:
Indicator 11: Chronic absenteeism by race (+67)
Indicator 12: Dropping out by income (+63)
Indicator 27: Housing complaints by geog. (+54)
Indicator 2: Business ownership by race (+48)
Indicator 39: VA appt. wait time vs ntl. avg. (+32)
Lowest scoring indicators:
Indicator 3: Payday loans and banks by geography (1)
Indicator 43: Food deserts by geography (1)
Indicator 33: Officer use of force by subject race (2)
Indicator 40: Infant mortality by race (2)
Indicator 24: Homelessness by disability status (16)
Indicators with greatest negative change scores:
Indicator 40: Infant mortality by race (-29)
Indicator 34: Child abuse & neglect vs. ntl. avg. (-29)
Indicator 17: Graduation by English proficiency (-20)
Indicator 24: Homelessness by disability status (-19)
Indicator 33: Officer use of force by subject race (-18)
IMPORTANT CONSIDERATIONS
HOW TO USE THIS REPORT
It is important to understand both the scope and the limitations of the Equality Indicators Report in order to properly interpret and make meaning of its contents. The report’s primary intent is to serve as a data tool to measure the extent of disparity over time between the most advantaged and the most disadvantaged population groups for each of 54 indicators. Equality scores are based specifically on the level of disparity. Scores should not be interpreted as an assessment of the overall well-being of Tulsa’s population. A high score means that the level of disparity between the groups being compared is relatively small, and a low score means that the level of disparity between the two groups is relatively large.
An increase or decrease in equality score does not necessarily indicate a comparable increase or decrease in well-being for the disadvantaged group. An increase in equality score (i.e. a decrease in disparity between two groups) may be caused by actual improvement in outcomes for the disadvantaged group, but it may also result from a decline in outcomes for the advantaged group, or some combination of the two. Both situations would generate improvement in the score. Likewise, a decrease in equality score (i.e. an increase in disparity between two groups) may be caused by either an actual decline in outcomes for the disadvantaged group or an improvement in outcomes for the advantaged group. Both situations would generate a lower score. To enable readers to identify the drivers behind an equality score, the data on which scores are based are included in the report.
The Equality Indicators report does not provide an analysis of what causes the reported disparities or prescribe a formula for resolving them. These objectives require research and dialogue beyond the scope of this report. However, this report can serve as a source of information to catalyze conversation and focus efforts within Tulsa toward producing a more equitable community.
DATA AVAILABILITY AND ADJUSTMENTS
As has been done in previous report years, The Tulsa Equality Indicators 2024 Annual Report draws from a wide variety of reliable data sources that range in vintage across multiple years. The data and scores labeled as the 2024 report year data in the indicator tables may, but generally do not, represent outcomes measured or collected in calendar year 2024. They represent outcomes measured during the most recent calendar or fiscal year for which data have been finalized and released by the data source.
In the event that new data were not available for an indicator at the time of data collection, the previous year’s data and score are repeated and used to calculate indicator, topic, theme, and city scores. The repeated data and scores appear in indicator tables. In the line graphs used to show trends in scores over time, report years with repeated scores are noted below the graph.
Each year, opportunities might arise to access better or more accurate data to measure the level of equality for a given indicator. Any changes in indicators are carefully considered after a review of available data and consultation with subject matter experts. When changes to indicators’ data or data sources are made, adjustments are also made to calculated values and scores of affected indicators, topics, themes and the city for all prior years.
Complete data sources for each indicator and a list of missing years of data can be found in Appendix B.
EQUALITY SCORES
All Tulsans do better when every Tulsan does better. Measuring and striving for equality leads us toward greater economic security, educational success, stable and secure housing, justice and safety, physical and mental well-being, and fair distribution of services for every Tulsan, which ultimately produces a more enriched quality of life for all Tulsans.
Tulsa’s overall equality score has increased every year since the inception of the Tulsa Equality Indicators series. At 43.09, the City score for 2024 is 4.4 points higher than in 2018, and 1.07 points higher than last year’s score, signifying gradual overall improvement in equality for the collection of indicators measured. Five of the six themes in the report show score improvement since 2018 – Education, Economic Opportunity, Housing, Services, and Public Health – while only the Justice theme has declined.
While the potential for relatively quick change in equality may be possible for some indicators through implementation of strategic policies and resources, change in equality of outcomes generally happens much more incrementally over a span of years. For example, the opening of a grocery store in a food desert can improve residents’ access to fresh food in a matter of months. Improvement in life expectancy, on the other hand, requires a multifaceted strategy targeting the many layers of social determinants of health which can take years, decades, or generations.
2024 INDICATOR SCORES
THEME 1 ECONOMIC OPPORTUNITY
THEME SCORES
Change Score 2018 to 2024: +11.22
The Economic Opportunity theme score of 48.44 in 2024 is more than 11 points higher than the baseline score of 37.22 from the 2018 report, and it is the second highest scoring theme this year. Generally, initiatives to boost economic growth in under-resourced communities in Tulsa have contributed to the improved score.
The theme score has been boosted in particular by reduced disparity in Indicator 2: Business ownership by race, which exhibited a reversal in positions of advantage for the two comparison groups. Prior to this year’s report, the Asian, Native Hawaiian and other Pacific Islander population group had the highest rate of business ownership in Tulsa, while the Black population group had the lowest. Data for this year’s report reveal that the rate of business ownership among Black workers in Tulsa now exceeds that of Asian, Native Hawaiian and other Pacific Islander workers, producing an equality score of 100 for this indicator, and helping to elevate the Economic Opportunity theme score.
An increasing rate of female business ownership and a lower rate of unemployment among Black Tulsans are also having positive impact on the improving Economic Opportunity theme score.
Marking the sixth consecutive year with at least a tenfold disparity, Indicator 3: Payday loans and banks by geography is a prime example of a disparity in opportunity for a group of Tulsans to thrive. Lack of access to traditional financial institutions like banks and credit unions, paired with a profusion of high interest charging predatory lenders magnify the financial hardship of many North Tulsa residents. By contributing to a cycle of poverty and undermining community wealth, dependence on predatory lending can negatively impact entire communities.
Economic opportunity is about the presence or absence of opportunities and barriers that affect an individual’s ability to realize economic security and stability. A multitude of interconnected factors impact an individual’s ability to achieve economic well-being, including many that are beyond the individual’s control. Some of these factors are:
• Availability of jobs paying a living wage;
• Access to non-predatory lending establishments;
• Income and wealth inequality;
• Minimum wage standards;
• Economic status of personal and professional networks.
An equal set of opportunities to succeed economically does not present itself to all people, nor do all people face the same barriers to economic success. Disparities in opportunities and barriers to economic success, along with the resulting disparities in outcomes are explored throughout the indicators of the Economic Opportunity theme.
Business
Living
Median
TOPIC 1: BUSINESS DEVELOPMENT
TOPIC SCORES
Change Score 2018 to 2024: +22.67
For a comprehensive list of all data sources and years used, please see Appendix B, page 64.
Indicator 1: Business ownership by gender
Business ownership: male compared to female workers
Indicator 2: Business ownership by race
Business ownership: Asian, Native Hawaiian & Other Pacific Islander (Asian/NHOPI) compared to Black workers
Comparison
The equality score for this indicator increased by 48 since 2018.
Black workers own businesses in Tulsa at a rate that exceeds that of Asian, Native Hawaiian & Other Pacific Islander workers.
Indicator 3: Payday loans & banks by geography
The equality score for this indicator decreased by 2 since
The ratio of banks and credit unions to payday lending businesses is 9 times higher in South Tulsa than in North Tulsa.
ECONOMIC OPPORTUNITY
TOPIC 2: EMPLOYMENT
TOPIC SCORES
Change Score 2018 to 2024: +6.67
For a comprehensive list of all data sources and years used, please see Appendix B, page 64.
Indicator 4: Unemployment by race Unemployment: Black compared to White
The equality score for this indicator increased by 19 since 2018. The unemployment rate for Black Tulsans is 58% higher than that for White Tulsans.
Indicator 5: Commute time by geography
Commute time of 30 minutes or more to work: North Tulsa compared to Midtown Tulsa residents
Comparison
Note:
The percentage of North Tulsa residents commuting 30 minutes or more to work is 86% higher than the percentage of Midtown Tulsa residents.
Indicator 6: High wage occupations by race
Note:
for
The percentage of White workers who are employed in high wage occupations is nearly 3 times the percentage of Hispanic/Latinx workers.
TOPIC 3: INCOME
TOPIC SCORES
Change Score 2018 to 2024: +4.34
Indicator 7: Living wage by geography Household
Indicator 8: Median household income by race
Median household income: White compared to Black households
The equality score for this indicator increased by 1 since 2018.
Median household income of White households is 76% greater than that of Black households in Tulsa.
Indicator 9: Poverty by educational attainment
The poverty rate of Tulsans with a high school diploma or less is nearly 3 times higher than the rate of those with a bachelor's degree or higher.
THEME 2 EDUCATION
THEME SCORES
Change Score 2018 to 2024: +16.11
The Education theme scored 55.11 in 2024, an improvement of more than 16 points since the 2018 baseline score of 39.00. Scoring the highest of all six themes in the 2024 report, the Education theme’s score improvement is driven largely by scores of 100 for two indicators – Indicator 11: Chronic absenteeism by race, and Indicator 12: Dropping out by income.
Prior to the pandemic, disparity in chronic absenteeism was shrinking as Native American students’ rate of chronic absenteeism declined and that of Asian students rose. While rates peaked for both student groups at the beginning of the pandemic, the rate for Native American students has declined more steadily, to the point of a reversal in positions of advantage – Native American students now have a chronic absenteeism rate lower than that of Asian students.
The rates of lower income and higher income 12th graders dropping out of school had been gradually inching nearer to one another, ending in equal rates during the first year of the pandemic. Since then, the gradual decline in dropout rate for lower income 12th graders has resumed, while the rate for higher income students has increased, resulting in a reversal in positions of advantage – lower income 12th graders now have a lower dropout rate than do higher income 12th graders.
Weighing on the Education theme score in the opposite direction is Indicator 17: Graduation by English proficiency, whose score fell 20 points from the baseline score to 60 in this year’s report. Four-year graduation rates for the comparison groups, non-English Learner students and English Learner students, both plummeted in this year’s report to record low levels since the inception of the Tulsa Equality Indicators.
Education outcomes that were negatively impacted by the COVID-19 pandemic continue to be slow to return to pre-pandemic levels. This trend has created critical challenges for districts across the nation, including Tulsa Public Schools, many of which are evident in the underlying data of the Education theme’s indicators.
The indicators in the Education theme explore disparities in barriers and opportunities for educational success and more equitable student outcomes. The focus ranges from elementary through postsecondary education. A solid foundation during the elementary and secondary years is crucial for future academic and career success, and postsecondary education or training is essential for accessing employment opportunities that can leverage an adequate wage for financial security.
Education Theme = 55.11/100
Abbreviated indi ator name
Suspensions by race
Chronic absenteeism by race
Dropping out by income
Abbreviated indi ator name
Emergency teacher cert by geog
Postsec particip by Eng pro
School report card score by income
Abbreviated indi ator name
Third grade reading pro by income
Graduation by English pro iciency
College completion by race
Due to a lack of new data, the following indicators repeat previous years’ data: Emergency Teacher Certification by Geography (2020, 2022), Post Secondary Opportunities Participation by English Proficiency (2019, 2021), School Report Card Score by Income (2019, 2021) and Graduation by English Proficiency (2021).
EDUCATION
TOPIC 1: IMPEDIMENTS TO LEARNING
TOPIC SCORES
Change Score 2018 to 2024: +44.33
For a comprehensive list of all data sources and years used, please see Appendix B, page 64.
Indicator 10: Suspensions by race
School suspensions: Black compared to Hispanic/Latinx Tulsa Public Schools (TPS) students
The equality score for this indicator increased by 3 since 2018.
The suspension rate of Black TPS students is more than 2½ times the rate of Hispanic/Latinx TPS students.
Indicator 11: Chronic absenteeism by race
Missing 10% or more of school days per school year: Native American compared to Asian Tulsa Public Schools (TPS) students
The equality score for this indicator increased by 67 since 2018.
The chronic absenteeism rate of Native American TPS students is slightly lower than that of Asian TPS students.
Indicator 12: Dropping out by income
Dropping
The
The dropout rate of lower income TPS 12th graders is slightly lower than that of higher income TPS 12th graders.
2:
QUALITY AND OPPORTUNITY
TOPIC SCORES
Change Score 2018 to 2024: +10.67
Indicator 13: Emergency teacher certification by geography
Employment
The 13 other
Note:
public school districts in Tulsa County include: Berryhill, Bixby, Broken Arrow, Collinsville, Glenpool, J enks, Keystone, Liberty, Owasso, Sand Springs, Skiatook, Sperry, and Union.
Indicator 14: Postsecondary opportunities participation by English proficiency
Participation in postsecondary opportunities: non-English Learner compared to English Learner Tulsa Public Schools (TPS) juniors and seniors
Comparison Group A:
The equality score for this indicator increased by 20 since 2018.
The percentage of TPS Non-English Learner students who participate and complete a postsecondary opportunity is 50% higher than TPS English Learner students.
Note: Postsecondary opportunities participation is the successful completion of an approved college or career -readiness program, which include: advanced placement or international baccalaureate (AP/IB) coursework, concurrent or dual enrollment, internships, and CareerTech coursework leading to industry certification.
Indicator 15: School report card score by income
Average School Report Card scores: higher income compared to lower income Tulsa Public Schools (TPS) schools
Comparison Group B:
The equality score for this indicator decreased by 5 since 2018.
Higher income TPS schools receive School Report Card scores that are more than 3½ times the scores of lower income TPS schools.
Note: Oklahoma’s “School Report Card” assesses school performance across multiple indicators, including academic achievement and growth, chronic absenteeism, progress in English language proficiency, postsecondary opportunities, and graduation. Higher income schools for this indicator refer to those with less than 60% of students qualifying for free and reduced lunch, and lower income schools refer to those with at least 90% of students qualifying.
EDUCATION
TOPIC 3: STUDENT ACHIEVEMENT
TOPIC SCORES
Change Score 2018 to 2024: -6.67
Indicator 16: Third grade reading proficiency by income
Indicator 17: Graduation by English proficiency
Four-year graduation: non-English Learner compared to English Learner Tulsa Public Schools (TPS) students
Comparison Group A:
Comparison Group B:
The equality score for this indicator decreased by 20 since 2018.
The high school graduation rate of TPS non-English Learners is 50% higher than that of English Learners.
Note: Due to new data availability, comparison group A has been changed from "all TPS students" used in previous report years to "nonEnglish Learner students," allowing distinct groups for comparison. Past report years' data have been updated to reflect the new group.
Indicator 18: College completion by race
College entry without earning a degree: Black compared to Hispanic/Latinx adults age 25+
Comparison Group A:
Comparison Group B:
The equality score for this indicator increased by 1 since 2018.
Black Tulsans begin college but do not graduate with a degree at a rate that is twice the rate of Hispanic/Latinx Tulsans.
THEME 3 HOUSING
THEME SCORES
Change Score 2018 to 2024: +3.78
The Housing theme received a score of 45.11 in 2024, an increase of nearly four points from the baseline score of 41.33 in 2018. Several key indicators have had a substantial positive impact on the improved Housing theme score, while one indicator has had the opposite effect.
With housing complaints increasing from South Tulsa and decreasing from North Tulsa per capita since 2018, the equality score for Indicator 27: Housing complaints by geography has reflected equality or near equality for the past three report years.
Although the share of both lower income and higher income Tulsans that are rent-burdened has increased, rent burden has increased more rapidly among higher income Tulsa renters, triggering a 17-point score improvement since 2018 for Indicator 25: Rent burden by income.
While rates of homelessness have declined for both veterans and non-veterans since 2018, the latest counts reveal that veterans are now less likely than non-veterans to experience homelessness, producing a score of 100 for Indicator 23: Homelessness by veteran status
The equality score for another indicator related to homelessness, Indicator 24: Homelessness by disability status, has decreased since 2018, reflecting growing disparity in this measure. While the rate of homelessness among adults with disabilities has increased, the rate among adults without disabilities has declined.
All across the nation, cities continue to face a serious crisis of a lack of affordable housing. The problem directly affects both homeowners and renters, who may struggle with meeting other basic needs such as food, health care, educational opportunities, child care, and transportation. This impacts whole communities. The limited ability of people to spend money on other consumer goods and services impacts job growth and economic development across all sectors of the local economy.
The indicators in this theme consider housing from three perspectives: those who own a home, those who rent, and those who are unhoused. Shelter is a basic human need, without which other concerns cannot be effectively addressed. Once in stable housing, an individual has greater capacity to pursue education or employment, to work towards better health, or in the case of homeownership to increase wealth.
Housing Theme = 45.11/100
HOUSING
TOPIC 1: HOMEOWNERSHIP
TOPIC SCORES
Change Score 2018 to 2024: -2.00
For a comprehensive list of all data sources and years used, please see Appendix B, page 64.
Indicator 19: Homeownership by race
Homeownership: White compared to Black householders
The equality score for this indicator decreased by 7 since 2018.
The percentage of White Tulsans who own their home is double that of Black Tulsans.
Indicator 20: Home purchase loan denial by race
Home purchase loan denials: Native American compared to Asian applicants
Native American applicants are denied a home loan at a rate that is more than 3 times the rate of Asian applicants.
Indicator 21: Housing cost burden by income
Spending
Lower income homeowners experience housing cost burden at a rate that is nearly 5 times the rate of higher income homeowners.
TOPIC 2: HOMELESSNESS
TOPIC SCORES
Change Score 2018 to 2024: -4.00
For a comprehensive list of all data sources and years used, please see Appendix B, page 64.
Indicator 22: Youth homelessness by race Homelessness: Native American compared to White youths age 13 to 24
Note:
Indicator 23: Homelessness by veteran status
Note:
Indicator 24: Homelessness by disability status
Note:
HOUSING
TOPIC 3: TENANT STABILITY
TOPIC SCORES
Change Score 2018 to 2024: +17.33
Indicator 25: Rent burden by income
Indicator 26: Evictions by race
Evictions: renter households in majority non-white compared to majority white neighborhoods
Comparison Group
The equality score for this indicator decreased by 19 since 2018.
The eviction rate of majority non-White neighborhoods is twice the rate of majority White neighborhoods.
Note: Census tracts that are more than 50% White are considered majority White, and those that are less than 50% White are considered majority non-White.
Indicator 27: Housing complaints by geography
Housing
The equality score for this indicator increased by 54 since 2018.
Housing complaints come from North Tulsa at a rate almost equal to that of South Tulsa.
THEME 4 JUSTICE
THEME SCORES
Change Score 2018 to 2024: -8.00
With the lowest equality score of all six themes in 2024, and the only theme to have a 2024 score that is lower than the first year of Tulsa Equality Indicators, the Justice theme score of 30.44 fell eight points from the baseline score of 38.44 in 2018. Seven of the nine indicators in this theme exhibited decreased scores in this year’s report.
One of the lowest scoring indicators across all themes, Indicator 33: Officer use of force by subject race dropped 18 points since 2018 for a score of 2 this year. While the rate of officer use of force towards Black Tulsans has increased to a new high level after a period of reductions, use of force towards Hispanic/Latinx Tulsans has declined overall since 2018. Falling by 29 points since 2018, the score for Indicator 34: Child abuse and neglect by comparison to national average reflects an overall increase in the rate of substantiated cases of child abuse and neglect in Tulsa County and a decrease in the national average since 2018.
Some positive momentum toward greater equality is seen in Indicator 31: Tulsa Police Department workforce by race A six-point score increase since 2018 reflects a modest reduction in employment of White officers and a modest increase in employment of Hispanic/Latinx officers.
Several research studies have found that people of color across the United States frequently experience disproportionate levels of policing, stops, searches, issuing of citations, uses of force, convictions, sentencing severity, uses of alternatives to incarceration, arrests for failure to pay fines and fees, and youth sentenced as adults, that do not align with higher levels or severity of crime committed. Many sources further suggest systemic racism and implicit bias throughout the entire criminal justice system significantly contribute to these disproportionate levels.*
The Justice theme explores disparities in arrests, law enforcement workforce, officer use of force, and violence. Using data to better understand issues in policing, safety, and violence enables city and law enforcement leaders to work collaboratively with the public to objectively examine trends and patterns to help identify root causes and develop strategies to reduce disparities.
Note on calculating scores for indicators related to arrests and police use of force: As in previous Equality Indicators reports, Black and White populations were selected as comparison groups for indicators 28 and 29 based on community feedback and to reflect contemporary discourse around the disparity in arrest rates by race. The method used in this report for Indicator 33, “Officer use of force by subject race," calculates the police use of force rate by race as the number of incidents per the population count for each race. The Tulsa Police Department calculates the rate using an alternative method, framing the use of force rate as the number of incidents per the arrest count for each race.
JUSTICE
TOPIC 1: ARRESTS
TOPIC SCORES
Change Score 2018 to 2024: -7.00
For a comprehensive list of all data sources and years used, please see Appendix B, page 64.
Indicator 28: Juvenile arrests by race Arrests: Black compared to White youths under 18
Indicator 29: Adult arrests by race Arrests: Black compared to White adults
Black adults are arrested at a rate that is nearly 2½ times the rate of White adults.
Note: As in previous Equality Indicators reports, the comparison of Blacks to Whites was intentionally selected to reflect th e contemporary discourse surrounding this specific indicator.
Indicator 30: Female arrests by comparison to national average Arrests: females
in Tulsa compared to national average
Females are arrested in Tulsa at a rate that is almost double that of females nationwide.
JUSTICE
TOPIC 2: LAW ENFORCEMENT
TOPIC SCORES
Change Score 2018 to 2024: -7.67
For a comprehensive list of all data sources and years used, please see Appendix B, page 64.
Indicator 31: TPD workforce by race
Tulsa Police Department (TPD) workforce: White compared to Hispanic/Latinx employees
Indicator 32: TPD workforce by gender
Tulsa Police Department (TPD) workforce: male compared to female employees
Comparison Group
Comparison Group B:
Tulsa Police Department employs 5 times more males than females per capita.
Indicator 33: Officer use of force by subject race
Black Tulsans experience officer use of force at a rate that is more than 9½ times the rate of Hispanic/Latinx Tulsans.
Note: Rate of officer use of force in this report is calculated by using the total population of each comparison group as the denominator. The Tulsa Police Department calculates the measure through an alternative method, using number of arrests for each comparison group as the denominator.
TOPIC 3: SAFETY AND VIOLENCE
TOPIC SCORES
Change Score 2018 to 2024: -9.34
For a comprehensive list of all data sources and years used, please see Appendix B, page 64.
Indicator 34: Child abuse and neglect by comparison to national average
Substantiated reports of child abuse and neglect: Tulsa County compared to national average
and neglect rate in Tulsa County is more than twice the national average.
Indicator 35: Homicide victimization by race
Comparison Group B:
Black Tulsans are victims of homicide at a rate that is 3 times the rate of White Tulsans.
Note: As in previous Equality Indicators reports, the comparison of Blacks to Whites was intentionally selected to reflect th e contemporary discourse surrounding this specific indicator.
Indicator 36: 911 domestic violence calls by geography
Comparison Group B:
Domestic violence calls to 911 originate from North Tulsa at a rate that is 2½ times the rate from South Tulsa per capita.
THEME 5 PUBLIC HEALTH
THEME SCORES
Change Score 2018 to 2024: +1.22
Aside from slightly exceeding the 2018 baseline score, at 41.11, the 2024 Public Health theme score is lower than every other prior report year for this theme. A score of 100 for one indicator was offset by substantial declines in the scores of two others.
For the fourth year in a row, Indicator 39: Veterans Affairs appointment wait time by comparison to national average scored a 100 as a lesser share of Tulsa area veterans waited an excessive period of time for appointments at local VA clinics than the national average.
At the other end of the scale, we find that the score for Indicator 40: Infant mortality by race has plummeted 29 points from the baseline to a score of 2. Data in this year’s report indicate that Black infants were lost at the highest rate recorded during the seven years of the Tulsa Equality Indicators project, while White infants experienced the lowest rate over the period, producing a nearly tenfold disparity.
Disparity has also increased for Indicator 41: Life expectancy by geography, reflected in a 13-point decline since 2018. While average life expectancy past retirement age has declined for both South Tulsa and North Tulsa residents, the decline has been steeper for North Tulsans, prompting the lowest equality score for this indicator in the seven years of analysis.
Disparities in access to fresh food continue to plague Tulsa as evidenced by the massive differences in rates of North and South Tulsa households living in food deserts in Indicator 43: Food deserts by geography
Health is a product of interrelated individual and systemic or structural factors, including genetic predispositions, community and environment, policies and practices of health care systems, and quality of health care. Those factors and many others are referred to as social determinants of health (SDOH) –the social, economic and physical characteristics defining the communities in which people live, work, and play. Varying experiences with SDOH can produce disparate health outcomes among different groups of people.
The Public Health theme explores disparities in a wide range of health arenas, including access to health care, personal behaviors impacting health, social determinants of health, mental health, and mortality.
Public Health Theme = 41.11/100
L…Abbreviated indi ator name
Health insurance by race
Emergency room use by geography
VA appt wait time vs national avg
L…Abbreviated indi ator name
Infant mortality by race
Life expectancy by geography
CardioV disease mortality by race
L…Abbreviated indi ator name
Food deserts by geography
Mentally unhealthy days by income
Smo ing by geography
Due to a lack of new data, the following indicators repeat previous years’ data: Emergency Room Use by Geography (2020, 2021, 2022), Veterans Affairs Appointment Wait Time by Comparison to National Average (2022) and Food Deserts by Geography (2019).
TOPIC 1: HEALTH CARE ACCESS
TOPIC SCORES
Change Score 2018 to 2024: +12.33 Indicator 37: Health insurance by race
For a comprehensive list of all data sources and years used, please see Appendix B, page 64.
The equality score for this indicator increased by 4 since 2018. The percentage of White Tulsans with health insurance is 32% higher than Hispanic/Latinx Tulsans.
Indicator 38: Emergency room use by geography
Emergency room (ER) visits: North Tulsa compared to South Tulsa residents
Comparison Group A:
Comparison Group B:
The equality score for this indicator increased by 1 since 2018.
North Tulsa residents use the ER at more than twice the rate of South Tulsa residents.
Indicator 39: Veterans Affairs appointment wait time by comparison to national average
Veterans waiting extended period for appointment: Tulsa VA clinics compared to national average
Comparison Group B:
Ratio of Comparison Group A to
The equality score for this indicator increased by 32 since 2018.
The percentage of veterans waiting an extended period of time for an appointment at Tulsa's VA clinics is slightly lower than the national average.
Note: Due to changes in quality standards regarding VA clinic wait time, for the 2024 report, extended period of time refers to a wait time of more than 20 days for primary care and mental health care, and more than 28 days for specialty care. In prior report years, extended period of time referred to a wait time of more than 30 days for all care types.
PUBLIC HEALTH
TOPIC 2: MORTALITY
TOPIC SCORES
Change Score 2018 to 2024: -12.67
For a comprehensive list of all data sources and years used, please see Appendix B, page 64.
Indicator 40: Infant mortality by race
Indicator 41: Life expectancy by geography
Life expectancy after retirement age: South Tulsa compared to North Tulsa residents
The equality score for this indicator decreased by 13 since 2018.
South Tulsa residents live more than 3½ times longer past retirement age than North Tulsa residents.
Note: Age of retirement as defined by the U.S Social Security Administration at the time of reporting is 66.
Indicator 42: Cardiovascular disease mortality by race
Death from major cardiovascular disease: Black compared
Comparison Group B:
The
Black Tulsans die from major cardiovascular disease at a rate that is 2½ times that of Hispanic/Latinx Tulsans.
Note: Data for this indicator are for Tulsa County.
PUBLIC HEALTH
TOPIC 3: WELL-BEING
TOPIC SCORES
Change Score 2018 to 2024: +4.00
For a comprehensive list of all data sources and years used, please see Appendix B, page 64.
Indicator 43: Food deserts by geography
Households living in food deserts: North Tulsa compared to South Tulsa households
Comparison Group A:
Indicator 44: Mentally unhealthy days by income
14+ days of poor mental health in past month: lower income compared to higher income Tulsa County adults
Comparison Group A:
The equality score for this indicator increased by 16 since 2018.
Lower income adults experience 14+ days of poor mental health per month at a rate that is 73% higher than higher income adults.
Note: The survey question reads: "thinking about your mental health, which includes stress, depression, and problems with emo tions, for how many days during the past 30 days was your mental health not good?" For this measure, lower income is defined as adults earning less than $50,000 annually; higher income as adults earning $50,000 or more. Data for this indicator are for Tulsa County.
Indicator 45: Smoking by geography
Smoking: North Tulsa compared to South Tulsa residents
of Comparison Group A to Comparison Group B
The equality score for this indicator decreased by 4 since 2018.
Smoking prevalence in North Tulsa is 79% higher that in South Tulsa.
THEME 6 SERVICES
THEME SCORES
Change Score 2018 to 2024: +2.11
With a modest increase of just over two points from the baseline score in 2018, the Services theme 2024 score of 38.33 positions Services at second to lowest score among the six themes. Disparities in indicators analyzed in this theme have important implications for the distribution of voice and power of life-changing resources, and of goods, services, and opportunities dependent on the availability of transportation.
We have observed somewhat consistent improvement over the years in internet access for Tulsans generally as measured by Indicator 47: Internet access by race. Overall, the shares of both Hispanic/Latinx and White households that lack access to a computer with high speed internet have been declining since 2018. While White households in Tulsa are still less likely than Hispanic/Latinx households to lack broadband, the disparity is shrinking, resulting in a 19-point score improvement since 2018.
The topics included in the Services theme involve conditions contributing to Tulsans’ overall quality of life. Access to key resources can make a massive difference in making other opportunities possible; having representation through voting or through public service can give voice to those not normally heard; and effective transportation options can eliminate barriers to educational and employment opportunities.
Dev
Homeowner
TOPIC 1: RESOURCES
TOPIC SCORES
Change Score 2018 to 2024: +2.33
For a comprehensive list of all data sources and years used, please see Appendix B, page 64.
Indicator 46: Vacant housing by geography
Vacant housing units: North Tulsa compared to South Tulsa
The equality score for this indicator decreased by 7 since 2018.
Housing vacancy rate in North Tulsa is twice that of South Tulsa.
Indicator 47: Internet access by race
Lack of access to computer with high speed internet at home: Hispanic/Latinx compared to White households
Comparison Group A:
The equality score for this indicator increased by 19 since 2018.
The percentage of Hispanic/Latinx Tulsans without access to a computer with high speed internet at home is 56% higher than the percentage of White Tulsans.
Note: This indicator represents the proportion of households that either have no computer or have a
speed internet.
but no access
Indicator 48: Services for persons with developmental disabilities by comparison to national average
Increase in state funding needed to serve persons with intellectual or develomental disabilities (IDD) on waiting list: OK compared to ntl. avg.
Group B:
The equality score for this indicator decreased by 5 since 2018.
The percent increase in state funding needed to serve Oklahomans with developmental disabilities is nearly 5 times the national average.
Note: Full definition of indicator: the ratio of the percent increase needed in Medicaid waiver and/or Intermediate Care Faci lity for Individuals with Intellectual Disabilities (ICF/IID) programs in order to serve persons with intellectual and developmental disabilities who are on the waiting list for Medicaid-waiver-funded long-term supports and services (LTSS) for Oklahoma to national average.
TOPIC 2: POLITICAL EMPOWERMENT
TOPIC SCORES
Change Score 2018 to 2024: -1.00
For a comprehensive list of all data sources and years used, please see Appendix B, page 64.
Indicator 49: Government representation by race Membership on City of Tulsa Authorities, Boards and Commissions (ABCs): White compared to Hispanic/Latinx residents
Comparison Group B:
The equality score for this indicator decreased by 2 since 2018.
White Tulsans are represented on Tulsa Authorities, Boards, and Commissions at a rate that is more than 2½ times the rate of Hispanic/Latinx Tulsans.
Indicator 50: Voter turnout by geography
Participation in last general election: South Tulsa compared to North Tulsa voting age citizens
Comparison Group A:
Comparison Group B:
The equality score for this indicator decreased by 2 since 2018.
Voter turnout in South Tulsa is nearly twice that of North Tulsa.
Note: Voter turnout for this indicator is measured as those voting in the last general election at the time of data collectio n. The 2024 report data reflect voter turnout data in the November 2024 election.
Indicator 51: Neighborhood and homeowner associations by geography
Neighborhood
Comparison Group B:
(NHA):
The
for this
South Tulsa has 2½ times the number of Neighborhood and Homeowner Associations as East Tulsa per capita.
TOPIC 3: TRANSPORTATION
TOPIC SCORES
Change Score 2018 to 2024: +5.00
For a comprehensive list of all data sources and years used, please see Appendix B, page 64.
Indicator 52: Bus stop concentration by geography Bus stops: Midtown Tulsa compared to South Tulsa
The equality score for this indicator increased by 9 since 2018.
Midtown Tulsa has 3 times as many bus stops per capita as South Tulsa.
Indicator 53: Commute time by mode of transportation
Commute time of less than 30 minutes: private vehicle compared to public transportation
The equality score for this indicator decreased by 0 since 2018.
The percentage of private vehicle commuters traveling less than 30 minutes to work is more than 2½ times that of public transportation commuters.
Note: For this indicator, commute time to work does not include persons who work from home.
Indicator 54: Vehicle access by race
Lack of vehicle access: Black compared to White households
The equality score for this indicator increased by 6 since 2018.
The percentage of Black householders without access to a vehicle is 2½ times that of White householders.
Source: U.S. Census Bureau, 2023 1-year (city) and 5-year (regions) American Community Survey. Note: The sum of regions' populations do not equal the City of Tulsa's population because zip code boundaries do not align with city boundaries.
TULSA EQUALITY
INDICATORS REGIONS WITH OVERLAY OF
This map shows the boundaries of the 80 Neighborhood Statistical Areas defined by the City of Tulsa’s Neighborhood Conditions Index (NCI) in relation to Equality Indicator regions.
The NCI provides detailed demographic and socioeconomic data as well as information about land use, transportation, economic development, access to social and cultural opportunities, public services and much more for every Tulsa neighborhood.
While Tulsa Equality Indicators regions are based on zip codes, NCI areas are based on census tracts, producing boundary lines that don’t necessarily align. NCI regions 46 and 47 are located within large zip codes that are associated primarily with other incorporated places.
Learn more Tulsa’s Neighborhood Conditions Index and access reports at https://tulsaplanning.org/ neighborhoods/nci/
Map Label Neighborhood Statistical Area
APPENDIX B DATA SOURCES
THEME 1: ECONOMIC OPPORTUNITY
Topic 1: Business Development
Indicator 1. Business ownership by gender: U.S. Census Bureau, 2016, 2017, 2018, 2019, 2021, 2022, & 2023 American Community Survey 1-Year Estimates
Indicator 2. Business ownership by race: U.S. Census Bureau, 2016, 2017, 2018, 2019, 2021, 2022, & 2023 American Community Survey 1-Year Public Use Microdata Sample (PUMS)
Indicator 3. Payday loans & banks by geography: Data Axle Reference Solutions, U.S. Historical Businesses Database, 2017, 2018, 2019, 2020, 2021, 2022, & 2023
Topic 2: Employment
Indicator 4. Unemployment by race: U.S. Census Bureau, 2016, 2017, 2018, 2019, 2021, 2022, & 2023 American Community Survey 1-Year Estimates
Indicator 5. Commute time by geography: U.S. Census Bureau, 2016, 2017, 2018, 2019, 2021, 2022, & 2023 American Community Survey 5-Year Estimates
Indicator 6. High wage occupations by race: U.S. Census Bureau, 2016, 2017, 2018, 2019, 2021, 2022, & 2023 American Community Survey 1-Year Estimates
Topic 3: Income
Indicator 7. Living wage by geography: U.S. Census Bureau, 2016, 2017, 2018, 2019, 2021, 2022, & 2023 American Community Survey 5-Year Estimates
Indicator 8. Median household income by race: U.S. Census Bureau, 2016, 2017, 2018, 2019, 2021, 2022, & 2023 American Community Survey 1-Year Estimates
Indicator 9. Poverty by educational attainment: U.S. Census Bureau, 2016, 2017, 2018, 2019, 2021, 2022, & 2023 American Community Survey 1-Year Estimates
THEME 2: EDUCATION
Topic 1: Impediments to Learning
Indicator 10. Suspensions by race: Tulsa Public Schools unpublished data, School Years 2017, 2018, 2019, 2020, 2021, 2022, & 2024
Indicator 11. Chronic absenteeism by race: Tulsa Public Schools unpublished data, School Years 2017 & 2020; Oklahoma State Department of Education, Oklahoma School Report Cards, School Years 2018, 2019, 2022, 2023, & 2024
Indicator 12. Dropping out by income: Tulsa Public Schools unpublished data, School Years 2016, 2017, 2018, 2019, 2020, 2022, & 2023
Topic 2: Quality and Opportunity
Indicator 13. Emergency teacher certification by geography: Oklahoma State Department of Education, Emergency Certifications webpage, School Years 2017, 2018, & 2021; Oklahoma State Department of Education, Unpublished State Board of Education meeting report, Feb. 2024, Dec. 2024; Oklahoma State Department of Education public records: Certified Staff Directory
Indicator 14. Postsecondary opportunities participation by english proficiency: Oklahoma State Department of Education, Oklahoma School Report Cards, School Years 2018, 2019, 2022, 2023, & 2024
Indicator 15. School report card score by income: Oklahoma State Department of Education, Oklahoma School Report Cards, School Years 2018, 2019, 2022, 2023, & 2024; Oklahoma State Department of Education, Low Income Report, School Years 2018, 2019, 2022, 2023, & 2024
Topic 3: Student Achievement
Indicator 16. Third grade reading proficiency by income: Tulsa Public Schools unpublished data, School Years 2017, 2018, 2019, 2021, 2022, 2023, & 2024
Indicator 17. Graduation by English proficiency: Oklahoma State Department of Education, Oklahoma School Report Cards, School Years 2017, 2018, 2019, 2021, 2022, & 2024
Indicator 18. College completion by race: U.S. Census Bureau, 2016, 2017, 2018, 2019, 2021, 2022, & 2023 American Community Survey 1-Year Estimates
THEME 3: HOUSING
Topic 1: Homeownership
Indicator 19. Homeownership by race: U.S. Census Bureau, 2016, 2017, 2018, 2019, 2021, 2022, & 2023 American Community Survey 1-Year Estimates
Indicator 20. Home purchase loan denial by race: Federal Financial Institutions Examination Council, Home Mortgage Disclosure Act Database, Conventional Purchases by Race, 2016, 2017, 2018, 2019, 2020, 2022 & 2023
Indicator 21. Housing cost burden by income: U.S. Census Bureau, 2016, 2017, 2018, 2019, 2021, 2022, & 2023 American Community Survey 1-Year Estimates
Topic 2: Homelessness
Indicator 22. Youth homelessness by race: Homeless Management Information System, Annual Homeless Assessment Report to Congress, for annual time periods beginning Oct. 1, 2016 to Sept. 30, 2020; A Way Home for Tulsa Interactive Data Dashboard, for annual time periods beginning Oct. 1, 2021 to Sept. 30, 2023; Tulsa Housing Solutions unpublished data for Oct. 1, 2023 to Sept. 30, 2024
Indicator 23. Homelessness by veteran status: Homeless Management Information System, Annual Homeless Assessment Report to Congress, for annual time periods beginning Oct. 1, 2016 to Sept. 30, 2020; A Way Home for Tulsa Interactive Data Dashboard, for annual time periods beginning Oct. 1, 2021 to Sept. 30, 2023; Tulsa Housing Solutions unpublished data for Oct. 1, 2023 to Sept. 30, 2024
Indicator 24. Homelessness by disability status: Homeless Management Information System, Annual Homeless Assessment Report to Congress, for annual time periods beginning Oct. 1, 2016 to Sept. 30, 2020; A Way Home for Tulsa Interactive Data Dashboard, for annual time periods beginning Oct. 1, 2021 to Sept. 30, 2023; Tulsa Housing Solutions unpublished data for Oct. 1, 2023 to Sept. 30, 2024
Topic
3: Tenant Stability
Indicator 25. Rent burden by income: U.S. Census Bureau, 2016, 2017, 2018, 2019, 2021, 2022, & 2023 American Community Survey 1-Year Estimates
Indicator 26. Evictions by race: The Eviction Lab, 2015 & 2016; Open Justice Oklahoma, Oklahoma Policy Institute, unpublished data for calendar years 2019, 2020, & 2023
Indicator 27. Housing complaints by geography: Tulsa Health Department unpublished data, 2017, 2018, 2019, 2020, 2021, 2022, & 2023
THEME 4: JUSTICE
Topic
1: Arrests
Indicator 28. Juvenile arrests by race: Oklahoma State Bureau of Investigation unpublished data, 2016, 2017, 2018, 2019, 2020, 2022, & 2023
Indicator 29. Adult arrests by race: Oklahoma State Bureau of Investigation unpublished data, 2016, 2017, 2018, 2019, 2020, 2022, & 2023
Indicator 30. Female arrests by comparison to national average: Oklahoma State Bureau of Investigation unpublished data, 2016, 2017, 2018, 2019, 2020, 2022, & 2023; Federal Bureau of Investigation, Uniform Crime Reporting: National Incident-Based Reporting System, 2016, 2017, 2018, 2019, 2020, 2022, & 2023
Indicator 33. Officer use of force by subject race: Tulsa Police Department, 2016, 2017, 2018, 2019, & 2022 Internal Affairs Annual Report; Tulsa Police Department unpublished data, 2020; Tulsa Police Department, 2023 Annual Report
Topic 3: Safety and Violence
Indicator 34. Child abuse and neglect by comparison to national average: Oklahoma Department of Human Services, FY 2015, 2016, 2017, 2018, 2019, 2021, & 2023 Annual Report Statistical Tables; U.S. Department of Health & Human Services, Administration for Children and Families, Administration on Children, Youth and Families, Children's Bureau, Child Maltreatment 2015, 2016, 2017, 2018, 2019, 2021, & 2023
Indicator 35. Homicide victimization by race: City of Tulsa unpublished data, 2016, 2017, 2018, 2019, 2020, 2022 & 2023
Indicator 36. 911 Domestic violence calls by geography: City of Tulsa unpublished data, 2016, 2017, 2018, 2019, 2020, 2022 & 2023
THEME 5: PUBLIC HEALTH
Topic 1: Health Care Access
Indicator 37. Health insurance by race: U.S. Census Bureau, 2016, 2017, 2018, 2019, 2021, 2022 & 2023 American Community Survey 1-Year Estimates
Indicator 38. Emergency room use by geography: Tulsa Health Department unpublished data, 2017, 2018, 2022 & 2023
Indicator 39. Veterans Affairs appointment wait time by comparison to national average: U.S. Dept. of Veterans Affairs, Completed Appointment Wait Times National, Facility, and Division Level Summaries, Measured from Preferred Date for Reporting Periods Ending: Oct. 2017, 2018, 2019, 2020, and Feb. 2021; FOIA request to U.S. Dept. of Veterans Affairs, VSSC Access to Care PowerBI dashboard, Feb. 2024
Topic 2: Mortality
Indicator 40. Infant mortality by race: Oklahoma State Department of Health, Center for Health Statistics, Health Care Information, Vital Statistics 2016, 2017, 2018, 2019, 2020, 2021, & 2023
Indicator 41. Life expectancy by geography: Tulsa Health Department unpublished data, 2013-15, 2014-16, 2015-17, 2016-18, 2017-19, 2019-21, & 2021-23
Indicator 42. Cardiovascular disease mortality by race: Oklahoma State Department of Health, Center for Health Statistics, Health Care Information, Vital Statistics 2016, 2017, 2018, 2019, 2020, 2021, & 2023
Indicator 44. Mentally unhealthy days by income: Oklahoma State Department of Health, Center for Health Statistics, Health Care Information, Behavioral Risk Factor Surveillance System 2015-16, 2016-17, 2017-18, 2018-19, 2019-20, 2021-22, & 2022-23
Indicator 45. Smoking by geography: Centers for Disease Control and Prevention, 500 Cities & Places: Local Data for Better Health, Model-based estimates for current smoking among adults aged >=18 years, 2017, 2018, 2019, 2020, 2021, 2023, & 2024 releases; Behavioral Risk Factor Surveillance System (BRFSS), 2015, 2016, 2017, 2018, 2019, 2021, & 2022
THEME 6: SERVICES
Topic 1: Resources
Indicator 46. Vacant housing by geography: U.S. Census Bureau, 2016, 2017, 2018, 2019, 2021, 2022, & 2023 American Community Survey 5-Year Estimates
Indicator 47. Internet access by race: U.S. Census Bureau, 2016, 2017, 2018, 2019, 2021, 2022, & 2023 American Community Survey 1-Year Estimates
Indicator 48. Services for persons with developmental disabilities by comparison to national average: Larson, S. A., et al, 2017, 2018, 2019, 2020, & 2021, In-home and residential long-term supports and services for persons with intellectual or developmental disabilities: Status and trends 2014 through 2018; Larson, S. A., et al, 2022, 2024, Long-term supports and services for persons with intellectual or developmental disabilities: Status and trends through 2019, 2020
Topic 2: Political Empowerment
Indicator 49. Government representation by race: City of Tulsa open data, 2017, 2018, 2019, 2021, 2022, 2023, & 2024
Indicator 50. Voter turnout by geography: Oklahoma State Election Board data request, November 2016, 2018, & 2020 elections; Oklahoma State Election Board, OK Election Data Warehouse, November 2022, & 2024 general elections
Indicator 51. Neighborhood and homeowner associations by geography: City of Tulsa open data, 2017, 2018, 2019, 2021, 2022, 2024, & Jan. 2025
Indicator 53. Commute time by mode of transportation: U.S. Census Bureau, 2016, 2017, 2018, 2019, 2021, 2022, & 2023
American Community Survey 1-Year Estimates
Indicator 54. Vehicle access by race: U.S. Census Bureau, 2016, 2017, 2019, 2021, 2022, & 2023 American Community Survey 1-Year Public Use Microdata Sample (PUMS)
Source Notes: In addition to indicators using the U.S. Census Bureau's American Community Survey (ACS) as the primary data source as noted above, ACS data were used in the calculation of rates for many other indicators. For example, ACS population counts for youth by race were used to calculate rates of homelessness for indicator 22, Youth homelessness by race. ACS 1-year estimates were used when possible, but in several instances 5-year estimates were required. For indicator 53, Commute time by mode of transportation, 5-year estimates were used because of excessively high margins of error associated with the 1-year estimates. Five-year estimates were used for all indicators making regional comparisons due to unavailability of ACS 1-year estimates at the zip code level.
Ten of the 54 indicators have one or more years for which new data were not available at the time of report preparation for that particular year. In those instances, the prior year's data and scores were repeated and were used to calculate topic, theme, and city scores. Indicators with repeated year(s) of data include:
Indicator
Repeated Data by Report Year
Emergency teacher certification by geography 2020, 2022
Postsecondary opportunities participation by English proficiency 2019, 2021
School report card score by income 2019, 2021
Graduation by English proficiency 2021
Evictions by race 2022, 2024
Emergency room use by geography 2020, 2021, 2022
Veterans Affairs appointment wait time by comparison to national average 2022
Food deserts by geography 2019
Voter turnout by geography 2019, 2023
Vehicle access by race 2020
*References: Erisman, Kerry L. . 2024. “Inequality in the Criminal Justice System and Accountability.” Legal Studies Blog, American Military University, June 4, 2024, https://www.amu.apus.edu/area-of-study/legal-studies/resources/inequality-in-the-criminal-justice-system-andaccountability/;
Ghandnoosh, Nazgol, and Celeste Barry. 2023. “One in Five: Disparities in Crime and Policing.” The Sentencing Project, November 2, 2023, https://www.sentencingproject.org/reports/one-in-five-disparities-in-crime-and-policing/; Hinton, Elizabeth, LeShae Henderson, and Cindy Reed. 2018. “An Unjust Burden: The Disparate Treatment of Black Americans in the Criminal Justice System.” Vera Institute of Justice Evidence Brief, May 2018, https://www.vera.org/publications/for-the-record-unjustburden;
“Racial Disparities Persist in Many U.S. Jails.” The Pew Charitable Trusts, May 16, 2023, https://www.pewtrusts.org/en/research-and-analysis/ issue-briefs/2023/05/racial-disparities-persist-in-many-us-jails; Pierson, Emma, Camelia Simoiu, Jan Overgoor, Sam Corbett-Davies, Daniel Jenson, Amy Shoemaker, Vignesh Ramachandran, Phoebe Barghouty, Cheryl Phillips, Raci Shroff, and Sharad Goel. 2020. “A Large-scale Analysis of Racial Disparities in Police Stops across the United States.” Nature Human Behaviour, May 4, 2020, https://www.nature.com/articles/s41562-020-0858-1; Human Rights Watch. 2019. “Get on the Ground!”: Policing, Poverty, and Racial Inequality in Tulsa, Oklahoma.” https://www.hrw.org/ report/2019/09/12/get-ground-policing-poverty-and-racial-inequality-tulsa-oklahoma/case-study-us; Eberhardt, Jennifer L. 2019. Biased: Uncovering the Hidden Prejudice That Shapes What We See, Think, and Do. New York: Viking.
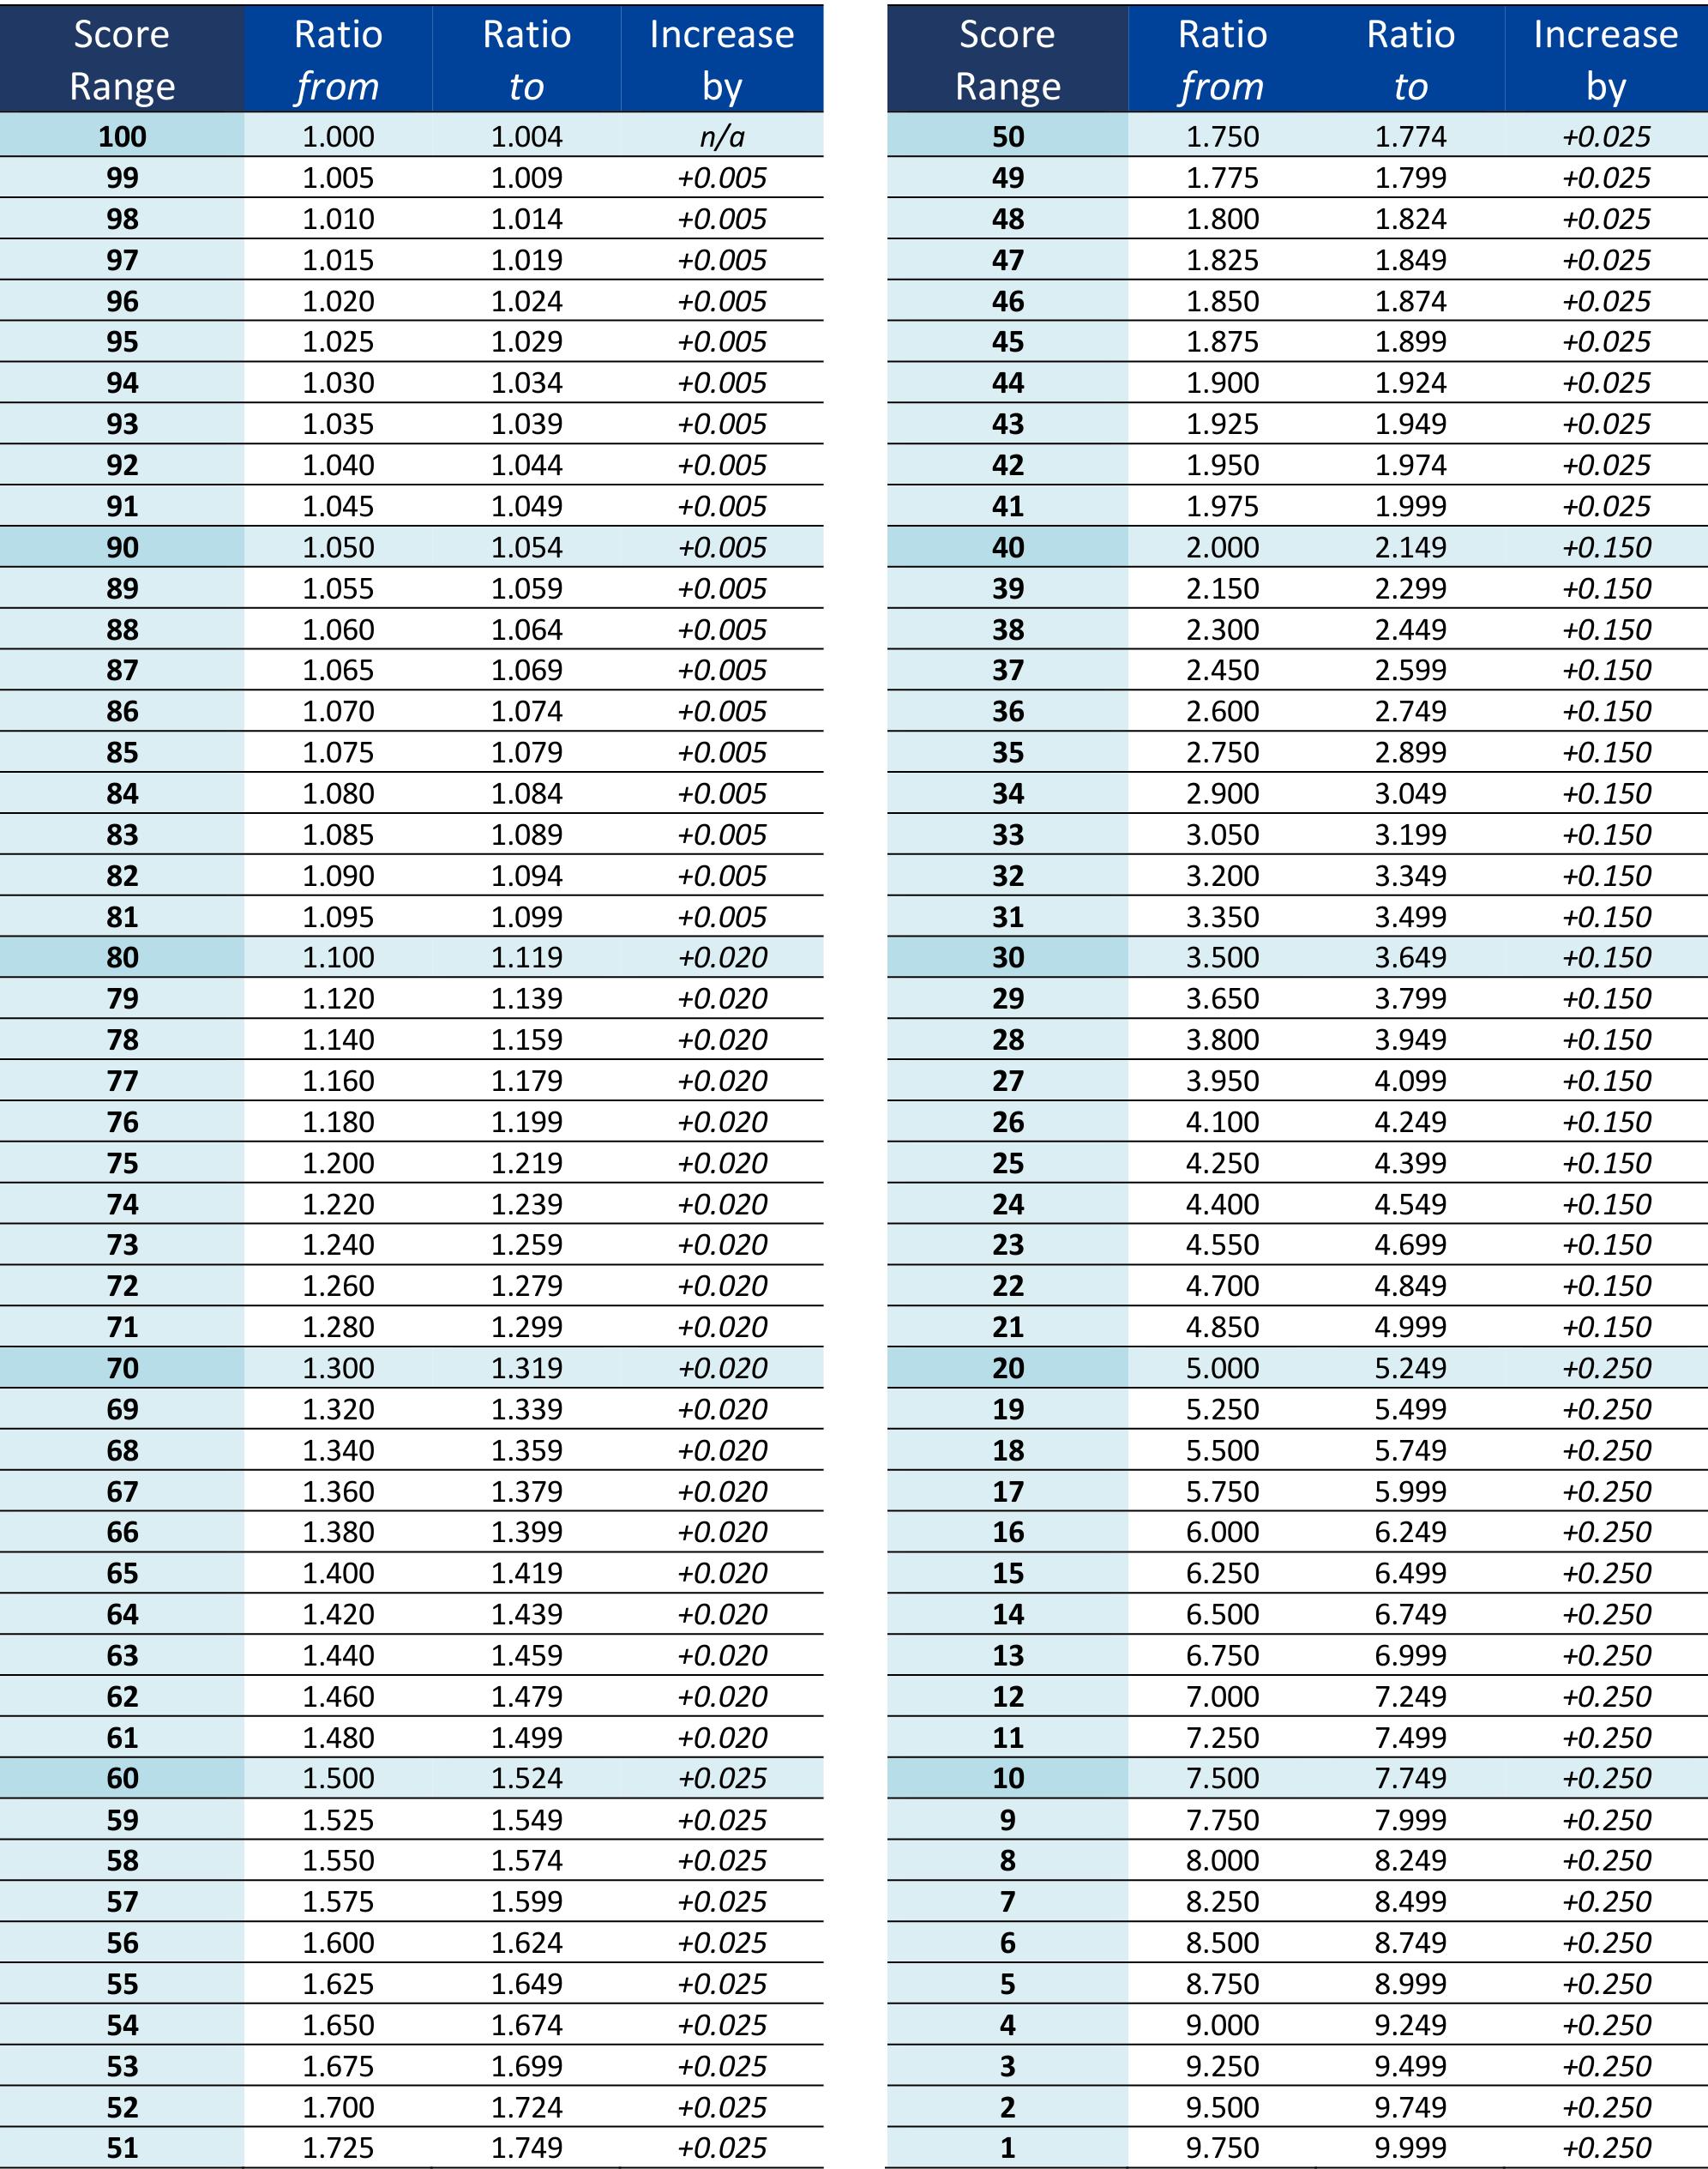
APPENDIX C
RATIO TO SCORE CONVERSION TABLE
APPENDIX D INDICATOR INDEX
THEME 1: ECONOMIC OPPORTUNITY
Topic 1: Business Development
Indicator 1: Business Ownership by Gender
Indicator 2: Business Ownership by Race
Indicator 3: Payday Loans & Banks by Geography
Topic 2: Employment
Indicator 4: Unemployment by Race
Indicator 5: Commute Time by Geography
Indicator 6: High-wage Occupations by Race
Topic 3: Income
Indicator 7: Living Wage by Geography
Indicator 8: Median Household Income by Race
Indicator 9: Poverty by Educational Attainment
THEME 2: EDUCATION
Topic 1: Impediments to Learning
Indicator 10: Suspensions by Race
Indicator 11: Chronic Absenteeism by Race
Indicator 12: Dropping Out by Income
Topic 2: Quality and Opportunity
Indicator 13: Emergency Teacher Certification by Geography
Indicator 14: Postsecondary Opportunities Participation by English Proficiency
Indicator 15: School A-F Report Card Score by Income
Topic 3: Student Achievement
Indicator 16: Third Grade Reading Proficiency by Income
Indicator 17: Graduation by English Proficiency
Indicator 18: College Completion by Race
THEME 3: HOUSING
Topic 1: Homeownership
Indicator 19: Homeownership by Race
Indicator 20: Home Purchase Loan Denial by Race
Indicator 21: Housing Cost Burden by Income
Topic 2: Homelessness
Indicator 22: Youth Homelessness by Race
Indicator 23: Homelessness by Veteran Status
Indicator 24: Homelessness by Disability Status
Topic 3: Tenant Stability
Indicator 25: Rent Burden by Income
Indicator 26: Evictions by Race
Indicator 27: Housing Complaints Geography
THEME 4: JUSTICE
Topic 1:
Indicator
Topic 2:
Indicator
Topic 3: Safety and Violence
Indicator
THEME 5: PUBLIC HEALTH
Topic
Topic 2: Mortality
Indicator
Topic 3: Well-being
Indicator
THEME 6: SERVICES Topic 1:
Topic 2: Political Empowerment
Indicator
Topic 3: Transportation
Indicator
CONTRIBUTORS
NARRATIVE
Krystal Reyes, Deputy Mayor, City of Tulsa
Lexi Bollis, Resilience and Equity Program Administrator, City of Tulsa
Melanie Poulter, Director of Research and Data, Tulsa Area United Way
PROJECT MANAGEMENT, DATA CURATION
Melanie Poulter, Director of Research and Data, Tulsa Area United Way
DATA ENGINEERING
Chris Anrig, Data Analyst, Tulsa Area United Way
DATA VISUALIZATION
Dan Rooney, Systems Analyst, City of Tulsa
LAYOUT AND DESIGN
Saif Khan, Designer/Consultant, Spark Collaborative LLC
Carlos Moreno, Project Manager, Spark Collaborative LLC
WEB CONTENT MANAGEMENT
Kim Meloy, Web Content and Social Media Manager, City of Tulsa
ACKNOWLEDGMENTS
The Tulsa Equality Indicators team would like to thank the following people and organizations for their subject matter expertise and assistance with data collection and analysis which helped make this report possible:
• Alisia Myers, Neighborhood Liaison, City of Tulsa Department of City Experience
• Amanda Fullerton, Data Analyst, Tulsa Health Department
• Christopher Cordova, Statistical Research Specialist, Statistical Analysis Center, Oklahoma State Bureau of Investigation
• Colin Medwick, Data Strategist, Tulsa Public Schools
• Olivia Denton Koopman, Chief Data and Policy Officer, Housing Solutions
• Tamara Franklin, Crime and Intelligence Unit Manager, City of Tulsa Police Department – Forensic Laboratory Division