


Measuring change toward greater equality in Tulsa
ANNUAL REPORT 2023

This report was prepared by the Tulsa Area United Way in partnership with the City of Tulsa. The Tulsa Equality Indicators 2023 Annual Report and data are available online at tulsaei.org.
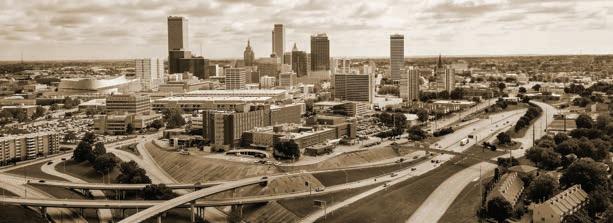
Photo courtesy of City of Tulsa Communications Department
TABLE OF CONTENTS

Letter from G.T. Bynum, Mayor, City of Tulsa 4 A Look Back over the Past Year 5 Executive Summary 8 Important Considerations 9 Equality Scores 11 Theme 1: Economic Opportunity 14 Topic 1: Business Development 16 Topic 2: Employment 18 Topic 3: Income 20 Theme 2: Education 22 Topic 1: Impediments to Learning 24 Topic 2: Quality and Opportunity 26 Topic 3: Student Achievement 28 Theme 3: Housing 30 Topic 1: Homeownership 32 Topic 2: Homelessness 34 Topic 3: Tenant Stability 36 Theme 4: Justice 38 Topic 1: Arrests 40 Topic 2: Law Enforcement 42 Topic 3: Safety and Violence 44 Theme 5: Public Health 46 Topic 1: Health Care Access 48 Topic 2: Mortality 50 Topic 3: Well-being 52 Theme 6: Services 54 Topic 1: Resources 56 Topic 2: Political Empowerment 58 Topic 3: Transportation 60 Appendix A: Tulsa Regions 62 Appendix B: Data Sources 64 Appendix C: Ratio to Score Conversion Table 68 Appendix D: Indicator Index 69 Contributors and Acknowledgments 71
tulsaei.org | 3
ANNUAL REPORT 2023
LETTER FROM G.T. BYNUM
MAYOR,
CITY OF TULSA
Dear Tulsans,
I am pleased to share the sixth edition of our Equality Indicators Report. Over these six years, this report has been a tool our city has used to understand where we are making progress in closing disparities and where we need to do more work. Our aim in publishing a report like this has not changed – it is to show our commitment to measure progress towards equality in Tulsa. Our efforts to advance equity, resilience, and welcoming are helping us move in that direction.

When we first released this report in 2018, our city was embarking on a journey to name historical inequities that have impacted social and economic outcomes, and to organize efforts, strategies, and resources to do something to address them. At that time, we launched the Resilient Tulsa strategy, created the office of resilience and equity, established an immigrant and refugee inclusion plan, and implemented dozens of initiatives to help support our communities access resources, supports, and to engage with city government. Through those plans and strategies, we aimed to normalize conversations that were difficult to have about our past. Each edition of our Equality Indicators report has helped us do that normalizing work. Without a common language of words or numbers, we can’t identify our challenges and most certainly not identify our progress.
Each report includes progress on 54 indicators related to health, education, justice, housing, services, and economic opportunity. But we have also done more than just measure and report – we have increased capacity in Tulsa to make meaning of this data. Our community has had conversations via our equity dialogues and through our Equality Indicators Learning summits. We have created conversations among hundreds of individuals through multiple interactive learnings series, and we have amplified the work of dozens of nonprofit and government offices that are helping to address the issues we see in the data. We have reached Tulsans from all parts of our city to help connect the data to action.
It is my hope that Tulsa will continue to take an honest look at where we are in improving outcomes in education, justice, housing, services, health, and economic opportunity for all Tulsans. The next generation of Tulsans has a baseline to work with thanks to this report. Thank you to the many Tulsans, the staff at nonprofit organizations, and the public servants at various city and other government agencies, who work every day to make sure we are making progress towards equality. No one report and no one number or score can tell the story of Tulsa’s journey to address racial inequities, but this report is a piece of that story. We have laid the groundwork for how cities should be looking to measure their own disparities. I look forward to seeing Tulsa progress and lead in this space.
Overall, Tulsa has improved its Equality Score since 2018 with increases in education, public health, economic opportunity, and housing themes. It is my hope that Tulsans will continue to use these scores to look at ways to ensure that every Tulsan, no matter their race, ethnicity, zip code, or other identity, has an opportunity for a healthy life. Thank you to our vast and robust network of non-profit organizations, local businesses, faith-based institutions, and government partners, who are making Tulsa better every day.
Department 4 | tulsaei.org
Photo courtesy of City of Tulsa Communications

A LOOK BACK OVER THE PAST YEAR
SINCE THE RELEASE OF THE 2022 REPORT
CONFRONTING HISTORIC RACISM
• The Kirkpatrick Heights Greenwood Master Plan Steering Committee formally endorsed the formation of a Community Development Corporation (CDC) as the governance model to ultimately manage the redevelopment of 56 acres of the historic Greenwood neighborhood, which will ensure that the community’s vision for the neighborhood is implemented.
• In 2023, Equity Dialogue facilitators hosted six dialogues that took place during the National Day of Racial Healing in January and during May and June at various libraries. Training for facilitators was also held during Welcoming Week in September to increase the number of bilingual facilitators. Since 2018 the City of Tulsa has trained more than 100 Tulsans to facilitate Equity Dialogues, hosted more than 50 dialogues, and reached over 500 people.
• Completed the third full excavation at Oaklawn Cemetery as part of the City’s search for victims from the 1921 Tulsa Race Massacre — a step that further moves the needle on the City’s search and one that solidifies the City’s commitment to find answers from more than 100 years ago. As part of the genetic genealogy portion of the investigation, six surnames and locations of interest have been identified by Intermountain Forensics, the Utah-based laboratory assisting the City with DNA and genealogical analysis. The City of Tulsa and Intermountain Forensics announced the need for additional participation in the genealogical process, which continues to this day.
• The City created an Asian Affairs Commission to recognize Tulsa’s growing Asian community. The Mayor’s Office of Resilience and Equity (MORE) established a working group of 26 Asian leaders to help create the new Commission, which was approved by the City Council. The Commission’s first meeting was held in January 2024.
ECONOMIC OPPORTUNITY
• Celebrated $245 million in new investments that were made in Tulsa during the second year of operation of the City’s new economic development arm, PartnerTulsa (formerly Tulsa Authority for Economic Opportunity or TAEO).
• Broke ground on a new entrepreneurship incubator that will be located in the historic Moton Hospital on E. Pine St. and N. Greenwood Ave. Greenwood Entrepreneurship at Moton (GEM) is a $9 million center that will eliminate a source of neighborhood blight and catalyze business growth in North Tulsa. The project is made possible by a $4 million contribution from the City of Tulsa and in partnership with the Tulsa Economic Development Corporation.
• The Office of Financial Empowerment (OFE) began the process to expand the Financial Empowerment Center’s (FEC) capacity by bringing on a second provider partner. This addition will increase the number of FEC counselors serving Tulsans from four to seven once fully implemented. In partnership with several agencies, the OFE also provided outreach and education opportunities to help Tulsans prepare for the return to repayment of federally held student loans which had previously been paused due to the pandemic. In 2023, the OFE coordinated the integration of the FEC with utilities department to help customers become current who have fallen behind on their payments. In addition, the OFE led a program integration with Municipal Court to determine future scalability. Clients who participate in this program can have a portion or all their fines and fees forgiven.
• Mayor G.T. Bynum and the Tulsa City Council appropriated $1 million in American Rescue Plan Act funds to seed capital improvements to launch a new business incubator for small businesses and entrepreneurs in East Tulsa (i.e. Tulsa Global District), an area with high rates of immigrant entrepreneurship. This business incubator will be the first in Oklahoma to include robust programmatic support to launch and scale immigrant businesses and serve as a model for inclusive economic growth.
• Progressed on the Kirkpatrick Heights - Greenwood Area Master Plan, which includes revitalizing 56 acres of publicly owned property in the Kirkpatrick Heights and Greenwood areas of North Tulsa. Thanks to Tulsa voters who passed the third round of Improve Our Tulsa, $7 million is available to begin implementation of plan priorities.
• The Tulsa Women’s Commission continued their Women in the Workforce initiative to research and understand the key barriers to women in the workforce and childcare and collect stories of women and families struggling with lack of quality childcare options.
tulsaei.org | 5
A LOOK BACK OVER THE PAST YEAR SINCE THE RELEASE OF THE 2022 REPORT

HOUSING
• Exceeded our two-year $500 million Housing Challenge goal in under one year, with the total sitting at more than $526.95 million at the end of 2023. This total captures all types of housing projects (new construction, renovations, conversions) and a variety of single-family, multi-family, and everything in-between. Established a housing fund in excess of $100 million thanks to voters approving the third Improve Our Tulsa sales tax package. This is the largest public commitment to housing construction in Tulsa history.
• The City committed $900,000 to a Tulsa Economic Development Program that will provide a revolving loan fund to developers to provide affordable housing to people with Housing Choice Vouchers.
• Announced nine program and policy steps to address homelessness and public safety in coordination with the Housing, Homelessness and Mental Health (3H) Task Force, all of which are either funded, underway, or completed.
• Continued progress on major housing projects across the city, including significant steps on the renovation of the Historic Laura Dester site in the Pearl District into 72 affordable housing units, and the groundbreaking of Black Wall Street Square, a modern development of townhomes in North Tulsa that pays homage to the traditional brownstone architecture, a hallmark of the historic 1920s Greenwood District and Black Wall Street.
• Received 16 proposals totaling $31 million in requested funding and 1,600 total housing units, in response to the Affordable Housing Trust Fund RFP. Seven projects were ultimately recommended for loan funding totaling $6.0 million representing 547 total units, with 510 of those being affordable units.
• Redeployed nearly $5 million in loan funds to two developers who submitted successful proposals to support housing in Downtown Tulsa.
• MORE staff helped individuals access resources to help them recover from the June 2023 windstorm by coordinating three Emergency Repair Grant Workshops held at three regional libraries in East, West, and North Tulsa in July, August, and September.
• Created a Multi-Family Housing Team consisting of two Code Enforcement Officers and one Assistant Fire Marshal to enforce nuisance, property maintenance, zoning and fire codes for multi-family housing complexes. The team has established a multifamily housing list that includes complexes of four units or more, and has worked on more than 70 cases since the creation of the program.
PUBLIC HEALTH
• Tulsa welcomed the opening of its second Costco in Council District 3, unlocking a major food desert in North Tulsa.
• The City hired its first Chief Mental Health Officer to oversee a city-wide strategy on mental health. This new position is responsible for applying a mental health lens to the city’s work and increasing collaboration among mental health programs, crisis response systems, and related services.
• Partnered with Healthy Minds Policy Initiative to secure a $4 million federal grant to improve the system of care for youth mental health through the Substance Abuse and Mental Health Services Administration Children’s Mental Health Initiative (CMHI). This grant provides intensive home-based care and wraparound services for children and youth with or at-risk for a severe emotional disturbance or severe mental illness and their families. Using evidence-based interventions, supporting coordination of care, increasing access to specialized services, and developing family and youth informed policy and practice, Tulsa’s CMHI provides comprehensive care to high need children and youth, and their families.
• Broke ground on the new Oklahoma Psychiatric Care Center, a $70 million and 140,000 square-foot facility. The facility will be part of a new academic medical district on Downtown’s west side, where it will be built next to the new Veterans Affairs hospital and OSU Medical Center. The City committed $4 million in American Rescue Plan Act funding to the project.
6 | tulsaei.org
6 | tulsaei.org
A LOOK BACK OVER THE PAST YEAR SINCE THE RELEASE OF THE 2022 REPORT

SERVICES
• The City hosted “City Hall on the Go” in Council District 2 to bring City services and information directly into neighborhoods.
• The City of Tulsa and immigrant serving nonprofits secured a grant to help alleviate the transportation barriers Afghan refugees face by helping prepare for and obtain drivers licenses. A total of 95 individuals were served and all received driving permits. In addition, contextualized English classes for driver’s education were created and served 24 individuals in these classes. The grant supported 39 individuals to receive their driver licenses.
• The City of Tulsa awarded $6.9 million in American Rescue Plan Act funding to 37 local nonprofits to develop and implement programs that respond to the public health emergency or lessen the negative economic impact of the pandemic for disproportionately impacted citizens.
• Piloted a new Alternative Response Team in Downtown Tulsa, sending firefighters and mental health caseworkers to assist people experiencing a non-violent mental health crisis.
• Opened Hope Playground in September, Oklahoma’s largest and first entirely inclusive playground at Whiteside Park for children with all abilities. Through a public private partnership with The Sanford & Irene Burnstein Family Foundation, the City of Tulsa constructed the site work and amenities for the playground which was funded by the Burnstein Foundation’s generous donation.
• The Tulsa Human Rights Commission voted to approve the creation of a 2SLGBTQ+* Committee, as a standing committee of the commission.
JUSTICE
• The Tulsa Police Department officially launched the Integrated Response Team (IRT) to embed Family and Children’s Services clinicians at each patrol division during 3rd shift (roughly M-F from 1:30 pm - 9:00 pm).
• Building on the success of the Public Safety Degree Pathway Partnership with OSU-Tulsa, in 2023 the Tulsa Police Department finalized degree pathway programs with four other universities, including a Hispanic Serving Institution. TPD also began to work on recruiting pipelines in Kansas and Arkansas.
• The Tulsa Police Recruiting unit worked with local high schools and universities to bring students participating in athletic programs to the Police Academy to work out with officers and connect with those serving them in the community.
• In 2023, the Tulsa Police Academy hosted a “Women In Policing” event, as well as a “Welcome to Policing” day to garner more interest in the community for careers in law enforcement. The Tulsa Police Department also sent women serving as leaders in the department to the National Association of Women Law Enforcement Executives conference and the International Association of Chiefs of Police (IACP) Women’s leadership meeting.
• Tulsa Municipal Court hosted Amnesty Days and "Clear Your Warrants" events helping over 500 individuals who had unpaid traffic and parking citations clear their outstanding fines and avoid additional fees or warrants.
* Two-spirit, lesbian, gay, bisexual, transgender, queer, intersex, asexual
tulsaei.org | 7
EXECUTIVE SUMMARY

THE TULSA EQUALITY INDICATORS 2023 ANNUAL REPORT is Tulsa’s sixth annual data report in the Equality Indicators series designed to measure and track the level of inequality in the areas of economic opportunity, education, housing, justice, public health, and services in Tulsa. This report was produced through the joint efforts of the City of Tulsa Mayor’s Office of Resilience and Equity and Tulsa Area United Way, using the Equality Indicators tool and methodology created in 2015 by the City University of New York Institute for State and Local Governance.
The purpose of the Tulsa Equality Indicators report is to inform community leaders, institutions, and residents about some of the most important disparities persistently and negatively impacting life for groups of Tulsans, helping focus public discourse around developing innovative solutions that lead to more equitable opportunities and outcomes for all Tulsans.
SUMMARY OF 2023 SCORES
For 2023, Tulsa received an aggregate score of 42.37 out of 100 based on levels of equality measured across 54 indicators. Among the six themes, Education scored the highest at 51.56, followed by Public Health at 47.67, Housing at 43.33, Economic Opportunity at 42.11, Services at 36.00, and Justice at 33.56.
At 42.37, the total City Score for 2023 is 3.68 points higher than in 2018, and greater than the City score of any of the previous report years. This positive trend may be an indication that Tulsa is improving with regard to equality on the 54 indicators. Over the past six years, Tulsa has shown increased scores in four of the six themes. Education has increased by over 12 points, Public Health by almost eight points, Economic Opportunity by nearly five points, and Housing by two points. The Justice and Services themes have experienced score declines of nearly five points and less than a point, respectively, since 2018.
Indicators with the five highest scores in the 2023 report include:
• Housing complaints by geography, with score of 100
• Veterans Affairs appointment wait time by comparison to national average, with score of 100
• Chronic absenteeism by race, with score of 91
• Dropping out by income, with score of 78
• Female arrests by comparison to national average, with score of 74
Indicators with the five lowest scores include:
• Payday loans and banks by geography, with score of 1
• Officer use of force by subject race, with score of 11
• Tulsa Police Department workforce by gender, with score of 18
• Housing cost burden by income, with score of 19
• Homelessness by disability status, Homicide victimization by race, and Food deserts by geography, with scores of 20
Indicators with the five greatest positive change scores from the baseline in 2018 to 2023 include:
• Chronic absenteeism by race, with an increase of 58
• Housing complaints by geography, with an increase of 57
• Dropping out by income, with an increase of 41
• Veterans Affairs appointment wait time by comparison to national average, with an increase of 32
• Food deserts by geography, with an increase of 19
Indicators with the five greatest negative change scores from the baseline in 2018 to 2023 include:
• Homelessness by veteran status, with a decrease of 30
• Child abuse and neglect by comparison to national average, with a decrease of 25
• Evictions by race, with a decrease of 19
• Graduation by English proficiency, with a decrease of 17
• Homicide victimization, with a decrease of 16
8 | tulsaei.org
IMPORTANT CONSIDERATIONS

HOW TO USE THIS REPORT
It is important to understand both the scope and the limitations of the Equality Indicators Report in order to properly interpret and make meaning of its contents. The report’s primary intent is to serve as a data tool to measure the extent of disparity over time between the most advantaged and the most disadvantaged population groups for each of 54 indicators. Equality scores are based on the level of disparity and should not be interpreted as an assessment of the overall well-being of Tulsa’s population. A high score means that the level of disparity between the groups being compared is relatively small, and a low score means that the level of disparity between the two groups is relatively large.
An increase or decrease in equality score does not necessarily indicate a comparable increase or decrease in well-being for the disadvantaged group. An increase in equality score (i.e. a decrease in disparity between two groups) may be caused by actual improvement in outcomes for the disadvantaged group, but it may also result from a decline in outcomes for the advantaged group, or some combination of the two. Both situations would generate improvement in the score. Likewise, a decrease in equality score (i.e. an increase in disparity between two groups) may be caused by either an actual decline in outcomes for the disadvantaged group or an improvement in outcomes for the advantaged group. Both situations would generate a lower score. To enable readers to identify the drivers behind an equality score, the data on which scores are based are included in the report.
The Equality Indicators report does not provide an analysis of what causes the reported disparities or prescribe a formula for resolving them. These objectives require research and dialogue beyond the scope of this report. However, this report can serve as a source of information to catalyze conversation and focus efforts within Tulsa toward producing a more equitable community.
DATA AVAILABILITY AND ADJUSTMENTS
As has been done in previous report years, The Tulsa Equality Indicators 2023 Annual Report draws from a wide variety of reliable data sources that range in vintage across multiple years. The data and scores labeled as the 2023 report year data in the indicator tables may, but generally do not, represent outcomes measured or collected in calendar year 2023. They represent outcomes measured during the most recent calendar or fiscal year for which data have been finalized and released by the data source.
When new data have not been available for an indicator for this or past reports, the previous year's data and score have been repeated and used to calculate indicator, topic, theme, and city scores. The repeated data and scores appear in indicator tables. In the line graphs used to show trends in scores over time, report years with repeated scores are symbolized by missing markers for those years.
Each year, opportunities might arise to access better or more accurate data to measure the level of equality for a given indicator. Any changes in indicators are carefully considered after a review of available data and consultation with subject matter experts. When changes to indicators’ data or data sources are made, adjustments are also made to calculated values and scores of affected indicators, topics, themes and the city for all prior years.
Complete data sources for each indicator and a list of missing years of data are can be found in Appendix B.
8 | tulsaei.org
tulsaei.org | 9
SCORES
All Tulsans do better when every Tulsan does better. Measuring and striving for equality leads us toward greater economic security, educational success, stable and secure housing, justice and safety, physical and mental well-being, and fair distribution of services for every Tulsan, which ultimately produces a more enriched quality of life for all Tulsans.
Tulsa’s overall equality score has increased every year since the inception of the Tulsa Equality Indicators series. At 42.37, the City score for 2023 is 3.68 points higher than in 2018, and .41 points higher than last year’s score, signifying gradual overall improvement in equality in the set of indicators measured. Four of the six themes in the report show score improvement since 2018 – Education, Public Health, Economic Opportunity, and Housing – while two themes have declined – Justice and Services.

While the potential for relatively quick change in equality may be possible for some indicators through implementation of strategic policies and resources, change generally happens much more incrementally over a span of years. For example, the opening of a grocery store in a food desert can improve residents’ access to fresh food in a matter of months. Improvement in life expectancy, on the other hand, requires a multifaceted strategy targeting the many layers of social determinants of health which can take years, decades, or generations.


Explore the data and learn more about scoring and methodology used for this report at tulsaei.org.
OUT OF 100 2023 CITY LEVEL SCORE 10 | tulsaei.org
2022 City Score: 41.96 2023 City Score: 42.37 2021 City Score: 40.93 2020 City Score: 40.56 2019 City Score: 40.07 Change Score 2018 to 2023: +3.68 2018 City Score: 38.69
42.37
CITY SCORES and CHANGE SCORE
SUMMARY OF CITY AND THEME SCORES
tulsaei.org | 11 City/ThemeReport Year City of Tulsa Score 2018 2019 2020 2021 2022 2023 42.37 41.96 40.93 40.56 40.07 38.69 0102030405060708090100 Economic Opportunity 2018 2019 2020 2021 2022 2023 Education 2018 2019 2020 2021 2022 2023 Housing 2018 2019 2020 2021 2022 2023 Justice 2018 2019 2020 2021 2022 2023 Public Health 2018 2019 2020 2021 2022 2023 Services 2018 2019 2020 2021 2022 2023 42.11 37.67 39.56 36.44 39.78 37.22 51.56 48.89 43.11 45.11 39.00 39.00 43.33 45.44 40.78 41.44 41.33 41.33 33.56 33.89 34.44 34.78 36.78 38.44 47.67 47.67 45.56 43.78 43.78 39.89 36.00 38.22 42.11 41.78 39.78 36.22 Equality Score
Economic Opportunity
Business ownership by gender
Business ownership by race Payday loans & banks by geography Unemployment by race
Third grade reading proficiency by income Graduation by English proficiency College completion by race Housing
Homeownership by race
Home purchase loan denial by race Housing cost burden by income Youth homelessness by race Homelessness by veteran status Homelessness by disability status Rent burden by income Eviction s by race
Equality Score
2023 INDICATOR SCORES 0102030405060708090100
Commute
Living
Median household
Poverty
educational attainment
Suspensions by race Chronic absenteeism by race Dropping out
income Emergency teacher cert.
geography
time by geography High wage occupations by race
wage by geography
income by race
by
Education
by
by
Postsec. particip. by English proficiency School report card score by income
Housing complaints by geography
Adult
Female arrests vs. national average TPD workforce by race TPD workforce by gender Officer use of force by subject race Child abuse/neglect vs. national average Homicide victimization by race 911 domestic violence calls by geography Public Health Health insurance by race Emergency room use by geography VA appt. wait time vs. national average Infant mortality by race Life expectancy by geography Cardiovascular disease mortality by race Food deserts by geography Mentally unhealthy days by income Smoking by geography
Vacant housing by geography Internet access by race Dev. disability services vs. national avg. Government representation by race Voter turnout by geography Homeowner associations by geography Bus stop concentration by geography Commute time by mode of transportation Vehicle access by race 28 58 52 33 48 36 1 62 61 37 63 33 33 54 37 78 91 38 100 40 29 20 56 39 19 35 52 36 20 43 11 18 26 74 37 37 100 43 50 20 31 31 47 39 68 35 39 33 37 39 37 25 39 40 tulsaei.org | 9 12 | tulsaei.org
Justice Juvenile arrests by race
arrests by race
Services
This report was prepared by the Tulsa Area United Way in partnership with the City of Tulsa. The Tulsa Equality Indicators 2023 Annual Report and data are available online at tulsaei.org.


THEME 1 ECONOMIC OPPORTUNITY
THEME SCORES


2018: 37.22
2019: 39.78
2020: 36.44
2021: 39.56
2022: 37.67
Change Score 2018 to 2023: +4.89
2023: 42.11
The Economic Opportunity theme score of 42.11 in 2023 is nearly five points higher than the baseline score of 37.22 from the 2018 report, and it is the fourth highest scoring theme. Many initiatives to boost economic growth in under-resourced neighborhoods have been put in place in recent years.
Economic opportunity is about the presence or absence of opportunities and barriers that affect an individual’s ability to realize economic sufficiency and stability. A multitude of interconnected factors impact an individual’s ability to achieve economic well-being, including many that are beyond the individual’s control. Some of these factors are:
• Availability of jobs paying living wage;
• Access to non-predatory lending establishments;
• Income inequality;
• Wealth inequality;
• Minimum wage standards;
• Economic status of personal and professional networks.
An equal set of opportunities to succeed economically does not present itself to all people, nor do all people face the same barriers to economic success.
Disparities in opportunities and barriers to economic success, along with the resulting disparities in outcomes are explored throughout the indicators of the Economic Opportunity theme.
SCORES AND DATA BY THEME, TOPIC AND INDICATOR
14 | tulsaei.org
100 2023 THEME SCORE
42.11 OUT OF


Note: For years in which new data are not available, the previous year's scores are repeated for calculation of indicator, topic, theme, and city scores. This is symbolized in the above line graph by a missing icon for those years.
Business DevelopmentEmployment Income 2018 2019 2020 2021 2022 2023 2018 2019 2020 2021 2022 2023 2018 2019 2020 2021 2022 2023 0 20 40 60 80 100 Equality Score Economic Opportunity Theme = 42.11/100 Business ownership by gender Business ownership by race Payday loans & banks by geography Unemployment by race Commute time by geography High wage occupations by race Living wage by geography Median household income by race Poverty by educational attainment
tulsaei.org | 15
TOPIC 1: BUSINESS DEVELOPMENT
TOPIC SCORES
Change Score 2018 to 2023: +7.33
For a comprehensive list of all data sources and years used, please see Appendix B, page 64.

SCORES AND DATA BY THEME, TOPIC AND INDICATOR ECONOMIC OPPORTUNITY
16 | tulsaei.org
Value Code 1 Indicator 1: Business ownership by gender Business ownership: male compared to female workers Report Year
Comparison Group A: % of male workers who own businesses Comparison Group B: % of female workers who own businesses Ratio of Comparison Group A to Comparison Group B 2018 2019 2020 2021 2022 2023
12.6% 13.7% 11.6% 10.7% 10.3% 11.5% 8.4% 8.7% 9.0% 6.5% 8.1% 6.3% 1.494 1.576 1.285 1.636 1.276 1.830 The equality score for this indicator increased by 14 since 2018. Male workers own businesses in Tulsa at a rate that is 49% higher than female workers.
2022: 30.33 2023: 41.33 2021: 37.00 2020: 30.33 2019: 42.67 2018: 34.00
Equality Score
615771557247
Indicator 2: Business ownership by race
Indicator 3: Payday loans & banks by geography
The ratio of banks and credit unions to payday lending businesses is 9 times higher in South Tulsa than in North Tulsa.
tulsaei.org | 17 Value Code 2
Business ownership: Asian, Native Hawaiian & Other Pacific Islander (Asian/NHOPI) compared to Black workers Report Year Equality
Comparison Group A: % of Asian/NHOPI workers who own businesses Comparison Group B: % of Black workers who own businesses Ratio of Comparison Group A to Comparison Group B 2018 2019 2020 2021 2022 2023 623339355552 10.6% 12.5% 13.4% 13.1% 10.0% 10.3% 7.2% 4.0% 6.1% 4.7% 6.1% 6.0% 1.477 3.104 2.208 2.798 1.636 1.722 The equality score for this indicator increased by 10 since 2018. Asian, Native Hawaiian & Other Pacific Islander workers own businesses in Tulsa at a rate that is 48% higher than Black workers. Value Code 3
Score
Report Year
Group
Ratio of banks & credit unions to
lending businesses in South Tulsa
Group B: Ratio of banks & credit unions to payday lending businesses in North Tulsa Ratio of Comparison Group A to Comparison Group B 2018 2019 2020 2021 2022 2023 111113 17.500 15.000 12.000 11.429 12.143 10.429 1.714 1.125 1.111 1.000 0.889 1.111 10.208 13.333 10.801 11.429 13.659 9.387
Ratio of banks & credit unions to payday lending businesses: South Tulsa compared to North Tulsa
Equality Score Comparison
A:
payday
Comparison
The equality score for this indicator decreased by 2 since 2018.
ECONOMIC OPPORTUNITY
TOPIC 2: EMPLOYMENT
TOPIC SCORES
Change Score 2018 to 2023: -0.33
For a comprehensive list of all data sources and years used, please see Appendix B, page 64.
Indicator 4: Unemployment by race
Equality Score
The equality score for this indicator decreased by 2 since 2018.
The unemployment
for Black Tulsans is 170% higher than that for White Tulsans.
SCORES AND DATA BY THEME, TOPIC AND INDICATOR
26 | tulsaei.org 18 | tulsaei.org Value Code 4
Unemployment: Black compared to White residents Report Year
Comparison Group A: % of Black residents in civilian labor force who are unemployed Comparison Group B: % of White residents in civilian labor force who are unemployed Ratio of Comparison Group A to Comparison Group B 2018 2019 2020 2021 2022 2023 363638373938 9.0% 14.5% 10.5% 10.3% 12.4% 12.6% 3.3% 5.3% 4.3% 4.0% 5.6% 5.4% 2.727 2.736 2.442 2.575 2.214 2.333
rate
2022: 39.67 2023: 39.00 2021: 41.67 2020: 40.00 2019: 36.33 2018: 39.33
Note: For this indicator, commute time to work does not include persons who work from home.
Note: For this indicator, high wage occupations include census categories: management, business and financial occupations; computer, engineering and science occupations; legal occupations; health diagnosing and treating practitioners, and other technical occupations.
tulsaei.org | 19 Value Code 5 Indicator 5: Commute time by geography Commute time of 30 minutes or more to work: North Tulsa compared to Midtown Tulsa residents Report Year
Comparison Group A: % of North Tulsans with commute time of 30 minutes or more Comparison Group B: % of Midtown Tulsans with commute time of 30 minutes or more Ratio of Comparison Group A to Comparison Group B 2018 2019 2020 2021 2022 2023 484952524549 19.0% 19.2% 19.2% 18.9% 19.0% 18.4% 10.5% 10.7% 11.1% 11.0% 10.1% 10.4% 1.810 1.800 1.722 1.719 1.887 1.776 The equality score for this indicator decreased by 1 since 2018. The percentage of North Tulsa residents commuting 30 minutes or more to work is 81% higher than the percentage of Midtown Tulsa residents.
Equality Score
Value Code 6 Indicator 6: High wage occupations by race Employment in high wage occupations: White compared to Hispanic/Latinx workers Report Year Equality Score
Group A: % of White workers employed in high wage occupations Comparison Group B: % of Hispanic/Latinx workers employed in high wage occupations Ratio of Comparison Group A to Comparison Group B 2018 2019 2020 2021 2022 2023 333435312531 34.9% 36.4% 33.7% 31.2% 33.2% 30.4% 11.1% 11.9% 12.0% 9.3% 7.7% 8.9% 3.158 3.045 2.812 3.355 4.312 3.416 The equality score for this indicator increased
2 since 2018. The percentage of White workers who are employed in high wage occupations is 3 times the percentage of Hispanic/Latinx workers.
Comparison
by
TOPIC 3: INCOME
SCORES
Change Score 2018 to 2023: +7.67
For a comprehensive list of all data sources and years used, please see Appendix B, page 64.
Equality Score
Note: For this indicator, 200% of poverty is used to represent living wage, which is the wage required to meet a household's basic needs without public or private assistance. TOPIC
SCORES AND DATA BY THEME, TOPIC AND INDICATOR ECONOMIC OPPORTUNITY
20 | tulsaei.org Value Code 7
7: Living wage by geography Household income at or above 200% of poverty level: South Tulsa compared to North Tulsa residents Report Year
Comparison Group A: % of South Tulsa residents who live in households earning at or above 200% of poverty Comparison Group B: % of North Tulsa residents who live in households earning at or above 200% of poverty Ratio of Comparison Group A to Comparison Group B 2018 2019 2020 2021 2022 2023
72.4% 73.2% 73.3% 72.9% 72.7% 72.9% 42.0% 41.5% 39.9% 39.0% 37.9% 37.0% 1.725 1.763 1.839 1.869 1.918 1.970
wage
Indicator
525047464442
The equality score for this indicator increased by 10 since 2018. The percentage of South Tulsans in households earning a living
is 72% higher than that of North Tulsans.
2022: 43.00 2023: 46.00 2021: 40.00 2020: 39.00 2019: 40.33 2018: 38.33
Indicator 8: Median household income by race
Indicator 9: Poverty by educational attainment
Poverty: adults age 25+ with a high school diploma or less compared to adults age 25+ with a bachelor's degree or higher Report Year Equality
Score
Comparison Group A:
% of adults with high school diploma or less with income below federal poverty level
Comparison Group B:
% of adults with bachelors degree or higher with income below federal poverty level
The equality score for this indicator increased by 4 since 2018.
The poverty rate of Tulsans with a high school diploma or less is nearly 3 times higher than the rate of those with a bachelor's degree or higher.
tulsaei.org | 21 Value Code 8
Median household income: White compared to Black households Report Year
Comparison Group A:
Comparison Group
Ratio of Comparison Group A to Comparison Group B 2018 2019 2020 2021 2022 2023 585044485449 �62,411 �57,566 �58,948 �55,448 �51,744 �51,053 �39,779 �32,701 �30,864 �30,463 �30,902 �28,399 1.569 1.760 1.910 1.820 1.674 1.798 The equality score for this indicator increased by 9 since 2018. Median household income of White households is 57% greater than that of Black households in Tulsa. Value Code 9
Equality Score
White median household income
B: Black median household income
Ratio of Comparison Group
2018 2019 2020 2021 2022 2023 282929232324 24.4% 22.7% 21.9% 21.1% 23.3% 22.9% 6.3% 6.1% 5.8% 4.5% 5.0% 5.2% 3.874 3.721 3.764 4.689 4.660 4.404
A to Comparison Group B
THEME 2 EDUCATION

THEME SCORES
Change Score 2018 to 2023: +12.56
The Education theme scored 51.56 in 2023, an improvement of more than 12 points since the 2018 baseline score of 39.00. Scoring the highest of all six themes in the 2023 report, the Education theme’s score improvement is driven largely by large score increases for two indicators – Chronic Absenteeism by Race and Dropping Out by Income. Unfortunately these score increases are not entirely the result of improvement in outcomes for the disadvantaged groups. In the case of Chronic Absenteeism by Race, outcomes for both groups worsened substantially; the advantaged group worsened more dramatically than the disadvantaged group, generating an improved equality score. For Dropping Out by Income, while the disadvantaged group did experience outcome improvement, the advantaged group experienced a significant outcome decrease, yielding an overall increased equality score.
The indicators in the Education theme explore disparities in barriers and opportunities for educational success and more equitable student outcomes. The focus ranges from elementary through postsecondary education. A solid foundation during the elementary and secondary years is crucial for future academic and career success, and postsecondary education or training is essential for accessing employment opportunities that can support an adequate wage for selfsufficiency.
Education outcomes, negatively impacted by the COVID-19 pandemic, have been slow to return to pre-pandemic levels. This trend has created critical challenges for districts across the nation, including Tulsa Public Schools, many of which are evident in the underlying data of the Education theme’s indicators.
SCORES AND DATA BY THEME, TOPIC AND INDICATOR
22 | tulsaei.org
OUT OF 100 2023 THEME SCORE
51.56
48.89 2023: 51.56
43.11
45.11
39.00
39.00
2022:
2021:
2020:
2019:
2018:


Note: For years in which new data are not available, the previous year's scores are repeated for calculation of indicator, topic, theme, and city scores. This is symbolized in the above line graph by a missing icon for those years.
Impediments to LearningQuality & OpportunityStudent Achievement 2018 2019 2020 2021 2022 2023 2018 2019 2020 2021 2022 2023 2018 2019 2020 2021 2022 2023 0 20 40 60 80 100 Equality Score Education Theme = 51.56/100 Suspensions by race Chronic absenteeism by race Dropping out by income Emergency teacher cert. by
Postsec. particip. by Eng. prof. School report card score by income
College completion by race
geog.
Third grade reading prof. by income Graduation by English proficiency
tulsaei.org | 23
EDUCATION
TOPIC 1: IMPEDIMENTS TO LEARNING Change Score 2018 to 2023: +35.00
For a comprehensive list of all data sources and years used, please see Appendix B, page 64.
The equality score for this indicator increased by 6 since 2018.
The suspension rate of Black TPS students is more than double the rate of Hispanic/Latinx TPS students. TOPIC SCORES
SCORES AND DATA BY THEME, TOPIC AND INDICATOR
24 | tulsaei.org Value Code 10
Group A: % of Black
students who have been
Group
% of Hispanic/Latinx
students who
been suspended Ratio of Comparison Group A to Comparison Group B 2018 2019 2020 2021 2022 2023 383233333532 18.4% 3.8% 12.2% 13.4% 13.7% 14.9% 7.9% 1.1% 3.9% 4.3% 4.9% 4.6% 2.325 3.281 3.132 3.116 2.796 3.239
Indicator 10: Suspensions by race School suspensions: Black compared to Hispanic/Latinx Tulsa Public Schools (TPS) students Report Year Equality Score Comparison
TPS
suspended Comparison
B:
TPS
have
2022: 70.67 2023: 69.00 2021: 56.67 2020: 53.00 2019: 37.67 2018: 34.00
Indicator 12: Dropping out by
Note: Lower income students refers to those qualifying for the free and reduced lunch program based on household income below 185% of federal poverty level. Higher income students refers to those who do not qualify.
tulsaei.org | 25 Value Code 11
by race Missing 10% or more of school days per school year: Native American compared to Asian Tulsa Public Schools (TPS) students Report Year Equality
Comparison Group A: % of Native American TPS students who are chronically absent Comparison Group B: % of Asian TPS students who are chronically absent Ratio of Comparison Group A to Comparison Group B 2018 2019 2020 2021 2022 2023 918076614033 48.7% 52.1% 57.3% 25.5% 28.9% 31.7% 46.6% 46.6% 47.8% 17.2% 14.4% 10.3% 1.045 1.119 1.199 1.485 2.010 3.078 The equality score for this indicator increased by 58 since 2018. The chronic absenteeism rate of Native American TPS students is nearly equal to that of Asian TPS students. Value Code 12
Indicator 11: Chronic absenteeism
Score
Dropping out of school: lower income compared to higher income Tulsa Public Schools (TPS) 12th grade students Report Year Equality Score Comparison Group A: % of lower income TPS 12th graders who drop out of school Comparison Group B: % of higher income TPS 12th graders who drop out of school Ratio of Comparison Group A to Comparison Group B 2018 2019 2020 2021 2022 2023 7810061653837 16.6% 4.9% 16.9% 15.6% 16.7% 18.7% 14.5% 4.9% 11.3% 11.1% 7.1% 7.5% 1.144 0.999 1.489 1.405 2.352 2.493 The equality score for this indicator increased by 41 since 2018. The dropout rate of lower income TPS 12th graders is 14% higher than that of higher income TPS 12th graders.
income
EDUCATION
TOPIC 2: QUALITY AND OPPORTUNITY Change Score 2018 to 2023: +10.33 TOPIC SCORES
For a comprehensive list of all data sources and years used, please see Appendix B, page 64.
Indicator 13: Emergency teacher certification by geography
The equality score for this indicator increased by 18 since 2018.
The rate of emergency certified teachers employed by Tulsa Public Schools as a share of all teachers employed by the district is 2½ times that of other districts in the county.
Note: The 13 other public school districts in Tulsa County include: Berryhill, Bixby, Broken Arrow, Collinsville, Glenpool, Jenks, Keystone, Liberty, Owasso, Sand Springs, Skiatook, Sperry, and Union.
SCORES AND DATA BY THEME, TOPIC AND INDICATOR
26 | tulsaei.org Value Code 13
Employment of
with
certifications: Tulsa Public
districts
Group
Number of emergency certified teachers employed by
per 1,000 teachers
Group
Number of emergency certified teachers employed by other
Co. districts per 1,000 teachers Ratio of Comparison Group A to Comparison Group B 2018 2019 2020 2021 2022 2023 371515232319 159.715 168.448 168.448 110.564 110.564 48.000 63.065 26.119 26.119 24.030 24.030 9.100 2.533 6.449 6.449 4.601 4.601 5.275
teachers
emergency teacher
Schools (TPS) compared to other Tulsa County school
Report Year Equality Score Comparison
A:
TPS
Comparison
B:
Tulsa
2022: 31.33 2023: 41.33
2021: 28.00 2020: 30.67
2019: 32.33 2018: 31.00
Indicator 14: Postsecondary opportunities participation by English proficiency
Participation in postsecondary opportunities: non-English Learner compared to English Learner Tulsa Public Schools (TPS) juniors and seniors Report Year Equality
Score
Comparison Group A: % of non-English Learner TPS juniors & seniors who complete a postsecondary opportunity
Comparison Group B: % of English Learner TPS juniors & seniors who complete a postsecondary opportunity
The equality score for this indicator increased by 14 since 2018.
The percentage of TPS Non-English Learner students who participate and complete a postsecondary opportunity is 66% higher than TPS English Learner students.
Note: Postsecondary opportunities participation is the successful completion of an approved college or career-readiness program, which include: advanced placement or international baccalaureate (AP/IB) coursework, concurrent or dual enrollment, internships, and CareerTech coursework leading to industry certification.
Indicator 15: School report card score by income
Average School Report Card scores: higher income compared to lower income Tulsa Public Schools (TPS) schools
Report Year Equality Score
Comparison Group A:
Average School Report Card score for higher income TPS schools
Comparison Group B: Average School Report Card score for lower income TPS schools
The equality score for this indicator decreased by 1 since 2018.
Higher income TPS schools receive School Report Card scores that are 3 times the scores of lower income TPS schools.
Note: Oklahoma’s “School Report Card” assesses school performance across multiple indicators, including academic achievement and growth, chronic absenteeism, progress in English language proficiency, postsecondary opportunities, and graduation. Higher income schools for this indicator refer to those with less than 60% of students qualifying for free and reduced lunch, and lower income schools refer to those with at least 90% of students qualifying.
tulsaei.org | 27 Value Code 14
Ratio of Comparison Group A to Comparison Group B 2018 2019 2020 2021 2022 2023 546038384040 55.7% 57.1% 53.5% 53.5% 57.4% 57.4% 33.6% 37.8% 23.1% 23.1% 28.4% 28.4% 1.658 1.511 2.316 2.316 2.021 2.021
Value Code 15
of Comparison Group A
Comparison Group
2018 2019 2020 2021 2022 2023 331931313434 52 58 59 59 60 60 16 11 17 17 20 20 3.191 5.257 3.471 3.471 3.000 3.000
Ratio
to
B
EDUCATION
TOPIC 3: STUDENT ACHIEVEMENT
TOPIC SCORES
Change Score 2018 to 2023: -7.67
For a comprehensive list of all data sources and years used, please see Appendix B, page 64.
Indicator 16: Third grade reading proficiency by income
Third grade reading/language arts proficiency: higher income compared to lower income Tulsa Public Schools (TPS) third graders
Report Year
Equality Score
Comparison Group A: % of higher income TPS 3rd graders who score proficient or above on reading/language arts test
Comparison Group B: % of lower income TPS 3rd graders who score proficient or above on reading/language arts test
The equality score for this indicator decreased by 4 since 2018.
The percentage of higher income TPS students scoring proficient or advanced on the 3rd grade reading test is 3 times the percentage of lower income TPS students.
Note: Lower income students refers to those qualifying for the free and reduced lunch program based on household income below 185% of federal poverty level. Higher income students refers to those who do not qualify.
SCORES AND DATA BY THEME, TOPIC AND INDICATOR
28 | tulsaei.org Value Code 16
Ratio of Comparison
2018 2019 2020 2021 2022 2023
24.8% 22.7% 21.8% 49.0% 39.9% 35.1% 7.9% 6.9% 4.0% 14.4% 11.7% 14.3% 3.120 3.273 5.498 3.403 3.410 2.455
Group A to Comparison Group B
333219313137
2022: 44.67 2023: 44.33 2021: 44.67 2020: 51.67 2019: 47.00 2018: 52.00
Four-year graduation: non-English Learner compared to English Learner Tulsa Public Schools (TPS) students
Report Year Equality Score
Comparison Group A: % of non-English Learner TPS high school students who graduate in 4 years
Comparison Group B: % of English Learner TPS high school students who graduate in 4 years
Note: Due to new data availability, comparison group A has been changed from "all TPS students" used in previous report years to "non-English Learner students," allowing distinct groups for comparison. Past report years' data have been updated to reflect the new group.
Comparison
Black Tulsans begin college but do not graduate with a degree at a rate that is 2½ times the rate of Hispanic/Latinx Tulsans.
tulsaei.org | 29 Value Code 17
Indicator 17: Graduation by English proficiency
Ratio of Comparison Group A to Comparison Group B 2018 2019 2020 2021 2022 2023
73.7% 74.6% 80.1% 80.1% 79.1% 78.7% 51.1% 52.1% 63.5% 63.5% 53.0% 71.1% 1.442 1.432 1.261 1.261 1.492 1.107
equality score for this indicator decreased by 17
The high school graduation rate of TPS non-English Learners is 44% higher than that of English Learners.
636472726180
The
since 2018.
Value Code 18
18: College completion by race College entry without earning a degree: Black compared to Hispanic/Latinx adults age 25+
Indicator
not
a
Report Year Equality Score Comparison Group A: % of Black adults who start college but do
earn
degree
Ratio of Comparison Group A to Comparison Group B 2018 2019 2020 2021 2022 2023
27.4% 27.1% 26.2% 27.7% 28.5% 28.6% 10.6% 11.5% 13.6% 16.2% 15.9% 13.0% 2.574 2.347 1.930 1.710 1.792 2.200
equality score for this indicator decreased by 2 since 2018.
Group B: % of Hispanic/Latinx adults who start college but do not earn a degree
373843524939
The
THEME 3 HOUSING
THEME SCORES

Change Score 2018 to 2023: +2.00
The Housing theme received a score of 43.33 in 2023, an increase of two points from the baseline score of 41.33 in 2018. The indicators in this theme approach housing from three perspectives: those who own a home, those who rent, and those who are unhoused.
Shelter is a basic human need, without which other concerns cannot be effectively addressed. Once in stable housing, an individual has greater capacity to pursue education or employment, to work towards better health, or in the case of homeownership, to increase wealth.
All across the nation, cities continue to face a serious crisis of a lack of affordable housing. The problem directly affects both homeowners and renters, who may struggle with meeting other needs such as food, health care, educational opportunities, child care, and transportation. This impacts whole communities. The limited ability of people to spend money on other consumer goods and services impacts job growth and economic development across all sectors of the local economy.

SCORES AND DATA BY THEME, TOPIC AND INDICATOR
30 | tulsaei.org
OF 100 2023 THEME SCORE
43.33 OUT
2022: 45.44 2023: 43.33 2021: 40.78 2020: 41.44 2019: 41.33 2018: 41.33

Note: For years in which new data are not available, the previous year's scores are repeated for calculation of indicator, topic, theme, and city scores. This is symbolized in the above line graph by a missing icon for those years.
Homeownership Homelessness Tenant stability 2018 2019 2020 2021 2022 2023 2018 2019 2020 2021 2022 2023 2018 2019 2020 2021 2022 2023 0 20 40 60 80 100 Equality Score Housing Theme = 43.33/100 Homeownership by race Home purchase loan denial by race Housing cost burden by income Youth homelessness by race Homelessness by veteran status Homelessness by disability status Rent burden by income Evictions by race Housing complaints by geography
tulsaei.org | 31
TOPIC SCORES
For a comprehensive list of all data sources and years used, please see Appendix B, page 64.
The equality score for this indicator increased by 5 since 2018.
White Tulsans are 72% more likely to own their home than Black Tulsans.
Value Code 19
Homeownership: White compared to Black householders Report Year
Comparison Group A: % of White householders who own their home Comparison Group B: % of Black householders who own their home Ratio of Comparison Group A to Comparison Group B 2018 2019 2020 2021 2022 2023
57.8% 58.8% 60.6% 57.9% 58.2% 58.1% 33.6% 32.7% 30.9% 32.0% 34.8% 31.6% 1.721 1.798 1.961 1.809 1.672 1.839
SCORES AND DATA BY THEME, TOPIC AND INDICATOR HOUSING TOPIC 1: HOMEOWNERSHIP Change Score 2018 to 2023: +2.33
Indicator 19: Homeownership by race
Equality Score
524942485447
32 | tulsaei.org
2022: 33.67 2023: 35.33 2021: 31.67 2020: 33.00 2019: 32.00 2018: 33.00
Indicator 20: Home purchase loan denial by race
Indicator 21: Housing cost burden by income
Spending more than 30% of income on housing costs: lower income compared to higher income homeowner households
The equality score for this indicator increased by 5 since 2018.
Lower income homeowners experience housing cost burden at a rate that is nearly 5 1/2 times the rate of higher income homeowners.
Note: The accepted federal standard for housing affordability states that no more than 30% of a household's gross income should be spent on housing and utilities expenses. Homeowners are classified as low-income for this indicator when their annual household income is less than $35,000, and higher-income when their household income is equal to or greater than $35,000.
Value Code 20
purchase loan denials:
American
applicants Report Year
Comparison Group A: % of Native American home loan applicants who are denied loan Comparison Group B: % of Asian home loan applicants who are denied loan Ratio of Comparison Group A to Comparison Group B 2018 2019 2020 2021 2022 2023 353540372938 23.4% 17.0% 17.9% 23.4% 26.4% 27.3% 8.2% 6.1% 8.6% 9.4% 7.2% 11.2% 2.854 2.794 2.084 2.489 3.667 2.438 The equality score for this indicator decreased by 3 since 2018. Native American applicants are denied a home loan at a rate that is
3 times the rate of Asian applicants. Value Code 21
Home
Native
compared to Asian
Equality Score
nearly
Group
% of lower income homeowner
that
Group B: % of higher income homeowner households that are housing cost burdened Ratio of Comparison Group A to Comparison Group B 2018 2019 2020 2021 2022 2023 191713141314 65.0% 62.3% 57.0% 58.7% 59.3% 55.5% 12.0% 10.4% 8.2% 8.7% 8.7% 8.4% 5.420 5.977 6.922 6.747 6.816 6.607
Report Year Equality Score Comparison
A:
households
are housing cost burdened Comparison
tulsaei.org | 33
TOPIC SCORES
For a comprehensive list of all data sources and years used, please see Appendix B, page 64.
The equality score for this indicator increased by 1 since 2018. Native American youths experience homelessness at a rate that is more than twice the rate of White youths.
Note: Counts of individuals experiencing homelessness in the table above include only those who received Emergency Shelter or Transitional Housing. Others who may have only used a day shelter, were served by street outreach, or received no services are not included in these counts.
SCORES AND DATA BY THEME, TOPIC AND INDICATOR
Value Code 22
Homelessness: Native American compared to White youths age 13 to 24
Comparison Group A: Number of Native American youths experiencing homelessness per 1,000 Native American youths Comparison Group B: Number of White youths experiencing homelessness per 1,000 White youths Ratio of Comparison Group A to Comparison Group B 2018 2019 2020 2021 2022 2023
17.021 22.037 20.685 24.351 33.380 24.900 7.876 8.298 6.866 8.497 9.951 10.406 2.161 2.656 3.013 2.866 3.355 2.393
HOUSING TOPIC 2: HOMELESSNESS Change Score 2018 to 2023: -14.67
Indicator 22: Youth homelessness by race
Report Year Equality Score
393634353138
34 | tulsaei.org
2022: 40.00 2023: 38.33 2021: 44.00 2020: 51.67 2019: 55.33 2018: 53.00
Indicator 23: Homelessness by veteran status
Homelessness: veterans compared to non-veterans Report Year Equality Score
Comparison Group A: Number of veterans experiencing homelessness per 1,000 veterans
Comparison Group B: Number of non-veterans experiencing homelessness per 1,000 non-veterans
Note: Counts of individuals experiencing homelessness in the table above include only those who received Emergency Shelter or Transitional Housing. Others who may have only used a day shelter, were served by street outreach, or received no services are not included in these counts.
Indicator 24: Homelessness by disability status
Homelessness: individuals with a disability compared to individuals without a disability Report Year Equality Score
Comparison
Comparison Group B:
The equality score for this indicator decreased by 15 since 2018.
Adults with disabilities experience homelessness at a rate that is 5 times the rate of adults with no disabilities.
Note: Counts of individuals experiencing homelessness in the table above include only those who received Emergency Shelter or Transitional Housing. Others who may have only used a day shelter, were served by street outreach, or received no services are not included in these counts.
Value Code 23
Ratio of Comparison Group A to Comparison Group B 2018 2019 2020 2021 2022 2023
19.805 17.619 15.271 16.040 16.360 17.867 12.315 12.260 12.447 15.468 16.825 16.673 1.608 1.437 1.227 1.037 0.972 1.072
5664749310086
The equality score for this indicator decreased by 30 since 2018. Veterans experience homelessness at a rate that is 61% higher than non-veterans.
Value Code 24
Group A: Number of persons with disabilities experiencing homelessness per 1,000 persons with disabilities
Number
experiencing
disabilities Ratio of Comparison Group A to Comparison Group B 2018 2019 2020 2021 2022 2023
39.479 38.911 32.117 37.421 30.393 30.426 7.844 7.509 7.278 9.300 10.703 10.524 5.033 5.182 4.413 4.024 2.840 2.891
of persons without disabilities
homelessness per 1,000 persons without
202024273535
tulsaei.org | 35
TOPIC SCORES
For a comprehensive list of all data sources and years used, please see Appendix B, page 64.
Note: The accepted federal standard for housing affordability states that no more than 30% of a household's gross income should be spent on rent and utilities expenses. Renters are classified as low-income for this indicator when their annual household income is less than $35,000, and higher-income when their household income is equal to or greater than $35,000.
SCORES AND DATA BY THEME, TOPIC AND INDICATOR
Value Code 25
Rent burden
income Spending more than 30% of income on rent housing costs: lower income compared to higher income renter households Report
Comparison Group A: % of lower income renter households that are rent burdened Comparison Group B: % of higher income renter households that are rent burdened Ratio of Comparison Group A to Comparison Group B 2018 2019 2020 2021 2022 2023 292217151312 88.1% 85.6% 83.2% 82.0% 79.9% 79.1% 23.9% 17.8% 14.2% 12.8% 11.6% 11.3% 3.685 4.817 5.879 6.406 6.888 7.000
HOUSING TOPIC 3: TENANT STABILITY Change Score 2018 to 2023: +18.33
Indicator 25:
by
Year Equality Score
The equality score for this indicator increased by 17 since 2018. Lower income renters experience rent burden at a rate that is more than 3½ times that of higher income renters.
36 | tulsaei.org
2022: 62.67 2023: 56.33 2021: 46.67 2020: 39.67 2019: 36.67 2018: 38.00
Indicator 26: Evictions by race
Evictions: renter households in majority non-white compared to majority white neighborhoods Report
Indicator 27: Housing complaints by geography
Housing complaints: North Tulsa compared to South Tulsa residents Report Year Equality Score Comparison
Housing complaints come from North Tulsa at a rate lower than that of South Tulsa.
Value Code 26
Comparison Group A: % of renter households in majority non-White census tracts that are evicted
Group B: % of renter households in majority White census tracts that are evicted Ratio of Comparison Group A to Comparison Group B 2018 2019 2020 2021 2022 2023 406666615859 8.2% 3.9% 3.9% 8.8% 9.5% 8.9% 4.0% 2.8% 2.8% 5.9% 6.1% 5.8% 2.041 1.384 1.384 1.496 1.557 1.534 The equality score for this indicator decreased by 19 since 2018. The eviction rate of majority non-White neighborhoods is twice the rate of majority White neighborhoods.
Year Equality Score
Comparison
White
White,
that
less than 50% White are
majority non-White. Value Code 27
Note: Census tracts that are more than 50%
are considered majority
and those
are
considered
Group A: Number of housing complaints
North Tulsa residents per
residents Comparison Group B: Number of housing complaints from South Tulsa residents per 1,000 South Tulsa residents Ratio of Comparison Group A to Comparison Group B 2018 2019 2020 2021 2022 2023
1.004 0.953 1.474 3.634 2.633 3.045 1.648 1.051 0.926 1.875 1.153 1.562 0.610 0.907 1.592 1.938 2.284 1.949
from
1,000 North Tulsa
10010057433943
The equality score for this indicator increased by 57 since 2018.
tulsaei.org | 37
THEME 4 JUSTICE
THEME SCORES

Change Score 2018 to 2023: -4.88
With the lowest score of all six themes in 2023, the Justice theme score of 33.56 fell 4.88 points from the baseline score of 38.44 in 2018. This theme explores disparities in arrests, law enforcement workforce, officer use of force, and violence. Using data to better understand issues in policing, safety, and violence enables city and law enforcement leaders to work with the public. Together, they can objectively examine trends and patterns to help identify root causes and develop strategies to reduce disparities.
Multiple researchers have found that African Americans across the United States frequently experience disproportionate levels of policing, stops, searches, issuing of citations, uses of force, convictions, sentencing severity, arrests for failure to pay fines and fees, and youth sentenced as adults. These do not align with higher levels or severity of crime committed. Many sources further suggest systemic racism and implicit bias throughout the entire criminal justice system significantly contribute to these disproportionate levels.*
Notes on calculating scores for indicators related to arrests and police use of force:
As in previous Equality Indicators reports, Black and White populations were selected as comparison groups for indicators 28 and 29 based on community feedback and to reflect contemporary discourse around the disparity in arrest rates by race. The method used in this report for Indicator 33, Officer Use of Force by Subject Race, calculates the police use of force rate by race as the number of incidents per population count for each race. The Tulsa Police Department calculates the rate using an alternative method, framing the use of force rate as the number of incidents per arrest count for each race.
*References cited in Appendix B.
SCORES AND DATA BY THEME, TOPIC AND INDICATOR
OUT OF 100 2023 THEME SCORE
33.56
38 | tulsaei.org
2022: 33.89 2023: 33.56
2021: 34.44
2020: 34.78
2019: 36.78
2018: 38.44

Note: For years in which new data are not available, the previous year's scores are repeated for calculation of indicator, topic, theme, and city scores. This is symbolized in the above line graph by a missing icon for those years.
Arrests Law EnforcementSafety & Violence 2018 2019 2020 2021 2022 2023 2018 2019 2020 2021 2022 2023 2018 2019 2020 2021 2022 2023 0 20 40 60 80 100 Equality Score Justice Theme = 33.56/100 Juvenile arrests by race Adult arrests by race Female arrests vs. national average TPD workforce by race TPD workforce by gender Officer use of force by subject race Child abuse/neglect vs. ntl. average Homicide victimization by race 911 domestic violence calls by geog.
tulsaei.org | 39
TOPIC 1: ARRESTS
TOPIC SCORES
Change Score 2018 to 2023: +2.66
For a comprehensive list of all data sources and years used, please see Appendix B, page 64.
Indicator 28: Juvenile arrests by race
Equality Score
The equality score for this indicator decreased by 2 since 2018. Black youths are arrested at a rate that is 2½ times the rate of White youths.
Note: As in previous Equality Indicators reports, the comparison of Blacks to Whites was intentionally selected to reflect the contemporary discourse surrounding this specific indicator.
SCORES AND DATA BY THEME, TOPIC AND INDICATOR
JUSTICE
Value Code 28
Report Year
Comparison Group A: Number of arrests of Black youths per 1,000 Black youths Comparison Group B: Number of arrests of White youths per 1,000 White youths Ratio of Comparison Group A to Comparison Group B 2018 2019 2020 2021 2022 2023 373928353539 12.489 17.562 25.535 21.583 26.174 26.721 4.991 7.777 6.533 7.809 9.198 11.975 2.502 2.258 3.908 2.764 2.845 2.231
Arrests: Black compared to White youths under 18
40 | tulsaei.org
2022: 41.67 2023: 49.33 2021: 42.33 2020: 46.33 2019: 49.67 2018: 46.67
Indicator 29: Adult arrests by race
Equality Score
Note: As in previous Equality Indicators reports, the comparison of Blacks to Whites was intentionally selected to reflect the contemporary discourse surrounding this specific indicator.
Indicator 30: Female arrests by comparison to national average
Equality Score
Females are arrested in Tulsa at a rate that is 22% higher than that of females nationwide.
Value Code 29
Arrests: Black compared to White adults Report Year
Comparison Group A: Number of arrests of Black adults per 1,000 Black adults Comparison Group B: Number of arrests of White adults per 1,000 White adults Ratio of Comparison Group A to Comparison Group B 2018 2019 2020 2021 2022 2023 373936383840 69.353 92.356 108.944 88.801 83.740 89.227 26.971 40.573 40.612 37.810 36.068 42.895 2.571 2.276 2.683 2.349 2.322 2.080 The equality score for this indicator decreased by 3 since 2018. Black adults are arrested at a rate that is 2½ times the rate of White adults.
Value Code 30
to
average Report Year
Group A: Number of arrests of females in Tulsa per 1,000 Tulsa females Comparison Group B: National average number of arrests of females per 1,000 females Ratio of Comparison Group A to Comparison Group B 2018 2019 2020 2021 2022 2023 744763667661 12.131 17.325 20.148 19.727 18.358 21.972 9.926 9.431 13.812 14.133 15.326 14.651 1.222 1.837 1.459 1.396 1.198 1.500
13
Arrests: females in Tulsa compared
national
Comparison
The equality score for this indicator increased by
since 2018.
tulsaei.org | 41
TOPIC 2: LAW ENFORCEMENT
TOPIC SCORES
Change Score 2018 to 2023: -4.67
For a comprehensive list of all data sources and years used, please see Appendix B, page 64.
Indicator 31: TPD workforce by race
Tulsa Police Department (TPD) workforce: White compared to Hispanic/Latinx employees
Equality Score
The equality score for this indicator increased by 8 since 2018.
Tulsa Police Department employs 3 times more White Tulsans than Hispanic/Latinx Tulsans per capita.
SCORES AND DATA BY THEME, TOPIC AND INDICATOR
JUSTICE
42 | tulsaei.org
Value Code 31
Report Year
Comparison Group A: Number of White TPD employees per 1,000 White residents Comparison Group B: Number of Hispanic/Latinx TPD employees per 1,000 Hispanic/Latinx residents Ratio of Comparison Group A to Comparison Group B 2018 2019 2020 2021 2022 2023 262621201518 3.456 3.406 3.557 3.295 3.223 3.096 0.826 0.826 0.712 0.650 0.516 0.542 4.184 4.125 4.997 5.071 6.250 5.712
2022: 26.67 2023: 18.33 2021: 23.00 2020: 22.00 2019: 26.33 2018: 23.00
Indicator 32: TPD workforce by gender
Indicator 33: Officer use of force by subject race
Subject of officer use of force: Black compared to Hispanic/Latinx individuals Report Year Equality Score
Comparison
The equality score for this indicator decreased by 9 since 2018.
Black Tulsans experience officer use of force at a rate that is more than 7 times the rate of Hispanic/Latinx Tulsans.
Note: Rate of officer use of force in this report is calculated by using the total population of each comparison group as the denominator. The Tulsa Police Department calculates the measure through an alternative method, using number of arrests per comparison group as the denominator.
Value Code 32
Tulsa Police Department (TPD) workforce: male compared to female employees Report Year
Comparison Group
Number of
per 1,000 male residents Comparison Group
Number of female
employees per 1,000 female residents Ratio of Comparison Group A to Comparison Group B 2018 2019 2020 2021 2022 2023 183130303031 4.194 3.906 4.131 3.755 3.673 3.499 0.761 1.156 1.155 1.047 1.013 1.044 5.508 3.380 3.575 3.586 3.627 3.350 The equality score for this indicator decreased by 13 since 2018. Tulsa Police Department employs 4½ times more males than females per capita. Value Code 33
Equality Score
A:
male TPD employees
B:
TPD
Black
Comparison Group A: Number of Black subjects of officer use of force per 1,000
residents
Group
Number of
per
residents Ratio of Comparison Group A to Comparison Group B 2018 2019 2020 2021 2022 2023 112318163420 2.366 1.579 1.833 1.651 2.413 2.555 0.322 0.342 0.319 0.269 0.796 0.508 7.353 4.618 5.746 6.138 3.031 5.030
B:
Hispanic/Latinx subjects of officer use of force
1,000 Hispanic/Latinx
tulsaei.org | 43
TOPIC 3: SAFETY AND VIOLENCE
TOPIC SCORES
Change Score 2018 to 2023: -12.67
For a comprehensive list of all data sources and years used, please see Appendix B, page 64.
The equality score for this indicator decreased by 25 since 2018.
The child abuse and neglect rate in Tulsa County is nearly twice the national average.
SCORES AND DATA BY THEME, TOPIC AND INDICATOR
JUSTICE
Value Code 34 Indicator 34: Child abuse and neglect by comparison to national average
reports of child abuse and neglect: Tulsa County compared to national average Report Year
Group A: Number of substantiated reports of child abuse & neglect in Tulsa County per 1,000 children under 18 Comparison Group B: National average number of substantiated reports of child abuse & neglect per 1,000 children under 18 Ratio of Comparison Group A to Comparison Group B 2018 2019 2020 2021 2022 2023 434249484868 15.707 17.400 16.400 16.600 16.400 12.400 8.100 8.900 9.200 9.100 9.100 9.200 1.939 1.955 1.783 1.824 1.802 1.348
Substantiated
Equality Score Comparison
44 | tulsaei.org
2022: 33.33 2023: 33.00 2021: 38.00 2020: 36.00 2019: 34.33 2018: 45.67
Note: As in previous Equality Indicators reports, the comparison of Blacks to Whites was intentionally selected to reflect the contemporary discourse surrounding this specific indicator.
Value Code 35
race Homicide victimization: Black compared to White victims Report Year
Group A: Number of Black homicide victims per 1,000 Black residents Comparison Group B: Number of White homicide victims per 1,000 White residents Ratio of Comparison Group A to Comparison Group B 2018 2019 2020 2021 2022 2023
0.636 0.615 0.536 0.524 0.692 0.514 0.123 0.129 0.142 0.113 0.139 0.190 5.185 4.765 3.775 4.637 4.969 2.705 The equality score for this indicator decreased by 16 since 2018. Black Tulsans are victims of homicide at a rate that is 5 times the rate of White Tulsans.
Indicator 35: Homicide victimization by
Equality Score Comparison
202229232136
Value Code 36 Indicator 36: 911 domestic violence calls by geography Domestic violence related 911 calls: North Tulsa compared to South Tulsa Report Year
Comparison Group A: Number of domestic violence calls to 911 from North Tulsa per 1,000 North Tulsa residents Comparison Group B: Number of domestic violence calls to 911 from South Tulsa per 1,000 South Tulsa residents Ratio of Comparison Group A to Comparison Group B 2018 2019 2020 2021 2022 2023 363636373433 70.817 77.858 82.381 94.598 81.100 89.779 26.840 29.198 30.594 36.583 27.108 29.333 2.638 2.667 2.693 2.586 2.992 3.061 The equality score for this indicator increased by 3 since 2018. Domestic violence calls to 911 originate from North Tulsa at a rate that is 2½ times the rate from South Tulsa per capita. tulsaei.org | 45
Equality Score
THEME 5 PUBLIC HEALTH

THEME SCORES
Change Score 2018 to 2023: +7.78
As one of the highest scoring themes in 2023 at 47.67, the Public Health score has increased by nearly eight points since the baseline score of 39.89 in 2018. This theme explores disparities in a wide range of health arenas, including access to health care, personal behaviors impacting health, social determinants of health, mental health, and mortality.
Health is a product of interrelated individual and systemic or structural factors, including genetic predispositions, community and environment, policies and practices of health care systems, and quality of health care. Those factors and many others are referred to as social determinants of health (SDOH) – the social, economic and physical characteristics defining the communities in which people live, work, and play. SDOH have considerable influence on health outcomes and health disparities among different groups of people. Disparities in life expectancy, morbidity and mortality, functional limitations, health care expenditures, and overall health status are impacted by different experiences with social, economic, and physical environments.
SCORES AND DATA BY THEME, TOPIC AND INDICATOR
46 | tulsaei.org 47.67 OUT OF 100 2023 THEME SCORE
2022: 47.67 2023: 47.67 2021: 45.56 2020: 43.78 2019: 43.78 2018: 39.89


Note: For years in which new data are not available, the previous year's scores are repeated for calculation of indicator, topic, theme, and city scores. This is symbolized in the above line graph by a missing icon for those years.
Health Care Access Mortality Well-being 2018 2019 2020 2021 2022 2023 2018 2019 2020 2021 2022 2023 2018 2019 2020 2021 2022 2023 0 20 40 60 80 100 Equality Score Public Health Theme = 47.67/100 Health insurance by race Emergency room use by geography VA appt wait time vs. ntl. average Infant mortality by race Life expectancy by geography CardioV disease mortality by race Food deserts by geography Mentally unhealthy days by income Smoking by geography
tulsaei.org | 47
TOPIC SCORES
For a comprehensive list of all data sources and years used, please see Appendix B, page 64.
The equality score for this indicator increased by 3 since 2018.
The percentage of White Tulsans with health insurance is 35% higher than Hispanic/Latinx Tulsans.
SCORES AND DATA BY THEME, TOPIC AND INDICATOR
Value Code 37 Indicator 37: Health insurance by race Health insurance coverage: White compared to Hispanic/Latinx residents Report Year
Score Comparison Group A: % of White residents with health insurance coverage Comparison Group B: % of Hispanic/Latinx residents with health insurance coverage Ratio of Comparison Group A to Comparison Group B 2018 2019 2020 2021 2022 2023 686969737065 91.0% 88.4% 89.3% 89.5% 89.7% 89.7% 67.2% 66.2% 67.5% 71.7% 68.8% 63.9% 1.354 1.335 1.323 1.248 1.304 1.404
PUBLIC HEALTH TOPIC 1: HEALTH CARE ACCESS Change Score 2018 to 2023: +12.00
Equality
48 | tulsaei.org
2022: 69.67 2023: 69.00 2021: 69.67 2020: 63.33 2019: 70.00 2018: 57.00
Indicator 38: Emergency room use by geography
Value Code 38
Emergency room (ER) visits: North Tulsa compared to South Tulsa residents Report Year Equality Score Comparison Group A: Number of ER visits by North Tulsa residents per 1,000 North Tulsa residents Comparison Group B: Number of ER visits by South Tulsa residents per 1,000 South Tulsa residents Ratio of Comparison Group A to Comparison Group B 2018 2019 2020 2021 2022 2023 394040404038 565.759 474.655 474.655 474.655 474.655 672.954 254.349 233.526 233.526 233.526 233.526 287.183 2.224 2.033 2.033 2.033 2.033 2.343 The equality score for this indicator increased by 1 since 2018. North Tulsa residents use the ER at more than twice the rate of South Tulsa residents. Value Code 39 Indicator 39: Veterans Affairs appointment wait time by comparison to national average Veterans waiting more than 30 days for appointment: Tulsa VA clinics compared to national average Report Year Equality Score Comparison Group A: % of veterans waiting more than 30 days for appointment at Tulsa VA clinics Comparison Group B: National average % of veterans waiting more than 30 days for appointment at VA clinics Ratio of Comparison Group A to Comparison Group B 2018 2019 2020 2021 2022 2023 1001001007710068 4.4% 4.4% 4.4% 5.5% 3.1% 5.0% 4.9% 6.4% 6.4% 4.7% 5.0% 3.7% 0.902 0.686 0.686 1.170 0.619 1.351 The equality score for this indicator
32 since 2018. The percentage of veterans waiting more than 30 days for an appointment at Tulsa's VA clinics is lower than the national average. tulsaei.org | 49
increased by
PUBLIC HEALTH
TOPIC 2: MORTALITY
TOPIC SCORES
Change Score 2018 to 2023: +3.33
For a comprehensive list of all data sources and years used, please see Appendix B, page 64.
Indicator 40: Infant mortality by race
Infant mortality: Black compared to White infant deaths in Tulsa County
Equality Score
The equality score for this indicator increased by 16 since 2018.
Black families experience the death of an infant at a rate that is nearly twice that of White families.
Note: Infant mortality is the death of an infant before their first birthday. Data for this indicator are for Tulsa County.
SCORES AND DATA BY THEME, TOPIC AND INDICATOR
Value Code 40
Report Year
Comparison Group A: Number of Black infant deaths per 1,000 Black live births Comparison Group B: Number of White infant deaths per 1,000 White live births Ratio of Comparison Group A to Comparison Group B 2018 2019 2020 2021 2022 2023
11.550 14.351 16.988 14.782 18.699 21.023 6.329 4.417 5.188 4.351 4.552 6.259 1.825 3.249 3.274 3.397 4.108 3.359
473232312631
50 | tulsaei.org
2022: 34.67 2023: 36.33 2021: 32.67 2020: 34.00 2019: 32.33 2018: 33.00
Indicator 41: Life expectancy by geography
Comparison Group A: Life expectancy in years after age 66 for South Tulsa residents
Comparison
Note: Age of retirement as defined by the U.S Social Security Administration at the time of reporting is 66.
Indicator 42: Cardiovascular disease mortality by race
Report Year Equality Score
Comparison Group A:
Deaths of Black residents from major cardiovascular disease per 100,000 Black residents
Comparison Group B:
Deaths of Hispanic/Latinx residents from major cardiovascular disease per 100,000 Hispanic/Latinx residents
The equality score for this indicator decreased by 2 since 2018.
Black Tulsans die from major cardiovascular disease at a rate that is almost 3½ times that of Hispanic/Latinx Tulsans.
Note: Data for this indicator are for Tulsa County.
Value Code 41
Life expectancy after retirement age: South Tulsa compared to North Tulsa residents Report Year Equality Score
Group
Life expectancy
Ratio of Comparison Group A to Comparison Group B 2018 2019 2020 2021 2022 2023 313533343535 11.641 13.362 13.491 13.232 12.992 13.031 3.353 4.675 4.354 4.550 4.594 4.558 3.471 2.858 3.099 2.908 2.828 2.859
equality score for this
4
2018. South
B:
in years after age 66 for North Tulsa residents
The
indicator decreased by
since
Tulsa residents live 2½ times longer after retirement age than North Tulsa residents.
Value Code 42
Death from major cardiovascular disease: Black compared to Hispanic/Latinx Tulsa County residents (age-adjusted death rates)
Ratio of Comparison Group A to
2018 2019 2020 2021 2022 2023
548.8 492.1 485.4 438.5 345.6 445.6 160.0 193.8 154.0 179.0 127.8 139.7 3.430 2.539 3.152 2.450 2.704 3.190
Comparison Group B
313733373633
tulsaei.org | 51
TOPIC SCORES
For a comprehensive list of all data sources and years used, please see Appendix B, page 64.
Note: A food desert is defined as an area characterized by low income population and limited access to healthy and affordable foods.
SCORES AND DATA BY THEME, TOPIC AND INDICATOR
Value Code 43 Indicator
Food deserts by geography
living in food deserts: North
to South Tulsa households Report Year Equality Score Comparison Group A: Number of North Tulsa households living in food deserts per 1,000 North Tulsa households Comparison Group B: Number of South Tulsa households living in food deserts per 1,000 South Tulsa households Ratio of Comparison Group A to Comparison Group B 2018 2019 2020 2021 2022 2023 20261111 685.571 688.960 727.845 734.040 723.959 723.959 135.243 167.472 1.000 1.000 1.000 1.000 5.069 4.114 727.845 734.040 723.959 723.959
times
PUBLIC HEALTH TOPIC 3: WELL-BEING Change Score 2018 to 2023: +8.00
43:
Households
Tulsa compared
The equality score for this indicator increased by 19 since 2018. The share of residents of North Tulsa living in a food desert is 5
the share of residents of South Tulsa.
52 | tulsaei.org
2022: 38.67 2023: 37.67 2021: 34.33 2020: 34.00 2019: 29.00 2018: 29.67
Note: The survey question reads: "thinking about your mental health, which includes stress, depression, and problems with emotions, for how many days during the past 30 days was your mental health not good?" For this measure, lower income is defined as adults earning less than $50,000 annually; higher income as adults earning $50,000 or more. Data for this indicator are for Tulsa County.
Value Code 44 Indicator 44: Mentally unhealthy days by income 14+ days of poor mental health in past month: lower income compared to higher income Tulsa County adults Report Year
%
mental health
%
mental health Ratio of Comparison Group A to Comparison Group B 2018 2019 2020 2021 2022 2023 504052504235 22.9% 22.7% 20.6% 21.2% 19.5% 17.5% 13.0% 10.9% 12.1% 12.0% 10.0% 6.2% 1.770 2.083 1.702 1.767 1.950 2.823
equality score for this indicator increased by 15 since 2018. Lower
mental health per month
a
higher income adults.
Equality Score Comparison Group A:
of lower income adults with 14+ days of poor
Comparison Group B:
of higher income adults with 14+ days of poor
The
income adults experience 14+ days of poor
at
rate that is 77% higher than
Value Code 45 Indicator 45: Smoking by geography Smoking: North Tulsa compared to South Tulsa residents Report Year
Comparison Group A: % of North Tulsa residents who smoke Comparison Group B: % of South Tulsa residents who smoke Ratio of Comparison Group A to Comparison Group B 2018 2019 2020 2021 2022 2023 435050514453 26.0% 26.4% 27.5% 27.8% 33.9% 28.7% 13.4% 15.0% 15.6% 16.1% 17.7% 17.0% 1.939 1.762 1.757 1.727 1.915 1.688
tulsaei.org | 53
Equality Score
The equality score for this indicator decreased by 10 since 2018. Smoking prevalence in North Tulsa is nearly twice that in South Tulsa.
THEME 6 SERVICES

THEME SCORES
Change Score 2018 to 2023: -0.22
The final theme, Services, scored 36.00 out of 100 in 2023, a slight decrease from the baseline score of 36.22 in 2018. Disparities in indicators analyzed in this theme have important implications for the distribution of voice and power of life-changing resources, and of goods, services, and opportunities dependent on the availability of transportation.
The topics included in this theme involve conditions contributing to Tulsans’ overall quality of life. Access to key resources can make an immense difference in making other opportunities possible; having representation through voting or through public service can give voice to those not normally heard; and effective transportation options can eliminate barriers to educational and employment opportunities.

SCORES AND DATA BY THEME, TOPIC AND INDICATOR
54 | tulsaei.org
OF 100
36.00 OUT
2023 THEME SCORE
2022: 38.22 2023: 36.00 2021: 42.11 2020: 41.78 2019: 39.78 2018: 36.22
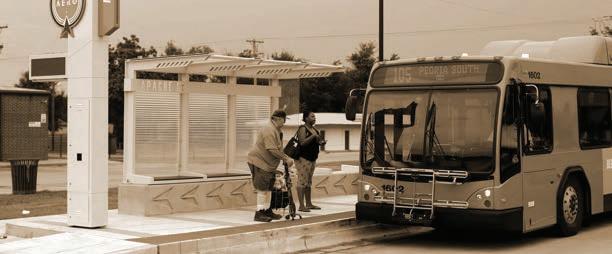

Note: For years in which new data are not available, the previous year's scores are repeated for calculation of indicator, topic, theme, and city scores. This is symbolized in the above line graph by a missing icon for those years.
Resources Political EmpowermentTransportation 2018 2019 2020 2021 2022 2023 2018 2019 2020 2021 2022 2023 2018 2019 2020 2021 2022 2023 0 20 40 60 80 100 Equality Score Services Theme = 36.00/100 Vacant housing by geography Internet access by race Dev. disability services vs. ntl. avg. Government representation by race Voter turnout by geography Homeowner associations by geog.
time by
access by
Bus stop concentration by geog. Commute
transportation Vehicle
race
tulsaei.org | 55
TOPIC 1: RESOURCES
TOPIC SCORES
Change Score 2018 to 2023: -3.00
For a comprehensive list of all data sources and years used, please see Appendix B, page 64.
SCORES AND DATA BY THEME, TOPIC AND INDICATOR
SERVICES
Value Code 46
46:
housing by geography
housing units: North Tulsa
to
Report
Comparison Group A: % of North Tulsa housing units that are vacant Comparison Group B: % of South Tulsa housing units that are vacant Ratio of Comparison Group A to Comparison Group B 2018 2019 2020 2021 2022 2023 404847485147 16.7% 16.6% 17.2% 17.2% 16.9% 17.0% 8.0% 9.2% 9.4% 9.5% 9.7% 9.2% 2.086 1.811 1.828 1.811 1.742 1.848
56 | tulsaei.org
2022: 40.67 2023: 34.67 2021: 43.67 2020: 49.67 2019: 49.33 2018: 37.67
Indicator
Vacant
Vacant
compared
South Tulsa
Year Equality Score
The equality score for this indicator decreased by 7 since 2018. Housing vacancy rate in North Tulsa is twice that of South Tulsa.
Indicator 47: Internet access by race
Lack of access to computer with high speed internet at home: Hispanic/Latinx compared to White households
Report
Year
Equality Score
Comparison Group A: % of Hispanic/Latinx households without internet access
Comparison Group B: % of White households without internet access
The equality score for this indicator is the same as in 2018. The percentage of Hispanic/Latinx Tulsans without access to a computer with high speed internet at home is more than double the percentage of White Tulsans.
Note: This indicator represents the proportion of households that either have no computer or have a computer but no internet subscription.
Indicator 48: Services for persons with developmental disabilities by comparison to national average
Increase in state funding needed to serve persons with intellectual or develomental disabilities (IDD) on waiting list: OK compared to ntl. avg.
Report Year Equality Score
Comparison Group A: % increase in state funding needed to serve Oklahomans with IDD on waiting list
Comparison Group B: National average % increase in state funding needed to serve people with IDD on waiting list
The equality score for this indicator decreased by 2 since 2018.
The percent increase in state funding needed to serve Oklahomans with developmental disabilities is more than 3 times higher than the national average.
Note: Full definition of indicator: the ratio of the percent increase needed in Medicaid waiver and/or Intermediate Care Facility for Individuals with Intellectual Disabilities (ICF/IID) programs in order to serve persons with intellectual and developmental disabilities who are on the waiting list for Medicaid-waiver-funded long-term supports and services (LTSS) for Oklahoma to national average.
Value Code 47
Ratio of Comparison
A to Comparison Group B 2018 2019 2020 2021 2022 2023
19.1% 12.8% 12.1% 12.1% 18.2% 26.3% 8.6% 7.3% 8.5% 10.6% 14.1% 11.8% 2.221 1.753 1.435 1.142 1.291 2.229
Group
395064787139
Value Code 48
Ratio of Comparison Group A
2018 2019 2020 2021 2022 2023
83.5% 100.1% 100.6% 101.7% 97.0% 103.7% 19.5% 22.0% 19.5% 22.0% 23.4% 26.2% 4.273 4.549 5.153 4.623 4.145 3.958
to Comparison Group B
252420232627
tulsaei.org | 57
TOPIC 2: POLITICAL EMPOWERMENT
TOPIC SCORES
Change Score 2018 to 2023: -3.00
For a comprehensive list of all data sources and years used, please see Appendix B, page 64.
The equality score for this indicator decreased by 1 since 2018. White Tulsans are represented on Tulsa Authorities, Boards, and Commissions at a rate that is 2½ times the rate of Hispanic/Latinx Tulsans.
SCORES AND DATA BY THEME, TOPIC AND INDICATOR
SERVICES
Value Code 49
Comparison Group A: Number of White members of ABCs per 1,000 White residents Comparison Group B: Number of Hispanic/Latinx members of ABCs per 1,000 Hispanic/Latinx residents Ratio of Comparison Group A to Comparison Group B 2018 2019 2020 2021 2022 2023
0.717 0.747 0.719 1.219 1.012 0.857 0.280 0.342 0.363 0.493 0.324 0.354 2.561 2.185 1.981 2.473 3.121 2.421
Indicator 49: Government representation by race Membership on City of Tulsa Authorities, Boards and Commissions (ABCs): White compared to Hispanic/Latinx residents Report Year Equality Score
373941373338
58 | tulsaei.org
2022: 36.67 2023: 37.67 2021: 45.33 2020: 39.67 2019: 39.00 2018: 40.67
Indicator 50: Voter turnout by geography
Participation in last general election: South Tulsa compared to North Tulsa voting age citizens
Note: Voter turnout for this indicator is measured as those voting in the last general election at the time of data collection.
Indicator 51: Neighborhood and homeowner associations by
The equality score for this indicator increased by 1 since 2018.
South Tulsa has 2½ times the number of Neighborhood and Homeowner Associations as East Tulsa per capita.
Value Code 50
Report
Comparison Group A: Number of South Tulsans who voted per 1,000 South Tulsa voting age citizens Comparison Group B: Number of North Tulsans who voted per 1,000 North Tulsa voting age citizens Ratio of Comparison Group A to Comparison Group B 2018 2019 2020 2021 2022 2023 393956454848 470.365 470.365 582.563 458.326 546.499 546.499 213.846 213.846 363.032 243.714 303.537 303.537 2.200 2.200 1.605 1.881 1.800 1.800 The equality score for this indicator decreased by 9 since 2018. Voter turnout in South Tulsa is twice that of North Tulsa.
Year Equality Score
Value Code 51
and Homeowner
Tulsa
Year
Comparison Group A: Number of NHAs in South Tulsa per 1,000 South Tulsa residents Comparison Group B: Number of NHAs in East Tulsa per 1,000 East Tulsa residents Ratio of Comparison Group A to Comparison Group B 2018 2019 2020 2021 2022 2023 373239373636 1.454 1.238 1.388 1.366 1.333 1.261 0.589 0.381 0.615 0.549 0.486 0.462 2.470 3.250 2.257 2.488 2.743 2.729
geography Neighborhood
Associations (NHA): South Tulsa compared to East
Report
Equality Score
tulsaei.org | 59
For a comprehensive list of all data sources and years used, please see Appendix B, page 64.
SCORES AND DATA BY THEME, TOPIC AND INDICATOR
Value Code 52
52: Bus stop concentration by geography Bus stops: Midtown Tulsa compared to South Tulsa Report Year
Score Comparison Group A: Number of bus stops in Midtown Tulsa per 1,000 Midtown Tulsa residents Comparison Group B: Number of bus stops in South Tulsa per 1,000 South Tulsa residents Ratio of Comparison Group A to Comparison Group B 2018 2019 2020 2021 2022 2023 333434352124 4.004 4.392 4.401 4.324 6.155 6.817 1.289 1.464 1.502 1.498 1.267 1.543 3.107 3.001 2.930 2.887 4.858 4.418
equality
Midtown Tulsa
3 times
bus stops per capita
South Tulsa. 60 | tulsaei.org
2022: 37.33 2023: 35.67 2021: 37.33 2020: 36.00 2019: 31.00 2018: 30.33
SERVICES TOPIC 3: TRANSPORTATION Change Score 2018 to 2023: +5.34
Indicator
Equality
The
score for this indicator increased by 9 since 2018.
has
as many
as
TOPIC SCORES
Indicator 53: Commute time by mode of transportation
Equality Score
Note: For this indicator, commute time to work does not include persons who work from home.
Indicator 54: Vehicle access by
The equality score for this indicator increased by 4 since 2018.
Value Code 53
Commute time of less than 30 minutes: private vehicle compared to public transportation Report Year
Comparison Group A: % of private vehicle users with a 30 minute or less commute
Group B: % of public transportation users with a 30 minute or less commute Ratio of Comparison Group A to Comparison Group B 2018 2019 2020 2021 2022 2023 393939383736 86.0% 85.8% 85.4% 85.4% 85.5% 85.8% 38.8% 39.5% 39.6% 36.1% 34.7% 32.3% 2.218 2.172 2.158 2.369 2.467 2.653 The equality score for this indicator increased by 3 since 2018. The percentage of private vehicle commuters traveling less than 30 minutes to work is twice that of public transportation commuters.
Comparison
Value Code 54
Year
Group A: % of Black households without
to
vehicle
Group B: % of White households without access to a vehicle Ratio of Comparison Group A to Comparison Group B 2018 2019 2020 2021 2022 2023 353939353531 12.9% 13.4% 12.7% 15.7% 15.7% 16.3% 4.6% 6.1% 5.7% 5.6% 5.6% 4.8% 2.839 2.192 2.232 2.804 2.804 3.396
race Lack of vehicle access: Black compared to White households Report
Equality Score Comparison
access
a
Comparison
tulsaei.org | 61
The percentage of Black householders without access to a vehicle is nearly 3 times that of White householders.
APPENDIX A
TULSA REGIONS
REGION ZIP CODES 2022 POPULATION East Tulsa 74108, 74116, 74128, 74129, 74134, 74146 81,527 Midtown Tulsa 74103, 74104, 74105, 74112, 74114, 74119, 74120, 74135, 74145 127,368 North Tulsa 74106, 74110, 74115, 74117, 74126, 74127, 74130 82,650 South Tulsa 74133, 74136, 74137 108,642 West Tulsa 74107, 74132 30,229 City of Tulsa 411,938
74104
74103
74132
74107
74137
74136
74133
74130
74127
74126
74117
74115 74110
74106
74145
74135
74120 74119
74114
74112
74105
74146
74134
74129
74128
74116
74108
Tulsa Midtown Tulsa North Tulsa South Tulsa West Tulsa EAST MIDTOWN NORTH SOUTH WEST
East
TULSA EQUALITY INDICATORS REGIONS WITH OVERLAY OF CITY OF TULSA NEIGHBORHOOD CONDITIONS INDEX
NEIGHBORHOOD STATISTICAL AREAS
This map shows the boundaries of the 80 Neighborhood Statistical Areas defined by the City of Tulsa’s Neighborhood Conditions Index (NCI) in relation to Equality Indicator regions.
While Tulsa Equality Indicators regions are based on zip codes, NCI areas are based on census tracts, producing boundary lines that don’t necessarily align. NCI regions 46 and 47 are located within large zip codes that are associated primarily with other incorporated places.
The NCI provides detailed demographic and socioeconomic data as well as information about land use, transportation, economic development, access to social and cultural opportunities, public services and much more for every Tulsa neighborhood.
Learn more Tulsa’s Neighborhood Conditions Index and access reports at https://tulsaplanning.org/ neighborhoods/nci/
tulsaei.org | 63 73 69 68 55 45 44 36 15 40 80 48 20 60 24 42 50 64 49 46 54 70 30 74 47 43 34 28 58 22 26 29 62 66 52 25 78 59 65 56 38 27 72 79 76 67 32 23 75 39 57 63 53 35 77 37 33 10 41 14 18 12 21 16 19 61 51 17 71 13 31 11 4 8 2 6 9 5 7 3 1 46 47 East Tulsa Midtown Tulsa North Tulsa South Tulsa West Tulsa
1 Osage Hills 2 Gilcrease Hills 3 Chamberlain 4 North Ridge 5 Walt Whitman 6 Flat Rock Creek 7 Hawthorne 8 Lloyd Park 9 Reservoir Hill-The Heights 10 Dunbar-Greenwood 11 Booker T Washington 12 Springdale 13 Louisville Heights 14 Mohawk Park-Dawson 15 Mingo Valley 16 Crutchfield 17 Cherokee Heights 18 Sequoyah 19 Maplewood 20 McKinley-Mitchell 21 Charles Page 22 Irving 23 Downtown 24 Pearl 25 Kendall-Whittier 26 Turner Park 27 Braden Park 28 McClure Park 29 Layman-Clarland 30 Western Village 31 Berryhill 32 Red Fork 33 Garden City 34 Eugene Field 35 Riverview 36 Maple Ridge 37 Cherry Street 38 Renaissance-Florence Park 39 Fair 40 Wedgwood-Crowell Heights 41 Leisure Lanes 42 Metcalfe-Magic Circle 43 Cooper 44 Tower Heights 45 East Woods 46 Spunky Creek 47 Fair Oaks 48 Woodward Park 49 Bryn Mawr-Lakewood 50 Mayo 51 Hoover 52 Terrace 53 Longview 54 Eastland 55 West Brookside 56 East Brookside 57 Ranch Acres 58 Whiteside 59 Southroads-Briarwood 60 Briarglen-Plaza 61 Stone Ridge 62 South Brookside 63 Patrick Henry 64 Park Plaza 65 Sungate 66 Regency-Woodland 67 Alsuma 68 Crystal Creek-Quail Ridge 69 Turkey Mountain 70 Riverwood 71 Southern Hills 72 Tulsa Hills 73 Kensington 74 Harvard Bend 75 Grissom-Thoreau 76 Woodland Hills 77 Vensel Creek 78 Hunter Park 79 South Ridge 80 South Point Map Label Neighborhood Statistical Area
APPENDIX B
DATA SOURCES
THEME 1: ECONOMIC OPPORTUNITY
Topic 1: Business Development

Indicator 1. Business Ownership by Gender: U.S. Census Bureau, 2016, 2017, 2018, 2019, 2021, & 2022 American Community Survey 1-Year Estimates
Indicator 2. Business Ownership by Race: U.S. Census Bureau, 2016, 2017, 2018, 2019, 2021, & 2022 American Community Survey 1-Year Public Use Microdata Sample (PUMS)
Indicator 3. Payday Loans & Banks by Geography: Data Axle (formerly ReferenceUSA), U.S. Historical Businesses Database, 2017, 2018, 2019, 2020, 2021, & 2022
Topic 2: Employment
Indicator 4. Unemployment by Race: U.S. Census Bureau, 2016, 2017, 2018, 2019, 2021, & 2022 American Community Survey 1-Year Estimates
Indicator 5. Commute time by Geography: U.S. Census Bureau, 2016, 2017, 2018, 2019, 2021, & 2022 American Community Survey 5-Year Estimates
Indicator 6. High Wage Occupations by Race: U.S. Census Bureau, 2016, 2017, 2018, 2019, 2021, & 2022 American Community Survey 1-Year Estimates
Topic 3: Income
Indicator 7. Living wage by geography: U.S. Census Bureau, 2016, 2017, 2018, 2019, 2021, & 2022 American Community Survey 5-Year Estimates
Indicator 8. Median household income by race: U.S. Census Bureau, 2016, 2017, 2018, 2019, 2021, & 2022 American Community Survey 1-Year Estimates
Indicator 9. Poverty by educational attainment: U.S. Census Bureau, 2016, 2017, 2018, 2019, 2021, & 2022 American Community Survey 1-Year Estimates
THEME 2: EDUCATION
Topic 1: Impediments to Learning

Indicator 10. Suspensions by race: Tulsa Public Schools unpublished data, School Years 2017, 2018, 2019, 2020, 2021, & 2022
Indicator 11. Chronic absenteeism by race: Tulsa Public Schools unpublished data, School Years 2017 & 2020; Oklahoma State Department of Education, Oklahoma School Report Cards, School Years 2018, 2019, 2022, & 2023
Indicator 12. Dropping Out by Income: Tulsa Public Schools unpublished data, School Years 2016, 2017, 2018, 2019, 2020, & 2022
Topic 2: Quality and Opportunity
Indicator 13. Emergency Teacher Certification by Geography: Oklahoma State Department of Education, Emergency Certifications webpage, School Years 2017, 2018, & 2021; Oklahoma State Department of Education, Unpublished State Board of Education meeting report, School Year 2024
Indicator 14. Postsecondary Opportunities Participation by English Proficiency: Oklahoma State Department of Education, Oklahoma School Report Cards, School Years 2018, 2019, 2022, & 2023
Indicator 15. School A-F Report Card Score by Income: Oklahoma State Department of Education, Oklahoma School Report Cards, School Years 2018, 2019, 2022, & 2023; Oklahoma State Department of Education, Low Income Report, School Years 2018, 2019, 2022, & 2023
Topic 3: Student Achievement
Indicator 16. Third Grade Reading Proficiency by Income: Tulsa Public Schools unpublished data, School Years 2017, 2018, 2019, 2021, 2022, & 2023
Indicator 17. Graduation by English Proficiency: Oklahoma State Department of Education, Oklahoma School Report Cards, School Years 2017, 2018, 2019, 2021, & 2022
Indicator 18. College Completion by Race: U.S. Census Bureau, 2016, 2017, 2018, 2019, 2021, & 2022 American Community Survey 1-Year Estimates
64 | tulsaei.org
THEME 3: HOUSING
Topic 1: Homeownership

Indicator 19. Homeownership by Race: U.S. Census Bureau, 2016, 2017, 2018, 2019, 2021, & 2022 American Community Survey 1-Year Estimates
Indicator 20. Home Purchase Loan Denial by Race: Federal Financial Institutions Examination Council, Home Mortgage Disclosure Act Database, Conventional Purchases by Race, 2016, 2017, 2018, 2019, 2020, & 2022
Indicator 21. Housing Cost Burden by Income: U.S. Census Bureau, 2016, 2017, 2018, 2019, 2021, & 2022 American Community Survey 1-Year Estimates
Topic 2: Homelessness
Indicator 22. Youth Homelessness by Race: Homeless Management Information System, Annual Homeless Assessment Report to Congress, for annual time periods beginning October 1, 2016 to September 30, 2020; A Way Home for Tulsa Interactive Data Dashboard, for annual time periods beginning October 1, 2021 to September 30, 2023
Indicator 23. Homelessness by Veteran Status: Homeless Management Information System, Annual Homeless Assessment Report to Congress, for annual time periods beginning October 1, 2016 to September 30, 2020; A Way Home for Tulsa Interactive Data Dashboard, for annual time periods beginning October 1, 2021 to September 30, 2023
Assessment Report to Congress; U.S. Census Bureau, American Community Survey, 2021 1-Year Estimates
Indicator 24. Homelessness by Disability Status: Homeless Management Information System, Annual Homeless Assessment Report to Congress, for annual time periods beginning October 1, 2016 to September 30, 2020; A Way Home for Tulsa Interactive Data Dashboard, for annual time periods beginning October 1, 2021 to September 30, 2023; Assessment Report to Congress; U.S. Census Bureau, American Community Survey, 2021 1-Year Estimates
Topic 3: Tenant stability
Indicator 25. Rent Burden by Income: U.S. Census Bureau, 2016, 2017, 2018, 2019, 2021, & 2022 American Community Survey 1-Year Estimates
Indicator 26. Evictions by Race: The Eviction Lab, 2015 & 2016; Open Justice Oklahoma, Oklahoma Policy Institute, unpublished data for calendar years 2019, 2020, & 2023
Indicator 27. Housing Complaints by Geography: Tulsa Health Department unpublished data, 2017, 2018, 2019, 2020, 2021, & 2022
THEME 4: JUSTICE
Topic 1: Arrests

Indicator 28. Juvenile Arrests by Race: Oklahoma State Bureau of Investigation unpublished data, 2016, 2017, 2018, 2019, 2020, & 2022
Indicator 29. Adult Arrests by Race: Oklahoma State Bureau of Investigation unpublished data, 2016, 2017, 2018, 2019, 2020, & 2022
Indicator 30. Female Arrests by Comparison to National Average: Oklahoma State Bureau of Investigation unpublished data, 2016, 2017, 2018, 2019, 2020, & 2022; Federal Bureau of Investigation, Uniform Crime Reporting: National Incident-Based Reporting System, 2016, 2017, 2018, 2019, 2020, & 2022
Topic 2: Law Enforcement
Indicator 31. TPD Workforce by Race: Tulsa Police Department, 2016, 2017, 2018, 2019, & 2022 Internal Affairs Annual Report; Tulsa Police Department unpublished data, 2020
Indicator 32. TPD workforce by gender: Tulsa Police Department, 2016, 2017, 2018, 2019, & 2022 Internal Affairs Annual Report; Tulsa Police Department unpublished data, 2020
Indicator 33. Officer use of force by subject race: Tulsa Police Department, 2016, 2017, 2018, 2019, & 2022 Internal Affairs Annual Report; Tulsa Police Department unpublished data, 2020
Topic 3: Safety and Violence
Indicator 34. Child Abuse and Neglect by Comparison to National Average: Oklahoma Department of Human Services, FY 2015, 2016, 2017, 2018, 2019, & 2021 Annual Report Statistical Tables; U.S. Department of Health & Human Services, Administration for Children and Families, Administration on Children, Youth and Families, Children's Bureau, Child Maltreatment 2015, 2016, 2017, 2018, 2019, & 2021
Indicator 35. Homicide Victimization by Race: City of Tulsa unpublished data, 2016, 2017, 2018, 2019, 2020, & 2022
Indicator 36. 911 Domestic Violence Calls by Geography: City of Tulsa unpublished data, 2016, 2017, 2018, 2019, 2020, & 2022
tulsaei.org | 65
THEME 5: PUBLIC HEALTH
Topic 1: Health Care Access

Indicator 37. Health Insurance by Race: U.S. Census Bureau, 2016, 2017, 2018, 2019, 2021, & 2022 American Community Survey 1-Year Estimates
Indicator 38. Emergency Room Use by Geography: Tulsa Health Department unpublished data, 2017, 2018, & 2022
Indicator 39. Veterans Affairs Appointment Wait Time by Comparison to National Average: U.S. Dept. of Veterans Affairs, Completed Appointment Wait Times National, Facility, and Division Level Summaries, Measured from Preferred Date for Reporting Periods Ending: October 2017, 2018, 2019, 2020, and February 2021
Topic 2: Mortality
Indicator 40. Infant Mortality by Race: Oklahoma State Department of Health, Center for Health Statistics, Health Care Information, Vital Statistics 2016, 2017, 2018, 2019, 2020, & 2021
Indicator 41. Life Expectancy by Geography: Tulsa Health Department unpublished data, 2013-15, 2014-16, 2015-17, 2016-18, 2017-19, & 2019-21
Indicator 42. Cardiovascular Disease Mortality By Race: Oklahoma State Department of Health, Center for Health Statistics, Health Care Information, Vital Statistics 2016, 2017, 2018, 2019, 2020, & 2021
Topic 3: Well-being
Indicator 43. Food Deserts by Geography: INCOG unpublished data, 2018, 2019, 2020, 2021, & 2023
Indicator 44. Mentally Unhealthy Days by Income: Oklahoma State Department of Health, Center for Health Statistics, Health Care Information, Behavioral Risk Factor Surveillance System 2015-16, 2016-17, 2017-18, 2018-19, 2019-20, & 2021-22
Indicator 45. Smoking by Geography: Centers for Disease Control and Prevention, 500 Cities & Places: Local Data for Better Health, Model-based estimates for current smoking among adults aged >=18 years, 2017, 2018, 2019, 2020, 2021, & 2023 releases; Behavioral Risk Factor Surveillance System (BRFSS), 2015, 2016, 2017, 2018, 2019, & 2021
THEME 6: SERVICES
Topic 1: Resources

Indicator 46. Vacant Housing by Geography: U.S. Census Bureau, 2016, 2017, 2018, 2019, 2021, & 2022 American Community Survey 5-Year Estimates
Indicator 47. Internet Access by Race: U.S. Census Bureau, 2016, 2017, 2018, 2019, 2021, & 2022 American Community Survey 1-Year Estimates
Indicator 48. Services For Persons With Developmental Disabilities By Geography: Larson, S. A., et al, 2017, 2018, 2019, 2020, & 2021, In-home and residential long-term supports and services for persons with intellectual or developmental disabilities: Status and trends 2014 through 2018; Larson, S. A., et al, 2022, Long-term supports and services for persons with intellectual or developmental disabilities: Status and trends through 2019.
Topic 2: Political Empowerment
Indicator 49. Government Representation by Race: City of Tulsa open data, 2017, 2018, 2019, 2021, 2022, & 2023
Indicator 50. Voter Turnout by Geography: Oklahoma State Election Board data request, November 2016, 2018, & 2020 elections; Oklahoma State Election Board, OK Election Data Warehouse, November 2022 general election
Indicator 51. Neighborhood and Homeowner Associations by Geography: City of Tulsa open data, 2017, 2018, 2019, 2021, 2022, & 2024
Topic 3: Transportation
Indicator 52. Bus Stop Concentration by Geography: Metropolitan Tulsa Transit Authority unpublished data, 2018; INCOG unpublished data, 2019, 2020, 2021, 2022, & 2023
Indicator 53. Commute Time by Mode of Transportation: U.S. Census Bureau, 2016, 2017, 2018, 2019, 2021, & 2022 American Community Survey 1-Year Estimates
Indicator 54. Vehicle Access by Race: U.S. Census Bureau, 2016, 2017, 2019, 2021, & 2022 American Community Survey 1-Year Public Use Microdata Sample (PUMS)
66 | tulsaei.org
References: Pierson, Emma, Camelia Simoiu, Jan Overgoor, Sam Corbett-Davies, Daniel Jenson, Amy Shoemaker, Vignesh Ramachandran, Phoebe Barghouty, Cheryl Phillips, Raci Shroff, and Sharad Goel. 2020. “A Large-scale Analysis of Racial Disparities in Police Stops across the United States.” Nature Human Behaviour, May 4, 2020, https://www.nature.com/articles/s41562-020-0858-1; Human Rights Watch. 2019. “Get on the Ground!”: Policing, Poverty, and Racial Inequality in Tulsa, Oklahoma.” https://www.hrw.org/ report/2019/09/12/get-ground-policing-poverty-and-racial-inequality-tulsa-oklahoma/case-study-us; Vielehr, Peter S. 2019. “Racial Bias in Police Officers Discretionary Search Decisions and Associated Community Mental Health Consequences: Evidence from Nashville, Tennessee.” PhD diss., Vanderbilt University; Hinton, Elizabeth, LeShae Henderson, and Cindy Reed. 2018. “An Unjust Burden: The Disparate Treatment of Black Americans in the Criminal Justice System.” Vera Institute of Justice Evidence Brief, May 2018; Balko, Radley. 2018. “There’s Overwhelming Evidence that the Criminal-Justice System is Racist. Here’s the Proof.” Washington Post, Sept. 18, 2018;
The Sentencing Project. 2018. Report of the Sentencing Project to the United Nations Special Rapporteur on Contemporary Forms of Racism, Racial Discrimination, Xenophobia, and Related Intolerance: Regarding Racial Disparities in the United States Criminal Justice System; The Sentencing Project. 2015. Black Lives Matter: Eliminating Racial Inequity in the Criminal Justice System;
The Sentencing Project. 2014. Disproportionate Minority Contact in the Juvenile Justice System; Eberhardt, Jennifer L. 2019. Biased: Uncovering the Hidden Prejudice That Shapes What We See, Think, and Do. New York: Viking
Notes: In addition to indicators using the U.S. Census Bureau's American Community Survey (ACS) as the primary data source as noted above, ACS data were used in the calculation of rates for many other indicators. For example, ACS population counts for youth by race were used to calculate rates of homelessness for indicator 22, Youth homelessness by race. ACS 1-year estimates were used when possible, but in several instances 5-year estimates were required. For indicator 53, Commute time by mode of transportation, 5-year estimates were used because of excessively high margins of error associated with the 1-year estimates. Five-year estimates were used for all indicators making regional comparisons due to unavailability of ACS 1-year estimates at the zip code level.
Ten of the 54 indicators have one or more years for which new data were not available at the time of report preparation for that particular year. In those instances, the prior year's data and scores were repeated and were used to calculate topic, theme, and city scores. Indicators with repeated year(s) of data include:
Indicator
Repeated Data by Report Year
tulsaei.org | 67
Emergency teacher certification by geography 2020, 2022 Postsecondary opportunities participation by English proficiency 2019, 2021 School report card score by income 2019, 2021 Graduation by English proficiency 2021 Evictions by race 2022 Emergency room use by geography 2020, 2021, 2022 Veterans Affairs appointment wait time by comparison to national average 2022 Food deserts by geography 2019
turnout by geography 2019, 2023
access by race 2020
Voter
Vehicle
APPENDIX C
SCORE TO RATIO CONVERSION TABLE
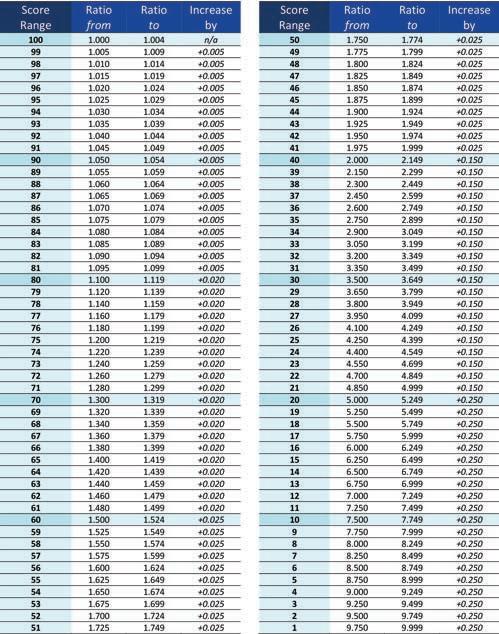
68 | tulsaei.org
APPENDIX D
INDICATOR INDEX
THEME 1: ECONOMIC OPPORTUNITY
THEME 2: EDUCATION
THEME 3: HOUSING

Topic 1: Business Development Indicator 1: Business Ownership by Gender Indicator 2: Business Ownership by Race Indicator 3: Payday Loans & Banks by Geography Topic 2: Employment Indicator 4: Unemployment by Race Indicator 5: Commute Time by Geography Indicator 6: High-wage Occupations by Race Topic 3: Income Indicator 7: Living Wage by Geography Indicator 8: Median Household Income by Race Indicator 9: Poverty by Educational Attainment
Topic 1: Impediments to Learning Indicator 10: Suspensions by Race Indicator 11: Chronic Absenteeism by Race Indicator 12: Dropping Out by Income Topic 2: Quality and Opportunity Indicator 13: Emergency Teacher Certification by Geography Indicator 14: Postsecondary Opportunities Participation by English Proficiency Indicator 15: School A-F Report Card Score by Income Topic 3: Student Achievement Indicator 16: Third Grade Reading Proficiency by Income Indicator 17: Graduation by English Proficiency Indicator 18: College Completion by Race
1: Homeownership
19: Homeownership by Race
20: Home Purchase Loan Denial by Race Indicator 21: Housing Cost Burden by Income
2: Homelessness
22: Youth Homelessness by Race Indicator 23: Homelessness by Veteran Status Indicator 24: Homelessness by Disability Status
3: Tenant Stability Indicator 25: Rent Burden by Income Indicator 26: Evictions by Race Indicator 27: Housing Complaints Geography tulsaei.org | 20 tulsaei.org | 69
Topic
Indicator
Indicator
Topic
Indicator
Topic

4: JUSTICE Topic 1: Arrests Indicator 28: Juvenile Arrests by Race 40 Indicator 29: Adult Arrests by Race 41 Indicator 30: Female Arrests by Comparison to National Average 41 Topic 2: Law Enforcement Indicator 31: TPD Workforce by Race 42 Indicator 32: TPD Workforce by Gender 43 Indicator 33: Officer Use of Force by Subject Race 43 Topic 3: Safety and Violence Indicator 34: Child Abuse & Neglect by Comparison to National Average 44 Indicator 35: Homicide Victimization by Race 45 Indicator 36: 911 Domestic Violence Calls by Geography 45 THEME 5: PUBLIC HEALTH Topic 1: Health Care Access Indicator 37: Health Insurance by Race 48 Indicator 38: Emergency Room Use by Geography 49 Indicator 39: Veterans Affairs Appointment Wait Time vs. National Average 49 Indicator 40: Infant Mortality by Race 50 Topic 2: Mortality Indicator 41: Life Expectancy by Geography 51 Indicator 42: Cardiovascular Disease Mortality by Race 51 Topic 3: Well-being Indicator 43: Food Deserts by Geography 52 Indicator 44: Mentally Unhealthy Days by Income 53 Indicator 45: Smoking Geography 53 THEME 6: SERVICES Topic 1: Resources Indicator 46: Vacant Housing by Geography 56 Indicator 47: Internet Access by Race 57 Indicator 48: Services for Persons with Developmental Disabilities by Geography 57 Topic 2: Political Empowerment Indicator 49: Government Representation by Race 58 Indicator 50: Voter Turnout by Geography 59 Indicator 51: Neighborhood and Homeowner Associations by Geography 59 Topic 3: Transportation Indicator 52: Bus Stop Concentration by Geography 60 Indicator 53: Commute Time by Mode of Transportation 61 Indicator 54: Vehicle Access by Race 61
THEME
CONTRIBUTORS
NARRATIVE
Melanie Poulter, Research and Data Director, Tulsa Area United Way
Krystal Reyes, Chief Resilience Officer, City of Tulsa, Office of the Mayor
DATA CURATION & VALIDATION
Melanie Poulter, Research and Data Director, Tulsa Area United Way
DATA ANALYTICS AND VISUALIZATION
Chris Anrig, Technical Specialist II, Community Service Council
LAYOUT AND DESIGN
Carlos Moreno & Lindsay Myers, Project Managers, 9b Corp.
ACKNOWLEDGMENTS
The Tulsa Equality Indicators team would like to thank the following people and organizations for their subject matter expertise and assistance with data collection and analysis which helped make this report possible:
• Alisia Myers, Neighborhood Liaison, City of Tulsa Working in Neighborhoods
• Amanda Fullerton, Data Analyst, Tulsa Health Department
• Brycen Gregory, Research Director, Oklahoma Policy Institute
• Christopher Cordova, Statistical Research Specialist, Statistical Analysis Center, Oklahoma State Bureau of Investigation
• Daniel Wallach, Associate Data Strategist, Data Strategy and Analytics, Tulsa Public Schools
• Dr. Robby Hedrick, Director of Transition Services, Coffee Bunker
• Joshua Starks, Commander, Tulsa VFW Post 577, and Human Rights Commissioner, City of Tulsa
• Kerri Ishem, Instructional Coach, Tulsa Public Schools
• Kia Shagena, Planner, Long Range & Strategic Planning, Tulsa Planning Office, Department of City Experience
• Nia Peterson, Community Investments Associate, Tulsa Area United Way
• Olivia Denton Koopman, Chief Data and Policy Officer, Housing Solutions
• Tamara Franklin, Crime and Intelligence Analyst, City of Tulsa Police Department – Forensic Laboratory Division
• Ty Simmons, Principal GIS Analyst, INCOG


tulsaei.org | 71


EXPLORE THE DATA AT TULSAEI.ORG
