Running the River
A Proof-of-Concept Study for Funding Improvements and Programming for the Shiawassee River Water Trail Using Tax Increment Financing


Prepared For The Shiawassee River Water Trail Coalition
Authored By MURP Consulting at Taubman College: Kat Cameron, Catherine Carlberg, Marco Dominguez, Nida Khan, Luke Ranker, Elsa Soderberg, Olivia Stillman, and Alex Wilkinson
Faculty Advisor
Dr. Richard Norton
A project submitted in partial fulfillment of the requirements for the degree of Master of Urban and Regional Planning.
University of Michigan
Alfred A. Taubman College of Architecture and Urban Planning

April 2023

1
This report was designed using a template from SlidesGo and graphics from Freepik.
Acknowledgements
Land Acknowledgement
List of Acronyms
List of Figures
List of Tables
Executive Summary
Chapter 1. Introduction
Chapter 2. Methods
Chapter 3. Results: Background Research
Case Study: French Broad River Water Trail, NC
Case Study: Huron River Water Trail, MI
Chapter 4. Results: SRWTC-Specific TIF & Equity Analysis
Case Study: Upper Grand River Water Trail, MI
Case Study: Lake Superior Water Trail, MN
Chapter 5. Assessment
Chapter 6. Conclusions and Next Steps
Appendices
A: GIS Analysis Methodology
B: Shiawassee River Water Trail TIF Maps by Jurisdiction
C: TIF Analysis Methodology
D: Survey Questions
E: Interviewees
F: Inclusive Universally Accessible & ADA Compliant Water Trail Launch Site Features
3 4 5 6 7 8 12 24 28 31 35 54 57 77 86 102 110 110 116 146 153 154 155
TABLE OF CONTENTS
2
ACKNOWLEDGEMENTS
We would like to first thank our client, the Shiawassee River Water Trail Coalition, for engaging us to work on this project, and for offering their input and guidance along the way. Specifically, the Chair of the Shiawassee River Water Trail Coalition, David Lossing, has been instrumental in helping refine the scope of our project, gathering data and information, and tailoring our findings to fit the needs of the Shiawassee River Water Trail Coalition.
We would like to thank the University of Michigan Alfred A. Taubman College of Architecture and Urban Planning for the opportunity to conduct this research as part of our master’s capstone project.
We are greatly appreciative of the time, effort, and expertise contributed by numerous individuals and organizations across Michigan and the U.S. as we conducted our research. Thank you.
Last but certainly not least, we would like to thank Dr. Richard Norton and Lanika Sanders for their support and leadership in guiding this team throughout the capstone process. Their insights and guidance were essential to the successful completion of this project.
3 3
LAND ACKNOWLEDGEMENT
The University of Michigan is located on the territory of the Anishinaabe people. The Ann Arbor campus currently resides on land ceded through the Treaty of Detroit in 1807. Additionally, in 1817, the Ojibwe, Odawa, and Bodewadami Nations made the largest single land transfer to the University of Michigan, ceded through the Treaty of Fort Meigs, with the hope that their children could be educated. We acknowledge the sovereignty of tribal lands and the painful history of genocide, forced assimilation, and displacement of Native communities that facilitated the establishment of the University. We affirm contemporary and ancestral Anishinaabek ties to this land, the profound contributions of Native Americans to this institution, and the University’s commitment to educating the children of Native ancestors.
We acknowledge that the Shiawassee River flows through the ancestral, traditional, and contemporary lands of the Anishinaabek – Three Fires Confederacy of Ojibwe, Odawa, and Bodewadami people. The Shiawassee River traverses land ceded in the 1807 Treaty of Detroit and the 1819 Treaty of Saginaw. We also recognize that the river also crosses lands within the traditional Homelands of the Wynadot, Peoria, Sauk, and other Indigenous nations. We affirm Indigenous sovereignty and hold the Shiawassee River Water Trail Coalition accountable to the needs of Indigenous peoples.
4
LIST OF ACRONYMS
ADA Americans With Disabilities Act (1990)
ATC Appalachian Trail Coalition
BRABrownfield Redevelopment Authority
CIACorridor Improvement Authority
CREP Conservation Reserve Enhancement Program
CWSRFClean Water State Revolving Fund
DDADowntown Development Authority
EGLE Michigan Department of Environment, Great Lakes, and Energy
EPA U.S. Environmental Protection Agency
ESRIEnvironmental Systems Research Institute, Inc.
FHWAFederal Highway Administration
GISGeographic Information Systems
HPMHedonic Pricing Method
HRWCHuron River Watershed Council
HRWTHuron River Water Trail
LDFALocal Development Financing Authority
LSWTLake Superior Water Trail
LSWTALake Superior Water Trail Association
MDARDMichigan Department of Agricultural and Rural Development
MDNRMichigan Department of Natural Resources
MNDNRMinnesota Department of Natural Resources
MNRTFMichigan Natural Resources Trust Fund
MSWCMichigan State Waterways Commission
NHDNational Hydrography Dataset
NIDNeighborhood Improvement Authority
RDARedevelopment Agencies
RTPRecreational Trails Program
SESSocioeconomic Status
SRWTShiawassee River Water Trail
SRWTCShiawassee River Water Trail Coalition
SWOTStrengths, Weaknesses, Opportunities, and Threats
TIDTax Increment Financing District
TIFTax Increment Financing
USDOTUnited States Department of Transportation
USGSUnited States Geographical Survey
WRIA Water Resources Improvement Act
5 5
LIST OF FIGURES
Figure 1: Shiawassee River Water Trail Map
Figure 2: The Mechanics of Tax Increment Financing
Figure 3: How Tax Increment Financing Works in Five Steps
Figure 4: Site Plan Rendering Depicting an SRWT Access Site in Linden, MI Located in the Downtown Area Adjacent to the Linden Hill Museum
Figure 5: Three Classes of Access Points that the Upper Grand River Water Trail Wished to Include Along the River
Figure 6: Oakland County SRWT TIF Parcels
Figure 7: Western Genesee County SRWT TIF Parcels
Figure 8: Eastern Genesee County SRWT TIF Parcels
Figure 9: Southern Shiawassee County SRWT TIF Parcels
Figure 10: Central Shiawassee County SRWT TIF Parcels
Figure 11: Northern Shiawassee County SRWT TIF Parcels
Figure 12: Saginaw County SRWT TIF Parcels
Figure 13: City of Fenton SRWT TIF Parcels
Figure 14: Comparison of Rankings of Per Capita, Per Parcel, and Per River Mile Revenues Across Jurisdictions
Figure 15: Map of Argentine Township Parcels
Figure 16: Map of Brady Township Parcels
Figure 17: Map of Burns Township Parcels
Figure 18: Map of Caledonia Township Parcels
Figure 19: Map of Chesaning Township Parcels
Figure 20: Map of City of Corunna Parcels
Figure 21: Map of City of Fenton Parcels
Figure 22: Map of City of Linden Parcels
Figure 23: Map of City of Owosso Parcels
Figure 24: Map of Fenton Township Parcels
Figure 25: Map of Genesee County (East) Parcels
Figure 26: Map of Genesee County (West) Parcels
Figure 27: Map of Holly Township Parcels
Figure 28: Map of New Haven Township Parcels
Figure 29: Map of Oakland County Parcels
Figure 30: Map of Owosso Township Parcels
Figure 31: Map of Rush Township Parcels
Figure 32: Map of Saginaw County Parcels
Figure 33: Map of Shiawassee County (Central) Parcels
Figure 34: Map of Shiawassee County (North) Parcels
Figure 35: Map of Shiawassee County (South) Parcels
Figure 36: Map of Shiawassee Township Parcels
Figure 37: Map of Venice Township Parcels
Figure 38: Map of Vernon Township Parcels
Figure 39: Map of Byron Village Parcels
Figure 40: Map of Village of Chesaning Parcels
Figure 41: Map of Village of Holly Parcels
Figure 42: Map of Village of Oakley Parcels
Figure 43: Map of Village of Vernon Parcels
Figure 44: Growth Rate Formula
6 15 18 19 56 58 60 61 62 63 64 65 66 68 75 117 118 119 120 121 122 123 124 125 126 127 128 129 130 131 132 133 134 135 136 137 138 139 140 141 142 143 144 145 147
LIST OF TABLES
Table 1: Health-Related Cost Savings from Paddlesport Recreation on the Tennessee River
Table 2: Economic Value of Huron River Water Trail Services
Table 3: Parking Dimensions
Table 4: Shiawassee River Water Trail TIF Parcels by County (Parcels Adjacent to the Water Trail)
Table 5: Number of Parcels Along the Shiawassee River Water Trail in Existing TIFs by County and TIF District
Table 6: Total 2022 Tax Revenue, TIF Revenues for First Year, and Proportion of Tax Base Diverted at 100% Capture
Table 7: Total Average Yearly and Total 30-Year TIF Revenues
Table 8: TIF Revenues for First Year, After 30 Years, and as a Proportion of Tax Base Diverted at 100% Capture and Corresponding Rankings
Table 9: Normalized TIF Revenues Across Alternative Measures
Table 10: Total and River Adjacent Median Home Values
Table 11: Racial Distribution of Shiawassee River Water Trail Communities (Number of Residents)
Table 12: Median Income of Shiawassee River Water Trail Communities in 2021
Table 13: Educational Attainment of Shiawassee River Water Trail Communities in 2021
Table 14: Occupations of Shiawassee River Water Trail Communities in 2021
Table 15: Proposed TIF Structures
Table 16: Single-Jurisdiction TIF Revenue by Municipality at 100% TIF Capture Rate
Table 17: Southern Shiawassee Multi-Jurisdictional TIF Revenue over 30-year Period
Table 18: South Central Shiawassee Multi-Jurisdictional TIF Revenue over 30-year Period
Table 19: Central Shiawassee Multi-Jurisdictional TIF Revenue over 30-year Period
Table 20: North Central Shiawassee Multi-Jurisdictional Water Trail TIF Revenue over 30-year Period
Table 21: Northern Shiawassee Multi-Jurisdictional Water Trail TIF Revenue over 30-year Period
Table 22: County Level Water Trail TIF Revenue over 30-year Period
Table 23: Unitary Shiawassee River Water Trail TIF Revenue over 30-year Period
Table 24: Overview of Legislative Reform per Water Trail TIF Option
Table 25: Single-Jurisdiction Water Trail TIF SWOT Analysis
Table 26: Multi-Jurisdictional Water Trail TIF SWOT Analysis
Table 27: County Water Trail TIF SWOT Analysis
Table 28: Unitary Water Trail TIF SWOT Analysis
Table 29: Parcels Currently Ineligible in an SRWT TID
Table 30: Village of Holly Millage Rates 2022
Table 30: Village of Holly 30-Year TIF Revenues
Table 32: Normalized 30 Year TIF Revenue Per Capita
Table 32: Normalized 30 Year TIF Revenue Per Parcel
River Mile 7 30 36 55 59 67 69 70 72 74 76 80 81 81 82 87 88 89 89 90 90 90 91 92 93 99 100 100 101 112 147 148 150 151 152
Table 34: Normalized 30 Year TIF Revenue Per Approximate
Executive Summary
This report is a proof-of-concept study of tax increment financing (TIF) as an option for providing stable and predictable funding for programming, improving, and maintaining water trails, conducted for the Shiawassee River Water Trail Coalition. This project assesses various amendments to Michigan law that might be made to authorize the creation of water trail TIF districts; it evaluates existing funding mechanisms for recreational trails; and it identifies and assesses four potential models of TIF structure using geospatial, financial, equity, and legislative analyses. We also conducted a survey, created a rendering of an accessible kayak launch site plan, and developed four water trail case studies.
The state and nationally designated Shiawassee River Water Trail, an 88-mile segment of waterway located on the Shiawassee River, traverses four counties and 22 different municipalities. Water trails increase property values, bolster local economic development, support public health, and encourage environmental stewardship. Despite state and national-level water trail designations and similar to other non-federal, long-distance recreational trails, water trails have few dedicated funding sources.
A TIF allows a unit of government to set a baseline on the assessed property value within a tax increment district (TID), typically
8
established to remedy blight, and then capture the increase in property tax revenue from TID-based improvements to further finance economic development projects within the TID. The funds collected in the TID provide capital to fund improvements and can be used as matching funds. A TIF diverts tax dollars from the general fund, however. It can also require an upfront investment, and it may generate insufficient revenue despite the expectation that it will generate increased property values in the TID.
Recreation areas, trails, and rivers spur economic development. Designating a water trail can lead to increases in annual visitors and local and state sales tax, business creation, and public health benefits. There is well-documented evidence that proximity to trails, recreation areas, and parks increases property values. Simply the addition of a park in a given census tract can increase median home values by $2,500 within the tract. Improved shoreline habitat, water quality, and access points to a river or recreation area can also increase property values.
Recreational trail organizations use a mixture of private donations, federal and state grants, foundation grants, and corporate sponsorships. Even so, funding for trail maintenance to keep rivers safe and passable is a persistent problem. In addition, relative to private funds, state and federal grants often are more proscribed, have very specific criteria, and require extensive reporting.
California was the first state to enable TIFs in 1952. Michigan passed its first TIF-enabling legislation, the Downtown Development Authority Act, in 1975. Since then, expansions have allowed TIFs to address a broad range of objectives like encouraging employment, promoting brownfield redevelopment, and removing invasive species from inland lakes. Currently, Michigan has seven types of TIFs. TIFs have not previously been used to fund recreational areas. Professional planners, TIF experts, and water trail experts consistently agreed that having both a strong vision and communication strategy about a water trail TIF would be vital to its success.
Using GIS analysis, we identified 1,965 parcels that would be eligible for inclusion in the TID, incorporating only parcels immediately adjacent to the SRWT. By combining tax millages for each jurisdiction and using an assumed 4% growth rate, we
calculated the TIF revenues for the first year of the TID at capture rates of 100% and 50% as well as the proportion of those tax revenues that would be diverted from the general fund for each jurisdiction. At 100% capture, the average amount of taxes diverted to the proposed TIF would be 1.02% of total revenues. We then modeled the total revenue for a 30-year TIF. At 100% capture rates, total TIF revenue for each jurisdiction ranges from approximately $1,200 to $2.3 million over 30 years, or between $40 to $77,000 per year, averaged across all 30 years. Total TIF revenues for all the jurisdictions combined would be $253,634 on average annually, or $7,609,033 by the end of the 30-year TIF.
To assess the equity of a water trail TIF across jurisdictions, we first calculated several measures of the relative contribution each jurisdiction would make to the TIF and then calculated normalized values of those contributions per capita, per parcel, and per river mile. That assessment revealed that wealthier jurisdictions would contribute more to the TIF than less wealthy jurisdictions, and it identified several patterns regarding the potential distribution of the burden of a TIF relative to total revenues and with regard to per capita revenues. We also analyzed several other measures of socio-economic status and found discernable variation in those measures across the jurisdictions. We conclude that these are findings that the SRWTC may want to consider when making trail improvement decisions, but that none raise any clear equity concerns regarding the establishment of a TIF itself, given the very low proportion of general tax revenues that would be affected by a water trail TIF for all the jurisdictions.
We propose four options for structuring a prospective TIF authorization (see table on page 10). Overall, the single-jurisdiction TIF approach requires the least legislative reform, while the unitary TIF requires the most. Administratively, overseeing the singlejurisdiction TIF would require the most effort for the Coalition; the unitary TIF would require the least. The unitary TIF is best equipped to address equity issues, while the multi-jurisdictional and unitary TIFs have the most potential to encourage collaboration among jurisdictions.
Based on our assessment, we conclude TIFs could potentially provide a stable and reliable funding mechanism for water trails, although authorizing them for that use would push the boundaries
9
of current practice. Nonetheless, that expansion could be credible given the evolving uses of TIFs over time, it would not necessarily prompt undue pushback, and it could ultimately succeed as a stable and reliable funding source if carefully planned and thoughtfully communicated to communities. When used in combination with existing funding mechanisms, the small proportions of tax revenues TIFs divert from the separate jurisdictions could be leveraged to undertake meaningful improvements to the water trail and to obtain additional funding. We recommend as next steps that the SRWTC: (1)
begin an economic impact study to demonstrate the benefits the trail provides; (2) inaugurate a TIF task force to act as spokespeople for the TIF and to aid decision making; (3) involve stakeholders in TIF selection to improve communication about using TIFs; (4) develop a legislative strategy that determines which TIF structure is best for the SRWT and identifies water trail champions; (5) incorporate equity in decisionmaking processes; and (6) add additional accessible amenities to allow more people to enjoy the water trail.
Description
Individual municipalities interested in river improvements enact separate TIFs
Municipalities enter into interlocal agreements to enact and manage multiple TIFs
Counties enter into interlocal agreements to enact and manage TIFs
A nonprofit entity is empowered to create and manage a single TIF across multiple municipalities
of TIF Single-jurisdiction Multi-jurisdictional County Unitary
Type
Revenue for 30-Year TIF $1,211-$2,309,898 $424,155-$1,264,203$115,223-$2,026,558 $7,609,033 10
(Page Intentionally Left Blank)
11
Introduction Overview of Project and Water Trails
PURPOSE AND GOALS

Michigan is home to over 36,000 river miles, more than 3,000 of which serve as navigable water trails. These water trails have the potential to provide both economic and recreational benefits to the state, but effectively managing, maintaining, and programming these waterways requires substantial financial resources.
This report presents a proof-of-concept study conducted on behalf of the Shiawassee River Water Trail Coalition (SRWTC) to assist the coalition in its efforts to obtain stable and predictable funding for the programming and maintenance of the Shiawassee River Water Trail (SRWT). Specifically, this project assesses various amendments to Michigan law that might be made to authorize the creation of Tax Increment Financing Authority (TIF) districts for river trails, and it evaluates four potential models of TIF structure that might be used to fund improvements and maintenance for water trails like the SRWT using geospatial, financial, and legislative analyses.
This project expands upon previous research conducted by Oakland, Genesee, Shiawassee, and Saginaw Counties and will contribute to future efforts to develop a proposed TIF Development
12
Plan, Tax Increment Financing Plan, Adoption Process, and Intergovernmental Agreement for the SRWTC. Based on coordination with the Chair of the SRWTC, we refined our project scope to encompass the following goals:
1. Research funding options for linear recreational trails.
2. Explore the history and use of TIFs in Michigan.
3. Analyze the legislative fit of water trail funding needs with current water resource TIF provisions.
4. Conduct geographic information systems (GIS) and fiscal analyses of a potential Shiawassee River Water Trail TIF.
5. Conduct a socio-economic equity analysis of a potential Shiawassee River Water Trail TIF.
6. Prepare a case study analysis of the potential economic benefits and site design options for a Shiawassee River Water Trail TIF.
Community Partners
The Shiawassee River Water Trail Coalition is a voluntary association of stakeholders interested in the course of the Shiawassee River between Holly and Chesaning, Michigan.1 The association was founded in 2016 and is composed of various municipalities, agencies, non-profit organizations, and individuals who are passionate about the conservation, education, and recreation opportunities along the Shiawassee River. Interested parties join the coalition by signing a Memorandum of Understanding, a formal agreement in which members acknowledge and authorize the coalition to speak on behalf of all members for the Shiawassee River Water Trail.
CURRENT COALITION PARTNERS
Oakland County
Headwaters Trails, Inc.
Blue Heron Land Conservancy
Village of Holly
Holly Township
Genesee County
Keepers of the Shiawassee
Ponemah-Squaw-Tupper Lake Association
Sierra Club - Nepassing Chapter
City of Fenton
Fenton Charter Township
City of Linden
Argentine Township
Genesee County Parks and Recreation Commission
Genesee County Conservation District
Southern Lakes Parks and Recreation Metro District
Shiawassee County
Friends of the Shiawassee River
Village of Byron
Village of Byron DDA
Shiawassee Township
Venice Township
Vernon Township
Village of Vernon
City of Corunna
Caledonia Township
City of Owosso
Rush Township
New Haven Township
Shiawassee County Parks and Recreation
DeVries Nature Conservancy
Shiawassee Economic Development Partnership
Saginaw County
Village of Oakley
Village of Chesaning
Chesaning Township
Brady Township
Saginaw County Parks and Recreation
13
“The Mission of the Coalition is to improve and promote public use of the water trail as a valuable resource for nonmotorized recreation and tourism and to support and enhance river conservation and stewardship.”
What is a Water Trail?
A water trail is a mapped recreational route along a lake, river, or other waterway specifically designed for people using small watercrafts like kayaks, canoes, single sailboats, or rowboats.2 Sometimes called “blueways,” “paddle trails,” or “river trails,” water trails are the aquatic equivalent of hiking and walking trails, or “greenways.” Water trails are planned and managed to facilitate positive outdoor experiences for users, featuring access points to enable water entry for people of all ages and ability statuses. 3 These trails also include signage indicating the river as a designated water trail, along with signage to support wayfinding, safety, and environmental stewardship.
Water trails can have both state and national designations. Across the country, there are 35 nationally recognized water trails as a part of the National Recreation Trail System, which was established in 2012 to promote healthy, accessible rivers and water-based tourism.4 Four of those water trails are located in the State of Michigan.5 The Michigan Department of National Resources (MDNR) initiated its state water trail program in 2018 and currently has eight state-designated water trails.6
The MDNR designates state water trails according to the following criteria:
● A quality trail experience
● Clear information for users
● Broad community support
● A sustainable business, maintenance, and marketing plan7
The U.S. National Park Service uses the following criteria when evaluating applications for national water trail designation:
● Mission statement
● Recreation opportunities
● Education
● Restoration
● Community support
● Public information
● Trail maintenance
● Planning8
The Shiawassee River Water Trail
The Shiawassee River Water Trail is an 88-mile segment of waterway located on the Shiawassee River that traverses four counties and 22 different municipalities. Depicted in figure 1, the Shiawassee River Water Trail is designated as both a national and state water trail after receiving those designations in 2020 and 2018, respectively.9,10 The trail flows from Water Works Park in Holly, Michigan to Cole Park in Chesaning, Michigan. It offers a variety of recreational opportunities along the way, such as paddling, fishing, swimming, and cultural-historic-educational experiences. Currently, 28 public access points facilitate access to the river and water trail, with some access sites providing full services, including restrooms, parking, informational kiosks, kayak lockers, and other amenities.
Since its establishment in 2016, the SRWTC has managed the planning, maintenance, and programming of the Shiawassee River Water Trail. In 2017, the coalition published the Shiawassee River Water Trail Plan, which identifies a broad array of activities needed to maintain and improve access to the river trail into the future.11 These activities include but are not limited to, the addition of signage, kiosks, trail amenities, and portages to the trail, as well as the promotion of business development associated with trail use. The coalition largely obtains financial support through grants, philanthropic donations, general fundraising, and site owner contributions. These funding sources taken together are often inconsistent, contain contingencies, and are not easily accessible to the coalition. Given that these challenges stymie the implementation of proposed river trail improvements, the SRWTC wants to explore other potential funding options, including specifically the potential establishment of a water trail TIF district to provide a dedicated source of funding for trail improvements.
14
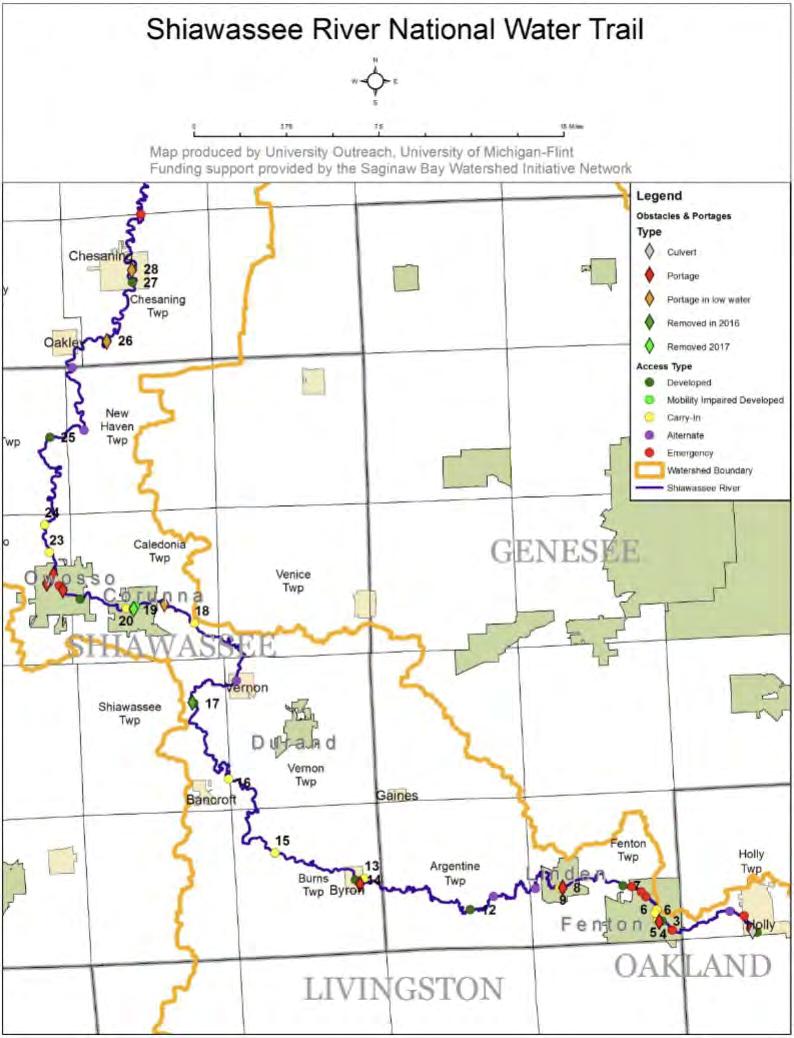 Figure 1: Shiawassee River Water Trail Map
15
Source: Figure from the Shiawassee River Water Trail Plan, University of Michigan-Flint
WATER TRAILS: HISTORY, IMPACTS, AND FUNDING
While the concept of a water trail has been around since the 1970s, official recognition at a state or national level is relatively new. The call to formally establish water trails as recognized natural features stemmed from the enhanced awareness of the need for environmental preservation and publicly accessible recreational areas. Environmentalism was brought to the fore in the 1960s after pivotal environmental laws, like the Wild and Scenic River Act (1968) and the National Trail Systems Act (1968), were passed. The National Trails System Act established the National Trail System, which was created to support conservation efforts by increasing access to nature through the promotion of outdoor recreation. The once small National Trail System, which started out with only the Appalachian National Scenic Trail and the Pacific Crest National Trail, now includes four different classifications of trails – National Scenic Trails, National Historic Trails, National Recreation Trails, and Connecting or Side Trails.12 In 2012, the Secretary of the Interior amended the National Trails System Act (1968) to include Water Trails Systems as a subset of federally recognized recreational trails.
Economic Impact Of Water Trails Property Value
Properties near rivers and other bodies of water often have higher property values than those located farther away.13 This trend is often attributed to the scenic views, access to natural areas, and improvements to the quality of life trails bring to residents and visitors.14 One study that looked at home values in Indianapolis, for instance, found that homes within half a mile of major recreation trails had 11% higher average property values than homes more than half a mile from the trail.15 When property values increase, a local government’s tax base can grow without needing to raise tax rates. The increase in property value can generate more revenue that can be used for future improvements to make the trails’ allure even higher. The economic potential of river corridors may serve to protect water trails for years to come.
A common fear among property owners and local governments is that increased usage along a water trail may lead to higher rates of trespassing and vandalism. Luckily, studies have shown that effectively managed trails with well-marked access points decrease the chance of trespassing by making public access and private property visible to users.16 Further, a look into the opinions of residents living near functional recreational trails has demonstrated that they are apt to embrace the trails over time. Residents who were originally opposed to trail development were more likely to be supportive of trails once they were funded and developed.17
Economic Development
Trails attract tourists and visitors who spend money at restaurants, shops, lodging, and other local businesses. Trails can increase opportunities for new businesses to develop, such as gear rental shops, tour companies, and outdoor recreation equipment retailers.18 A 2013 economic impact analysis of Michigan’s Huron River Water Trail estimated that the food, transportation, recreation, entertainment, and lodging opportunities associated with the trail produce an annual $33 million for Southeast Michigan alone.19
Improved Community Connection, Health, and Environmental Benefits Health
Recreational trails provide opportunities for physical activity, which can improve physical health and reduce the risk of heart disease, obesity, diabetes, and other chronic diseases. Access to nature also provides a positive impact on mental health.20 The number of people seeking outdoor recreation opportunities has grown significantly in recent years as a result of the COVID-19 Pandemic.21
Community Building
Walking trails connect communities as safe and accessible ways to travel between neighborhoods, schools, and other destinations. They also enhance social capital by providing opportunities for social interaction and community events, such as trail runs, group bike rides, community festivals, and volunteer activities. While 16
water trails may provide similar opportunities, it is likely they will not do so to the same extent as a walking trail because water may be less accessible and more expensive than a simple walk. We still expect that water trails positively impact visitors as well as the surrounding communities. The positive social impact has been observed by visitors of the Huron River Water Trail, who report having social interactions and enjoying their time on the river.22 Rural communities near outdoor recreational opportunities often see higher employment rates, higher average levels of educational attainment, and improved overall health in comparison to rural communities that lack access to recreational areas.23
Environmental Stewardship
Exposing adults and children to the beauty and enjoyment of outdoor recreation can be a powerful tool for promoting environmental stewardship within a community. When people have personal relationships with the natural environment their fondness for natural resources is likely to grow and their awareness of the issues facing waterways can be enhanced. Those issues are varied and dynamic, including the influx of invasive species, increased nonpoint and point source pollution, and increasingly severe and unpredictable climate change impacts such as drought, variable precipitation, and increased extreme weather events.24 Increased awareness of these issues can bolster support for improved management practices within these areas, prompting paddlers and other trail users to perform stewardship activities like picking up trash, advocating for additional environmental protections, and donating to environmental organizations.25
Funding Water Trails
Despite their state and national-level designations, water trails have few dedicated funding sources. Water trails often traverse multiple properties and jurisdictions, making their management and funding highly complex. Unlike smaller trails in local, state, or federal parks and protected areas, many trails may not be managed by a single government agency or department. Long-distance trails, including water trails, are managed by federal or state agencies when they reside fully within the agency boundaries, while other trails may be managed by coalitions or nonprofit organizations despite sometimes crossing into state or federally protected areas.26
Coalitions and individual organizations dedicated to promoting and maintaining recreational trails often focus a large portion of their time on securing donors and applying for grants. Terrestrial trail organizations such as the Ice Age Trail Alliance and the Continental Divide Trail Coalition, as well as water trail organizations like the Huron River Watershed Council, rely heavily on generous individual and corporate donors to fund the planning, creation, implementation, and maintenance of their trails.27 Grants, specifically those from philanthropic foundations, are so important for these organizations’ budgets that they often hire staff dedicated to grant writing and development. Unfortunately, few foundations rarely grant funding for the general maintenance of trails and waterways. For that reason, donations from private individuals must often be used for maintenance and overhead costs by these organizations.
Funding from the federal and state governments is often limited. The U.S. Department of Transportation’s (USDOT) Recreation Trail Program relies on the Michigan Department of Natural Resources to distribute funding to local, regional, or statewide grantees. Since 1993 the MDNR has been able to fund over 350 projects across the state. As of 2021, only four of those projects appear to be directly related to water trails.28 As of late April 2023, the Michigan legislature was considering the addition of dedicated one-time funding for the State Water Trail program within the MDNR’s budget. The amount allocated to each of the nine water trails was to be decided in a future conference committee.29
Due to their multi-jurisdictional nature, water trails may not qualify for resources from the Michigan Natural Resource Trust Fund or other state-level programs because they often require that the project take place on only one parcel of land.30 Thus, entities overseeing water trails are restricted to applying only for grants that target a single location along the river, rather than grants that could fund maintenance along the entire length or portions of the water trail. Recreational trail managers interviewed for this study consistently noted that bankrolling general water trail maintenance was the most difficult to acquire and often highly sought-after.
A small portion of water trail funding comes from local communities. This funding is usually in the form of membership fees to the trail-supporting organization. Some water trails receive
17
limited funding from some, but not all, of the communities along the river or within the watershed. The communities within the watershed that choose to opt out from providing funding tend to lie far from the river or struggle with limited budgets, particularly because they are rural municipalities.31
TAX INCREMENT FINANCING OVERVIEW
Tax increment financing (TIF) was first introduced in California in 1952 to provide municipalities with a mechanism for funding blight reduction projects in urban centers. Following suit, states across the country began passing laws to enable forms of tax increment financing, expanding its potential uses and settings. The State of Michigan passed its first TIF-enabling law, Public Act 197, in 1975.
Tax Increment Financing in Concept
Tax increment financing is a popular public financing tool used to provide funding to municipal governments for economic development and redevelopment. Tax increment financing allows a unit of government to first set a baseline assessed property value within the defined tax increment district (TID). Figures 2 and 3 illustrate the mechanics of a TIF and how they work, respectively. The tax revenue generated at and below the baseline assessed property value goes to a municipality’s general fund while the increase in property tax revenue above the baseline (i.e., the increment) goes to a TIF authority to pay for TID-based improvements.32 Depending on the legislation authorizing the TIF, increases in property tax revenue in a TID can be captured even if they are a result of inflation or other economic trends.
Using this design, municipalities can divert a small portion of their total property tax revenue toward TIF authorities for development initiatives, all without levying new taxes on property owners. TIF revenue can be used to attract private investors with loans and subsidies by offering to match their contributions to the district.33
A TID should be large enough that it can generate enough revenue to help sustain the redevelopment efforts. At the same time,
legislation authorizing TIFs generally requires that the TID encompass only properties that experience the direct benefits of investment in the district. In addition, when a municipality (or municipalities) decides to create a TIF, other taxing entities with jurisdictions within the municipality (e.g., school districts) generally must agree to share their tax base in order to support the operation of the TIF.
The maximum life for a TIF district depends on the specifications of state/local TIF enabling laws. Typically, TIFs are set to sunset anywhere from 15-40 years after they are first established.
DevelopmentIncreasesPropertyValueinTIFDistrict
Property Assessed Value Creation Termination Baseline Property Value Value after TIF Captured & Redirected Value Tax Increment Time Period of TIF
18
Figure 2: The Mechanics of Tax Increment Financing
“Blight, But For” Test
States commonly require a proposed TID to pass the “Blight, But For” test in order to allow the establishment of the TIF. The test asks the following questions:
● Blight: Does the area exhibit features that impair or prevent the normal use or development of the property?
● But For: Would redevelopment occur without public assistance?
Although some municipalities have clearer definitions of what blight looks like, this set of criteria presents a relatively low bar for the TID to pass in order to be eligible for the TIF. Over the past seven decades, states have been able to take the framework of TIFs and adapt them to serve a wide range of development purposes beyond blight eradication. For example, in Michigan, TIF legislation has been expanded to allow for development to take place in both urban and suburban areas that may or may not be blighted. Despite the flexibility of certain TIF requirements, all proposed TIFs must serve a public purpose in order to be established, and the purpose of the TIF authority must be declared publicly.
Managing TIF Revenue
TIDs are often operated by a redevelopment authority created by the municipality. These authorities provide the legal, financial, organizational, and administrative support required to execute the TIF plan. Before improvements can be made to a TID in Michigan, the TIF authority must present a development plan and a TIF plan for approval by the legislative body.
● Development Plan: A TIF development plan often outlines the current physical characteristics of the proposed TIF district. In Michigan, for example, the plan often lays out the location of and time required to complete each project, the estimated costs of development, and any potential displacement that may occur as a result of the development. A TIF authority can only take on projects outlined in the TIF development plan.
● TIF Plan: A TIF Plan must outline the tax increment procedures, the maximum amount of debt the TIF authority can take on, and the duration of the TIF. The plan must also provide a projection of the anticipated impact the improvements in the district will have on assessed property values.
Development plans and TIF plans must undergo a public approval process before the TID can be formally established. These processes are outlined in each TIF law. The TIF and development plans are often pointed to as a strength of this financing mechanism because they both raise capital and provide a blueprint for development.
1. Mark area for redevelopment
2. Assess value of property within boundary
3. Receive tax increment to pay for new development
4. Spur economic growth and development
5. Use revenue to pay debt service
19
Figure 3: How Tax Increment Financing Works in Five Steps
The Benefits of Using TIF as a Development Tool
1. Self-Financing: A successful TIF district development, in theory, is able to pay for itself. Investment in the TID leads to an increase in property values in the TID. The increase in the property value then leads to an increase in the property tax revenue in the district. The growth in property tax revenue due to development and redevelopment provides the funds needed to pay for the original investment in the TID.
2. Creating Leverage: A successful TIF district can provide a municipality with a consistent revenue stream that can be used as leverage with private developers and intergovernmental grants. TIF incremental revenue can be used as matching funds for projects.
3. Avoiding New Taxes: TIFs allow municipalities to capture and redirect tax revenue to development and redevelopment initiatives without imposing a new tax on property owners. Unlike the passage of a new tax, the establishment of a TID does not require voter approval. New taxes are often unpopular among voters.
4. Circumventing Bureaucratic Hoops: Although recent legislation in Michigan has been passed to make TIFs more transparent to the public, they still require relatively little reporting and evaluation in comparison to other programs. A TIF represents one of the few locally controlled funding options that have few bureaucratic delays/reporting components often associated with intergovernmental revenue.
5. Sunsetting: TIFs are not meant to be permanent financial structures in a municipality. Once the TIF period expires, any additional increases in property tax revenues from future increases in assessed property values will return to municipal taxing bodies.
The Drawbacks of Using TIF as a Development Tool
Tax increment financing has the opportunity to be an effective means for generating funds for improvement projects in the established district. The tool, however, is not without drawbacks or critics.
1. Upfront Investment: It costs money to create and operate a TIF authority. These costs are often absorbed by the local government and repaid with the TIF revenue eventually captured by the TIF authority.
2. Insufficient Revenue: Actual TIF revenue may fall short of the TIF authority’s expectations. In order for a TIF to be successful, the TIF must generate a reasonable increase in the assessed property values of the properties in the district. It is possible that assessed property values in a TID could decrease either permanently or temporarily during the TIF period due to factors that are outside the control of a TIF authority. Furthermore, TIF revenue may grow slower than originally anticipated due to economic and policy changes. Property tax abatements, a common incentive for developers, may reduce tax revenues. This has been a particular problem in Michigan.
3. Private Partners Required: In an ideal world, a TIF would generate enough revenue to cover the full costs of the proposed projects in the TID. In reality, this is rarely the case. TIF authorities may still need to rely on alternative sources of capital in order to afford the projects they hope to complete –especially for projects like capital improvements.
4. Inconclusive Results: There is no consensus on whether TIFs actually lead to a positive impact on economic growth.
5. Diverting Tax Dollars: Tax Increment Financing can sometimes be controversial among municipalities because it diverts tax dollars away from the general fund and into the TID. While this might not be an issue for every jurisdiction, smaller municipalities or municipalities experiencing financial difficulties might be hesitant to commit a portion of their dollars to go toward TIF improvement projects.
20
An understanding of the fundamentals of tax increment financing will be essential for all advocates of using this mechanism to fund the Shiawassee River Water Trail. Champions of this idea must be prepared to answer questions about the basic mechanics of TIFs in order to thoughtfully answer questions and ease the concerns of residents located around the proposed TIF district.
Throughout this report, we will refer to the basic TIF concepts and structure outlined in this section. In the coming sections, we will explore in-depth the possibility of using tax increment financing as a source of stable funding for improvements along the Shiawassee Water Trail.
Looking Ahead
This chapter provides a first-pass, broad overview of water trails, the challenges water trail managers face in funding them, the economic and public health benefits they provide, and background concepts regarding tax increment financing, all to lay the foundation for a more comprehensive assessment of whether that mechanism might indeed be appropriate and effective for providing more stable and reliable funding for water trail improvements and maintenance. After describing briefly the various methods we employed for that assessment, we then provide more detailed findings, conclusions, and recommendations from that effort.
Drawing from in-depth research used to inform our assessment, we first discuss in more detail the key concepts, structures, and historical uses of TIFs, along with findings from a more comprehensive review of the economic, public health, and other benefits of water trails and the struggles water trail managers experience in securing funding to manage them. In addition, we present findings from case studies that analyze the economic impact of TIFs on private properties and in rural communities, with a focus on access points and accessibility features that further boost the economic and health benefits of water trails.
Building on that broad background research, we address specifically the Shiawassee River Water Trail, providing first a site render to illustrate the kinds of access elements the SRWTC seeks to add and maintain along the trail. We then present results from a GIS overlay analysis used to identify the parcels that would be included within the water trail TIF district, followed by results from corresponding fiscal modeling and analysis and an analysis of equity considerations across the water trail jurisdictions. Finally, we present four alternative approaches for structuring water trail TIFs in Michigan, assess those alternatives both broadly and with regard to SRWTC’s particular interests and needs, and offer overall conclusions and recommendations.
21
Citations
1. “Coalition.” Shiawassee River Water Trail Coalition. Accessed March 23, 2023. https://www.shiawasseewatertrail.org/coalition.
2. “What Is a Water Trail?” Michigan Water Trails. Accessed March 23, 2023. https://www.michiganwatertrails.org/watertrail_def.asp.
3. “Water Trails.” Department of Natural Resources. State of Michigan, 2023. https://www.michigan.gov/dnr/places/state-trails/water-trails.
4. “New National Water Trails System to Promote Healthy, Accessible Rivers | U.S. Department of the Interior,” accessed January 9, 2023, https://www.doi.gov/news/pressreleases/New-National-Water-Trails-Systemto-Promote-Healthy-Accessible-Rivers.
5. “NRT Database.” National Recreation Trails Database, 2023. https://www.nrtdatabase.org/.
6. Gordon, Birginia. “Officials Name 8 Waterways the First State-Designated Water Trails.” Michigan Radio, December 27, 2018. https://www.michiganradio.org/environment-science/2018-12-26/officialsname-8-waterways-the-first-state-designated-water-trails.
7. “State Water Trail Designation Program Handbook.” Michigan Department of Natural Resources. Accessed March 23, 2023. https://www.michigan.gov/mdhhs//media/Project/Websites/dnr/Documents/PRD/Trails/PureMiWaterTrailApplicatio nHandbook.pdf?rev=dc4a2d0caf294f8890460a30009a6585&hash=95422720 8C93AE3B732B2B07D440517B.
8. “National Water Trails System Designation Criteria.” National Parks Service. U.S. Department of the Interior. Accessed March 23, 2023. https://www.nps.gov/subjects/nationaltrailssystem/national-water-trailssystem-criteria.htm.
9. Gordon, Birginia. “Officials Name 8 Waterways the First State-Designated Water Trails.” Michigan Radio, December 27, 2018. https://www.michiganradio.org/environment-science/2018-12-26/officialsname-8-waterways-the-first-state-designated-water-trails.
10. “NRT Database.” National Recreation Trails Database, 2023. https://www.nrtdatabase.org/.
11. The Shiawassee River Water Trail Coalition, “The Shiawassee River Water Trail Plan,” n.d., https://drive.google.com/file/d/0B1gjV_v5CNcLSWU4emFKWlFGWFE/view.
12. Sandra L. Johnson, “History of the National Trails System -American Trails” (Congressional Research Service, December 11, 1998), https://www.americantrails.org/national-trails-system/history.
13. Miller, Norm G., Jeremy Gabe, and Michael Sklarz. “The Impact of Water Front Location on Residential Home Values Considering Flood Risks.” Journal of Sustainable Real Estate 11, no. 1 (2019): 84–107. https://doi.org/10.22300/1949-
8276.11.1.84.
14. “Role of Parks and Recreation on Health and Wellness: Position Statement.” National Recreation and Park Association. Accessed April 1, 2023. https://www.nrpa.org/our-work/Three-Pillars/role-of-parks-and-recreation-onhealth-and-wellness/.
15. Lindsey, G, J Man, and S Payton. “Property Values, Recreation Values, and Urban Greenways.” Journal of Park and Recreation Administration, 2004, 69–90.
16. Lawson, Megan. “Headwaterseconomics.orgMeasuring Trails Benefits: Property Value.” headwaterseconomics.org, 2016. http://headwaterseconomics.org/wp-content/uploads/trails-library-propertyvalue-overview.pdf.
17. David P. Racca and Amardeep Dhanju, “Property Value/Desirability Effects of Bike Paths Adjacent to Residential Areas” (Delaware Center for Transportation, November 2006), https://headwaterseconomics.org/wpcontent/uploads/Trail_Study_51-property-value-bike-paths-residentialareas.pdf.
18. “Trails Make Economic Sense.” Trails Make Economic Sense -American Trails. American Trails, 2021. https://www.americantrails.org/economic-benefits.
19. Washtenaw County Office of Community and Economic Development, “Huron River Water Trail Economic Impact Analysis” (Ann Arbor, MI: Washtenaw County Office of Community and Economic Development, December 2013), https://www.hrwc.org/wpcontent/uploads/2014/03/HRWT%20Economic%20Impact%20Report.pdf.
20. “Nurtured by Nature,” Monitor on Psychology (American Psychological Association, 2020), https://www.apa.org/monitor/2020/04/nurtured-nature.
21. Matteson, Cory. “How Trails and Outdoor Access Provide Important Mental Health Benefits.” Rails to Trails, n.d. https://www.railstotrails.org/trailblog/2020/september/02/how-trails-andoutdoor-access-provide-important-mental-health-benefits/.
22. Washtenaw County Office of Community and Economic Development.
23. Richard J. Reeder and Dennis M. Brown, Recreation, Tourism, and Rural WellBeing -Google Books (University of California, Berkeley: U.S. Department of Agriculture, Economic Research Service, 2005), https://www.google.com/books/edition/Recreation_Tourism_and_Rural_Well_bei ng/BzFNAQAAMAAJ?hl=en&gbpv=0.
24. Environment, “Freshwater Strategic Priorities 2022-2025.”
25. “America's Public Lands Explained.” U.S. Department of the Interior, January 31, 2023. https://www.doi.gov/blog/americas-public-landsexplained#:~:text=Like%20national%20parks%2C%20national%20conservation %20areas%20are%20designated,Area%2C%20and%20Utah%27s%20Red%20Cli ffs%20National%20Conservation%20Area.
26. Johnson, “History of the National Trails System -American Trails.”
22
27. Ice Age Trail Alliance, “2021 Ice Age Trail Alliance Annual Report” (Ice Age Trail Alliance, 2021), https://www.iceagetrail.org/wp-content/uploads/2021IATA-annual-report_FINAL_web.pdf.
28. “Results,” n.d. https://recreationaltrailsinfo.org/results/.
29. “FY 2023-24 NATURAL RESOURCES BUDGET,” Pub. L. No. 0188, § 114, Senate Bill (2023), https://www.senate.michigan.gov/sfa/departments/highlightsheet/hidnr_web.pd f.
30. Interview with Executive Director of Water Trail, interview by Alex Wilkinson, February 6, 2023.
31. Executive Director of Water Trail.
32. Ronnie Lowenstein, “Learning from Experience: A Primer on Tax Increment Financing,” New York City Independent Budget Office (New York City Independent Budget Office, September 2002), https://www.ibo.nyc.ny.us/iboreports/TIF-Sept2002.pdf.
33. Tanvi Misra, “The Trouble With TIF,” Bloomberg.Com, September 12, 2018, https://www.bloomberg.com/news/articles/2018-09-12/does-tax-incrementfinancing-really-work-usually-no.
34. Charles Eckenstahler, “Michigan Tax Increment Financing: A Primer,” Planning & Zoning News, December 2008.
35. The Recodified Tax Increment Financing Act 2018, Michigan Codified Law (MCL) 125.4214
36. Johnson and Man, A Review of Tax Increment Financing Laws.
37. Lowenstein, “Learning from Experience: A Primer on Tax Increment Financing.”
38. Eckenstahler, “Michigan Tax Increment Financing: A Primer.”
23
Methods
This chapter provides a concise overview of the procedures and techniques used to address the research goals identified in our scope of work, including the various steps and tools used to collect, analyze, and interpret the data and information presented, provided to ensure that our research process is replicable. Methods that require a more detailed explanation can be found in the technical methods sections within the appendices, supplementing the information presented in this chapter. The following sections explain the research processes conducted on water trail funding, TIFs, and case studies as well as GIS, TIF modeling, and legislative reform analyses.
BACKGROUND RESEARCH

Water Trail Impact and Funding
We conducted a literature review of existing funding mechanisms for water trails and terrestrial recreational trails in Michigan and across the country. Through that work, we expanded our research to include an assessment of the impacts of trails and recreation areas on nearby property values, environmental stewardship, local economies, public health, and so on. Our team conducted eight interviews with staff members from water trail-related organizations, a terrestrial trail coalition staff member, and staff members from a national trail advocacy organization.
24
History and Usage of TIFs
As background for identifying potential TIF funding alternatives, we researched the history of TIFs with a particular focus on the State of Michigan to gain an understanding of the historical context for tax increment financing in concept. We then integrated this information with insights provided by interviews with contemporary planners and a state lawmaker to assess the primary intent of TIF laws, potential pitfalls, and paths to success. Altogether we met with 10 Michigan TIF experts.
Municipality Survey
We conducted a survey consisting of seven questions to provide initial outreach to and feedback from 22 individual community leaders and city managers associated with the SRTWC. To encourage a higher survey response, we kept the survey brief and asked broad but informative questions that included multiple choice, yes/no, and open-ended questions. Refer to Appendix D for the exact questions.
We designed the survey to provide a general understanding of the levels of experience, understanding, and interest in TIFs among potential partners in these 22 jurisdictions. We reached out to jurisdiction leaders individually via email and attached a link to the survey using Qualtrics to record the findings. The initial contact information was provided to us by SRWTC; in several cases, we obtained additional contact information from jurisdiction websites.
Case Studies
We developed four case studies to address the following: property value modeling along the Huron River Water Trail in Southeast, Michigan; analysis of access points and the economic impact of the French Broad River Water Trail in Western, North Carolina; universal design accessibility standards modeling on the Upper Grand River Water Trail in Southeast, Michigan; and economic and social impact analysis for rural communities through tourism on the Lake Superior Water Trail in Northeast, Minnesota. These case studies are integrated throughout the report in relevant sections.
In developing these case studies, we looked for river trails in the United States that share similar river trail lengths and span across multiple jurisdictions, as well as cases that focus on socioeconomic and equity impacts. The SRWTC can use these cases as examples of existing water trails with similar characteristics to the Shiawassee River Water Trail, as well as reference cases that can be used to further inform and support the SRWTC’s proposals for future water trail improvement goals, strategies, and implementation actions for the Shiawassee River Trail.
SRWTC-SPECIFIC SITE DESIGN, GIS, AND TIF ANALYSES Site Rendering
To provide a visual representation of the type of kayak access site and launch structure the SRWTC seeks to provide using TIF and other funding sources throughout the water trail, we designed a site plan that presents a potential kayak launch site in Linden, MI. That illustrative design incorporates parking requirements, access points, and facilities such as portable toilets. The basic requirements and AutoCAD drawings of the kayak launch site were provided by the Linden Director of Public Works. The site plan is based on two main factors: accessibility and parking. We used screenshots from Google Maps as base maps and exported them to Adobe Illustrator and Photoshop to create the render.
GIS Overlay Analysis
Using the Geographic Information Systems (GIS) mapping software ArcGIS Pro, we performed an overlay analysis to identify the parcels eligible for inclusion in a Shiawassee River Water Trail TIF district. This research expands upon analyses conducted by Oakland, Genesee, Shiawassee, and Saginaw County GIS departments, in partnership with the SRWTC. Using geospatial and tabular parcel data provided by county officials, the SRWTC estimated potential revenues from a TIF district along the water
25
trail. Given that parcels cannot be included in two TIF districts simultaneously, our overlay analysis builds upon this work to further verify parcels eligible for inclusion in the Shiawassee River Water Trail TIF.
To complete this analysis, we collected the parcel, TIF, and hydrography shapefile data from state and county-level sources, and we cleaned the data to isolate Shiawassee River parcels.1 We digitized missing geospatial data using reference maps. We triangulated the geospatial and tabular data to ensure the water trail TIF parcels include only those that are situated directly adjacent to the water trail and that each parcel was accounted for only once. Finally, we identified parcels for inclusion in a water trail TIF by excluding all parcels along the Shiawassee River Water Trail that fall within existing TIF districts. Refer to Appendix A for a detailed description of our GIS analysis process.
TIF Revenue Modeling and Equity Analysis
We combined property value information from parcels identified by our GIS analysis with millage rates from jurisdictions and counties for the TIF analysis. Because Michigan law limits the life of a TIF to 30 years, unless renewed, we modeled a 30-year TIF capture model for each of the four potential TIF structures (described below) to illustrate the total revenues that might be collected over that period of time.2 The model used an assumed property value growth rate of 4% per year, and it included 30-year total TIF capture projections at 100% and 50%, as well as average yearly TIF captures. Refer to Appendix C for a detailed description of the TIF analysis process.
We also compared the yearly TIF capture amount to the total tax revenue of each jurisdiction. We did this by calculating what percentage of each jurisdiction’s 2022 tax revenue the yearly 2023 TIF capture would be at 100% and 50%. We also normalized the 30year total TIF capture amounts by per capita, per river mile, and per
parcel number to compare and assess them from an equity perspective to inform TIF organizational options.
Finally, we also examined how TIFs would implicate equity considerations by comparing several measures of socioeconomic status across jurisdictions, including the average median home values for each township, city, and village to the average median home value of the riverside TIF parcels within that township, city, and village, respectively. We also compared demographic data like race, median income, educational attainment, and occupation across municipalities. See Appendix C for more details on our analysis methodology.
Potential TIF Structures
To develop the four TIF funding options evaluated for this assessment and to determine the legislative reforms that would be required for each, we analyzed current Michigan TIF legislation with an eye for potential modifications and approaches that would most benefit river trail projects specifically. We identified existing language from current TIF authorizations that could provide precedent and models for modifying the law.
SWOT Analysis
Finally, to compare the proposed TIF structures to one another and the funding status quo, we conducted four SWOT analyses. SWOT stands for strengths, weaknesses, opportunities, and threats, and this tool helps to understand current assets and deficiencies while guiding future action by identifying positive trends or anticipated obstacles. Strengths and weaknesses are current internal or inherent factors. Opportunities and threats are external factors that require an eye for future developments. The four criteria used for comparison in the SWOT analysis were: (1) current legislative fit and reform required, (2) administrative feasibility and cost, (3) equity, and (4) efficacy.
26
Citations
1. Geospatial data sources include:
● Oakland County, Michigan, “OC Tax Parcels (Public),” Access Oakland, last modified November 9, 2020, retrieved from https://accessoakland.oakgov.com/datasets/oakgov::oc-tax-parcelspublic/about.
● State of Michigan, “Counties (v17a),” GIS Open Data, last modified April 26, 2022, retrieved from https://gismichigan.opendata.arcgis.com/datasets/Michigan::counties-v17a/about.
● State of Michigan, “Minor Civil Divisions (Cities & Townships),” GIS Open Data, last modified April 26, 2022, retrieved from https://gismichigan.opendata.arcgis.com/datasets/Michigan::minor-civil-divisionscities-townships-/about.
● State of Michigan, “Villages,” GIS Open Data, last modified April 26, 2022, retrieved from https://gismichigan.opendata.arcgis.com/datasets/Michigan::villages/about.
● U.S. Geological Survey, “NHDPlus High Resolution (NHDPlus HR),” The National Map, last modified July 1, 2019, retrieved from https://www.usgs.gov/national-hydrography/access-national-hydrographyproducts.
2. Recodified Tax Increment Financing Act 2018, Michigan Codified Law (MCL) 125.4805

27
Results: Background Research

Impact of Water Trails, Trail Funding, and TIF Overview
Humans have used water for navigation for millennia, and we have long been innately aware of the benefits rivers provide us. The recreational use of modern-day water trails also positively contributes to the communities they flow through. We must understand the value of water trails before exploring the idea of using tax increment financing (TIF), as a TIF’s success hinges on the investment and improvement of the water trail. We then explore the current landscape of recreational terrestrial and water trail funding in Michigan and the United States, where we can identify its shortcomings and the rationale for the TIF. Finally, we introduce TIFs including their history, uses, and evolution as well as their potential for funding water trails.
RECOGNIZING A WATER TRAIL’S VALUE
Most paddlers and community members are well aware of the positive benefits of a water trail transecting their community. Sometimes prior to implementation and designation, future users and community members may not recognize how water trails can spur economic development. According to a survey conducted
28
prior to the completion of the Tioughnioga River Trail in New York, for example, distance from the river and past use of trails increased the likelihood of trail users recognizing these benefits.1 Perceived benefits may become more obvious after the designation of the trail, and research points to water trail users becoming very aware of the financial benefit of visitors coming to the area to paddle.2
Paddlers with awareness of the river’s connection to the local economy are more supportive of strengthening the connection and enabling funding mechanisms for the water trail. Users who were aware of the connection also supported developing programs that encouraged paddlers to patronize local businesses such as the creation of package deals that integrated paddle and non-paddle tourism (e.g., rental and hotel deals, being able to drop off one’s kayak at your BnB, transportation between river launches and the downtown, etc.).3
Casual recreational paddlers not only contributed more to local economic development via renting equipment, but they also tended to recognize the connection between water trails and economic development because they engaged with water trail-related businesses. Alternatively, avid paddlers often own their own kayaks so they might not be aware of how their use of a water trail is impacting the economy of the surrounding community.4 Consequently, recreational paddlers were more likely to support a water trail funding option, including equipment tax, craft registration, paddling licenses, and user fees.5
Non-Property Economic Impacts
Outdoor recreational areas and trails have positive benefits for their nearby communities. According to the research conducted by the Outdoor Industry Foundation, a paddler in Michigan spent on average $481 per year.9 In Michigan, this means that the Huron River Water Trail’s economic impact is worth $33 million annually in Washtenaw County alone.10 As another example, the Tennessee RiverLine Trail, a proposed 652-mile trail that flows through Tennessee, Alabama, Mississippi, and Kentucky, had 284,550 annual visitors prior to trail implementation in 2022. This number was expected to increase by over 800,000 more paddlers, a 283% increase, yielding anticipated increases in annual expenditures by $48.3M. The new trail is also expected to bolster local and state sales tax by $2.6 million.11 The University of Tennessee - Knoxville,
which carried out the study, hopes to see the creation of over 600 jobs related to the trail, even in a scenario where the trail turns out to be only one-third as successful as predicted. Ideally, in the most aspirational scenario, the trail could increase employment by 1,959.12 In terms of state gross domestic product (GDP), states are expected to see increases from $734,000 in Mississippi, the state with the smallest river mileage, to $60.4 million in Tennessee, which has over 60% of the river.13
Public Health Savings
Additional indirect economic impacts include the benefits communities receive from improved access to free and low-cost recreational opportunities such as paddling. By estimating the average number of annual paddlers, the total health-related costs avoided per person per year from moderate physical activity, and the time a paddler spends paddling per year, it is possible to estimate these savings to individuals, insurance companies, and businesses. Already, the Tennessee River, with its current level of annual users, helps local residents avoid over $23.7 million in health-related costs due to their increased access to paddling. Not only do residents save on direct and indirect health costs, but workers’ compensations costs and productivity loss costs are decreased.14 See table 1 for estimated savings across these categories. It is expected that these savings will grow as access to the river is improved.
Recreation Areas’ Effect on Property Values
Value is in the Eye of the Landowner
While quantitative data can illustrate the exact effect on property values of owning land near a park, recreation area, or trail, there is value in acknowledging the impact of property owners believing their properties' values are improved due to proximity to recreation. A meta-analysis of 18 studies that used opinion surveys about trails and property values indicated that residents who live near or adjacent to a trail perceive the trail to have a positive or neutral effect on their properties’ values.15 In a seminal study from the 1980s, 75% of property owners within one block of the BurkeGilman Trail, a 27-mile multiuse rail trail near Seattle, Washington,
29
believed that the trail increased the salability of their properties.16 At the time of the survey, the trail was only 12.1 miles. Though 7.1% of those surveyed believed the proximity had the opposite effect and decreased the salability, the majority still were more optimistic, believing the trail would increase the selling price.
Landowners often harbor fears of escalating crime from greenways and bluewaysin close proximity to their properties because the trails increase the number of non-local recreational users passing through the neighborhood. Property owners link their perception of crime with their property values. Nonetheless, surveyed residents from the Seattle study believed that there was no discernible effect on crime rates for those residing adjacent to the trail.17 Trespassing was also not a concern for them.18 Similarly in Luling, Texas, surveys of landowners before and after the opening of the Luling Paddle Trail indicated that they did not believe the trail was adversely affecting property values. Of the 19 property owners who responded, most did not think the trail would adversely affect landowners’ privacy (63%), increase crime (70-75%), increase concern of liability (80%), cause trespassing to be an issue (63%), or cause property damage to occur (78-83%).19 These specific issues often cause property owners to worry that their property values will decline, so the fact residents near the trail did not have increased concerns after trail implementation suggests that trails have minimal if any negative effects on nearby properties or at the very least, that there is little evidence they do.
Empirical Data on Property Values and Nearby Open Space and Recreation Areas
The financial benefit of parks and their impacts on properties values have justified building them since the 1800s.20 A 2007 study conducted in West Virginia that investigated the use of TIFs to fund two park systems, for example, found that simply the addition of a park in a given census tract added over $2,500 to the median home values within the tract.21 In addition, the addition of a jogging or fitness trail increased the median home value by over $11,000 for assessed property values in both urban and rural areas adjacent to the park systems. Due to West Virginia’s relatively low property tax rates, there may be a substantial increase in tax revenues in a more typical state.22
Many studies have calculated the exact increase in property value per foot closer to a trail or recreation area. For every foot closer to the Little Miami Scenic Trail, for example, there was an increase in value of $7.05, in 2008 dollars, for single-family home values in the two Ohio counties the recreational trail passes through.23 Similarly, a meta-analysis summarized the findings from five studies investigating the impact of trails on property values using the hedonic pricing technique to reveal that property values are in general positively affected by trail proximity.24 Rarely did property values decrease when closer to a trail; the only exception was a trail that ran parallel to a major roadway that adversely affected those properties’ prices. In general, the literature supports that a trail could have positive effects on housing prices up to one mile away. Only two sources indicated that increasing distance from a river increased property values, but these were often linked to aesthetic issues.25
While these studies and much of the literature focus on recreational areas and trails in general, the data can reasonably be taken as applicable to water trails, especially considering the positive effects that rivers alone have on property values.
State Physically active paddlers that live near the TN River* Medical Care Cost Savings (Direct and Indirect) Workers’ Compensation Savings (Direct & Indirect) Lost Productivity Total Alabama 13,796 $8,513,924$160,251$385,915 $9,060,090 Kentucky 1,728 $1,066,645$20,077$56,987$1,143,709 Mississippi 234 $144,482$2,719$6,533$153,735 Tennessee 20,407 $12,593,639$237,040$584,473 $13,415,151 Total 36,166 $22,318,91$420,087$1,033,908 $23,772,685
Source: Sims, Welch, and Rushing, “Economic Potential of the Tennessee RiverLineWater Trail,” 2022 *Counties that border the Tennessee River
30
Table 1: Health-Related Cost Savings from Paddlesport Recreation on the Tennessee River
Case
Study: French Broad River, North Carolina: Linking Economic Development to Access Point Location
OVERVIEW
The French Broad River, which flows through Transylvania County, North Carolina, is a popular destination for fishing, paddling, and other water recreation with its eight access points interspersed around the two hub towns. Of the two main hub towns on the river, both Rosman and Brevard incorporate the river into community events in addition to using it recreationally. Several community organizations share in stewarding the river while multiple government organizations manage the access points.
Access Point Analysis
Considering the types of land use along the river was important to trail managers because most of the land along the river is privately owned and used for agriculture. This has made locating access points more difficult because agricultural use can result in channelization with steep banks.
The upper parts of the river are typically more favorable for beginner and recreational paddlers because there the river is calmer with no rapids or dams that complicate access. However, the upper portion of the river is narrower, which can make debris more of a safety issue as it is more likely to make traversing the river more difficult.
It is worthwhile to consider the proximity of hub towns to access points. Having access points closer to hub towns can increase visitors’ accessibility to other town activities. Brevard is the central hub town but has the farthest distance between access points in this section of the river. Additionally, the river only has two overnight campsites, at miles eight and 30, limiting options for paddlers on overnight trips.6 Trail managers will focus on developing comprehensive river information for trip planning, adding a new access point near Brevard, and increasing the overnight campsites for improved river access overall.
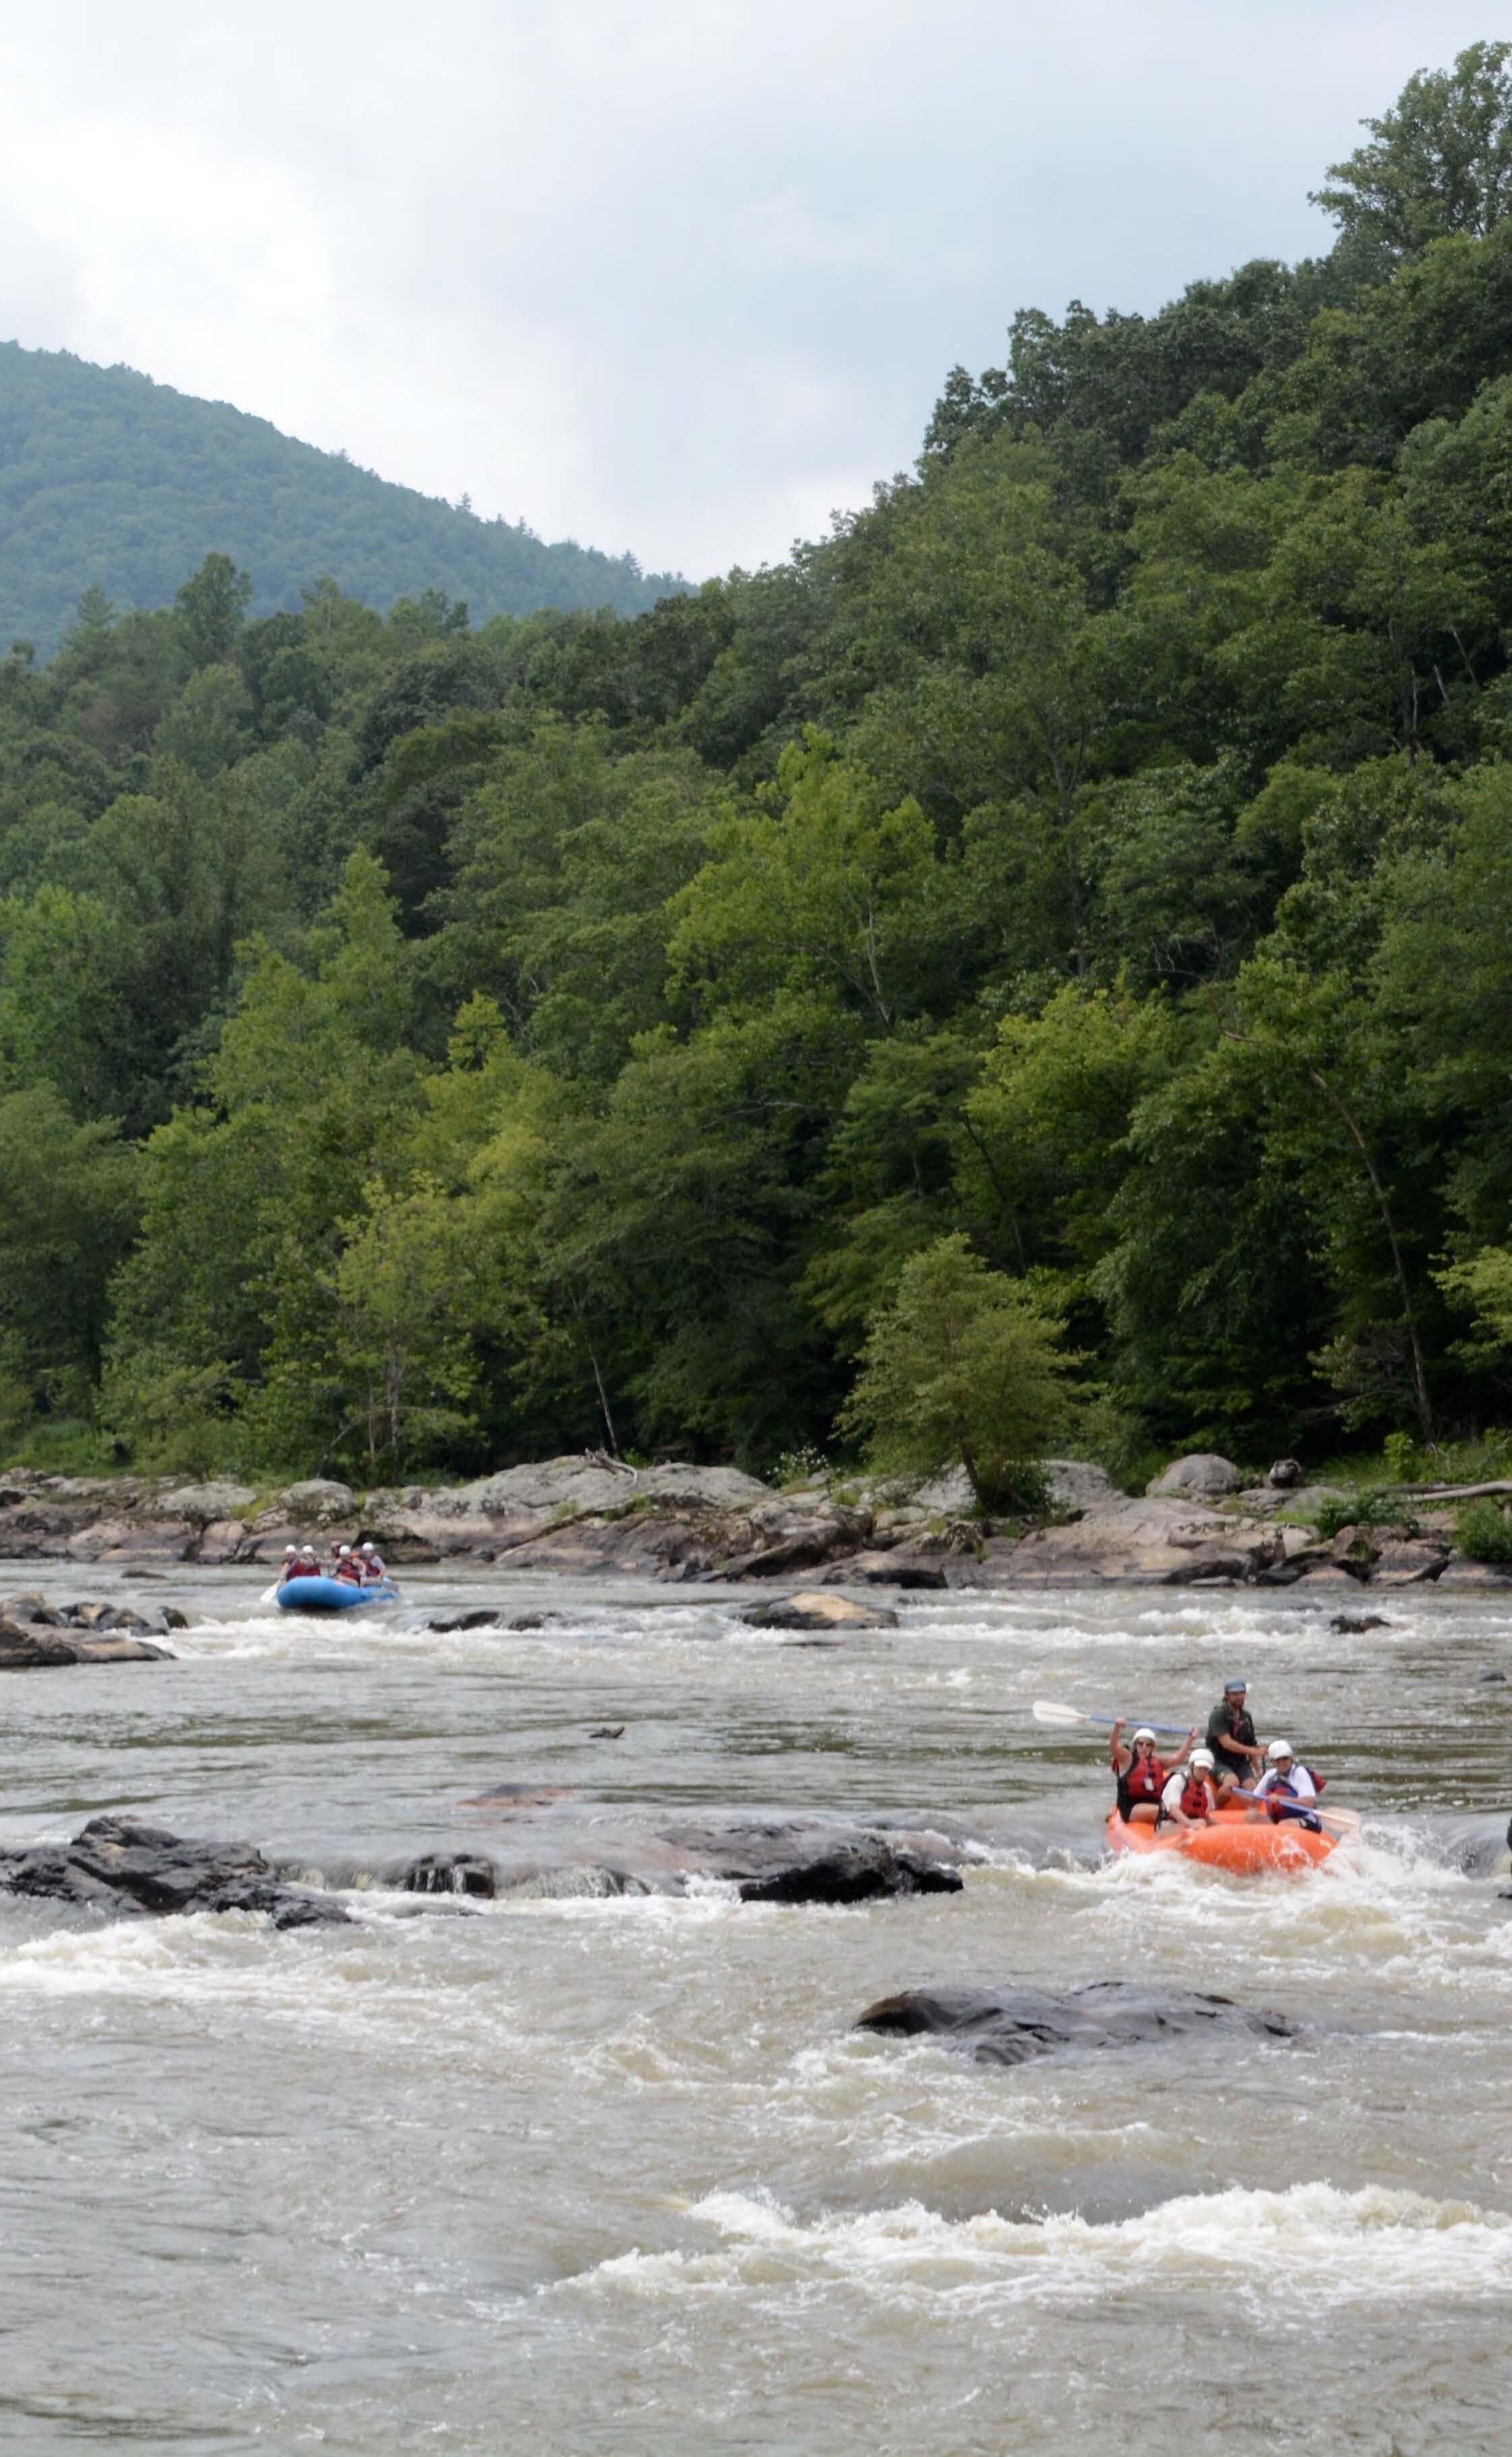
Photo by: howderfamily.com CC BY-NC-SA 2.0 31
French Broad River White Water Rafting
Economic Impacts
Analysts concluded that increasing river access in Brevard and Rosman would bring economic benefit by increasing river use and thus driving spending at nearby businesses. They reasoned that because river users typically have a high level of discretionary income and make multiple river trips a year, promoting other activities in conjunction with river use could help diversify local economies and increase river-related activities and business in the area. Improving river access points and infrastructure could further help to diversify the type of visitors, including attracting more people who prefer overnight trips and other types of paddlers, as well as addressing anglers’ and fishermen's concerns.
River Users
Analysts found that the most common river users are paddlers and fishermen. Around 71% of paddlers spend less than a day on the river. Around a quarter of paddlers take overnight trips, of which many prefer primitive camping as a preferred lodging type. River users are most concerned with the quality and safety of river access points. Paddlers tend to contribute to the local economy through various spending categories. A typical group of paddlers spends between $250 and $500 per paddling trip, with spending categories related to equipment and supplies as well as travel and food.7 Non-locals usually spend around $46 per person per day. Typically, around 9.4% of visitors use guide services or outfitters, and around 31% of visitors reported other retail spending.8 Kayakers typically own their own crafts, while canoers are less likely to own them and therefore rent.
Takeaways and Implications for Shiawassee River Water Trail Access
Learning from the French Broad River experience, thinking about the location of access points in relation to towns and areas of interest for visitors will be important for the SRWTC if it seeks to to increase visitor use, access, and potential economic impact. Considering how to increase overnight camping options for longer trips on the river may also be beneficial by helping to increase the number of overnight visitors, particularly by adding riverside campsites attractive to multi-day camping paddlers.
32
The Effect of Water Resource and Recreation Access Improvement on Property Values
The primary logic underlying a TIF authority is that improvements made by it serve to raise the values of and subsequent tax revenues from properties within the taxing district. There is a positive connection between water quality, stream restoration, recreation quality, and property values. This connection provides a compelling justification for establishing a TIF focused on investing in making a water trail a cleaner, safer, and more enjoyable feature for residents and visitors, given the effects those improvements would likely have on river-adjacent and nearby property values.
Water Quality
One measurement that could be considered is water quality. A recent study of the improvement of lake water quality, specifically of Secchi depth (i.e., water clarity) and chl-a (i.e., an indicator of algal abundance), combined with a national housing dataset, predicted that even a modest improvement of these variables by 10% could substantially increase housing prices by $6-9 billion. If all lakes were restored to pristine conditions, there would be an increase of $25-27 billion in housing values across the U.S.31 A smaller study of 113 lakes in the U.S. highlighted that water clarity had a positive effect on housing prices in inland lakes. An extrapolation of this research on Big Barbee Lake in Indiana showed that a 52% decrease in phosphorous would cause an increase in property values of 4.7%.32 This research did not include the valuation of benefits for non-property owners (i.e., recreational users) but expected that these values might increase as well.
Effects of Stream Restoration
Water quality would not be the only indicator of success for a TIF. Using the hedonic price method, a study of properties near seven stream restoration projects in three California counties signaled that these improvements could also bolster property values.33 Property values increased approximately $4,500 to $19,000 (in 1995 dollars) when streambanks were stabilized, nearby land was acquired for an education trail, flood damage was reduced, and fish habitat was improved. The study estimated these increases would boost property tax revenues by $240 per house with a tax rate of 1.25% of property value.34 The only example of decreased housing
values from improved environmental conditions was seen in a study of riparian restoration that encouraged property owners to plant trees to shade the water as a means to improve salmon habitat, which had the effect of reducing views of the water from their homes.35
Recreation Quality
The quality of and level of access to nearby recreational facilities also has been seen to have a positive effect on property values. The National Park Service’s Rivers, Trails, and Conservation Assistance program acknowledges that property values are highest near greenways that have effective maintenance and security, some recreational access, and open space rather than developed facilities.36 A study on water-based recreation facilities in a waterbased state park in Pennsylvania revealed the significant positive influence on rural property value within zero to seven miles of the park.37 Alternatively, improving the quality of recreation access (i.e., quality of hiking, cleanliness, and parking availability at the parks) by 30% was found to increase property values by .03-.06% for houses five to ten miles away from parks.38 Improving recreational access played a larger role in the property value increases than other variables. This is because better quality parks encourage visitation and increase net benefits, which is captured in property values.
In sum, a plethora of data links the presence of open space, recreational areas, trails, and rivers to positive benefits for communities in the form of economic development, increased property values, and improved public health. We can assume with continued improvement and regular maintenance of the Shiawassee River Water Trail, that the trail would unlock similar benefits for parcels adjacent to the river, if not further inland, and for the communities it passes through. Those benefits further justify the idea of developing a TIF to provide a stable and sufficient funding source to pay for water trail improvements and maintenance. Nonetheless, first, it is helpful to consider the current state of funding for water trails in Michigan and the U.S., to fully assess that potential.
33
FUNDING LESSONS FROM WATER TRAILS AND OTHER RECREATIONAL TRAILS
Water trails have no dedicated funding source from the government, leaving organizations and shoreline communities to scrape together funding from a variety of sources to fund improvements, maintenance, and administration. Communities, especially those in rural areas, often lack the funds to support a water trail on their own, and nonprofit organizations that help manage water trails also come up against funding challenges.39 Budgets for water trail organizations can fluctuate greatly year-toyear depending on the grant funding they receive.
Based on interviews with professionals in the field and a review of budgets for tax-exempt trail organizations, there appears to be no consistent budget structure across water trails, watershed coalitions, or recreational trails. Most trail organizations use a mixture of private donations, federal and state grants, private grants, corporate sponsorships, and occasionally membership fees or program fees. Additional funding options include “bond measures, donations, sponsorships, ‘friends of’ programs, license plate initiatives, and special events… as [well as] concessionaire contract fees and special-use permits charged to outfitters and guides.”40 It is evident that the most successful trails draw from a variety of funding sources.
In general, most trail organization staff we interviewed reiterated the difficulty of finding grant funding for trail maintenance. Few state and federal agencies provide specific funding for maintenance, and private grantors are less likely to fund general trail maintenance because it’s not as exciting as funding a new program or initiative. This challenge is consistent across the nonprofit sector, where organizations often struggle to fund necessary overhead costs. Ongoing maintenance is necessary for keeping water trails passable and safe for paddlers. In one of our interviews, a water trail organization admitted to not being able to promote their water trail to the public because their maintenance is so underfunded that the trail has become unnavigable.
This particular water trail is often blocked by log jams and the organization has yet to find a stable source of funding for removing woody debris. This example illustrates how critical stable funding is for the success of water trails.
Private Donors
Many terrestrial and water trail organizations rely on private donors to support their work. Recruiting individual donors requires organizations to spend a lot of time and energy forming and managing relationships. Developing strong messaging around the benefits of the trail, especially broader impacts like public health benefits can encourage support from those interested in having a positive impact on their community. Donors are more likely to give money if they feel like their contribution will make a difference. Private donations can be used to fill funding gaps not met by grant funding. Smaller private donations typically go toward an organization’s general budget and are unrestricted in use. Larger donors might want their donations to go toward a more targeted use; however, there is often room to negotiate how their contribution should be used.
Successful organizations should develop a robust funding strategy that includes a plan for attracting private donors. The Huron River Watershed Council, for example, has a private Innovators Fund that bankrolls projects that are not yet grant-ready and allows the organization to carry out the pre-work necessary for larger state and federal grants.41 Private donors’ ability to support many types of projects at various stages of development makes them a valuable source of funding for water trail organizations. Additionally, some water trail organizations establish funds or endowments to support maintenance activities. Donors are then able to contribute directly to those funds.42
Individual donations also provide an opportunity to further invest in the future by contributing to endowment funds. For example, the David N. StartzellStewardship Fund at the Appalachian Trail Coalition (ATC), named after its former executive director, is reserved for trail construction, maintenance, and land management activities and contributes millions of dollars each year to the organization’s budget.43
34
Case Study: Property Value Modeling along the


Huron River Water Trail
OVERVIEW
Michigan’s Huron River Water Trail (HRWT) exemplifies how economic impact modeling can strengthen the case for using dedicated funding streams to finance water trails. Stretching 104 miles across 26 municipalities in southeast Michigan and managed by the Huron River Watershed Council, the Huron River Water Trail runs through rural and urban areas, providing recreation for some 103,000 paddlers annually.
Economic Impacts
The HRWT has both direct and indirect impacts on the region, including job creation, increased property values, and increased local economic activity, particularly in the canoeing and kayaking industry.26 The HRWT provides approximately $53.5 million in annual economic output, which is equal to $29.9 million in direct spending and $23.6 million in indirect and induced spending. This economic activity has created approximately 641 local jobs in the region, $628 million in added property values, and approximately $150 million in annual environmental values.27 Table 2 summarizes the aggregate value that the HRWT provides for the five counties, broken down into several distinct categories, in annual and total dollars. The total sums the annual values over time and uses a 4% discount rate.
 Huron River, MI Autumn River
35
Photo by: Rantes CC BY NC SA 2.0
Property Values
One of the most significant contributors to high home values is location, and some of the largest contributors to increases in property values proximate to the HRWT are the Huron River’s aesthetic and recreational appeal. That said, calculating the value of something to someone is already a difficult and subjective task, and it becomes even more complicated when estimating something’s value to many people, as property values aim to do. The Huron River Watershed Council confronted this hurdle by using different methods of calculating property values along the HRWT, one of which we summarize here.
Hedonic Pricing Model
The hedonic pricing model (HPM) is a commonly used environmental valuation method to quantify the utility or value that places like lakes, rivers, hiking trails, wilderness areas, areas with scenic views, and other natural spaces have on nearby home values. By looking at homes with similar attributes like lot size, square footage, and proximity to waterfront locations, hundreds of home sales can be analyzed and then quantified.28 For this study, data were gathered from only Oakland and Wayne Counties, leaving out Oakland, Washtenaw, and Livingston Counties. Additionally, the data included parcels within half of a mile of the
Huron River, although vacant properties and foreclosed properties were both excluded from the study. For Wayne County, only residential zoning codes and multifamily dwellings were excluded. Using the HPM method, researchers evaluating the benefits of the Huron River and water trail found the following:
• On average the premium for a house adjacent to the Huron River in Oakland and Wayne Counties was between 39% and 65% higher than property values that were not riveradjacent.29
• The added value of the houses collectively is approximately $628 million along the Oakland and Wayne County portion of the HRWT.
• The primary reason for this added value is due to the aesthetic amenity that the river provides residents as well as recreational users.30
Key Takeaways
The HRWT’s recreational utility and resultant economic benefit suggest that investment in the SRWT would drive similar economic activity. Although the HPM is an effective and commonly used tool to estimate the utility people place on natural environments, more in-depth data will be needed to analyze the SRWT using this and similar methods.
Annual Added Value Total Added Value Recreation $108.2 million $2.7 billion Biological Diversity $1.1 million $27.7 million Wetland Flood Mitigation/Reduction $15.6 million $390 million Aesthetic Enjoyment $25.1 million $628 million Total $150 million $2.8 billion
Source: Isely et al., “The Economic Impact of the Huron River”
36
Table 2: Economic Value of Huron River Water Trail Services
While the ATC is a remarkable example of private donor impact, it demonstrates how large donors can finance hard-to-fund projects and routine trail maintenance.
Larger private donors are also vastly important to financing a water trail organization. Attracting a few loyal, large donors can positively impact an organization’s budgetary capacity. This, however, requires organizations to invest in finding and maintaining these donors. One trail manager interviewed emphasized that people give to people; trust and communication are a large part of maintaining these relationships.
Corporate and Foundation Support
Another important area of funding for water trails is support from foundations and corporations in the form of grants and sponsorships. The water trail organizations we interviewed use corporate sponsorship to fund signage along the trail, including mile markers and other informational placards. Communities that are uninterested in having the sponsor’s name on signage are permitted to opt out of branded signs and pay an additional fee for non-branded signs. Public-private partnerships can also help pay for new launch sites or docks with community agreements that cover who will maintain the infrastructure over time.
Corporations and foundations provide some of the same flexibility as private donors. They often have less strict criteria for what the money should be used for and may be organized under umbrella categories such as environmental impact or economic development. Foundations often have fewer quantitative reporting requirements than government grants, which can have quarterly reporting rather than annual reporting requirements, thus reducing the workload of trail organizations.44
While government grants can be limited to meeting specific criteria, (e.g., meeting nonpoint source pollution requirements), a foundation may be more interested in funding necessary work like maintenance or projects with less tangible outcomes, according to those we interviewed. One such example of trail-specific funding is the non-profit American Trail’s Trails Capacity Fund, which provides small grants to trail organizations nationwide for maintenance, research, and stewardship training projects.45
Local foundations want to see their funding have positive local impacts, whether it be invasive species removal or economic development. Exhibiting clear connections between a foundation’s goals and the water trail can increase the likelihood of receiving grants.
One grantor repeatedly mentioned by local water trail organizations is the Fred A. and Barbara M. Erb Family Foundation. This foundation has specific interests in the Great Lakes, environmental justice, and promoting sustainable business practices. Several of the water trail managers spoke of relying heavily on the Erb Foundation for consistent funding over multiple years. The foundation has recently, as of 2022, made the decision to spend down their remaining funds, which means SRWTC and other water trails in Michigan can only rely on them for a decade more.46
Like private donors, relationships with foundations and corporations must be carefully cultivated over time. Trail organization staff spoke of applying to as many community foundations as possible and spending years slowly developing relationships with grant managers at these institutions. This is especially true for large well-known foundations such as the Doris Duke Foundation, Hewlett Foundation, or Wyss Foundation.
Current State and Federal Funding Sources
State and federal agencies disburse millions of dollars annually, but these grants often are more proscribed and have specific criteria that constrain the way an organization can use the funding. These agencies often require grant recipients to report quantifiable outcomes, such as pounds of phosphorus removed, or acres of land purchased. Federal and state grants may require matching funds, extensive reporting, and lengthy application processes that smaller organizations do not have the capacity to meet. One interviewee, who works in development at their trail organization, stated that they do not apply to some smaller grants because the money is not worth the reporting requirements. Despite the difficult and competitive nature of state and federal grants, they remain a vital source of funding for water trails across the state.
37
Through interviews with experts from local water trails located across Michigan and our own research, we compiled a list of federal and state funding sources.
Federal Funding
The Recreational Trails Program (RTP) is a federal-level program through the U.S. Department of Transportation’s Federal Highway Administration (FHWA) that provides funds to states to disburse trail development and maintenance projects for non-motorized and motorized recreational trail uses.47 The funds come from the Federal Highway Trust Fund that are collected from non-highway recreational fuel use (e.g., snowmobiles, all-terrain vehicles, offhighway motorcycles, and off-highway light trucks); a third of fuel taxes paid by non-highway recreationists are estimated to fund RTP.48 The 2021 Bipartisan Infrastructure Law of 2021 (the Infrastructure Investment and Jobs Act) reauthorized RTP through fiscal year 2026. Each state has its own RTP administration, and different states use different agencies to disburse funds. Michigan distributes its funds through the Parks and Recreation Division of the Michigan Department of Natural Resources. An online database of the RTP projects includes projects submitted voluntarily by states (https://recreationaltrailsinfo.org/).49 As of April 2023, there were over 1,900 examples of RTP funds being used for aquatic projects nationwide including one in Michigan related to water access site improvements.50
The Clean Water State Revolving Fund (CWSRF) is a federal-state partnership that provides funds for water infrastructure projects, including stormwater and watershed pilot projects as well as water treatment and pollution abatement projects.51 The U.S. Environmental Protection Agency (EPA) oversees the program. CWSRF provides low-interest loans to eligible recipients; as the loan is repaid, that money is given out as new loans. Via “sponsorship” states can allow public, private, and nonprofit entities to access funding for nonpoint source pollution projects.52 Some examples of unique applications of the CWSRF include the purchase of land in order to protect water quality within a watershed. Green infrastructure and land conservation are also possible applications.53
Michigan-Specific State Funding
Michigan Department of Natural Resources’ (MDNR) recreation grants are available for projects that contribute to increasing opportunities for Michigan residents to participate in recreational activities. Some of the grants available require that applicants have a 5-year recreation plan approved prior to the application for project funding. One complication that may arise for water trails when applying for these grants is that the MDNR requires that funds are used for projects that take place on a single parcel, not across multiple parcels. Furthermore, water trail organizations typically have limited capacity to fill out these applications and ensure projects comply, making these grants difficult to obtain.54 Based on experience, the trail managers we interviewed stressed the importance of ensuring that grant applications provide explicit detail for how the funding would be used, otherwise an organization might risk getting denied early in the grant cycle. Despite their sometimes-limited application, a water trail might still consider applying for an MDNR grant.
The Michigan Department of Agricultural and Rural Development (MDARD) is charged with “encouraging and embracing innovation, creativity, and growth” in rural regions in Michigan. MDARD funds many programs centered around providing environmental protection and ensuring natural resources remain viable and profitable for businesses in Michigan.55 Multiple water trails in the state have utilized funding opportunities for such projects because a robust recreational water trail has the potential to bring economic activity to the surrounding areas. One specific program available to river trails is the Conservation Reserve Enhancement Program (CREP). CREP support can be used to reduce unoff by funding riparian buffers that help to restore high-traffic river areas where users are accessing portage points.56 Preserving the shores helps to preserve the water quality of the river, increasing further recreational opportunities for future generations and, in turn, increasing opportunities for long-term economic development.
The Michigan State Waterways Commission (MSWC) is a sevenmember advisory board that works with the MDNR to allocate dedicated funds for the acquisition, development, and maintenance of public water access sites.
38
It began as an entity that managed sites around the Straits of Mackinac and has since expanded to serve waterways throughout the state.57 Municipalities submit a request for proposal that is evaluated by the MSWC, which then determines what projects to fund and how to allocate expenses. This source has proven to be a useful option for water trails. The commission is funded through revenues generated by watercraft registration fees, taking 51% of the fees collected, as well as receiving 1.6% of the state gas tax on the sale of all gasoline. In many applications, the fund requires that the municipality secure matching funds on a 1:1 basis for the amount received, which opens the opportunity for collaboration with other organizations.
The Michigan Natural Resources Trust Fund (MNRTF) is under the guidance of MDNR and was established in 1976 as a fund for public land acquisition for outdoor recreation.58 Since its creation, the fund has granted more than $1 billion to local governments for developing and improving public outdoor recreation opportunities.59 The MNRTF is entirely funded through state efforts with no federal input through a portion of all state mineral, gas, and oil sales. At last check, the fund exceeded half a billion dollars, and projects are funded by the yearly accrued interest. It awards grants to local units of government and some recreation authorities as well as projects undertaken directly by the MDNR. In 1984, the fund received Michigan constitutional protection, and guidelines were adopted to direct the operation of the fund and to establish parameters in determining permissible fund uses and allocation amounts.60 Following those procedures and criteria, the MNRTF funded 45 separate projects across the state in 2022.
One example is a recreation project for the Iron Ore Heritage Trail in Marquette County.61 The trail received $150,000 in 2022, which was used to add more access points, as well as to improve accessibility to existing facilities. The MNRTF allows for 25% of its funding to be used to purchase land adjacent to already existing recreation areas to preserve, protect, and expand recreational spaces.62 To apply for MNRTF funding, a municipality must submit an application for a natural resource conservation-related project. A government unit that applies to the fund must have a 5-year recreation plan that has been approved by MDNR.63
Watershed Councils are organizations established under state law to protect rivers and their riparian areas through the maintenance and monitoring of water quality and land uses within the corresponding watershed.64 A watershed planner from the Huron River Watershed Council, which monitors more than 100 miles of the Huron River and its riparian zones located throughout five Michigan counties, noted that funding sources are more available to watershed councils because of Public Act Number 87 of 2021, which provides funding for watershed organizations through the Michigan Department of Environment, Great Lakes, and Energy (EGLE). 65,66 Rather than focusing solely on the water trail itself, managing a water trail through a state-recognized watershed council can offer additional benefits because the council addresses the entire watershed and may have access to additional funding opportunities (i.e., water quality funding) that trail management organizations alone may not enjoy.67
At the same time, watersheds cover large areas, and substantial administrative capacity is necessary to obtain funding for installing and maintaining improvements throughout their entire land areas comprehensively. Because watersheds do not follow jurisdictional boundaries, watershed councils also function across multiple jurisdictions, adding further to administrative challenges. In addition, funding for watershed councils is generally project-based, like most other funding mechanisms, implicating further the capacity requirements needed to obtain and administer large-scale projects using multiple funding sources.
A Note on User Fees
A water trail organization might also consider implementing a user fee for visitors. Currently, none of the recreational or water trail organizations we spoke with collect user fees. If fees are implemented, paddlers prefer them to remain low.68 A water trail study conducted in the late 1990s concluded that fees for overnight camping spots along a water trail could generate a variety of benefits, including covering maintenance costs, and it predicted an increase in their use over time as the need for funding rose.69 Alternatively, a second study conducted around the same time determined that nearly a quarter of low-income respondents to their survey traveled elsewhere or reduced their recreation due to user fees.
39
They also revealed that even a $5 daily fee would affect half of low-income users compared to influencing some 33% of highincome users.70 More recent research has similarly demonstrated that user fees displace low-income outdoor recreationists, as those recreationists are willing to travel up to three times farther to avoid paying a user fee.71 This is not due to an inability to pay but an unwillingness to do so.
Even so, the literature on recreational user fees is not conclusive. At least one analyst believes that conclusions about user fees are not well established, and that over 60% of paddlers may support a user funding system, even though higher-income paddlers were most likely to support them. That research recommends, accordingly, that resource managers gain an in-depth knowledge of the different segments of the water trail and how those different segments might be funded using different mechanisms before implementing user fee programs.72
THE HISTORY AND USES OF TAX INCREMENT FINANCING
Taken altogether, traditional methods for financing trails can lead to lackluster and inconsistent funding for water trail organizations. Though not commonly used, tax increment financing may offer a solid, sustainable funding source, with one study from West Virginia suggesting TIF-funded municipal park improvements could provide nearly $1 million annually in incremental property tax revenues.73 Before estimating what such a TIF might generate for a water trail such as the SRWT, this section provides an overview of the history of TIFs and their use in Michigan as well as a snapshot of the existing types of TIF authorities enabled under Michigan law.
General History of TIFs
Tax increment financing is a common funding mechanism used throughout the United States by a diverse range of municipalities. As of 2023, 49 states and Washington D.C. authorize the use of TIFs in some capacity with Arizona being the only state not to allow TIF usage. 74 The evolution of tax increment financing is important for understanding and developing contemporary revisions to TIF use and laws for water trails.
Tax increment financing was first enabled by Proposition 18 in California in 1952. The goal of the legislation was to provide Redevelopment Agencies (RDAs), which had been enabled by the Community Redevelopment Act in 1945, with greater financial capacity by creating a “self-financing” method for redeveloping blighted urban areas. Prior to Proposition 18, RDAs relied primarily on federal funding through the Housing and Home Finance Agency, the predecessor to the current Department of Housing and Urban Development, to pay for development projects.75
The general practice of a TIF authority since its inception has been to fix a base, invest in improvements, and then use the resulting increase in tax revenue (i.e., the increment) to retire the debt incurred to pay for the improvements. That approach, for the most part, has served as the foundation for ensuing TIF adaptations.
Over the next two decades following Prop 18, TIFs grew in popularity statewide as California began guaranteeing funding for public schools in 1972, regardless of property tax capture. 76 Further, the passage of Proposition 13 in 1978 restricted the ability of local governments to increase property taxes.77 Alongside crumbling city infrastructure and growing public concern, these monumental policy changes helped popularize RDAs in California as a means for economic development in distressed urban areas. Nonetheless, in January 2011, California drastically cut the use of TIFs after Governor Jerry Brown declared a state of fiscal emergency.78 Brown blamed the state’s $25.4 billion budget gap on redevelopment authorities, which had been diverting nearly $5 billion a year in property tax revenue.79 Governor Brown used the fiscal emergency to effectively dissolve the use of RDAs in 2012.80 Today, California’s TIFs have been largely stripped of their independence from public input. The story of TIFs in California illustrates how tax increment financing is neither infallible nor inevitable as a financing tool, and it lends important insight as we explore the viability and longevity of TIF as a financing tool elsewhere in the country.
40
History and Uses of TIFs in Michigan
Midwestern states began to take an interest in TIF in the 1960s and 1970s when the incentivization of TIF usage coincided with the era of federal devolution. During this time, the federal government began divesting heavily from state and local government development projects. The State of Michigan first passed TIFenabling legislation in 1975 as part of Public Act 197, also known as the Downtown Development Authority (DDA) Act.81 More recently, lawmakers introduced the Waterfront TIF, which funds inland lakes, along with several other TIFs during the Great Recession to provide both rural and urban municipalities with tools to combat the economic downturn. One former state lawmaker we interviewed, who was involved in shepherding these bills through the legislature, however questioned whether current lawmakers would have the appetite for similar legislative reform today.
Public Act 57 of 2018
In response to concerns over insufficient accountability and transparency within TIF agencies throughout the state, the Michigan Legislature passed Public Act 57 of 2018. This legislation repealed and recodified several TIF-related acts, including the DDA Act of 1975, the Tax Increment Finance Authority Act of 1980, the Local Development Financing Act of 1986, the Corridor Improvement Authority Act of 2005, the Neighborhood Improvement Authority Act of 2007, the Nonprofit Street Railway Act of 2008, and the Water Resource Improvement Tax Increment Finance Authority Act of 2008. Public Act 57 sets forth several provisions related to funding public improvements, as laid out below.
Expansion of TIF usage under Michigan Law through 2018 PA 57
Over time, the uses of TIFs in Michigan have expanded beyond the original intent of the tool. There have been several expansions to allow TIFs to address a broad range of objectives, like encouraging employment and brownfield redevelopment, and to extend TIFs’ applicability to outside the downtown area. TIF law has also changed to allow capturing the incremental increase of property tax revenue within a TIF district that is not strictly attributable to the improvements. TIF authorities can capture the incremental
increase in property tax revenue attributable to inflation, for example.
While this is encouraging, incorporating innovative TIF usage under Michigan law will by no means be simple or politically feasible. To better understand the feasibility of amending Michigan’s current TIF legislation to support financing along a river, it is helpful to first explore the allowable uses and eligibility requirements under current legislation. Outlined below are several types of TIFs introduced as tools for municipalities under prior legislation, and further defined under Public Act 57.
Downtown Development Authority (DDA)
Downtown Development Authorities represent the original form of TIF established in Michigan in 1975. These entities help mitigate property value deterioration by using funds to address the causes of deterioration and promote economic growth within the Tax Increment Financing District (TID).82 DDAs are authorized to capture TIF revenues as well as secure funding from grants, contracts, and interest on loans.83 DDAs can only establish a TID in an area zoned for business uses.
Local Development Financing Authority (LDFA)
This form of tax increment financing was designed to promote economic growth and job creation within specific area boundaries. Cities, villages, and urban townships can create LDFA districts, and municipalities within a single county can join together to establish an LDFA.84 For a project to be eligible under an LDFA, the primary purpose must fall into one of the following categories:85
• Manufacturing or processing of goods or materials
• Agricultural processing
• High technology activity for research, product development engineering, laboratory testing, or industrial technology
• Energy production
• Business incubation
Corridor Improvement Authority (CIA)
The Corridor Improvement Authority Act was first established in 2005 as Public Act 280. CIAs aim to provide municipalities with opportunities to finance improvements that correct and prevent the deterioration of business districts outside of their main downtown areas. To be eligible, the TID must:
41
• Be within 500 feet of a road classified as an arterial or collector
• Contain at least ten contiguous parcels or five continuous acres
• Be zoned for mixed-use and high-density residential use
• Have more than half of the existing first-floor ground space square footage classified as commercial real property
• Be served by municipal water and sewer
Uniquely, Corridor Improvement Authorities can span two or more municipalities, important to note because the creation of a TIF district spanning the Shiawassee River Water Trail would require cooperation and coordination among over 20 municipalities. Encouragingly, Michigan law allows TIFs to be intergovernmental.
Neighborhood Improvement Authority (NIA)
A city or village can establish a Neighborhood Improvement Authority to improve public facilities in residential neighborhoods.86 NIAs are different from other TIDs because they are the first TIF allowed to finance improvements in residential districts.87
Nonprofit Street Railways
This type of TIF was established to encourage the development of transportation facilities and the provision of public transportation services by allowing nonprofit organizations to acquire, construct, maintain, and operate street railway systems. Under this classification of TIF, a nonprofit becomes a “street railway” and can manage the TIF funds, in addition to (or rather than) a unit of government, as required by all of the other TIF enabling provisions.
Water Resource Improvement District
Waterfront TIFs were first enabled in Michigan by Public Act 57 of 2018 to help municipalities secure funding to control invasive species and maintain infrastructure on and within one mile of an inland lake. Eligible inland lakes must also have at least two public access points. Under this type of TIF, several municipalities can coestablish a Water Resource Improvement District as long as the municipalities are adjacent to one another.
Additional TIF
Brownfield Redevelopment Authority
The ability to establish a Brownfield Redevelopment Authority was granted to municipalities by Public Act 381 of 1996, also known as the Brownfield Redevelopment Financing Act. Sites eligible for this
type of TIF are often limited to those directly contaminated or adjacent to contamination sites. Depending on the municipality, eligibility may be extended to properties that are blighted or functionally obsolete.88 Funds gathered from the TID can be used to assist in the cleanup or redevelopment of the property.
It is important to understand the history and uses of TIFs in Michigan in order to evaluate whether an amendment or revision to the existing TIF legislation is a feasible option for the Shiawassee River Water Trail Coalition to pursue. Based on our findings, it appears as though an expansion to allow for a water trail-targeted TIF aligns with the trajectory of the uses of TIFs in the state.
WHAT MICHIGAN TIF EXPERTS SAY Success and Struggles
To better understand the successes and pitfalls of TIFs in Michigan, we conducted interviews with ten Michigan planners and TIF experts. These professionals consistently agreed that having both a strong vision and a clear communication strategy about TIF goals are vital to success. Such efforts help overcome wariness from officials and the general public. Some interviewees, including a former state legislator heavily involved in crafting TIF laws, cautioned that legislative reform to encompass funding for water trails may be too difficult to accomplish politically.
At the outset, any municipality interested in establishing a new TIF must develop clear, achievable goals that resonate with a broad audience, multiple planners said. Doing so is not only important for the required TIF plan but also for winning over public support. Successful Michigan TIF districts have identified concrete outcomes the municipality can expect to achieve with TIF funding, and they have developed narratives around why these outcomes are vital to the community. This often requires significant coalition building and a single voice cheerleading the project. When communities have disparate ideas of success, the political will to move forward often dies. According to a planning consultant who
42
has worked with several Michigan cities, one luxury of a new project like the Shiawassee River Water Trail is that leaders can define what success looks like. Even so, success along one portion of the river may look different than somewhere downstream, so project leaders will need to be adept at communicating and compromising.
Downtown Development Authorities, the most common type of TIF district, are typically more successful than other TIFs, at least in the eyes of the public, because the results are tangible. Residents can see and touch the outcomes of TIF financing in the form of street beautification projects and new economic activity. Funding recreation was not a priority for the DDA officials we interviewed. However, with a river trail or similar recreation project, those who use the amenities will easily recognize the improvements, even though demonstrating success to the larger community may be difficult.
While many of the experts interviewed shied away from weighing in directly on whether a TIF for the Shiawassee River specifically would be feasible, most noted the merit of using this style of funding. TIFs offer a sustainable funding source and allow targeted spending within the district. Even so, though a TIF district may have virtue, the idea of tax increment financing to the general public and municipal officials may be a tough sell, several experts said. If a community does not have significant blight, the classic “but for” test applied to TIFs may not win over locals. Put simply, a “but for” test ponders whether economic development or increased property values would have occurred without the TIF district. Because TIFs were created originally to halt economic decay, demonstrating that river amenities will spur economic development will be crucial.
In rural areas, proving that less developed portions of the river are blighted may also be difficult. It may be hard to define blight in areas with less history of development, such as rural areas. In any case, if the purpose of the TIF is to provide dedicated funding for water trail maintenance and improvements that should yield public benefits, such as increased property values or economic development if not blight reduction, water trail managers will need to adequately demonstrate that those outcomes can be attributed at least in part to their maintenance and improvement efforts, whether in urban or rural settings.
Equitable fund sharing poses an issue for any multi-jurisdictional financing mechanism, several experts also noted. Specifically, with a river trail, a smaller community with a single launch point may contribute a significantly smaller amount of funding than a larger community with multiple access points. Thus arises the question of whether these funds should be limited to the community where they are raised or spread out across the TIF district. Authorization language must clearly spell out where funds will be used. If dollars are spread out across the district, the authority, the coalition, or a similar entity, must justify to officials and the public that projects in other areas will also benefit their own communities.
TIF districts that struggle typically do so because the promised development never materializes and the district does not raise the expected funds, planners said. These struggles happen for a variety of reasons that largely depend on the makeup of the community, including misplaced priorities or a lack of interest from private developers.
Political, Economic, and Community Considerations
Planners involved in Michigan TIF districts warned that districts often get caught in the friction between the evolution of the city and residents opposed to change. For instance, DDAs are often involved in projects that traditionalists are not in favor of, such as bringing density to downtowns. Equally cumbersome is the perception that TIFs provide direct subsidies or payouts that line developers’ pockets. Though some downtowns may have the capacity to provide development reimbursements, the widespread nature of this practice is often a misconception as most DDAs simply provide the capital for improvements (streetscaping, bikeways, new sidewalks, etc.) that make the area more attractive to developers. Similarly, because TIFs rely on the incremental increase in tax revenue, many people believe the TIF will directly increase property taxes.
The type of projects undertaken may also trigger public resentment of the TIF. Raw infrastructure projects, like new sewers, streets, and sidewalks are easy to justify. However, several interviewees shared that especially with DDAs, TIF projects are often viewed as
43
“fluffy” placemaking efforts such as revamping a farmers market or cleaning up a riverwalk. Residents may question the need for such projects when their neighborhoods are marked with potholes. Similarly, TIFs often appear to have no sunset period. Michigan law fixes a TIF authority’s lifetime to 30 years, but most are renewed without much public comment. After the majority of projects in the original TIF plan are completed, residents often question why the district continues to collect new revenue.
A now-retired planning consultant who worked with Michigan municipalities to establish and plan for LDFA, CIA, and DDAs worried about the feasibility of a water trail TIF. Tax increment financing is primarily used for improvements in commercial or industrial areas, and as such, relies on those types of properties for funding. Many of the parcels along the SRWT are residential or agricultural, creating a potential burden for justifying the TIF. Additionally, some properties will not fall within the new TIF capture as they are already in a TIF district or are publicly owned.
The finance director for a large DDA noted that while county-level TIFs are not the norm, county treasures are well suited for managing TIFs. Treasures are well versed in Michigan law and finance best practices. As a result, they are generally well-trusted by both other public officials and the public.
In sum, contemplating the potential political pitfalls, especially regarding the creation and use of TIFs, reinforces the need for establishing a clear purpose, discernable, and measurable goals and a strong narrative for conveying why a new TIF is needed.
USING TIFS TO FUND WATERFRONT DEVELOPMENT
TIFs as Recreational Funding
While numerous studies have suggested using a TIF to fund a park or clean up a body of water, no literature reveals that this has been attempted. TIFs as funding mechanisms for parks and recreation were first proposed in the literature in 1986 when researchers recommended investing TIF revenues in parks to revitalize blighted urban places.89 Due to declining funding from the higher-level government and the subsequent shrinking of investment in recreation and culture, TIFs were also recommended as a viable option for park improvements when included in a larger redevelopment plan.90 Recognizing the potential impact on property values, an in-depth analysis of using TIFs for municipal parks in West Virginia not only recommended TIFs but also estimated that their use near two parks could increase property values by $280 million. The research estimated further that this could yield up to $980,000 annually in incremental property tax revenues for the two nearby municipalities.91
In search of innovative funding for waterfront development and environmental improvements, a report for the Great Lakes Protection Fund recommended TIFs for sediment cleanup and dredging, especially as part of a larger redevelopment project. Examples of this include projects that used TIF funds for parks and trails, stream naturalization, wetlands restoration, habitat reclamation, and “daylighting” a river.92 While some projects were undertaken because of enforcement action against private parties, others were voluntary in nature, such as water trail maintenance would be. In White Lake, Michigan, sediment cleanup caused landside property values and, therefore, tax revenues to increase. The cleanup also contributed to new development around the lake.93 In Jackson, Michigan, riverfront redevelopment of the Grand River as part of a Consumer Credit Union project contributed to stream restoration, preservation of greenspace, and riparian buffer
44
improvement.94 The project also “stimulated public awareness that the river is an important recreation and development asset for the City and that environmentally conscious riverfront development can become a reality,” and it improved the public’s sense of safety and security.95
Discussions around using TIFs for maritime infrastructure improvement illuminated issues with tax increment district (TID) boundaries as well as providing examples of TIF use in waterfront communities.96 In Florida, municipalities often struggle to fund the removal of derelict vessels, carry out channel improvements, and conduct environmental restoration and sea level rise adaptation projects. Community Redevelopment Agencies often attempt to revitalize blighted working waterfront areas via the improvement of land-based infrastructure such as docks, boardwalks, and pavilions, as well as the installation of new boat storage, educational riverwalks, navigational aids, and signage. Using TIF funds for improvements outside of TIDs, such as when the TID boundary stops at the waterline, can be legally questionable. However, some municipalities in Florida have pursued water-side projects despite this hurdle.97
Besides TIFs, other funding mechanisms that collect taxes from special assessment districts near parks have been implemented. These taxing strategies were utilized in Kansas City, Missouri; Denver, Colorado; and Minneapolis, Minnesota. In Minneapolis, legislation passed in 1911 allowed the City to have a system of graduated property taxes, where those closest to the park pay higher taxes than those further away. This special assessment method to finance new parks was eventually abandoned when it was realized that neighborhoods with low incomes could not easily pay for a park.98
Despite the lack of real-world examples using TIFs to solely fund recreation areas and their maintenance, the increasing reference to this option in both scholarly literature and policy reports supports further investigation into making this a reality.
TIF Experts’ Feedback
Overall, none of the experts interviewed were aware of any municipalities using the Waterfront TIF enabled under Michigan law, seemingly the most logical TIF mechanism to apply to a river trail. This tool, first introduced in 2008, allows municipalities to establish tax increment financing along the shores of an inland lake primarily to improve water quality and battle invasive species. One urban planner involved in a DDA was aware of an organization pushing for a trail project that had considered establishing a Waterfront TIF, as part of the trail is set to run along the local river. However, given its focus on water quality, the organization found the mechanism too restrictive. It was difficult to prove that walking trails would result in significant environmental improvements.
Corridor Improvement Authorities
A planner at the Michigan Municipal League noted that another tax increment financing mechanism is equally applicable to a river trail – a Corridor Improvement Authority (CIA). CIA legislation allows TIFs to be established along major commercial roads and streets. Historically, rivers have acted as natural corridors for transportation and economic activity and now provide a corridor for canoers and kayakers. Modification of the CIA language to include certain Michigan river trails may accomplish the goals of the SRWTC. The CIA legislation allows multiple jurisdictions to coordinate on a single TIF authority; intergovernmental cooperation that will be necessary for a Shiawassee River Water Trail TIF to work. Additionally, CIA TIFs are narrow districts that follow the arterial road or street in a similar fashion to the TIF district that the Coalition wishes to establish.
A few hurdles exist to using CIA legislation for a river trail despite the similarities. First, a CIA TIF can only be established on properties bordering a road classified as an arterial or collector by the Federal Highway Administration. Any new legislation would need to include federal or state-designated river trails. Second, parcels in a CIA TIF must be contiguous, potentially an issue for land along the Shiawassee that falls within an existing TIF or within a municipality that opts out of joining the SRWTC. Finally, and possibly most cumbersome for a river trail, using a CIA TIF involves several property use and zoning requirements.
45
Half of the properties in a CIA TIF district must have ground-floor commercial use, and the property must be zoned for residential, commercial, and industrial use. Further, the property must be served by municipal water and sewage. As most of the properties along the Shiawassee are rural residential properties with septic tanks, such restrictions would make a CIA TIF along the river unworkable. To allow for water trail CIA TIF, the new legislation would therefore need to include loosened restrictions.
TIF Risks
Expanding the use of TIF funding also poses risks. As noted by one planning consultant, the use of tax increment financing has already greatly expanded from the law’s original intent of improving beleaguered downtowns. Some TIF districts have come under fire for reaching beyond the intent of the law to benefit areas that are not blighted or polluted. For instance, some communities have faced criticism for establishing corridor improvement districts along highway interchanges that are seemingly not blighted. Legislators critical of the taxing mechanism, or those looking for ways to reign in property taxes, may see an expansion of the law as an overreach. Changes to the TIF law may bring TIF districts under increased scrutiny that could potentially harm communities where the TIF is being used appropriately, shared the interviewed planning consultant.
Broadening TIF language to include waterways could open the door to even further expansion of the law, the consultant said, noting that if a river trail qualifies for TIF funding, then a municipality could potentially justify using this funding for a hiking trail as well. As tax increment financing expands, Michigan municipalities could reach a point where most jurisdictions are under some form of TIF. The interviewee shared that this may not be palatable to some members of the public because such expanded use of TIFs would take power away from elected officials to determine where money is spent through expenditures made using general tax fund revenues. That said, this situation may have value in and of itself: TIFs allow districts to target public investment so tax dollars raised in a given district stay in that district.
Ideally, a TIF district is able to capture incremental increases in property value that can be attributed to improvements funded through the authority’s work. However, TIF experts we talked to
said it can be difficult to assess exactly how much money is related to improvements versus natural increases from inflation. Current language in Michigan’s TIF law allows authorities to exclude inflation-related gains in property value but does not require it.99
Feedback from Municipal Leaders Survey Results
We conducted a brief seven-question survey designed to provide a general characterization of the levels of familiarity with and experience using TIFs among leaders of the 22 jurisdictions encompassing the SRWT. The survey was intended to serve as a base reference for future more in-depth surveys, should they be conducted. Our goal was to have participation from all 22 jurisdiction leaders; 11 responded. All responding jurisdiction leaders said they were familiar with TIFs. Five of the participants failed to mention what types of TIFs they were familiar with, however, or they noted that they did not have direct experience with TIFs. The remaining six participants stated that they were familiar with DDA TIFs specifically. Two jurisdiction leaders have experience with BRA TIFs, and one participant had direct experience using LDFAs.
We assume conservatively that the local officials surveyed who did not respond to our inquiry failed to do so because they do not have substantial familiarity with TIFs. That assumption, and extrapolation from the information provided by those who did respond, suggests that most local officials within the jurisdictions that would be affected by a SRWT TIF in fact have very limited familiarity with TIFs in general, as well as TIFs that serve purposes beyond local conventional economic development in particular. That suggests, in turn, that the SRTWC will need to engage in substantial local education efforts, should it decide to proceed with a proposal to develop a water trail TIF.
46
Feedback from Trail Organizations
In general, the experts we spoke to expressed interest in using a TIF to fund a water trail, but many also stated concerns about some communities being less interested in using such an approach for funding. Communities that may be less interested in a water trail TIF might have less access to the river within their jurisdiction or have a smaller tax base from which municipal administrators would prefer not to relinquish any additional funds. Trail towns with established relationships with the river, and that have benefited from economic development and improved environmental quality already because of the water trail, would likely be more interested. Presenting the idea of a TIF to these communities should underscore the potential economic and health impacts of the water trail, how to best take advantage of it even with few current river access points, and the positive impact of the water trail TIF relative to the amount of taxes diverted. The trail staff we spoke to viewed a TIF as a positive opportunity to match grant funding, stabilize a water trail’s budget over multiple years, and finance difficult-tofund maintenance or early-stage projects.
Marketing TIFs
Most staff emphasized the importance of carefully crafting language to be used around the proposed water trail TIF. It is essential to be prepared with well-coordinated talking points; a thoughtful campaign; and take-home material with thorough explanations of TIFs, positive examples of their uses, and potential improvements that the water trail TIF could fund. Community engagement would also be vital to convincing jurisdictions to implement the TIF. Finding local champions or “early adopters” whom the community trust and that can be well-versed in the TIF and bring additional stakeholders on board can help in the TIF adoption process. The SRWTC has already begun conversations with its members, but further outreach to municipal boards and decision-makers should start early.
Strengthening the ties between the water trail and its local community bolsters reasons to support funding the trail itself. One interviewee insisted on presenting the TIF funding as, “They’re not funding a water trail, they’re funding a [whitewater] destination” in reference to whitewater water trails in Georgia, emphasizing the holistic benefits to local communities that water trails offer rather focusing on generating funds for the trail alone.
Another way to increase community approval for TIFs would be to highlight a specific issue the TIF funding would be able to address. For example, a watershed council we spoke to oversees a water trail, but due to log jams that consistently block passage in that section of the river, the watershed council does not actively promote it. Some notorious log jams are quite large and can be viewed via satellite imagery. Alternately, the council has promoted paddling in other sections of the river, and some riverside cities have invested in paddle infrastructure in the sections within their jurisdiction. Lack of maintenance funding hinders log jam removal, which is frustrating to both the council and community members. Iterating that the TIF could be used for log jam removal may unite communities around the idea of approving the TIF. The watershed council staff member was optimistic that the community’s reception to a TIF would be more positive if presented as a longterm solution to log jams.
HOW TO MEASURE SUCCESS
After establishing a TIF district it is vital to prove that projects done within the district have led to incremental increases in property value. The accounting director for a successful downtown development authority said they were aware of only two ways to measure if TIF projects are successful: compare property value within the district with similar properties outside the district or compare property values after the district is established with historical data.
The potential problem with both of these measures is that they are broad and use large, general numbers. As such, they lack nuance and may not provide necessary detail. As a result, it may be difficult to immediately determine if improvements to a water trail can be directly connected to incremental property value improvements.
Resources for Estimating Trails’ Impacts
Determining the exact economic impacts of outdoor recreation, including water trails, involves considering a wide variety of factors. The U.S. National Park Service has long been interested in conducting economic impact surveys. Their “Economic Impacts
47
of Protecting Rivers, Trails, and Greenway Corridors” is meant to assist communities in identifying economic impacts and utilizing economic impacts in acquiring more funding. The resource estimates the economic impact of parks, trails, and rivers by analyzing their effect on commercial uses, local resident expenditures, and travel and tourism.100 Additionally, the resource book provides information on how to connect agency or organization expenditures, green infrastructure, corporate and retirement relocation and retention, gateway communities, and real property values to the economic benefits of nearby trails, as well as recommending potential sources for this information. Sample survey questions for economic impact analysis are also provided. In 2005, a revised draft was published that included how to estimate the economic impact of trails’ public health benefits along with an example economic analysis for Golden Gate National Recreational Area.101 A similar example of a water trail economic analysis is the “Economic Potential of the Tennessee RiverLine Water Trail” white paper prepared by the University of Tennessee- Knoxville and the University of Alabama.102
TURNING TOWARD THE SHIAWASSEE
Based on our background research, we conclude that while TIFs have not yet been used for recreational areas, there is potential for their use when considering their positive effects on local economies and property values, as well as their legislative feasibility. With this in mind, we begin our assessment of a water trail TIF for the Shiawassee River, first by imagining what TIF funds could bring to a community with a rendering of an accessible kayak launch. Following that illustration, we provide case studies that investigate the impact of water trails specifically on rural communities and with regard to ensuring accessibility. Finally, we present our analyses regarding the potential revenue capture for a water trail TIF along the Shiawassee River, along with the results from an equity analysis.
48
Citations
1. Laani Uunila and Russell Currie, “MARKET FEASIBILITY OF A WATER TRAIL,” in PROCEEDINGS OF THE 1999 INTERNATIONAL SYMPOSIUM ON COASTAL AND MARINE TOURISM, ed. Mark L. Miller, Jan Auyong, and Nina P Hadley (THE 1999 INTERNATIONAL SYMPOSIUM ON COASTAL AND MARINE TOURISM, Vancouver, WA: Washington Sea Grant, 2002), https://repository.library.noaa.gov/view/noaa/36225/noaa_36225_DS1.pdf#page =124.
2. Juliene Melissa McLaughlin, “Ecotourism Assessment: Applying the Principles of Ecotourism to Paddle-Based Recreation in St. Lawrence Islands National Park and Environs” (M.S., Canada Ontario, CA, Queen’s University (Canada)), accessed March 7, 2023, https://www.proquest.com/docview/1514470827/abstract/FDBD7459E08E403F PQ/1.
3. McLaughlin.
4. Carole Kline et al., “Funding Sustainable Paddle Trail Development: Paddler Perspectives, Willingness to Pay and Management Implications,” Journal of Sustainable Tourism 20, no. 2 (2012): 235–56, https://www.tandfonline.com/doi/full/10.1080/09669582.2011.603425.
5. Kline et al.
6. Rachel Taylor, Carolyn Fryberger, and Emily Yeager, “French Broad River Access Study” (NC Growth, October 2019), https://ncgrowth.unc.edu/wpcontent/uploads/2019/10/French-Broad-River-Access-Study-web.pdf
7. Taylor, Fryberger, and Yeager.
8. J. Beedle, “2008 Paddle Tourism Study: North Carolina State Trails Program,” 2008, http:// flintriver.org/blog/watertrail/resources/.
9. Southwick Associates, Inc. and Outdoor Industry Foundation, “The Economic Contribution of Active Outdoor Recreation – Technical Report on Methods and Findings” (Fernandina Beach, Florida, July 9, 2006), https://outdoorindustry.org/wp-content/uploads/2017/03/2006-The-EconomicContribution-of-Active-Outdoor-Recreation.pdf.
10. Washtenaw County Office of Community and Economic Development, “Huron River Water Trail Economic Impact Analysis” (Ann Arbor, MI: Washtenaw County Office of Community and Economic Development, December 2013), https://www.hrwc.org/wpcontent/uploads/2014/03/HRWT%20Economic%20Impact%20Report.pdf.
11. Charles B. Sims, Jilleah G. Welch, and Brain Rushing, “Economic Potential of the Tennessee RiverLineWater Trail,” White Paper Series 1 (Howard H. Baker Jr. Center for Public Policy: University of Tennessee Knoxville, June 1, 2022), https://bakercenter.utk.edu/energy-and-environment-white-papers/economicpotential-of-the-tennessee-riverline-water-trail/.
12. Sims, Welch, and Rushing.
13. Sims, Welch, and Rushing.
14. Sims, Welch, and Rushing.
15. Duygu Karadeniz, “The Impact of the Little Miami Scenic Trail on Single Family Residential Property Values” (Cincinnati, OH, University of Cincinnati School of Planning of College of Design, Art, Architecture, and Planning, 2008), https://www.como.gov/wp-content/uploads/2021/02/trail_eco_impact_study.pdf
16. Seattle Engineering Department Office for Planning, “Evaluation of the BurkeGilman Trail’s Effect on Property Values and Crime,” May 1987, http://www.brucefreemanrailtrail.org/pdf/Burke-Gilman.pdf.
17. Seattle Engineering Department Office for Planning.
18. Seattle Engineering Department Office for Planning.
19. Terry Jennings, “A River Runs Through It: Assessing the Attitudes of Landowners along the Luling Paddle Trail” (San Marcos, Texas., Texas State University-San Marcos, 2010), https://digital.library.txstate.edu/handle/10877/3533.
20. John L. Crompton, “The Role of the Proximate Principle in the Emergence of Urban Parks in the United Kingdom and in the United States,” Leisure Studies 26, no. 2 (April 1, 2007): 213–34, https://doi.org/10.1080/02614360500521457.
21. Mark L. Burton and Michael J. Hicks, “Tax Increment Financing Implications of Municipal Parks in West Virginia: Spatial and Semi-Parametric Estimates,” Journal of Park and Recreation Administration 25, no. 2 (April 18, 2007), https://js.sagamorepub.com/jpra/article/view/1361.
22. Burton and Hicks.
23. Karadeniz, “The Impact of the Little Miami Scenic Trail on Single Family Residential Property Values.”
24. Karadeniz.
25. Karadeniz.
26. Natalie Warren, “An Economic Argument for Water Trails” (River Management Society: River Management Society, October 2015), https://www.rivermanagement.org/assets/WaterTrails/economic%20argument%20for%20water% 20trails.pdf.
28. Paul Isely et al., “The Economic Impact of the Huron River,” Other Faculty Publications (Grand Valley State University, March 2017), https://scholarworks.gvsu.edu/cgi/viewcontent.cgi?article=1004&context=eco_o therpubs. Warren, “An Economic Argument for Water Trails.”
29. Isely et al., “The Economic Impact of the Huron River.”
30. Isely et al.
49
31. Roger L. Moore et Saleh Mamun et al., “Valuing Water Quality in the United States Using a National Dataset on Property Values,” Proceedings of the National Academy of Sciences 120, no. 15 (April 11, 2023): e2210417120, https://doi.org/10.1073/pnas.2210417120.
32. al., The Economic Impacts and Uses of Long-Distance Trails : Featuring a Case Study of the Overmountain Victory National Historic Trail ([Washington, D.C.]: U.S. Dept. of the Interior, National Park Service, 1998).
33. Carol Streiner and John Loomis, “Estimating the Benefits of Urban Stream Restoration Using the Hedonic Price Method,” Rivers 5 (January 1, 1995), https://www.researchgate.net/publication/242190184_Estimating_the_Benefits_ of_Urban_Stream_Restoration_Using_the_Hedonic_Price_Method.
34. Streiner and Loomis.
35. Siân Mooney and Ludwig M. Eisgruber, “The Influence of Riparian Protection Measures on Residential Property Values: The Case of the Oregon Plan for Salmon and Watersheds,” The Journal of Real Estate Finance and Economics, no. 22 (2001): 273–86, https://doi.org/10.1023/A:1007899716050.
36. Rivers, Trails, and Conservation Assistance National Park Service, “Economic Impacts Of Protecting Rivers, Trails, And Greenway Corridors: A Resource Book,” 1995, https://www.railstotrails.org/resourcehandler.ashx?id=4250.
37. W. A. Schutjer and M. C. Hallberg, “Impact of Water Recreational Development on Rural Property Values,” American Journal of Agricultural Economics 50, no. 3 (August 1968): 572–83, https://doi.org/10.2307/1238260.
38. Kent F. Kovacs, “Integrating Property Value and Local Recreation Models to Value Ecosystem Services from Regional Parks,” Landscape and Urban Planning 108, no. 2 (November 1, 2012): 79–90, https://doi.org/10.1016/j.landurbplan.2012.08.002.
39. Kline et al., “Funding Sustainable Paddle Trail Development: Paddler Perspectives, Willingness to Pay and Management Implications.”
40. Kline et al.
41. Palm, “Innovators Fund - Huron River Watershed Council,” accessed May 5, 2023, https://www.hrwc.org/donate/innovators-fund/.
42. yhb CPAS and Consultants, “THE APPALACHIAN TRAIL CONSERVANCY FINANCIAL STATEMENTS,” April 13, 2022, https://appalachiantrail.org/wpcontent/uploads/2022/07/atc_financial_report_2021.pdf.
43. The Maine Trail Center, “Dave Startzell –Trail Champions,” April 28, 2021, https://trailchampions.matc.org/dave-startzell/.
44. Andrea Paine, Personal Communication, April 25, 2023.
45. “The Trails Capacity Program -American Trails,” accessed April 9, 2023, https://www.americantrails.org/the-trails-capacity-program.
46. “A Transformational Decision | Erb Family Foundation,” Fred A. and Barbara M. Erb Family Foundation (blog), accessed April 11, 2023,
https://www.erbff.org/fdn-news/a-transformational-decision/.
47. American Trails, “Recreational Trails Program Facts and Status,” American Trails, accessed April 23, 2023, https://www.americantrails.org/rtp-about.
48. Federal Highway Administration, “Recreational Trails - Environment -FHWA,” Federal Highway Administration - Office of Planning, Environment, & Realty, June 22, 2022, https://www.fhwa.dot.gov/environment/recreational_trails/.
49. Federal Highway Administration, “Recreational Trails Program Project Database,” Recreational Trails Program Project Database, accessed April 23, 2023, https://recreationaltrailsinfo.org/.
50. Federal Highway Administration, “Record ID 9599: Michigan - Parmalee Bridge,” Recreational Trails Program Project Database, accessed April 23, 2023, https://recreationaltrailsinfo.org/project/9599/?mode=.
51. US EPA, “Clean Water State Revolving Fund (CWSRF),” Collections and Lists, April 13, 2015, https://www.epa.gov/cwsrf.
52. Jackie Rigley, “What’s New with Clean Water State Revolving Funds?,” Highstead (blog), February 22, 2022, https://highstead.net/insights/whats-newwith-clean-water-state-revolving-funds/.
53. Maria Martinez, “Using State Revolving Funds for Land Conservation” (Conservation Finance Network, n.d.), https://www.conservationfinancenetwork.org/sites/default/files/201902/CFN%20Toolkit%20-%20State%20Revolving%20Funds%20Rev.pdf.
54. Interview with Water Trail Exec Dir., February 6, 2023.
55. “Department of Agriculture & Rural Development.” MDARD. Accessed March 17, 2023. https://www.michigan.gov/mdard.
56. “Conservation Reserve Enhancement Program (CREP).” MDARD. State of Michigan, 2023. https://www.michigan.gov/mdard/environment/crep#eligibility.
57. “Michigan State Waterways Commission.” SOM - State of Michigan. Accessed April 4, 2023. https://www.michigan.gov/whitmer/appointments/oma/all/3/michigan-statewaterways-commission.
58. “Michigan Natural Resources Trust Fund (MNRTF).” Lansing: State of Michigan Department of Natural Resources, February 10, 2015.
59. Mayes, Jon. “Whitmer Approves $45.6 Million in Natural Resources Trust Fund Grants.” Michigan Department of Natural Resources, 2022. https://content.govdelivery.com/accounts/MIDNR/bulletins/322fe41.
60. Wild, Viola Bay. “Fiscal Focus: Michigan Natural Resources Trust Fund.” Lansing: House Fiscal Agency, September 2012.
61. Kendrick, Tristen. “Michigan Natural Resources Trust Fund Set to Improve up Outdoor Recreation.” https://www.uppermichiganssource.com, December 17, 2022. https://www.uppermichiganssource.com/2022/12/17/michigan-naturalresources-fund-set-imrpove-up-outdoor-recreation/.
50
62. Kendrick. “Michigan Natural Resources Trust Fund Set to Improve up Outdoor Recreation.”
63. “Natural Resources Trust Fund.” State of Michigan. Accessed April 4, 2023. https://www.michigan.gov/dnr/buy-and-apply/grants/rec/mnrtf.
64. “Managing Michigans Watersheds.” Michigan Lakes & Streams Association, INC, 2022. https://mymlsa.org/lake-and-watershed-management/managingmichigans-watersheds/. See Part 311 of 1994 Public Act 451.
65. “Our Watershed.” Huron River Watershed Council. HRWC, March 30, 2023. https://www.hrwc.org/our-watershed/.
66. “Act No. 87 Public Acts of 2021.” Michigan Legislature -Public Act Number 0087 of 2021. State of Michigan, 2021. https://www.legislature.mi.gov
67. Dan Brown, Interview with HRWC staff, Dan Brown, interview by Kat Cameron, March 9, 2023.
68. McLaughlin, “Ecotourism Assessment.”
69. Uunila and Currie, “MARKET FEASIBILITY OF A WATER TRAIL.”
70. Thomas More and Thomas Stevens, “Do User Fees Exclude Low-Income People from Resource-Based Recreation?,” Journal of Leisure Research 32, no. 3 (September 1, 2000): 341–57, https://doi.org/10.1080/00222216.2000.11949920.
71. Chase C. Lamborn, Jordan W. Smith, and Steven W. Burr, “User Fees Displace Low-Income Outdoor Recreationists,” Landscape and Urban Planning 167 (November 1, 2017): 165–76, https://doi.org/10.1016/j.landurbplan.2017.06.007.
72. Kline et al., “Funding Sustainable Paddle Trail Development: Paddler Perspectives, Willingness to Pay and Management Implications.”
73. Burton and Hicks, “Tax Increment Financing Implications of Municipal Parks in West Virginia.”
74. Council of Dev. Fin. Agencies. (2015). Tax Increment Financing: State-byState Report . Columbus: CDFA.
75. Casey Blount et al., “Redevelopment Agencies in California: History, Benefits, Excesses, and Closure,” U.S. Department of Housing And Urban Development, January 2014, https://www.huduser.gov/portal/publications/redevelopment_whitepaper.pdf
76. Strategic Economics, “Report on the Use of Tax Increment Financing,” State of California’s Governor’s Office of Planning and Research (Governor’s Office of Planning and Research, December 20, 2020), https://opr.ca.gov/docs/20210203-TIF_Tools_Final_Report.pdf.
77. “Proposition 13,” LA County Government, n.d., https://assessor.lacounty.gov/real-estate-toolkit/proposition-13.
78. Reuters Staff, “UPDATE 1-California Governor Declares Fiscal Emergency,” U.S., January 21, 2011, https://www.reuters.com/article/economy-californiaemergency/update-1-california-governor-declares-fiscal-emergencyidUSN2017743420110121.
79. State Of California, “Governor Brown Issues Proclamation Reaffirming Fiscal Emergency | Governor Edmund G. Brown Jr.,” January 20, 2011, https://www.ca.gov/archive/gov39/2011/01/20/news16882/index.html.
80. “TIF Case Studies: California and Chicago -The New School SCEPA,” Www.Economicpolicyresearch.Org, August 24, 2020, https://www.economicpolicyresearch.org/insights-blog/tif-case-studiescalifornia-and-chicagohttps://www.economicpolicyresearch.org/insightsblog/tif-case-studies-california-and-chicago
81. “Tax Increment Financing -Michigan Downtown Association,” n.d., https://www.michigandowntowns.com/tax_increment_financing.php#:~:text=Wh at%20is%20Tax%20Increment%20Financing,in%20the%20State%20of%20Michi gan.
82. Michigan Municipal League, “Economic Development Tools—Downtown Development Authority,” mml.org, February 2019, https://www.mml.org/resources/publications/one_pagers/2019-2-27FS_Econ_Dev_Tools_DDAs-2019&Plus.pdf.
83. “Downtown Development Authority -DEGC,” DEGC, April 5, 2023, https://www.degc.org/dda/.
84. “Local Development Finance Authority” (Michigan Economic Development Corporation, January 23, 2023), https://www.michiganbusiness.org/4947af/globalassets/documents/reports/fact -sheets/localdevelopmentfinancingactpa281.pdf.
85. Michigan Municipal League, “Economic Development Tools—Downtown Development Authority,” mml.org, February 2019, https://www.mml.org/resources/publications/one_pagers/2019-2-27FS_Econ_Dev_Tools_DDAs-2019&Plus.pdf.
86. Michigan Economic Development Corporation, “Neighborhood Improvement Authority (NIA),” Michiganbusiness.org, October 2018, https://www.michiganbusiness.org/4a8167/globalassets/documents/reports/fact -sheets/neighborhoodimprovementauthority.pdf.
87. Michigan Municipal League, “Economic Development Tools—Neighborhood Improvement Authority,” Mml.Org, February 2019, https://www.mml.org/resources/publications/one_pagers/2019-2-27FS_Econ_Dev_Tools_NIA-2019_&_Plus.pdf.
85. Michigan Municipal League, “Economic Development Tools—Downtown Development Authority,” mml.org, February 2019, https://www.mml.org/resources/publications/one_pagers/2019-2-27FS_Econ_Dev_Tools_DDAs-2019&Plus.pdf.
86. Michigan Economic Development Corporation, “Neighborhood Improvement Authority (NIA),” Michiganbusiness.org, October 2018, https://www.michiganbusiness.org/4a8167/globalassets/documents/reports/fact -sheets/neighborhoodimprovementauthority.pdf.
51
87. Michigan Municipal League, “Economic Development Tools—Downtown Development Authority,” mml.org, February 2019, https://www.mml.org/resources/publications/one_pagers/2019-2-27FS_Econ_Dev_Tools_DDAs-2019&Plus.pdf.
88. Michigan Economic Development Corporation, “Neighborhood Improvement Authority (NIA),” Michiganbusiness.org, October 2018, https://www.michiganbusiness.org/4a8167/globalassets/documents/reports/fact -sheets/neighborhoodimprovementauthority.pdf.
89. Michigan Municipal League, “Economic Development Tools—Neighborhood Improvement Authority,” Mml.Org, February 2019, https://www.mml.org/resources/publications/one_pagers/2019-2-27FS_Econ_Dev_Tools_NIA-2019_&_Plus.pdf.
90. SEMB, “Creating Successful Corridors,” Semcog.Org, n.d., https://www.semcog.org/desktopmodules/SEMCOG.Publications/GetFile.ashx?fil ename=CreatingSuccessfulCorridors_PlanningImplementationJuly2016.pdf.
91. Sheila J. Backman and John L. Crompton, “Developing Public Recreation and Park Facilities with Tax Increment Financing,” Journal of Park and Recreation Administration 4, no. 3 (1986): 40–48, https://rpts.tamu.edu/wpcontent/uploads/2020/09/Developing-Public-Recreation-and-Park-Facilitieswith-Tax-Increment-Financing.pdf.
92. Enid Slack, “Municipal Funding for Recreation,” Laidlaw Foundation, March 12, 2003, https://laidlawfdn.org/assets/municipal_funding_for_recreation_final_draft.pdf.
93. Burton and Hicks, “Tax Increment Financing Implications of Municipal Parks in West Virginia.”
94. Evans Paull and Greg Lewis, “Innovative Financing For Great Lakes Environmental Restoration: Concepts For Tying Waterfront Development To Environmental Restoration And Funding The Non-Federal Match For Great Lakes Legacy Projects.” (GREAT LAKES PROTECTION FUND, December 2008).
95. Paull and Lewis.
96. Paull and Lewis.
97. “Consumer Union Document Provided to NEMW” quoted in Paull and Lewis.
98. Samantha Culp, Thomas T. Ankersen, and Marissa Faerber, “The Tiff Over TIF: Extending Tax Increment Financing to Municipal Maritime Infrastructure,” Maine Sea Grant Publications, 2013, https://digitalcommons.library.umaine.edu/seagrant_pub/59.
99. Culp, Ankersen, and Faerber.
100. Slack, “Municipal Funding for Recreation.”
101. Recodified Tax Increment Financing Act 2018, Michigan Codified Law (MCL) 125.4412
102. Rivers, Trails, and Conservation Assistance National Park Service, “Economic Impacts Of Protecting Rivers, Trails, And Greenway Corridors: A Resource Book.”
103. Rebecca Ellen Nadel, “Economic Impacts of Parks, Rivers, Trails, and Greenways” (Masters Thesis, Ann Arbor, MI, University of Michigan, 2005), http://www.wildonesniagara.com/images/Nadel-2.pdf.
104. Sims, Welch, and Rushing, “Economic Potential of the Tennessee RiverLine Water Trail.”
52
(Page Intentionally Left Blank)
53
Results: SRWTC-Specific TIF and Equity Analysis

This section presents results from our initial analyses specific to the Shiawassee River Water Trail (SRWT). First, we provide a conceptual site rendering of an access point in Linden to demonstrate the amenities and improvements that could be made using the funds generated from an SRWT TIF. Next, we present the results from a GIS overlay analysis conducted to identify parcels along the Shiawassee River Water Trail that are potentially eligible to be included in an SRWT TIF, followed by results from the financial modeling and assessment of a potential 30-year TIF.
SITE RENDERING: LINDEN, MI
To illustrate the kinds of improvements a water trail TIF might fund, we prepared a sample rendering of what a kayak launch in Linden might look like (see figure 4). This site is on the water trail close to city hall. The kayak launch must be designed to meet the needs and requirements of the city and future water trail users. The rendering includes basic requirements such as access points, facilities (e.g., portable toilets), and the kayak launch. The kayak launch is a floating dock that leads to an accessible boarding kit that lowers the kayak into the water without needing additional help.
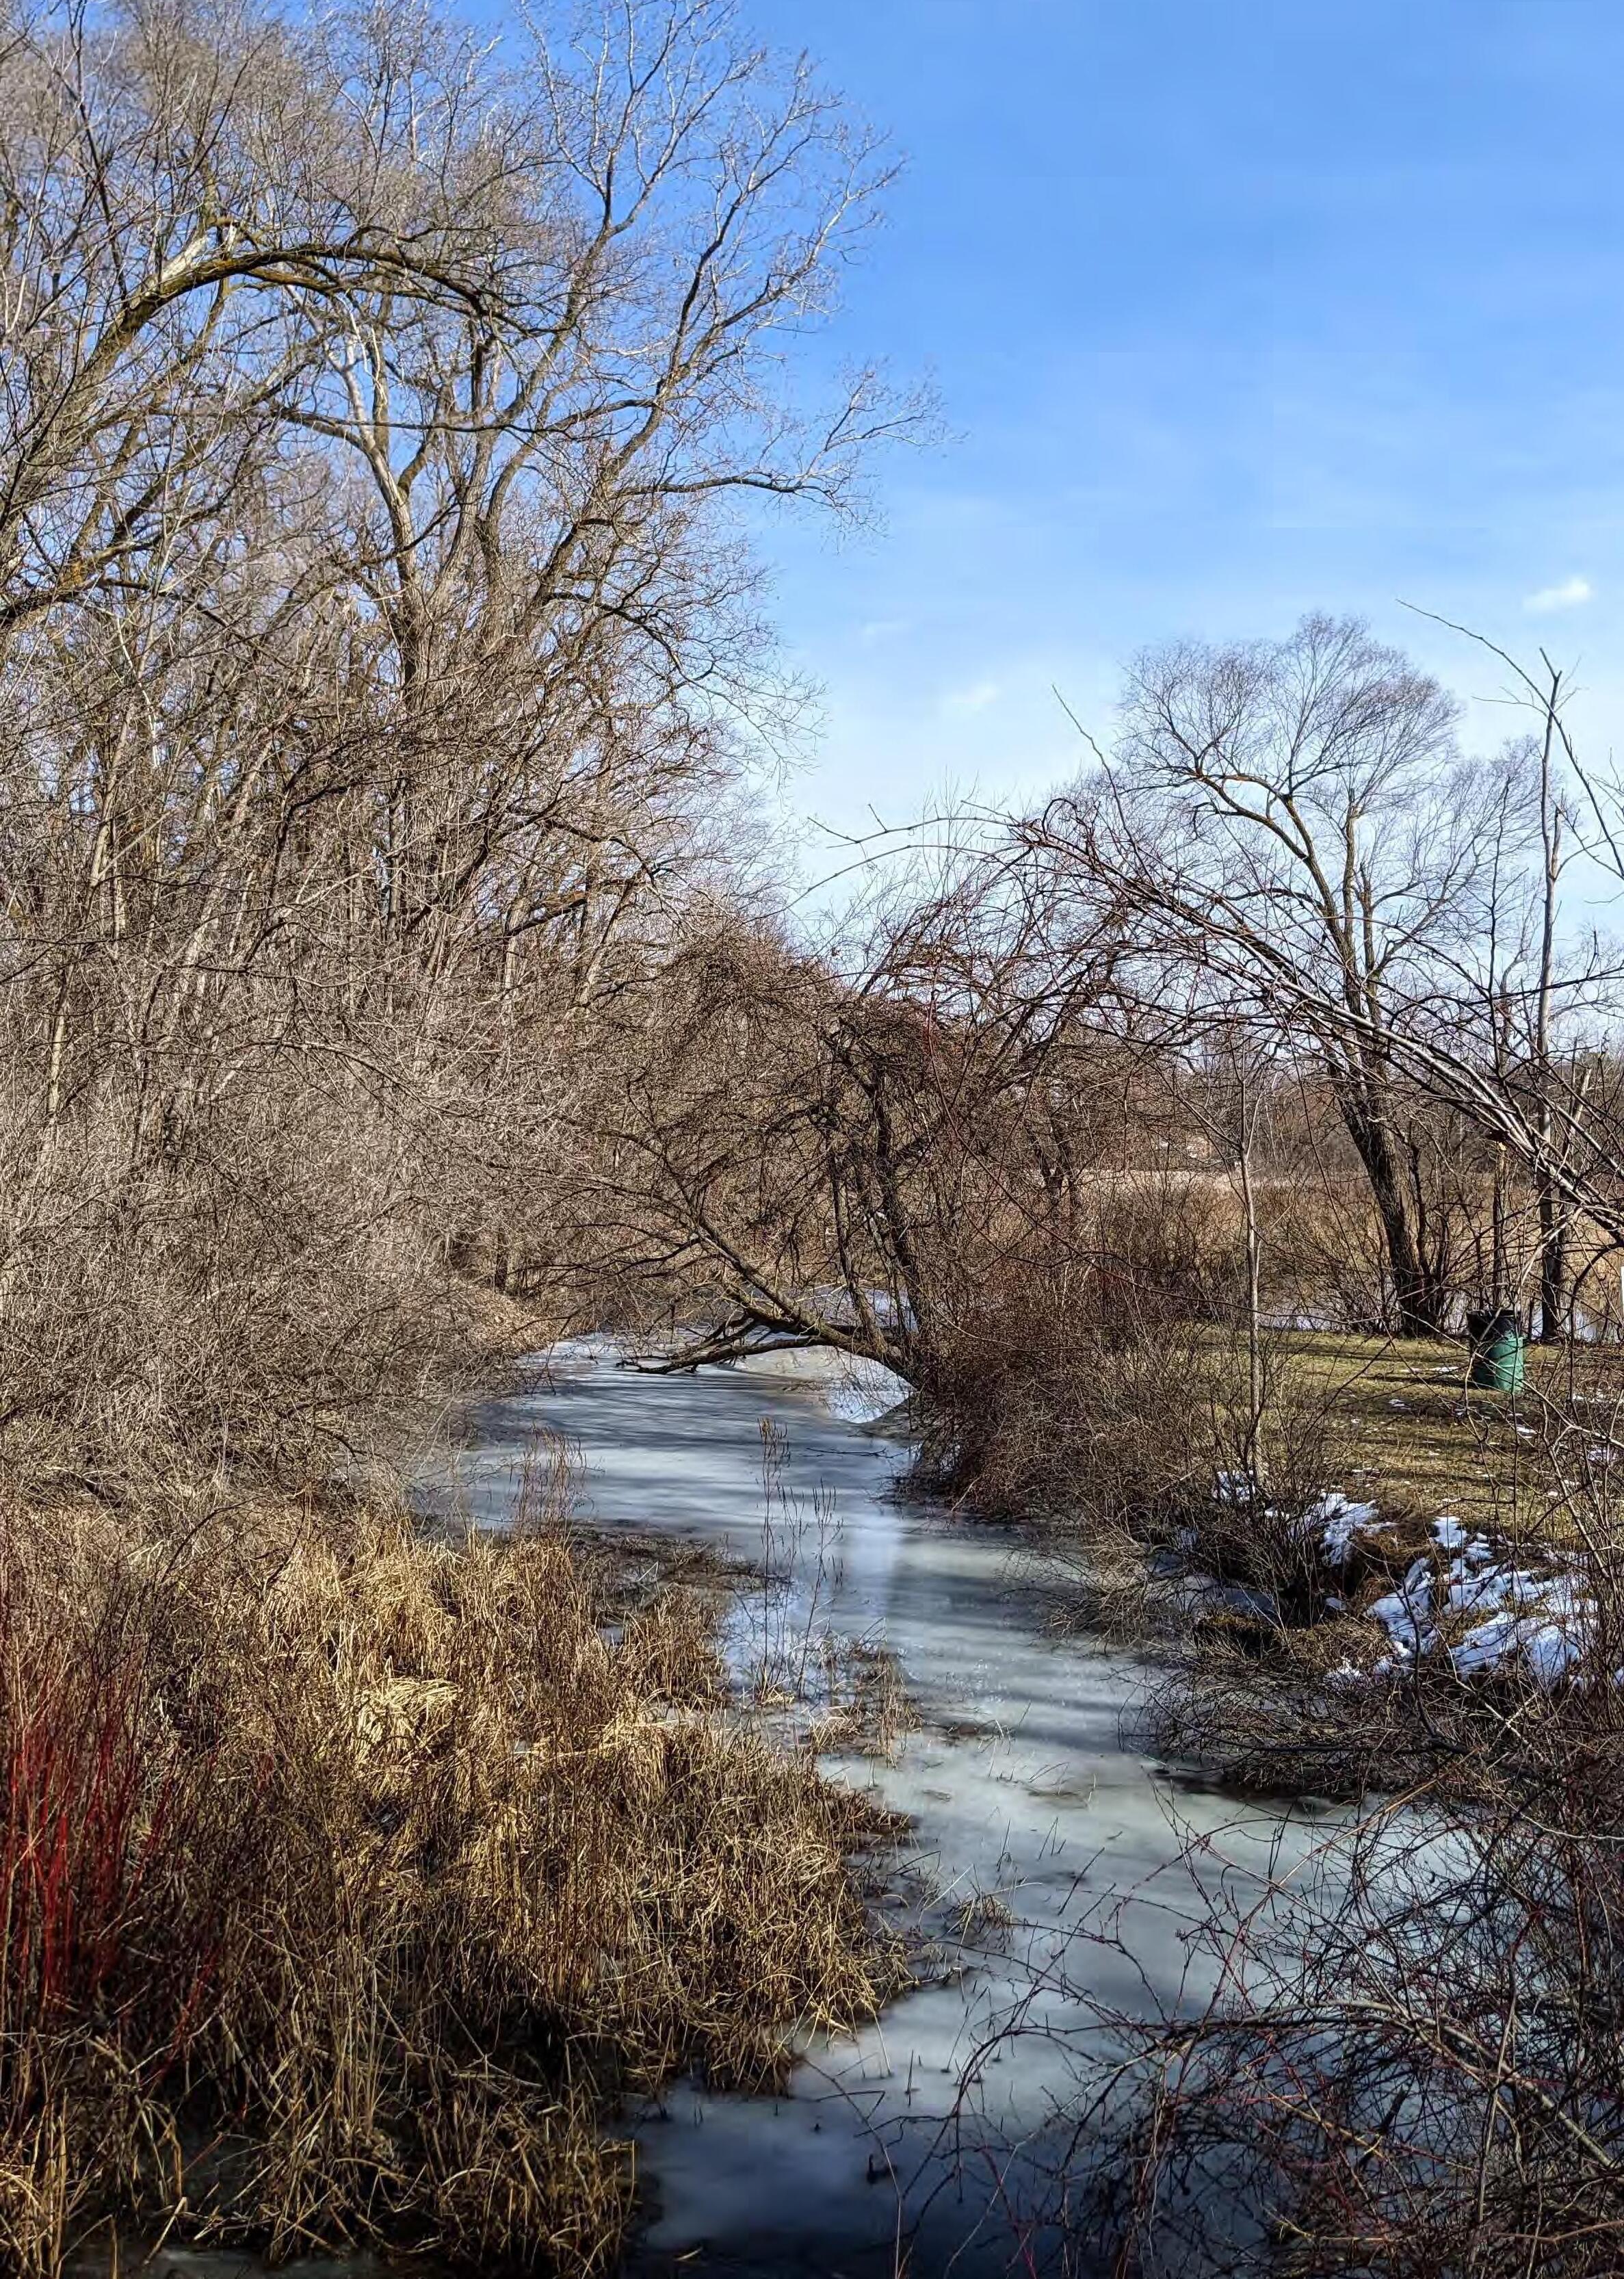
54
The rendering presented here is not meant to be a final design prepared for the city’s use, rather it is offered as an illustrative example of what the city might adopt in the future. We addressed three design elements, as follows:
1. Parking: Designated trailer parking spaces near the water trail allows for more efficient use of the available area for visitor parking, especially for users with a craft loaded on a trailer. Most users prefer to park their vehicle, unload their kayak, lock their vehicle, and then transport everything to the launch.1 Hence, we incorporated potential shared parking spaces around the kayak launch, which could be used to load/unload the kayaks, employing the size requirements listed in table 3.
2. Access: The kayak launch site should be accessible for everyone. The design proposes an additional loading/unloading space for persons with disabilities to have a better access to the kayak launch.
3. Facilities: In general, if potable water and public sewer are available, the site is probably located in an urban area and could draw a relatively large number of users. If the site has electricity but no public sewer or public water, the size of the restroom and its septic system will be dependent on the maximum number of anticipated users. Water service in such settings, if provided, will likely be from a well. If the water is not potable, signs must be posted indicating that the water is not suitable for drinking.2 For this illustrative rendering, we anticipate that toilets would be connected to public water and sewer, and we situate them accordingly in front of the kayak launch and the Linden Mills City Park, making them both more accessible and easier to maintain.
Space type Width Length With kayak trailers 10-12 ft 40-50 ft Without kayak trailers 9 ft 18 ft 55
Table 3: Parking Dimensions
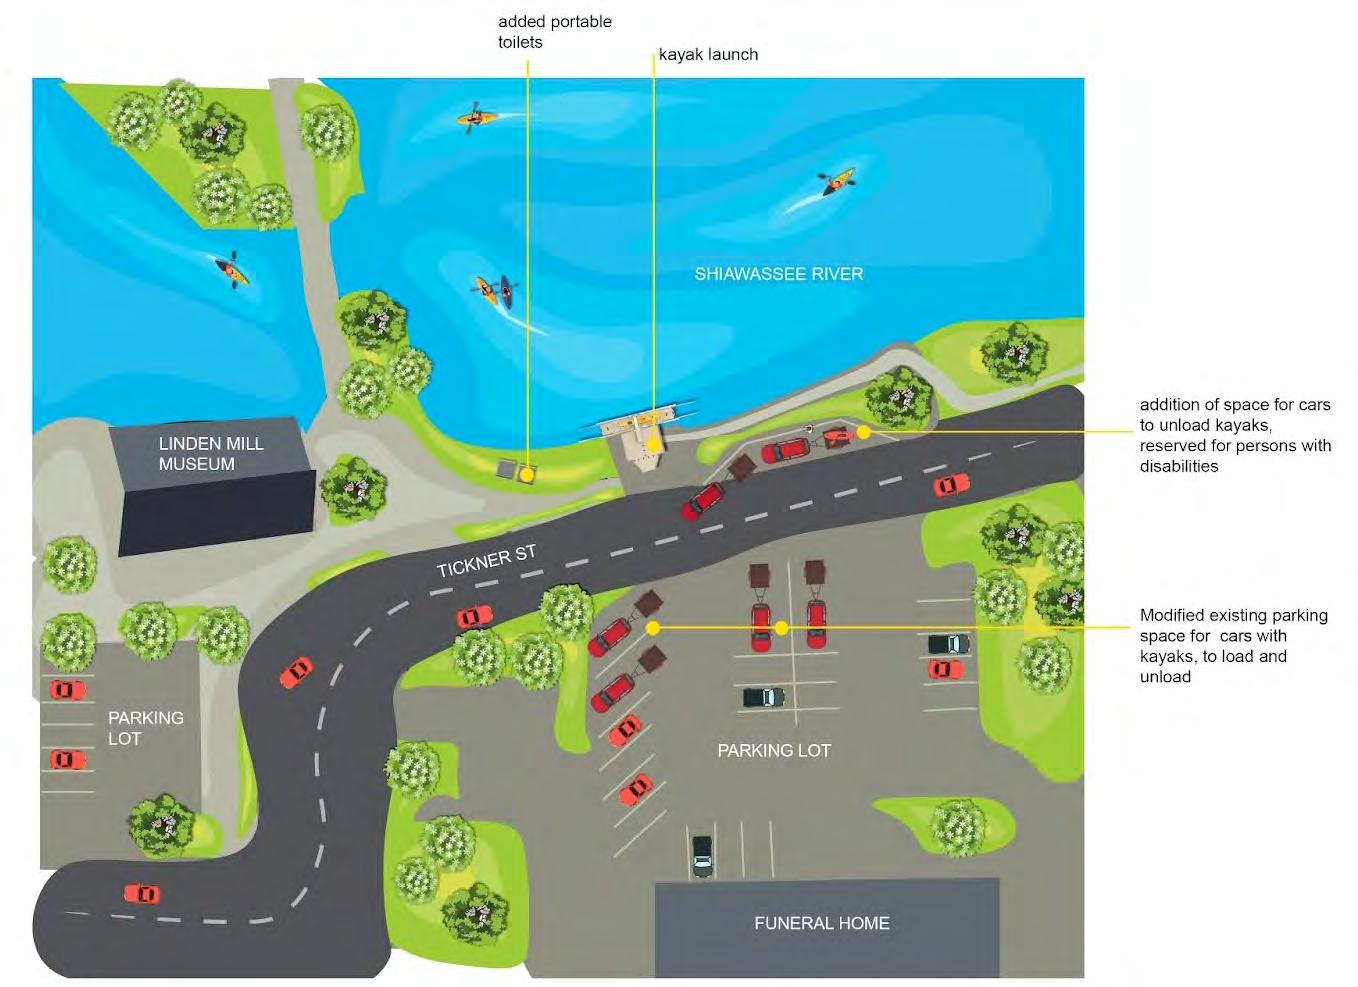
56
Figure 4: Site Plan Rendering Depicting an SRWT Access Site in Linden, MI Located in the Downtown Area Adjacent to the Linden Hill Museum
Case
Study: Upper Grand River Water Trail, Michigan
OVERVIEW
The 91-mile Upper Grand River Water Trail is located primarily in Jackson County, Michigan and consists of three main trail sections: Upper Grand River, Chain of Lakes, and Portage River. The Upper Grand River Water Trail’s universal design standards model how the SRWTC might utilize design to more effectively accommodate a wider range of users.
Accessibility
Accessibility considers the ease of use and needs of all people and is regulated by federal, state, and local law in the United States. Federally, the 1990 Americans with Disabilities Act (ADA) aims to protect persons with disabilities from discrimination, including those who (1) have a physical or mental impairment that substantially limits one or more major life activities, (2) have a history or record of such an impairment (such as cancer that is in remission), or (3) are perceived by others as having such an impairment (such as a person who has scars from a severe burn).3
Universal Design Features
Universal design considers the usability of products and environments for all people, to the greatest extent possible, without the need for adaptation or specialized design.4 The Upper Grand River Water Trail Development Plan was informed by a site assessment process that consisted of the following procedures:
• Documenting site conditions, amenities, and other characteristics of the water trails

• Paddling sections of the river for a more accurate assessment of river conditions, identifying hazards and obstacles, estimating float time between access points, and mapping roads and bridges that cross over the river
• Using aerial photography to gain a deeper understanding of the site
• Conducting discussions with local stakeholders through community meetings and interviews
Grand River, Michigan
57
Photo by: Rachel Kramer CC BY 2.0
About 40 existing and potential sites were identified and inventoried as either formal (e.g., sites identified on an existing map, marked with some signage, overseen by local or state government, and supported by some degree of amenities) or informal (e.g., vacant land, parks, or areas adjacent to bridges without any amenities where paddlers access the river). The plan’s steering committee further narrowed down existing and possible sites based on a discussion of what type of sites should be developed on the river. To prioritize future projects, the development plan categorizes access sites as either type A, type B, or type C. Figure 5 explains in detail the types of amenities and boating experience each site is expected to accommodate.
The plan’s recommendations were further guided by a best practices fact sheet developed by Access Recreation Group, LLC, a consulting group focused on accessible recreation.5 The document lists universally accessible water trail launch site features to incorporate into site improvements. Some features include improved surface accessible routes with slopes no greater than 5%, gangway, and ramp slopes below 8.33%, and accessible restrooms with at least one universally accessible single-user unisex restroom, among others (see Appendix F for the full list of accessible features).
Key Takeaways
The accessible design process and provisions of the Upper Grand River Water Trail Development Plan offer several key considerations for the SRWTC, as follows:
1. Dedicated sources of funding are necessary to prevent financial constraints from stymieing universal design implementation. ADA-accessible kayak launches, permanent restroom facilities, and other universal design improvements cost more than unimproved beaches, portable bathrooms, and/or other standard alternatives.
2. Completing and expanding upon already-identified site improvements will increase accessibility.
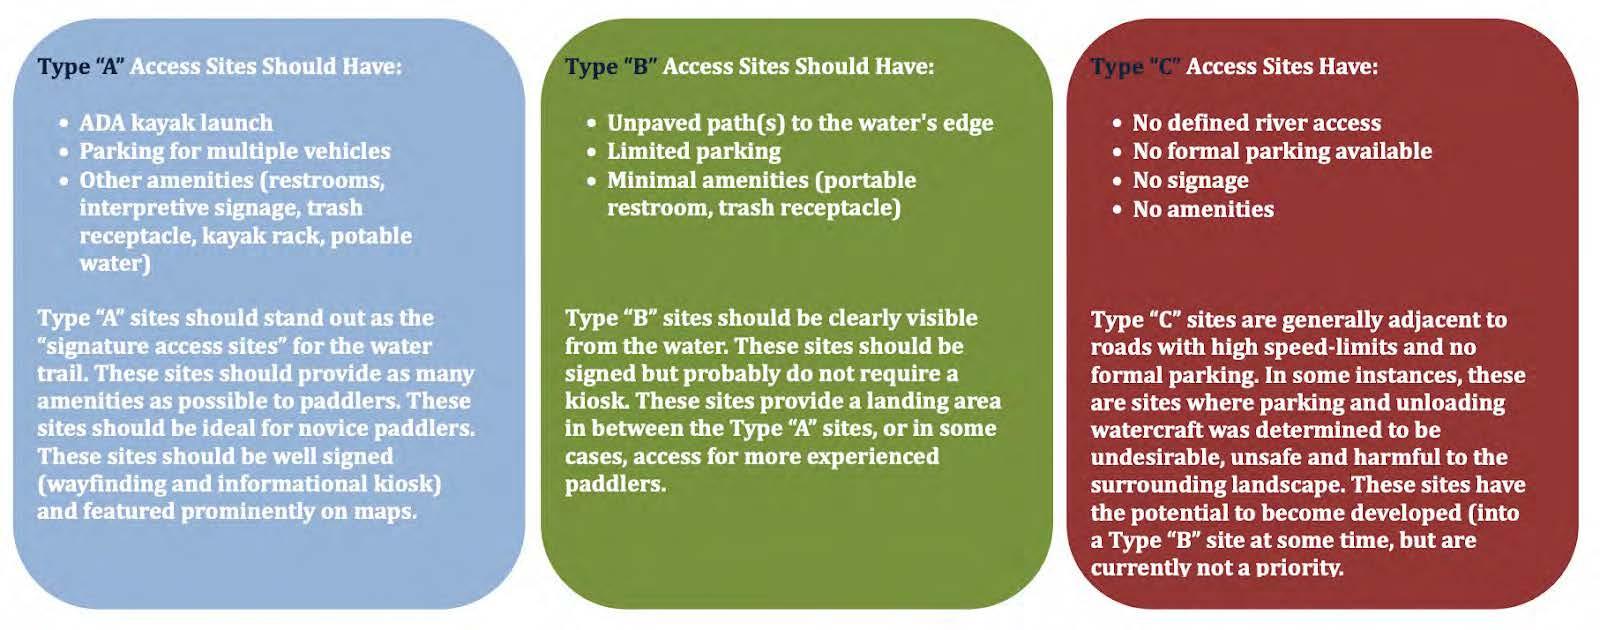 Figure 5: Three Classes of Access Points that the Upper Grand River Water Trail Wished to Include Along the River
58
Source: Figure from the Upper Grand River Water Trail Development Plan
GIS OVERLAY ANALYSIS
As a first step for assessing the spatial area of a potential SRWT TIF district (TID) and the revenue that might be generated by that TIF, we conducted a geographical information system (GIS) overlay analysis, incorporating into the TID only parcels immediately adjacent to the Shiawassee River or a connected water body, as directed by the SRWTC. Parcels cannot be a part of multiple TIDs for tax capture purposes under Michigan law; although, it is important to note that they might still be included in the TID for programming purposes. For that reason, we identified riveradjacent parcels that are already subject to another TIF and removed them for further analysis regarding potential tax capture. Through this process, we identified a total of 1,965 parcels eligible for tax capture. The county-level distribution of eligible parcels is provided in table 4.
Oakland County originally estimated 76 parcels to be included in the proposed TIF district. During the data triangulation phase, we determined that six parcels are ineligible for inclusion because they are not directly adjacent to the Shiawassee River Water Trail or a connected water body. One parcel was not digitized in the Oakland County parcel data and was added to GIS geospatial data for further analysis. Therefore, 71 parcels adjacent to the river and water trail were considered in the analysis. After conducting the
overlay with the Village of Holly Downtown Development Authority (DDA), we determined that eight parcels overlap with Water Trail TIF parcels and the Village of Holly DDA. Figure 6 illustrates Oakland County’s water trail and TIF parcels.
Genesee County has the most parcels eligible for inclusion in the Shiawassee River Water Trail TIF: 919. County officials had originally estimated that 1,060 parcels could be included in the proposed TIF. During the data cleaning phase, we noted that there were parcels repeated in the tabular data, skewing total parcel and revenue calculations. We deleted all duplicate parcels to ensure each parcel was only analyzed once. Fifty-six parcels were then removed because they are not directly adjacent to the Shiawassee River Water Trail or a connected water body. The overlay analysis revealed a total of 57 parcels located along the water trail and within existing TIF districts, including the City of Fenton’s Brownfield Redevelopment Authority (BRA), the City of Fenton’s DDA, and the City of Liden’s DDA. The remaining 919 parcels that can be incorporated into the water trail TIF are shown in figures 7 and 8 on the following pages.
A total of 853 parcels in Shiawassee County can be incorporated into a Water Trail TIF along the Shiawassee River. County officials had originally estimated 828 parcels along the river trail. We deleted one parcel that is not adjacent to the Shiawassee River Water Trail or a connected water body. Ninety-four parcels were added to the analysis because they were determined to be adjacent to the water trail and connected water bodies. There are 69 parcels located along the river trail and within an existing TIF district like the City of Corunna’s DDA, the City of Owosso’s DDA, the City of Owosso’s BRA, and the Village of Byron’s DDA. The remaining 853 parcels that can be incorporated into the Shiawassee River Water Trail TIF are shown in figures 9, 10, and 11.
Saginaw County includes a total of 130 parcels that could be captured by a Shiawassee River Water Trail TIF. County officials had initially calculated 145 parcels located along the river trail. Duplicate parcels were deleted to ensure that each parcel was accounted for only once, yielding 140 total parcels. Following the overlay analysis, we determined that there are 10 parcels located in the Village of Chesaning’s DDA and located along the river trail. The 130 Saginaw County parcels eligible to be included in the Shiawassee River Water Trail TIF are shown in figure 12.
County Number of Eligible SRWT TIF Parcels Existing TIF Parcels Total Parcels Oakland 63 8 71 Genesee 919 57 976 Shiawassee 853 69 922 Saginaw 130 10 140 Total 1,965 144 2,109
59
Table 4: Shiawassee River Water Trail TIF Parcels by County (Parcels Adjacent to the Water Trail)
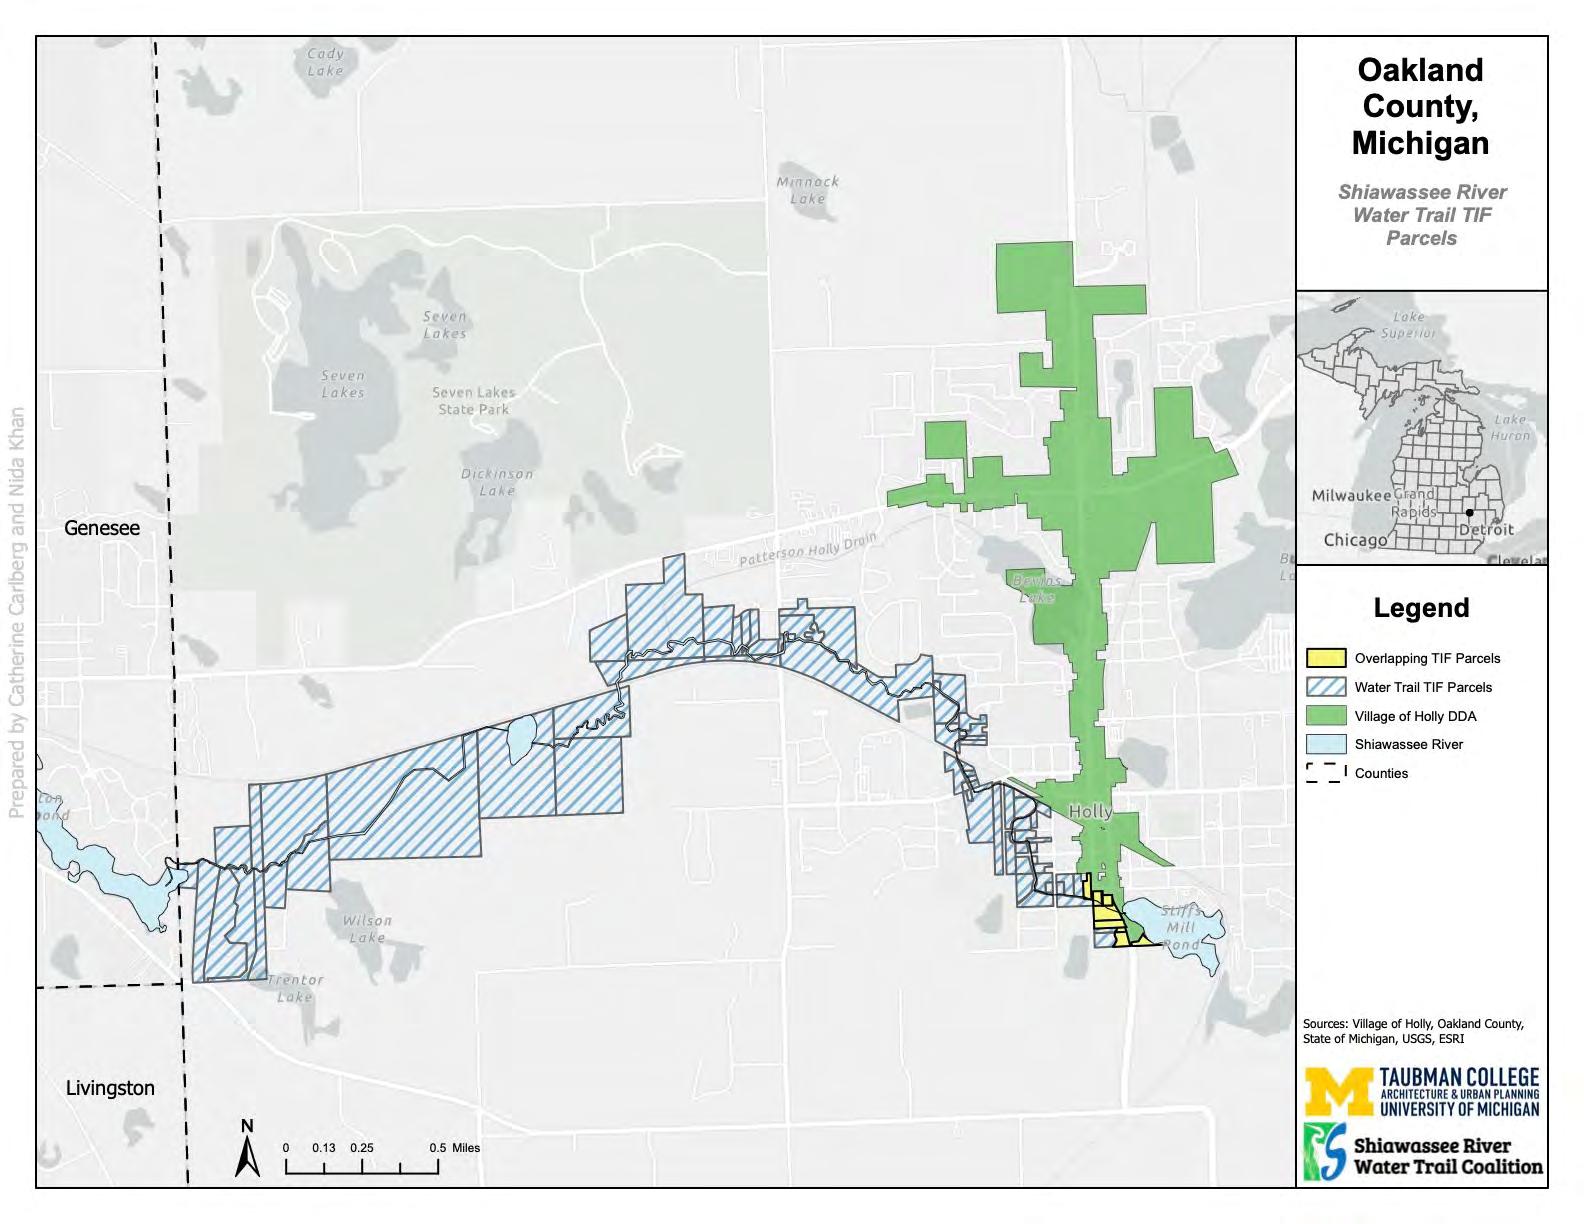
60
Figure 6: Oakland County SRWT TIF Parcels
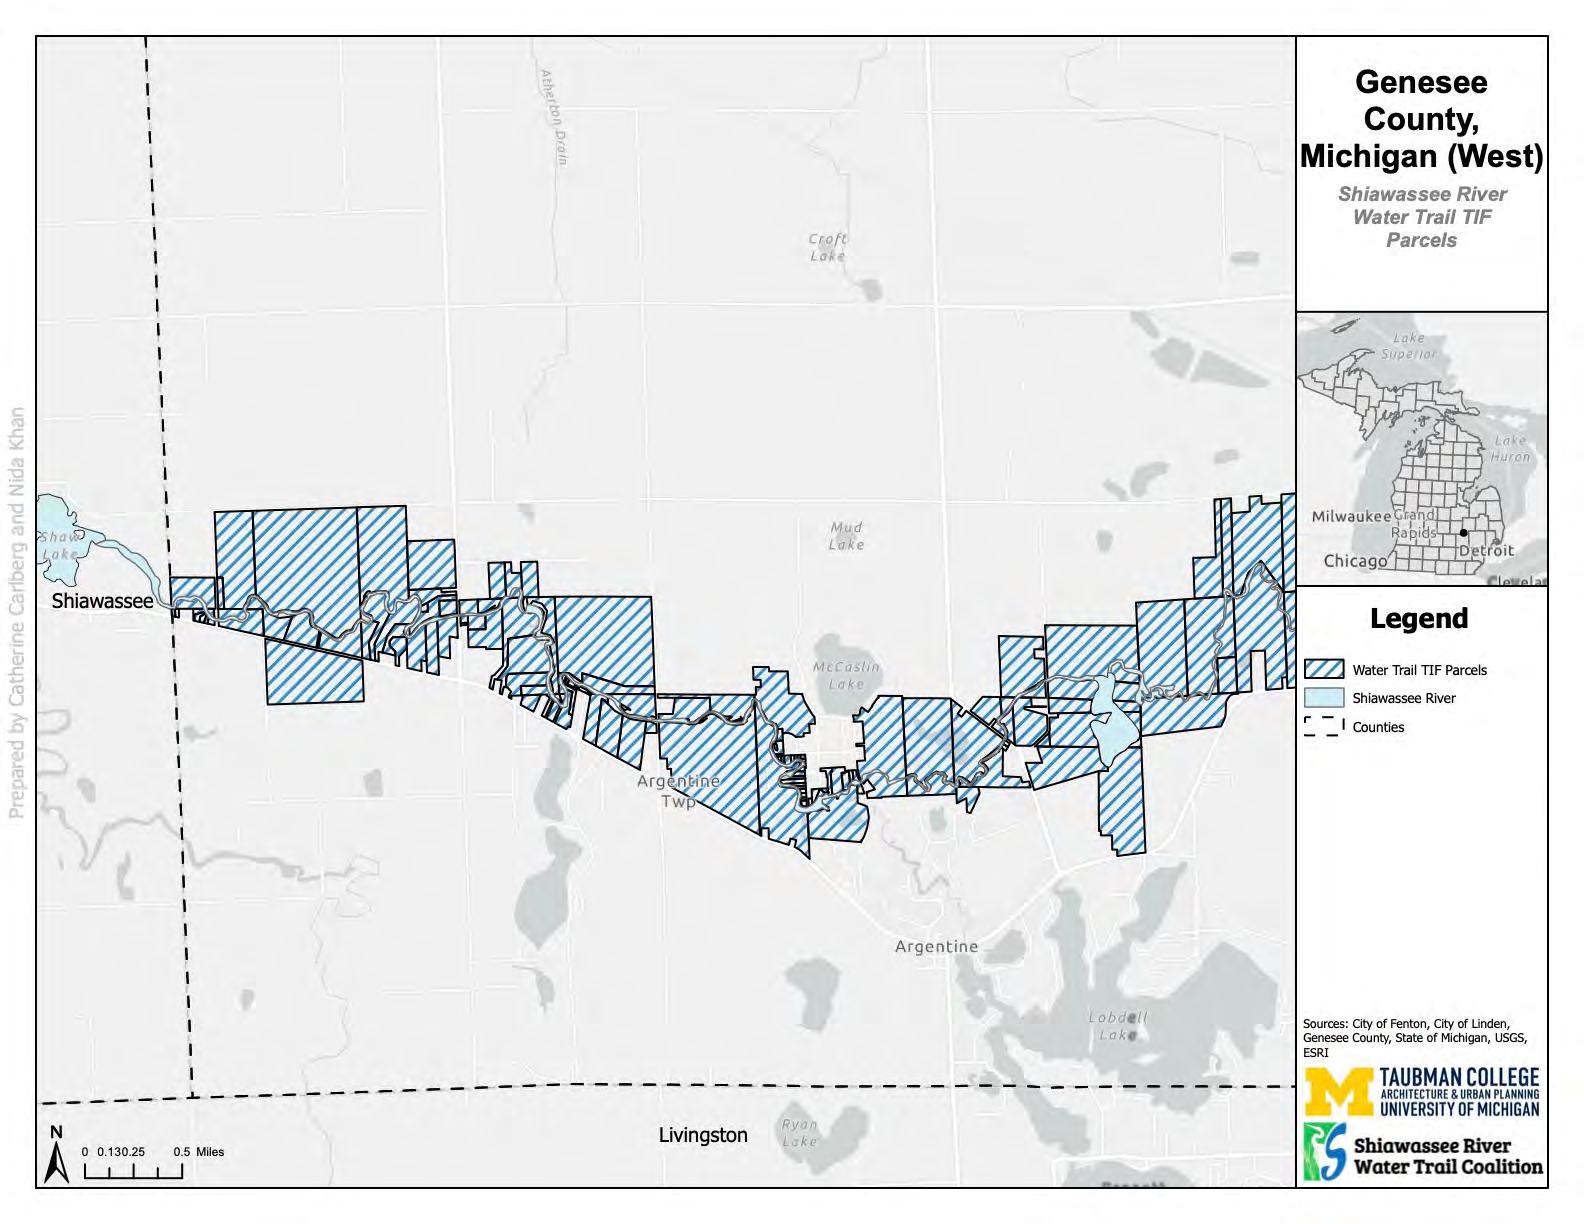
61
Figure 7: Western Genesee County SRWT TIF Parcels
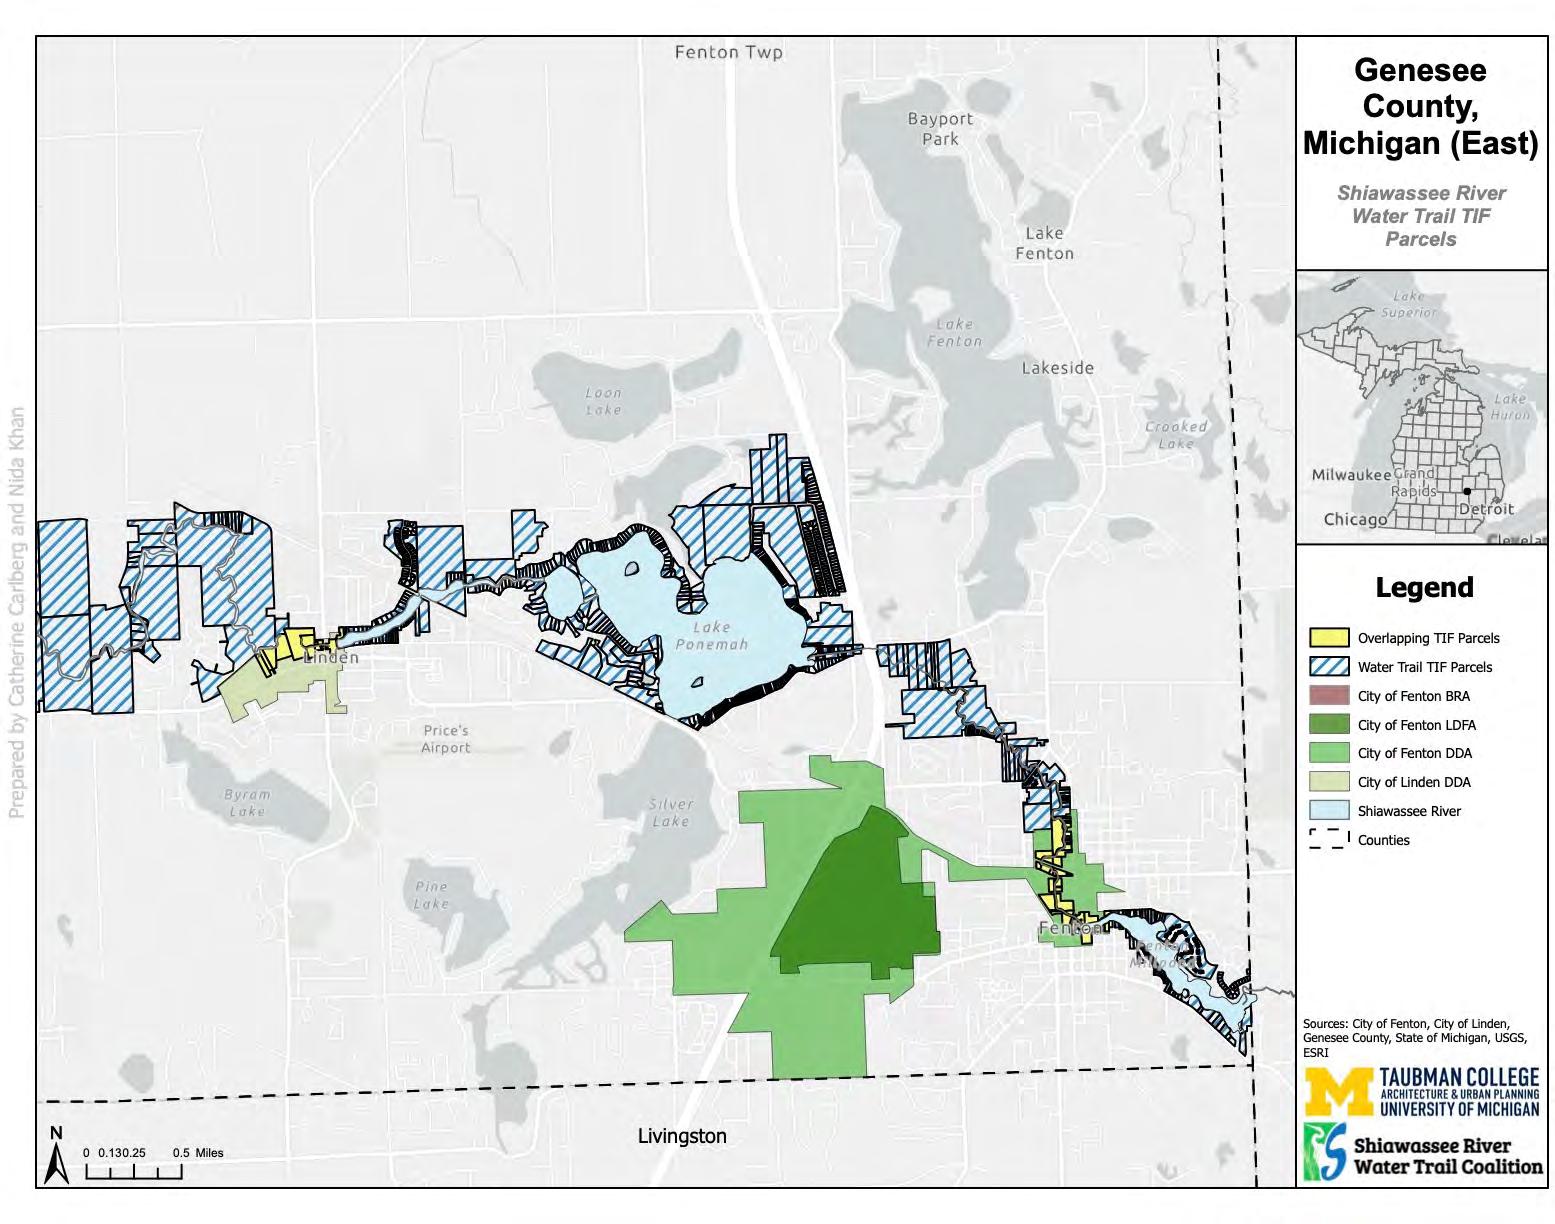
62
Figure 8: Eastern Genesee County SRWT TIF Parcels

63
Figure 9: Southern Shiawassee County SRWT TIF Parcels

64
Figure 10: Central Shiawassee County SRWT TIF Parcels

65
Figure 11: Northern Shiawassee County SRWT TIF Parcels
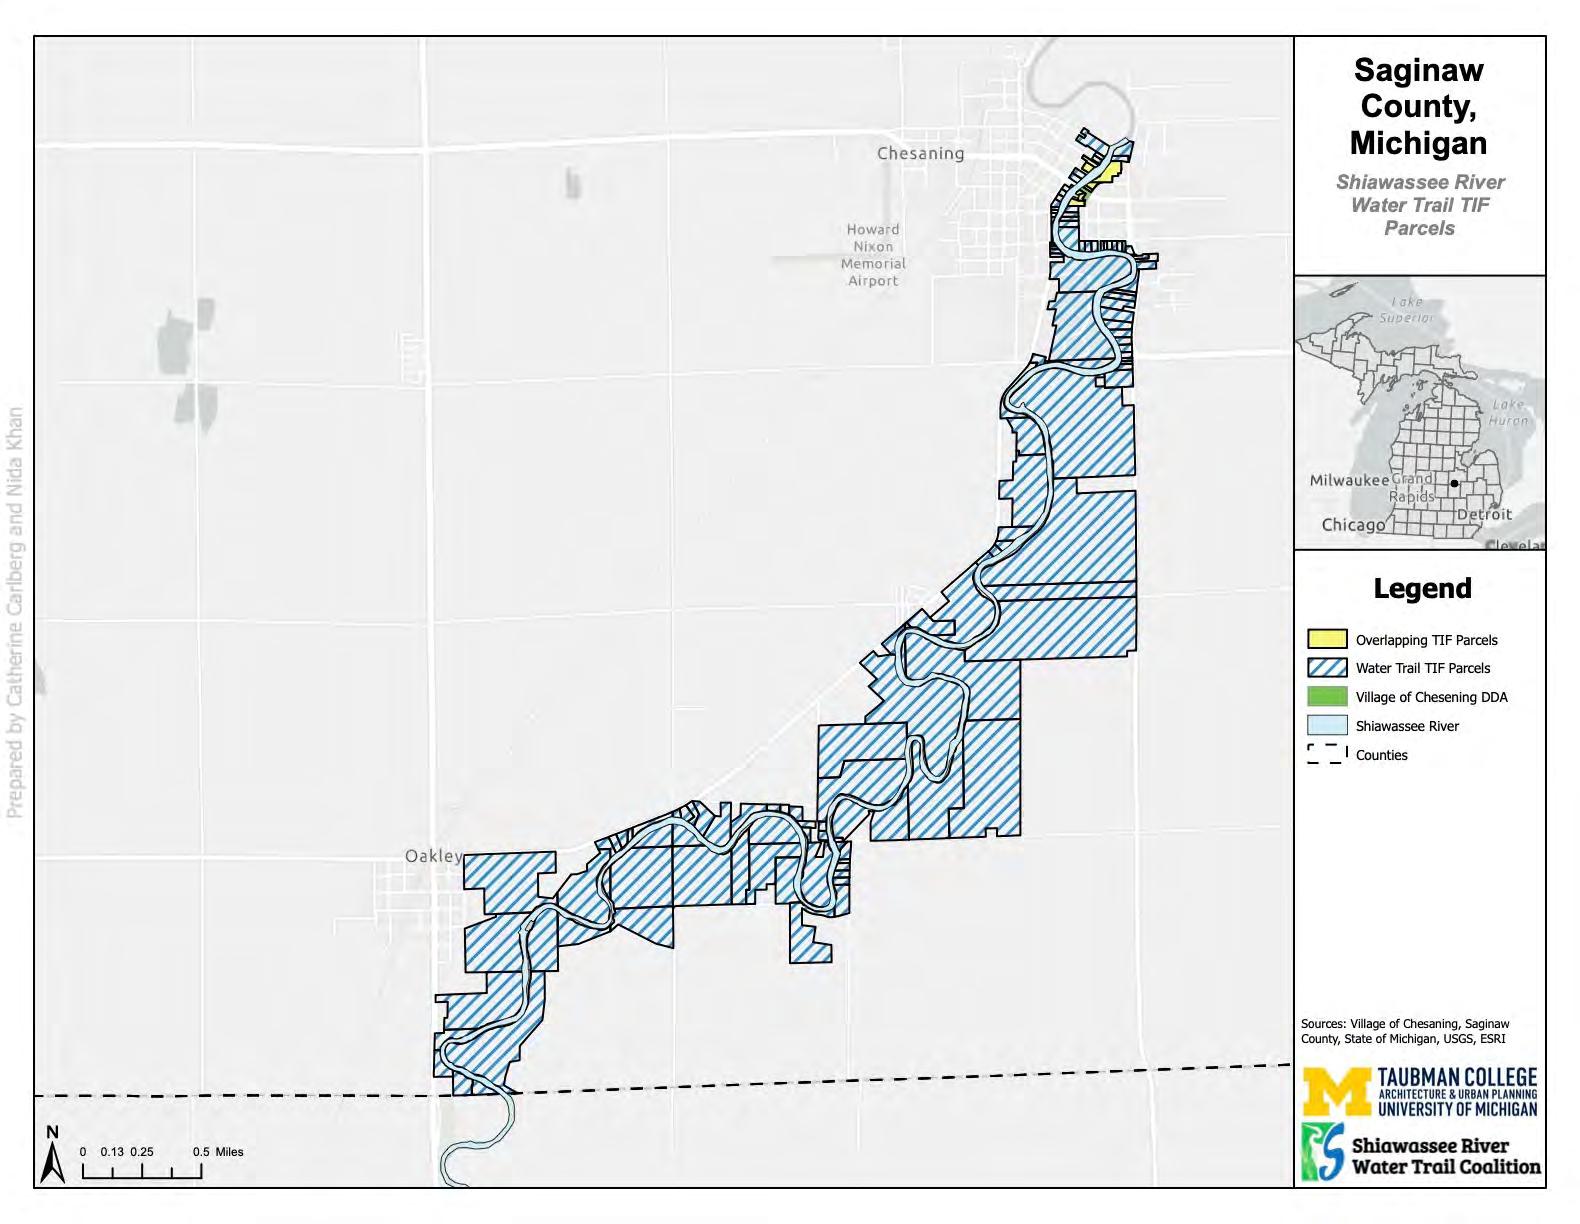
66
Figure 12: Saginaw County SRWT TIF Parcels
Across all four counties, there are 144 parcels located adjacent to the Shiawassee River Water Trail and incorporated into existing TIF districts, making them ineligible for capture by a Shiawassee River Water Trail TIF. Table 5 provides the county-by-county distribution of those parcels. Refer to Appendix A for a full list of parcels currently excluded from a potential river trail TIF.
To further illustrate the impact of existing TIF districts on the proposed SRWT TIF, figure 13 presents a more detailed depiction of parcels in the City of Fenton that are currently ineligible for inclusion in a water trail TIF. The areas bounded in green represent the City of Fenton’s current operating TIFs, including the DDA and LFDA, while the hatched, blue parcels are those directly adjacent to the Shiawassee River Water Trail. Areas highlighted in yellow represent parcels that are along the river but are currently within another existing TIF district. The SRWTC aims to include the existing TIF parcels (i.e., those highlighted in yellow) in the water trail TIF district for programming purposes but exclude them from TIF revenue collection until the other TIF districts expire.
TIF FINANCIAL AND EQUITY ANALYSIS
We modeled a 30-year TIF using the eligible parcels identified in the previous GIS analysis. We used the assessed value of the eligible properties, an assumed growth rate for analytical purposes, and capture rates of 100% and 50%. This model reflects the potential revenue the TIF would be able to generate across its maximum 30-year period if all 22 jurisdictions and all their eligible parcels were included in the TIF.
A common concern regarding TIFs is that they make it more difficult for municipalities to provide essential services, which are generally funded by property taxes allocated to the general fund. TIFs divert tax revenues from the general fund towards the TIF authority and the special projects it funds. The revenue diverted away from a municipality’s general fund toward a TID, however, represents a very small proportion of the municipality’s total property tax revenue.
To understand how the potential TIF revenue compares to the overall tax revenue for each jurisdiction within an SRWT TID, we calculated the first-year (2023) TIF revenue relative to the 2022 total tax revenue of each municipality. We also calculated the average yearly capture for each jurisdiction during the 30-year period, along with the total capture across the 30-year period. We then considered whether these revenues would be able to meet the maintenance and improvement needs identified in the SRWT Plan.
County Current TIFs Number of Parcels Oakland Village of Holly DDA 8 Oakland County Total 8 Genesee City of Fenton BRA 1 City of Fenton DDA 43 City of Linden DDA 13 Genesee County Total 57 Shiawassee City of Corunna DDA 17 Village of Byron DDA 32 City of Owosso BRA 2 City of Owosso DDA 18 Shiawassee County Total 69 Saginaw Village of Chesaning DDA 10 Saginaw County Total 10 Total Number of Properties along the Shiawassee River Water Trail Already Included in a TIF District 144
67
Table 5: Number of Parcels Along the Shiawassee River Water Trail in Existing TIFs by County and TIF District
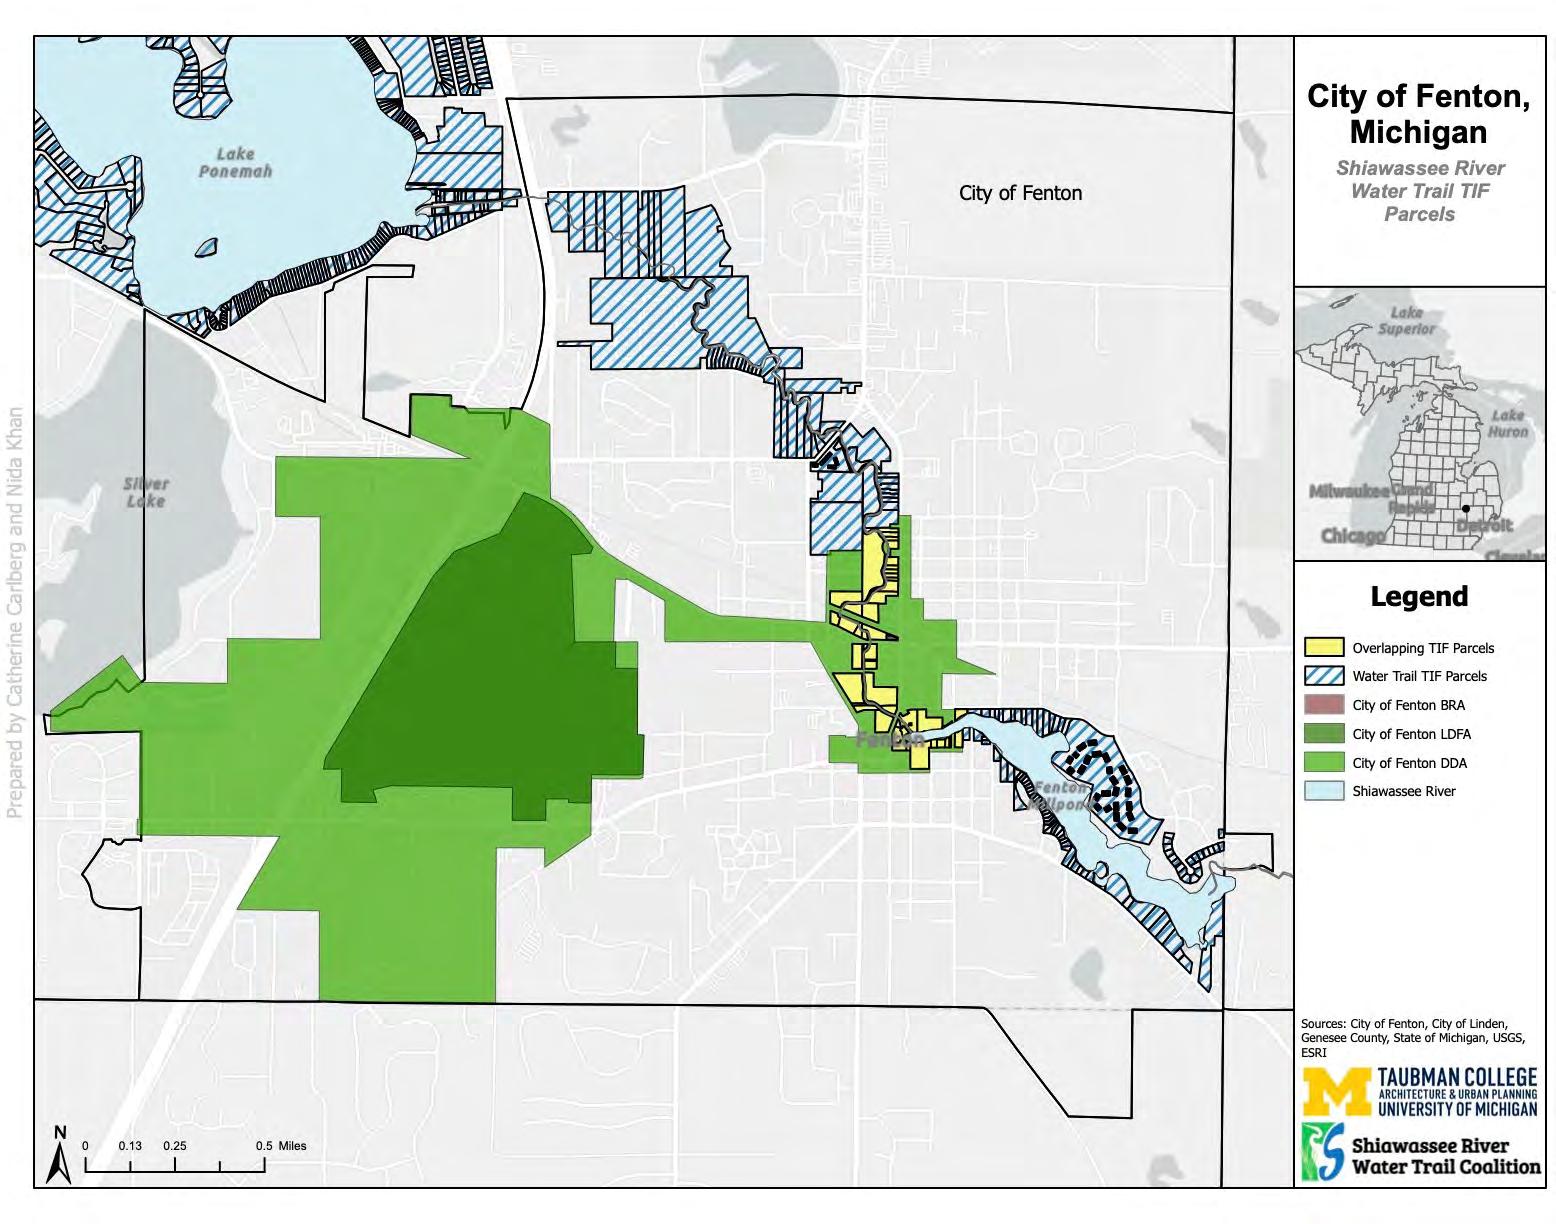
68
Figure 13: City of Fenton SRWT TIF Parcels
Finally, we conducted an equity analysis by comparing TIF revenues across jurisdictions by ranking the contributions of each jurisdiction using their 2022 tax revenue, 2023 first-year TIF revenue, 30-year TIF revenue, and 2023 first-year revenue as a percentage of 2022 total tax revenue. We also used several normalized measures, ranked them, and compared the median home values for river-adjacent parcels to home values of the jurisdictions overall, as well as by considering several other indicators of socioeconomic status.
Financial Modeling
First-Year Revenue Comparison
We first consider the potential first-year revenues from an SRWT TIF as a proportion of the total tax revenue of each TID jurisdiction. We calculated that proportion by using the year one (2023) TIF Revenue and dividing that by the 2022 total tax revenue. 6 This information is important because many city managers may be concerned about how additional TIFs might limit their municipality’s ability to fund basic government services like police, fire, and elections, which are financed through property taxes.
Given the assumptions employed for this analysis and based on a 100% capture rate for the tax increment district (i.e., only the water trail-adjacent parcels), the largest percentage of diverted tax revenues across all 22 districts would be for Fenton Township at 6.12% of its 2022 total tax revenue, as illustrated by table 6. The next largest is Argentine Township, at 2.95%, and Byron Village, at 2.07%. All the rest would amount to diverting close to 1% or less of a jurisdiction’s annual tax revenue (with 14, or more than half of the 22 jurisdictions, diverting less than 1%). Overall, the total amount of TIF revenues diverted from the 22 jurisdictions in 2023 would represent about 0.58% of the combined tax base revenues of those jurisdictions in 2022. Viewed another way, the average of the proportions of tax base revenues diverted for the 22 jurisdictions individually during Year 1 would be about 1%. Based on this assessment and viewed either way, the proportion of tax revenues diverted for a dedicated SRWT TIF would be modest for all of the participating jurisdictions taken altogether and any of them taken individually.
: 2022 Michigan Ad Valorem Property Tax Report 2022
Jurisdiction 2022 Total Tax Revenue* Year 1 (2023) TIF Revenue Proportion of Tax Base Diverted Holly Township $988,009$309 0.03% Holly Village $1,627,088$1,746 0.11% Fenton City $6,760,633$25,526 0.38% Fenton Township $672,972$41,186 6.12% Linden City $2,012,329$20,484 1.02% Argentine Township $180,364$5,322 2.95% Burns Township $300,216$4,655 1.55% Byron Village $114,939$2,381 2.07% Vernon Township $346,213$1,346 0.39% Shiawassee Township$191,649$1,806 0.94% Vernon Village $181,583 $545 0.30% Venice Township $360,079 $262 0.07% Caledonia Township $197,883$2,354 1.19% Corunna City $1,030,843$5,122 0.50% Owosso City $4,894,718$6,546 0.13% Owosso Township$1,233,965$4,548 0.37% Rush Township $224,745$3,971 1.77% New Haven Township $159,029$2,201 1.38% Brady Township $54,173 $164 0.30% Oakley Village $27,222 $22 0.08% Chesaning Township $150,892 $730 0.48% Chesaning Village $1,709,899$4,391 0.26% Total $23,419,442$135,615 0.58% Average of Revenue Proportions Diverted in Year 1 1.02%
*Source
69
Table 6: Total 2022 Tax Revenue, TIF Revenues for First Year, and Proportion of Tax Base Diverted at 100% Capture
Revenue at Various Capture Rates for a 30-Year TIF
Table 7 displays the total revenue that could conceivably be directed to a water trail TIF for each jurisdiction according to a 100% and a 50% capture rate. Current legislation allows TIFs to be established for a maximum of 30 years. Therefore, for the purposes of this analysis, we modeled revenue capture for a 30-year TIF. Following the general practice for estimating average growth rates in property values over time as used by the four counties encompassing the SRWT, we assumed a 4% annual growth rate starting with 2022 taxable property values. For comparison, we also modeled revenues diverted using both 100% and 50% capture rates (i.e., capturing 100% of the annual incremental increase in tax revenues for all eligible river-adjacent parcels as well as 50% of those values).
At a 100% capture rate, the total TIF revenue for each jurisdiction ranges from approximately $1,200 to $2.3 million over 30 years, or between $40 to $77,000 on average per year, averaged across all 30 years. Fenton Township would collect the most revenue at all capture rates ($2,309,898 at 100% over 30 years). Oakley Village would capture the least revenue ($1,211 at 100% capture over 30 years). Total revenues at a 100% capture rate for all jurisdictions would be around $253,643 per year on average, summing to around $7.6 million over 30 years. The total capture amount at 50% would be around $123,000 per year on average, summing to around $3.8 million over 30 years.
A Note on Assessed Values
It is important to note that properties are not assessed every year in Michigan; they are generally reassessed only when sold, transferred, or after the construction of new development. Under most circumstances, property values follow a standard growth rate that matches the rate of inflation or 5%, whichever is less. This means that some assessed values will likely be very low in situations where the owner has possessed the property for a long time. By using an estimated 4% growth rate, and not attempting to model periodic reassessments, the estimated revenues generated here are reasonable, if not a little conservative.
Average Yearly TIF Revenue Total 30-Year TIF Revenue 100% 50% 100% 50% Holly Township $577 $288 $17,304 $8,652 Holly Village $3,264 $1,632 $97,919 $48,959 Fenton City $47,721 $23,861$1,431,645$715,822 Fenton Township $76,997 $38,498$2,309,898$1,154,949 Linden City $38,294 $19,147$1,148,822$574,411 Argentine Township $9,949 $4,975 $298,483$149,242 Burns Township $8,702 $4,351 $261,069$130,535 Byron Village $4,451 $2,226 $133,544 $66,772 Vernon Township $2,516 $1,258 $75,489 $37,745 Shiawassee Township $3,376 $1,688 $101,280 $50,640 Vernon Village $1,018 $509 $30,553 $15,276 Venice Township $489 $244 $14,668 $7,334 Caledonia Township $4,400 $2,200 $132,009$66,005 Corunna City $9,576 $4,788 $287,265$143,633 Owosso City $12,237 $6,119 $367,120$183,560 Owosso Township$8,503 $4,252 $255,097$127,549 Rush Township $7,424 $3,712 $222,712 $111,356 New Haven Township $4,858 $2,429 $145,752 $72,876 Brady Township $306 $153 $9,174 $4,587 Oakley Village $40 $20 $1,211 $606 Chesaning Township $725 $362 $21,740 $10,870 Chesaning Village $8,209 $4,105 $246,279$123,139 Total $253,634 $126,817$7,609,033$3,804,516
70
Table 7: Total Average Yearly and Total 30-Year TIF Revenues
Amenities and Improvements
The revenue generated at both capture rates would cover both the average yearly maintenance costs of the river trail and by extension the total maintenance costs of the river trail over the 30-year TIF period. According to the Shiawassee River Water Trail Plan, improvements and maintenance costs include dams, access points, portages, obstructions, and signs. Some costs may be location specific according to the Shiawassee Water Trail Capital Improvements Plan. For example, the City of Owosso has several maintenance costs relating to the existing dam. Other cost categories may be spread out along the river, including new access points and signage, which vary in location and include many different jurisdictions.
Based on a projection of the 10-year capital improvements schedule included in the plan, the yearly costs of the water trail would be $46,000, although actual yearly costs may vary depending on the projects scheduled for each year. For example, in year two of the plan, costs will be over $100,000, accounting for several new access points. The yearly average revenue potentially generated by a 30-year TIF could be up to around $253,000 (i.e., assuming full participation), sufficient to cover these expenses.
Based on a projection of the cost estimates according to the 10year capital improvements plan, the 30-year total costs for the river trail would be around $1.38 million. This amount could also conceivably be covered by the revenue projections for both capture rates of the TIF ($7.6 million at 100% and $3.8 million at 50%). Ultimately, the TIF revenue at both capture rates could cover the projected capital improvement expenses of the water trail, although again some costs may be geographically specific to a jurisdiction and the actual yearly costs may vary according to the project schedule. Additional TIF revenue could be used for other water trail improvements or projects that are discussed later in this report, or to help cover general labor and other related costs for administering the TIF.
Equity Analysis
In addition to considering the potential adequacy of TIF-generated funds to meet SRWT programmatic needs, we also considered whether there are potential inequities regarding the potential distribution of the burden of diverting tax revenues for the TIF across jurisdictions. Equity should not be mistaken for equality. Equality refers to the idea that everything (or in this case, every jurisdiction) should be treated the same way, regardless of relevant characteristics for individual jurisdictions, while equity accounts for the nuances of reality, acknowledging diverse needs, capacities, and other relevant individual differences. Addressing equity thus allows for adjusting based on those differing levels of need and other related factors. The differing capacities and needs most relevant along the Shiawassee River Water Trail relate to variations in different aspects of socioeconomic status across the 22 jurisdictions along the water trail. We considered several different measures to assess potential equity concerns.
Relative Contribution Compared to Relative Wealth
One important equity consideration for designing and implementing a water trail TIF would be the relative contribution that any given jurisdiction would make to the TIF (i.e., versus the levels of contribution made by others in the TID), compared to the relative overall wealth of that jurisdiction (again, as compared to others in the TID). Table 8 presents first the total tax revenues for each of the 22 SRWT jurisdictions, which provides a general measure of the overall wealth of those jurisdictions–at least with regard to tax revenues. It then provides the first-year TIF capture (100%) and the 30-year TIF capture (100%) revenues, along with the Year One TIF capture as a proportion of total tax revenue. We use the TIF revenue as a proportion of total revenue as a measure of the contribution a given jurisdiction would make to the water trail TIF. Finally, table 8 provides a rank-ordering of each of the jurisdictions along those several measures, where one was the lowest value observed and 22, was the highest value observed. The orange shading highlights those with lower values for each ranking, while the blue-shading highlights those with higher values for each ranking.
71
Table 8: TIF Revenues for First Year, After 30 Years, and as a Proportion of Tax Base Diverted at 100% Capture and Corresponding Rankings
Note: Several of the rankings for the Year 1 and the 30-Year revenue estimates do not align consistently because of rounding error.
72 Jurisdiction 2022 Total Tax Revenue 2022 Revenue Rank Year 1 (2023) TIF Revenue at 100% Capture Year 1 Rank 30-Year TIF Revenue 30-Year TIF Rank Proportion of Tax Base Diverted Year 1 Percent Rank Holly Township $988,009 15 $309 4 $17,304 4 0.03% 1 Holly Village $1,627,088 18 $1,746 8 $97,919 8 0.11% 4 Fenton City $6,760,633 22 $25,526 21 $1,431,645 21 0.38% 10 Fenton Township $672,972 14 $41,186 22 $2,309,898 22 6.12% 22 Linden City $2,012,329 20 $20,484 20 $1,148,822 20 1.02% 15 Argentine Township $180,364 6 $5,322 18 $298,483 18 2.95% 21 Burns Township $300,216 11 $4,655 16 $261,069 16 1.55% 18 Byron Village $114,939 3 $2,381 12 $133,544 11 2.07% 20 Vernon Township $346,213 12 $1,346 7 $75,489 7 0.39% 11 Shiawassee Township $191,649 8 $1,806 9 $101,280 9 0.94% 14 Vernon Village $181,583 7 $545 5 $30,553 6 0.30% 7 Venice Township $360,079 13 $262 3 $14,668 3 0.07% 2 Caledonia Township $197,883 9 $2,354 11 $132,009 10 1.19% 16 Corunna City $1,030,843 16 $5,122 17 $287,265 17 0.50% 13 Owosso City $4,894,718 21 $6,546 19 $367,120 19 0.13% 5 Owosso Township $1,233,965 17 $4,548 15 $255,097 15 0.37% 9 Rush Township $224,745 10 $3,971 13 $222,712 13 1.77% 19 New Haven Township$159,029 5 $2,201 10 $145,752 12 1.38% 17 Brady Township $54,173 2 $164 2 $9,174 2 0.30% 8 Oakley Village $27,222 1 $22 1 $1,211 1 0.08% 3 Chesaning Township $150,892 4 $730 6 $21,740 5 0.48% 12 Chesaning Village $1,709,899 19 $4,391 14 $246,279 14 0.26% 6 Total $23,419,442 $135,615 $7,609,033 Average 1.02%
Smallest ⟶ Largest
Based on those relative rankings, jurisdictions with relatively higher wealth and that would make relatively high contributions toward the TIF include Fenton Township, Linden City, and Corunna City. Those with more moderate wealth and that would make more moderate contributions to the TIF include Vernon Township, Shiawassee Township, and Caledonia Township. Finally, jurisdictions with relatively lower wealth and that would make relatively smaller contributions to the TIF include Vernon Village, Brady Township, and Oakley Village. All these jurisdictions would be, in a sense, at relative parity, in that the relative contributions made are roughly proportional to their overall wealth.
Also based on these rankings, several jurisdictions with relatively higher levels of wealth would end up making relatively smaller contributions to the TIF (based on this proportional measure), including Holly Township, Holly Village, Fenton City, Venice Township, Owosso City, Owosso Township, and Chesaning Village. Conversely, several jurisdictions with relatively lower levels of wealth would end up making relatively higher levels of contribution to the TIF. These jurisdictions are Argentine Township, Burns Township, Byron Village, Rush Township, New Haven Township, and Chesaning Township.
Normalized Revenues
We also normalized the potential revenues generated by a water trail TIF across jurisdictions using several alternative measures, including potential revenue captured per capita, per river mile, and per parcel. Specifically, table 9 presents the estimated 100%, 30year TIF revenues using these three normalized revenue measures across jurisdictions, as well as the relative ranking for each measure. The orange-shaded values represent the jurisdictions with the lowest dollar amounts captured, while the blue-shaded values represent those with the highest dollar amounts captured for each measure. In addition, figure 14 presents a bar chart illustrating the relative rankings of these three normalized measures across jurisdictions. These normalized measures provide a means of assessing whether any of the jurisdictions affected by the TIF would contribute substantially more or less to the TIF based on their relative population size (i.e., per capita measure) compared to the contributions they would make based on the land area (i.e., per parcel or per river mile).
Relative Contribution Comparisons and Considerations
Reviewing these various measures of relative contribution taken altogether, there is considerable variation across all the jurisdictions for any one measure, and there is little consistency across the several measures. As such, there are no jurisdictions that would clearly and consistently benefit, or would be clearly and consistently burdened, across all the measures relative to other jurisdictions; rather, the distributions of burdens and benefits are more specific to the concept addressed by the given measure (e.g., overall wealth, overall contribution, per capita contribution, and so on). In addition, none of the measures presented here regarding the relative contributions that the TID jurisdictions would make in terms of overall wealth, population size, or land area suggest that the establishment of a TIF would be clearly unfair or unduly burdensome for any of them, given the very low contributions that all of them would make in terms of the TIF contribution as a proportion of overall tax revenues.
Nonetheless, the SRTWC may want to take the relative distributions toward the TIF as suggested by these measures into consideration when prioritizing investments in new access installations or when undertaking ongoing maintenance efforts. For example, there are several relatively wealthier jurisdictions such as Holly Township and Holly Village with lower contributions overall that would also make a relatively lower per capita contribution but a relatively higher area-based contribution (i.e., per parcel or per mile, or both). Conversely, some jurisdictions would make a relatively high contribution across all three normalized measures in contrast to their relatively smaller contribution regarding overall wealth, such as Fenton City and Linden City, while others would make a relatively low contribution across all three normalized values, consistent with their relatively smaller contribution in terms of overall wealth, such as Brady Township and Oakley Village. Again, these various findings, along with other comparisons like them, should be considered more fully by the Coalition–if a water trail TIF is authorized–when programming the timing and locations of the new access sites, facilities, and other related water trail projects funded by the TIF.
73
Jurisdiction Revenue per Capita Per Capita Rank Revenue per Parcel Per Parcel Rank Revenue per River Mile Per River Mile Rank Holly Township $3 2 $666 2 $11,852 5 Holly Village $8 5 $2,720 15 $28,138 9 Fenton City $119 17 $5,362 19 $331,783 20 Fenton Township $137 18 $5,384 20 $615,153 22 Linden City $277 22 $10,077 22 $437,646 21 Argentine Township $42 11 $2,278 11 $27,098 8 Burns Township $80 14 $1,652 7 $28,501 10 Byron Village $245 21 $3,339 16 $121,403 18 Vernon Township $18 6 $2,359 13 $20,513 6 Shiawassee Township $37 9 $1,426 5 $11,329 4 Vernon Village $41 10 $2,546 14 $45,601 13 Venice Township $6 4 $2,095 9 $6,447 2 Caledonia Township $30 8 $1,483 6 $26,063 7 Corunna City $94 15 $4,353 17 $116,302 17 Owosso City $25 7 $6,018 21 $121,563 19 Owosso Township $54 12 $1,947 8 $96,811 16 Rush Township $176 20 $2,296 12 $36,038 12 New Haven Township $120 19 $2,242 10 $31,378 11 Brady Township $4 3 $706 3 $8,574 3 Oakley Village $0.26 1 $404 1 $158 1 Chesaning Township $73 13 $870 4 $72,465 14 Chesaning Village $101 16 $4,561 18 $94,723 15 Total $1,690 $64,784 $2,289,539
74
Table 9: Normalized TIF Revenues Across Alternative Measures
Smallest ⟶ Largest
Median Home Values
In addition to considering equity in terms of relative overall jurisdiction wealth and TIF contribution, we also considered equity implications pertaining to several measures of socio-economic status (SES), including median home values, race, income, and education. Table 10 displays the median home values for the total parcels in each jurisdiction as well as the SRWT adjacent parcels. The table presents, first, the median home values jurisdiction-wide, including those for parcels located adjacent to the Shiawassee River. The table then provides the values for only those parcels located adjacent to the river, which would comprise the potential SRWT TIF District (TID) across the jurisdictions, followed by the dollar amount difference for every jurisdiction. Because the Village of Oakley has no residential parcels, no value is reported for that jurisdiction in table 10.
Generally, the closer a property is to a body of water, the higher the property value will be in comparison to properties that are not close to bodies of water, like rivers, as discussed in more detail in Chapter 3. Somewhat surprisingly, the opposite effect appears to be occurring across the 22 jurisdictions that would comprise the SRWT, as demonstrated in table 10, where the median home value of river-adjacent properties is consistently lower than the median home value of property jurisdiction-wide.
The Rural Ratio
One potential factor that may explain observed lower property values for parcels in jurisdictions along the Shiawassee River relative to inland parcels is the amount of farmland that exists in the region (corresponding to relatively fewer residential parcels), along with the largely rural areas that comprise the region generally (i.e., whether actively farmed or not). To qualify as urban, an area needs to have a population of at least 5,000. Only six of the 22 jurisdictions along the Shiawassee River are classified as urban areas: Holly Village, Holly Township, Fenton City, Fenton Township, Argentine Township, and Owosso City.
In general, both rural areas and actively farmed parcels command lower prices than developed rural residential and urban parcels. Those factors may be overwhelming whatever price premium may be occurring for residential parcels located on or near the Shiawassee River. Another factor that may explain observed lower property values for river-adjacent parcels is that some number of such parcels that may have higher values may also be situated within already existing TIFs, which would exclude them from our analysis. We did not evaluate this finding extensively, and these potential explanations are speculative; the SRWTC may want to explore this phenomenon in more depth moving forward to better understand its causes and to track any change over time.
Given this phenomenon, an SRWT TIF could have the effect of increasing property values of river-adjacent properties throughout the region over time to the point of reversing this observed phenomenon. The original purpose of enabling TIFs in Michigan, and specifically the purpose of the waterfront TIF most recently authorized, was to provide municipal funding mechanisms to promote economic development in a way that would intentionally increase property values. This purpose and its potential success raise equity concerns that cut both ways.
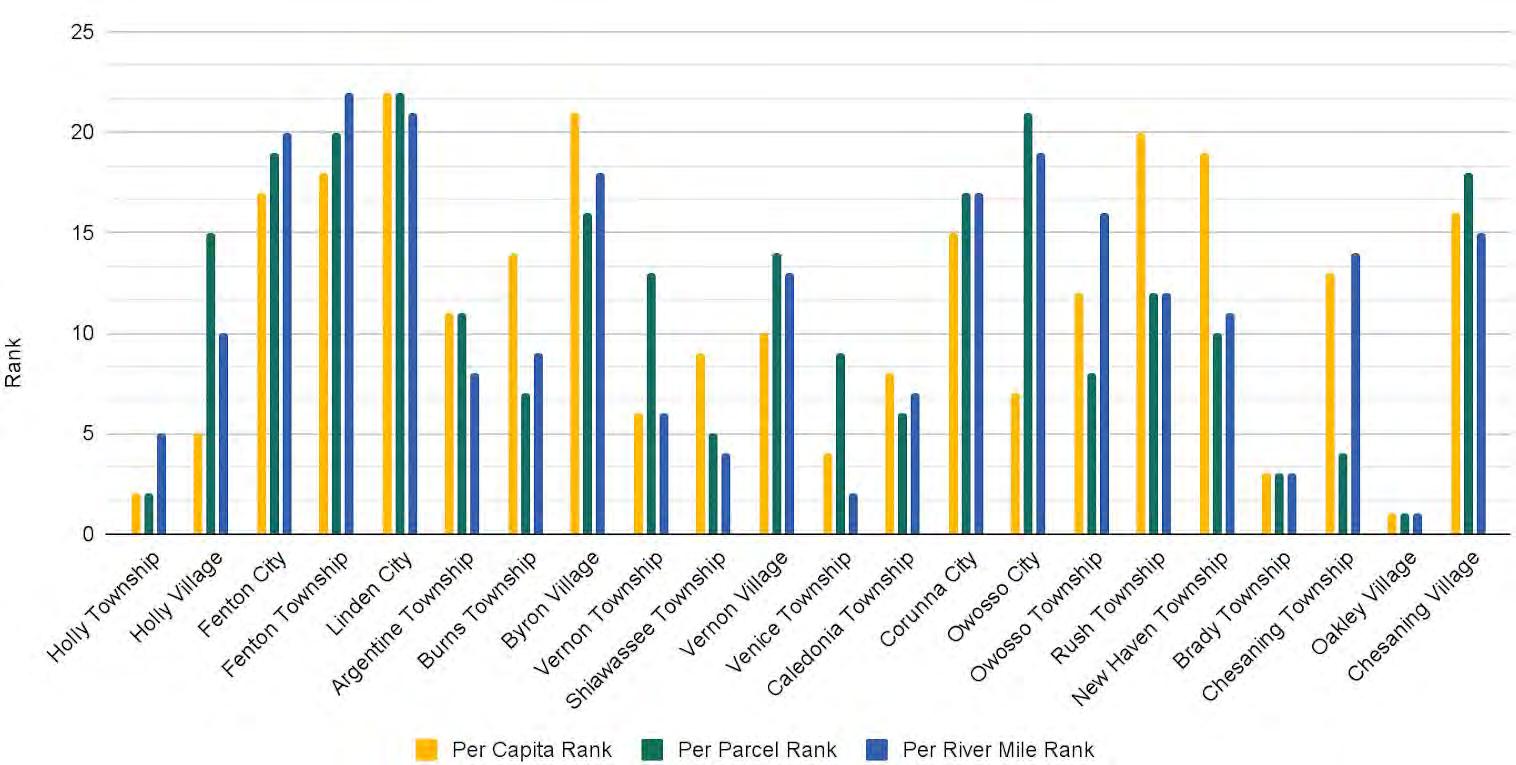
75
Figure 14: Comparison of Rankings of Per Capita, Per Parcel, and Per River Mile Revenues Across Jurisdictions
Note: Bars represent ranking amongst jurisdictions, not raw values.
Comparison of Rankings of Per Capita, Per Parcel, and Per River Mile Revenues Across Jurisdictions
On the one hand, if residential properties along the river trail are indeed consistently lower than other properties in the jurisdiction overall, a TIF could be used to help promote new development or redevelopment and increase property values along the river, bringing the use of a water trail TIF closer to the original purpose and intent of TIFs in Michigan broadly. At the same time, such new residential development would likely be less affordable (incorporating the premium from an enhanced river trail), as well as diminishing the rural character of portions of the trail that make them enjoyable to paddlers–as discussed in the Lake Superior Water Trail case study sidebar. The SRTWC will also want to contemplate these countervailing issues as it moves forward in designing and implementing a water trail TIF.
Table 10: Total and River Adjacent Median Home Values
Source: U.S. Census Bureau; American Community Survey, 2021 American Community Survey 5-Year Estimates, Table DP04: Selected Housing Characteristics, data.census.gov.
Note: The Village of Oakley has no residential parcels
Jurisdiction Median Home Values: Total Properties Median Home Values: River Adjacent Properties Difference Holly Village $133,400 $85,610 -$47,790 Holly Township $180,500 $145,540 -$34,960 Fenton City $168,500 $123,500 -$45,000 Fenton Township $283,700 $162,700 -$121,000 Linden City $190,300 $124,450 -$65,850 Argentine Township $240,900 $104,900 -$136,000 Burns Township $169,300 $90,250 -$79,050 Byron Village $143,800 $102,600 -$41,200 Vernon Township $117,300 $80,800 -$36,500 Shiawassee Township $144,000 $37,300 -$106,700 Vernon Village $96,800 $66,500 -$30,300 Venice Township $121,400 $111,000 -$10,400 Caledonia Township $130,500 $45,300 -$85,200 Corunna City $118,400 $47,200 -$71,200 Owosso City $95,600 $73,144 -$22,456 Owosso Township $146,900 $117,300 -$29,600 Rush Township $167,600 $74,196 -$93,404 New Haven Township $145,900 $91,898 -$54,002 Brady Township $118,800 $33,400 -$85,400 Oakley Village $65,800 – -$65,800 Chesaning Township $113,400 $57,500 -$55,900 Chesaning Village $97,000 $57,900 -$39,100
76
Case Study: Lake Superior Water Trail: The Economic and Social Impact on Rural Communities


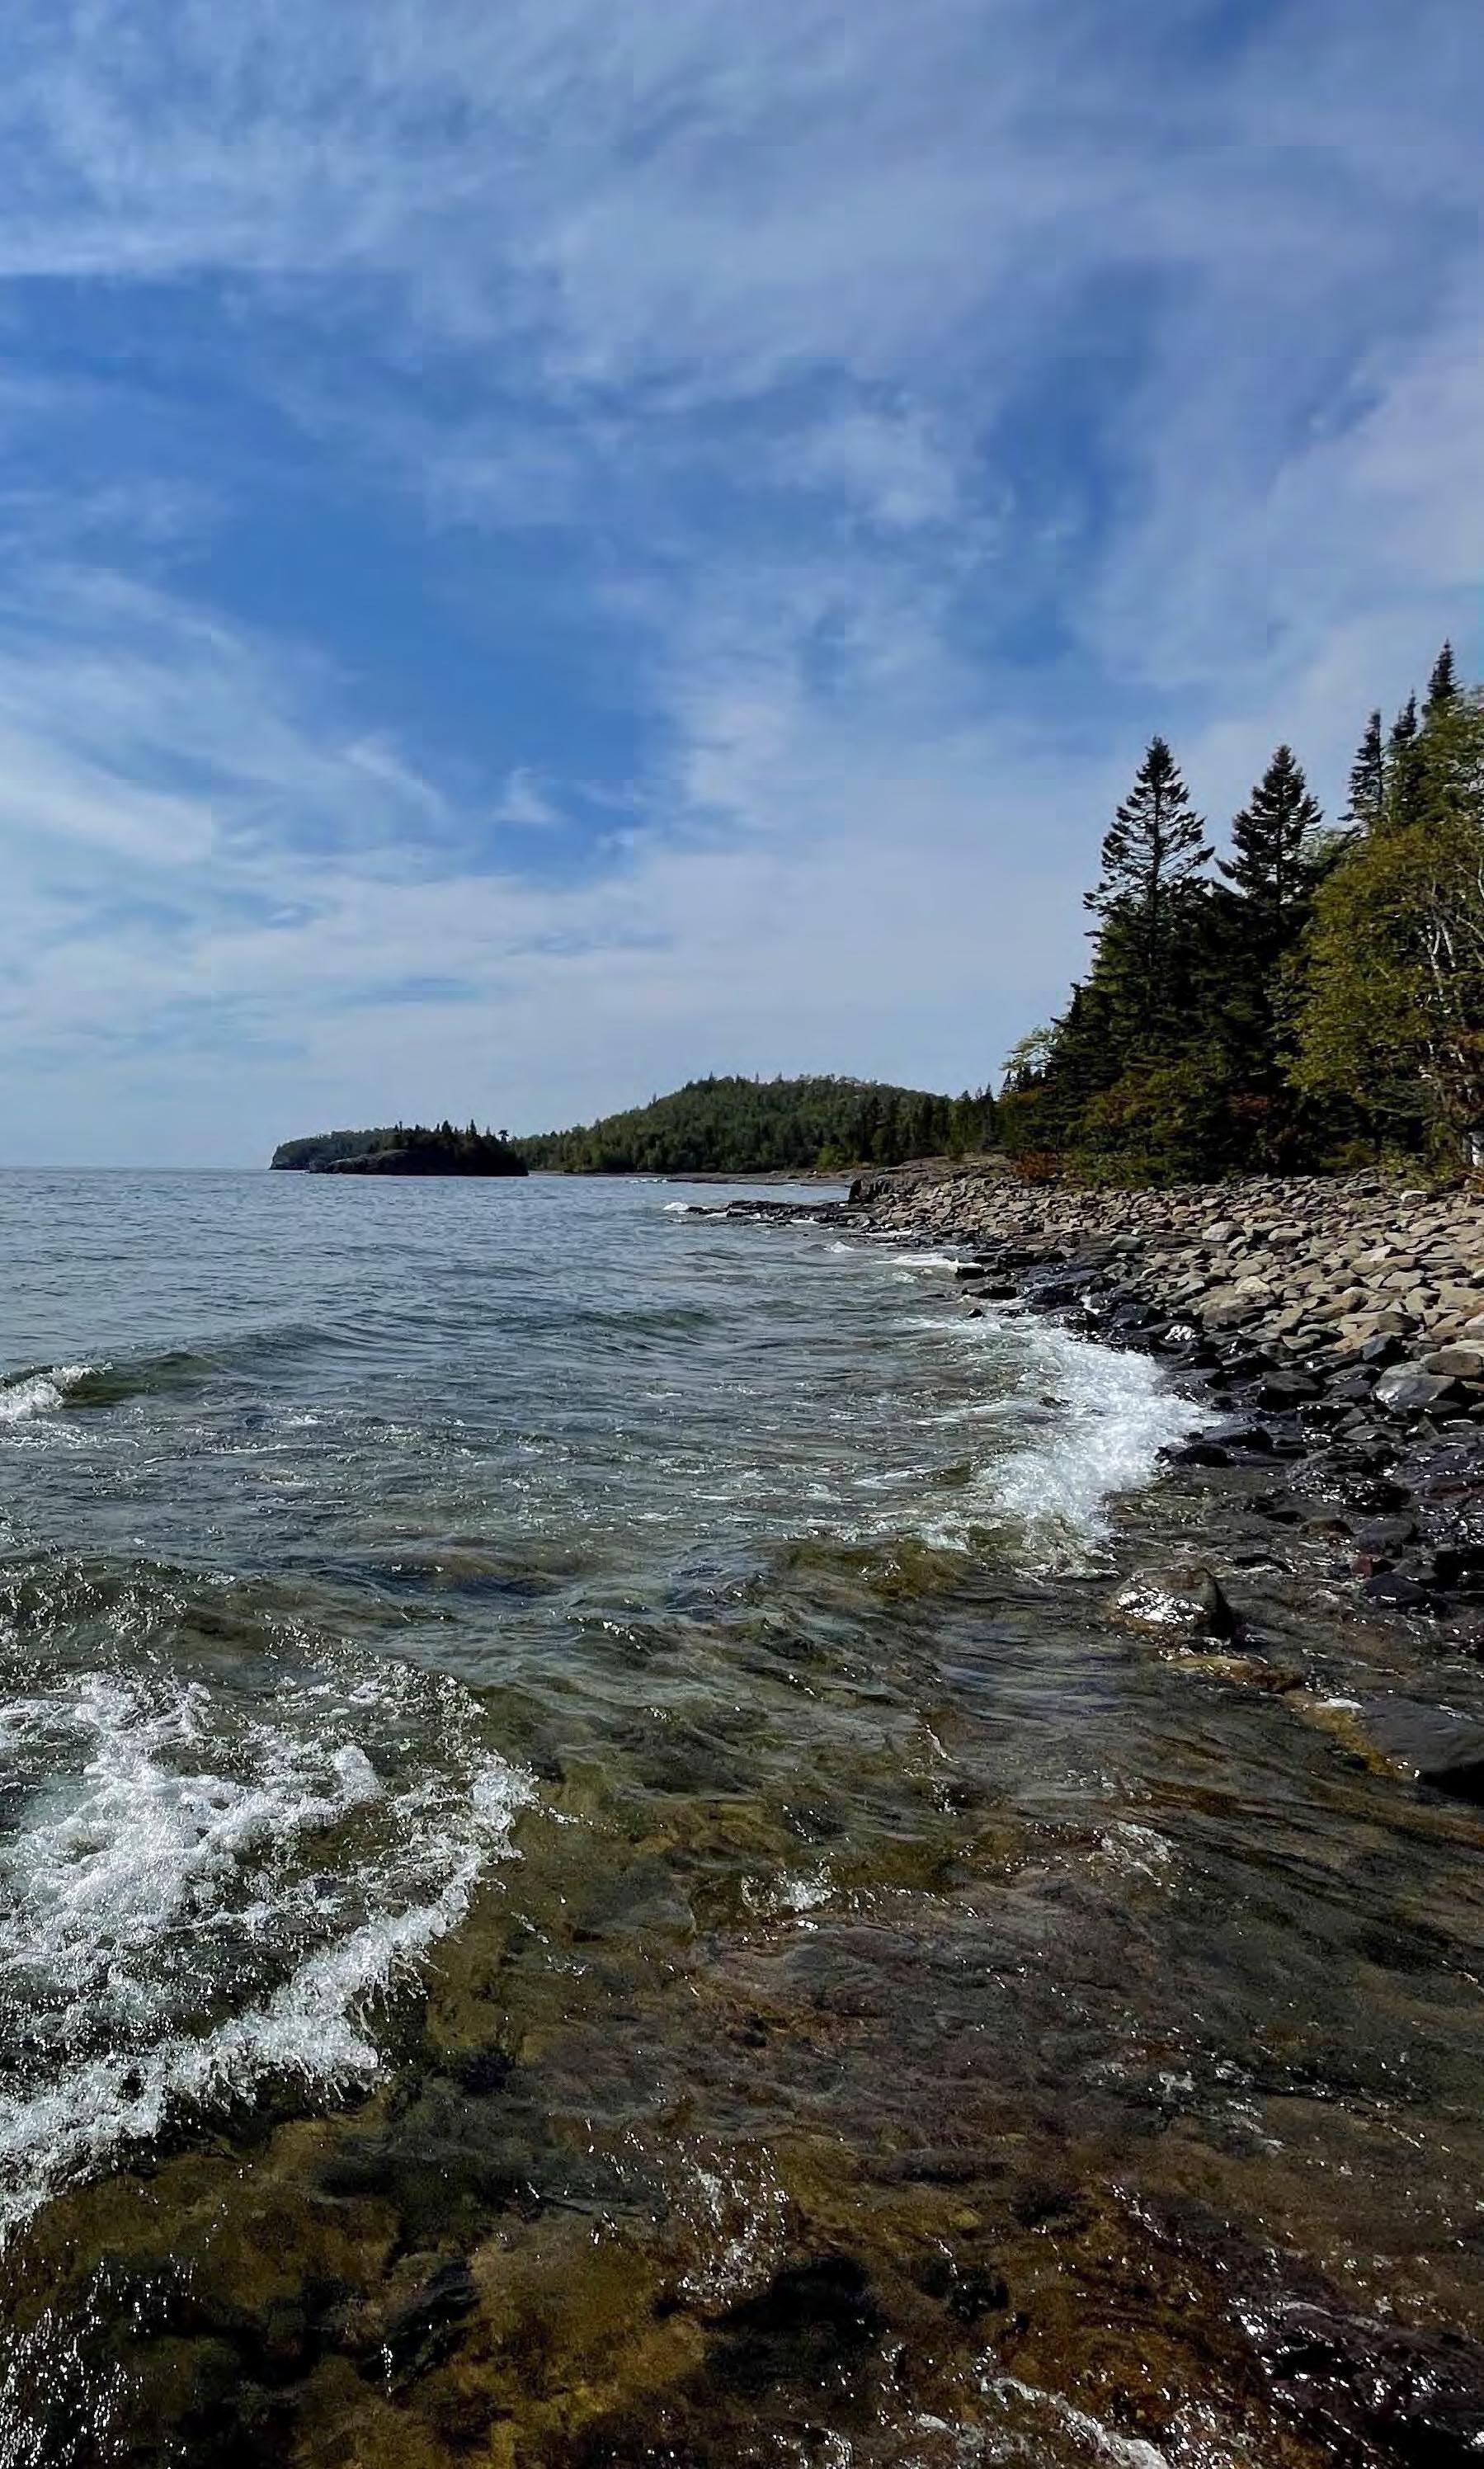
OVERVIEW
Minnesota’s Lake Superior Water Trail (LWST) offers insights into potential economic and social obstacles and benefits of water trails on rural communities, particularly through tourism. Water trails’ popularity is increasing in the recreation and tourism sector, an important economic sector in many states.9 Tourism development and resultant visitor spending spark income and employment benefits for communities but extend beyond economic gains to include social and environmental benefits. Social impacts, (i.e., local “quality of life” and “sense of place”) and physical impacts (i.e., protection or detriment of a community’s natural and/or built environment), are of particular importance as these characteristics are often key reasons for visitors’ initial interest in an area.10 For rural communities near water trails, it is not uncommon for tourists to drive a large portion of the economic activity in retail and service. Thus, by cultivating and leveraging local sponsorship and support from area businesses and community organizations, water trails can provide high-quality recreation at a very low cost.
Water trails foster a sense of stewardship that supports the local economy by boosting local business activity. However, quantifying the impacts of recreational activities is difficult because the water trail uses are difficult to measure, making it complicated to separate their benefits specifically from the impacts of tourism in general.
Lake Superior Water Trail
The LSWT was originally championed by enthusiastic sea kayakers before becoming established as a water trail in 1993 by the Minnesota Department of Natural Resources (MNDNR). Located along the North Shore of Lake Superior, small communities and their local businesses depend on seasonal tourism and actively promote adventure recreation and historical interpretation. The water trail main attraction is kayaking, with over 3,000 outings a year.11
Lake Superior
Seclusive Nature CC BY NC SA 2.0 77
Photo by:
Advantages for Rural Communities
• Stewardship and Community Vitality: Despite the LWST was not intended for economic development along the mostly privately owned North, the water trail has had a positive impact by promoting recreation and stewardship. The rural counties have higher unemployment and poverty rates as well as lower incomes and educational attainment and are experiencing population stagnation and slow economic transitions from agriculture and timber to service and retail industries. Water trail visitors spend money on guides, outfitters, and equipment rental businesses, restaurants, gas stations, and lodging. Increased numbers of quality local service and retail businesses thus enhance opportunities for paddlers to spend money in rural economies.12
• Destinations: The LSWT is more of a tourist destination for paddlers than the North Shore as a whole. The creation and increased maintenance of campsites along the trail enhance opportunities for multi-day paddle trips.
• Events: Water trail events can stimulate economic growth. Participation at the Annual Two Harbors Kayak Festival has increased three-fold since 1998. The events and activities are managed by the Lake Superior Water Trail Association, which is a nonprofit that maintains the trail. Communities promoting their water trail events have a greater influence on destination travelers.
• Up-Front Investment: Small-scale, water trail-related tourism developments are less costly and easier to start up than traditional tourism facilities. Even with lower initial water trail development, water trails do require significant in-kind support within the local community.13
Rural Community Disadvantages
• Risks of Commodifying the River: Taking advantage of the recreational and commercial value of a river increases land use competition and the potential for conflict, which can lead to gentrification; luring outsiders into a community drives up the competition, land, and retail prices in the area. Tourism is increasing land prices around the LWST. About 70% of homes around the lake are seasonal.14
• Environmental Impacts: A growing concern with the LWST is human waste disposal. The rugged shoreline does not offer soil conditions that permit “Leave No Trace” principles for human waste disposal. Currently, many access points and campsites do not offer adequate toilets.
• Dedicated Local Support and Partnerships are Necessary: Public-private partnerships continue to be key to the water trail’s success. Development and maintenance of the water trail is a joint effort of the MNDNR, the LSWTA, and a growing group of resorts and private businesses. The LSWTA has taken primary responsibility for the management and maintenance, which makes the system dependent on volunteers.
• Private Property Concerns: As discussed in this report, there are few studies that clearly establish direct connections between property prices and water trails, especially coastal ones. Even so, tourism brings the potential for increased land prices. LSWT has experienced no occurrences of trespassing or littering, but water trails create the opportunity for such actions to occur, if there are no proper boundaries and signage.
Takeaways
The SRWTC should continue to involve the community in future planning processes to ensure that landowner and citizen concerns are addressed in the process. This can be done through outreach to the community during the beginning stages of any project as well as afterward through an addition of a designated local contact person for different sections of the river. This can add a personal connection as it can ensure quick, accurate responses to suggestions, concerns, and other comments. Addressing potential consequences beforehand by understanding local landowners' interests and their land use patterns that are inconsistent with the water trail’s vision. Rural tourism development will have social implications including increased land values, trespassing incidents, environmental hazards, etc. Increasing communication through mailers and surveys, potentially in coordination with an economic impact study, with river-adjacent landowners could allow for an early warning detection of issues. Clearly indicating public lands and access points with proper signages can also alleviate worries.
78
Race and Socioeconomic Status
In addition to calculating normalized measures of TIF revenue capture rates to consider potential equity concerns regarding the potential burdens and benefits of a water trail TIF, as discussed above, we also examined the racial and socioeconomic makeup of each municipality to gain a deeper understanding of existing conditions and other potential equity concerns. The 22 municipalities along the Shiawassee River Water Trail are not notably diverse racially, each with predominantly white residential populations, as illustrated by table 11. Specifically, the percentage of individuals who identify as white within the 22 municipalities ranges from 89% to 96%. The municipalities with the most racial diversity are Holly Township and the Village of Oakley, with a little over 10% of the population identifying as a race other than white in each community.
In contrast, socioeconomic status (SES) varies significantly between jurisdictions, as illustrated by tables 12, 13, and 14. SES is determined by indicators such as income, educational attainment, and occupation. Of those factors, the median income ranges from $39,643 in the Village of Oakley to $100,625 in Fenton Township. Educational attainment also varies across jurisdictions, with 9.5%, or 315 residents 25 years and older, in Vernon Township having earned a bachelor’s degree or higher in 2021, while 43.1%, or 5,250 residents 25 years and older, in Fenton Township earned a bachelor’s degree or higher in 2021. Rates of residents who have earned a high school diploma or higher have a much closer range: 82.7% in the Village of Oakley to 96.7% in the City of Fenton. Occupations typically associated with low SES, like service and production, transportation, and material moving, comprise the majority of employment in the Village of Byron, Vernon Township, Brady Township, and the Village of Oakley.
79
Note: The “Indigenous” column is a combination of American Indian & Alaskan Native and Native Hawaiian & Other Pacific Islander census categories. Percentages represent the percentage of racial categories in the jurisdiction and are rounded to the nearest whol e number.
Municipality White Black or African American Asian Indigenous Some Other Race Two or More Races Total Population Holly Village 5,489 (91%) 106 (2%) 0 (0%)0 (0%) 68 (1%) 355 (6%) 6,031 Holly Township 10,772 (90%) 228 (2%) 99 (1%) 41 (0%) 92 (1%) 774 (6%) 12,006 Fenton City 10,855 (90%)190 (2%)122 (1%) 29 (0%) 79 (1%)739 (6%) 12,014 Fenton Township 15,550 (92%)115 (1%)130 (1%) 62 (0%) 106 (1%) 880 (5%) 16,843 Linden City 3,827 (92%)35 (1%) 20 (0%) 9 (0%) 22 (1%)229 (6%) 4,142 Argentine Township 6,566 (93%) 16 (0%) 30 (0%) 26 (0%) 42 (1%)411 (6%) 7,091 Burns Township 3,084 (94%) 0 (0%) 12 (0%)16 (0%)16 (0%)152 (5%) 3,280 Byron Village 518 (95%) 0 (0%) 2 (0%) 1 (0%) 2 (0%)27 (5%) 545 Vernon Township 4,038 (95%)4 (0%) 6 (0%) 23 (1%)20 (0%) 182 (4%) 4,273 Shiawassee Township 2,578 (94%) 4 (0%) 15 (1%)14 (1%) 25 (1%) 104 (4%) 2,740 Vernon Village 710 (96%) 0 (0%)0 (0%)0 (0%) 0 (0%) 28 (4%) 738 Venice Township 2,290 (95%) 15 (0%) 4 (0%) 9 (0%) 10 (0%) 94 (4%) 2,422 Caledonia Township 4,072 (93%) 14 (0%) 30 (1%) 18 (0%) 23 (1%)203 (5%) 4,360 Corunna City 2,782 (91%) 11 (0%)15 (0%)17 (1%) 23 (1%) 198 (7%) 3,046 Owosso City 13,467 (91%)134 (1%) 59 (0%) 61 (0%) 141 (1%) 852 (6%) 14,714 Owosso Township 4,433 (93%) 17 (0%) 28 (1%) 8 (0%) 25 (1%)254 (5%) 4,765 Rush Township 1,185 (93%) 3 (0%) 12 (1%) 7 (1%) 6 (0%) 55 (4%) 1,268 New Haven Township 1,170 (96%) 2 (0%) 4 (0%) 2 (0%) 5 (0%) 35 (3%) 1,218 Brady Township 2,018 (94%) 6 (0%) 0 (0%) 6 (0%) 14 (1%) 98 (5%) 2,142 Oakley Village 269 (90%) 0 (0%)0 (0%) 2 (1%) 5 (2%) 23 (8%) 299 Chesaning Township 4,385 (92%) 19 (0%) 23 (0%) 9 (0%)93 (2%) 219 (5%) 4,748 Chesaning Village 2,236 (92%) 11 (0%) 8 (0%) 5 (0%) 40 (2%) 130 (5%) 2,430 Source: U.S. Census Bureau; Decennial Census, 2020 Table: P1 RACE, data.census.gov.
Table
11: Racial Distribution of Shiawassee River Water Trail Communities (Number of Residents)
80
Source: U.S. Census Bureau; American Community Survey, 2021 American Community Survey 5-Year Estimates, Table S1903: MEDIAN INCOME IN THE PAST 12 MONTHS (IN 2021 INFLATION-ADJUSTED DOLLARS), data.census.gov.
Source: U.S. Census Bureau; American Community Survey, 2021 American Community Survey 5-Year Estimates, Table 1501: EDUCATIONAL ATTAINMENT, data.census.gov.
Note: Percentages represent the percentage of educational attainment in the jurisdiction and are rounded to the nearest whole number.
Municipality High School or Higher Bachelor’s Degree or Higher Total Population Over 25 years Holly Village 4,133 (91%) 1,030 (18%) 4,543 Holly Township 8,047 (92%) 2,087 (24%) 8,746 Fenton City 8,093 (97%) 2,443 (29%) 8,373 Fenton Township 11,623 (95%) 5,250 (43%) 12,195 Linden City 2,551 (96%) 712 (27%) 2,662 Argentine Township 4,986 (96%) 1,465 (28%) 5,215 Burns Township 2,184 (92%) 430 (18%) 2,374 Byron Village 375 (92%) 71 (18%) 406 Vernon Township 3,004 (91%)315 (10%) 3,308 Shiawassee Township 1,696 (94%) 316 (17%) 1,813 Vernon Village 355 (92%) 50 (13%) 386 Venice Township 1,522 (94%) 252 (16%) 1,628 Caledonia Township 3,016 (90%) 709 (21%) 3,366 Corunna City 2,058 (95%) 326 (15%) 2,166 Owosso City 8,805 (90%) 1,548 (16%) 9,822 Owosso Township 3,289 (91%) 693 (19%) 3,621 Rush Township 704 (86%) 164 (20%) 815 New Haven Township 722 (92%) 190 (24%) 782 Brady Township 1,295 (88%) 174 (12%) 1,472 Oakley Village 153 (83%) 18 (10%) 185 Chesaning Township 3,314 (92%) 682 (19%) 3,611 Chesaning Village 1,632 (92%) 345 (20%) 1,772
Municipality Median Income Past 12 Months Holly Village $54,206 Holly Township $63,464 Fenton City $70,585 Fenton Township $100,625 Linden City $80,686 Argentine Township $86,239 Burns Township $78,854 Byron Village $69,625 Vernon Township $54,830 Shiawassee Township $71,938 Vernon Village $66,500 Venice Township $58,261 Caledonia Township $59,041 Corunna City $42,016 Owosso City $45,599 Owosso Township $50,428 Rush Township $61,838 New Haven Township $64,833 Brady Township $55,313 Oakley Village $39,643 Chesaning Township $49,194 Chesaning Village $49,722
Table 13: Educational Attainment of Shiawassee River Water Trail Communities in 2021
81
Table 12: Median Income of Shiawassee River Water Trail Communities in 2021
Source: U.S. Census Bureau; American Community Survey, 2021 American Community Survey 5-Year Estimates, Table: S2402, Occupation By Sex For The Full-time, Year-round Civilian Employed Population 16 Years And Over, data.census.gov.
Note: Percentages represent the percentage of occupations in the jurisdiction and are rounded to the nearest whole number.
Municipality Management, business, science, & arts ServiceSales & office Natural resources, construction, & maintenance Production, transportation, & material moving Total full-time, year-round civilian employed population 16 years & over Holly Village 829 (41%) 394 (20%)345 (17%) 102 (5%) 350 (17%) 2,020 Holly Township 1,657 (44%) 527 (14%) 696 (19%) 276 (7%) 600 (16%) 3,756 Fenton City 2,299 (53%) 489 (11%0 814 (19%) 243 (6%) 525 (12%) 4,370 Fenton Township 2,590 (50%) 403 (8%) 1,185 (23%) 262 (5%) 699 (14%) 5,139 Linden City 735 (58%) 153 (12%) 201 (16%) 103 (8%) 82 (6%) 1,274 Argentine Township 942 (43%) 178 (8%) 395 (18%)303 (14%) 391 (18%) 2,209 Burns Township441 (40%) 88 (8%) 139 (13%) 216 (19%) 225 (20%) 1,109 Byron Village 74 (34%) 15 (7%) 39 (18%) 21 (10%) 68 (31%) 217 Vernon Township 284 (24%) 120 (10%) 234 (20%) 182 (15%) 380 (32%) 1,200 Shiawassee Township 206 (25%) 76 (9%) 274 (33%) 83 (10%) 181 (22%) 820 Vernon Village 70 (41%) 15 (9%) 30 (18%)37 (22%) 18 (11%) 170 Venice Township 223 (32%) 103 (15%)153 (22%) 81 (12%) 140 (20%) 700 Caledonia Township 437 (33%) 184 (14%) 233 (17%) 143 (11%) 336 (25%) 1,333 Corunna City 110 (13%)194 (23%) 301 (36%) 102 (12%) 120 (15%) 827 Owosso City 1,364 (28%) 825 (17%) 1,028 (21%) 355 (7%) 1,264 (26%) 4,836 Owosso Township 590 (35%) 155 (9%) 358 (22%) 174 (10%) 386 (23%) 1,663 Rush Township 158 (48%) 48 (15%) 29 (9%) 22 (7%) 74 (22%) 331 New Haven Township 119 (29%) 48 (12%) 80 (20%) 78 (19%) 82 (20%) 407 Brady Township 133 (19%) 79 (11%) 114 (16%)140 (20%) 234 (33%) 700 Oakley Village 11 (14%) 6 (8%) 11 (14%) 24 (31%) 26 (33%) 78 Chesaning Township 449 (32%) 107 (8%) 276 (20%)285 (21%) 273 (20%) 1,390 Chesaning Village 225 (29%) 78 (10%) 139 (18%)199 (25%) 142 (18%) 783
Table 14: Occupations of Shiawassee River Water Trail Communities in 2021
82
SES Implications for the SRWTC
Race and socioeconomic status have been shown to affect access to and use of community amenities like green and blue spaces. In general, there are persistent inequalities in the use of blue spaces; the various benefits associated with them are not fairly distributed amongst the population.15 There are a myriad of reasons why certain groups are less likely to use natural environments, like safety concerns or perceptions of cleanliness. Perhaps the most common reason cited for not utilizing these amenities is the distance from one’s home or work.16 Even so, proximity does not necessarily prompt greater use. A study conducted in Northern Utah revealed that while lower SES and Hispanic residents lived closer to urban blue spaces, higher SES and white respondents were more familiar with and spent more time in blue spaces.17 There are other factors that impact the use of blue spaces as well, like cultural differences in nature-based recreation. Some studies suggest that “restricted horizons,” or limited knowledge and awareness of opportunities to access local natural environments, is particularly important for low-income individuals who may lack experience or confidence in negotiating large, complex natural sites such as water trails.18
If given the opportunity to consider equity concerns, the SRWTC might focus on public engagement and improvements within communities that are historically underrepresented in outdoor recreation and natural resource management. Prioritizing lowerincome or low-SES communities for improvements and new access points may also increase equity and facilitate more engagement with the river among these populations. The Coalition can improve accessibility by altering the built environment and using targeted educational programming to attract lower SES residents along the Shiawassee River Water Trail. Improvements along the water trail like signage, bathroom facilities, and kayak lockers may reduce safety and sanitation concerns that could be hindering the use of the trail. Programmed events and activities that focus on inclusion
and education could attract users who may feel uncomfortable participating in an unfamiliar and new activity. An example of a similar existing program is the Hudson River Riders in Yonkers, NY.19 Different activities for varying levels of users may be vital in attracting new participants, especially introductory experiences.
Based on SES data collected, a key area to focus outreach and improvements along the Shiawassee River Water Trail might be the northern portion of the trail, especially in Saginaw County. Three of the four municipalities in Saginaw County are in the bottom five of all river trail municipalities for median income in 2021. The median income was $39,643 in the Village of Oakley, $49,194 in Chesaning Township, and $49,722 in the Village of Chesaning. The Village of Oakley in particular ranks low across all indicators of SES.
Additionally, the median home values along the water trail, which are consistently lower than the median property values of the whole municipality, may indicate that lower SES residents reside closer to the water trail than higher SES individuals, like the study conducted in Northern Utah. This could mean that the taxes drawn from lower-income residents through an SRWT TIF would likely benefit higher-income residents who tend to live further away from the trail and use the amenity more often. With this possibility, each municipality would benefit from increased programming that serves low-SES residents who are likely to be less experienced users of the water trail.
Given these considerations taken altogether, the structure and organization of a Shiawassee River Water Trail TIF matters, especially to low-income and low-SES residents who live along the shore of the Shiawassee River. The following chapter discusses the options available to the coalition as it decides how to organize and manage a possible TIF moving forward. Equity considerations and suggestions are further included in the next chapters of this report where appropriate to help guide the coalition in those efforts.
83
Citations
1. Wilder, R.S. 2016. An introduction to Kayak and Canoe Launch Design. https://s3.amazonaws.com/suncam/docs/240.pdf.
2. Wilder, R.S. 2016. An introduction to Kayak and Canoe Launch Design. https://s3.amazonaws.com/suncam/docs/240.pdf.
3. “Introduction to the Americans with Disabilities Act,” ADA.gov, February 1, 2023, https://www.ada.gov/topics/intro-to-ada/.
4. “Upper Grand River Water Trail Development Plan,” accessed February 7, 2023, https://www.co.jackson.mi.us/DocumentCenter/View/6067/Upper-GrandRiver-Water-Trail-Development-Plan?bidId=, 23.
5. “Inclusive Universally Accessible and ADA Compliant Water Trail Launch Site Features” (Access Recreation Group), accessed February 7, 2023, https://www.swmpc.org/downloads/universalaccesskayaklaunch.pdf.
6. “2022 Ad Valorem Property Tax Report” (Michigan.gov, n.d.), https://www.michigan.gov/taxes/-/media/Project/Websites/taxes/Tax-LevyReports/2022-Ad-Valorem-Property-Tax-LevyReport.pdf?rev=6dd6b1046c4946c3a695f0dd644dc416&hash=1DDD82C9478 D1C99D04DD593FC5C9575.
7. The Shiawassee River Water Trail Coalition, “The Shiawassee River Water Trail Plan,” n.d., https://drive.google.com/file/d/0B1gjV_v5CNcLSWU4emFKWlFGWFE/view.
8. “Urban and Rural,” census.gov, April 27, 2023, https://www.census.gov/programs-surveys/geography/guidance/geoareas/urban-rural.html
9. Lindsy Johnson, “Case Studies of Water Trail Impacts on Rural Communities” (Thesis, University of Oregon, 2002), https://headwaterseconomics.org/trail/6water-trail-impacts-on-rural-communities/.
10. Johnson.
11. Johnson.
12. Johnson.
13. Johnson.
14. Johnson
15. Pitt, Hannah. “What Prevents People Accessing Urban Bluespaces? A Qualitative Study.” Urban Forestry & Urban Greening 39 (2019): 89–97. https://doi.org/10.1016/j.ufug.2019.02.013.
16. Boyd, Francesca, Mathew P. White, Sarah L. Bell, and Jim Burt. “Who Doesn’t Visit Natural Environments for Recreation and Why: A Population Representative Analysis of Spatial, Individual and Temporal Factors among Adults in England.” Landscape and Urban Planning 175 (2018): 102–13.
https://doi.org/10.1016/j.landurbplan.2018.03.016.
17. Haeffner, Melissa, Douglas Jackson-Smith, Martin Buchert, and Jordan Risley. “Accessing Blue Spaces: Social and Geographic Factors Structuring Familiarity with, Use of, and Appreciation of Urban Waterways.” Landscape and Urban Planning 167 (2017): 136–46. https://doi.org/10.1016/j.landurbplan.2017.06.008.
18. Morris, Jake, Elizabeth O'Brien, Bianca Ambrose-Oji, Anna Lawrence, Claudia Carter, and Andrew Peace. “Access for All? Barriers to Accessing Woodlands and Forests in Britain.” Local Environment 16, no. 4 (2011): 375–96. https://doi.org/10.1080/13549839.2011.576662.
19. “Hudson River Riders,” Hudson River Riders, accessed May 7, 2023, https://www.hudsonriverriders.org.
84
(Page Intentionally Left Blank)
85
Assessment:
Alternative TIF Structures and Legislative Reform
In this section we present an overview of four potential tax increment financing structures for a water trail TIF. Based on our research into the history and uses of TIFs and our understanding of the needs and priorities of the Shiawassee River Water Trail Coalition, we propose that the Coalition consider the following four options for structuring a proposed TIF authorization:
● Single-Jurisdiction TIF
● Multi-Jurisdictional TIF

● County TIF
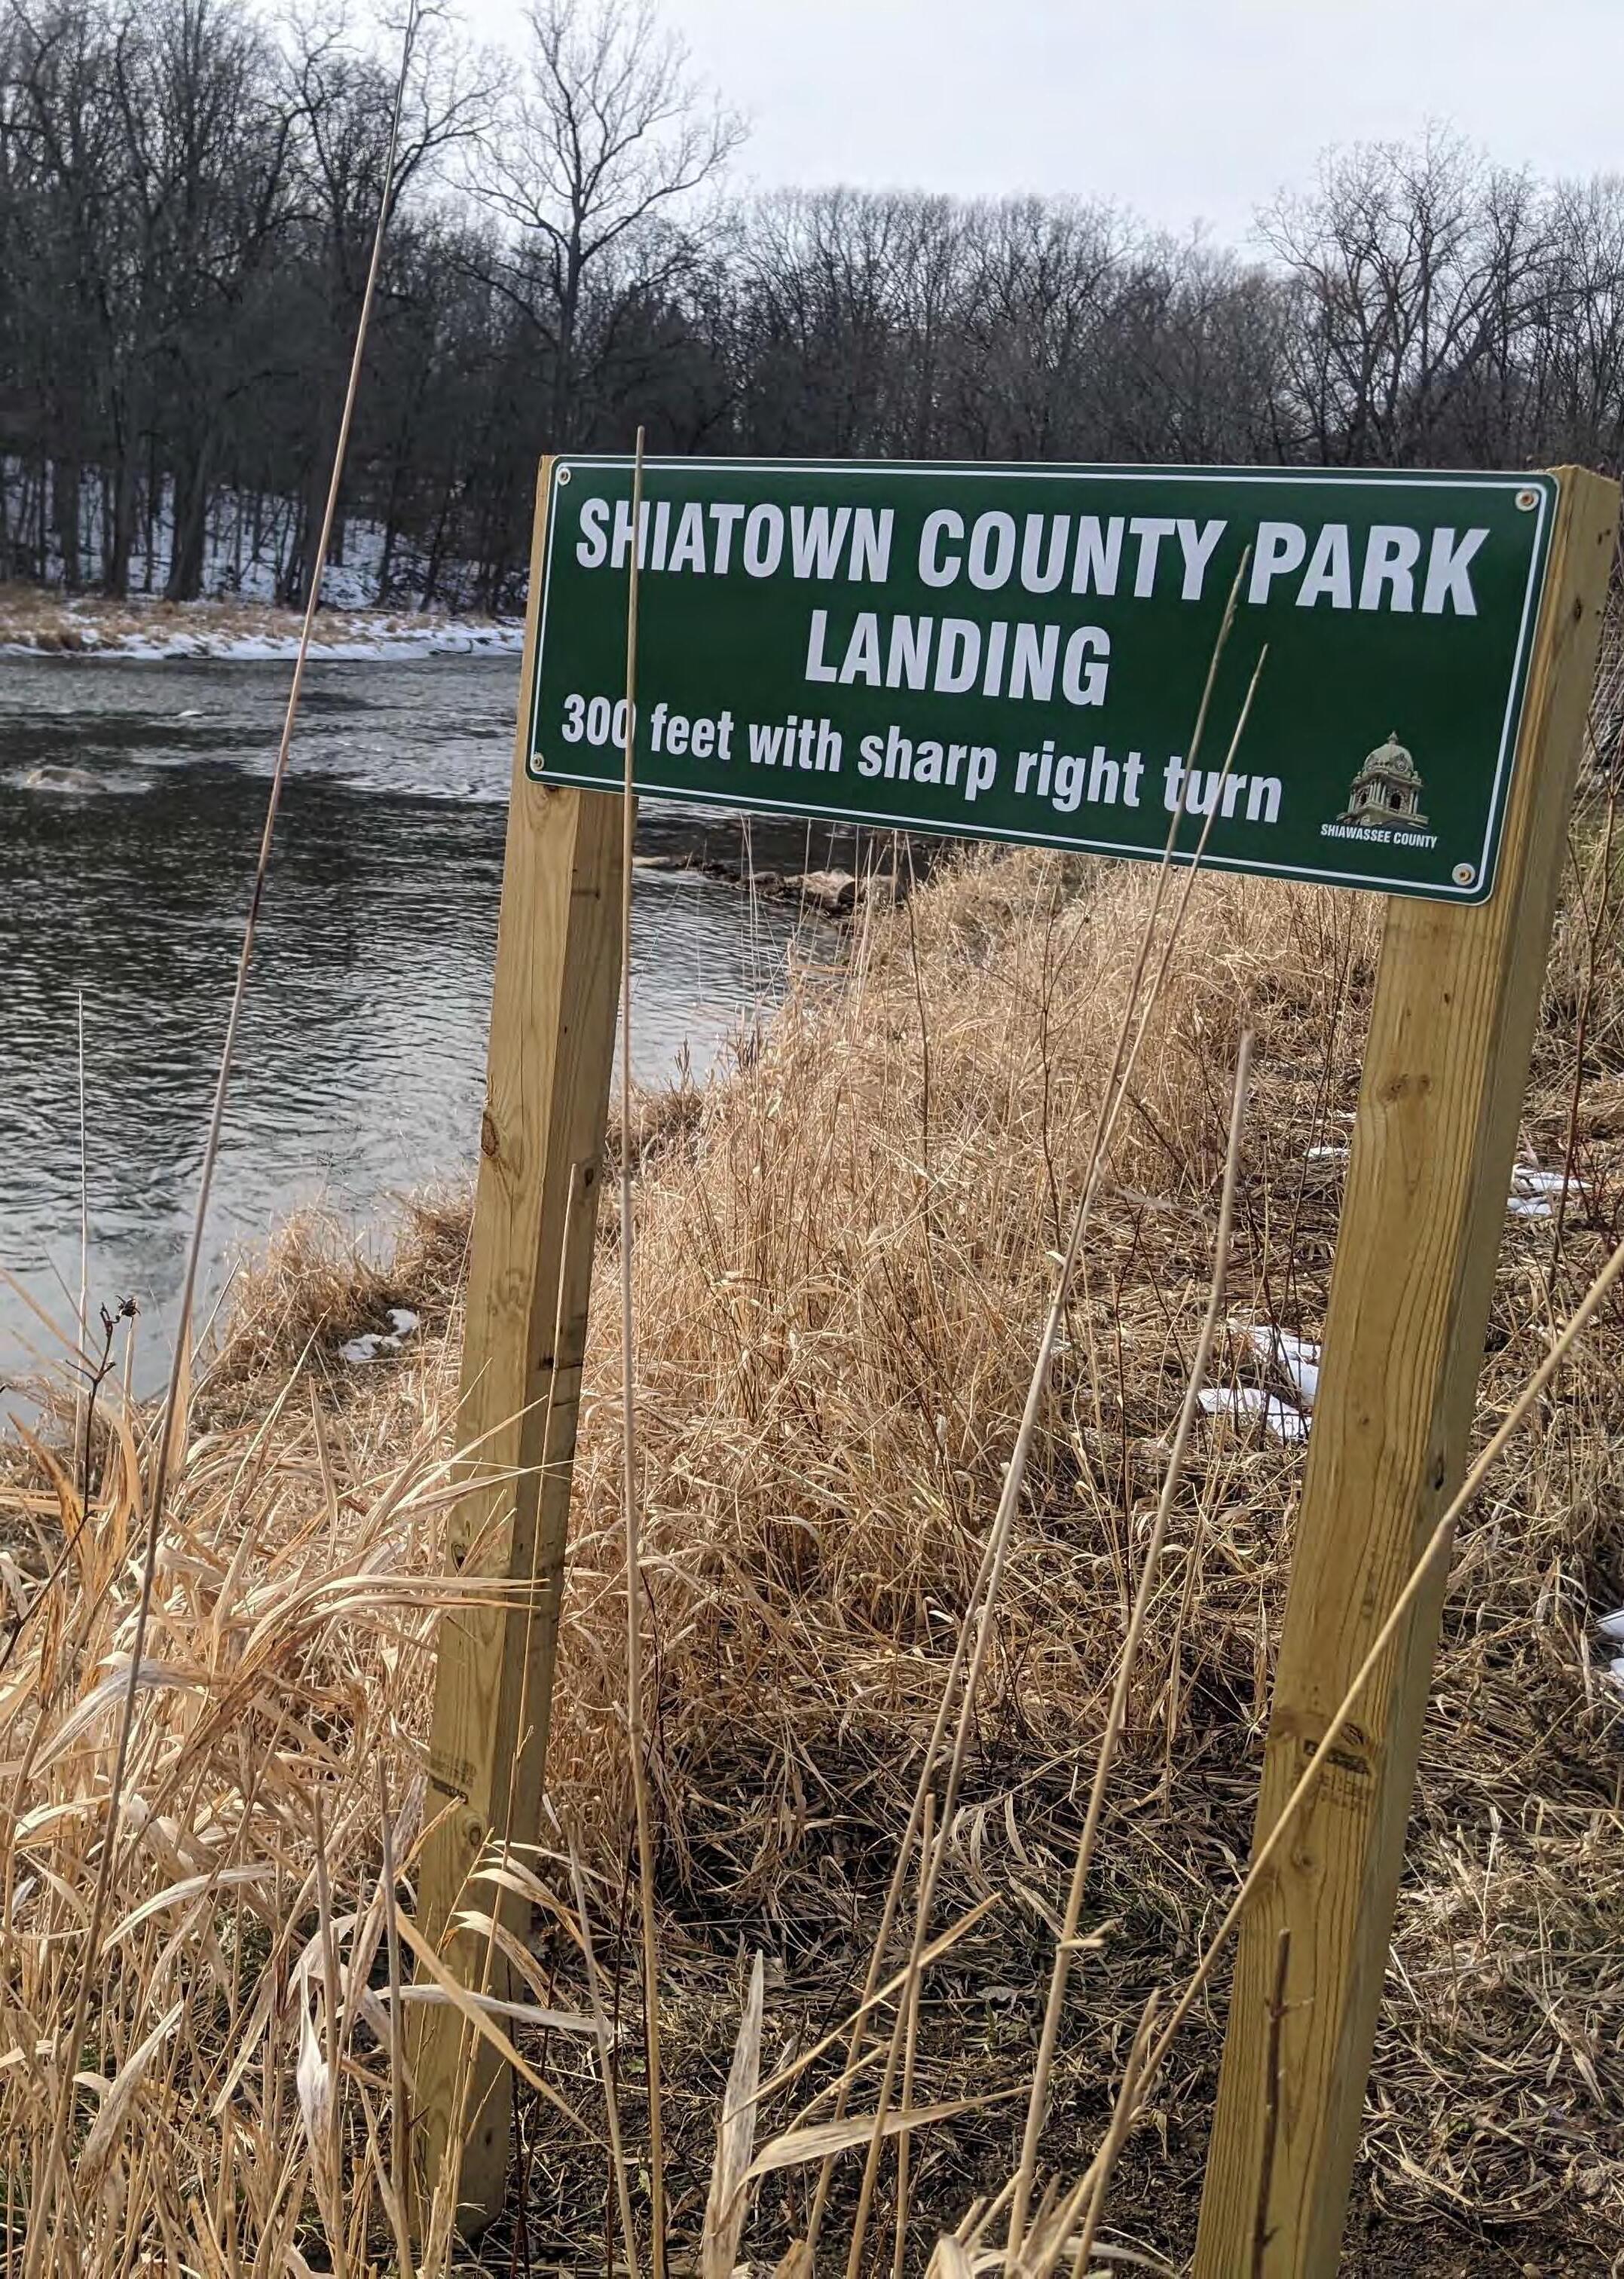
● Unitary TIF
In addition to describing the basic mechanics of each TIF structure, we note the legislative precedent used to inform the TIF structure and the revenue-generating potential of each option.
We conclude this section with a SWOT (strength, weakness, opportunities, and threats) analysis of the four TIF options. We use the criteria of legislative and political feasibility, administrative costs, ability to address equity, and overall efficacy to compare the TIFs. Finally, we pull together our understanding of the full array of various funding opportunities for water trails, in comparison with TIFs, in a separate SWOT analysis. This section of the report can be used to help the SRWTC evaluate the legislative and funding strategy it would like to pursue moving forward.
86
TIF OPTIONS ANALYSIS
Proposed TIF Structures Overview
We developed four options for potential TIF structures drawing from existing authorizations under Michigan law, see table 15. These alternatives are meant to be representative of a range of possible approaches for analytical purposes. We provide an assessment of the pros and cons of each option. The legislative reform required to accomplish the options is addressed separately later in this report.
Single Jurisdiction (SJ) TIF
The simplest TIF structure to fund recreational and infrastructure improvements along the Shiawassee River involves each
Table 15: Proposed TIF Structures
SingleJurisdiction TIF
Villages, Townships, and Cities
Individual municipalities interested in Shiawassee River improvements enact separate TIFs
Coordinator and promoter Contractor
municipality enacting and managing a tax increment district (TID) along its portion of the river. Under this structure, municipalities that value river improvements could create independent TIF districts. Because there could be as many as 22 separate TIDs across the 22 separate municipalities, projects and improvements may seem disjointed or inconsistent along the river.
An SJ TIF is a politically attractive option because it allows each city, village, or township’s officials to determine if river improvements are a priority for their community, it maximizes the autonomy each jurisdiction retains over its own TIF budget, and it facilitates spending TIF dollars only within its jurisdiction. At the same time, for these same reasons, the SRWTC would have a limited role as a third party advocating for the river and helping municipalities coordinate water trail-related projects, and it would face considerable administrative challenges doing so for so many different TIDs separately.
As illustrated in table 16, individual municipalities could generate anywhere from $21 to $41,000 in TIF revenue within the first year of establishing an option for an SJ TIF with a 100% capture rate. It is important to note that the revenue captured from this proposed TIF structure represents a small proportion of each municipality’s overall tax revenue each year as discussed in Chapter 4 of this report. Based on the 2022 total tax revenue per municipality, an SJ TIF would only divert between .03% to 6% for any given jurisdiction.
MultiJurisdictional TIF
Villages, Townships, and Cities
Municipalities enact multiple TIFs and enter into interlocal agreements to manage projects
Coordinator and promoter Contractor County TIF Counties
Counties enact TIFs and enter into interlocal agreements to manage projects Coordinator and promoter Contractor
Unitary TIF N/A
Sole administrator for the Water Trail TIF 87
TIF Authority
Municipalities such as the City of Fenton, Fenton Township, and Linden might be able to accumulate enough revenue from an SJ TIF to fund meaningful recreational and infrastructure improvements. Smaller municipalities, or those with less property along the Shiawassee River Water Trail, may only generate as little as $21 in the first year. Over the 30 years, we expect the total TIF revenues to range between $1,211 and $2,309,898. Additionally, it is reasonable to expect that each municipality will see economic benefits that will transcend the properties directly adjacent to the Water Trail. In addition to the direct benefits of the improvements made by the Water Trail TIF, municipalities may benefit from increases in property tax revenue attributable to the TIF improvements but outside of the defined TIF district (and thus not captured by the TIF).
Type of TIF Government Level Structure Involvement with the TIF
Role
SRWTC’s
The Coalition is empowered to create and manage a single TIF across multiple municipalities
Year 1 (2023) TIF Revenue 2022 Total Tax Revenue Proportion of Tax Base Diverted Average Yearly Revenue 30-Year TIF Revenue Total Holly Township $309 $988,009 0.03% $577 $17,304 Holly Village $1,746 $1,627,088 0.11% $3,264 $97,919 Fenton City $25,526 $6,760,633 0.38% $47,721 $1,431,645 Fenton Township $41,186 $672,972 6.12% $76,997 $2,309,898 Linden City $20,484 $2,012,329 1.02% $38,294 $1,148,822 Argentine Township $5,322 $180,364 2.95% $9,949 $298,483 Burns Township $4,655 $300,216 1.55% $8,702 $261,069 Byron Village $2,381 $114,939 2.07% $4,451 $133,544 Vernon Township $1,346 $346,213 0.39% $2,516 $75,489 Shiawassee Township$1,806 $191,649 0.94% $3,376 $101,280 Vernon Village $545 $181,583 0.30% $1,018 $30,553 Venice Township $262 $360,079 0.07% $489 $14,668 Caledonia Township $2,354 $197,883 1.19% $4,400 $132,009 Corunna City $5,122 $1,030,843 0.50% $9,576 $287,265 Owosso City $6,546 $4,894,718 0.13% $12,237 $367,120 Owosso Township $4,548 $1,233,965 0.37% $8,503 $255,097 Rush Township $3,971 $224,745 1.77% $7,424 $222,712 New Haven Township $2,201 $159,029 1.38% $4,858 $145,752 Brady Township $164 $54,173 0.30% $306 $9,174 Chesaning Township $730 $150,892 0.48% $725 $21,740 Oakley Village $22 $27,222 0.08% $40 $1,211 Chesaning Village $4,391 $1,709,899 0.26% $8,209 $246,279 Total $135,615 $23,419,442 0.58% $253,634 $7,609,033
88
Table 16: Single-Jurisdiction TIF Revenue by Municipality at 100% TIF Capture Rate
Multi-Jurisdictional (MJ) TIF
This second tax increment financing structure creates the opportunity to establish several TIDs that span multiple jurisdictions. This option allows TIF authorities to join with others in different municipalities, which could help increase the total funding any given TIF authority has available.
Under this model, interested municipalities could co-create TIF districts and develop interlocal agreements for budget and project management. This model follows the precedent set within the Corridor Improvement Authority (CIA) portion of Act 57 of 2018.1 CIA districts allow for multiple jurisdictions along an arterial road to enter into an interlocal agreement to co-manage the TID. Local Development Finance Authorities (LDFAs), under the same law, also enable cross-jurisdictional funding and management.
This option still maintains a sense of localized control of TIF revenue. Pursuing this option, however, would require two or more
jurisdictions to do the work to initiate, outline, and create a TIF district. Negotiating interlocal agreements might also require greater political maneuvering. Under this mode, the SRWTC could remain a third-party advocate, providing guidance and support to the MJ TIFs, or it might be able to take on a more involved role in the management of a TIF through a contracting process.
To demonstrate the potential financial capacity of MJ TIFs, we grouped, at random, several adjoining municipalities along the Shiawassee River Water Trail. It is important to note that the groupings of municipalities below do not represent formal recommendations for TIF district composition. Rather, the following TIF districts are only meant to serve as examples of what MJ TIFs could look like as presented in tables 17-21. As can be seen from these hypothetical scenarios, grouping TIDs yields greater capture revenue, making projects more feasible financially. However, this could result in funds from one jurisdiction contributing to projects within the same TID but also situated in another jurisdiction, which may be a point of concern for local officials or residents.
Year 1 (2023) TIF Revenue 2022 Total Tax Revenue Proportion of Tax Base Diverted Average Yearly TIF Revenue 30-Year Total TIF Revenue Holly Township $309 $988,009 0.03% $865 $17,304 Holly Village $1,746 $1,627,088 0.11% $4,896 $97,919 Fenton City $25,526 $6,760,633 0.38% $71,582 $1,431,645 Fenton Township $41,186 $672,972 6.12% $115,495 $2,309,898 Total $68,767 $10,048,702 0.68% $192,838 $3,856,766 Year 1 (2023) TIF Revenue 2022 Total Tax Revenue Proportion of Tax Base Diverted Average Yearly TIF Revenue 30-Year Total TIF Revenue Linden City $20,484 $2,012,329 1.02% $57,441 $1,148,822 Argentine Township $5,322 $180,364 2.95% $14,924 $298,483 Burns Township $4,655 $300,216 1.55% $8,702 $261,069 Byron Village $2,381 $114,939 2.07% $6,677 $133,544 Total $32,842 $2,607,847 1.26% $87,745 $1,841,918 Table
Shiawassee
Jurisdictional
Revenue over 30-year Period Table
Shiawassee MultiJurisdictional TIF Revenue over 30-year Period 89
17: Southern
Multi-
TIF
18: South Central
The five hypothetical Multi-Jurisdictional Water Trail TIDs developed for illustration here would generate a wide range of total revenues. The Southern Shiawassee Multi-Jurisdictional Water Trail TIF is projected to generate $192,838 (table 17) in its first year, while the North Central Shiawassee Multi-Jurisdictional Water
Trail TIF is projected to only generate $11,099 (table 20). While $11,000 is not an insignificant amount of revenue, it demonstrates that there is the potential for a large disparity in revenuegenerating capacities across Multi-Jurisdictional Water Trail TIFs, depending on how they might be organized.
Year 1 (2023) TIF Revenue 2022 Total Tax Revenue Proportion of Tax Base Diverted Average Yearly TIF Revenue 30-Year Total TIF Revenue Caledonia Township $2,354 $197,883 1.19% $6,600 $132,009 Corunna City $5,122 $1,030,843 0.50% $14,363 $287,265 Owosso City $6,546 $4,894,718 0.13% $18,356 $367,120 Owosso Township $4,548 $1,233,965 0.37% $12,755 $255,097 Rush Township $3,971 $224,745 1.77% $11,136 $222,712 Total $22,541 $7,582,154 0.30% $63,210 $1,264,203
Year 1 (2023) TIF Revenue 2022 Total Tax Revenue Proportion of Tax Base Diverted Average Yearly TIF Revenue 30-Year Tota TIF Revenue Vernon Township $1,346 $346,213 0.39% $3,774 $75,489 Shiawassee Township $1,806 $191,649 0.94% $5,064 $101,280 Vernon Village $545 $181,583 0.30% $1,528 $30,553 Venice Township $262 $360,079 0.07% $733 $14,668 Total $3,958 $1,079,524 0.37% $11,099 $221,990 Year 1 (2023) TIF Revenue 2022 Total Tax Revenue Proportion of Tax Base Diverted Average Yearly TIF Revenue 30-Year Total TIF Revenue New Haven Township $2,201 $159,029 1.38% $7,288 $145,752 Brady Township $164 $54,173 0.30% $459 $9,174 Chesaning Township $730 $150,892 0.48% $1,087 $21,740 Oakley Village $22 $27,222 0.08% $61 $1,211 Chesaning Village $4,391 $1,709,899 0.26% $12,314 $246,279 Total $7,508 $2,101,215 0.36% $21,208 $424,155
TIF Revenue over 30-year
Table 20: North Central Shiawassee Multi-
Jurisdictional
Water Trail
Period
Table 21: Northern Shiawassee MultiJurisdictional Water Trail TIF Revenue over 30-year Period
90
Table 19: Central Shiawassee MultiJurisdictional TIF Revenue over 30-year Period
County (CO) TIF
To avoid potential conflicting interests across dozens of municipalities while maintaining a level of local control, this structure would empower county governments to establish TIF districts along their portion of a river. Like the MJ TIF, this approach would require an interlocal agreement between counties spelling out the management and budget of the TIDs.
Under this model, counties would be granted the legal authority to create and manage a TIF that would include all eligible properties along the Shiawassee River Water Trail. This model would follow the precedent set in the Brownfield Redevelopment Financing Act of 1996.2 Under that act, counties are included under the definition of “municipality” and are allowed to establish and exercise the powers of a TIF within the TID. Counties must receive written consent from each jurisdiction located within the TID before diverting their tax dollars. Each county could grant the Shiawassee River Water Trail Coalition the ability to help manage TIF revenues through an interlocal agreement.
A CO TIF has the potential to generate a larger revenue than what a single municipality could generate on its own. With the CO TIF, however, TIF revenue might be spent on projects outside of one or multiple participating jurisdictions. Some municipalities might
object to contributing a portion of their total tax revenue toward projects that aren’t focused on their community. County Commissions will be tasked with convincing residents of the merits of participating in a Water Trail TIF.
In addition, some of the County-Level Water Trail TIFs might have a lower capacity to generate funds than the Multi-Jurisdictional Water Trail TIF. For example, the first-year TIF projections estimated for Oakland County would generate only $2,054 in revenue (table 22). Because there are far fewer parcels adjacent to the water trail located in Oakland County, the county’s funding would be limited if a CO TIF was adopted. Holly Township and the Village of Holly are the only two municipalities along the water trail in Oakland County. These two municipalities might prefer an MJ TIF over a CO TIF. In the hypothetical MJ TIFs proposed in the section above, Holly Township and the Village of Holly entered an MJ TIF with neighboring Fenton Township and the City of Fenton. In this scenario, the MJ TIF would generate a first-year TIF revenue of $68,767 (table 18) potentially increasing the funding for projects located in Oakland County. This is important because Oakland County and Saginaw County might not support this TIF structure since it might not generate enough revenue to finance improvements they would hope to see along their portion of the water trail.
Year 1 (2023) TIF Revenue 2022 total Tax Revenue Proportion of Tax Base Diverted Average Yearly TIF Revenue 30-Year Total TIF Revenue Oakland County $2,054 $2,615,097 0.08% $3,841 $115,223 Genesee County $92,518 $9,626,297 0.96% $172,962 $5,188,848 Shiawassee County$35,736 $9,235,861 0.39% $67,552 $2,026,558 Saginaw County $5,306 $1,942,187 0.27% $9,280 $278,404
91
Table 22: County-Level Water Trail TIF Revenue over 30-year Period
Unitary (U) TIF
Under this model, the Shiawassee River Water Trail Coalition would act as the sole TIF authority along the 88-mile water trail. See table 23 for revenues. This model would follow the precedent set by Section 5, Nonprofit Street Railways, of the Recodified Tax Increment Financing Act of 2018.3 Under this act, a nonprofit organization can become an independent TIF authority to encourage the development and maintenance of public transportation facilities. Under this model, the SRWTC would act as a quasi-government agency with full authority to manage TIF dollars and projects. This removes the hyperlocal control of previous options but makes it possible for the SRWTC to consolidate the project planning process along the water trail and spend TIF revenue along the water trail freely so long as it complies with the TIF plan. Legislation modeled after the Nonprofit Street Railway section of the Recodified Tax Increment Financing Act of 2018 would likely provide the Shiawassee River Water Trail Coalition the flexibility and autonomy they desire to make improvements along the water trail. This option requires substantial legislative reform and might be the most difficult option to pursue politically, as discussed more below.
LEGISLATIVE REFORM
To shape realistic legislative reform, we analyzed current TIF laws to find existing elements that open the door for the changes needed to create a riverfront TIF. Each option requires different levels of legislative reform to ensure it can be implemented. An overview of these reforms is illustrated in table 24. These reforms escalate with regard to political feasibility from simplest to most complicated. However, existing authorities provide models to draw from, suggesting that while some options push the envelope more, each is viable.
Current Legislative Authorities
The Water Resource Improvement TIF might be the best part of Act 57 of 2018 to propose the required amendments to allow for the use of TIFs for water trails. The current Water Resource Improvement TIF law states:
If the governing body of a municipality determines that it is necessary for the best interests of the public to promote water resource improvement or access to inland lakes, or both, in a water resource improvement district, the governing body may, by resolution, declare its intention to create and provide for the operation of an authority within the boundaries of a water resource improvement district.4
Water resource improvements are activities that enhance water quality and water-dependent natural resources, including, but not limited to
● Elimination of the cause and proliferation of aquatic nuisance species
● Sewer systems that service existing structures
● Stormwater systems that service existing structures
● Dredging, removal of spoils, or other improvements or maintenance activities that enhance navigability.5 Inland lakes are restricted to natural or artificial lakes, ponds, or impoundments. It does not include a lake or pond with a surface area of fewer than five acres.6
The Water Resource Improvement TIF currently calls for a board that consists of five to nine individuals appointed by the executive officer of the municipality. There must be at least a majority of board members with an ownership or business interest in the development area, as well as at least one member who is a resident of the development area or lives within a half mile of the development area.7
Revenue per TIF Capture Rate Year 1 (2023) TIF Revenue 2022 Total Tax Revenue Proportion of Tax Base Diverted Average Yearly Capture at 100% 30-Year TIF Capture Total at 100% Total Capture $135,615 $23,419,442 0.58% $253,634 $7,609,033
92
Table 23: Unitary Shiawassee River Water Trail TIF Revenue over 30-year Period
Policy Revisions Overview
For a Water Trail TIF to be a legislative reality several changes need to be made to the current law as a revision to PA 57. The TIF structure the Shiawassee River Water Trail Coalition opts for will dictate what type of legislative change will be most effective and appropriate. We address here the key areas requiring change, including amendments to enable:
● TIF districts along a water trail
● TIF revenue to be used to fund recreational and infrastructure improvements
● TIF districts to contract out to third parties
● Non-contiguous jurisdictions to co-create and co-manage a TIF district
● Counties to establish and manage a TIF
● A nonprofit organization to administer and manage a TIF
Additional topics the coalition should explore include:
● Adding a statement of legislative findings to the Water Resource Improvement Authority section of PA 57 (or a new section, as noted below, if that option is pursued)
● Defining what board membership and structure should look like to ensure equitable representation in the use of TIF revenue
● Creating meaningful engagement opportunities (e.g., a development area citizens council) for residents along the Shiawassee River Water Trail that will enhance buy-in and support for collaboration
● Including provisions that take into account hiring and compensation for employees working for the TIF authority
● Considering whether a Water Trail TIF authority can take on debt and, if so, whether the TIF authority can use revenue generated by the TIF to service that debt
● Proposing a new TIF division within the Recodified Tax Increment Financing Act of 2018 that establishes Water Trail Recreation Authorities, rather than amending the existing Water Resource Improvement Authority
The topics above are discussion points for the coalition to flag once its members settle on their preferred TIF structure. The SRWTC can look at the Recodified Tax Increment Financing Act of 2018 as a reference to see how these matters have been addressed for other types of TIF structures.
TIF districts can be established along river water trails
TIF funds can go toward recreational & related purposes
Can contract with a third party for management
Non-contiguous multi-jurisdictional TIFs for river-adjacent municipalities
Counties can establish TIFs
Nonprofits can govern a Waterfront TIF
Level of Legislative Language Reform Required for WRIA TIF Single-Jurisdiction TIF Multi-Jurisdictional TIF County TIF Unitary TIF
Table 24: Overview of Legislative Reform per Water Trail TIF Option
93
Changes for All Water Trail TIFs
All four of the Water Trail TIF structures proposed in this report will require some legislative changes. As previously mentioned, Michigan’s laws on tax increment financing do not currently allow for the use of TIFs along a water trail or for the purpose of funding recreational and infrastructural improvements. Specifically, there are three basic changes that all of the several TIF structure options presented here would require.
Enabling TIF Districts along a Water Trail
The first and most essential amendment to Michigan’s current TIF law would be to allow the establishment of a TIF district along a river or water trail. As previously mentioned, a WRIA can already be established around an inland lake. This provision of the TIF Act will need to be amended to define a river trail, and then to extend TIF authorities to river trails.
Enabling TIF Funding to be Used to Finance Recreational Improvements
Currently, WRIA can use TIF funds for water improvements that are focused on enhancing water quality and aquatic ecosystems. While some of the functions currently enabled might represent some of the improvements along the water trail, expanding the legislation to include expressly improvements surrounding recreational purposes would be beneficial in ensuring that the water trail TIF can spend its revenue in a way that aligns with the SRWTC’s agenda. To meet the goals stated in the SRWTC plan, the language should be broad enough to allow TIF revenue to be used for the following purposes:
● Promoting river-related recreation, public access sites, and user experiences
● Maintaining access sites and sustaining trail operations
● Preserving and protecting river resources
The amendment should be specific enough to allow spending on things such as boat launches, public restrooms, and other activities, but broad enough that it could be applied to other Michigan water trails (and potentially other reasonable uses related to water trails not currently envisioned).
The SRWTC is interested in adding a provision to the revised or amended TIF law to allow the coalition to spend TIF revenue outside the immediate TIF district and within the greater watershed. The SRWTC is specifically interested in engaging residents of the watershed in education about improving water
quality. Currently, TIF law dictates that revenues generated within the district must be spent in the district. Amending the law to allow for funds to be spent away from the TID may be politically infeasible. However, some potential workarounds would not require legislative reform. For instance, online material such as best practices and educational videos, could be produced within the district, but benefit the whole watershed. Additionally, the SRWTC could host educational events at a location within the district but invite community members from around the watershed.
Enabling TIF Districts to Contract with a Third Party
Two options exist to allow a river trail TIF district to contract with the SRWTC or a similar nonprofit organization.
The first option is through a third-party contract arrangement. The current Waterfront TIF law requires new language to authorize the SRWTC to manage and market the TIF district(s) as a third party. An example of this language can be found in the Local Development Financing Authority provisions:
“(7) The Michigan economic development corporation shall market the certified technology parks and the certified business parks. The Michigan economic development corporation and an authority may contract with each other or any third party for these marketing services.”8
Additional language should be included that enables an authority established for a river trail to contract with a third party for services. The power of the coalition, as a third-party contractor, would be laid out in the contract.
Another option can be found in the Urban Cooperation Act of 1967. This act empowers municipalities to enter interlocal agreements. Governments that have established an agreement are permitted to establish a separate legal entity to administer or execute the agreement. However, the agreement must expressly provide for a separate entity; otherwise, one can not be created. This provision allows municipalities to spell out the exact nature of the power the separate legal entity can possess. According to the Act, the separate legal entity “shall possess the common power specified in the agreement and may exercise it in the manner or according to the method provided in the agreement.”9 Similar language could be used in a water trail provision.
94
Changes for a Multi-Jurisdictional Water Trail TIF
Enabling Multiple Jurisdictions to Work Together
The Waterfront TIF Act already includes language in Section 705 that allows municipalities that create an authority to enter into an agreement with an adjoining municipality. However, because of the nature of a river trail, it may be necessary that (or at least beneficial for) non-contiguous municipalities enter agreements for river trail management.
Two existing TIF provisions currently contain language that should open the door for multi-jurisdictional partnerships with municipalities that are not adjoining. Both the Corridor Improvement District and Local Development Finance Authority laws allow for “joint authority” but do not explicitly require municipalities to be neighboring.
Meanwhile, the Urban Cooperation Act of 1967 provides, in part, that “any public agency of this state may exercise jointly with any other public agency of this state.”10 With this in mind, the Waterfront TIF language could be updated to read:
“(5) Any municipality that has created an authority may enter into an agreement with any other municipality that has created an authority along the same waterfront or river trail to jointly operate and administer those authorities under an interlocal agreement under the urban cooperation act of 1967, 1967 (Ex Sess) PA 7, MCL 124.501 to 124.512”
By removing “adjoining” and including “any” and “along the same waterfront or river trail” within this provision the legislation should be broad enough to empower municipalities that do not share a border to coordinate efforts so long as they are all along the same river corridor. Additionally, a phrase similar to “participating municipalities need not be adjoining” could be included. Simply avoiding any language about the location of jurisdiction may also eliminate the problem, although it could result in ambiguity that might make the execution of the act more difficult and litigation more likely.
Changes for a County-Level Water Trail TIF Enabling Counties to Establish TIFs
Municipalities are currently enabled to establish Water Resource Improvement Authorities. A “municipality” constitutes a city, village, or township.11 To allow for greater collaboration, coordination, and financial feasibility, it might be worthwhile to enable TIFs to be established at the county level.
Fortunately, there is precedent within Michigan law that enables counties to be the administrators of Brownfield Redevelopment Authorities. In the Brownfield Redevelopment Financing Act, PA 381 of 1996, a municipality is defined as a city, village, township, or county.12 When a county establishes a TIF, it can exercise powers over eligible properties within the district if the encompassed cities, villages, and townships agree to the provisions of the TIF plan.13
The Waterfront TIF language could be updated to expand the definition of “municipality” to encompass counties. Furthermore, if the law is updated to allow counties to establish TIFs, the law might also need to incorporate a provision similar to that of the Brownfield TIF.
If the law is changed to allow counties to establish TIFs, Section 705 of the Waterfront TIF should also include provisions that enable the county to operate the TIF in the municipalities within its jurisdiction. Any proposed revisions should require that all cities, villages, and townships within a county agree to the provisions of the TIF plan and enter into an agreement with the county. If a municipality does not agree to the provisions, this provision should allow the county-level TIF to proceed without parcels from that jurisdiction. Language to enable a county's ability to operate a waterfront TIF can be adopted from the Brownfield Development Financing Authority Act (PA 381 of 1996) and might read as the following:
(6) An authority established by a county shall exercise its powers with respect to eligible property within a city, village, or township within the county only if that city, village, or township has concurred with the provisions of a Water Trail TIF that apply to that eligible property within the city, village, or township.
95
(7) A city, village, or township including a city, village, or township that is a qualified local governmental unit may enter into a written agreement with the county in which that city, village, or township is located to exercise the powers granted to that specific city, village, or township under this act.
For a County Level Water Trail, the law must also expand the definition of “chief executive officer” for a County Level Water Trail TIF. This ensures that the county executive or chairperson of the county board of commissioners can appoint members to the board. Language for this revision can be taken from the Brownfield Redevelopment Financing Authorities Act. A revision to section 702(f) could read as follows:
"Chief executive officer" means the mayor of a city, the village manager of a village, the township supervisor of a township, or the county executive of a county or, if the county does not have an elected county executive, the chairperson of the county board of commissioners.
Enabling Nonprofit Organizations to Serve as Administrators and Managers of a TIF
If the Shiawassee River Water Trail Coalition wishes to pursue a Unitary TIF, more extensive amendments will be needed. Given the extensive nature of those amendments, we recommend adding a new type of TIF to Public Act 57 of 2018. This new category of TIF would meld aspects of Part 5 of PA 57, Nonprofit Street Railways TIF authorization, with aspects of the existing Waterfront TIF authorization. It would be difficult to make the waterfront TIF work for this scenario even with substantial amendments.
Under this section of PA 57, “street railways” are nonprofits organized to operate a “street railway system.” These organizations can acquire, own, construct, furnish, equip, complete, operate, improve, or maintain a street railway system. To create a similar concept for the SRWTC, new provisions drawn from the existing language in the Street Railways TIF act would authorize a water trail coalition to act as a TIF authority. For example, the following language can be adapted for a water trail TIF:
Language Adapted from 125.4507
(g) "Water Trail Management Organization'' means a nonprofit
corporation organized under this part for the purpose of maintaining a water trail. Water Trail Management Organization includes a nonprofit corporation incorporated under the nonprofit corporation act, 1982 PA 162, MCL 450.2101 to 450.3192, for the purpose of assisting the Water Trail in acquiring, owning, constructing, furnishing, equipping, completing, operating, improving, or maintaining a water trail or for the purpose of financing a water trail.
(h) "Water Trail" means the facilities, equipment, and personnel required to provide and maintain a national or state-designated water trail flowing through a city, village, township, or county.
Under this portion of the law with regard to street railways, the nonprofit organization enters an operating agreement with each road authority with jurisdiction over the public streets and highways that overlap with the location where the organization seeks to operate the street railway system. If the coalition chooses to pursue this legislative option, note that use of the broader term “management organization” would allow other water trail managers that are not coalitions, such as the Huron River Watershed Council, to be TIF authorities under this provision as well.
TIF OPTIONS STRENGTHS, WEAKNESSES, OPPORTUNITIES, AND THREATS ANALYSIS
Criteria Discussion
To gain a better understanding of which TIF structure may be the most appropriate for the SRWTC or similar group, we performed a Strengths, Weaknesses, Opportunities, and Threats (SWOT) analysis of each option. For this assessment, we focused on each structure’s legislative and political feasibility, administrative cost and feasibility, and ability to address equity and efficacy.
96
Legislative and Political Feasibility
It is important for the SRWTC to consider the legislative and political feasibility of each of the proposed TIF structures prior to deciding on which to pursue. The Single-Jurisdiction Water Trail TIF option, for example, provides the SRWTC with a TIF structure that would require minimal revisions to Part 7 of Public Act 57 of 2018, which enables the creation of Water Resource Improvement Authorities (WRIA). As we learned through our interviews, the WRIA is not currently used by any municipalities in the state. The reform required to enable Single-Jurisdiction Water Trail TIFs may also make the establishment of WRIAs more attractive and accessible to municipalities with large waterfront and riverfront communities. In short, our proposed legislative changes might breathe new life and momentum into a portion of the law that is currently inoperative. This option is also likely the easiest to accomplish politically. Most municipalities are already familiar with creating and managing TIFs, so the expertise should exist locally. TIF revenues from a SingleJurisdiction Water Trail TIF would also stay within the jurisdiction, minimizing concerns about how funds might be allocated along an 88-mile water trail.
As seen in tables 26 and 27, the Multi-Jurisdictional and the County-Level Water Trail TIFs both require a few additional revisions to the WRIA. The changes required for each of these options, however, are relatively modest. As previously mentioned, public officials and the public alike generally trust county treasures because they are seen as experts in financial best practices. That trust may make a county TIF more palatable at the local level.
The Unitary Water Trail TIF requires the most legislative reform, which can be seen in table 28. Because of the complexity and nuance of a Unitary Water Trail TIF, this option might require a new chapter or classification of TIFs to be added to PA 57. There are potential pros and cons to introducing a new TIF category. With a new classification, the legislation can be fine-tuned and then amended later if changes are needed. However, introducing a new TIF category may draw more scrutiny and criticism than amending the existing WRIA. As noted previously in our overview of the history and use of TIFs, some Michigan planners worry that drastic changes to TIF laws may draw the ire of those skeptical of the use of TIFs. This could result in an effort to rein in TIF law’s powers rather than expand them.
Administrative Feasibility and Cost
Administratively, a Unitary Water Trail TIF or County-Level TIF would likely be the easiest for the SRWTC to manage. Meanwhile, the Single-Jurisdiction Water Trail TIF would be the most difficult and time-consuming to administer. This is laid out in tables 28, 27, and 25.
If the proper legislation is passed to enable a Unitary TIF, the SRWTC would have to put in more energy up front convincing the 22 jurisdictions to agree to the provisions outlined in the Water Trail TIF Plan that apply to eligible properties within their municipality. After that process is complete, however, the SRWTC would likely have the greatest flexibility and discretion over how, when, and where the TIF revenues are spent. This option might be slightly easier to manage than if the SRWTC were to manage four separate County-Level Water Trail TIFs.
A County-Level Water Trail TIF is one of the easier options for the coalition to manage administratively. Each county would individually work to get their encompassed jurisdictions to agree to the provisions of a County-Level Water Trail TIF Plan. As previously mentioned, municipalities generally have positive relationships with their county treasurers. This trust can be leveraged to make the process of setting up the TIF less controversial and burdensome. If all four counties choose to establish a County-Level Water Trail TIF, SRWTC would enter four separate interlocal agreements or be contracted as the administrators for the TIF districts. Administratively, the Multi-Jurisdictional Water Trail TIF would look similar to the County-Level Water Trail TIF. One of the key differences, however, is the possibility of having more than four Water Trail TIF districts that would need to be managed by the SRWTC. The TIF structure’s complexity will dictate the staffing needs of the coalition.
The Single-Jurisdiction Water Trail TIF would likely be much more administratively complex and costly. Under this TIF structure, each municipality would decide individually if they wanted to create a Water Trail TIF and develop their own Water Trail TIF Plan. This could be challenging for the SRWTC, which hypothetically might have to manage up to 22 individual Water Trail TIFs.
97
Equity
The Unitary Water Trail TIF option would provide the SRWTC with the best opportunity to take equity into consideration when deciding how to allocate TIF revenues. Because TIF revenue would be pooled from the 22 participating jurisdictions, municipalities with lower property values or fewer overall resources might be able to host riverfront projects they normally would not be able to afford otherwise. This also applies to County-Level Water Trail TIFs. However, the opportunities to redistribute TIF funds would be bound by county lines and thus more limited, unless the counties allowed for distributions across boundaries in an interlocal agreement. In other words, while there might be opportunities for poorer communities to benefit from the general wealth of the greater county, not all counties are equally wealthy and the system to provide for greater equity could be complicated.
A strength of the Multi-Jurisdictional Water Trail TIF option is that municipal coalitions could be organized in order to effectively meet shared goals and values. An unintentional consequence of allowing the formation of non-contiguous multi-jurisdictional TIFs, however, is that some municipalities that are smaller or with lower capacity might be excluded from joining the TIF. Additionally, residents may feel it is unfair to spend their tax dollars outside of their jurisdiction. The SRWTC would have to rely on goodwill, cooperation, and inclusion by the individual municipalities to promote equity across Water Trail TIFs.
The same aspects that make the Unitary Water Trail TIF the best option for addressing equity also make the Single-Jurisdiction TIF the weakest. While the TIF structure does allow for hyper-local control, some communities that may want river improvements simply will not be able to generate enough TIF revenue because of the size or number of parcels in their boundaries.
The relative wealth/contribution and normalized contribution assessments featured in Chapter 4 of this report strongly suggest the need to consider whether the various TIF options will establish equitable funding mechanisms, particularly when assessing a MultiJurisdictional TIF scheme. In brief, there are disparities between how much some municipalities would contribute when compared to their total tax revenue, as well as considering contributions by population size and area. None of those disparities are so
substantial as to suggest that the establishment of the TIF itself would be inherently unfair or unreasonable, especially considering the very small proportions of total tax revenues that any of the TID jurisdictions would be asked to contribute. Nonetheless, the SRWTC should consider whether the various relevant benefits and burdens of the TIF warrant prioritizing the kinds or timing of projects it decides to implement, such as by siting new access points first in jurisdictions that have relatively less wealth overall but that would be contributing relatively higher proportions of their tax base to the TIF.
In addition, when considering a Multi-Jurisdictional TIF, it may be more equitable to choose an option that provides similar per capita revenues for each grouping of jurisdictions. For example, combine Linden City with a per capita revenue of $277, Argentine Township with a per capita revenue of $42, and Burns Township with a per capita revenue of $80 for one multi-jurisdictional TIF, while another group could include Byron City with a per capita revenue or $245, Vernon Village with a per capita revenue of $41, and Holly Village with a per capita revenue of $8. These or similar groups would create dispersed funds across large to small municipalities so that no single jurisdiction carries an undue burden.
As noted in Chapter 4, the 22 municipalities along the Shiawassee River are not racially diverse. White residents make up no less than 90% of any township, village, or city.
Efficacy
There are two main questions that guide our evaluation of the efficacy of the four TIF structures:
1. Does the TIF structure provide the SRWTC with enough money to finance projects along the river?
2. Does the TIF structure encourage buy-in and participation among the individual municipalities along the water trail?
The Unitary Water Trail TIF provides the greatest efficacy with regard to financing the SRWTC’s goals, as noted in table 28. The Unitary Water Trail TIF creates the largest single pot of money: it could generate $135,615 in the first year, as noted in our capture analysis. The SRTWC master plan calls for about $485,000 total for identified river improvements, which indicates that as long as not all projects are completed in a single year, and
98
Categories:
Efficacy
Equity
Legislative & Political Feasibility
Administrative Feasibility & Cost
with additional grant funding, the SRWTC would have ample money to fund projects and hire a small staff. This structure also reduces competition for grants and state aid and opens the door for potential nonprofit-specific grant opportunities.
The Unitary Water Trail TIF has the potential to bring the 22 participating municipalities together by generating widespread buy-in and excitement for improvements along the water trail. Additionally, as a nonprofit, the SRWTC TIF authority may qualify for additional funding through grants that would not be open to a normal authority.
Though this structure has many advantages related to efficacy, however, it does have two primary weaknesses. First, a Unitary Water Trail TIF may be the most difficult to establish as it would likely be the most controversial TIF. Municipalities falling within the Shiawassee River Water Trail may not feel excited about contributing a portion of their tax dollars to go toward projects that could potentially be spent up to tens of miles away from their jurisdiction. With this in mind, it might be difficult initially to get the municipalities on board with the Unitary Water Trail TIF. The
second potential weakness of the Unitary Water Trail TIF is that it requires the heftiest amount of legislative change. Not only is a Water Trail TIF a new concept for Michigan tax policy but also authorizing a nonprofit to act as a taxing body would be unique and would likely require significant lobbying.
The Single-Jurisdiction Water Trail TIF has the greatest number of threats to efficacy. With potentially more than 20 municipalities attempting river projects, this structure creates a notable amount of competition for state, federal, and philanthropic funding. Furthermore, individual municipalities, particularly smaller jurisdictions, may not be able to weather an economic downturn that negatively impacts property values, increasing the chance that Single-Jurisdiction TIFs do not meet revenue projections.
Four TIF Option SWOT Breakdown
Each consideration of strength, weakness, opportunity, or threat for the four TIF options was coded under the following categories: Efficacy, Equity, Legislative and Political Feasibility, and Administrative Feasibility and Cost.
Single-Jurisdiction Water Trail TIF STRENGTHS
Would require the least amount of legislative reform and could likely be accomplished
Most similar to already enabled TIFs
Maximizes jurisdictional autonomy over how and where TIF revenue is spent
TIF revenue is spent in close proximity to where the money is collected from
WEAKNESSES
Hard to consider equity in how TIF revenue is spent because TIF dollars can only be spent directly in the municipality Municipalities with lower incomes and/or fewer properties located along the water trail might not generate enough revenue on their own to feasibly finance desirable improvements
The SRWTC might have to negotiate and manage up to 22 separate TIF partnerships
OPPORTUNITIES THREATS
Make adjustments to TIF law that would enhance existing legislation, potentially making it more accessible and attractive to other waterfront communities
Competition for state, federal, and private funding might arise between the 22 separate Municipality Specific Water Trail TIFs
Economic changes might lead to unpredictable challenges in the housing market that could negatively impact the revenue generation of a smaller TIF
Table 25: SingleJurisdiction Water Trail TIF SWOT Analysis
99
Multi-Jurisdictional Water Trail TIF
STRENGTHS
Jurisdictions can organize around shared goals to maximize opportunities and tackle equity issues
Jurisdictions can join togetherin a way that maximizes financial leverage
The number and geographic location of municipalities can be flexible
OPPORTUNITIES
The nature of an interlocal agreement fosters collaboration among jurisdictions along the river
WEAKNESSES
A new legal entity may need to to create to manage the TIF budget
Establishing multiple TIFs and setting up interlocal agreements will require significant work
Small districts may not be equitably funded if they have fewer parcels or lower-value parcels
THREATS
Generally, the public may lack an understanding of TIFs
With multiple municipalities involved, there is more room for disagreements about goals
Predicting which municipalities will join a Multi-Jurisdictional TIF makes increases the uncertainty
Competition for state, federal, and private funding increases if several Multi-Jurisdictional TIFs are formed
County Water Trail TIF
STRENGTHS
County governments likely already have established infrastructure with knowledge of laws and budgets.
With just four counties, the administration is relatively easy compared to up to 22 municipalities
Based on projects, more dollars are available for projects compared to the previous two options
OPPORTUNITIES
People tend to trust county treasures, which can be leveraged both during the creation and the execution of the TIF Funds can be distributed equitably within the county
WEAKNESSES
Counties are not currently authorized to form TIFs, so this option doesn’t necessarily follow the current logic for TIFs
Additional legislative reform is required to allow counties to establish TIFs
THREATS
Competition for state, federal, and private funding might arise between the four County-Level Water Trail TIFs
Table 26: MultiJurisdictional Water Trail TIF SWOT Analysis
Efficacy Equity Legislative & Political Feasibility Administrative Feasibility & Cost 100
Table 27: County Water Trail TIF SWOT Analysis
Categories:
Categories:
Efficacy
Equity
Legislative & Political Feasibility
Administrative Feasibility & Cost
Unitary Water Trail TIF STRENGTHS WEAKNESSES
Funds can be distributed equitably along the river
The administration would likely be easier as SRWTC manages a single TIF
As a single entity, there would be less competition for grant funding
Projects can be completed more quickly after the TIF is established
OPPORTUNITIES
As a single entity, this option has the most opportunity to consider equity
Risk is spread across the entire river, making it more likely the TIF can weather an economic downturn or other risks
A nonprofit may qualify for more grant opportunities
A TIF’s Potential
In sum, an assessment of the four TIF options presented here suggests that the use of a TIF could be a viable course of action for obtaining stable and reliable funding for managing a water trail. While the difficulty of reforming legislation and enacting a TIF could be considerable and should be addressed carefully, the potential opportunities the TIF provides appear to outweigh the potential disadvantages. Nevertheless, even should a water trail TIF be authorized, it is important to bear in mind that the SRWTC would almost certainly still need to utilize other forms of funding mechanisms to fulfill the coalition’s goals. As such, the SRWTC should maintain its established relationships with private donors, corporations, foundations, or grant-providing entities. Multiple funding streams, including TIFs and currently available options, will likely provide the most promising approach for the SRWTC. In the next chapter, we present our recommendations for actions that will assist the SRWTC in achieving its water trail goals.
As the most novel and complicated option, this would require the most amount of legislative reform
Partner jurisdictions would have limited autonomy regarding how their tax dollars are spent
Given the nature of this structure, it will be the most controversial and most difficult to create
THREATS
Generally, the public may lack an understanding of TIFs
As the most unique option, legislators may be critical of a TIF operated by a nonprofit Might need to amend the Michigan Natural Resources Trust Fund to give grants to nonprofits.
Table 28: Unitary Water Trail TIF SWOT Analysis
101
Conclusions and Next Steps

The use of a TIF for water trails could work and offers potential as a dedicated funding source for the Shiawassee River Water Trail. The TIF revenue can support the implementation of projects from the Shiawassee River Water Trail Plan. In addition, these funds can be used as vital matching funds for larger state and federal grants, multiplying the TIF’s impact and therefore, the water trail’s impact. However, this expansion of the use of TIFs may be pushing the envelope. Our research demonstrates the general trend of TIF use expansion in Michigan and how a potential water trail TIF can be designed and managed. Notably, the research presented in Chapter 3 illustrates the small proportion of tax revenues that would be diverted from the municipalities’ general funds toward the water trail TIF. To avoid the backlash observed in states like California, which substantially reduced the use of TIFs in 2012 because of concerns regarding their impacts to local general revenues, care in designing and marketing a TIF is critical to ensure it is effective and politically feasible.
For a waterfront TIF to be successful, the SRWTC must use concrete data and thoughtful narratives to illustrate the value of its water trail. The coalition needs to demonstrate how the Shiawassee does and will continue to have a positive impact on the communities it passes through. How the TIF is marketed will determine if it is successfully adopted. The SRWTC must consider
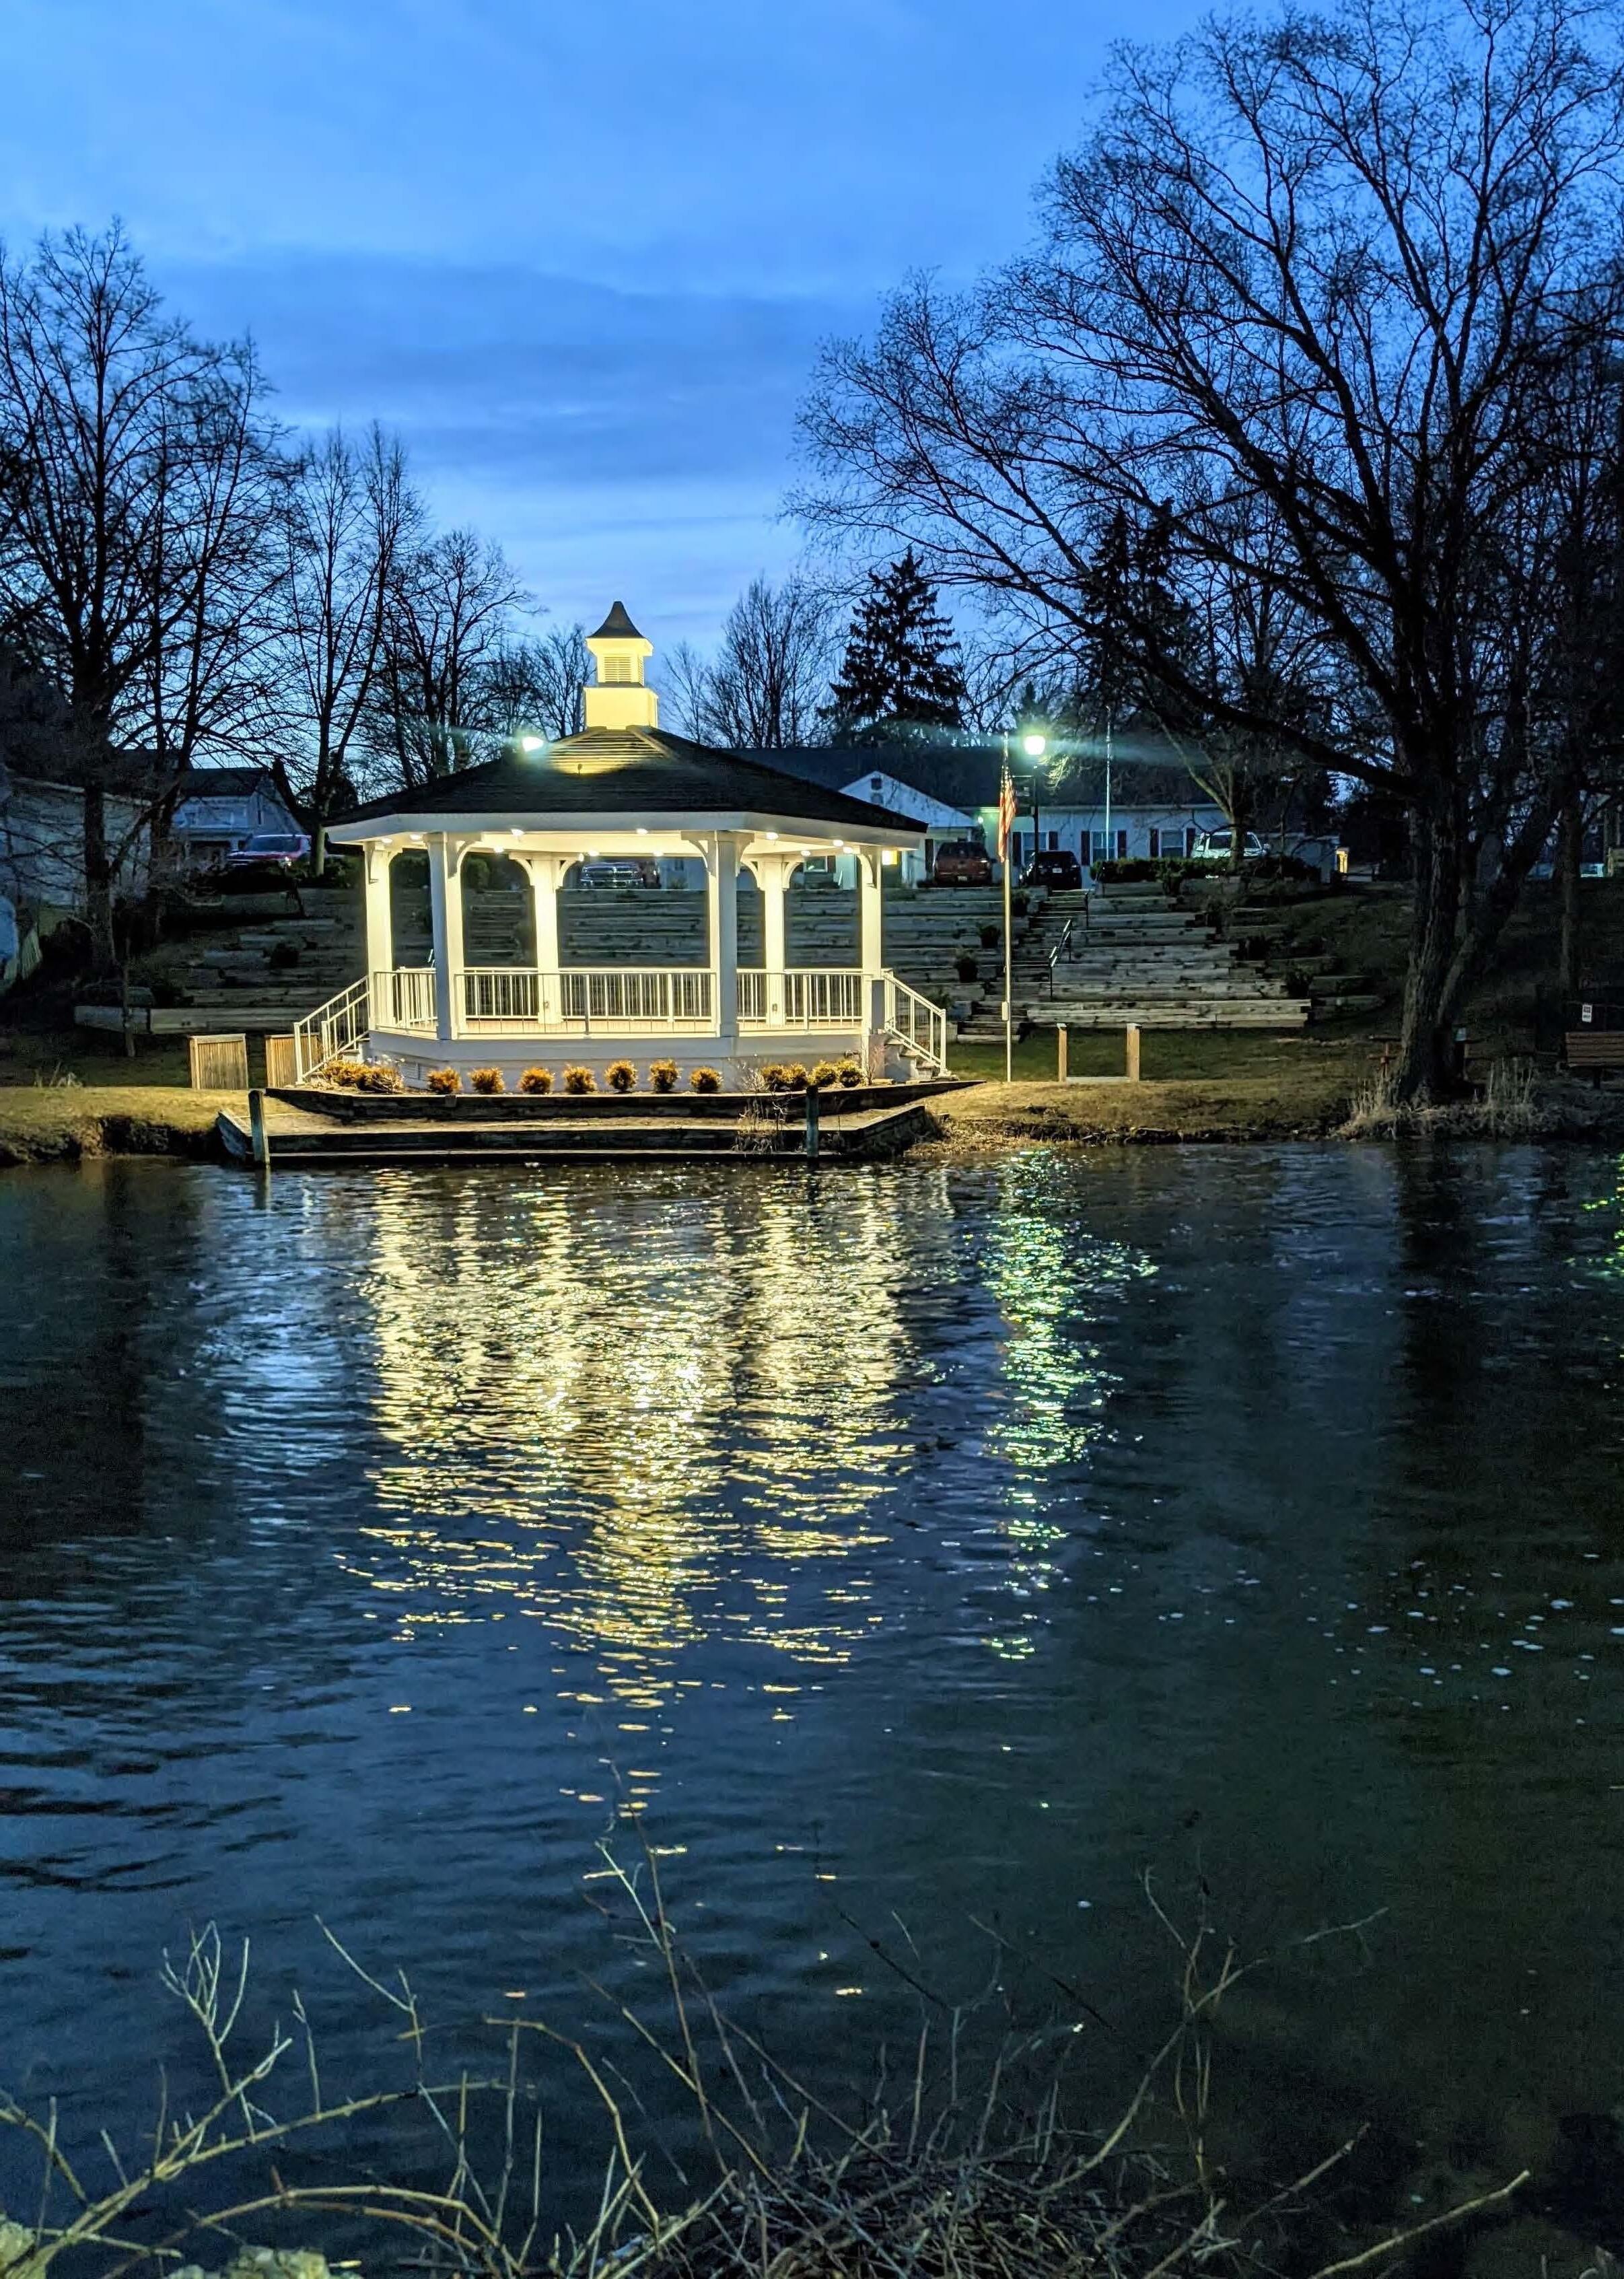
102
how the TIF is discussed with its members, in communities along the river, and in preparation for passing the appropriate legislation for its enabling. This is especially true when talking to municipalities of different sizes and tax bases to make sure that each feels their community is being asked to contribute reasonably, and that each will feel commensurate benefits from the improvements made.
The following recommendations are meant to guide the coalition in designing and implementing a water trail TIF that will avoid backlash from the state legislature and municipal leaders and advance the goals of the Coalition: foster collaboration between the jurisdictions along the Shiawassee River Water Trail and provide a dedicated and reliable funding source for improvements and maintenance along the river. These recommendations are specifically meant to serve as guides for programming and implementing the water trail TIF.
1. BEGIN
ECONOMIC IMPACT STUDY
An economic impact study is an analysis that examines the economic effects of a project on the surrounding community. A water trail economic impact study in particular studies the effect of recreational opportunities along the water trail on the region’s economy, as well as ecological and property value impacts. An economic impact study is crucial for the Shiawassee River Water Trail Coalition (SRWTC) because it can help provide concrete data to support the eventual legislative reforms needed to authorize a water trail TIF in Michigan as well as be used to convince communities to support a water trail TIF and one day, to hopefully, renew a TIF.
Economic impacts can be measured using a variety of criteria. The National Park Service’s “Economic Impacts Of Protecting Rivers, Trails, And Greenway Corridors: A Resource Book” and its drafted update by Nadel, “Economic Impacts of Parks, Rivers, Trails, and Greenways” outline explicit examples of data to collect, potential sources for this data, and helpful hints for collection, analysis, and
use of the data.1,2 Some that the SRWTC may want to collect include:
• Recreational access to and use of the Shiawassee River Water Trail
• Biodiversity and ecological contributions or ecosystem services of the Shiawassee Watershed
• Scenic amenities
• Real estate values
Specific data that can be used to evaluate these impacts are:
• The number of paddlers and visitors per year, per season, and per day, in what section(s) of the river
• Origin of paddlers (local or tourists)
• Direct spending (equipment rentals, kayak lockers, etc.)
• Indirect spending (Local lodging, campgrounds, restaurants, etc.)
• Added value to residences near the Shiawassee River Water Trail -both qualitative via interviews and quantitative (property values, tax revenues, etc.)
• Ecosystem services from the protection of the river
• Biological diversity (survey of invasive species, water quality, acres of land protected)
• Savings from flood control or costs related to flooding incidents
The numbers of visitors and their spending habits are useful information for estimating the impacts the water trail has on the economies of surrounding communities and the larger region. Visitors spend money on meals, shopping, lodging, transportation, and equipment. This money is funneled back into the local economies, increasing employee wages and stimulating job creation. This kind of economic activity can also attract employers and companies to the Shiawassee River region. As discussed earlier in this report, the presence of a water feature or recreational trail can also increase property values due to the amenity’s proximity to the residence. Some values may be more difficult to quantify because they are societal values, like aesthetics or natural beauty, while others such as water quality are quantifiable.
SRWTC may consider contracting this work out to a consultant company that has experience in economic impact studies or finding additional assistance elsewhere.
103
The Rivers, Trails, and Conservation Assistance program highly recommends partnering with university masters or doctoral candidates and their professors. The University of Michigan’s School for Environment and Sustainability (SEAS) or Taubman College of Architecture and Urban Planning may be excellent places to start. Both schools require their masters candidates to complete capstone projects. Both may be open to multiyear projects that extend over multiple cohorts.
It can be costly to perform these studies because the efforts required to collect necessary data are often time- and laborintensive. Appropriate methods might include, for example, surveys of local businesses, residents, nearby property owners, and visitors. Nonetheless, preparing comprehensive and thorough economic, social, and environmental assessments can illustrate the logic of TIFs: that improvements made along the water trail, funded by TIF revenues, will increase property values of river-adjacent parcels and promote economic development along the river trail, as well as providing an array of additional benefits such as enhanced public health, social wellbeing, and environmental quality.
2. INAUGURATE A TIF TASK FORCE
While the SRWTC is already a well-established organization that represents nearly all of the Shiawassee River’s 22 communities, a smaller group of SRWTC should form a TIF Task Force. The responsibilities of the TIF Task Force are to support the Coalition’s executive director in selecting the appropriate TIF option for moving forward, coordinate with other coalition members and stakeholders, craft supporting materials for communicating with local communities, and carry out any additional tasks necessary to bring the water trail TIF into fruition, including the recommendations listed here.
The selected Coalition members should not only be willing and able to participate but they must also be considered highly trustworthy amongst SRWTC members. A high level of trust is necessary as the task force members are responsible for helping to select the TIF
option that will most benefit the SRWTC and communicating clearly, and effectively, with coalition members and their respective communities.
If this water trail TIF is successful, SRWTC’s efforts could set a precedent for the use of TIFs for water trails and recreation at the national scale, and therefore, the Task Force members will play a vital role in making this become a reality. They will essentially be the “early adopters,” and therefore, the ambassadors for adopting the TIF. They should be well-versed in all aspects of the water trail TIF, including supportive arguments for different communities, depending on the community’s level of interest, existing Coalition involvement, tax base, the potential to benefit, and so on.
3. INVOLVE STAKEHOLDERS IN TIF SELECTION
Community engagement and participation are critical parts of any planning process. The Coalition should aim to include a variety of stakeholders in its eventual decision regarding the type of water trail TIF to be used. Beyond current organizational and municipal members of the coalition, residents of the 22 municipalities that would be directly affected by the creation of a water trail TIF should be included in the decision-making process. Residents should be fully informed about the issue, and communication should be transparent. The data and information presented in this report may be used to educate residents on the problem and proposed solutions.
Soliciting feedback from the public can include a variety of techniques and tools, such as the following:
• Surveys
• Community meetings
• Focus group discussions
• Charettes
• Social media
These events should not only inform the community members about the TIF options but allow ample opportunities for comments
104
and feedback. Recording and documenting this feedback will help inform the decision process and maintain accountability.
Scheduled events like group paddles would be great opportunities to discuss TIF options with local users or pass out a survey. Additionally, many coalition members hold their own events like stream monitoring, clean-up events, group paddling sessions, and more. Leveraging the relationships with coalition members, the SRWTC may also delegate community engagement tasks and disperse information through other organizations and leaders within the communities. The addition of a designated contact person for different sections of the river can add a personal connection as it can ensure quick and accurate responses to suggestions, concerns, and other comments. Finally, it is vital to recognize that the SRWTC should be prepared to respond to and act meaningfully upon any and all feedback it receives from these various outreach and engagement efforts; failing to do so often yields frustration and disinvestment among the community, outcomes that are worse than had stakeholders not been engaged at all.
4. DEVELOP LEGISLATIVE STRATEGY
Given the four TIF structure options outlined above, the Coalition’s TIF Task Force must decide which TIF structure to pursue. Their decision should consider the input from the Coalition and community members as well as the strengths, weaknesses, opportunities, and threats as laid out in the Analysis section of this report. Additionally, special attention should be paid to which TIF allows for the most equitable use of TIF funds.
The type of TIF will determine the legislative reforms needed to pass through the Michigan Legislature. The four TIF structure option matrix illustrates the intensity of legislative reform, and some specific language is proposed to help guide the Coalition’s future efforts in bringing legislation before the Michigan legislature.
Other considerations for the legislative strategy include:
• Develop supporting documents that clearly illustrate the economic and non-economic benefits of water trails
• Seek out amenable politicians in both the State House and Senate to support and sponsor the legislation
• Prepare initial drafts of the proposed legislative amendments inspired by this study and the input of the TIF task force and stakeholders to carry forward into the Michigan Legislature’s formal legislative drafting process
• Recruit community members as necessary to contact representatives about their support for the bill
5. INCORPORATE EQUITY IN DECISION-MAKING
Moving forward, the SRWTC will likely face arguments about equity as it relates to redistribution and the benefits-received principle. Redistribution, in an abstract sense, is the transfer of income and wealth from some individuals (usually high-income) to others (usually low-income) through a social mechanism such as taxation, welfare, or public services. This could be seen along the river trail through the use of a TIF. Funds generated in high-income communities, such as Fenton Township, could be spent on improvements and amenities in low-income communities, like the Village of Oakley. While some may claim this is fair, there will likely be opponents. Some property owners may argue that fairness is related to what they pay. In other words, money generated from their taxes should be spent in a way that directly benefits them. This line of reasoning would likely hinder improvements along the water trail in municipalities like the Village of Oakley, which only has three parcels along the trail and has some of the lowest socioeconomic indicators. Proponents of the benefits-received principle would argue that if they couldn’t generate funds for improvements, they shouldn’t be added to this section of the river trail. With this in mind, the coalition will need to develop a clear stance and communication strategy with residents.
Another common concern among property owners is that increased investment in green spaces has the possibility of exacerbating
105
inequality by driving up property values. This is known as “green gentrification,” and given the similarities between green and blue spaces, it is likely a phenomenon that can manifest with the redevelopment of blue spaces as well.
Investment in green spaces can also lead to fears that the most change will occur in established wealthy communities. The SRWTC should consider the reality of its rural water trail when choosing future sites for improvement projects such as launches. Some residents may value the undeveloped nature of the trail. For rural communities, increasing communication through mailers and surveys, potentially in coordination with the economic impact study, with river-adjacent landowners could allow for an early warning detection of issues that may arise.
Considering the possibility of TIF funding support, the SRWTC can incorporate equity into how it proposes to manage projects by considering, for example, the revenue generated per river mile, per parcel, and/or per capita in each municipality. With that information, the SRWTC might decide to make programming decisions that reflect various measures of equity to ensure broad acceptance of the fairness of its allocations. The coalition might adjust its budgeting for maintenance and infrastructure, for example, by calibrating its spending on things like mile markers, signage, or rest stops on TIF contributions per river mile.
Another aspect where equity should be considered is in selecting the TIF. The unitary TIF would allow for the greatest redistribution of wealth along the length of the water trail, and the singlejurisdictional TIF would be limited in this aspect. However, care should be taken if considering the county and multi-jurisdictional TIF structures as certain counties or groupings of municipalities may benefit more than others by generating greater TIF revenues. For the multi-jurisdictional approach, SRWTC and the engaged municipalities should consider grouping themselves to optimize for equitable distribution.
6. ADD ADDITIONAL ACCESSIBLE
AMENITIES
The Shiawassee River Water Trail Plan already incorporates a variety of accessibility elements into its schedule of improvements; however, these could be expanded, given the funds generated from a river trail TIF. The original plan was developed with other funding mechanisms in mind, and the proposed TIF and subsequent revenues will allow for more expansive improvements along the water trail.
The types of amenities and where they will be located are critical for buy-in from community members and municipalities. If the coalition aims to increase tourism and access to the river, priority could be given to creating and improving access points that are closer to trail towns, or the more urban hubs of the Shiawassee River, to increase visitor use and the potential economic impacts from visitors. Yet, given the rural nature of many of the communities, the coalition will also want to consider amenities and access points like restrooms in the rural sections as well to avoid trespassing and sanitation concerns of residents. The coalition may also want to examine the locations of the existing 28 access points and plan for new access points in communities that currently do not have one, like the Village of Oakley.
The design of access points matters, and the coalition is already doing a commendable job of including accessible features. For example, the development plan suggests improvements like permanent bathroom facilities and signage for Water Works Park in Holly, the first access site on the water trail. Signage in particular can take many forms, including digital signage and physical signage. Digital information should be easily accessible and include things like route maps; guides; know-before-you-go information about access points, directions, and amenities; and distance to other towns and attractions. Having physical signage with information can also help connect paddlers with non-water-related activities, including access to downtown shopping areas, lodging options, and museums. Incorporating these kinds of universal design features increases accessibility for users of all abilities, but
106
they are also costly. Fortunately, the funds collected from a water trail TIF will provide more opportunities for these kinds of features to be added along the river trail.
A valuable resource for the coalition moving forward is Access Recreation Group’s best practices fact sheet, found in Appendix F, which provides a thoughtful and comprehensive list of design standards that can increase accessibility for all users. The use of these suggestions would enable the trail to have long-term success and produce more positive social and economic outcomes. Some notable accessible design features from the document include:
• Improved surface accessible routes with slopes no greater than 5%
• Gangway and ramp slopes below 8.33%
• Accessible restrooms with at least one universally accessible single-user unisex restroom
• Accessible potable water source
• ADA accessible parking spaces, grills, and picnic tables
• Accessible kayak launch such as the EZ Launch
107
Citations
1. Rivers, Trails, and Conservation Assistance National Park Service, “Economic Impacts Of Protecting Rivers, Trails, And Greenway Corridors: A Resource Book,” 1995, https://www.railstotrails.org/resourcehandler.ashx?id=4250.
2. Rebecca Ellen Nadel, “Economic Impacts of Parks, Rivers, Trails, and Greenways” (Masters Thesis, Ann Arbor, MI, University of Michigan, 2005), http://www.wildonesniagara.com/images/Nadel-2.pdf.
108
(Page Intentionally Left Blank)
109
Appendices
A: GIS ANALYSIS METHODOLOGY
The purpose of the GIS overlay analysis was to analyze the feasibility of implementing a TIF district along the Shiawassee River Water Trail and to support revenue modeling of the proposed TIF district. The following outline describes in detail the steps used to perform the overlay analysis.
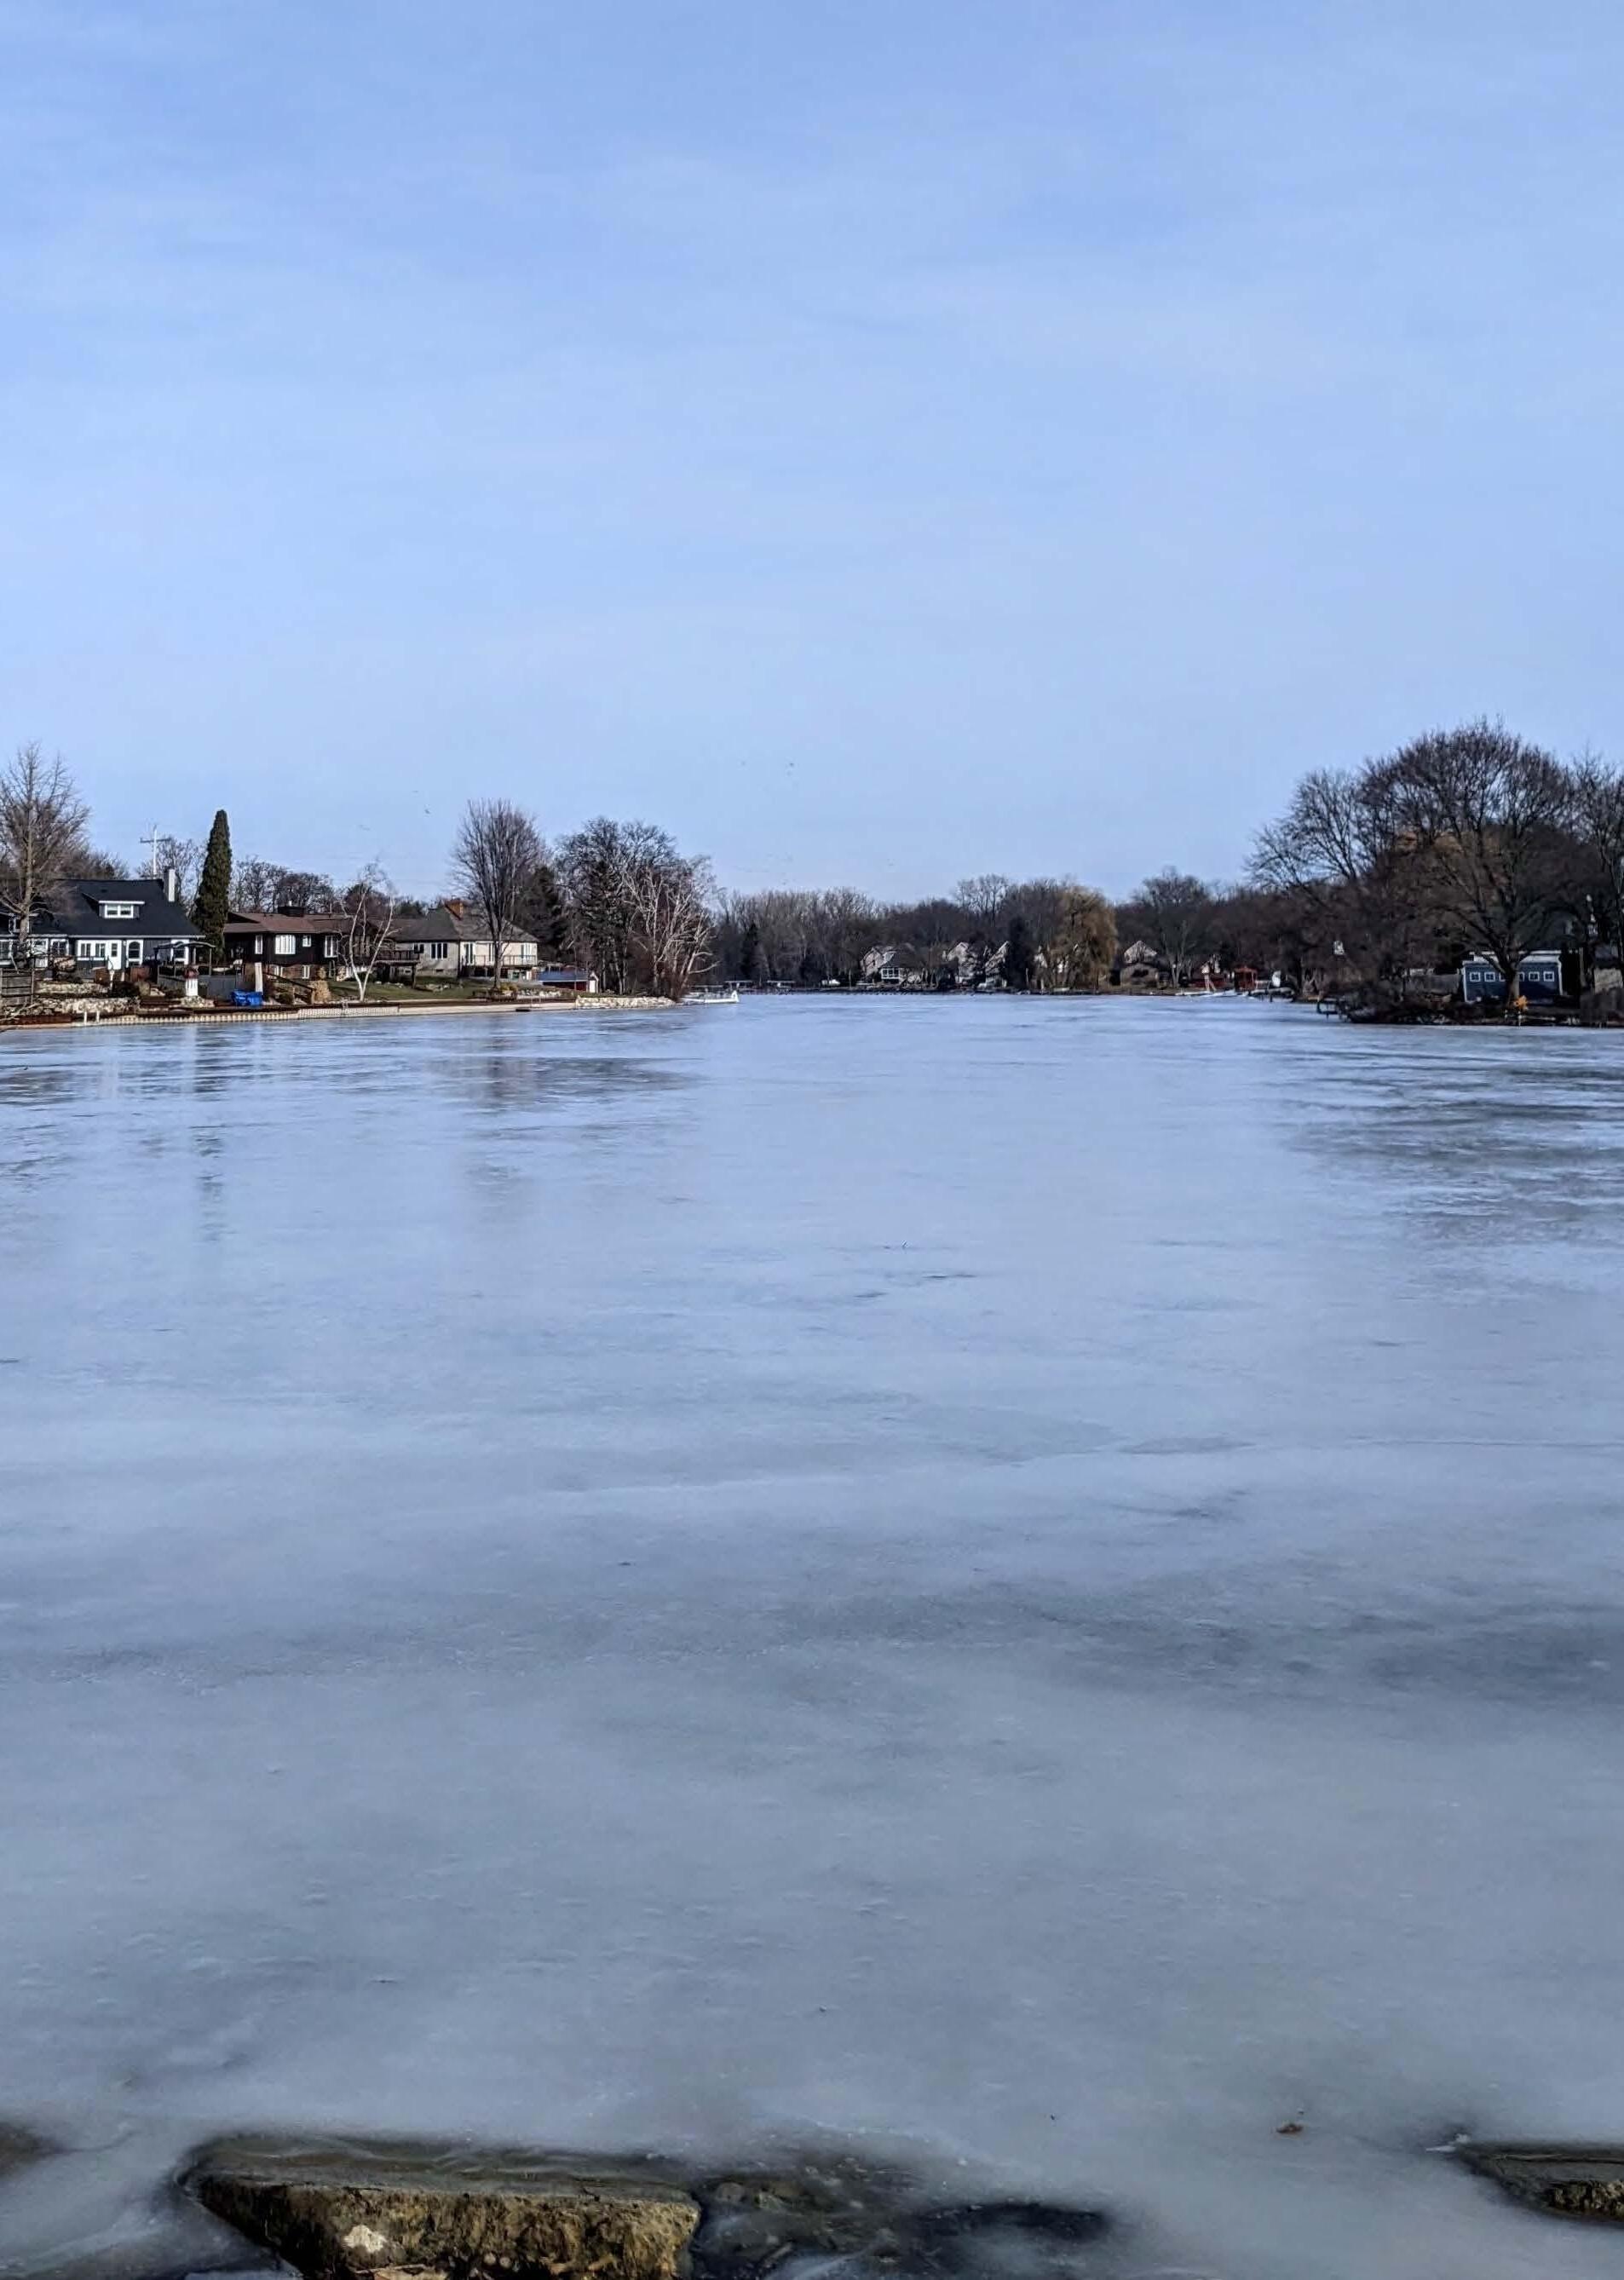
Stage 1: Data Collection
To perform an overlay analysis, data were accessed through opensource and municipal databases. County, village, and minor civil divisions (city and township) shapefiles were downloaded from Michigan’s open data portal, and the boundaries of the Shiawassee River and other water bodies were collected from the National Hydrography Dataset (NHD). The NHD is prepared by the United States Geographical Survey (USGS) and represents United States surface waters using common features such as lakes, ponds, streams, rivers, canals, stream gages, and dams in vector and
110
raster formats. We used the NHD’s vector feature classes for this project. Additionally, Oakland County's parcel boundaries were accessed through Access Oakland, the county’s open data portal.
Accessing non-open source data required correspondence with municipal leaders and GIS departments. Parcel data are often not publicly available and jurisdictions sell this information to supplement revenues. For the common good, jurisdictions may provide data to groups like the Shiawassee River Water Trail Coalition. Under these circumstances, our client and team members requested parcel and existing TIF boundary shapefiles from relevant counties and municipalities. Parcel shapefiles were received via email for Shiawassee County, Genesee County, and Saginaw County, as well as the Village of Holly Downtown Development Authority (DDA), the City of Linden DDA, the City of Fenton DDA and Local Development Finance Authority (LFDA), the City of Owosso DDA, the City of Fenton Brownfield Redevelopment Authority (BRA), and the City of Owosso BRA.
Four geospatial datasets could not be collected: the Village of Byron DDA, the Village of Vernon DDA, the Village of Chesaning DDA, and the City of Corunna DDA. Municipal contacts did not respond to our requests for the data; however, given that the establishment of a TIF district requires a development plan, which includes a map of the TIF district boundary, this issue was overcome by manually digitizing the DDA boundaries for the missing data using existing maps.
Stage 2: Preparing Data for Analysis
After gathering the necessary datasets, the data were cleaned in preparation for analysis, beginning with the NHD shapefile. Using ArcGIS Pro software, the Shiawassee River was selected from the NHD dataset and a new layer was created from that selection. Sections of the Shiawassee River not part of the water trail were manually deleted from the Shiawassee River layer, including specifically the section where the Shiawassee River forks in the Village of Vernon. Additionally, sections of the river that were not digitized in the original NHD dataset, likely due to the narrowness of the river at certain points along the trail, were manually digitized using the ESRI topographic base map and parcel boundaries as a reference. The Merge geoprocessing tool was used to combine the river polygons into one polygon feature.
The final Shiawassee River layer was then used to clean the Oakland County and Shiawassee County parcel datasets. These datasets include all parcels in the entire county, so we used the Select by Location tool to isolate parcels adjacent to the water trail. We then made a new layer from this selection of all parcels within 50 feet of the Shiawassee River.
The next step was to triangulate the geospatial and tabular data using a variety of resources, including PDF maps of the potential water trail TIF district from Oakland, Genesee, Shiawassee, and Saginaw Counties. These maps include all parcels along the Shiawassee River but exclude or do not consider parcels in existing TIF districts. (See table 28 for list of currently ineligible parcels) Spreadsheets prepared and provided by county officials also include the parcel number, address, property class, assessed value, taxable value, and a variety of other information allowing the calculation of revenues from the proposed water trail TIF district. However, these spreadsheets required some cleaning to maximize utility. For example, some parcels were counted twice and therefore skewed total revenues for each county. All duplicate parcels were deleted to ensure each parcel was calculated only once. Additionally, some parcels adjacent to the water trail were missing, while other parcels not adjacent to the trail were included. To ensure accuracy, Regrid, a national property data and spatial data resource, was used to review each parcel and determine whether it should be included in the TIF district. Parcels were either added or deleted based on whether they were directly adjacent to the Shiawassee River or a connected water body. All county parcel data were reviewed for inclusion.
The data were then transformed into polygon form for consistency. The City of Fenton’s DDA and LDFA data were originally presented as line features, so the Feature to Polygon tool was used to transform these data into polygons.
111
Stage 3: GIS Overlay Analysis
To finally perform the overlay analysis, all necessary feature layers were added to the respective county and municipality maps. The Select by Location tool was used to select all parcels along the Shiawassee River Water Trail that were already within an existing TIF district. A new layer was created from each selection to represent the parcels that overlapped. These new layers were then combined into one using the Merge tool. Parcels eligible for inclusion in the water trail TIF were indicated using blue diagonals, and parcels along the water trail but already included in an existing TIF are represented by the color yellow, as seen in Chapter 4 and Appendix B.
Municipality (Cont.) TIF District (Cont.) Parcel Number (Cont.)
112 Municipality TIF District Parcel Number Village of Holly Holly DDA 0133479004 Village of Holly Holly DDA 0134354001 Village of Holly Holly DDA 0134357001 Village of Holly Holly DDA 0134354002 Village of Holly Holly DDA 0134357003 Village of Holly Holly DDA 0134357002 Village of Holly Holly DDA 0134358007 Village of Holly Holly DDA 0134357004 City of Linden Linden DDA 61-20-552-117 City of Linden Linden DDA 61-20-551-041 City of Linden Linden DDA 61-20-551-055 City of Linden Linden DDA 61-20-551-039 City of Linden Linden DDA 61-20-551-040 City of Linden Linden DDA 61-20-551-038
City of Linden Linden DDA 61-20-552-155 City of Linden Linden DDA 61-20-300-007 City of Linden Linden DDA 61-20-551-035 City of Linden Linden DDA 61-20-551-032 City of Linden Linden DDA 61-19-400-010 City of Linden Linden DDA 61-19-400-009 City of Linden Linden DDA 61-19-400-001 City of Fenton Fenton BRA 53-25-606-COM City of Fenton Fenton DDA 53-36-506-203 City of Fenton Fenton DDA 53-25-556-014 City of Fenton Fenton DDA 53-25-556-015 City of Fenton Fenton DDA 53-25-556-016 City of Fenton Fenton DDA 53-25-556-017 City of Fenton Fenton DDA 53-25-515-066 City of Fenton Fenton DDA 53-25-515-028 City of Fenton Fenton DDA 53-25-515-014 City of Fenton Fenton DDA 53-25-515-015 City of Fenton Fenton DDA 53-25-515-016 City of Fenton Fenton DDA 53-25-515-018 City of Fenton Fenton DDA 53-25-515-060 City of Fenton Fenton DDA 53-25-515-020 City of Fenton Fenton DDA 53-26-576-062 City of Fenton Fenton DDA 53-26-576-063 City of Fenton Fenton DDA 53-25-515-025
Table 29: Parcels Currently Ineligible in an SRWT TID
Municipality (Cont.) TIF District (Cont.) Parcel Number (Cont.) City of Fenton Fenton DDA 53-26-576-059 City of Fenton Fenton DDA 53-26-576-057 City of Fenton Fenton DDA 53-26-576-058 City of Fenton Fenton DDA 53-25-515-027 City of Fenton Fenton DDA 53-36-506-019 City of Fenton Fenton DDA 53-35-530-080 City of Fenton Fenton DDA 53-36-506-020 City of Fenton Fenton DDA 53-36-506-021 City of Fenton Fenton DDA 53-35-527-035 City of Fenton Fenton DDA 53-36-506-030 City of Fenton Fenton DDA 53-35-527-034 City of Fenton Fenton DDA 53-35-527-033 City of Fenton Fenton DDA 53-36-506-075 City of Fenton Fenton DDA 53-36-502-037 City of Fenton Fenton DDA 53-36-506-221 City of Fenton Fenton DDA 53-36-506-069 City of Fenton Fenton DDA 53-36-506-074 City of Fenton Fenton DDA 53-36-506-200 City of Fenton Fenton DDA 53-36-506-073 City of Fenton Fenton DDA 53-36-506-082 City of Fenton Fenton DDA 53-36-502-052 City of Fenton Fenton DDA 53-36-506-090 City of Fenton Fenton DDA 53-36-506-091 City of Fenton Fenton DDA 53-36-506-092 Municipality (Cont.) TIF District (Cont.) Parcel Number (Cont.) City of Fenton Fenton DDA 53-36-506-093 City of Fenton Fenton DDA 53-36-506-085 City of Fenton Fenton DDA 53-36-506-084 City of CorunnaCorunna DDA 026-12-010-001 City of CorunnaCorunna DDA 026-12-010-003 City of CorunnaCorunna DDA 026-50-030-000 City of CorunnaCorunna DDA 026-50-023-000 City of CorunnaCorunna DDA 026-50-028-000 City of CorunnaCorunna DDA 026-50-029-000 City of CorunnaCorunna DDA 026-70-072-000 City of CorunnaCorunna DDA 026-50-031-000 City of CorunnaCorunna DDA 026-50-027-000 City of CorunnaCorunna DDA 026-12-016-001 City of CorunnaCorunna DDA 026-12-014-007 City of CorunnaCorunna DDA 026-12-010-002 City of CorunnaCorunna DDA 026-10-003-003 City of CorunnaCorunna DDA 026-10-003-007 City of CorunnaCorunna DDA 026-10-004-001 City of CorunnaCorunna DDA 026-10-004-000-01 City of CorunnaCorunna DDA 026-10-004-000 City of Owosso Owosso BRA 050-470-000-002-00 City of Owosso Owosso BRA 050-470-024-001-00 City of Owosso Owosso DDA 050-680-001-001-00 City of Owosso Owosso DDA 050-651-000-001-00 113
Municipality (Cont.) TIF District (Cont.) Parcel Number (Cont.)
Municipality (Cont.) TIF District (Cont.) Parcel Number (Cont.)
Village of Byron Bryon DDA 016-60-015-018
Village of Byron Bryon DDA 016-60-015-004
Village of Byron Bryon DDA 016-60-015-002
Village of Byron Bryon DDA 016-60-015-005
Village of Byron Bryon DDA 016-60-015-005
Village of Byron Bryon DDA 016-60-015-006
Village of Byron Bryon DDA 016-60-015-007
Village of Byron Bryon DDA 016-60-015-012
Village of Byron Bryon DDA 016-60-015-011
Village of Byron Bryon DDA 016-60-015-013
Village of Byron Bryon DDA 016-60-015-014
Village of Byron Bryon DDA 016-60-015-015
Village of Byron Bryon DDA 016-60-015-016
Village of Byron Bryon DDA 016-60-015-017
Village of Byron Bryon DDA 016-60-022-001
Village of Byron Bryon DDA 016-60-022-002
Village of Byron Bryon DDA 016-60-022-003
Village of Byron Bryon DDA 016-66-059-000
Village of Byron Bryon DDA 016-66-021-000
Village of Byron Bryon DDA 016-66-037-000
Village of Byron Bryon DDA 016-60-015-008
Village of Byron Bryon DDA 016-60-015-009
Village of Byron Bryon DDA 016-60-015-008-03
Village of Byron Bryon DDA 016-60-015-001
Village of Byron Bryon DDA 016-60-015-003
City of Owosso Owosso DDA 050-651-000-003-00 City of Owosso Owosso DDA 050-651-000-032-00 City of Owosso Owosso DDA 050-651-002-005-00 City of Owosso Owosso DDA 050-651-002-001-00 City of Owosso Owosso DDA 050-542-000-050-00 City of Owosso Owosso DDA 050-470-038-003-00 City of Owosso Owosso DDA 050-470-038-002-00 City of Owosso Owosso DDA 050-120-002-008-00 City of Owosso Owosso DDA 050-470-000-001-00 City of Owosso Owosso DDA 050-470-000-005-00 City of Owosso Owosso DDA 050-651-012-001-00 City of Owosso Owosso DDA 050-470-000-009-00 City of Owosso Owosso DDA 050-470-000-010-00 City of Owosso Owosso DDA 050-470-000-012-00 City of Owosso Owosso DDA 050-470-000-011-00
DDA
Village of Byron Bryon DDA 016-62-000-003 Village of Byron Bryon DDA 016-61-003-001 Village of Byron Bryon DDA 016-66-045-000 Village of Byron Bryon DDA 016-60-004-004 Village of Byron Bryon DDA 016-66-060-000 Village of Byron Bryon DDA 016-60-004-001 Village of Byron Bryon DDA 016-60-004-005
City of Owosso Owosso
050-470-028-012-00
114
Municipality (Cont.) TIF District (Cont.) Parcel Number (Cont.) Village of Byron Bryon DDA 016-66-064-000 Village of Chesaning Chesaning DDA 13-09-3-16-0236-800 Village of Chesaning Chesaning DDA 13-09-3-16-0236-700 Village of Chesaning Chesaning DDA 13-09-3-16-0197-000 Village of Chesaning Chesaning DDA 13-09-3-16-0190-000 Village of Chesaning Chesaning DDA 13-09-3-16-1610-000 Village of Chesaning Chesaning DDA 13-09-3-16-0193-000 Village of Chesaning Chesaning DDA 13-09-3-16-0198-001 Village of Chesaning Chesaning DDA 13-09-3-16-0235-000 Village of Chesaning Chesaning DDA 13-09-3-16-0234-000 Village of Chesaning Chesaning DDA 13-09-3-16-0198-000 115
B: SHIAWASSEE RIVER WATER TRAIL TIF MAPS BY JURISDICTION
On the following pages are maps of each municipality and county that have waterfront parcels on the Shiawassee River Water Trail. In each of these maps, parcels indicated with blue hatches are parcels adjacent to the river trail. Areas shown in varying shades of green or brown are the boundaries of existing TIF districts like DDAs, LFDAs, and BRAs. The parcels highlighted in yellow are the result of the overlay analysis and indicate which parcels are adjacent to the Shiawassee River Water Trail and already incorporated within existing TIF districts. The yellow parcels are currently ineligible for capture in a river trail TIF.
116
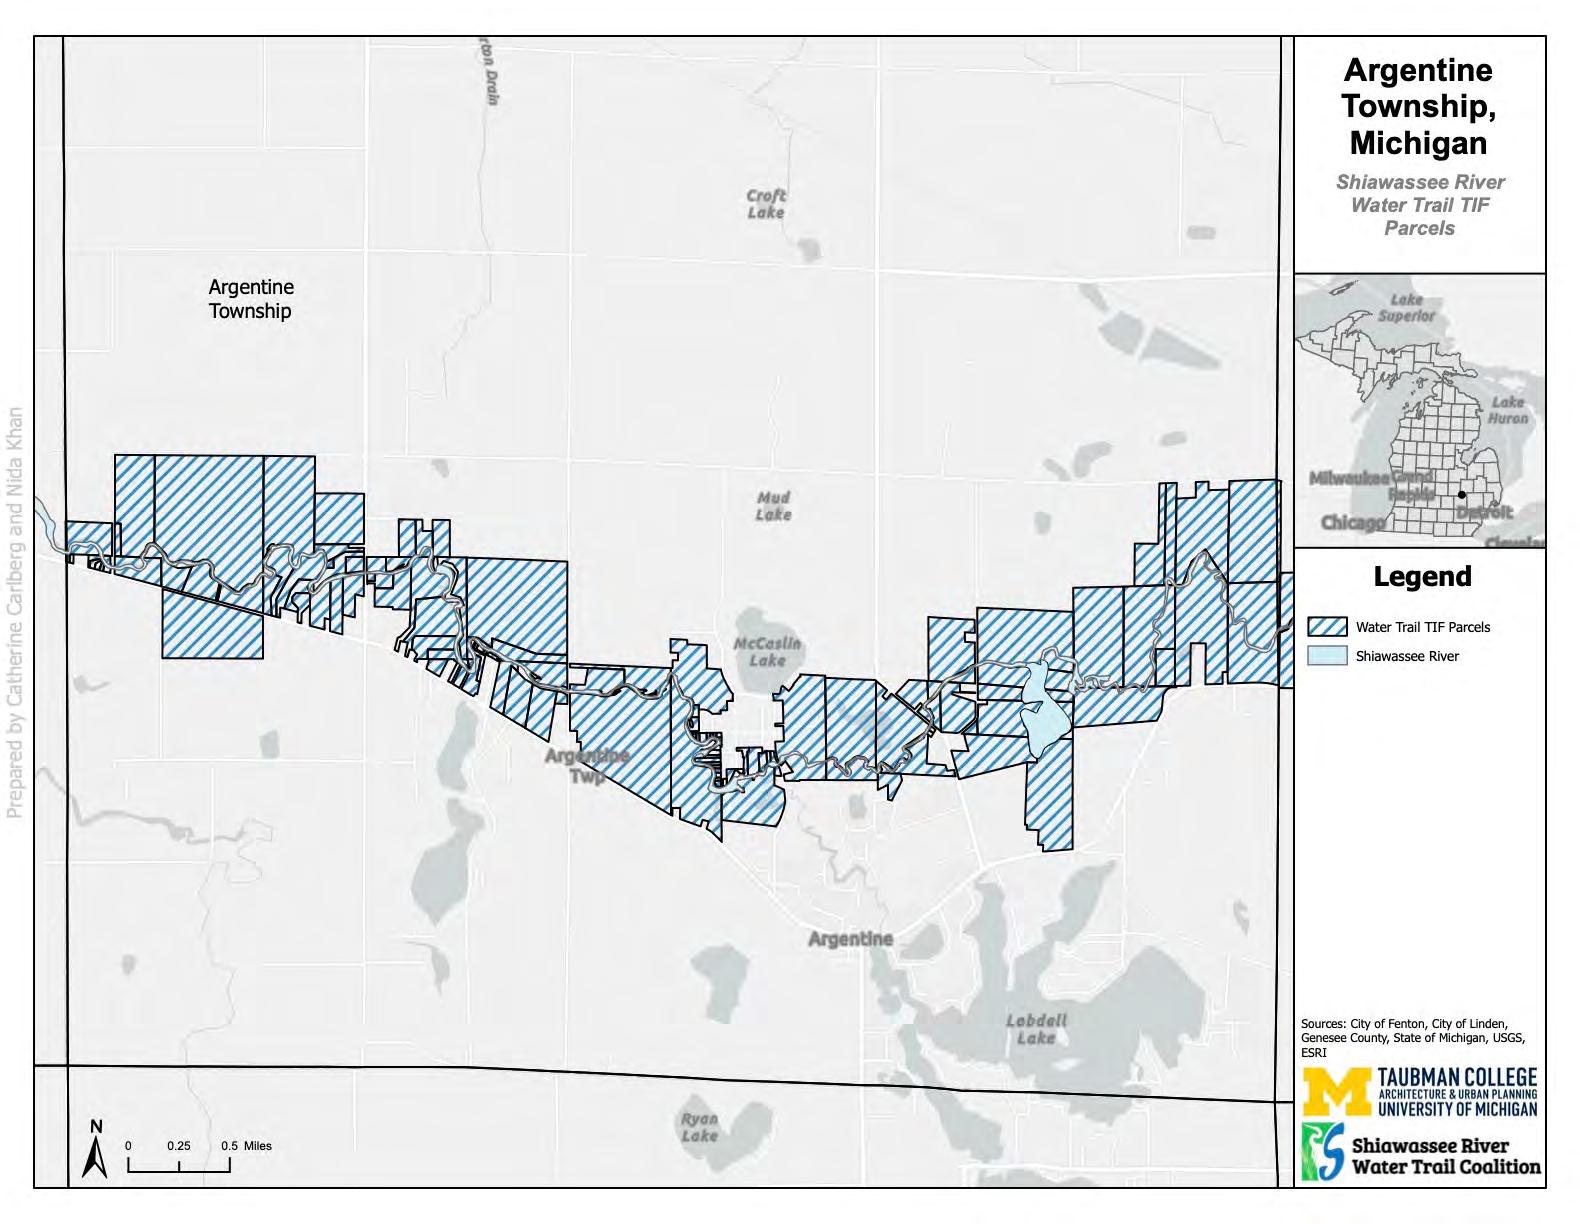
117
Figure 15: Map of Argentine Township Parcels
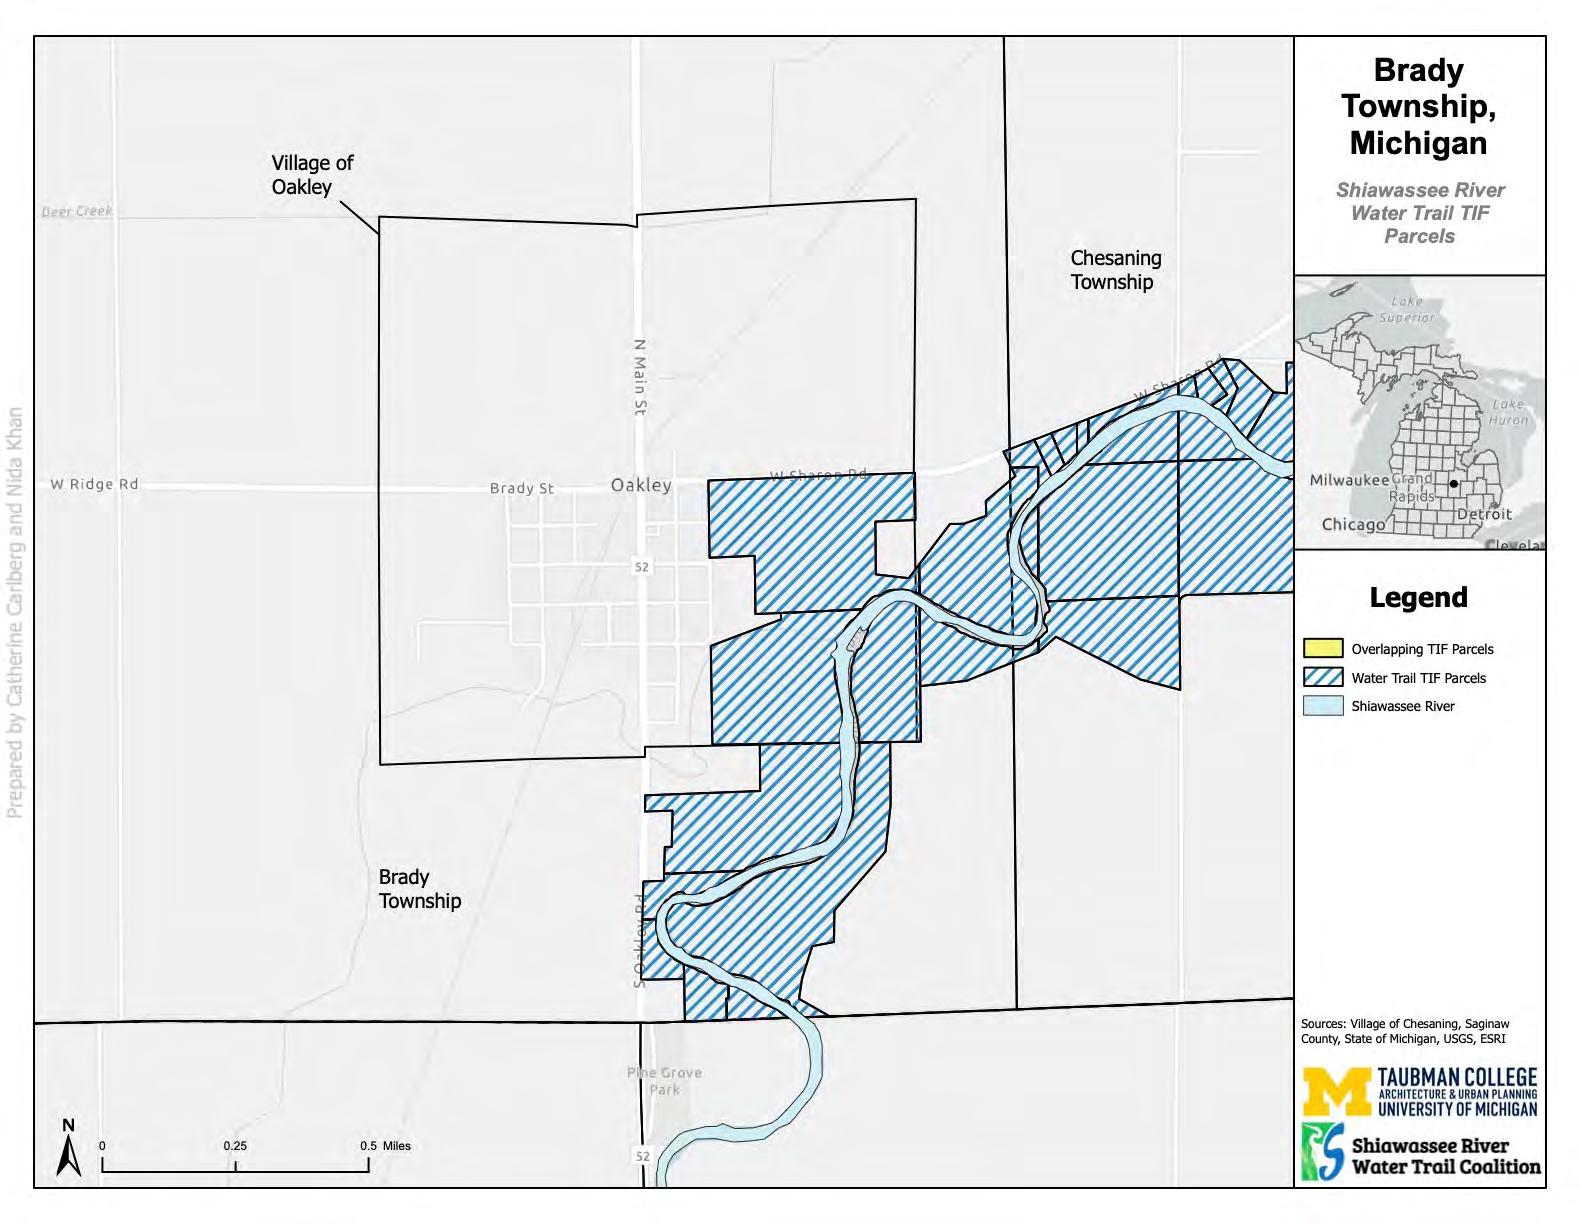
118
Figure 16: Map of Brady Township Parcels
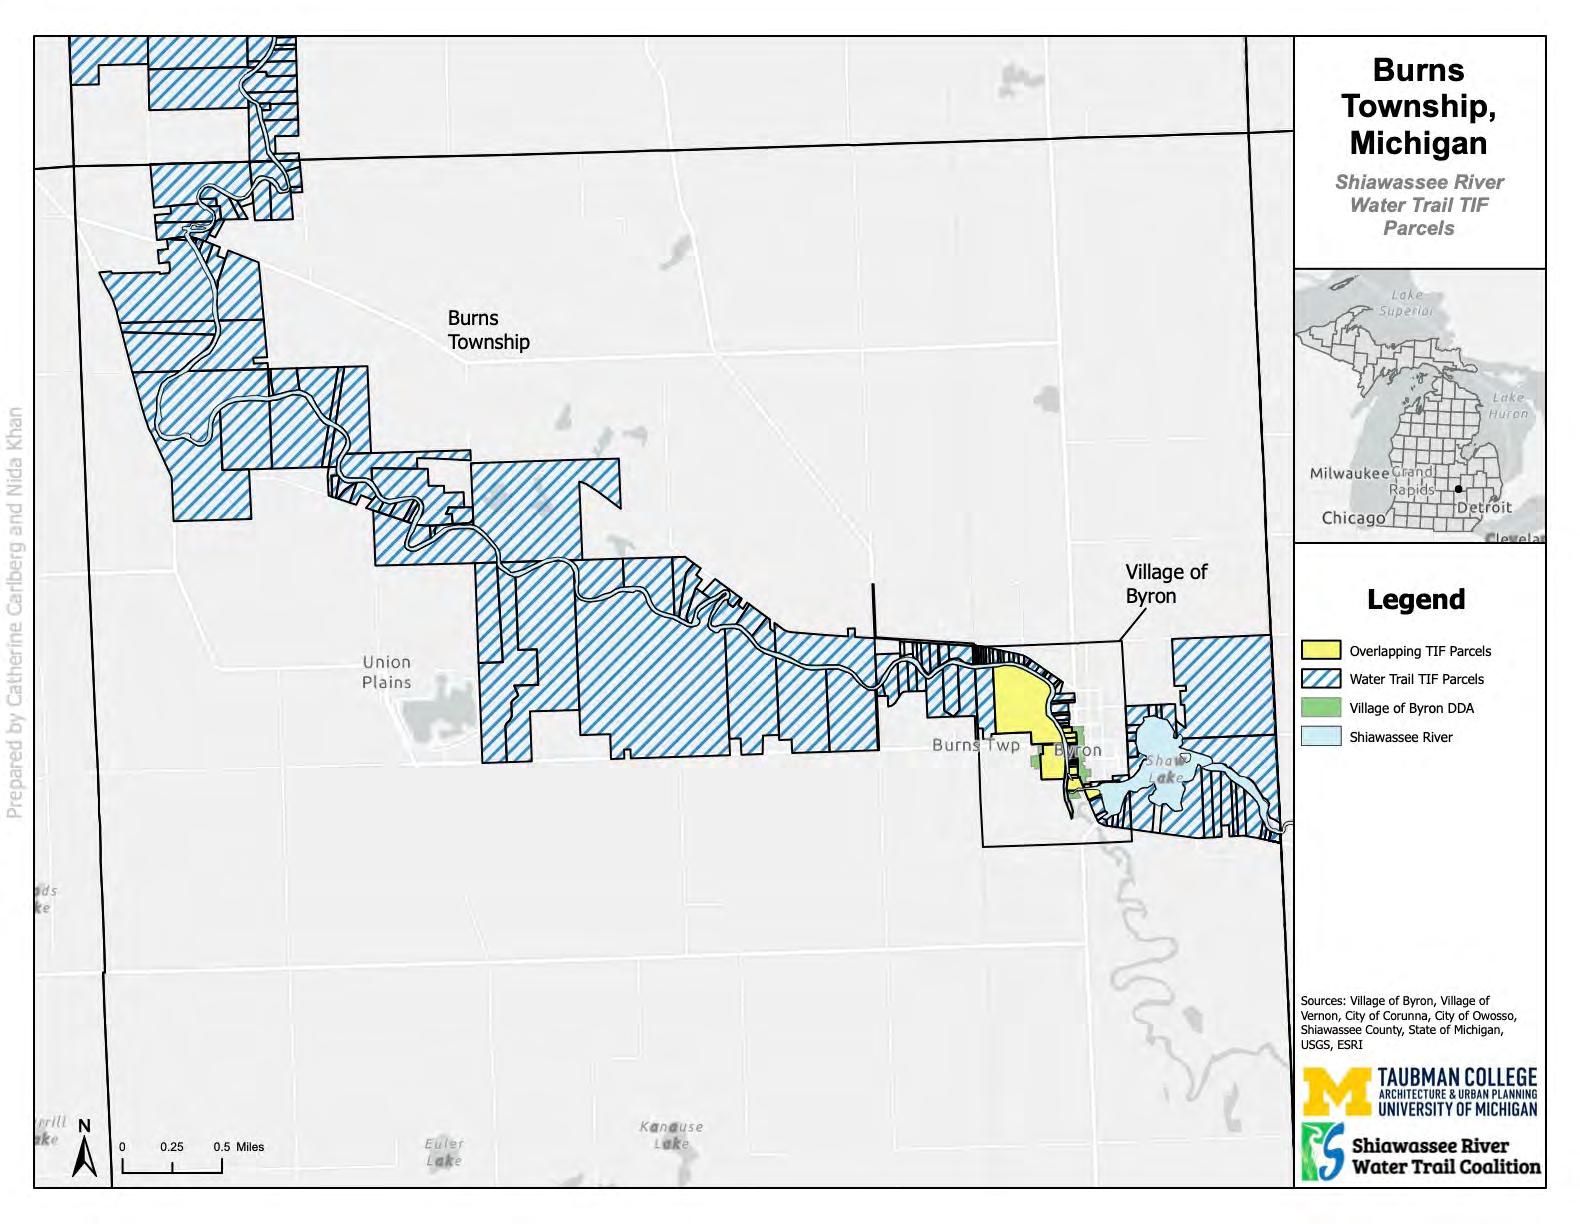
119
Figure 17: Map of Burns Township Parcels
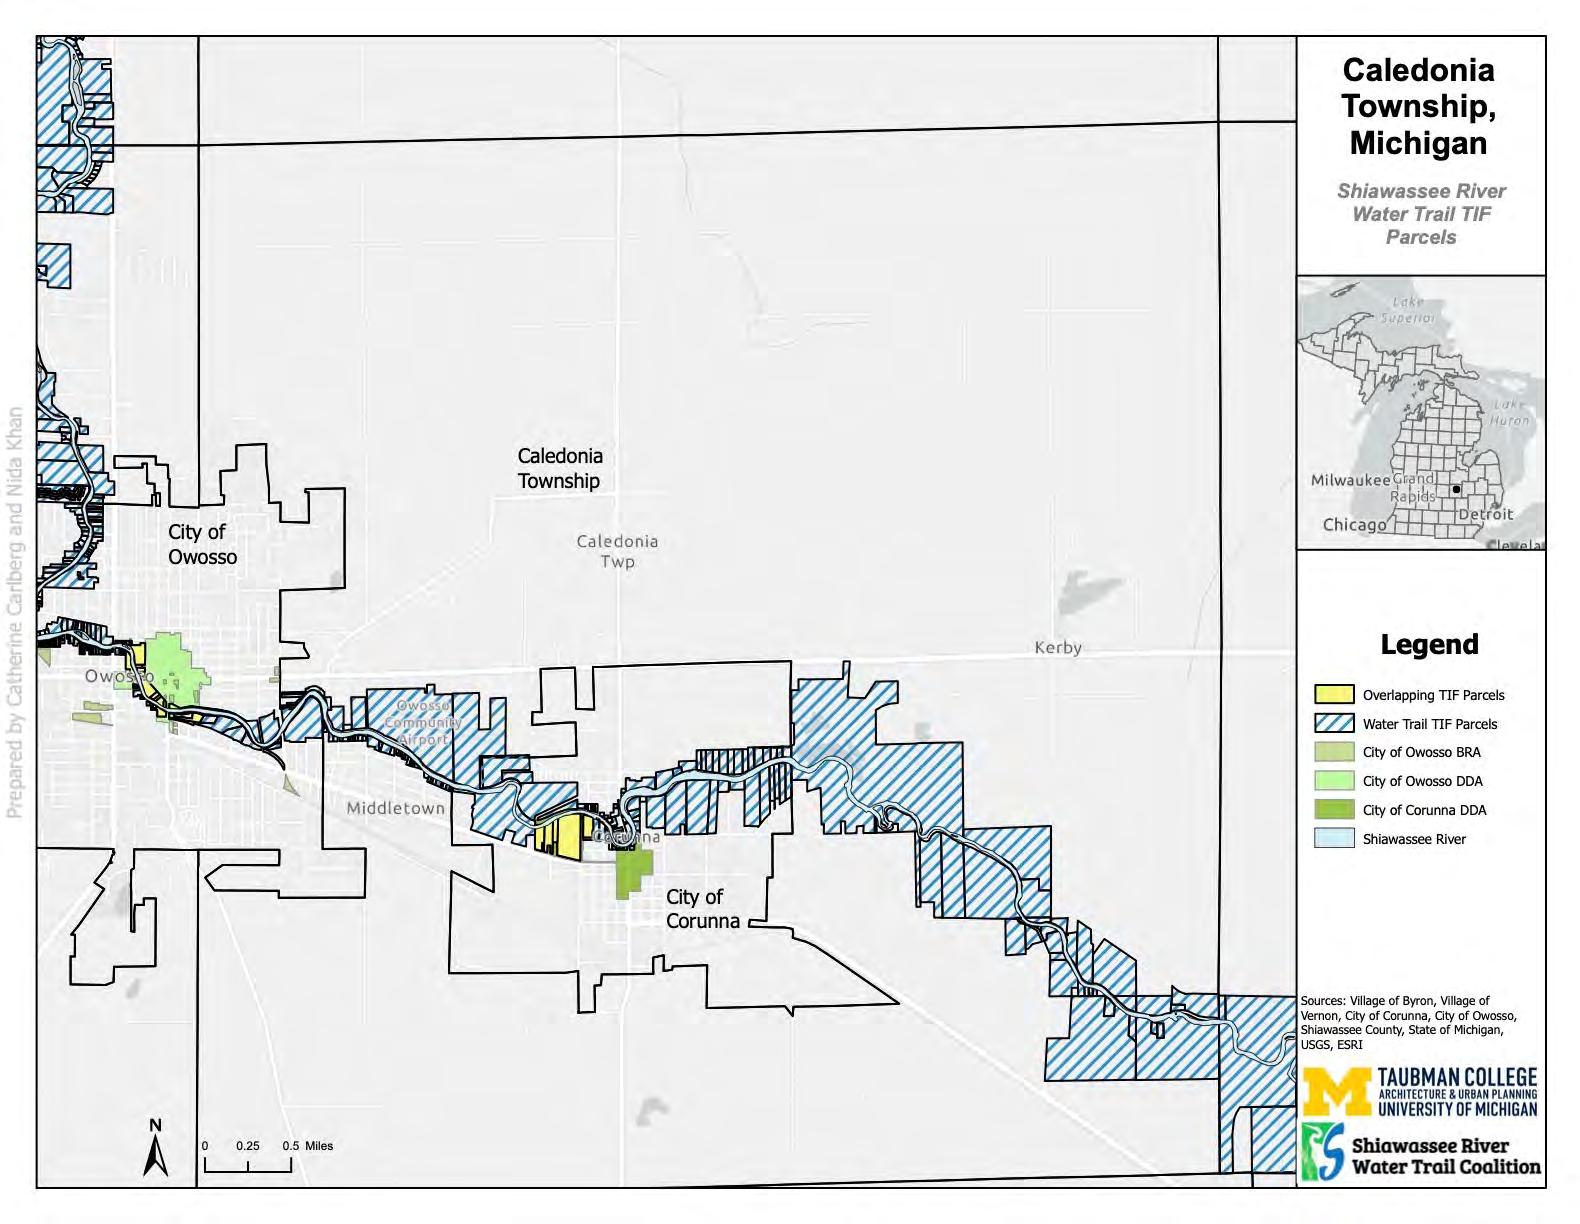
120
Figure 18: Map of Caledonia Township Parcels
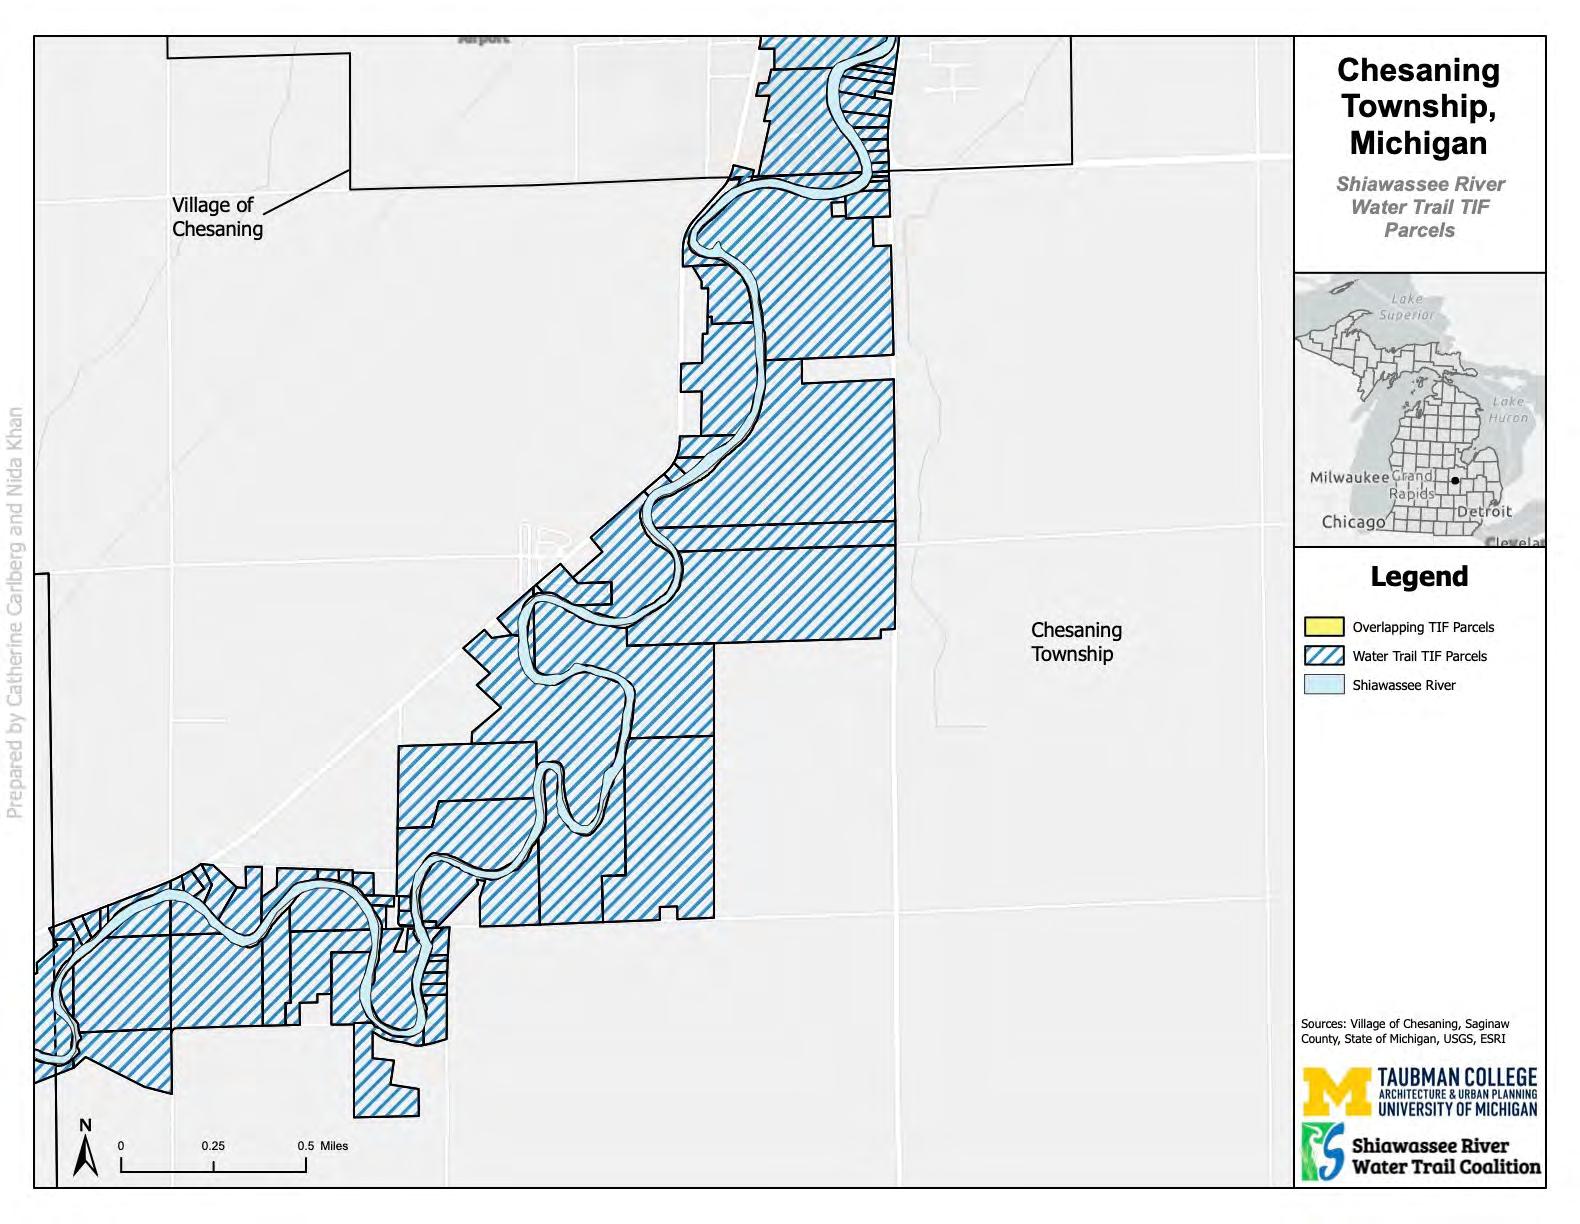
121
Figure 19: Map of Chesaning Township Parcels
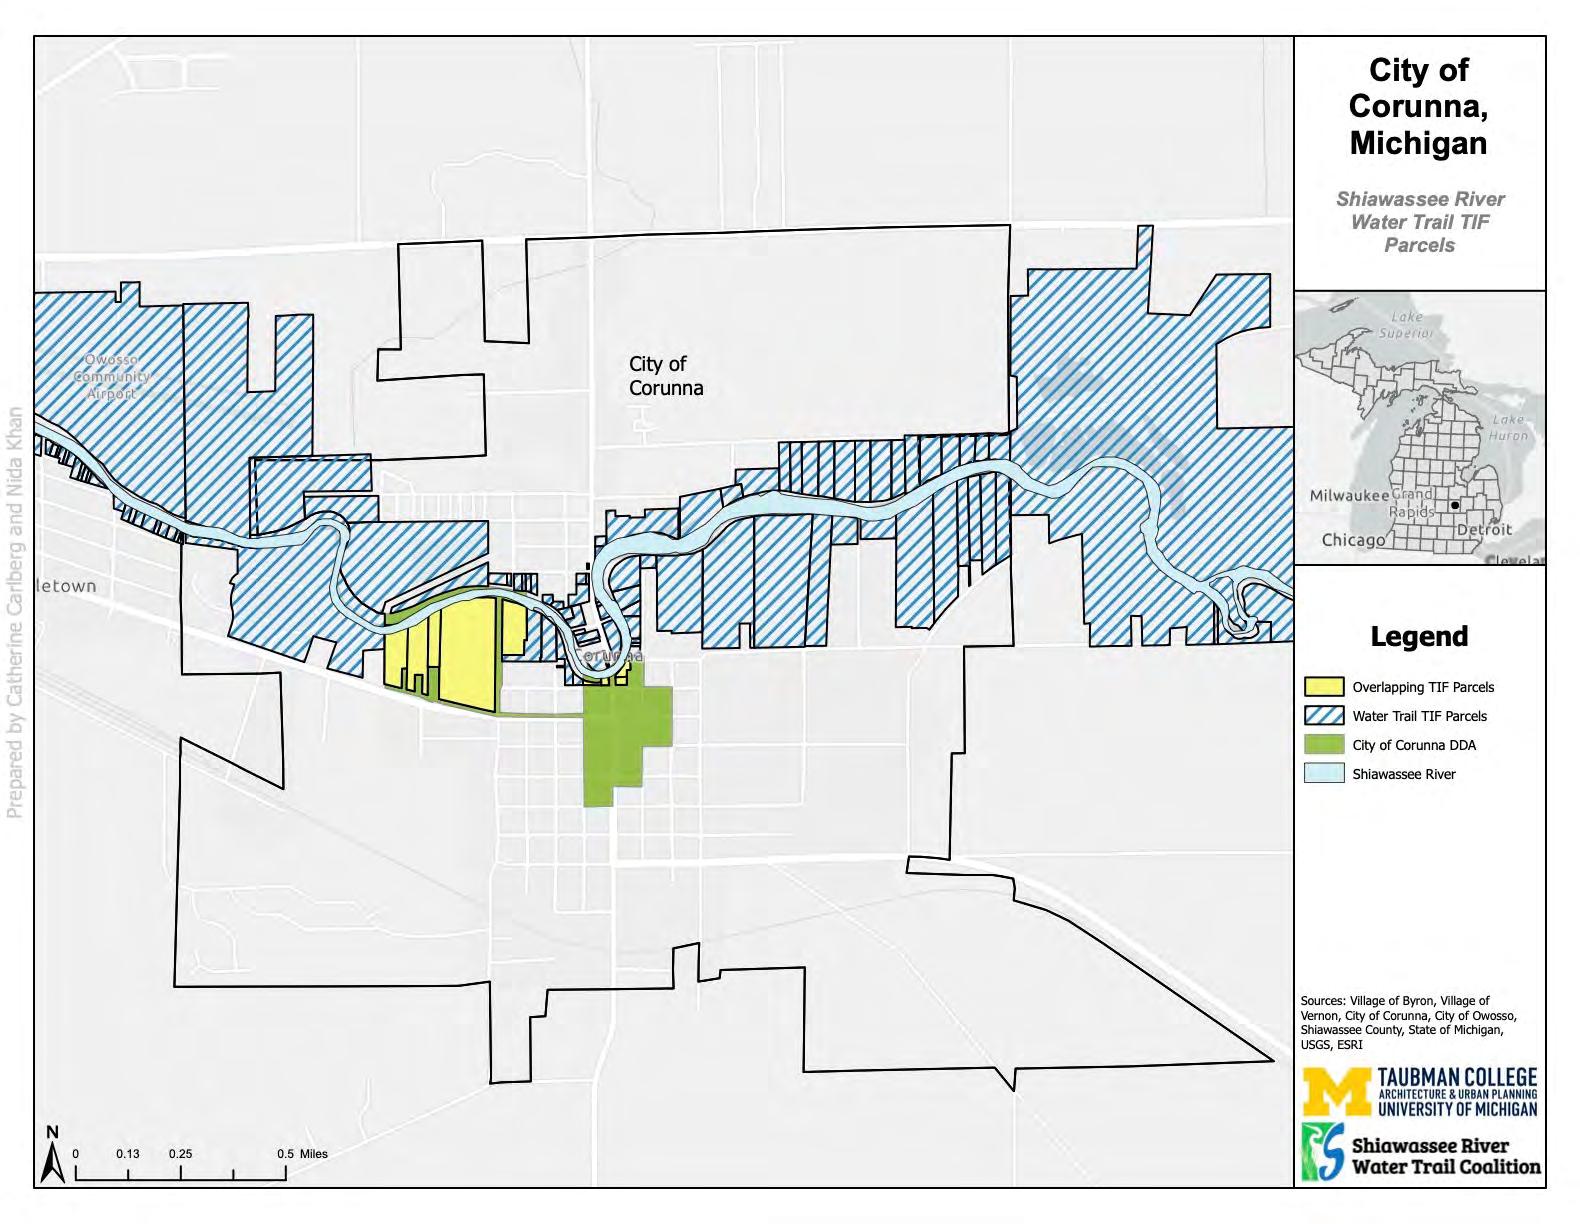
122
Figure 20: Map of City of Corunna Parcels

123
Figure 21: Map of City of Fenton Parcels
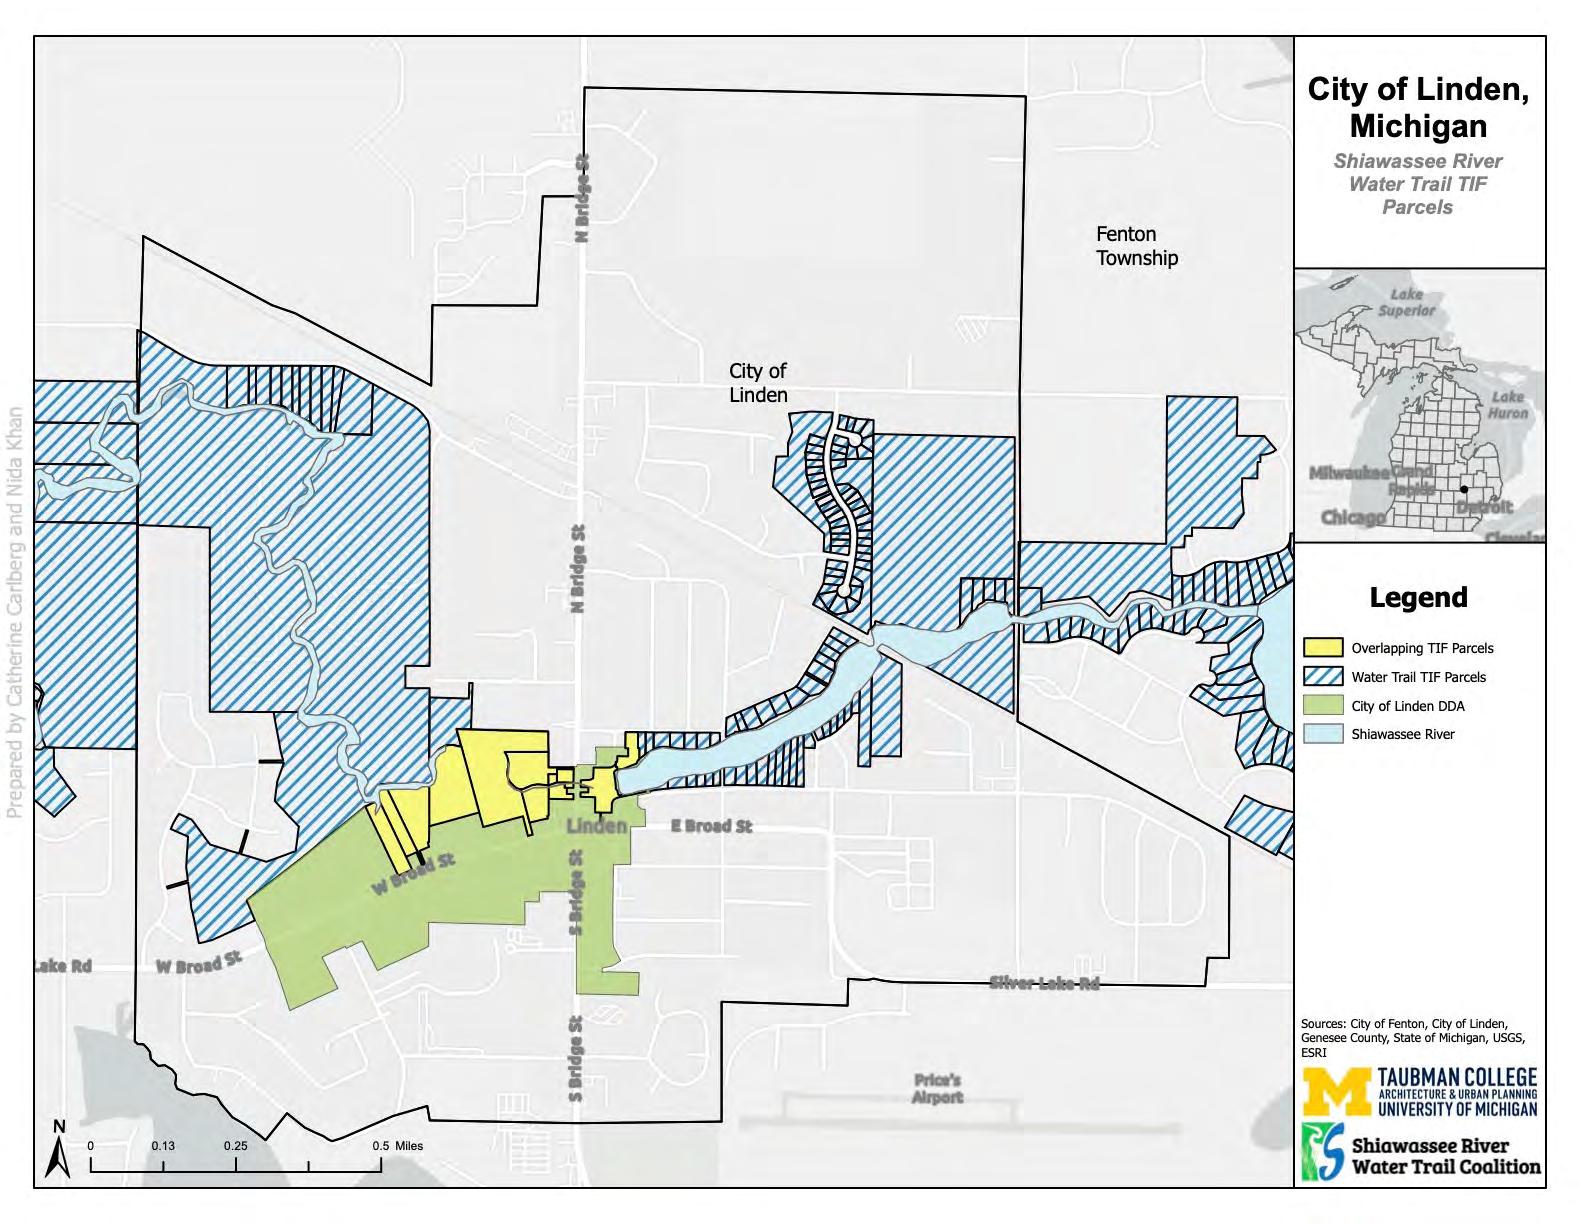
124
Figure 22: Map of City of Linden Parcels
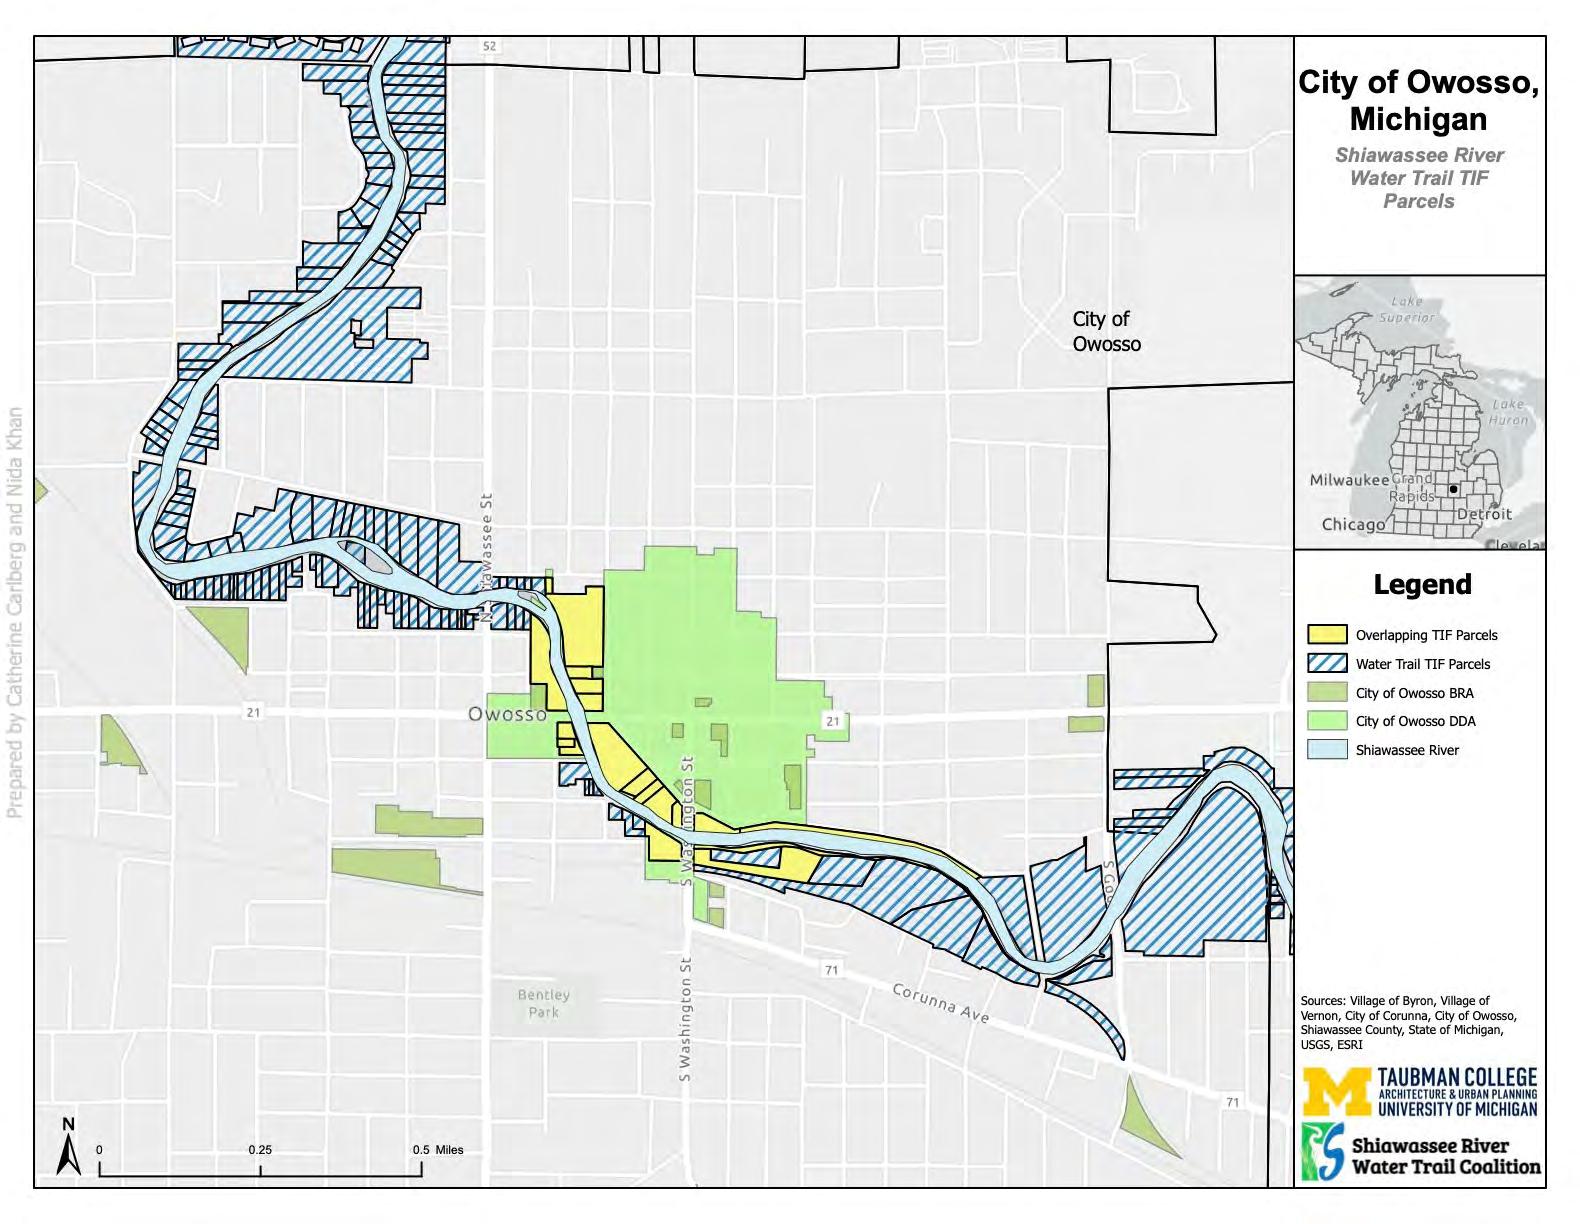
125
Figure 23: Map of City of Owosso Parcels
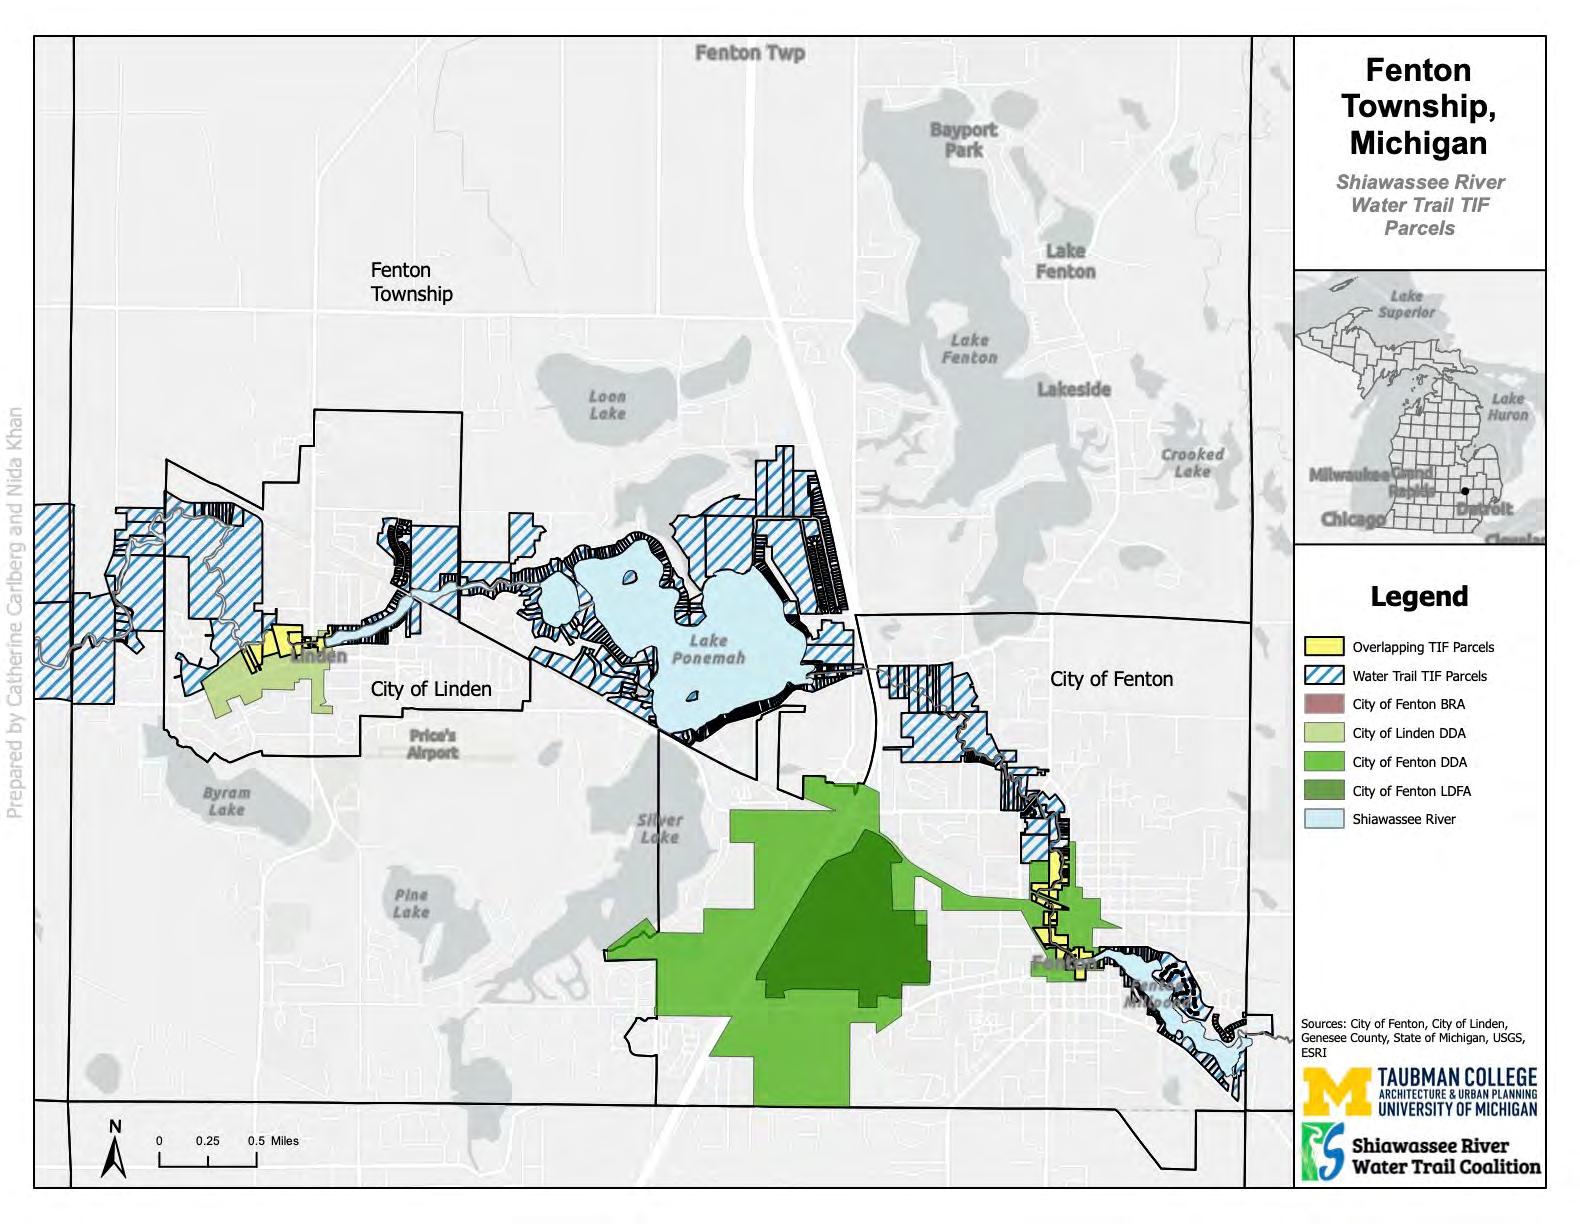
126
Figure 24: Map of Fenton Township Parcels
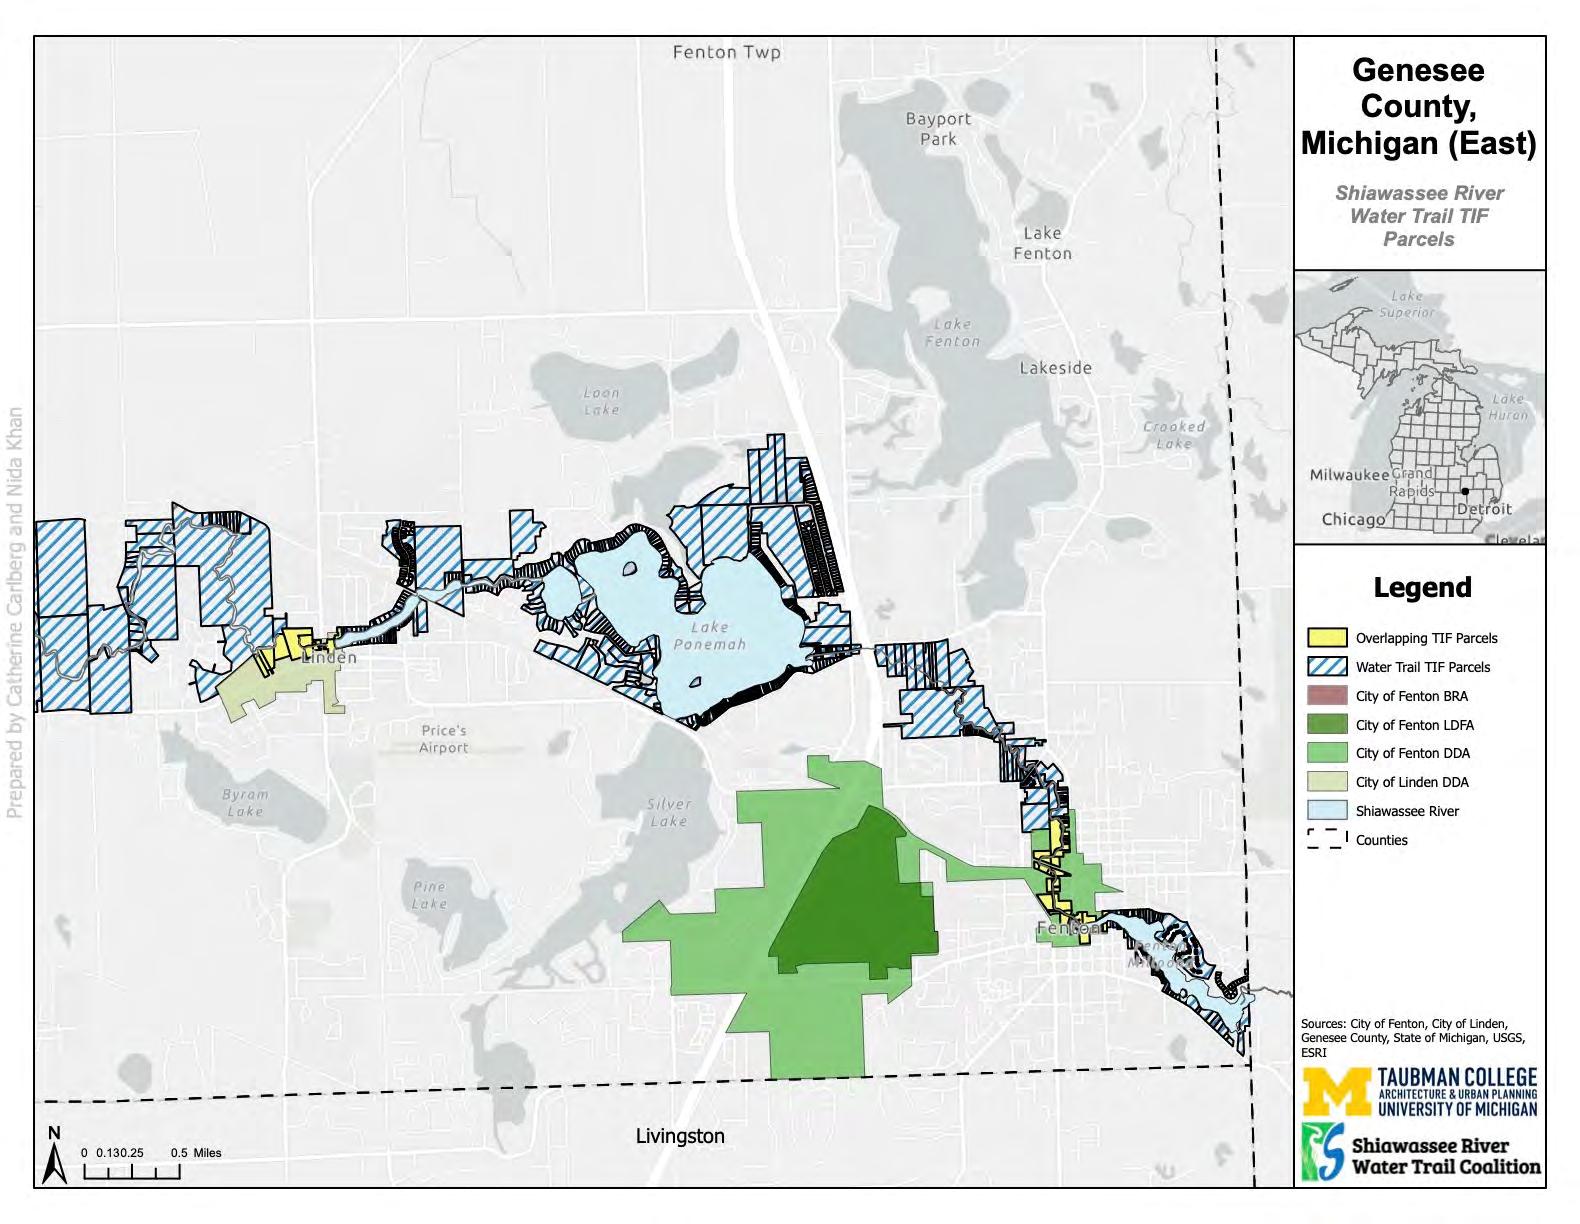
127
Figure 25: Map of Genesee County (East) Parcels

128
Figure 26: Map of Genesee County (West) Parcels
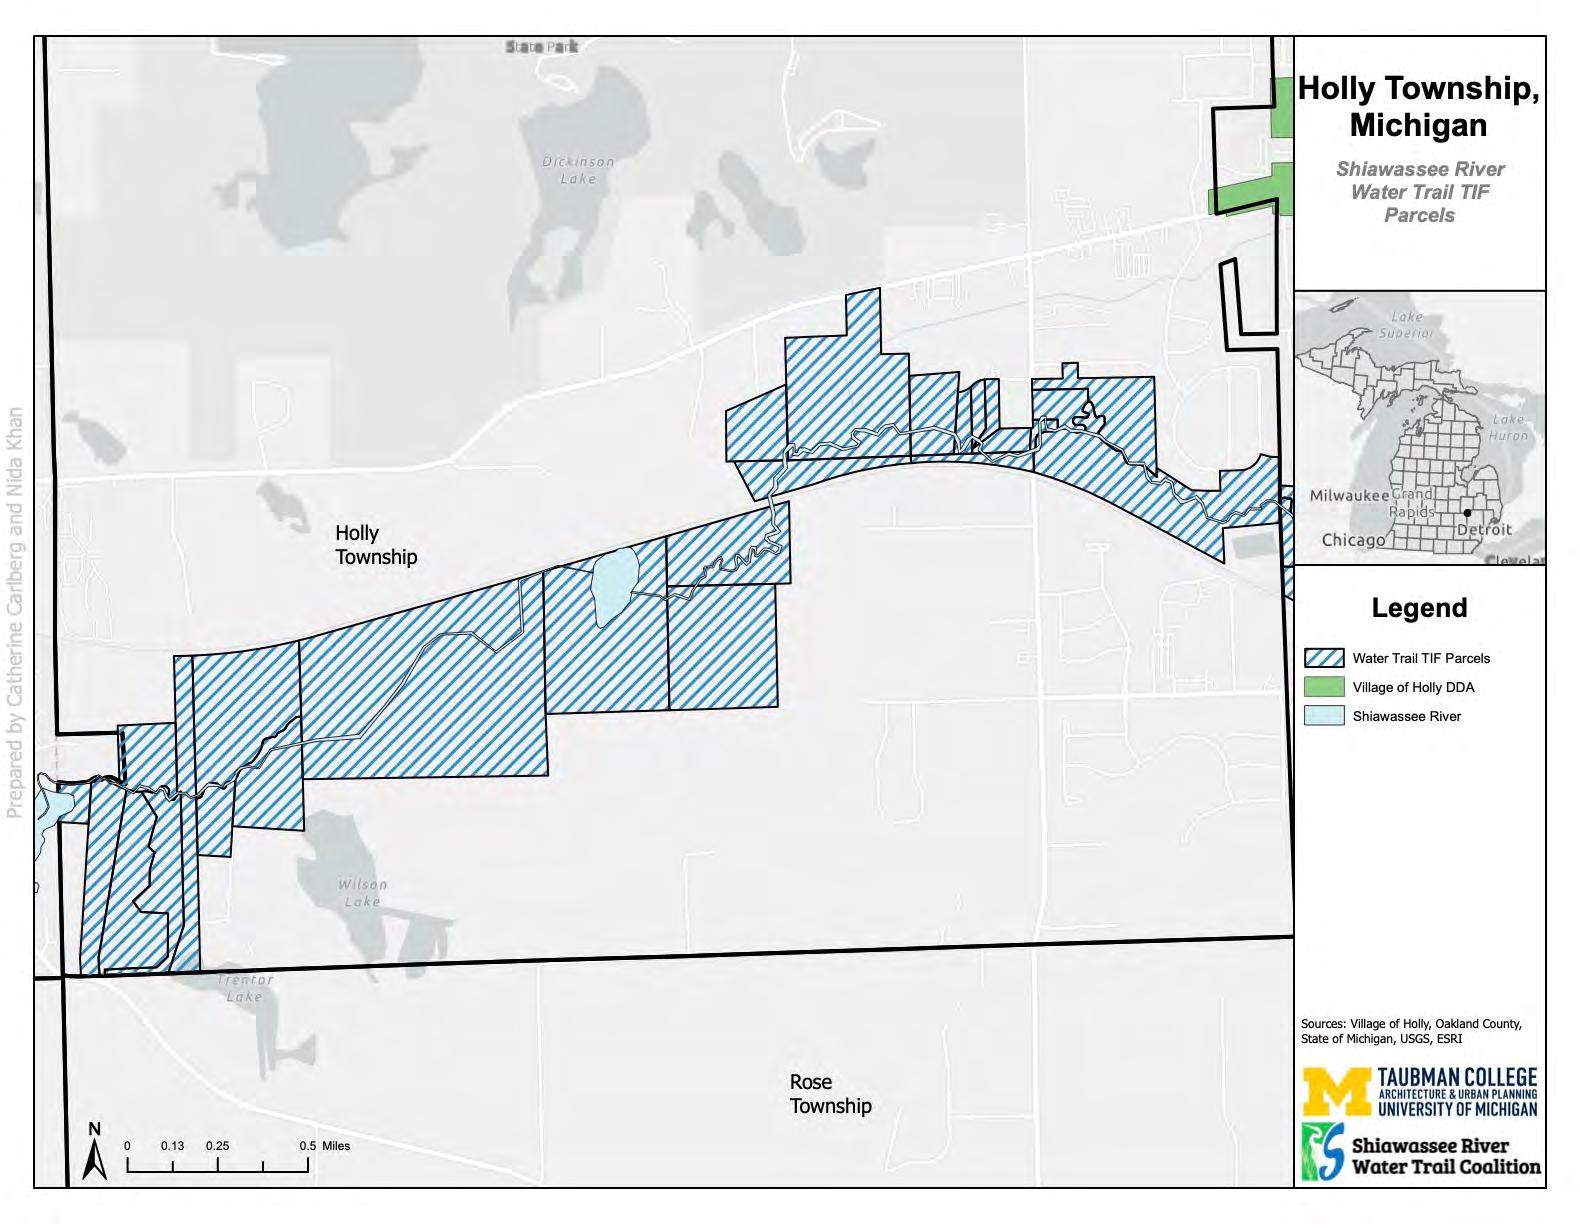
129
Figure 27: Map of Holly Township Parcels
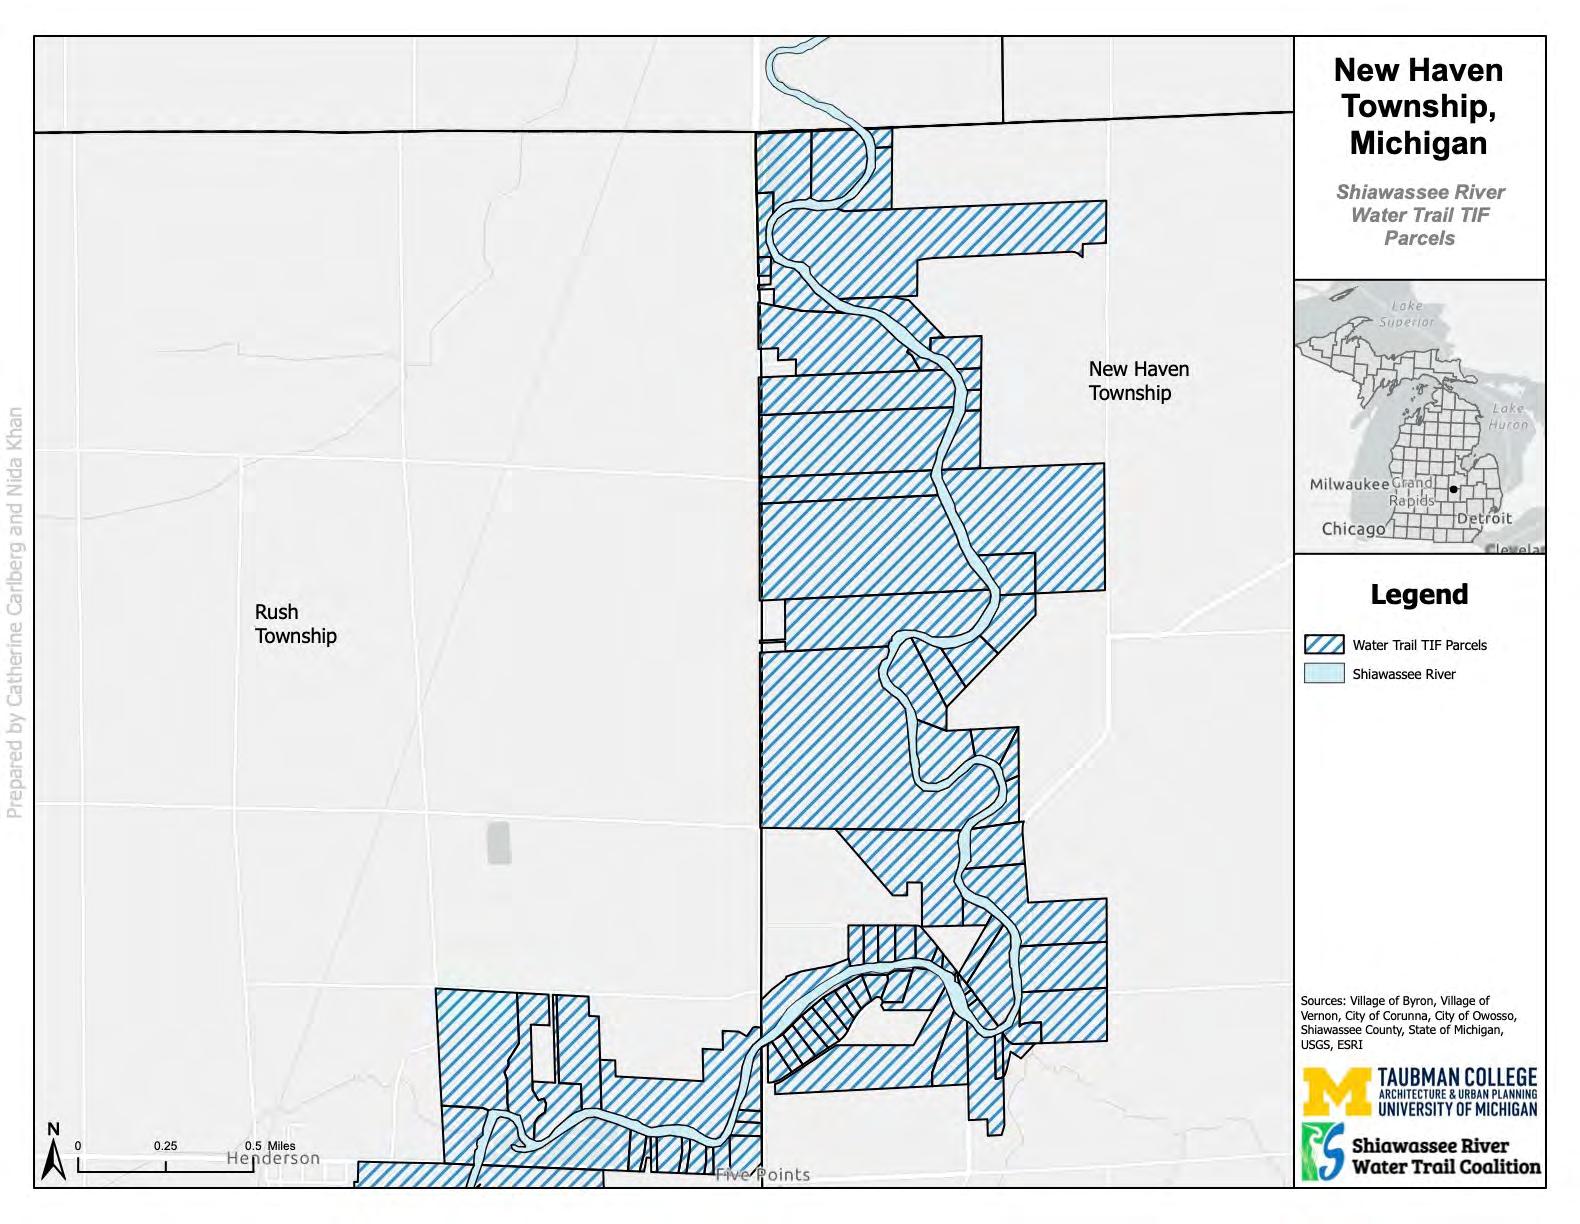
130
Figure 28: Map of New Haven Township Parcels
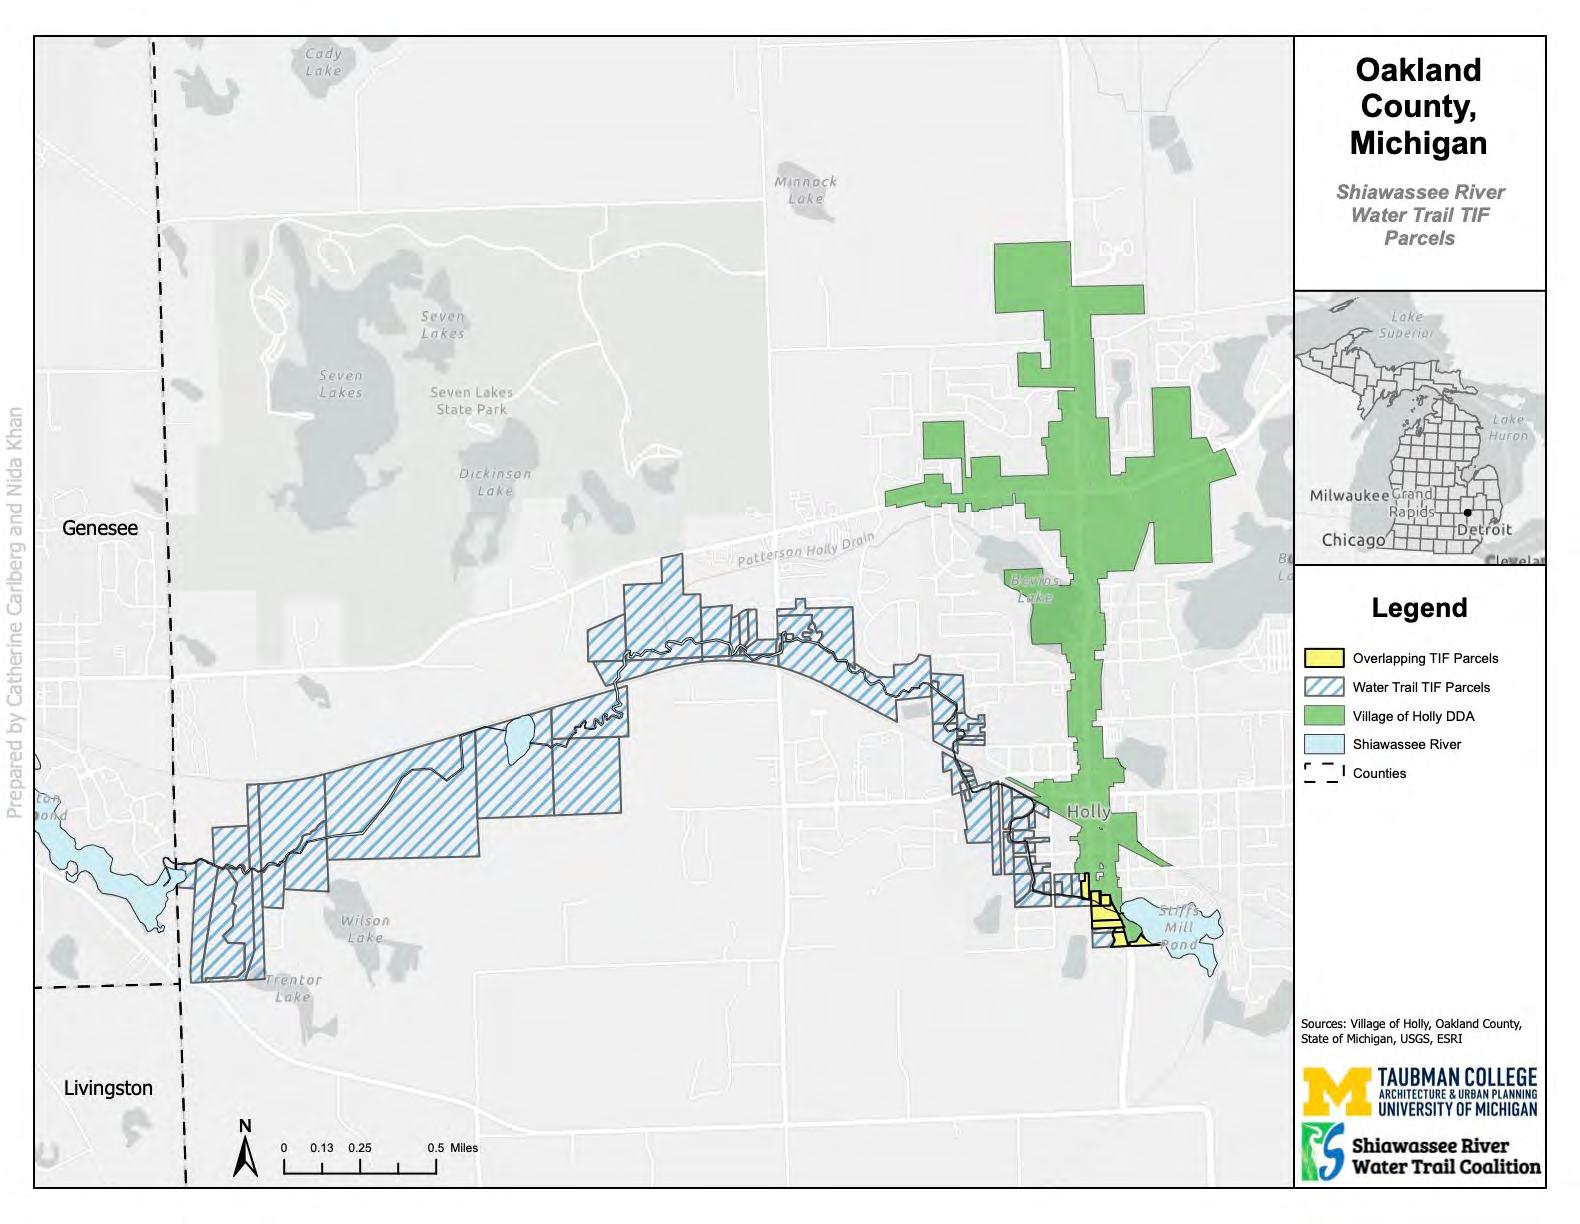
131
Figure 29: Map of Oakland County Parcels
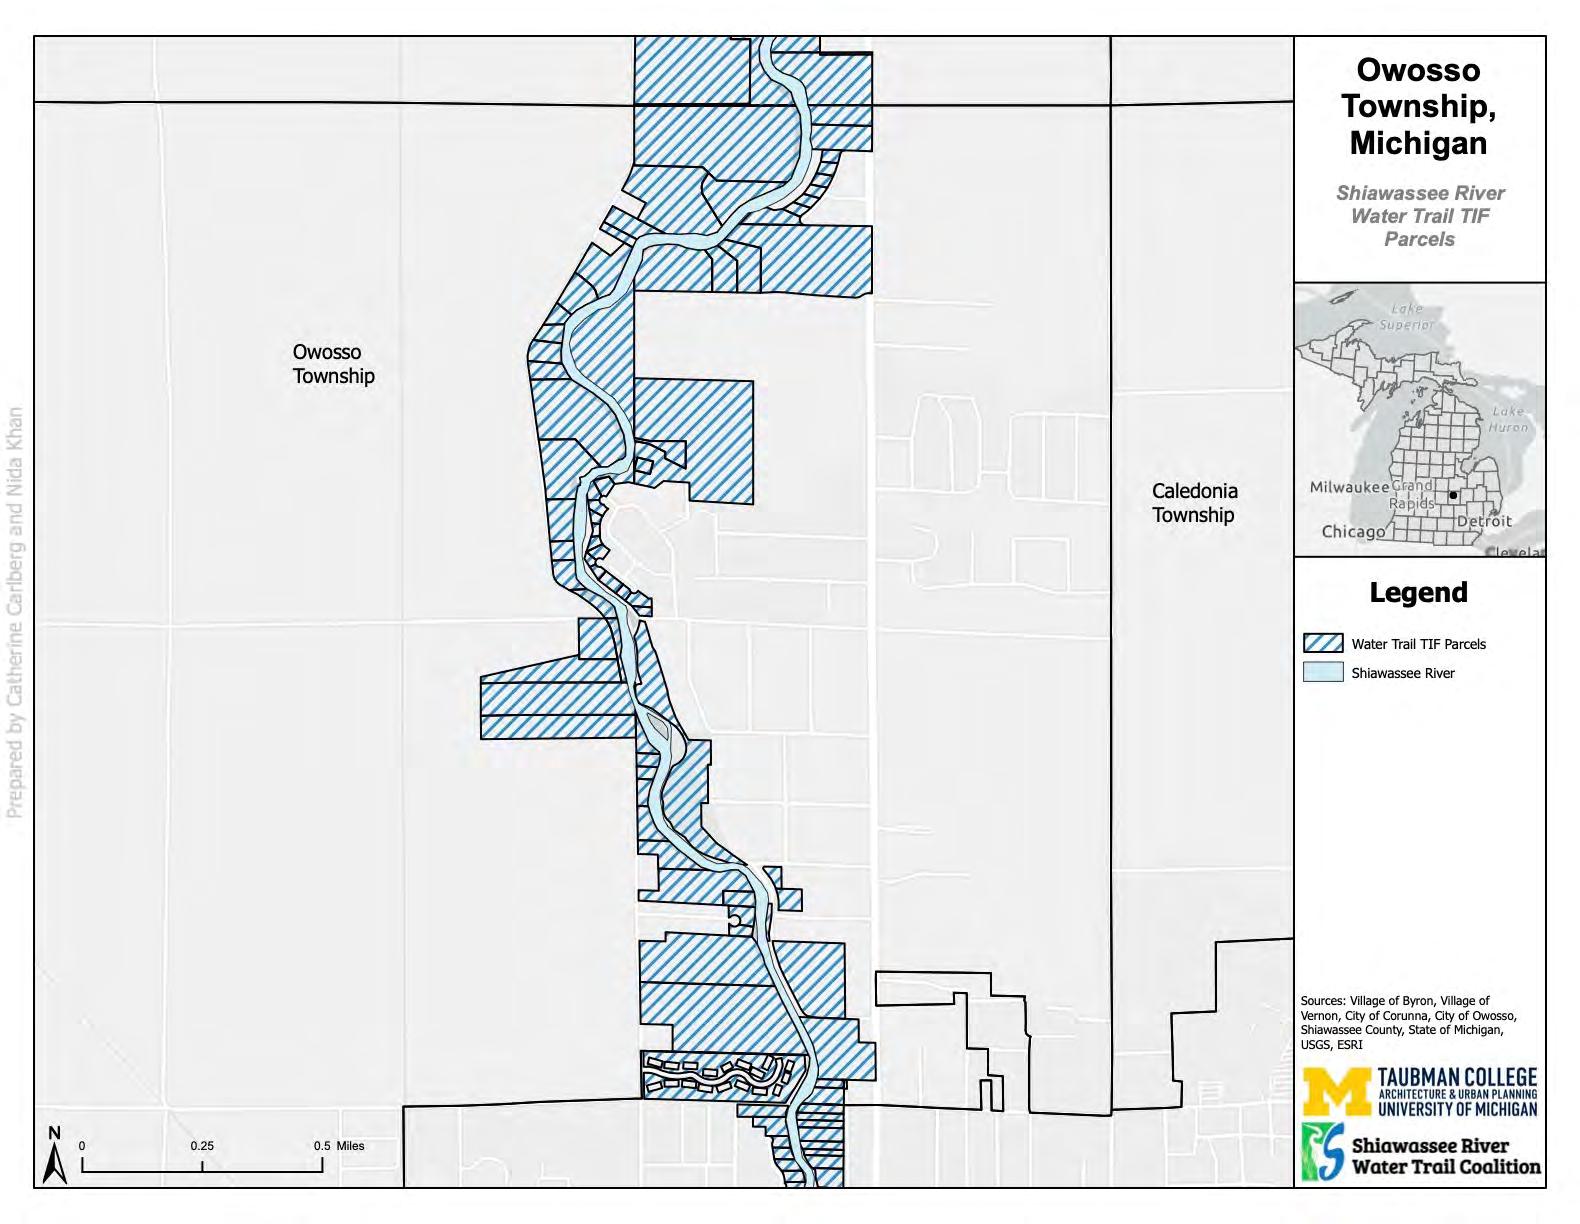
132
Figure 30: Map of Owosso Township Parcels
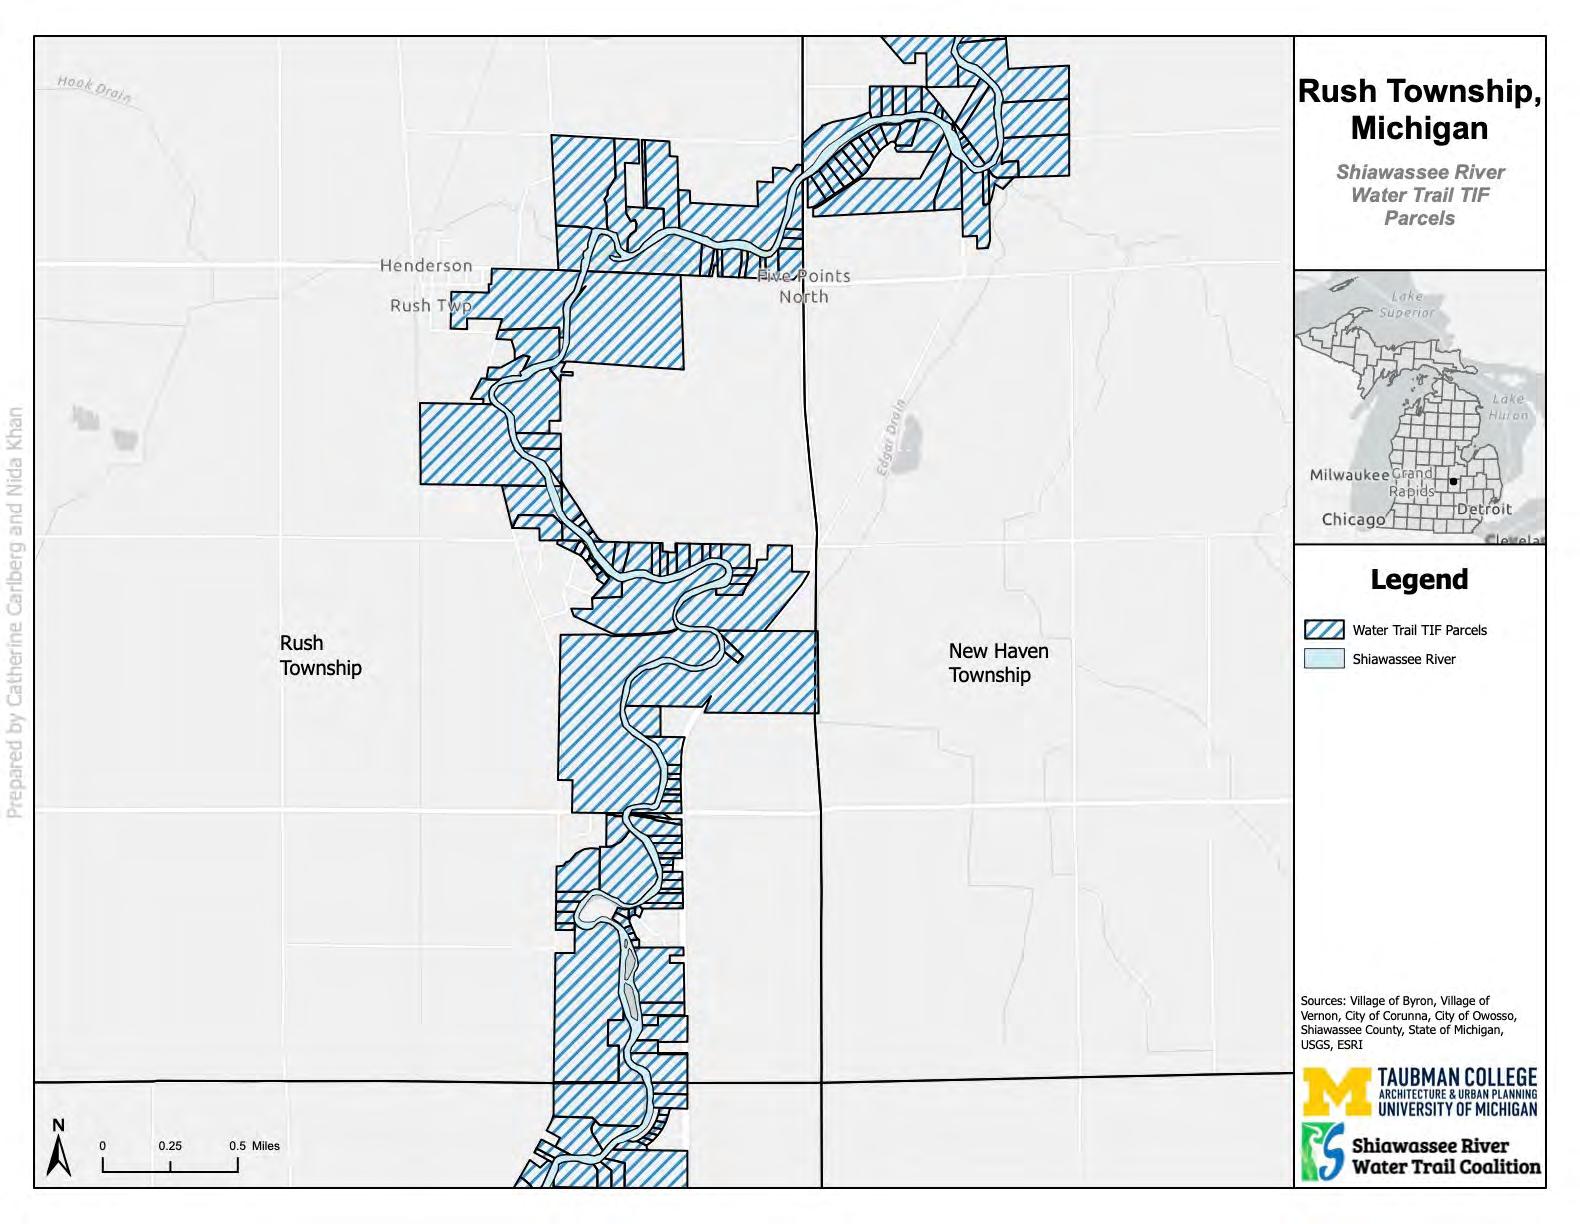
133
Figure 31: Map of Rush Township Parcels

134
Figure 32: Map of Saginaw County Parcels
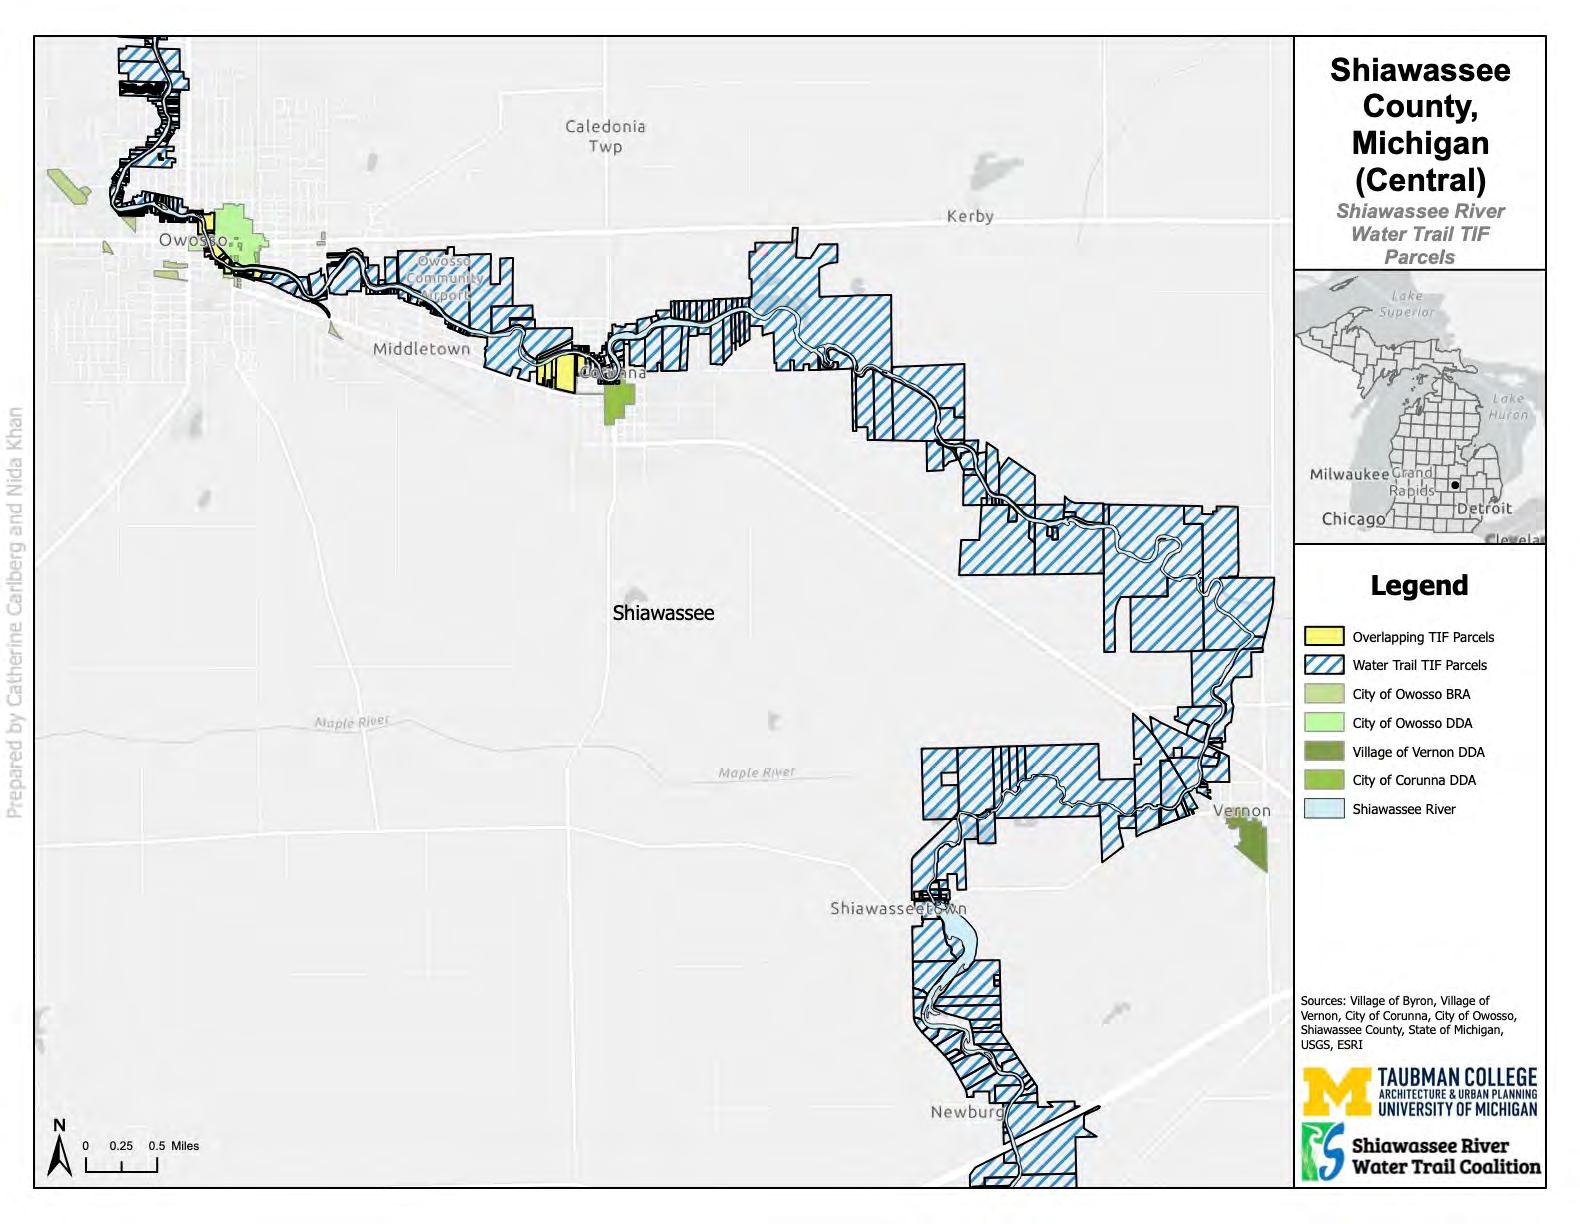
135
Figure 33: Map of Shiawassee County (Central) Parcels
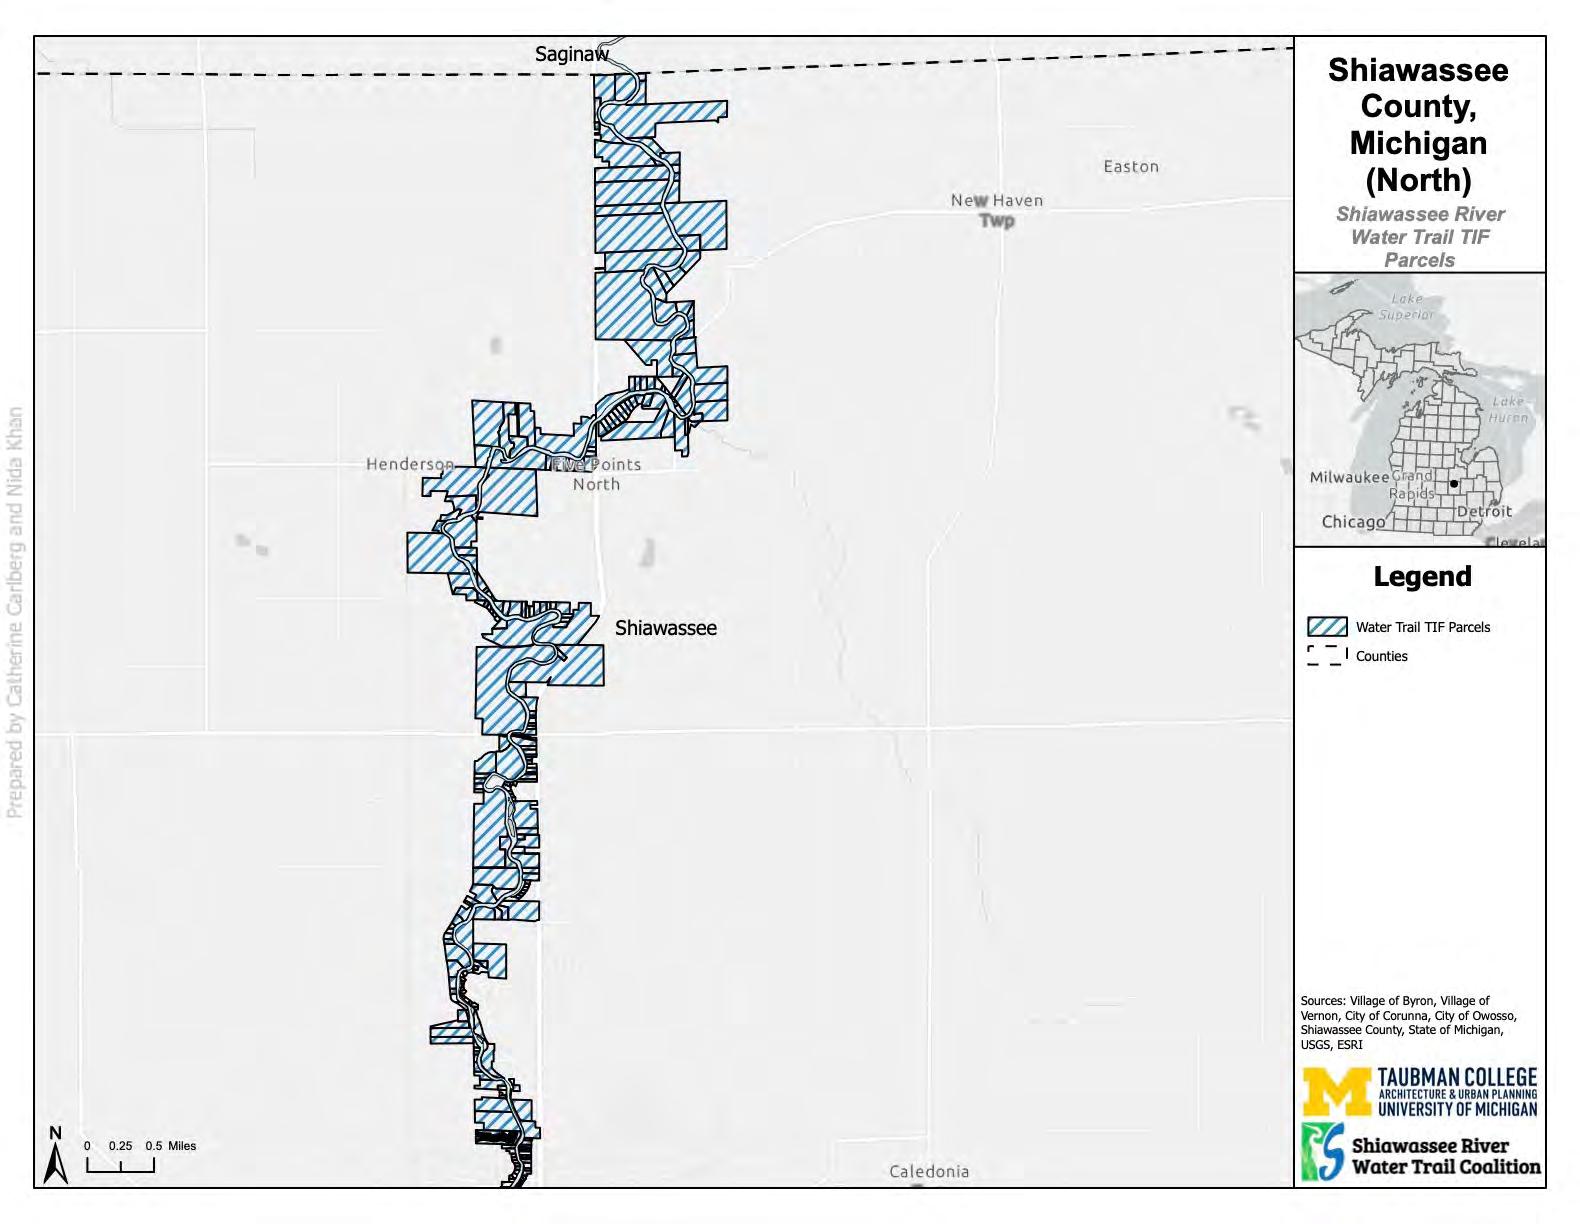
136
Figure 34: Map of Shiawassee County (North) Parcels
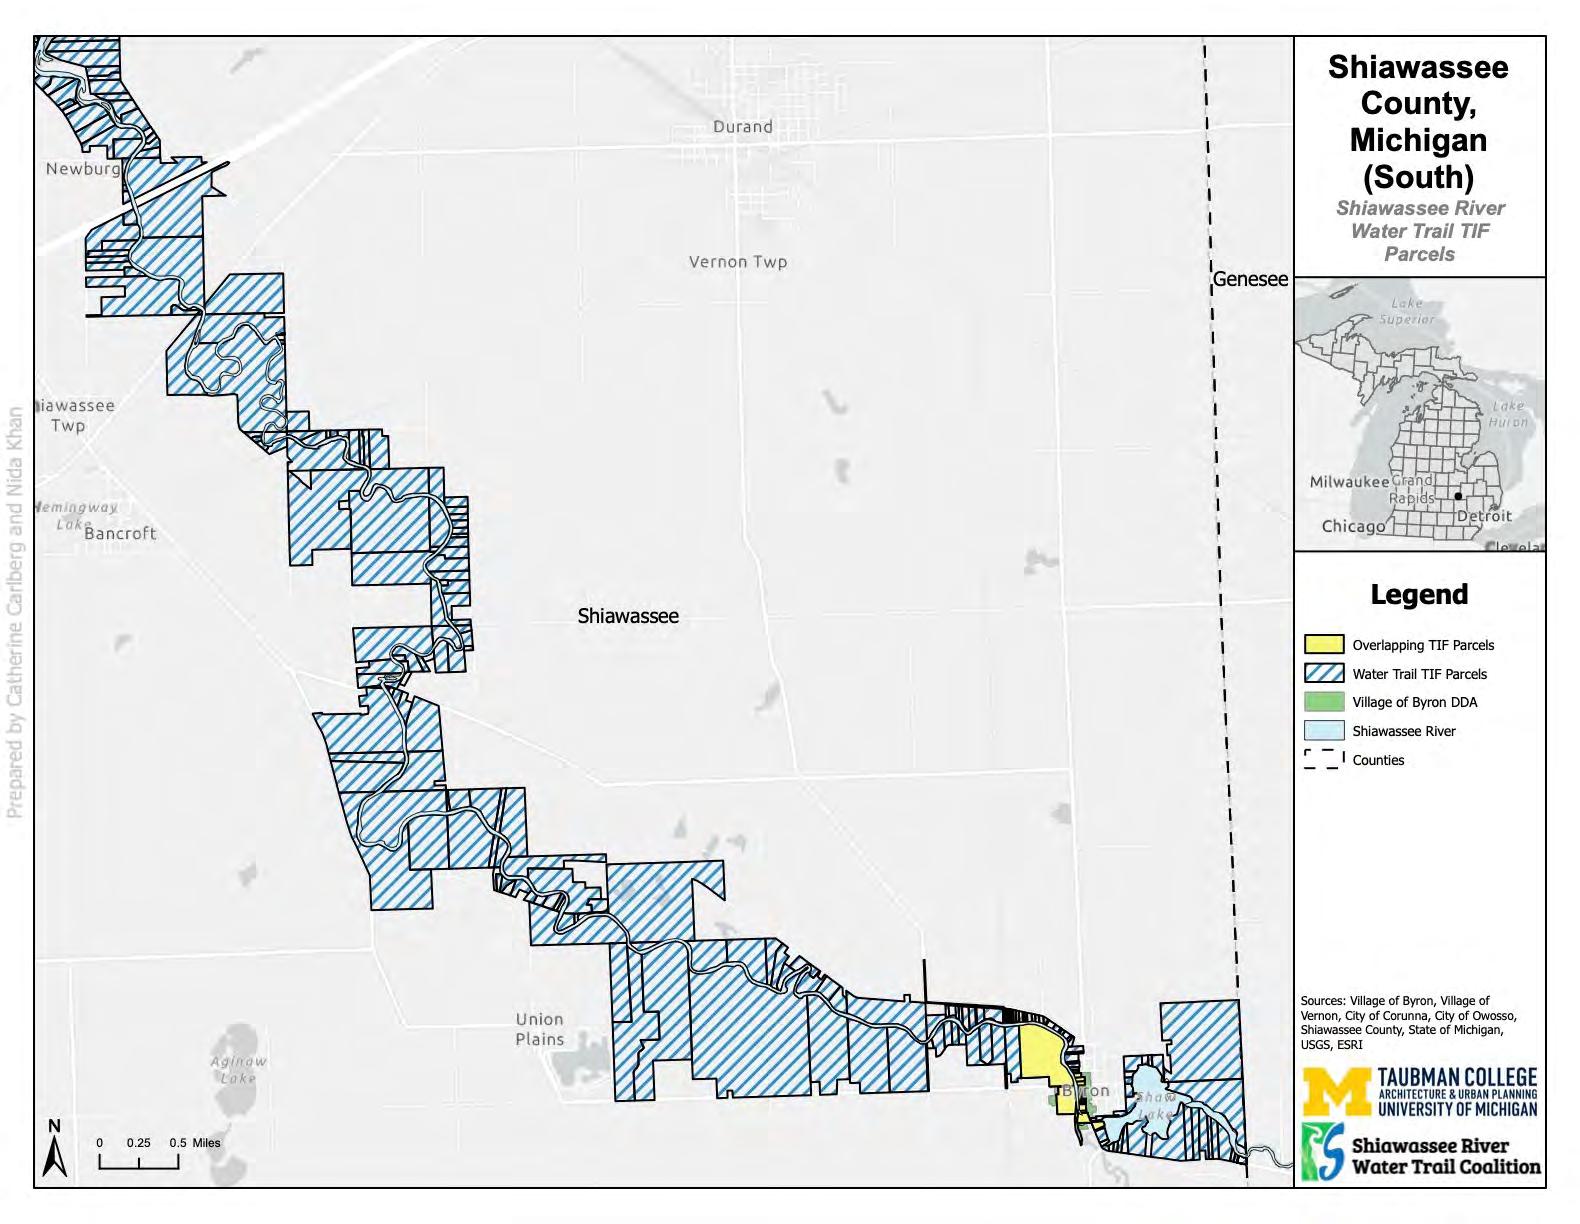
137
Figure 35: Map of Shiawassee County (South) Parcels
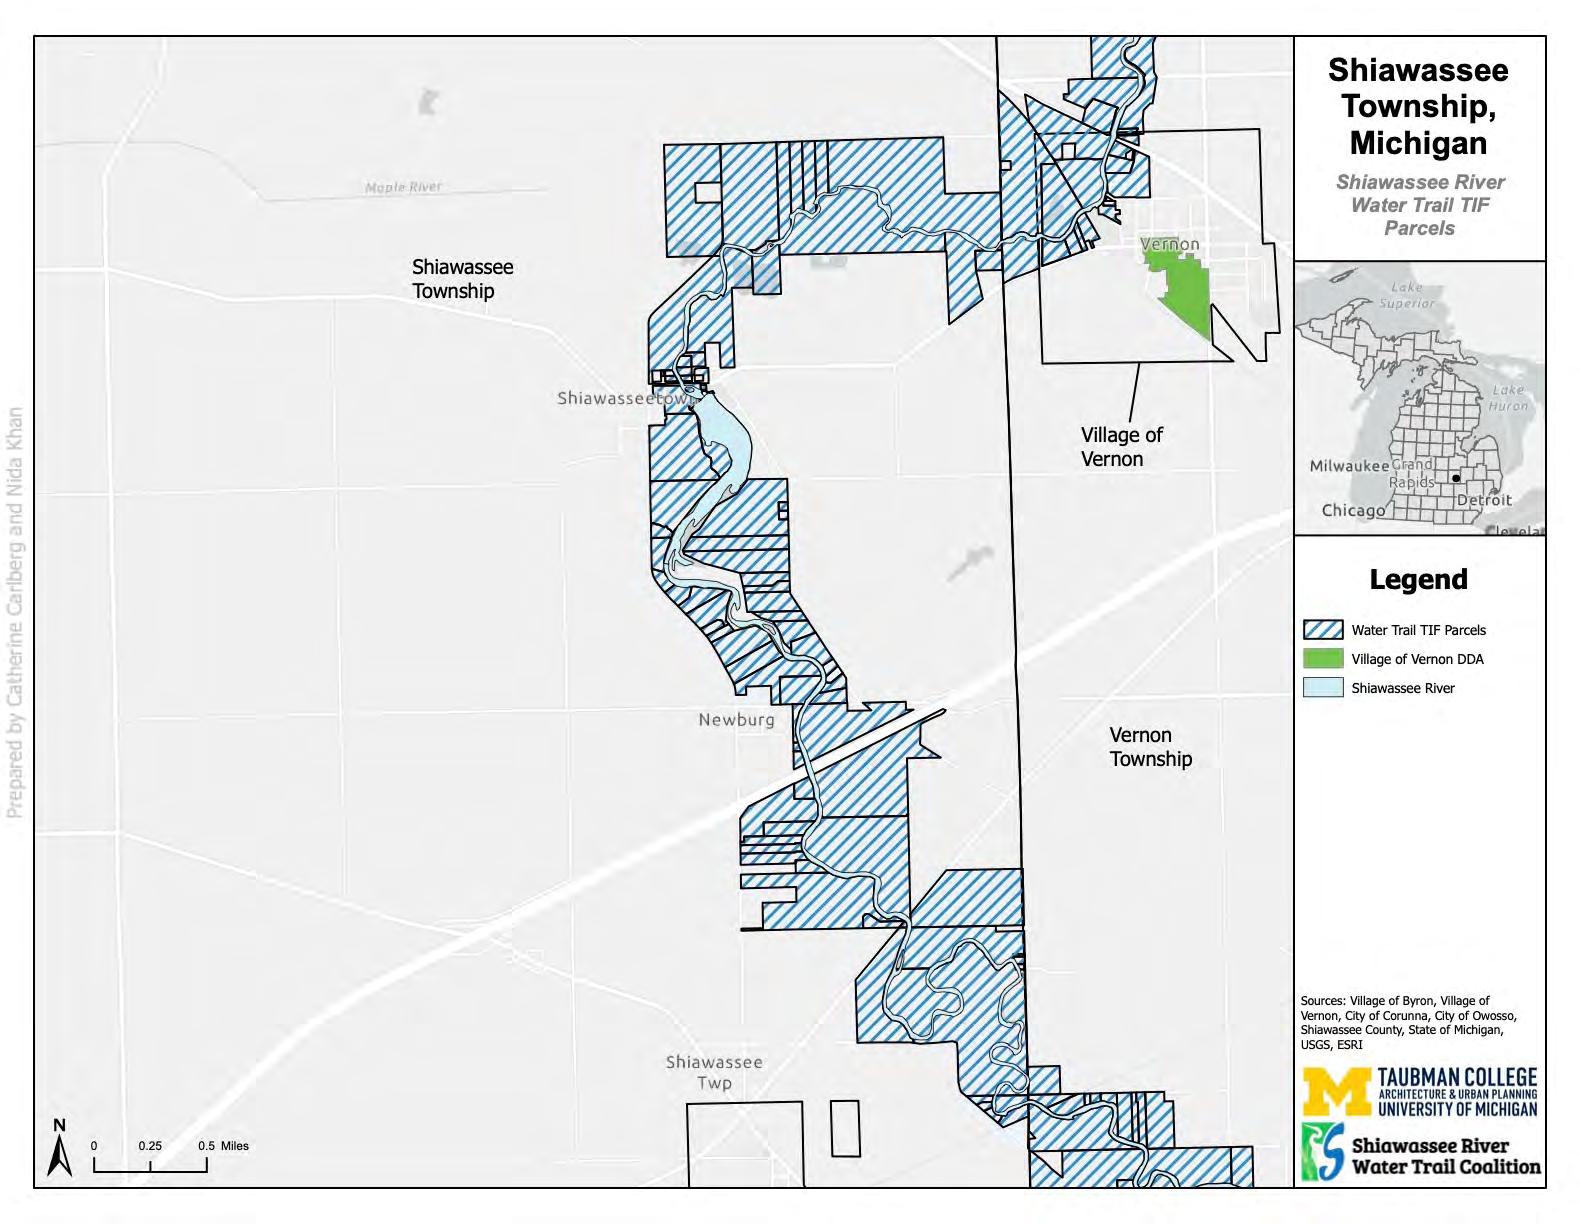
138
Figure 36: Map of Shiawassee Township Parcels
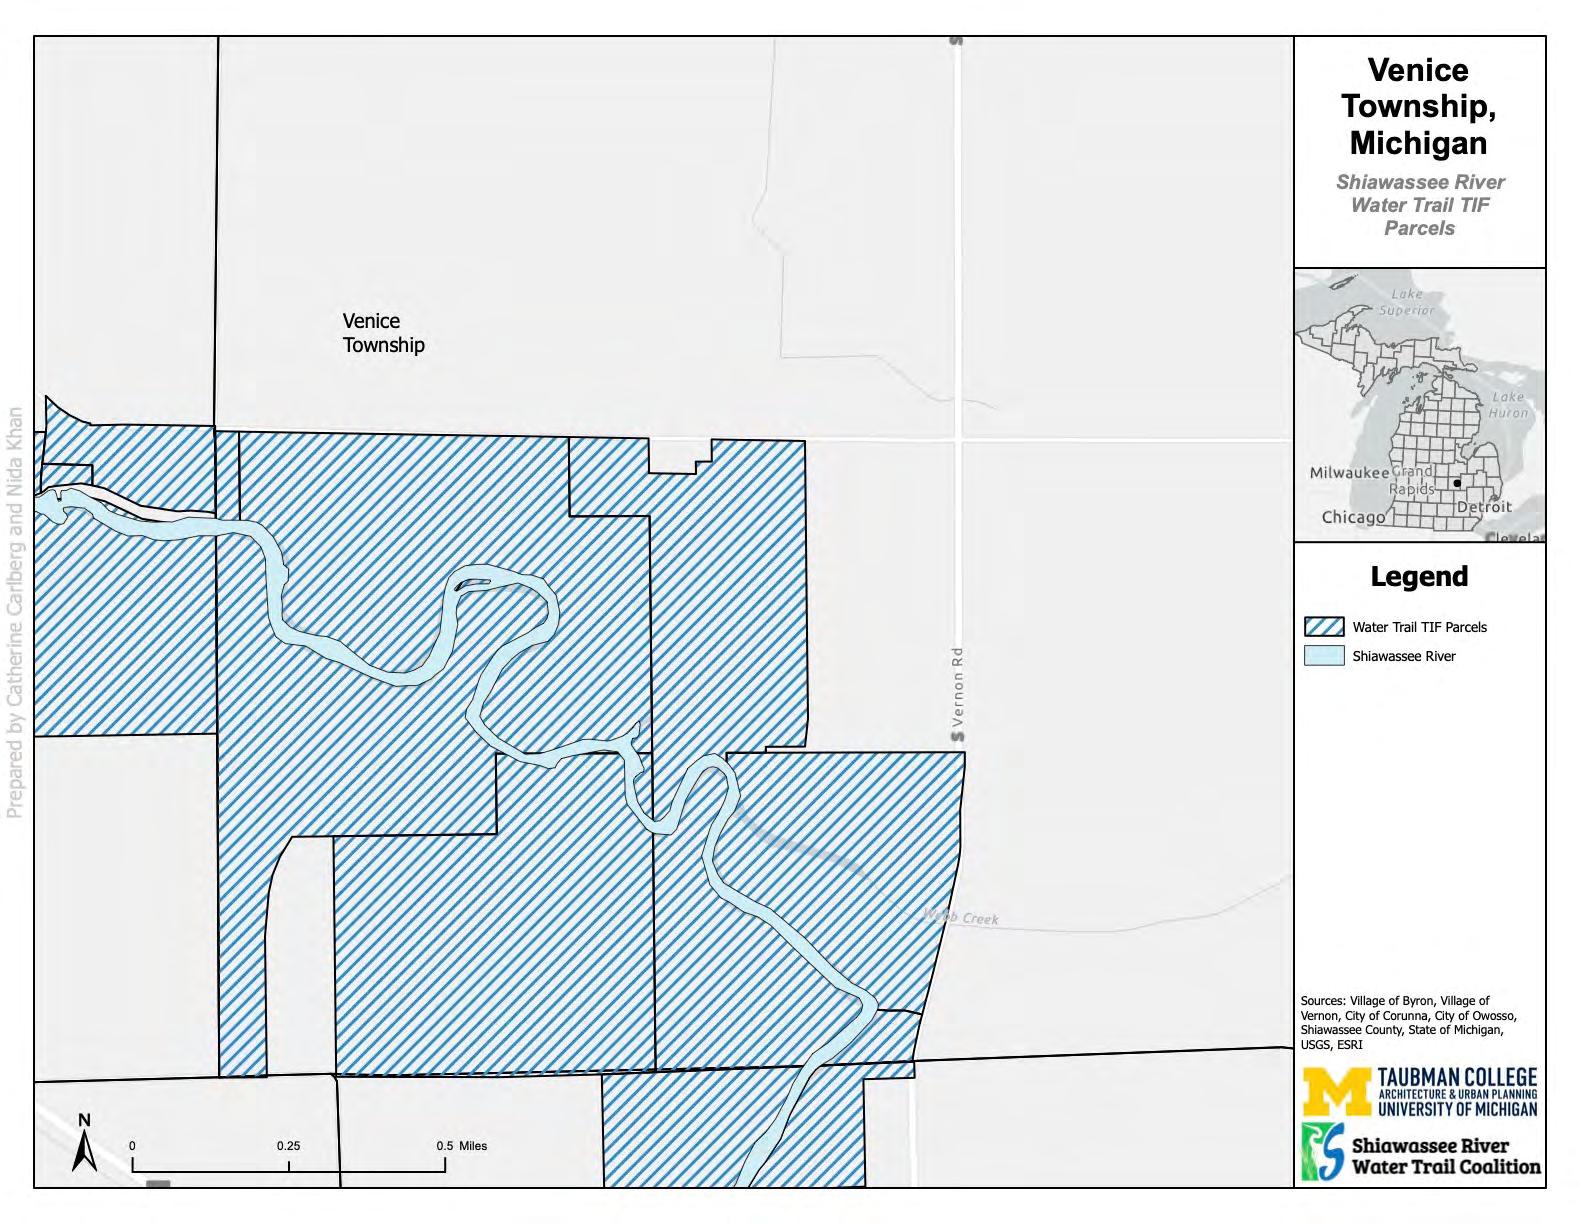
139
Figure 37: Map of Venice Township Parcels
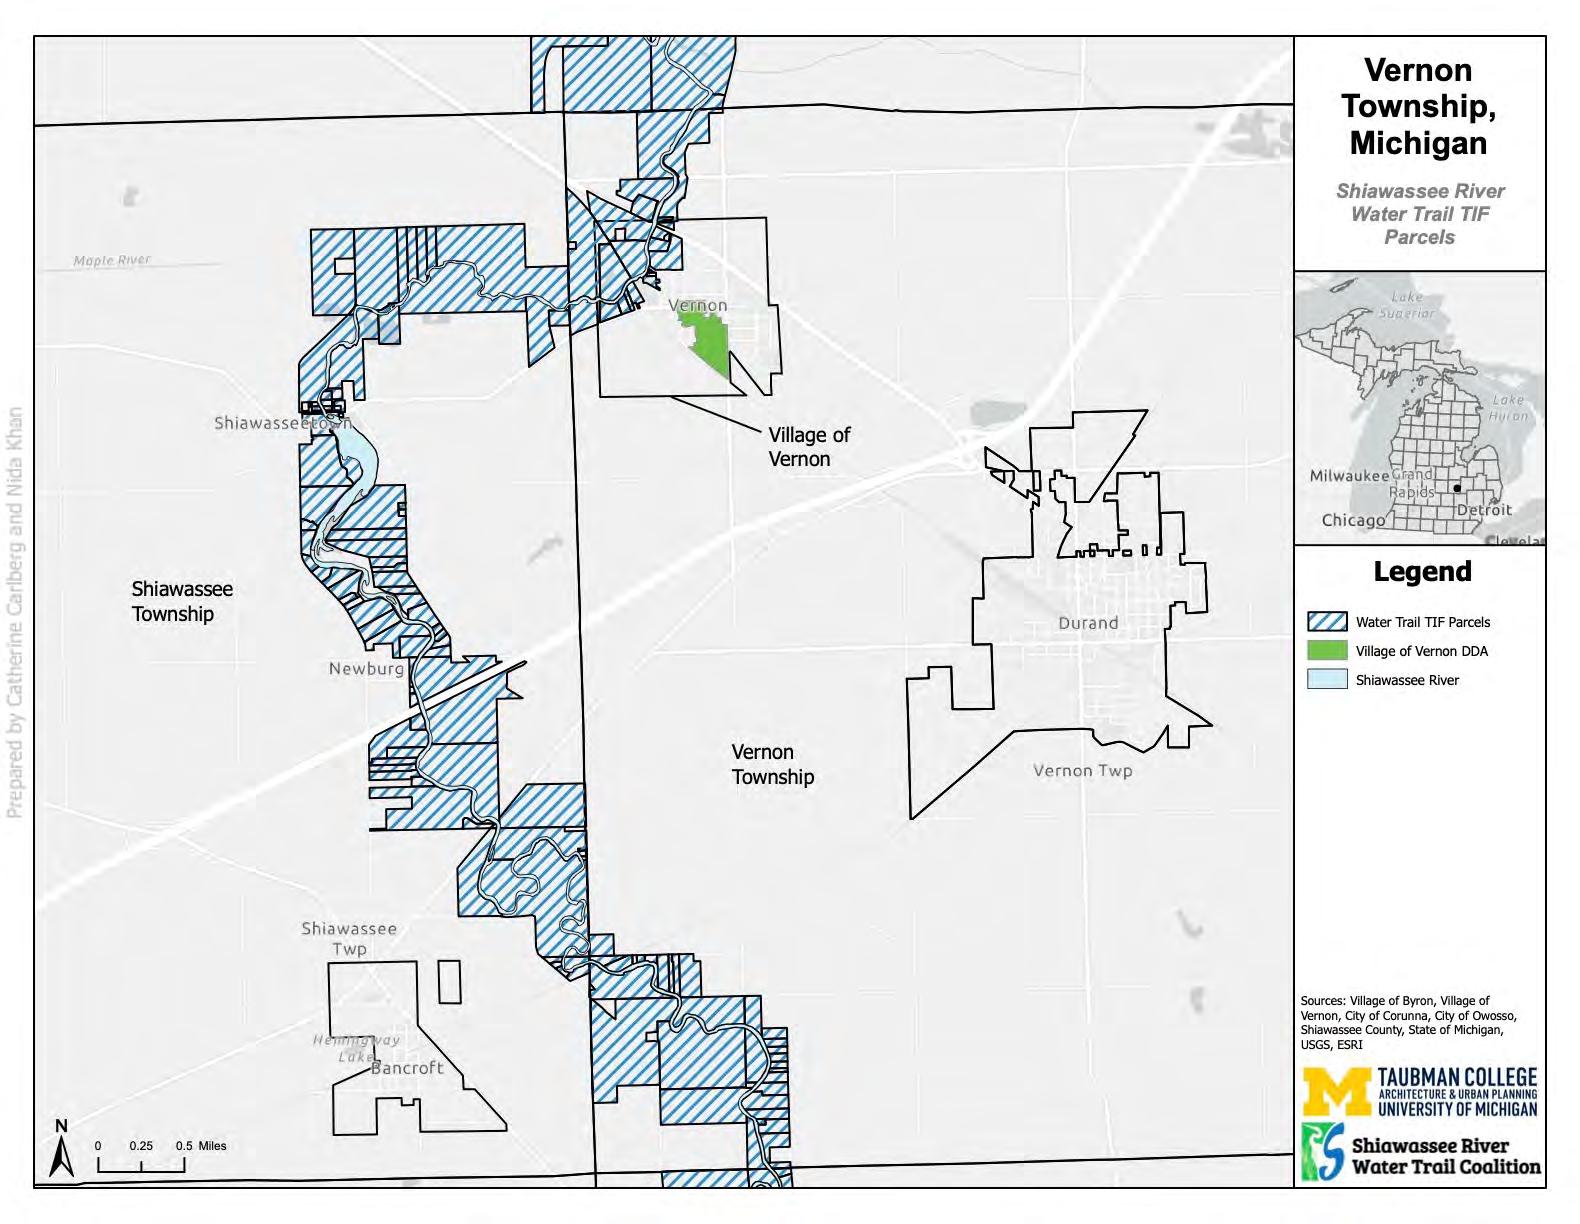
140
Figure 38: Map of Vernon Township Parcels
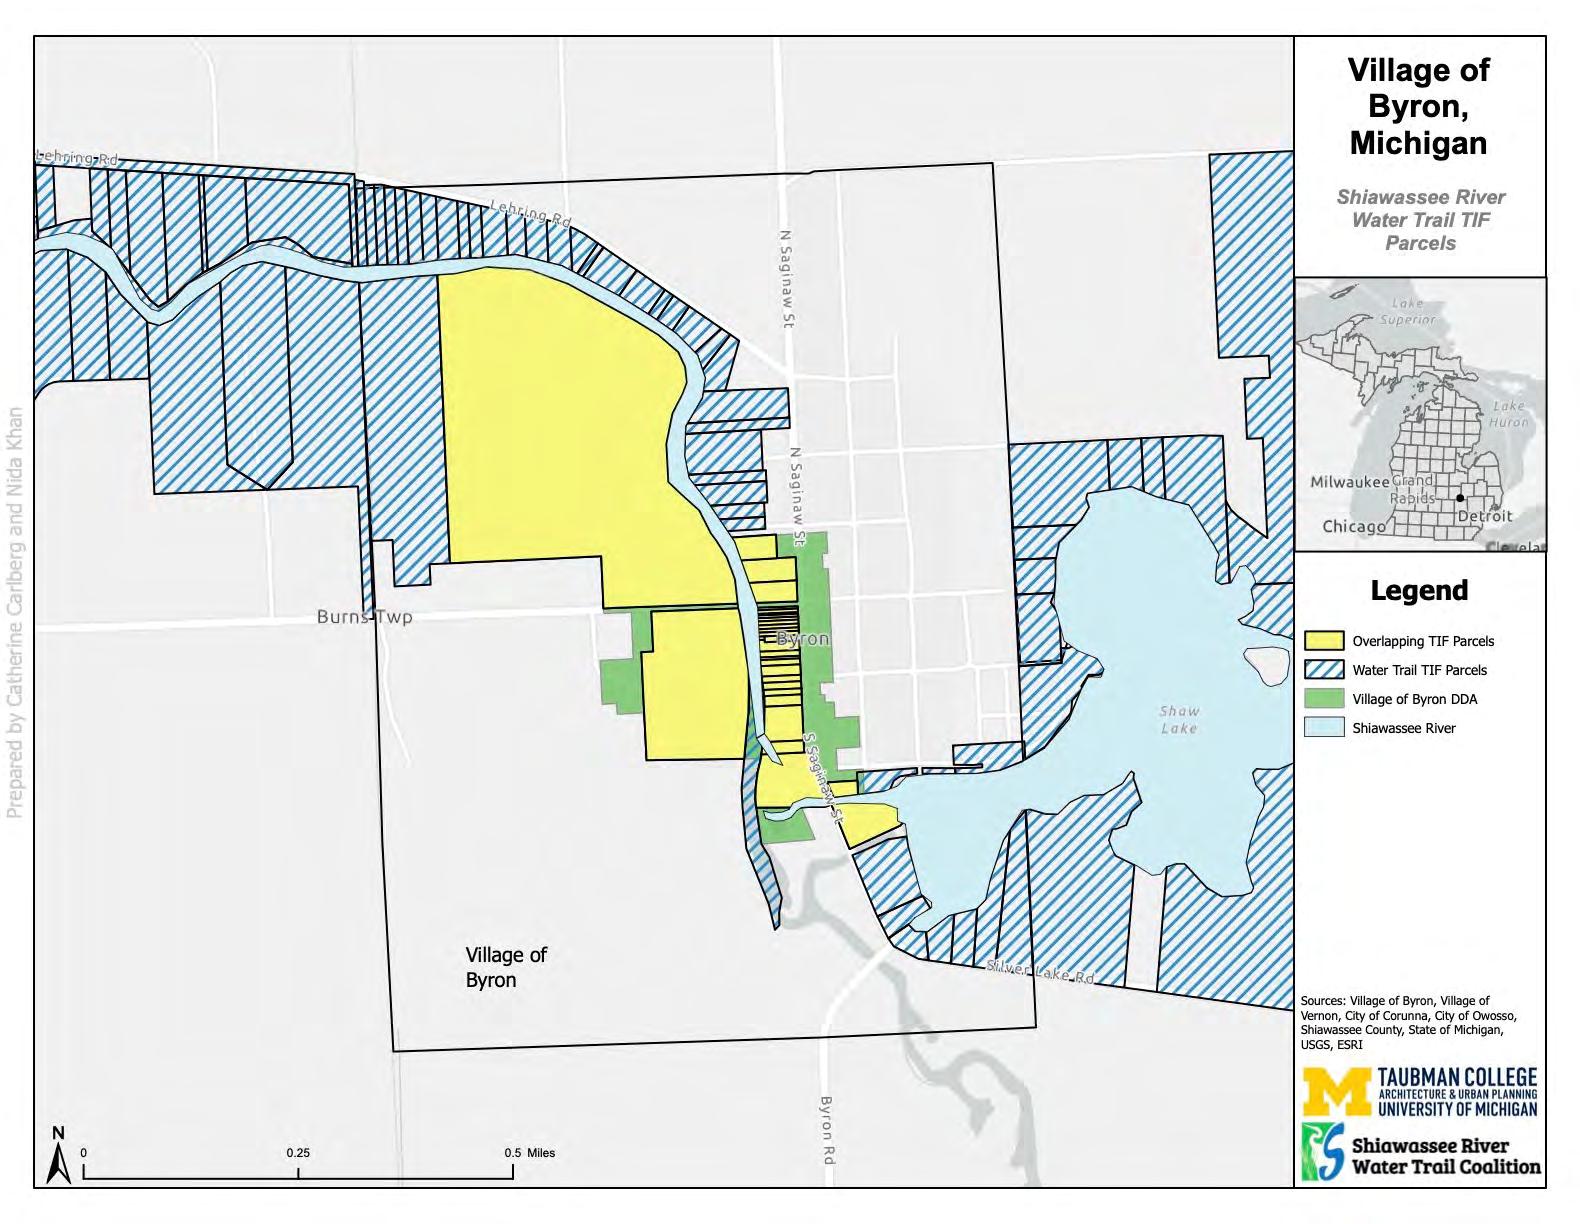
141
Figure 39: Map of Byron Village Parcels
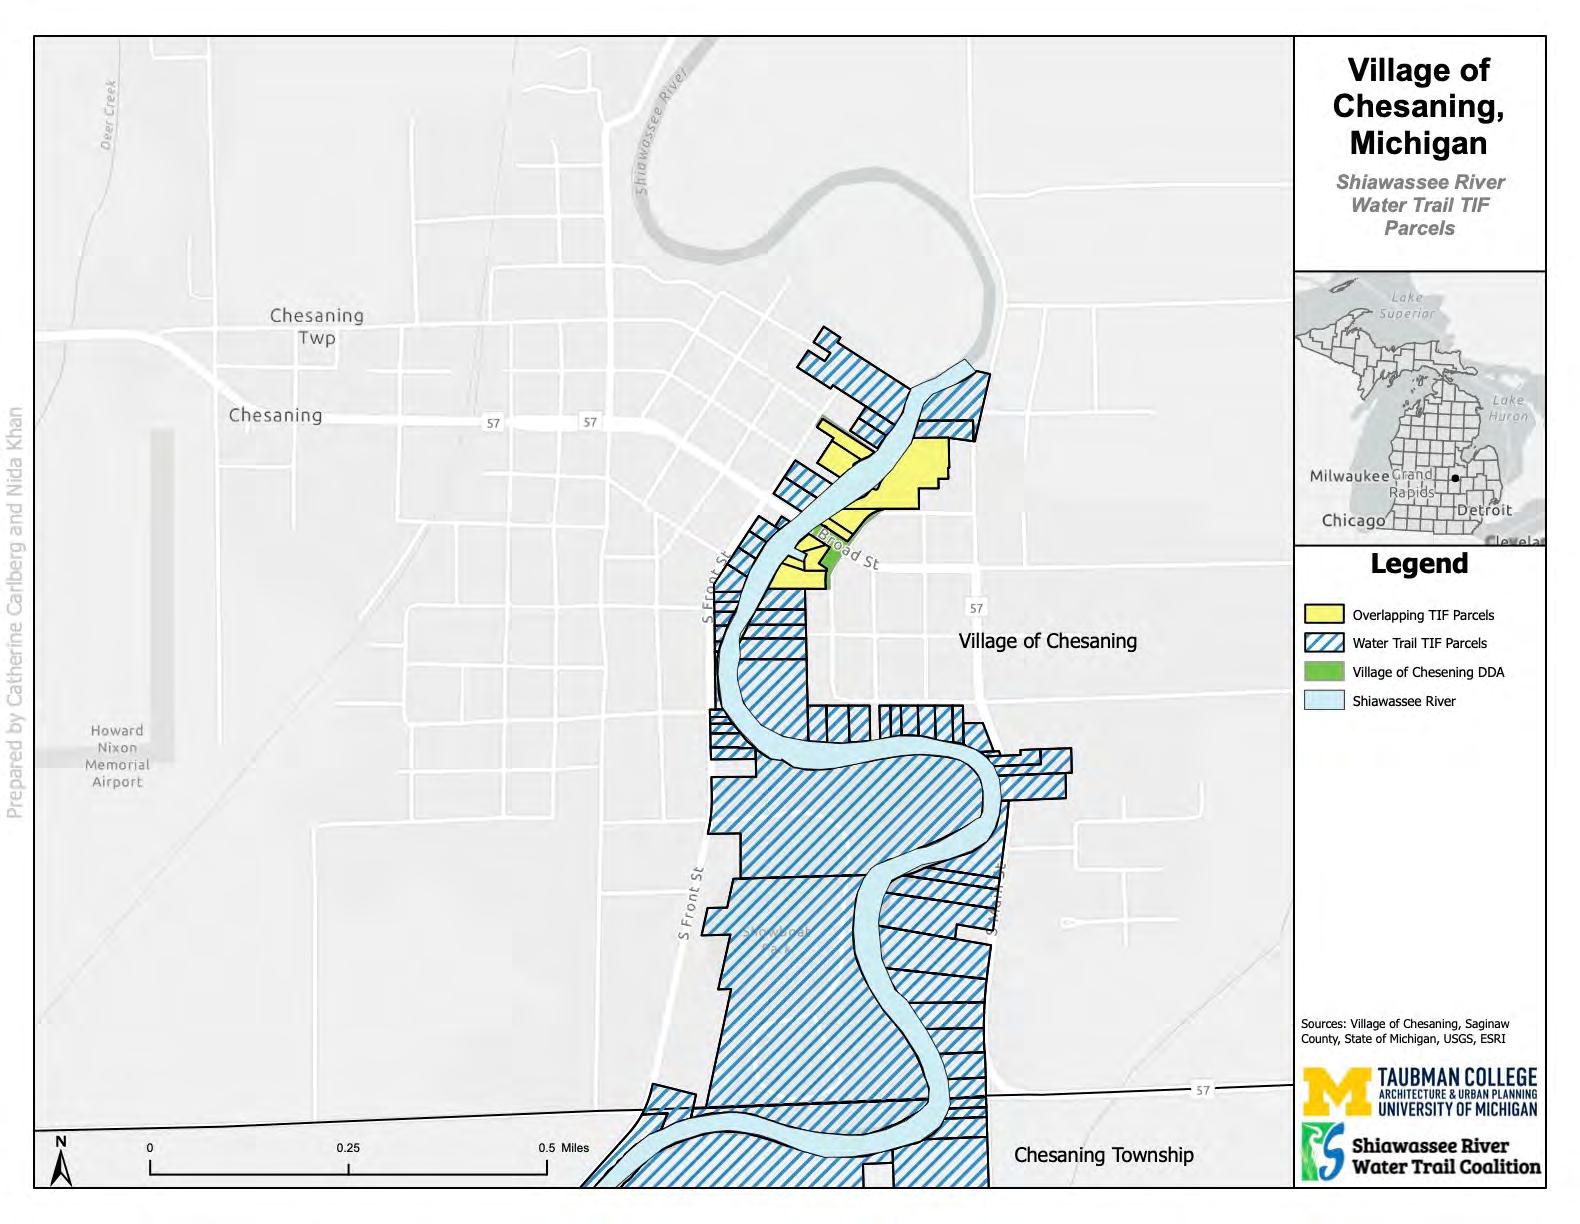
142
Figure 40: Map of Village of Chesaning Parcels
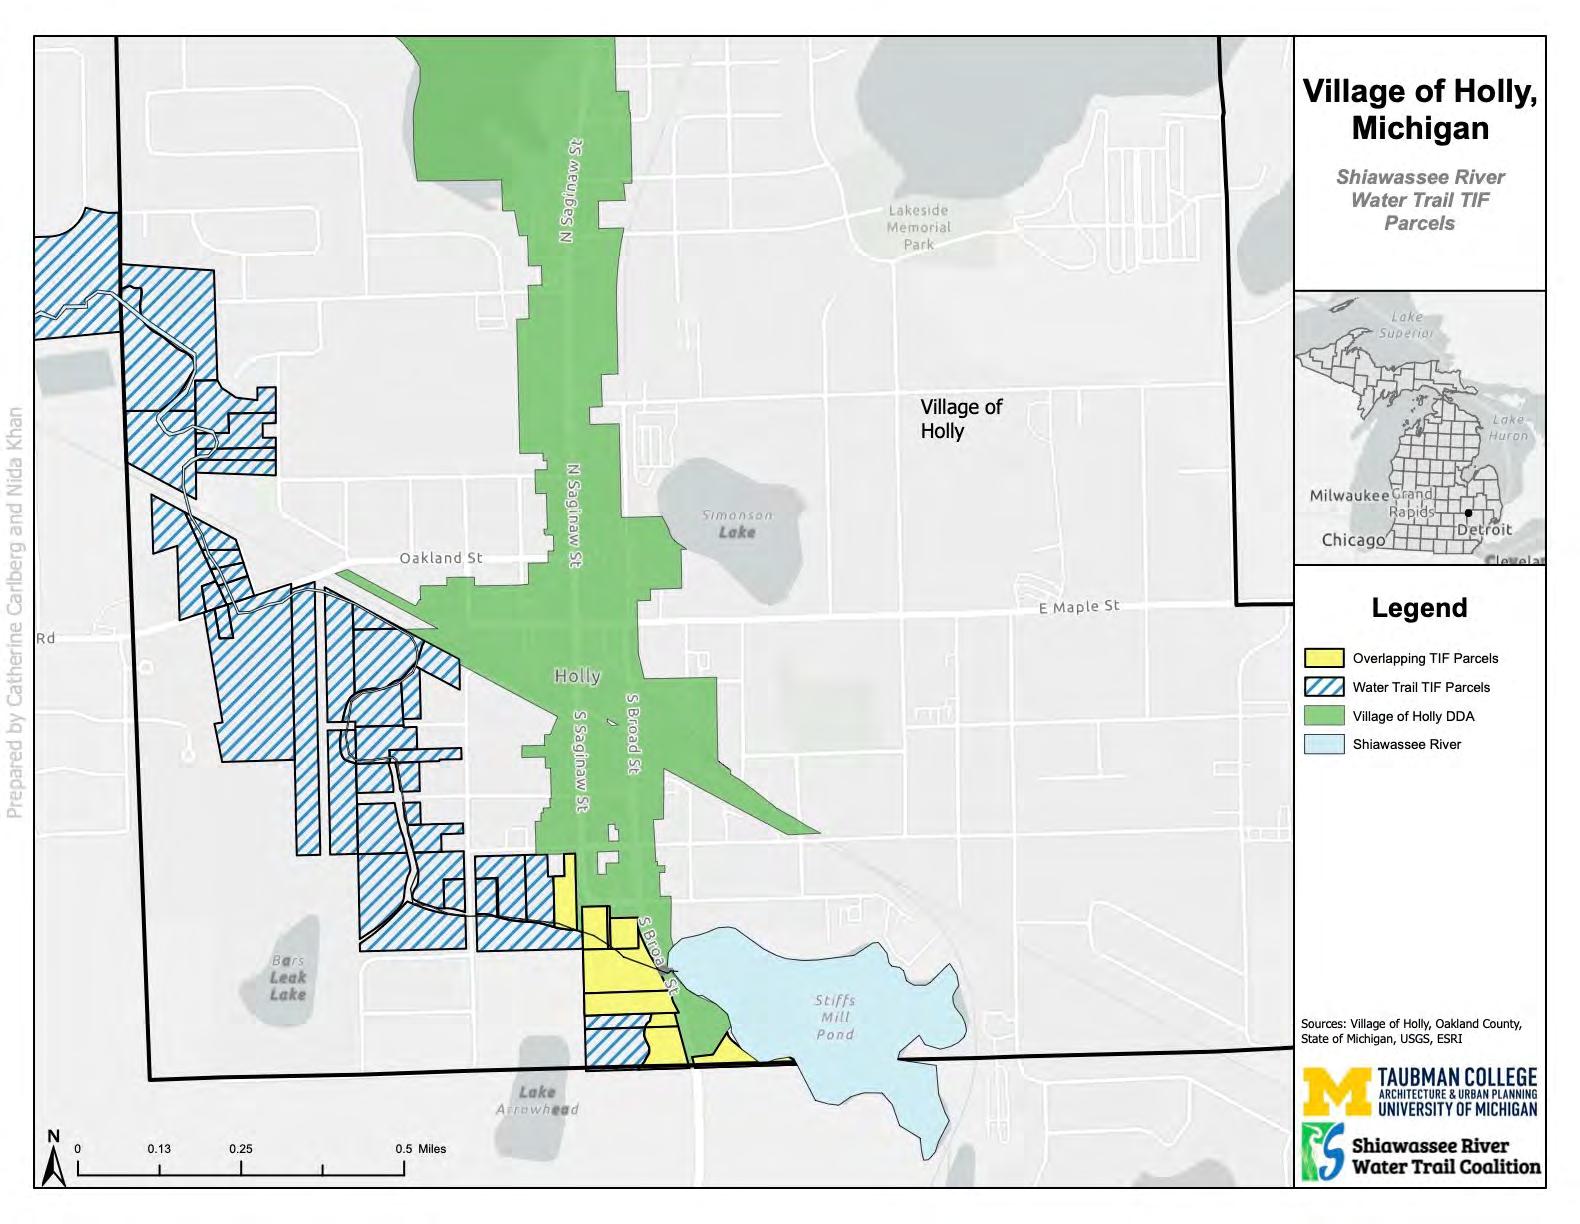
143
Figure 41: Map of Village of Holly Parcels
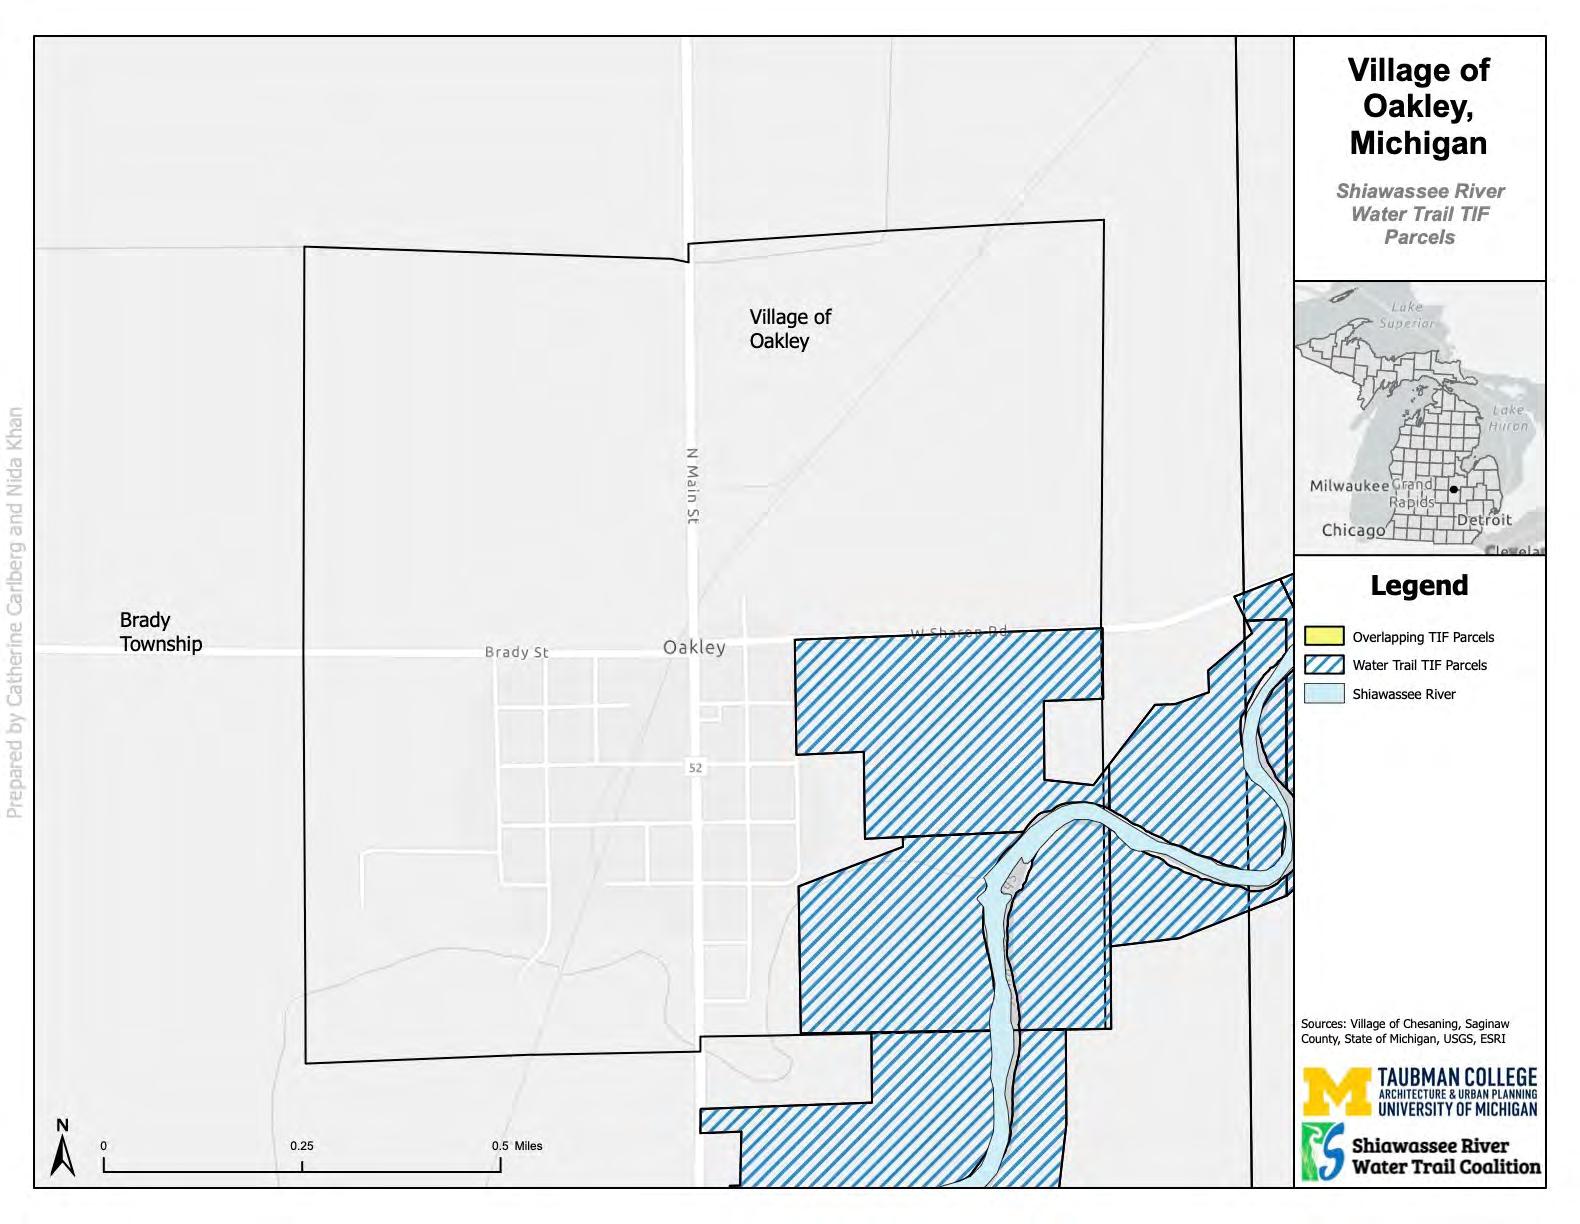
144
Figure 42: Map of Village of Oakley Parcels
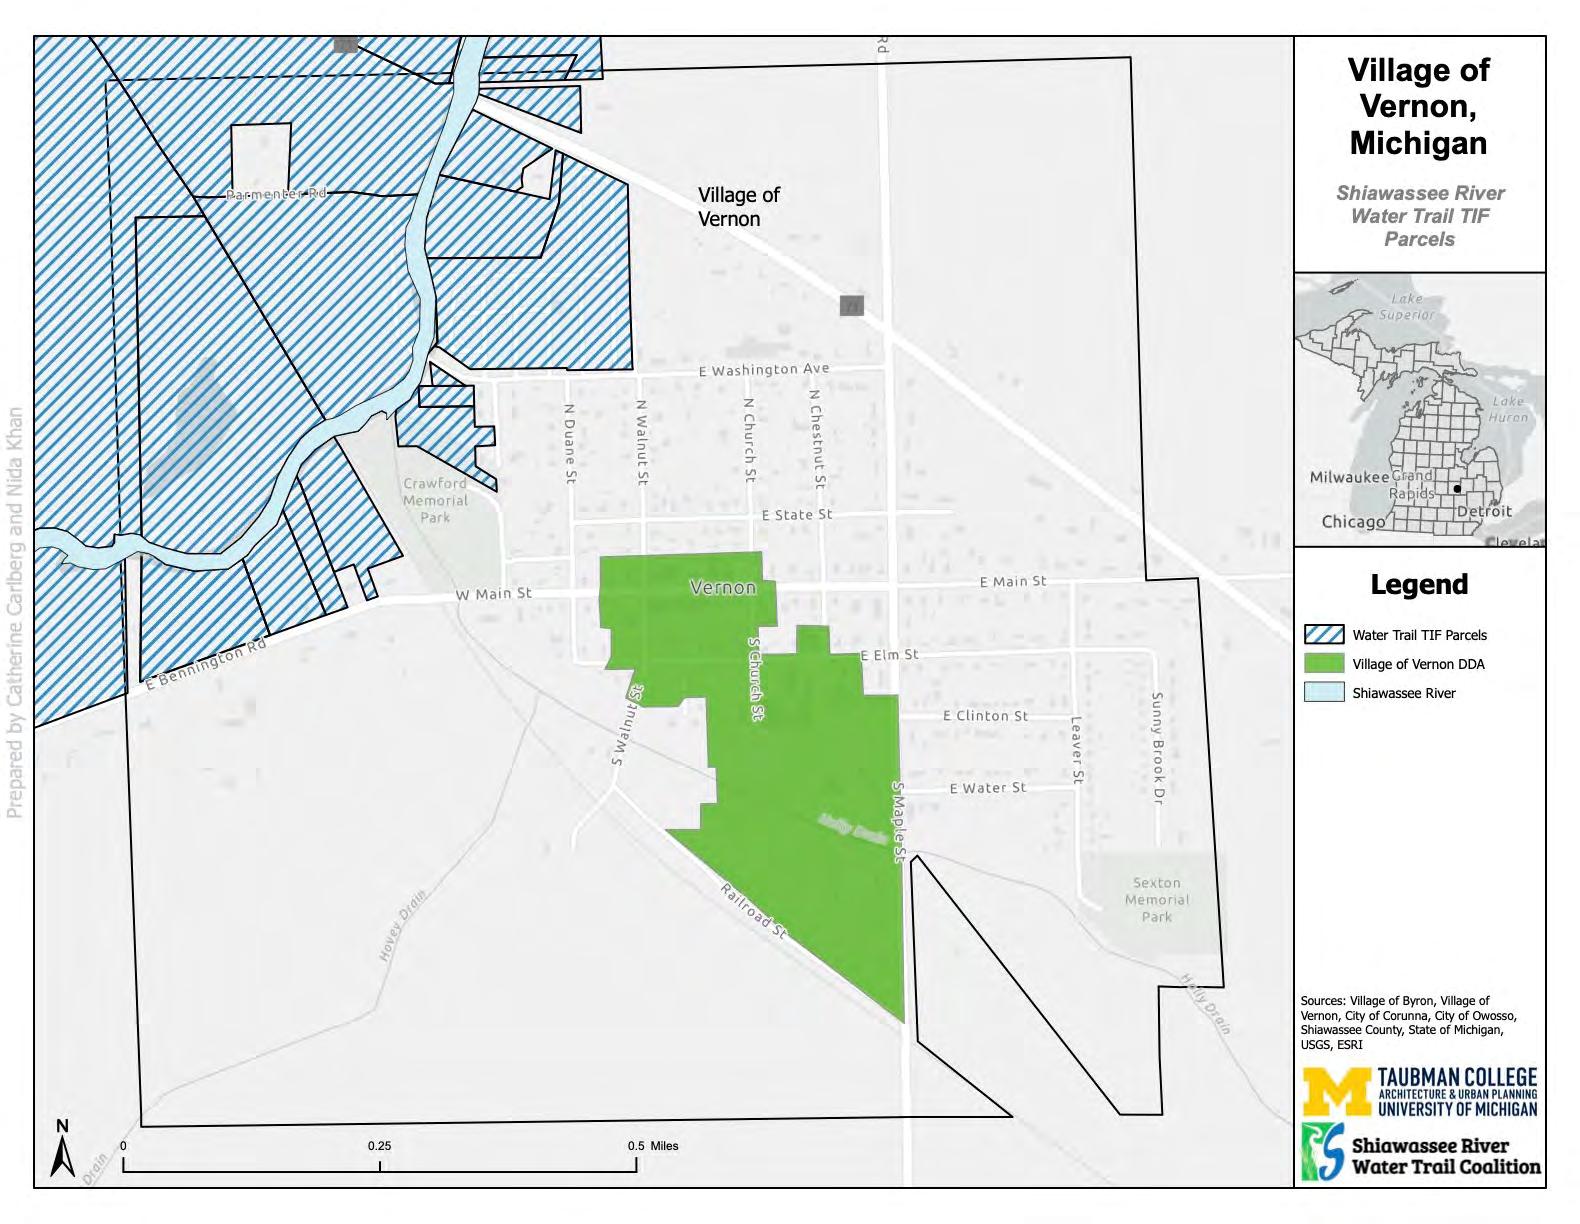
145
Figure 43: Map of Village of Vernon Parcels
C: TIF ANALYSIS METHODOLOGY
To identify land parcels for modeling TIF capture rates, we first cross-referenced parcels adjacent to the Shiawassee River with the assessed and taxable values for the counties of Oakland, Genesee, Shiawassee, and Saginaw. The parcels were then split into appropriate township, city, or village jurisdictions using parcel identification numbers. Regrid was used to identify parcels in instances where the parcel identification number was invalid or unclear.
Next, we gathered data on the millage rates for each jurisdiction and millage breakdowns, as seen in table 30. In some instances, only the total millages were available on the respective jurisdictional websites, so we emailed and called county, township, city, and village assessment offices to gather the millage breakdowns. We excluded millages related to education, fire departments, libraries, zoos, and arts organizations, as specified by Michigan law.
We then used Microsoft Excel to model a 30-year TIF for each township, city, and village. As identified by the GIS analysis, we based our analysis for each jurisdiction on the taxable value for qualifying riverside parcels using a 4% growth rate applied to 2022 taxable values within the jurisdiction. A 4% growth rate was chosen because prior to the COVID-19 pandemic, the average appreciation in property values was 4.4% from the 1990s through the 2010s.1 For each jurisdiction, we modeled a 100% tax capture and a 50% tax capture for the 30-year period. We also calculated the average yearly TIF earnings based on the 30-year total as well.
Property taxes in Michigan are calculated based on a variety of interrelated but distinct values. The market value of a property is how much a property would sell under normal market conditions and is not used to calculate property taxes. Instead, due to Proposal A, Michigan first evaluates the assessed value of a property, which is determined to be 50% of the market value. Taxable value is the value that millage rates are applied to and is used to calculate property taxes. The taxable value can only increase from year to year by the rate of inflation or 5%, whichever
is less. Taxable value will only increase beyond this cap to match the assessed value when properties are sold or transferred, or when there are new developments. Therefore, our modeled revenues may be conservative estimates as it does not consider situations where taxable value may increase more than the inflation rate or 5%.
Table 31 presents a sample calculation of river trail TIF revenues for the Village of Holly. As noted above, the first step in calculating TIF revenues was to determine the applicable millage rates for the river trail TIF. The river trail TIF millage rate is the sum of all eligible millage rates in the jurisdiction. All existing TIF, school, and library millages were not considered in this calculation. Therefore, we determined that the millage rate for the river trail TIF in the village would be 20.0891 mills or 0.0200891.
146
Note: Assessing in Village of Holly administered by Holly Township
Next, we calculated the 4% growth of the total taxable value of river trail parcels in the Village of Holly throughout the 30-year TIF Period. Figure 44 presents an example of the formula for calculating the 4% growth rate.
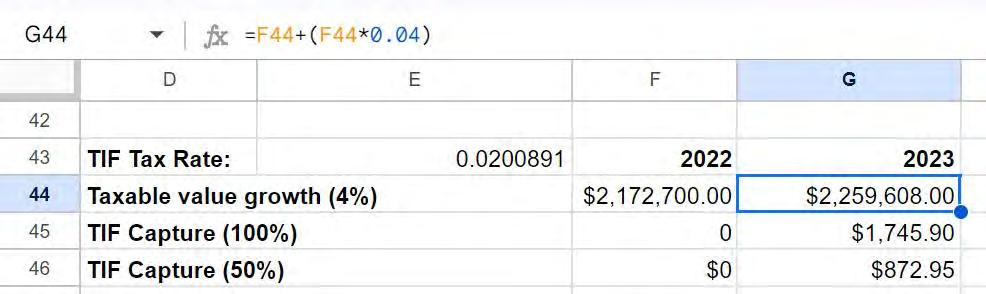
147 2022 Tax Rate Details Tax Authority Holly Area Schools Subject to Capture Summer Taxes State Education Tax 6.0000 School Operating (Non-PRE) 18 School Sinking Fund N/A School Debt 8.5000 Intermediate School District 0.1881 ISD Voted 2.9777 Community College 1.4891 x CC Debt N/A Oakland County General 3.9686 x Total Summer Non-PRE 41.1235 Total Summer PRE 23.1235 Village Tax - Summer 11.6505 x Winter Taxes OC Parks and Rec 0.3431 x Huron-Clinton Metroparks 0.207 x Detroit Zoo Authority 0.0945 Detroit Institute of Arts 0.1945 OC transit 0.95 x Holly Township 1 x Holly Library 0.96 Holly Parks and Rec 0.4808 x Total Winter 4.2299 NOCFA Tax - Winter 4 Total PRE Village 39.004 Total PRE Township 31.3534 Total Non-PRE Village 57.004 Total Non-PRE Township 49.3534 Village Garbage Collection $200.00
Figure 44: Growth Rate Formula
Table 30: Village of Holly Millages Rates 2022
Then, the value of the TIF tax capture at 100% was multiplied by 50% to produce the other capture rate value. Table 30 depicts all the revenue values captured in the Village of Holly throughout the 30-year TIF period.
148 TIF Tax Rate: 0.0200891 2022 2023 2024 2025 2026 2027 2028 2029 2030 Taxable value growth (4%) $2,172,700.00 $2,259,608.00 $2,349,992.32 $2,443,992.01 $2,541,751.69 $2,643,421.76 $2,749,158.63 $2,859,124.98 $2,973,489.98 TIF Capture (100%) 0 $1,745.90 $1,815.74 $1,888.37 $1,963.90 $2,042.46 $2,124.16 $2,209.12 $2,297.49 TIF Capture (50%) $0 $872.95 $907.87 $944.18 $981.95 $1,021.23 $1,062.08 $1,104.56 $1,148.74 TIF Capture (10%) 0 $174.59 $181.57 $188.84 $196.39 $204.25 $212.42 $220.91 $229.75 TIF Capture (8%) 0 $139.67 $145.26 $151.07 $157.11 $163.40 $169.93 $176.73 $183.80 TIF Capture (5%) 0 $87.30 $90.79 $94.42 $98.20 $102.12 $106.21 $110.46 $114.87 2031 2032 2033 2034 2035 2036 2037 2038 2039 $3,092,429.57 $3,216,126.76 $3,344,771.83 $3,478,562.70 $3,617,705.21 $3,762,413.42 $3,912,909.95 $4,069,426.35 $4,232,203.41 $2,389.39 $2,484.97 $2,584.36 $2,687.74 $2,795.25 $2,907.06 $3,023.34 $3,144.27 $3,270.04 $1,194.69 $1,242.48 $1,292.18 $1,343.87 $1,397.62 $1,453.53 $1,511.67 $1,572.14 $1,635.02 $238.94 $248.50 $258.44 $268.77 $279.52 $290.71 $302.33 $314.43 $327.00 $191.15 $198.80 $206.75 $215.02 $223.62 $232.56 $241.87 $251.54 $261.60 $119.47 $124.25 $129.22 $134.39 $139.76 $145.35 $151.17 $157.21 $163.50 2040 2041 2042 2043 2044 2045 2046 2047 2048 $4,401,491.54 $4,577,551.20 $4,760,653.25 $4,951,079.38 $5,149,122.56 $5,355,087.46 $5,569,290.96 $5,792,062.60 $6,023,745.10 $3,400.85 $3,536.88 $3,678.36 $3,825.49 $3,978.51 $4,137.65 $4,303.16 $4,475.28 $4,654.29 $1,700.42 $1,768.44 $1,839.18 $1,912.74 $1,989.25 $2,068.82 $2,151.58 $2,237.64 $2,327.15 $340.08 $353.69 $367.84 $382.55 $397.85 $413.76 $430.32 $447.53 $465.43 $272.07 $282.95 $294.27 $306.04 $318.28 $331.01 $344.25 $358.02 $372.34 $170.04 $176.84 $183.92 $191.27 $198.93 $206.88 $215.16 $223.76 $232.71 2049 2050 2051 2052 TIF Period (30 years) Total $6,264,694.91 $6,515,282.70 $6,775,894.01 $7,046,929.77 $22,993,239.37 $4,840.46 $5,034.08 $5,235.45 $5,444.86 $16,087.15 $2,420.23 $2,517.04 $2,617.72 $2,722.43 $8,044 $484.05 $503.41 $523.54 $544.49 $1,608.71 $387.24 $402.73 $418.84 $435.59 $1,286.97 $242.02 $251.70 $261.77 $272.24 $804.36
Table 31: Village of Holly 30-Year TIF Revenues
First-Year Revenue Comparison
We compared the first-year TIF revenue capture to the total tax revenue for each jurisdiction. We did this by first calculating the 2022 total tax revenue for each jurisdiction using data available from the Michigan state treasury Department. We then divided the 100% and 50% TIF revenue captured by each jurisdiction by this amount to come up with a percentage of the total 2022 tax revenue for each jurisdiction.
Normalizing TIF Capture Amounts
We also compared the TIF revenue amounts for each jurisdiction. We did this by normalizing the 100% capture TIF revenue for each jurisdiction using three measures: per capita, per parcel, and per approximate river mile, depicted in tables 32, 33, and 34, respectively. We calculated the per capita revenue by dividing the 100% capture amount by the population of the jurisdiction according to 2020 census data from table P1. We normalized the revenue per river mile by first using the measure tool in google maps to calculate the total length of the river in each jurisdiction. We then cross-referenced the length by having another member measure the distance. We then averaged the two distances. We then divided the 100% capture TIF revenue by the average distance to calculate the revenue per river mile. We normalized the 100% capture TIF revenue per parcel by dividing by the number of residential occupied parcels in each jurisdiction.
149
Table 32: Normalized 30 Year TIF Revenue Per Capita
150 30-Year Total Revenue at 100% Capture per Capita Total Population Holly Township $17,304 $3 6031 Holly Village $97,919 $8 12006 Fenton City $1,431,645 $119 12014 Fenton Township $2,309,898 $137 16843 Linden City $1,148,822 $277 4142 Argentine Township $298,483 $42 7091 Burns Township $261,069 $80 3280 Byron Village $133,544 $245 545 Vernon Township $75,489 $18 4273 Shiawassee Township $101,280 $37 2740 Vernon Village $30,553 $41 738 Venice Township $14,668 $6 2422 Caledonia Township $132,009 $30 4360 Corunna City $287,265 $94 3046 Owosso City $367,120 $25 14714 Owosso Township $255,097 $54 4765 Rush Township $222,712 $176 1268 New Haven Township $145,752 $120 1218 Brady Township $9,174 $4 2142 Chesaning Township $21,740 $73 299 Oakley Village $1,211 $0 4748 Chesaning Village $246,279 $101 2430 Total Capture $7,609,033
Table 33: Normalized 30 Year TIF Revenue Per Parcel
151
30-Year Total Revenue at 100% Capture Per Parcel Number of Parcels Holly Township $17,304 $666 26 Holly Village $97,919 $2,720 36 Fenton City $1,431,645 $5,362 267 Fenton Township $2,309,898 $5,384 429 Linden City $1,148,822 $10,077 114 Argentine Township $298,483 $2,278 131 Burns Township $261,069 $1,652 158 Byron Village $133,544 $3,339 40 Vernon Township $75,489 $2,359 32 Shiawassee Township $101,280 $1,426 71 Vernon Village $30,553 $2,546 12 Venice Township $14,668 $2,095 7 Caledonia Township $132,009 $1,483 89 Corunna City $287,265 $4,353 66 Owosso City $367,120 $6,018 61 Owosso Township $255,097 $1,947 131 Rush Township $222,712 $2,296 97 New Haven Township $145,752 $2,242 65 Brady Township $9,174 $706 13 Chesaning Township $21,740 $870 25 Oakley Village $1,211 $404 3 Chesaning Village $246,279 $4,561 54 Total Capture $7,609,033
Table 34: Normalized 30 Year TIF Revenue Per Approximate River Mile
152
30-Year Total Revenue at 100% Capture Per River Mile Approximate River Miles Holly Township $17,304 $11,852 1.46 Holly Village $97,919 $28,138 3.48 Fenton City $1,431,645 $331,783 4.315 Fenton Township $2,309,898 $615,153 3.755 Linden City $1,148,822 $437,646 2.625 Argentine Township $298,483 $27,098 11.015 Burns Township $261,069 $28,501 9.16 Byron Village $133,544 $121,403 1.1 Vernon Township $75,489 $20,513 3.68 Shiawassee Township $101,280 $11,329 8.94 Vernon Village $30,553 $45,601 0.67 Venice Township $14,668 $6,447 2.275 Caledonia Township $132,009 $26,063 5.065 Corunna City $287,265 $116,302 2.47 Owosso City $367,120 $121,563 3.02 Owosso Township $255,097 $96,811 2.635 Rush Township $222,712 $36,038 6.18 New Haven Township $145,752 $31,378 4.645 Brady Township $9,174 $8,574 1.07 Chesaning Township $21,740 $72,465 0.3 Oakley Village $1,211 $158 7.645 Chesaning Village $246,279 $94,723 2.6 Total Capture $7,609,033 88.105
D: SURVEY QUESTIONS
SRWTC TIF Familiarity Survey
Introduction
We are a group of graduate students at the University of Michigan working for a workshop course with the Shiawassee River Water Trail Coalition. For this project, we are analyzing potential options to fund water trail improvements along the Shiawassee River, focusing especially on the potential feasibility of using tax increment financing (TIF). For this initial assessment, we have developed a short set of questions for community leaders like yourself to help us understand local experiences with TIFs and your thoughts regarding them.
This survey should take only several minutes to complete. Please note that any information provided in this survey will be used for research purposes only and will remain confidential; any information we report from the survey will not provide any attribution or identify respondents otherwise.
Q1 What Jurisdiction do you represent?
Q2 Are you familiar with Tax Increment Financing?
◎ Yes
◎ No
Q3 Is your familiarity with TIF(s) based on direct experience with using a TIF as a development tool, or some other source of information?
◎ Based on direct experience with TIF
◎ NOT Based on direct experience with TIF (Please briefly note source) __________________________________________________
Q4 Is your familiarity with TIF(s) based on direct experience with using a TIF as a development tool, or some other source of information?
◎ Based on direct experience with TIF
◎ NOT Based on direct experience with TIF (Please briefly note source)
Q5 What type of TIF(s) does your community use?
◎ Downtown Development Authority (DDA)
◎ Tax Increment Finance Authority (TIFA)
◎ Local Development Financing Authority (LDFA)
◎ Brownfield Redevelopment Authority (BRA)
Q7 Has the use of the TIF produced the results for which it was created? (Yes or No, please explain).
Q6 Please provide some positive examples where the TIF has advanced community goals (if possible), and examples where use of the TIF has been problematic (if applicable).
Q7 What types of improvements would you like to see along the Shiawassee River? (Check all that apply).
▢ Projects that enhance economic development (e.g., new access, signage)
▢ Projects that enhance environmental sustainability (e.g., managing stormwater runoff)
▢ Projects that focus on increased access to the river (e.g., new put-ins)
▢ Projects that link the trail to other recreational opportunities (e.g., increase connections within current parks)
▢ Projects that provide improved infrastructure/amenities along the river (e.g., restrooms)
▢ Projects that enhance wildlife habitat along the river
▢ Other (please briefly describe)
__________________________________________________
________________________________________________________________
153
E: INTERVIEWEES
Michigan TIF Experts
• Jason Allen, former Michigan State Legislator
• Harry Burkholder, Chief Operating Officer, Traverse City Downtown Development Authority
• Kevin Christiansen, Economic and Community Development Director, City of Farmington
• Rebecca Harvey, Senior Principal Planning Consultant, McKenna
• Kate Knight, Executive Director, Farmington Downtown Development Authority
• Sara McCallum, Accounting Director/Deputy Director, Ann Arbor Downtown Development Authority
• Amber Miller, Capital Projects Manager, Ann Arbor Downtown Development Authority
• Jennifer Morris, Client Representative, OHM Advisors
• Richard Murphy, Program Manager, Michigan Municipal League
• Doug Piggott, Retired Planner
Water Trail and Recreational Trail Experts
• Dan Brown, Watershed Planner, Huron River Watershed Council
• Matt Cowall, Executive Director, Land Information Access Association & Michigan Water Trails
• Candace Gallagher, Director of Operations, American Trails
• Deana Jerdee, Executive Director, Paddle Antrim
• Meija Knafl, Outreach Coordinator, River Raisin Watershed Council
• Lauren Murray, Director of Development, Continental Divide Trail Coalition
• Kris Olson, Watershed Ecologist, Huron River Watershed Council
• Andrea Paine, Program Coordinator, Huron River Watershed Council
• Mike Passo, Executive Director, American Trails
• Elizabeth Riggs, former Deputy Director, Huron River Watershed Council
• Nancy Stewart, Water Recreation Consultant, Minnesota Department of Natural Resources
• Andrea White, Programs Coordinator, Georgia River Network
154
F: INCLUSIVE UNIVERSALLY ACCESSIBLE AND ADA
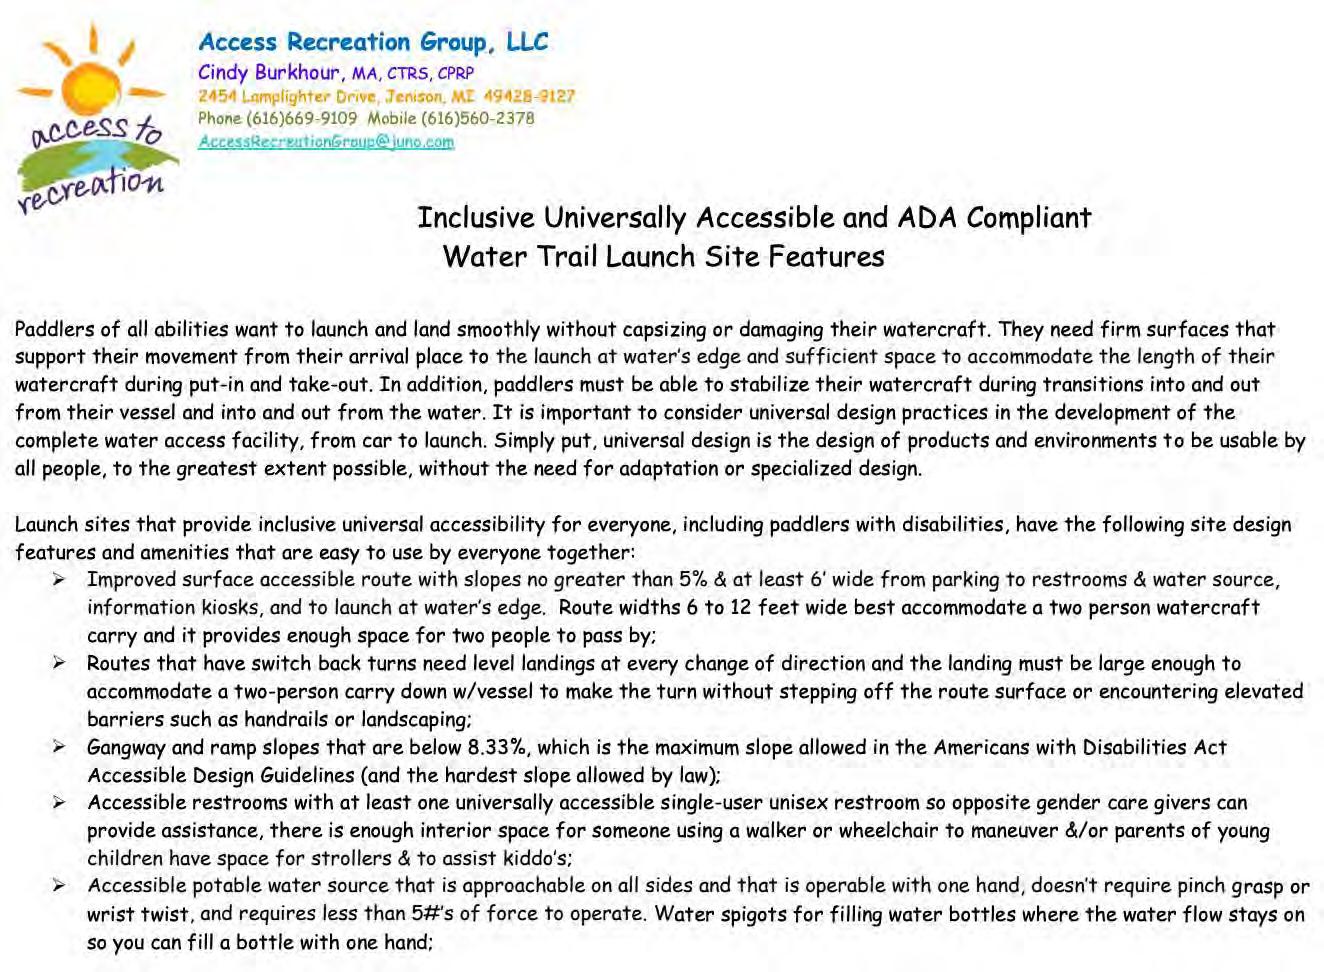
COMPLIANT WATER TRAIL
LAUNCH SITE FEATURES
155
156
Citations
1. Ross, Jenna. “Mapped: The Growth in U.S. House Prices by State.” Advisor Channel, October 17, 2022. https://advisor.visualcapitalist.com/growth-in-u-shouse-prices-by-state/.
157
(Page Intentionally Left Blank)
158
