Preserving Naturally Occurring Affordable Housing in Detroit: A Case Study of Oakman Boulevard Community along the Joe Louis Greenway


University of Michigan
Taubman College of Architecture and Urban Planning
Capstone 2023
ACKNOWLEDGEMENTS
Detroit Housing and Revitalization Department
Kyle Ofori
Rebecca Labov
Roland Gainer
Heather Zygmontowicz
Amy Amador
Keegan Mahoney
Safiya Merchant
Detroit Planning and Development Department
Michele Flournoy
Hanan Yahya
Joseph Kemp
HOPE Village
Debbie Fisher
Jeff Jones
Local Initiatives Support Coalition
Brandon Ivory
Victor Abla
TEAM DESCRIPTION
Neighborhood Service Organization
Katrina McCree
Oakman Boulevard Community Association
Juan Carlos Angeles
David Morgan
Poverty Solutions at the University of Michigan
Alexa Eisenberg
Southwest Housing Solutions
Tim Thorland
Detroit Landlords
Warren Emerson
Thomas Ihrie
This student-led team includes eleven second-year master’s degree candidates in the Urban and Regional Planning program at the Taubman College of Architecture and Urban Planning at the University of Michigan. The names of individual team members are listed below.
Maya Baker
Melika Belhaj
Anthony Bui
Christian Carroll
David Elam
Alexis Farrell
Maria Garcia Reyna
Tianhong Ge
Nick Hill
Michelle Marin
Yifei Sun
Our team was guided by faculty advisor Dr. Lan Deng and graduate student instructor Rand Makarem.
2 | Preserving Small Multi-Family NOAH Properties
TEAM DESCRIPTION | 3
TABLE
CONTENTS 4 | Preserving Small Multi-Family NOAH Properties List of Figures, Tables, and Maps ............................................................................................................. 6 Executive Summary ...................................................................................................................................... 7 Goals of the Study ......................................................................................................................................... 9 Introduction .................................................................................................................................................... 10 The Joe Louis Greenway ................................................................................................................................... 12 Lessons Learned: Implications from Atlanta and Chicago ............................................................. 13 Naturally Occurring Affordable Housing (NOAH) ............................................................................... 14 The Oakman Boulevard Community .......................................................................................................... 15 Methodology ................................................................................................................................................. 22 General Approach ............................................................................................................................................... 24 Property Analysis Methodology .................................................................................................................. 24 Community Engagement Methodology ................................................................................................... 25 Policy Research Methodology ...................................................................................................................... 27 Findings and Analysis ................................................................................................................................ 28 Property Analysis ................................................................................................................................................ 30 Oakman Boulevard Community Neighborhood NOAH Property Overview .......... 30 Recent Market Trends, Landlord Analysis, and Rent Distribution ................................ 35 Summary of Findings from Property Research ..................................................................... 40 Community Engagement ................................................................................................................................. 42 Summary of Findings .......................................................................................................................... 42 Policy Research .................................................................................................................................................... 44 Existing Preservation Efforts in Detroit ..................................................................................... 44 State & Federal Programs ................................................................................................................ 46 Case Studies of NOAH Preservation Policies in Other Cities ........................................ 47 Limitations ..................................................................................................................................................... 56 Timeline .................................................................................................................................................................... 58 Data Sources and Reliability ......................................................................................................................... 58 Constraints of Research Capacity .............................................................................................................. 58 Difficulty in Landlord Identification and Outreach ............................................................................. 58 TABLE OF CONTENTS | 5 Recommendations ...................................................................................................................................... 60 Conclusion ..................................................................................................................................................... 68 References ..................................................................................................................................................... 69 Appendix A: Oakman Boulevard Maps .................................................................................................. 71 Appendix B: Oakman NOAH Property Profiles ................................................................................... 75 Appendix C: Small Multi-Family NOAH Database Development Methodology ....................... 121 Appendix D: NOAH Properties Price per Unit ................................................................................... 128 Appendix E: Windshield Survey Results .............................................................................................. 129 Appendix F: Best Practices for PILOT Programs – An Evaluation of the Memphis Downtown Property PILOT ............................................................................................................................................ 131
OF
LIST OF FIGURES, TABLES, AND MAPS
EXECUTIVE SUMMARY
In October 2017, the City of Detroit officially announced a plan to construct a 27.5mile greenway system called the Joe Louis Greenway (JLG). In May 2021, the JLG Framework Plan was published and construction of the JLG recently began in the Midwest and Barton-McFarland communities.1 Although the planned Joe Louis Greenway stands to elevate and connect neighborhoods in Detroit that have experienced historic and systemic disinvestment, including the Oakman Boulevard Community neighborhood, the Greenway may also create pressure on the local housing market. Government initiatives ought to be pursued to preserve the affordability and physical condition of naturally occurring affordable housing (NOAH) in neighborhoods like Oakman. Our graduate student-led team conducted property, neighborhood, and policy research as well as outreach to local stakeholders to develop recommendations for the City of Detroit’s Housing and Revitalization Department (HRD) to preserve and improve forty-five small multi-family NOAH properties in Oakman. Our research guided not only policy and program recommendations, but it also helped us generate a property and neighborhood research methodology that can be replicated in other Detroit neighborhoods along the Joe Louis Greenway. Our research and recommendations aim to aid HRD in mitigating the negative effects that the Greenway may pose to Oakman’s more vulnerable renter residents and small landlords. This study identifies five recommendations to assist in the preservation of NOAH properties in the Oakman Boulevard Community neighborhood, each with strategies for accomplishing the recommendations.
Create and Maintain a NOAH Preservation Database
• Build a NOAH property database and monitor market dynamics of NOAH properties in neighborhoods of concern and maintain a database of NOAH properties on a continual basis.
• Conduct landlord outreach for at-risk NOAH properties: host open houses, produce informational flyers, and provide a banner link on the City website specifically for landlords of NOAH properties.
Mitigate issues related to low Certificate of Compliance rates
• Prioritize resident safety: alter code enforcement programs so that they function to assist property owners in achieving compliance rather than penalizing and disincentivizing them.
• Expand the Landlord Home Repair Program (LRP) to both occupied properties and properties with more than 2 units: dedicate LRP funds beyond the scope of unoccupied properties once the program rolls out in late 2024.
• Reduce the penalty for a failed lead inspection: reducing the penalty for failed lead inspections may incentivize more property owners to formally register their rental properties.
6 | Preserving Small Multi-Family NOAH Properties Introduction .................................................................................................................................................... 10 Figure 1: The Planned Route of the Joe Louis Greenway ................................................................. 12 Figure 2: Census Tracts in Oakman Boulevard Community .......................................................... 16 Table 1: Oakman Boulevard Community Population Demographics by Census Tract ..... 16 Table 2: Oakman Boulevard Community Housing Demographics ............................................. 17 Figure 3: 2021 Median Age in Oakman ..................................................................................................... 18 Figure 4: 2021 Percent of Vacant Housing Units .................................................................................. 19 Methodology .................................................................................................................................................. 22 Table 3: Refining Small Multi-Family NOAH Property Data ........................................................... 25 Figure 5: Image of JLG Engagement Event ............................................................................................ 27 Findings and Analysis ................................................................................................................................. 28 Figure 6: Number of Units Distribution ..................................................................................................... 30 Figure 7: Year Built Distribution .................................................................................................................... 30 Table 4: Oakman NOAH Property Characteristics .............................................................................. 30 Figure 8: Certificate, Violation, and Ownership Statistics (2011-2021) ...................................... 31 Figure 9: CoStar Submarket .......................................................................................................................... 32 Figure 10: Market Comparison - Average Listed Rent (2011-2021) ............................................. 32 Figure 11: Market Comparison - Average Vacancy Percent (2011-2021) ................................... 32 Figure 12: Property Typology in Oakman ................................................................................................. 33 Table 5: Typology 1: Unregistered Properties ........................................................................................ 34 Table 6: Typology 2: Rental Registered Properties ............................................................................. 34 Table 7: Typology 3: Rental Registered & Certificate of Compliance Properties ................ 34 Figure 13: Number of Sales in Oakman Community, 2011-2022 ................................................... 35 Figure 14: Frequency of Property Sales in Selected Detroit Communities ............................ 36 Figure 15: Median price per square foot for multi-family properties in Detroit .................... 37 Figure 16: Small multi-family NOAH properties vs. other multi-family properties in Oakman Boulevard Neighborhood .............................................................................................. 38 Table 8: Price trend statistics for small multi-family NOAH properties in Oakman Boulevard Neighborhood .................................................................................................................. 38 Figure 17: Oakman Community Landlord Footprint throughout the City of Detroit .......... 39 Table 9: Oakman Community Landlord Summary ............................................................................. 40 Table 10: The small-scale scope of Oakman Community Landlords ......................................... 40 Table 11: Summary of Windshield Survey Findings ............................................................................. 43 Table 12: DHFF Programs for NOAH Preservation ............................................................................. 45 Table 13 Tax-Based Strategies ....................................................................................................................... 48 Table 14 - Alternative Financing Case Studies ...................................................................................... 50 Table 15 - Other Types of Support ............................................................................................................... 53
EXECUTIVE SUMMARY | 7
Address the financial needs of NOAH properties
• Earmark a portion of Detroit Housing for the Future Funds (DHFF) for preservation and rehabilitation loans for small-scale NOAH: conduct targeted outreach to NOAH property owners and set aside DHFF funds to ensure that they have access to specialized loan products.
• Assist loan recipient NOAH properties in applying for the local PILOT program, or other tax abatement; once enacted: utilize the local PILOT program to help loan recipients cover their debt repayment
• Partner with local organizations to provide building electrification services for NOAH properties: support NOAH properties through companies and organizations that can improve the quality of the NOAH housing stock, especially in relation to the mechanical systems of the structure.
Make NOAH properties a sustainable financial model
• Make adjustments to the in-progress PILOT program: monitor transitions out of the program, increase transparency provided through annual reporting, and consider yearly compliance checks with NOAH property owners.
• Package the PILOT program with rehabilitation funding: increase funding opportunities and target outreach from DHFF, LISC Detroit, and HRD.
Provide institutional support to NOAH property owners
• Create a single landlord portal where landlords can find information regarding Rental Registration, Certificate of Compliance, Building Codes, Ordinances, and links to available resources such as the free Capital Needs Assessment and DHFF Funding Projects: a centralized portal would be a valuable resource for improving the knowledge base for NOAH landlords and tenants.
• Create a formalized network for NOAH property owners that can connect them with other property owners, experienced developers, contractors, and City representatives: building a network would allow NOAH property owners to have more resources at their disposal.
Endnotes
1. Joe Louis Greenway. (n.d.). City of Detroit. https://detroitmi.gov/departments/ general-services-department/joe-louis-greenway
GOALS OF THE STUDY
Mission + Vision
Our mission was to produce a plan with recommendations to help preserve the physical condition and affordability of naturally occurring affordable housing (NOAH) in the Oakman Boulevard Community neighborhood of Detroit, in light of the construction of the Joe Louis Greenway. The outcome of our project aims to offer the City of Detroit’s Housing and Revitalization Department (HRD) NOAH preservation actions based on accessible data to support both the Oakman Boulevard Community neighborhood and other similar neighborhoods. We hope that this analysis will equip decision-makers with wellresearched evidence of public action that can support NOAH landlords to maintain affordable rents while improving the physical property condition.
8 | Preserving Small Multi-Family NOAH Properties
GOALS OF THE STUDY | 9

01 Introduction
Many American cities are turning to greenways as part of their urban redevelopment strategy, with examples such as Atlanta’s BeltLine and Chicago’s 606 Trail. Those greenway experiences show that they have been successful in attracting development and new residents to urban neighborhoods that have long experienced disinvestment. However, greenways can also raise concerns about potential economic and social costs for disadvantaged populations due to the loss of affordable housing as a result of increased investment in these neighborhoods. A similar greenway initiative, the Joe Louis Greenway (JLG), has begun development in the City of Detroit. Partnering with HRD, our team has examined the availability and characteristics of small-multifamily NOAH properties in the Oakman Boulevard Community neighborhood located in the Northwest section of the greenway, identified the risks those properties are facing, and proposed
five pertinent. recommendations to promote the preservation of such housing.
The Joe Louis Greenway
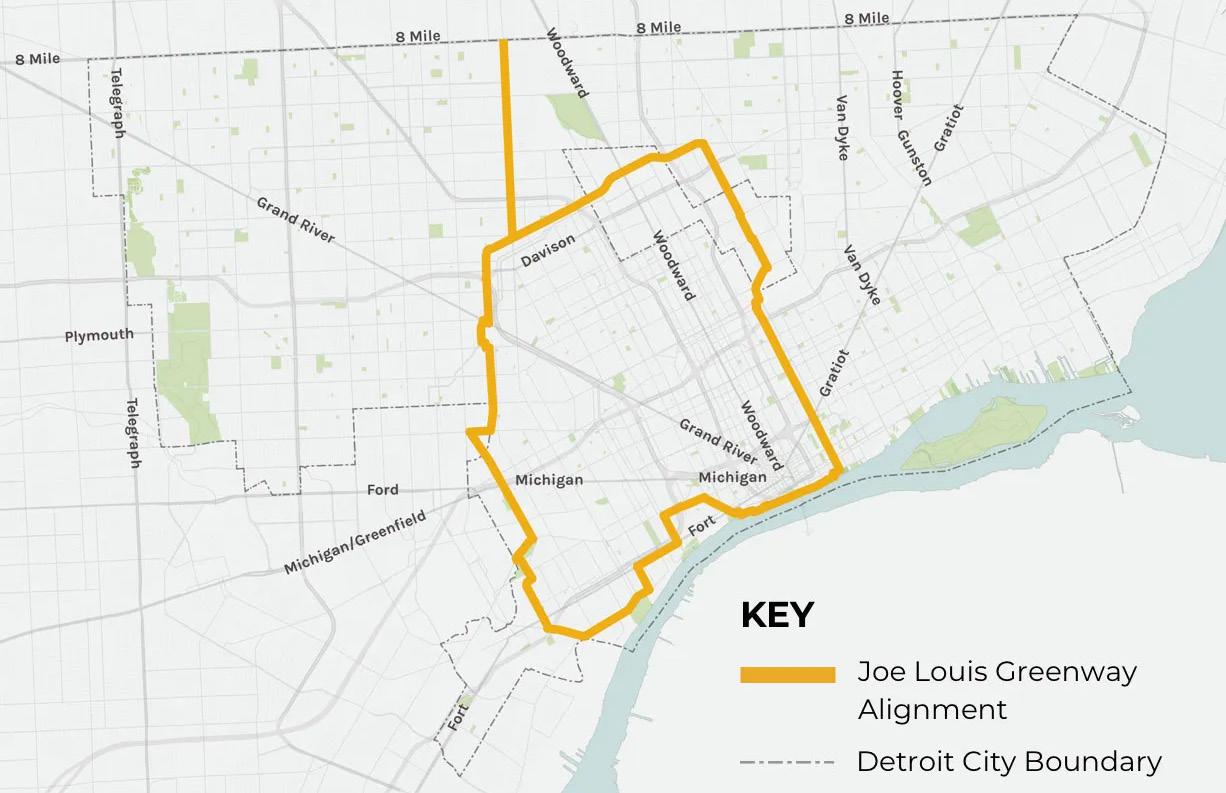
The Joe Louis Greenway is a 27.5-mile walking, hiking, and biking trail project initiated by the City of Detroit in partnership with the cities of Hamtramck, Highland Park, and Dearborn.1 Construction began in 2022 and is part of a broad vision for the City. As shown in Figure 1, the JLG will connect residents and visitors of more than 20 communities, consisting of on- and off-street protected bike lanes and walking paths, connecting to existing paths such as the Dequindre Cut, Detroit Riverwalk, and the Iron Belle intrastate trail. 2 To examine JLG’s potential impacts on nearby neighborhoods, we first looked at research done on similar greenway projects in other cities to identify some key lessons.
Lessons Learned: Implications from Atlanta and Chicago
Atlanta BeltLine
The Atlanta BeltLine is a 22-mile loop of existing and proposed shared-use trails surrounding Atlanta, Georgia. Acting as an impetus for the JLG, the BeltLine uses former railroad right-of-way to connect 45 neighborhoods that were historically divided by race and class. Supported by a public-private partnership and managed by Atlanta BeltLine Inc., the BeltLine aims to build “a more equitable and inclusive Atlanta and engage partners by delivering transformative public infrastructure that enhances mobility, fosters culture, and improves connections to economic opportunity.”3
The first segment of the BeltLine opened in 2008. As other portions of the BeltLine opened, many neighborhoods, especially along the Eastside trail of the BeltLine, have been experiencing gentrification as new developments have increased. Rents and property values have accelerated as investors purchased adjacent properties at low costs and converted them to highend living.4 In 2022, renters paid more than 50% higher to live along the Eastside trail of the BeltLine compared to 2021. In Reynoldstown, a neighborhood along the Eastside trail, rents increased by 54% with a one-bedroom apartment lease starting at $2,000 per month.5
The rapid changes in affordability along the BeltLine have raised concerns of displacement in the majority-Black and low-income neighborhoods in the south and west sides of Atlanta, which have experienced decades of disinvestment. Landlords are likely to increase rent in
light of higher property taxes and higher demand for housing along the BeltLine.6 To protect long-time Atlanta homeowners, the BeltLine implemented its Legacy Retention Program. The Legacy Retention Program provides property tax assistance to Atlanta homeowners on the west and south sides of the trail by covering the cost of property tax increases through 2030. However, the program provides no mechanism that protects renters.7
Chicago’s 606 Trail
The 606 Trail (also known as the Bloomingdale Trail) is a 2.7-mile shared-use elevated trail built on an abandoned railway in Chicago’s northwest side. Completed in 2015, the 606 connects four diverse neighborhoods with a potential expansion eastward toward the Lincoln Yards development site. The $95 million project was funded in part by the federal, state, and local government as well as philanthropy, and is managed under a public-private partnership.8
Following the 606’s opening in 2015, gentrification has been rampant in close proximity to the trail. The eastern segment of the trail, home to a majority white and affluent neighborhoods of Bucktown and Wicker Park, has experienced gentrification dating back to the 1980s and the addition of the trail has only marginally increased gentrification in the neighborhoods.9 However, the western segment of the 606, home to the working-class neighborhood of Logan Square and the majority-Hispanic Humboldt Park neighborhood, experienced significant price increases driven by demand and desire to be close to the 606.10
Properties along the 606 are significantly at risk of being converted to luxury housing. Older multi-family apartments with belowmarket rents are being sold and demolished for single-family homes or luxury condos,
12 | Preserving Small Multi-Family NOAH Properties
Source: Detroit Greenways Coalition
Figure 1: The Planned Route of the Joe Louis Greenway
INTRODUCTION | 13
causing widespread displacement, rising rents, and loss of community character.11 In response, the Chicago City Council passed a temporary moratorium on demolitions close to the 606 in January 2020. Then, in January 2021, the City Council passed a “deconversion ordinance” that bans singlefamily homes without a zoning change on blocks where greater than 50% of the lots are multi-family buildings.12
Lessons for Detroit
The Atlanta BeltLine and Chicago’s 606 Trail provide insights into the potential effects on housing that Detroit’s Joe Louis Greenway may have. In both greenways, following the completion of the trail, rents have increased significantly, and disadvantaged populations have faced greater housing instability.
The effects of the greenways present concerns that the Joe Louis Greenway could also convert existing affordable housing into market-rate housing and increase housing instability for vulnerable populations. In a city that is majority Black and low-income, the impacts of the Joe Louis Greenway would potentially be more striking when compared to Atlanta and Chicago.
In the Oakman Boulevard Community neighborhood, where the Joe Louis Greenway is situated at the northern end of the neighborhood, the economic effects of greenway investment can attract new residents and housing developments to the area. As demand for housing in the neighborhood increases, owners of properties that are currently affordable would have the incentive to increase their rent to maximize revenue. This would place existing tenants at risk of losing the only housing they are able to afford, creating an affordable housing crisis in the neighborhood and disrupting livelihoods.
Atlanta and Chicago offer lessons that are applicable to Detroit. City leaders must be cognizant of the implications on housing that the construction of the Joe Louis Greenway continues to have and ensure the preservation of existing affordable housing properties.
Naturally Occurring Affordable Housing (NOAH)
NOAH in Detroit
The Detroit housing market is unique. Unlike many major U.S. cities, Detroit is known for an oversupply of housing and a high vacancy rate. A quick drive around most Detroit neighborhoods will reveal numerous vacant housing units, many of which are falling into disrepair. Despite the ample supply of housing, decades of discriminatory housing policies, divestment, and exploitive lending practices have limited the availability of affordable rental housing units that are in safe condition in Detroit.13 In 2021, sixty percent of Detroit households living in rental units were cost burdened, meaning they spent over 30% of their income on housing, and thirty-three percent were severely cost-burdened, meaning they spent 50% of their income on housing.14
This study focuses on preserving NOAH in the Oakman Boulevard Community neighborhood in Detroit. According to the definition used by the City of Detroit, NOAH properties are unsubsidized, privatelyowned housing units that are affordable to households earning 60% or less of the Area Median Income (AMI). Since NOAH properties are privately owned and do not carry public subsidies, they are not subject to government affordability restrictions. As a result, their status as affordable housing can change quickly due to market forces. In areas with growing demand, owners may choose to raise rents. Meanwhile,
in areas with weak demand, owners may find it difficult to keep affordable units in decent condition, which can lead to physical deterioration and the eventual loss of units from the affordable housing stock. Furthermore, NOAH properties are not subjected to the same inspection processes as subsidized housing.15 Registered Detroit residential rental properties are required to submit to annual physical inspections and obtain a lead clearance certificate. However, many NOAH properties in Detroit are not registered and are thus not subject to annual physical inspections.16 To complicate matters further, many rental registered properties have not obtained their certificate of compliance limiting the base level inspection and lead clearance necessary to provide a safe renting condition. Furthermore, the high median age of residential properties in Detroit – and specifically the Oakman Boulevard Community17 – dictates that further maintenance and renovation efforts are required for these properties to maintain a livable standard.
NOAH in Oakman Boulevard
Since NOAH properties need to be affordable to households making 60% of AMI, their rents should be less than 30% of this household income level.18 Based on this definition, in 2022, a one-bedroom NOAH unit would be rented for less than $1,000 per month and a two-bedroom NOAH unit would be rented for less than $1,209 per month. One issue is that AMI is defined at the metropolitan level. Given that the City of Detroit has much lower household income than the surrounding suburban communities, most of the unsubsidized housing units in the Oakman Boulevard Community neighborhood fall within the NOAH criteria. Since properties of different sizes may have different dynamics, our project focuses on a particular type of NOAH properties: small multi-family rental properties with between 4 and 36 units.
Throughout this report, we will refer to this specific grouping as NOAH properties. Much of the housing stock within Detroit consists of single-family or single-family conversions to properties under five units, so this study does not capture the majority of NOAH properties that exist in Detroit.
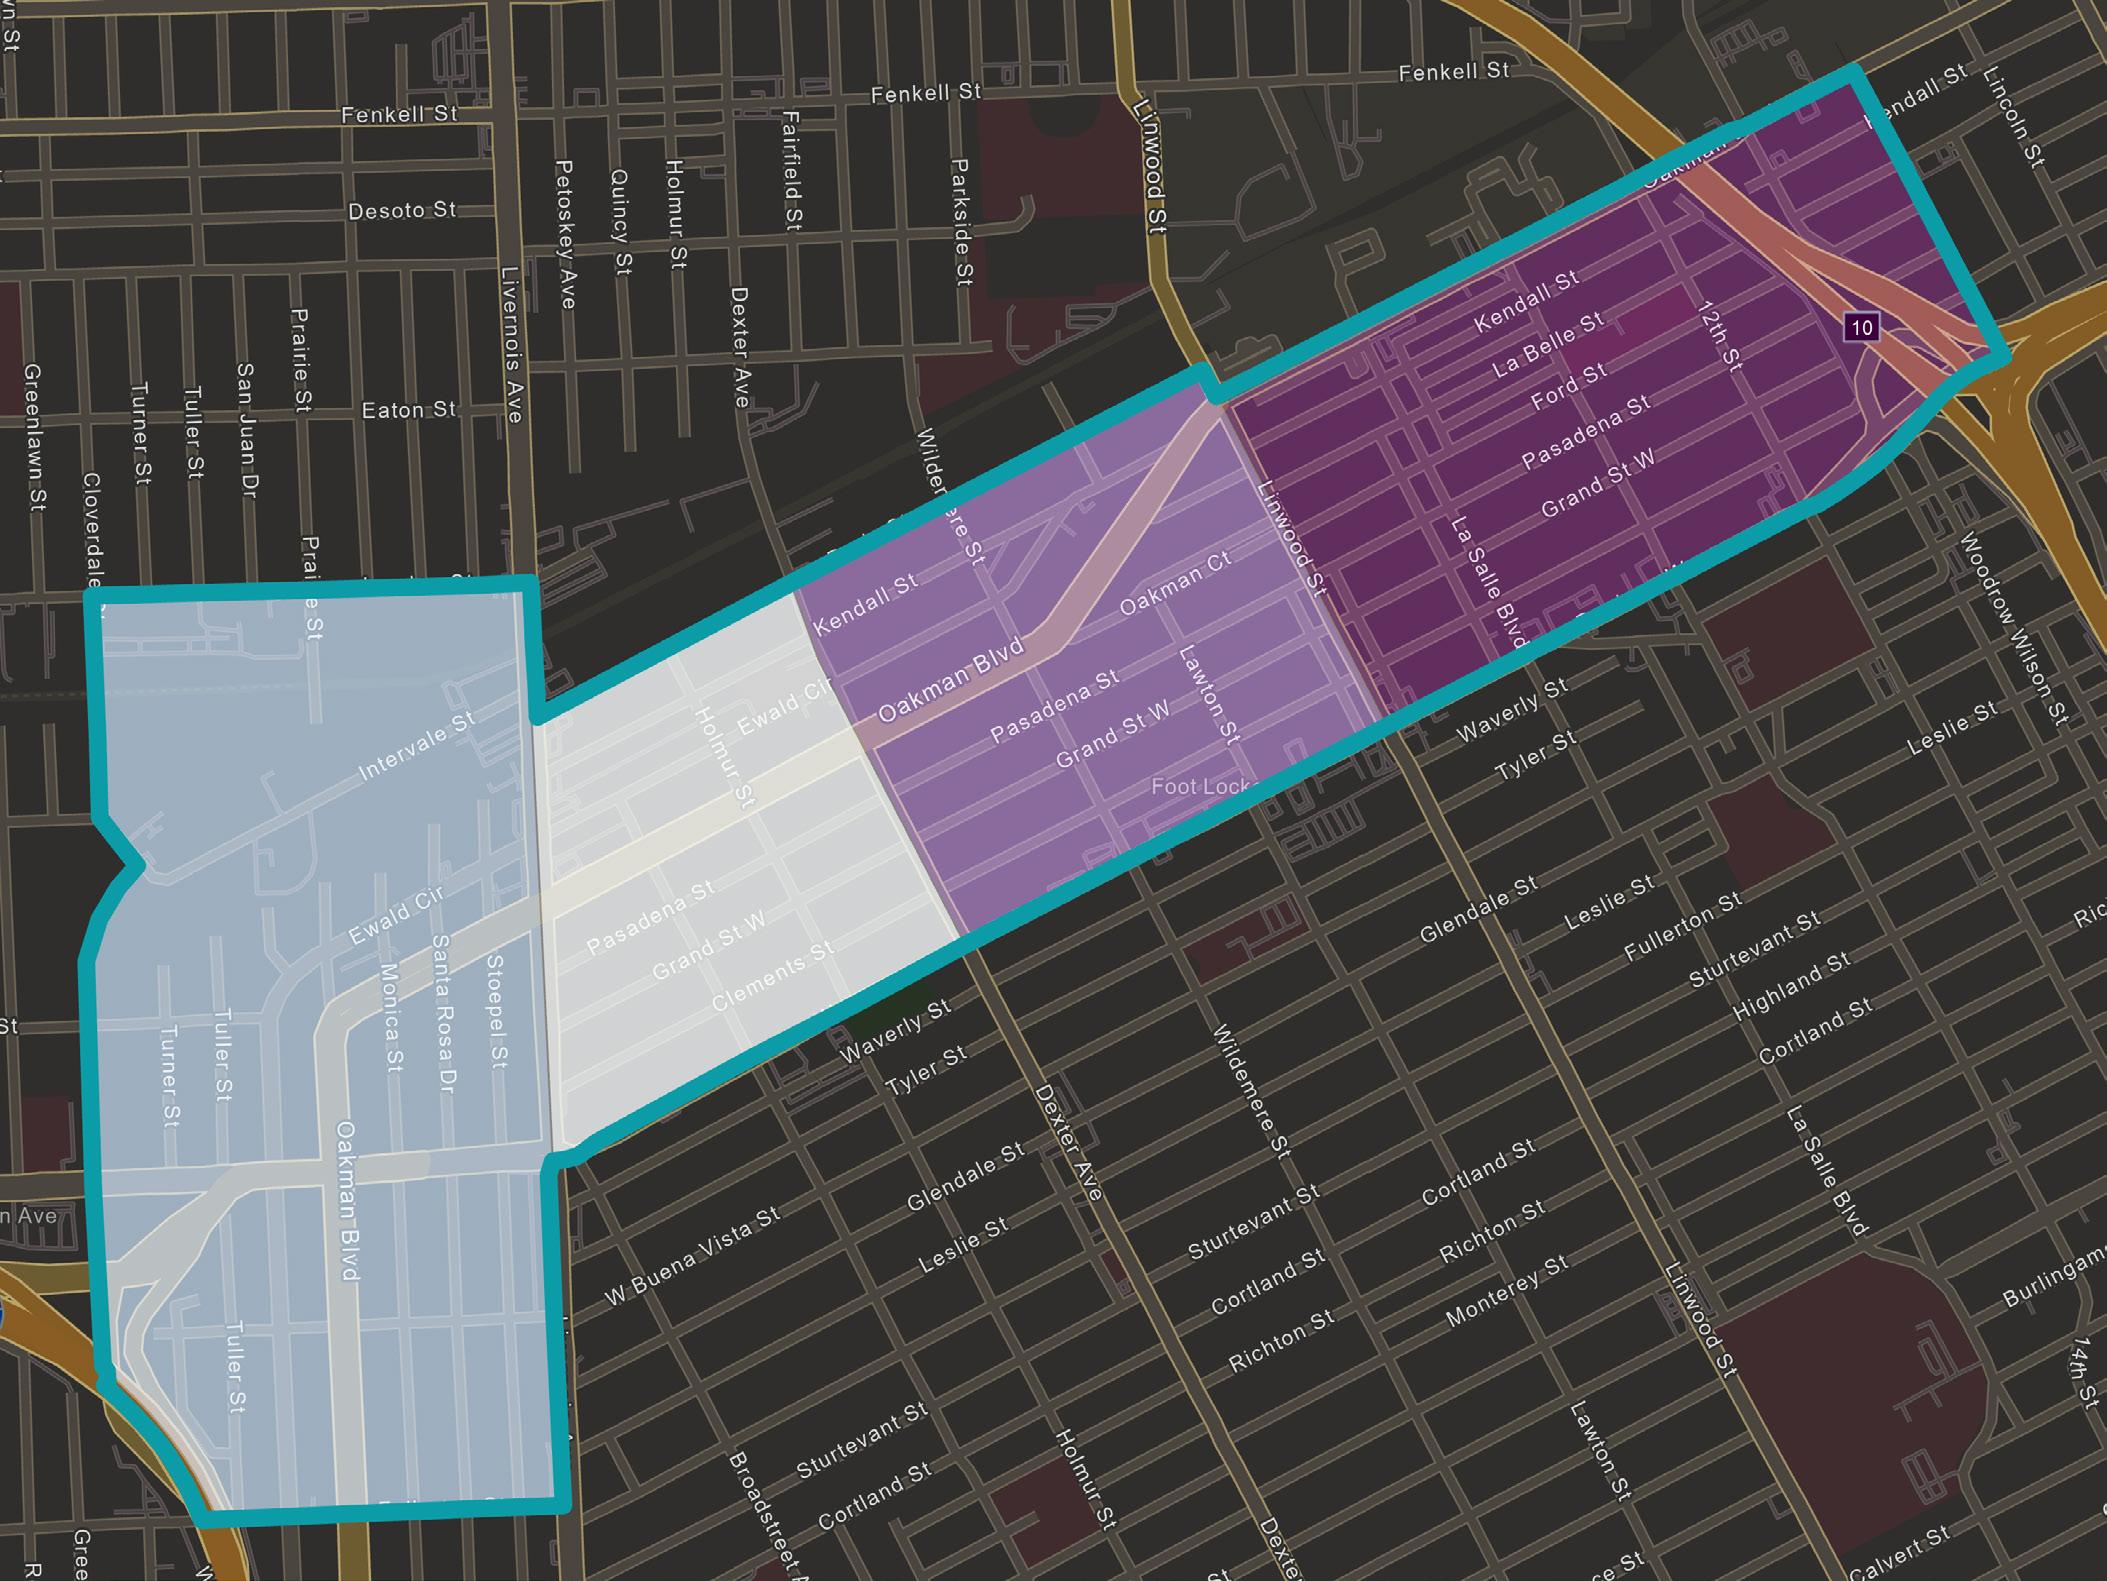
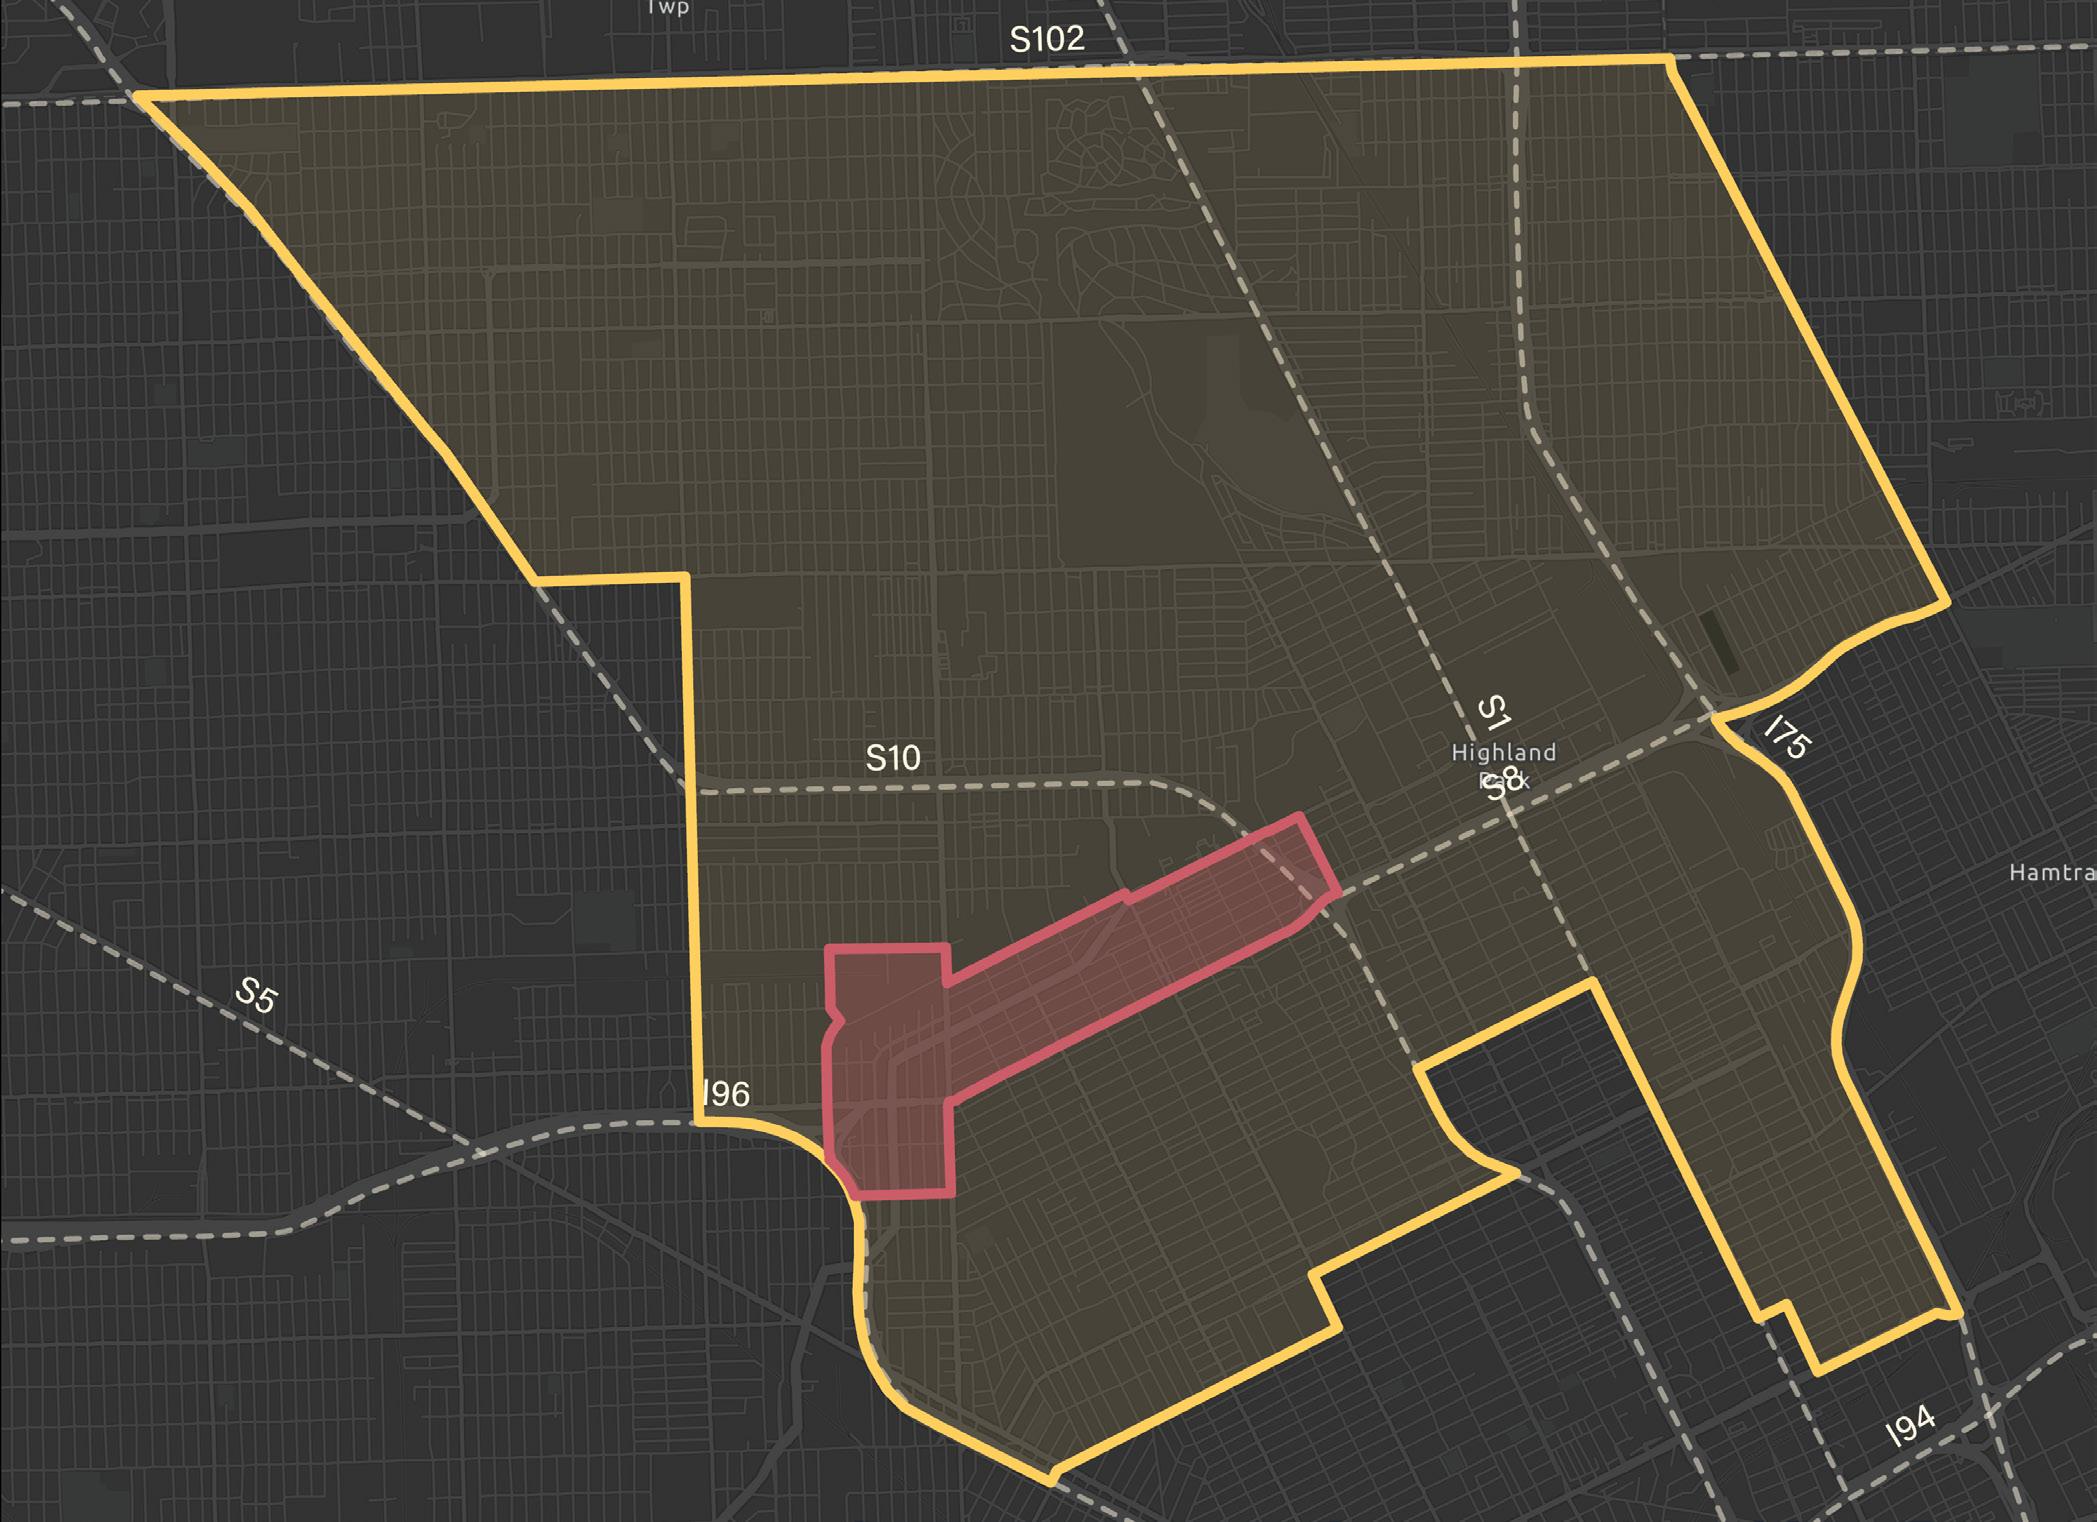
The Oakman Boulevard Community
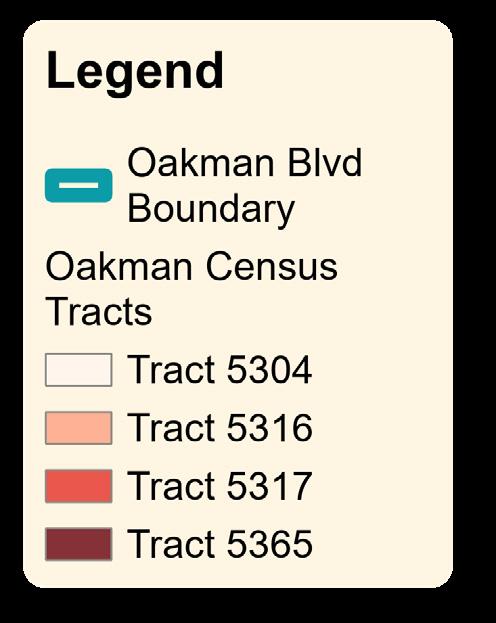
This study focuses on the Oakman Boulevard Community along the JLG. To be consistent with the City’s work on the Greenway, we used the same neighborhood boundary that the Detroit Planning and Development Department has identified in their JLG planning study. Based on this definition, Oakman is a neighborhood that is made up of four census tracts (Tract 5304, Tract 5316, Tract 5317, Tract 5365) as shown in Figure 2. In total, Oakman has 6,228 people, 2,640 households, and 4,104 housing units.19
90.76% of the population identifies as Black or African American (one race), which is much higher than the City-wide percentage of 77.9%. 20 In addition, Oakman appears to be composed of a higher female demographic when compared to the City, particularly in Tracts 5304 and 5316. Meanwhile, the age of the population within Oakman seems to be rather consistent with the City as the voting age population is within 5% of the City’s percentage. One other important takeaway is that Oakman appears to have a higher prevalence of non-family households when compared to the City, especially in Tract 5317. Therefore, when compared to the City, the Oakman community is a majority Black community that is likely to have a higher demographic of single, female-led households.
14 | Preserving Small Multi-Family NOAH Properties INTRODUCTION | 15
Another important consideration of the Oakman Boulevard Community would be its housing and economic characteristics. The data in the chart below breaks it down by census tract to gain a deeper understanding of this area. As Table 1 shows, the Oakman Boulevard Community stood out for several characteristics:
• Oakman has a total of 2,640 households and 4,104 housing units.

• The majority of occupied housing is made up of rental housing.
• The census tract with the highest median household income (Tract 5365) is almost 1.5 times greater that of the lowest (Tract 5304).
• The vacancy rate in Oakman is consistently higher than the City.
• The homeownership rate in Oakman is consistently lower than the City.
• The median housing value stays relatively the same across all four census tracts.
• The median gross rent differs rather significantly between tracts (Tracts 5316 & 5317 are around $700 whereas Tracts 5304 & 5365 are around $800).
Note: All data has come from the ACS 2017-2021 estimate except for median household income in Tract 5317, where the data is not available for this estimate. Instead, we used the median household income data from ACS 2016-2020 estimate for this tract.
16 | Preserving Small Multi-Family NOAH Properties INTRODUCTION | 17 Source: U.S. Census
Bureau, 2022 Census Tracts
Source: ACS 2017-2021 5-year
Figure 2: Census Tracts in Oakman Boulevard Community
estimates
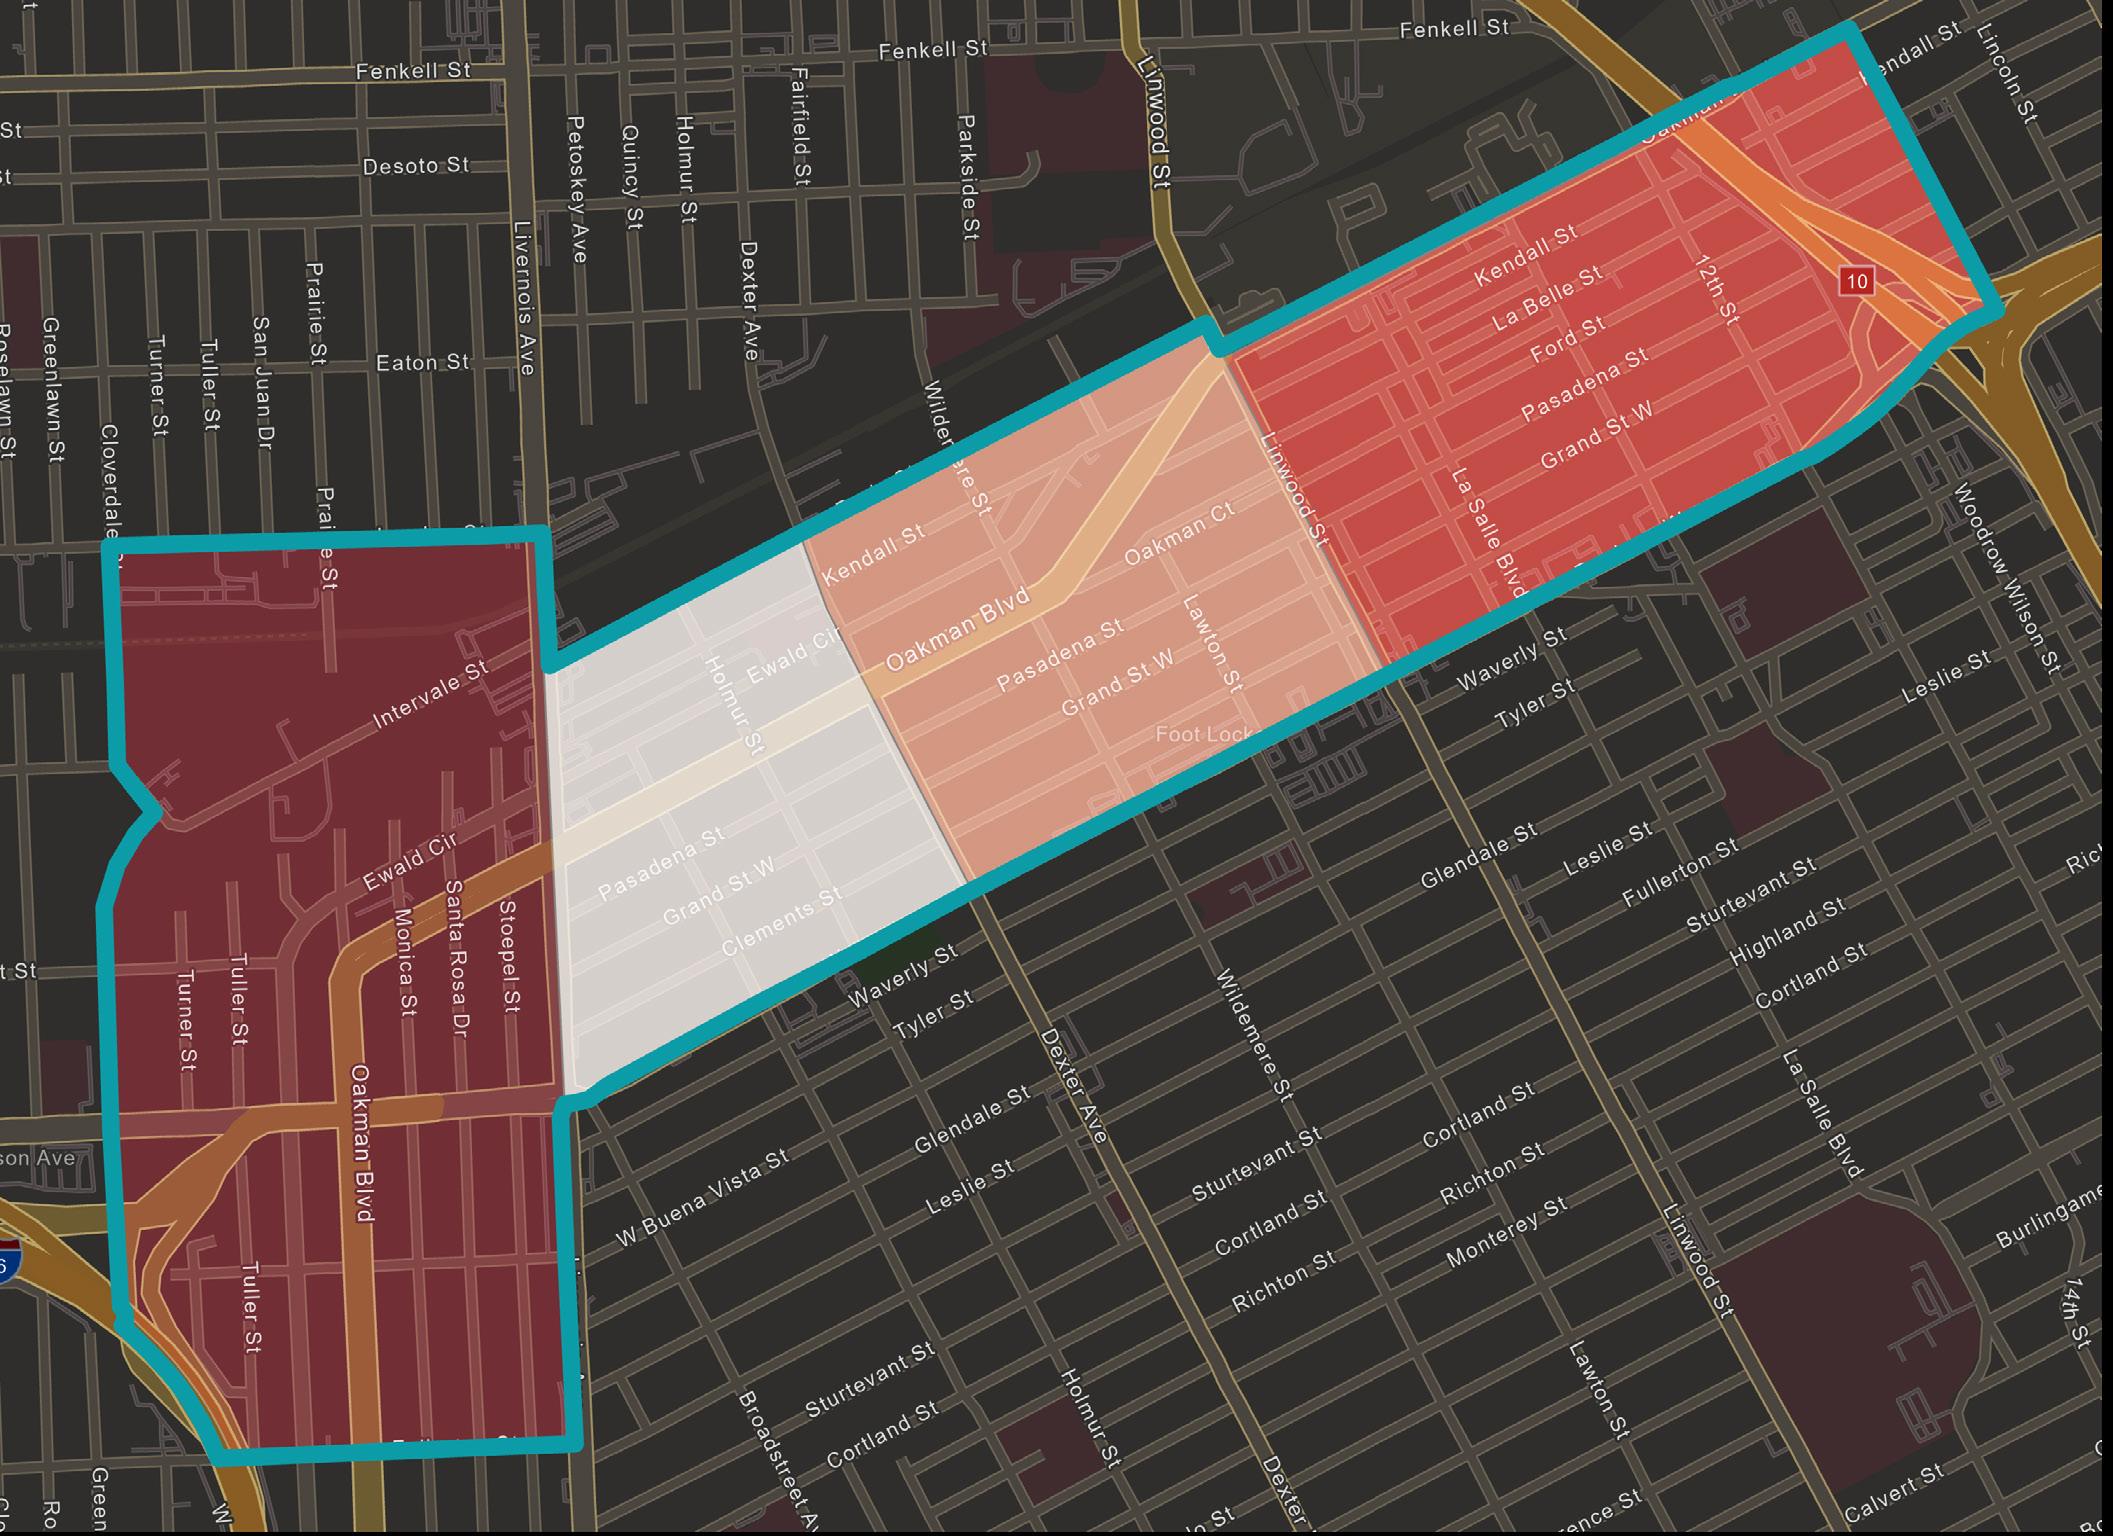
Oakman Boulevard Community Demographics 5365 5304 5316 5317 Detroit Total Population 2,056 1,239 1,811 1,122 632,589 Percent of Population identifying as Black or African American, One Race 77.7% 97.7% 97.7% 95.8% 77.9% Sex Ratio, Males per 100 Females 79.1 51.7 56.8 99.3 71.5 Percent of Voting Age Population 67.95% 67.72% 68.25% 81.11% 73.45% Median Age 35.5 33.8 37 46.8 35.0 Number of Family Households 428 288 303 128 132,517 Number of Non-Family Households 381 224 398 490 119,212 5304 5316 5317 5365
Table 1: Oakman Boulevard Community Population Demographics by Census Tract
Source: ACS 2017-2021 5-year estimates
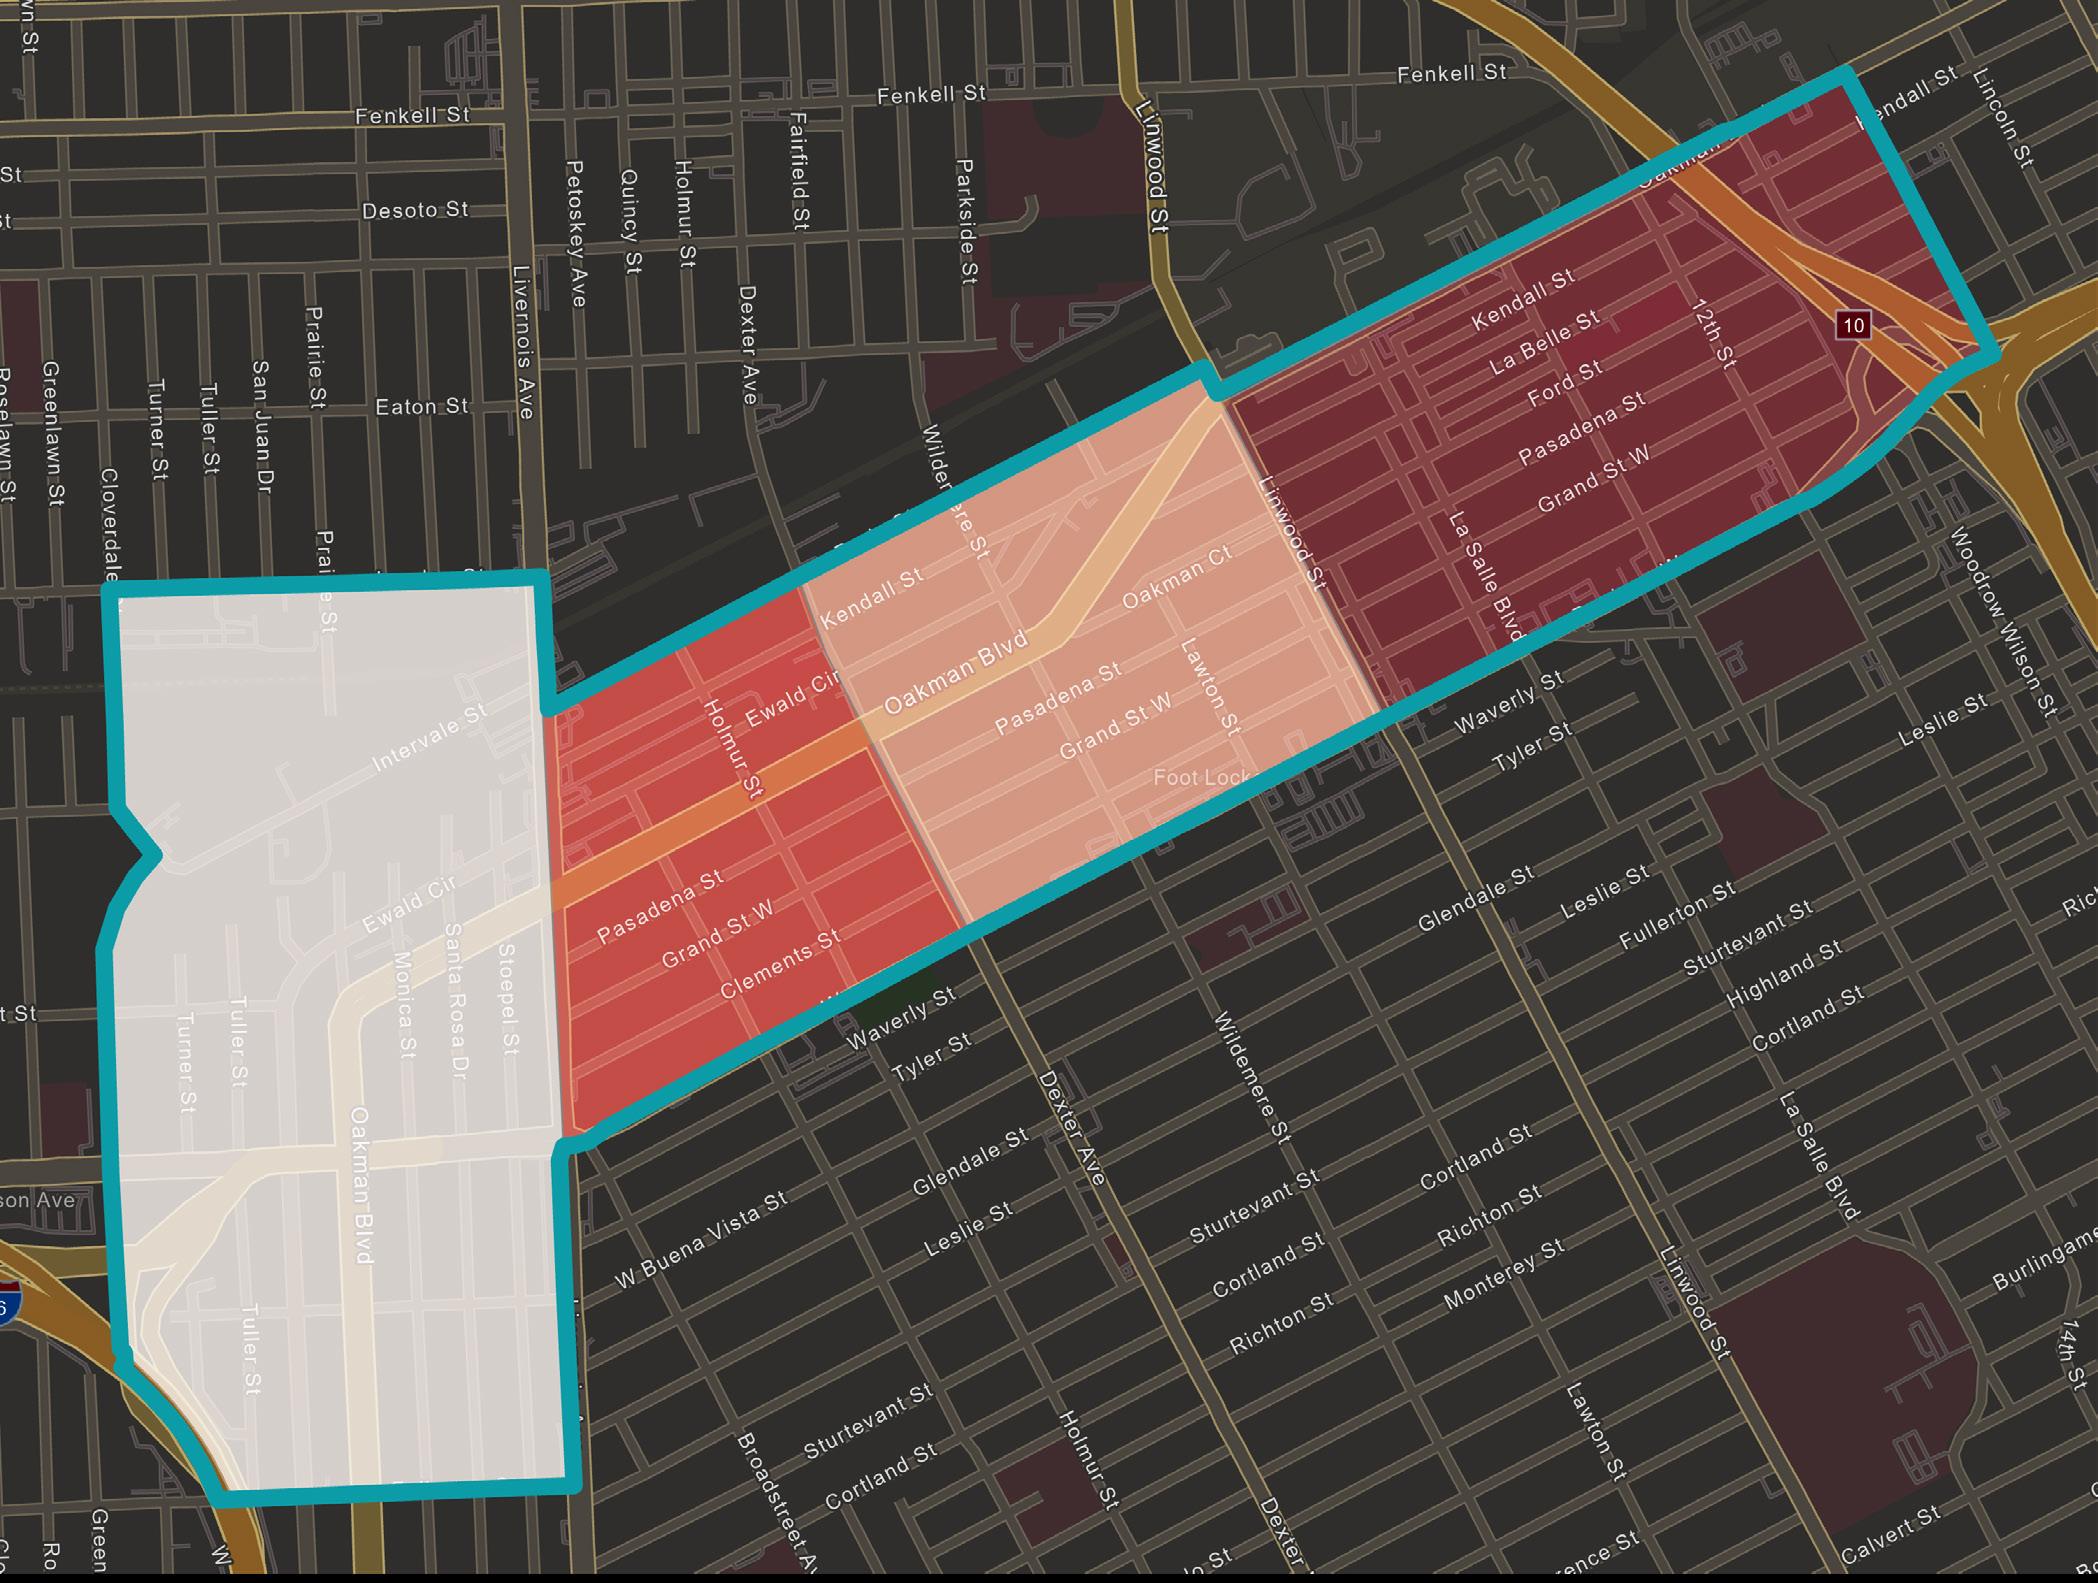
Oakman Boulevard Community Housing and Economic Characteristics 5365 5304 5316 5317 Detroit No. of Households 809 512 701 618 251,729 Median Household Income $29,814 $20,509 $21,094 $20,980 (ACS 2020) $36,140 % below poverty rate 31.2% 48.5% 36.5% 51.4% 30.2% Number of housing units 1,113 802 1,073 1,116 322,906 Number of Vacant Housing Units 304 290 372 498 77,527 Housing Vacancy Rate 27.31% 34.67% 36.16% 44.62% 22.04% Number of owner-occupied units 354 169 250 282 129,084 Number of rental-occupied units 455 343 451 336 122,645 Homeownership Rate 44% 33% 36% 46% 51.28% Median Housing Value $52,700 $48,200 $51,500 $48,700 $69,300 Median Gross Rent $839 $824 $738 $714 $925
Table 2: Oakman Boulevard Community Housing Demographics
When observing specific trends within the Oakman Boulevard Community, one key takeaway is the significance of Tract 5317. Tract 5317 has the highest median age (46.8) and the lowest median household income ($20,980). In addition, it has the lowest median gross rent ($714) and the highest unit vacancy rate (44.62%). Of particular interest is this tract’s relation to the NOAH properties we will identify next: it contains 20 of our 45 target properties. This indicates that Tract 5317 is an extremely valuable location for affordable living conditions. Further Oakman Boulevard Community demographic and statistical maps can be found in Appendix A.
Due to its high vacancy, lower rents, and aging population, Tract 5317 is at higher risk for land speculation and rapidly increased land values. Census data has revealed that over 13% of the vacant units sold in this tract have remained unoccupied. This is nearly double the next closest percentage (6.62% in Tract 5306). 21 Therefore, this may indicate that either properties in Tract 5317 are currently being acquired out of speculation and the purchasers are waiting for favorable market conditions, or purchasers are buying property to renovate in conjunction with the near-term development of the Joe Louis Greenway.
Given that the Oakman neighborhood has some compelling characteristics, it is likely to be more greatly impacted by changing market conditions. When compared to the City at large, these characteristics, including lower rents, higher percentages of nonfamily households, lower median housing value, higher median age, are all potential risk factors that correlate with the property analysis findings within this report.


18 | Preserving Small Multi-Family NOAH Properties INTRODUCTION | 19
Source: ACS 2017-2021 5-year estimates
Figure 3: 2021 Median Age in Oakman
5304
5316
5317
5365
Source: ACS 2017-2021 5-year estimates
Figure 4: 2021 Percent of Vacant Housing Units
5304
5316
5317
5365
Housing
Endnotes
1. Joe Louis Greenway. (n.d.). City of Detroit. https://detroitmi.gov/ departments/general-servicesdepartment/joe-louis-greenway
2. Joe Louis Greenway Framework Plan Vol. 1 The Vision. (2021). General Services Department, SmithGroup, Studio Incognita, Sidewalk Detroit, Toole Design, & HR&A Advisors. Detroit, MI; City of Detroit.
3. About Us. Atlanta Beltline. (n.d.). https:// beltline.org/about-us/
4. Immergluck, D. (2022). Chapter 2: The Beltline as a Public-Private Gentrification Project. In Red hot city: Housing, race, and exclusion in twenty-first century Atlanta (pp. 59–94). essay, University of California Press.
5. Areas around Atlanta See Rent Increases as High as 83% over Last Year. WSBTV Channel 2 - Atlanta. June 3, 2022. https://www.wsbtv.com/news/local/ atlanta/areas-around-atlanta-seerent-increases-high-83-over-last-year/ ATIMRW2BHBGDXII4VNELERDIOY/.
6. Immergluck, D. 2022.
7. Brey, J. (2021, May 4). The Atlanta Beltline Wants to Prevent Displacement of Longtime Residents. Is It Too Late? Next City. https://nextcity.org/urbanist-news/ the-atlanta-beltline-wants-to-preventdisplacement-of-longtime-residents.
8. Frequently Asked Questions. The 606. (2019, May 31). https://www.the606.org/ resources/frequently-asked-questions/.
9. Lee, W. & Greene, M. (2019, June 21). Neighbors Have Embraced the 606 Even as Gentrification and Crime Create a Divided Playground. Chicago Tribune. https://www.chicagotribune. com/news/breaking/ct-606-trailneighborhoods-20190623-20190621ilxlcfqhjffkfgt6rx5k7fyn34-story.html.
10. Smith, G. et al. (2016, November 1). Measuring the Impact of the 606. Institute for Housing Studies - DePaul
University. https://www.housingstudies. org/releases/measuring-impact-606/.
11. Black, C. (2020, January 30). “Green Gentrification” and Lessons of the 606. The Chicago Reporter. https:// www.chicagoreporter.com/greengentrification-and-lessons-of-the-606/.
12. Laurence, J. & Peña, M. (2021, January 28). New Ordinance Makes It Harder to Turn Apartments into Single-Family Homes along 606 and in Pilsen. Block Club Chicago. https://blockclubchicago. org/2021/01/27/new-ordinance-makesit-harder-to-turn-apartments-into-singlefamily-homes-along-606-and-in-pilsen/.
13. Risk Profile: Distressed NOAH Property Affordable Housing Preservation Strategies. (2021). Detroit Preservation Partnership.
14. 2021 ACS updates. (2022). Detroit Future City.
15. Risk Profile: Distressed NOAH Property Affordable Housing Preservation Strategies. (2021). Detroit Preservation Partnership.
16. Rental Dwelling Inspections Requirements. (2018). City of Detroit Property Maintenance Division.
17. U.S. Census Bureau, “Median Year Structure Built, 2021 5-Year Estimates.”
18. Detroit Preservation Action Plan. (2018). Detroit: City of Detroit.
19. U.S. Census Bureau, “Demographic and Housing Estimates, 2021 5-Year Estimates.”
20. U.S. Census Bureau, “Demographic and Housing Estimates, 2021 5-Year Estimates.”
21. U.S. Census Bureau, “Occupancy Status, 2020 DEC Redistricting Data.”
20 | Preserving Small Multi-Family NOAH Properties INTRODUCTION | 21
Methodology
02
GENERAL APPROACH
To identify the scope and process for our project, our team began with a literature review. We conducted an extensive literature review to learn more about the Oakman Boulevard Community, the Joe Louis Greenway’s potential impacts, and NOAH housing in general.
After our initial literature review, we split into three teams for context-specific research. Details of each team’s research methodology is included in the following sections.
• Property research to collect and analyze market data on individual NOAH properties and the Oakman Boulevard Community.
• Neighborhood level research and outreach to understand the challenges and opportunities within Oakman.
• Research of the existing NOAH policies and programs available in Detroit and other relevant U.S. cities.
PROPERTY ANALYSIS METHODOLOGY
Overview
Using open source data, our research team developed a process to identify small multifamily NOAH properties in the Oakman Boulevard Community. In addition to the Open Data Portal, we also used Data Driven Detroit’s Housing Portal and Multiple Listing Services (MLS) to refine and corroborate our findings. For the purpose of this study, our team defined small multi-family NOAH properties as those containing between 4-36 units. Each of these NOAH properties are analyzed in more detail in property profiles which can be seen in Appendix B. Appendix C provides a detailed explanation of the database methodology.
Generating & Refining Small Multi-family NOAH Property Data
Using the City of Detroit assessor’s data as the foundation for property identification, we first identified all properties within the Oakman Boulevard Community. This property dataset was then refined using queries to isolate properties based on property tax classification, land use type, taxpayer identification, and taxpayer addresses. To corroborate the data identified through queries, site-specific property research was necessary. This process required our team to investigate individual properties and individually filter out those that did not meet specific target identifiers for NOAH properties (Transitional housing; Regulated affordable housing (Section 8); Vacant properties; Properties used solely for commercial purposes). Once the 45 properties were identified, we compiled a small multi-family NOAH property database that includes the most pertinent property information for analysis.
Examining Recent Market Trends
Property sales data available from the City’s Open Data Portal provides useful information about the turnover rate of property ownership in a neighborhood. It also allows us to examine changes in property sales prices that may impact future rents and increase the burden on low- to middle-income tenants. Analysis of sales data is important to understand market trends and potential future risks to NOAH housing.
In order to connect transaction data to the aforementioned 45 NOAH properties, we counted the number of transactions each individual property went through from 2011 to 2022. To ensure that we counted valid market sales, we applied criteria to exclude non-sale transfers or sales where financial institutions or government entities were
Source: Authors’ work”
receivers of properties indicating mortgage or tax foreclosures.
COMMUNITY ENGAGEMENT METHODOLOGY
An integral aspect of this project was engagement with stakeholders and experts to get their perspectives on the issues facing the Oakman Boulevard Community neighborhood and how the Greenway may affect the neighborhood. We either attended meetings or conducted interviews with the following groups.
Meeting: Detroit Planning and Development Department, Joe Louis Greenway (JLG) Team
The Detroit’s Planning and Development Department is conducting ongoing outreach and engagement with the communities that will be impacted by the JLG team. To ensure that we were building off of existing work rather than replicating it, the JLG team shared their outreach and research plan as well as insights and
recommendations for our outreach and research efforts.
Interview: HOPE Village Revitalization
HOPE Village Revitalization “is a community controlled organization committed to improving the quality of life in the Hope Village neighborhood.”1 The HOPE Village neighborhood overlaps with the Oakman boundary, although it covers a slightly larger area than our study area. Our team met with HOPE Village representatives to learn insights regarding the challenges and opportunities for tenants and property owners in Oakman.
Interview: Oakman Boulevard Community Association (OBCA)
Our team had a virtual meeting with representatives of the Oakman Boulevard Community Association (OBCA) which is a resident-run neighborhood association that aims to “bring together residents of the Oakman Boulevard Community in order
24 | Preserving Small Multi-Family NOAH Properties METHODOLOGY | 25
Table 3: Refining Small Multi-Family NOAH Property Data
Criteria Remaining Properties after Criteria Applied Amount change All Properties in Target Neighborhood 3499 0 Property tax classification is “Residential” or “Commercial” 2405 -1094 Land use types is “Apartment” or “3+ family” 197 -2208 Property is neither vacant nor for commercial use 186 -11 Taxpayer’s address doesn’t match the property’s address 80 -106 Property is not vacant and/or not for commercial use 52 -28 Number of units ranges from 4 to 36 50 -2 Property is not regulated affordable housing (Section 8) 49 -1 Property is not transitional housing 46 -3 Property is unregulated affordable housing (NOAH) 45 -1
to achieve a better community in which to live, foster interest in civic affairs by providing opportunities for discussion of common neighborhood issues, and to act in concert to resolve these issues.”2 The OBCA neighborhood boundary represents the historic district, which overlaps with the study area. They provided valuable insight regarding the challenges and opportunities for tenants and property owners in Oakman.
Interview: Neighborhood Service Organization (NSO)
Our team members met with the Chief Community Impact Officer at NSO which is located on Oakman Boulevard. NSO is an organization that focuses on holistic care for residents, especially working with folks who are unhoused, older adults with mental illness, and people with developmental disabilities. By interviewing them, we hoped to get a better understanding of the needs of the residents because we did not have the opportunity to directly engage residents due to time constraints.
Meetup: Metro-Detroit MultiFamily Housing Investors, Southfield, MI
Members of our team had informal conversations with multi-family housing investors at a meetup event. At this networking/social event, our team members held informal conversations with roughly ten attendees, some of whom were landlords in Metro Detroit. Those conversations helped us understand the challenges and motivations in operating rental properties in Metro Detroit.
Interviewing Detroit Landlords
One of the most challenging community engagement groups to connect with were landlords. Research on NOAH housing in Oakman offered contact information for eighteen of the forty-five target properties.
Prior to making contact with these property owners and/or managers, we developed a list of interview questions. Depending on the specific property and contact person, the number of questions asked varied.
Phone calls were made to all eighteen properties, and when available, emails were also sent. Unfortunately, as we will discuss in the limitation section, we did not succeed in carrying out interviews with those landlords.
In supplemental Oakman landlord interviews, we did manage to interview two Detroit landlords with properties outside of Oakman. The questions asked in these interviews excluded those questions that are specific to Oakman.
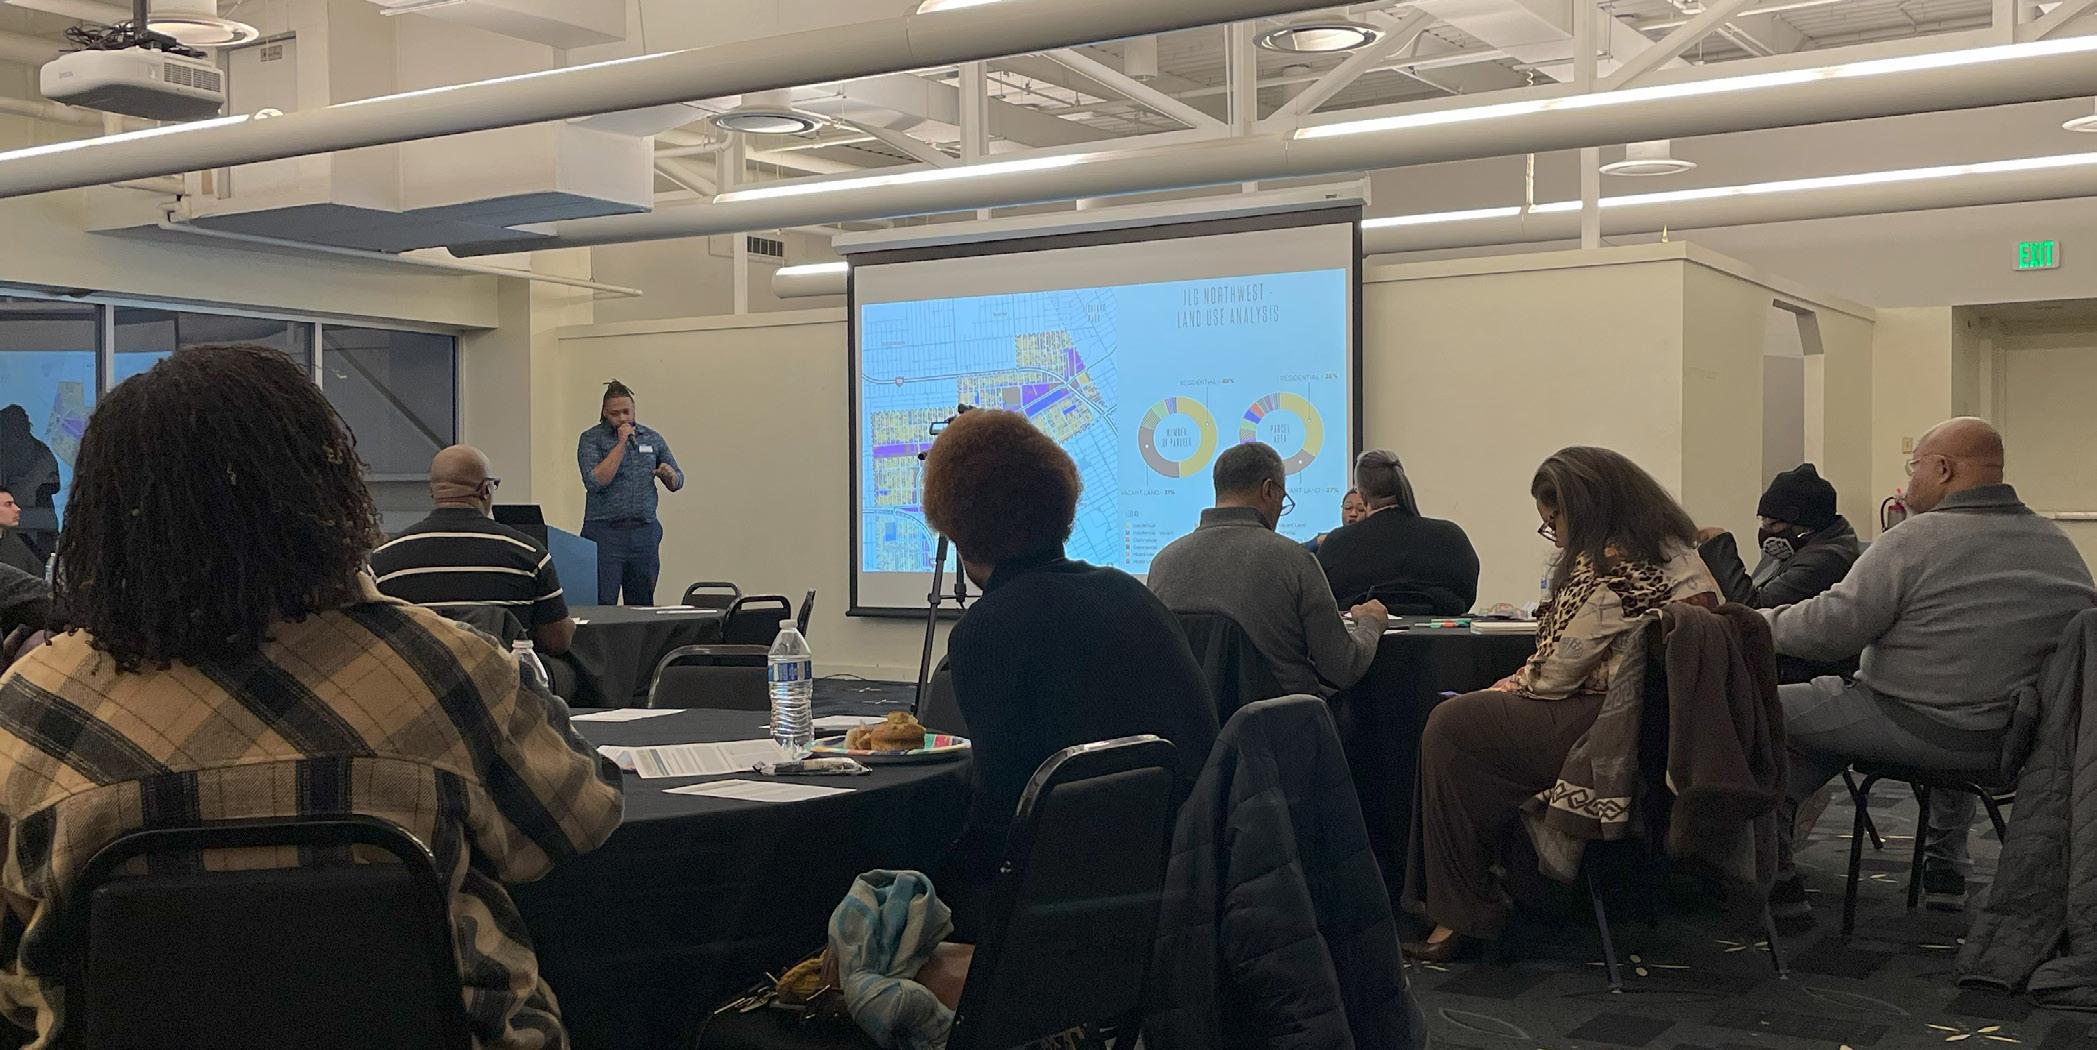
Community Engagement Event: Joe Louis Greenway Planning & Development Department
Members of our team attended a community engagement event hosted by the Detroit Planning and Development Department to gather resident input on the Joe Louis Greenway. The structure of the community engagement event allowed for public participation, including comments and questions. While the focus of the event did not directly align with our project goals, some public input did involve concerns with housing affordability.
Windshield Survey
In addition to meetings with stakeholders and experts, our team conducted a windshield survey to view all 45 target properties. We developed a scoring system to rate the physical condition of the visible property exterior. The scoring scale is indicated below.
1 - Uninhabitable
2 - Major repairs required
3 - Minor/cosmetic repairs required
4 - Good condition
To rate each property, we parked in front of the property and discussed the features, if any, that warrant a loss of “property condition” points. The three team members discussed the significance of the needed repairs to determine the appropriate point value. The score was discussed until a unanimous decision was made.
POLICY RESEARCH METHODOLOGY
Our team sought to understand the current state of policies and strategies for NOAH preservation that have been or could be applied in Detroit. We researched existing policies at the local, state, and federal levels that support or in some way impact NOAH preservation; such policies implemented in comparable cities; and regional nonprofit and philanthropic organizations that have addressed NOAH preservation. This established a baseline for further research, helped to identify regional experts who could be interviewed, and assisted in the development of questions to ask and topics to research.
Our team developed a list of organizations and experts to interview to discuss the success of existing policies and get their perspectives on the viability of potential new strategies. The team was able to schedule and conduct interviews with representatives from Southwest Housing Solutions, Local Initiatives Support Corporation (LISC) Detroit, the Policy Team at Detroit’s Housing and Revitalization Department (HRD), as well as a University of Michigan Poverty Solutions Fellow who had worked with United Community Housing Coalition (UCHC). Each interview was 30 to 45 minutes in length and the interviewee’s experiences with the rental market in Detroit, their thoughts on the success of existing policies, and their personal opinions on the potential benefits of new policies were discussed.
Endnotes
1. HOPE Village Revitalization. (n.d.). hopevillagecdc.org/about-us/#hvrmission
2. Oakman Blvd Community Association. (n.d.). from https://oakmanblvd.org/
26 | Preserving Small Multi-Family NOAH Properties METHODOLOGY | 27
Figure 5: Image of JLG Engagement Event
Findings and Analysis

03
PROPERTY ANALYSIS
Oakman Boulevard Community Neighborhood NOAH Property Overview
Property characteristics
Within the Oakman Boulevard Community neighborhood, there are a total of 1,585 rental-occupied units.1 After our team completed detailed property identification and site-specific research, 45 properties with between 4 and 36 units were identified in the neighborhood as NOAH. These 45 properties have a total of 465 units, comprising 29.3% of the total neighborhood rental-occupied unit stock.
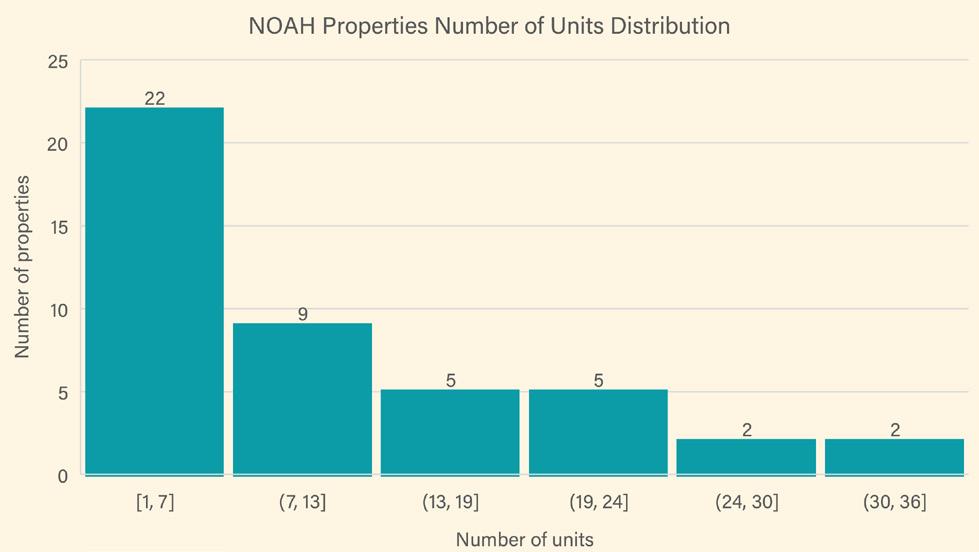
A distribution analysis of the number of units shows that the majority (22) of properties have 4-7 units while the second largest composition of properties (9) has 7-13 units. The median number of units per property within the target 45 properties is 7, which shows that most NOAH properties are relatively small.
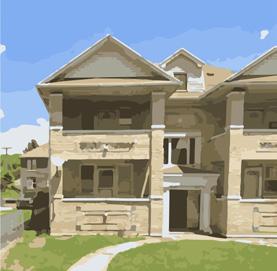
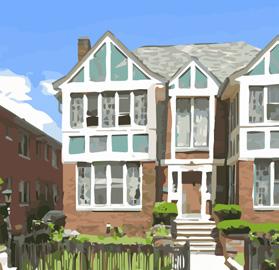
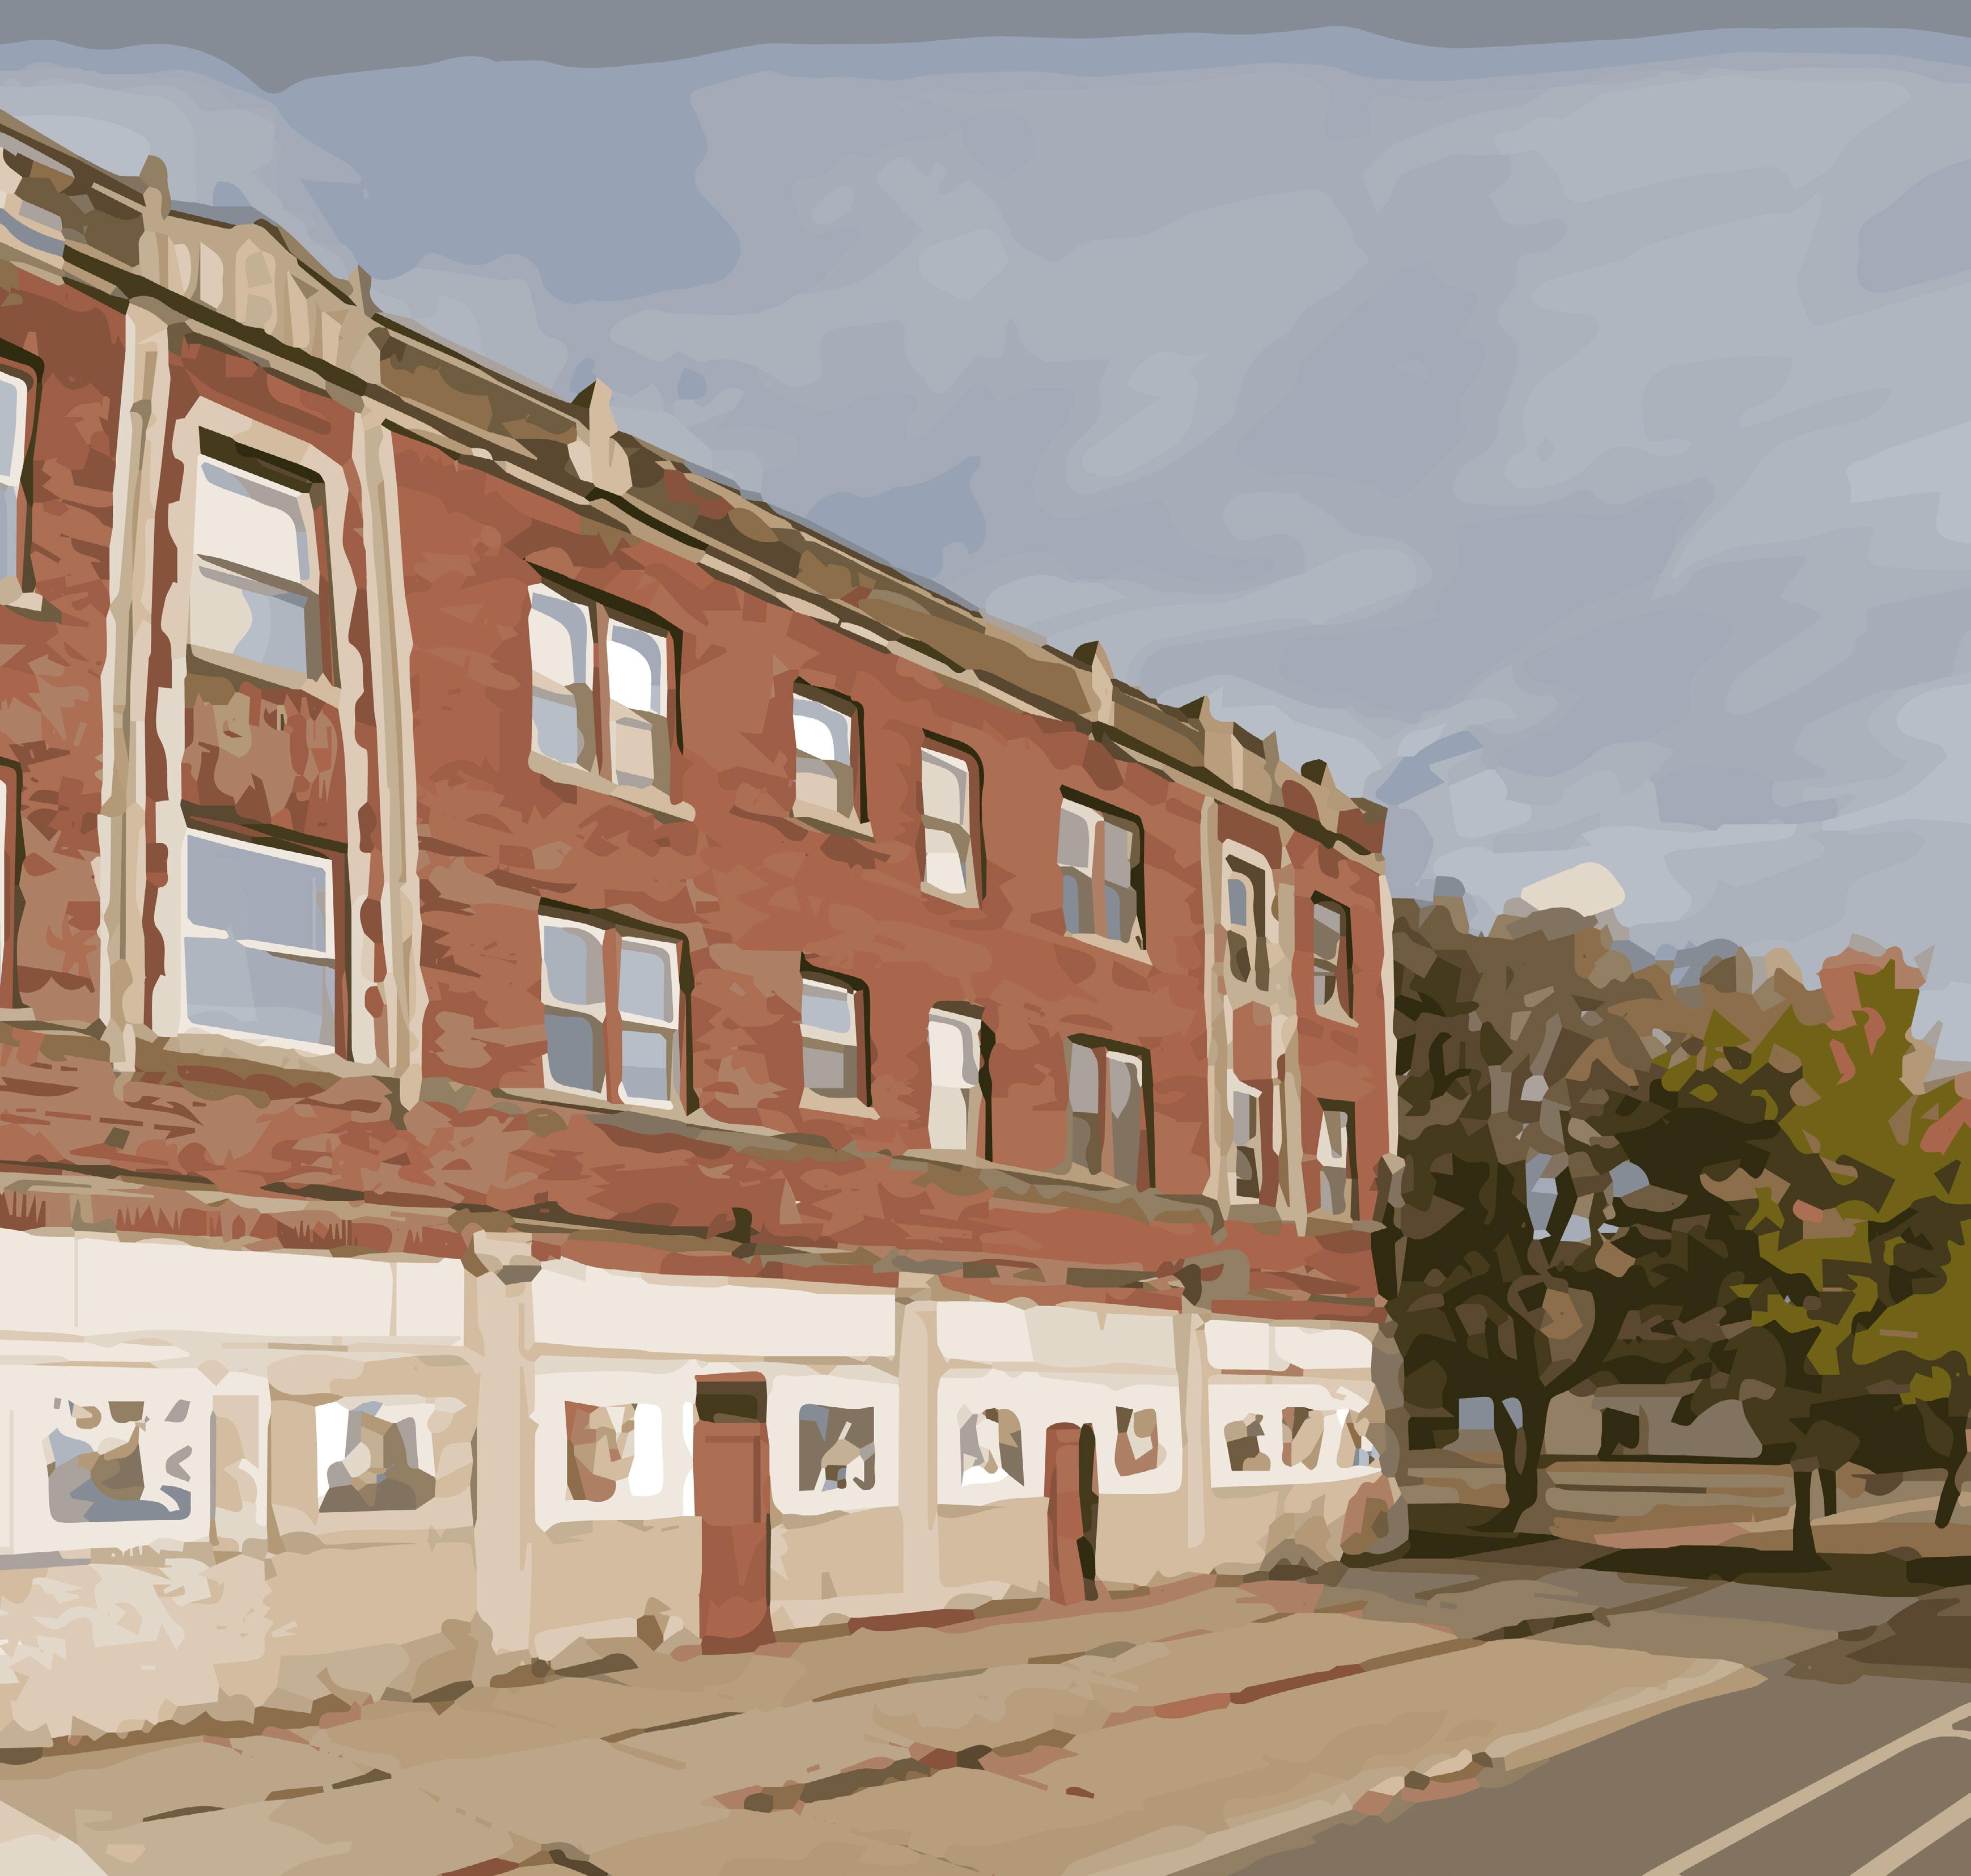
Our 45 target properties are also described in more detail in property profiles that were specifically curated for each individual property (See Appendix B). The property profiles aim to share additional information related to property typology, site conditions, permit information, transaction history, and normalized sale metrics (i.e., last sale price per unit, last sale price per square feet). The profiles also include a recent image of the
property and a figure depicting sales history compared to the neighborhood average over a period from 2011-2022 .
NOAH properties and their contractual relationships to the City of Detroit
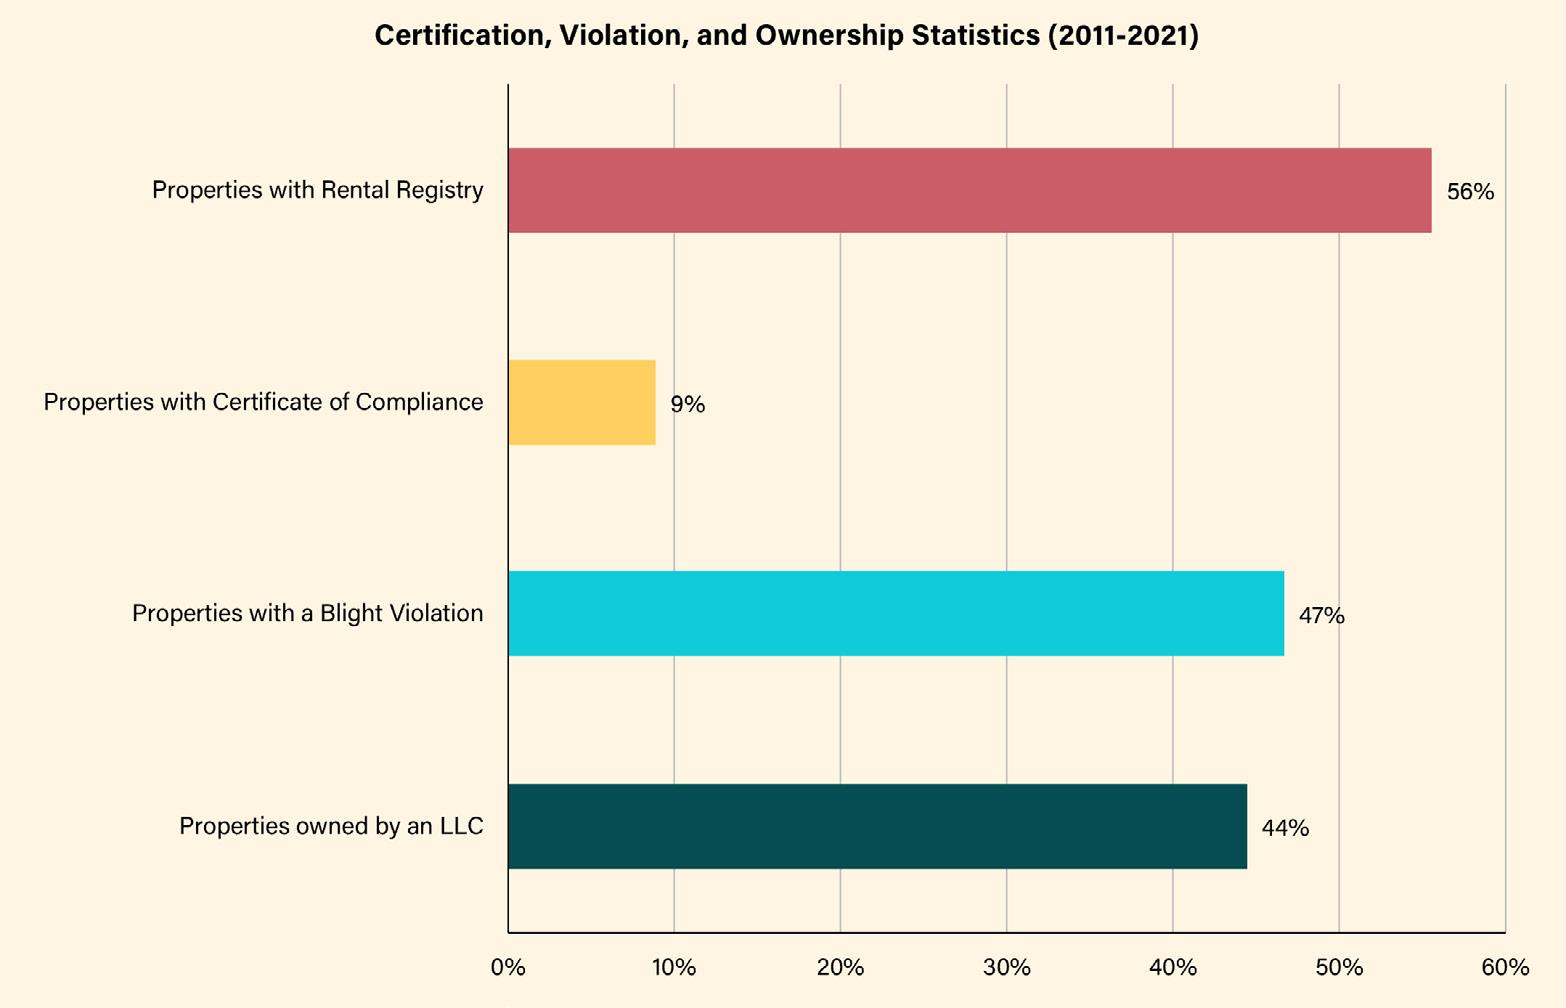
In order to better understand the status of each property in relation to the City of Detroit, an evaluation of certificate of compliance, blight violations, ownership status, and rental registry was conducted. From 2011-2022, of the 45 properties, we found that 44.44% are owned by an LLC, 8.89% have obtained a certificate of compliance, 46.47% have blight violations, and 55.56% hold a rental registration.
certificates of compliance may have serious quality issues, reflecting the poor conditions of many aging properties throughout the City.
Submarket comparison
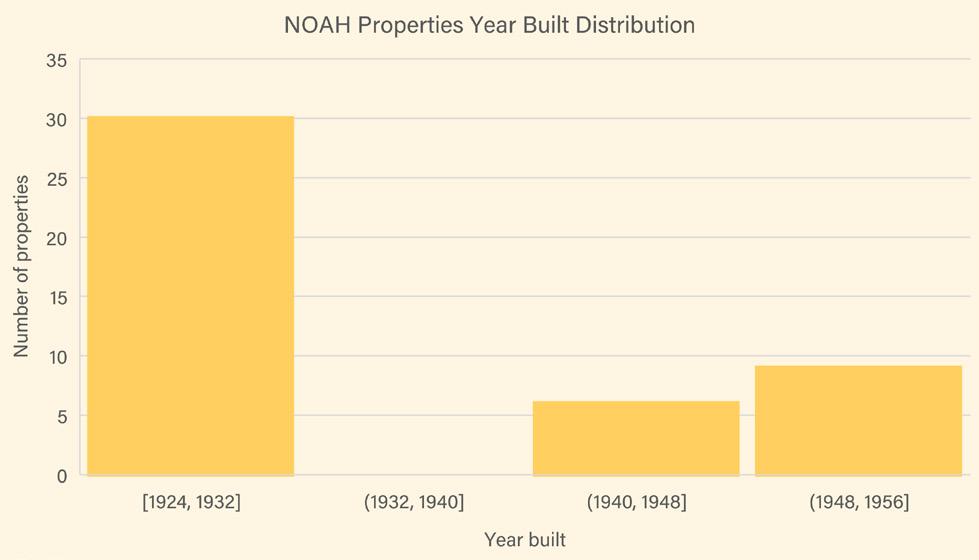
100% of the 45 NOAH properties in the neighborhood were built before 1978, when lead paint was officially banned in the State of Michigan. Of the 45 properties, 66.67% (30/45) were built between 1924 and 1932, when no lead restrictions were in place. Typically, these properties pose the more significant problems with respect to lead exposure should lead clearance not be achieved.
In Detroit, having a rental registration does not necessarily mean that a landlord has obtained a certificate of compliance. Of the 45 properties, only 4 (8.80%) hold both a certificate of compliance and a rental registration, which means that the other properties have neither been inspected by a 3rd party, nor passed a lead clearance. This striking number indicates that there is a lack of enforcement of basic condition standards in NOAH properties within the neighborhood. Rental properties without
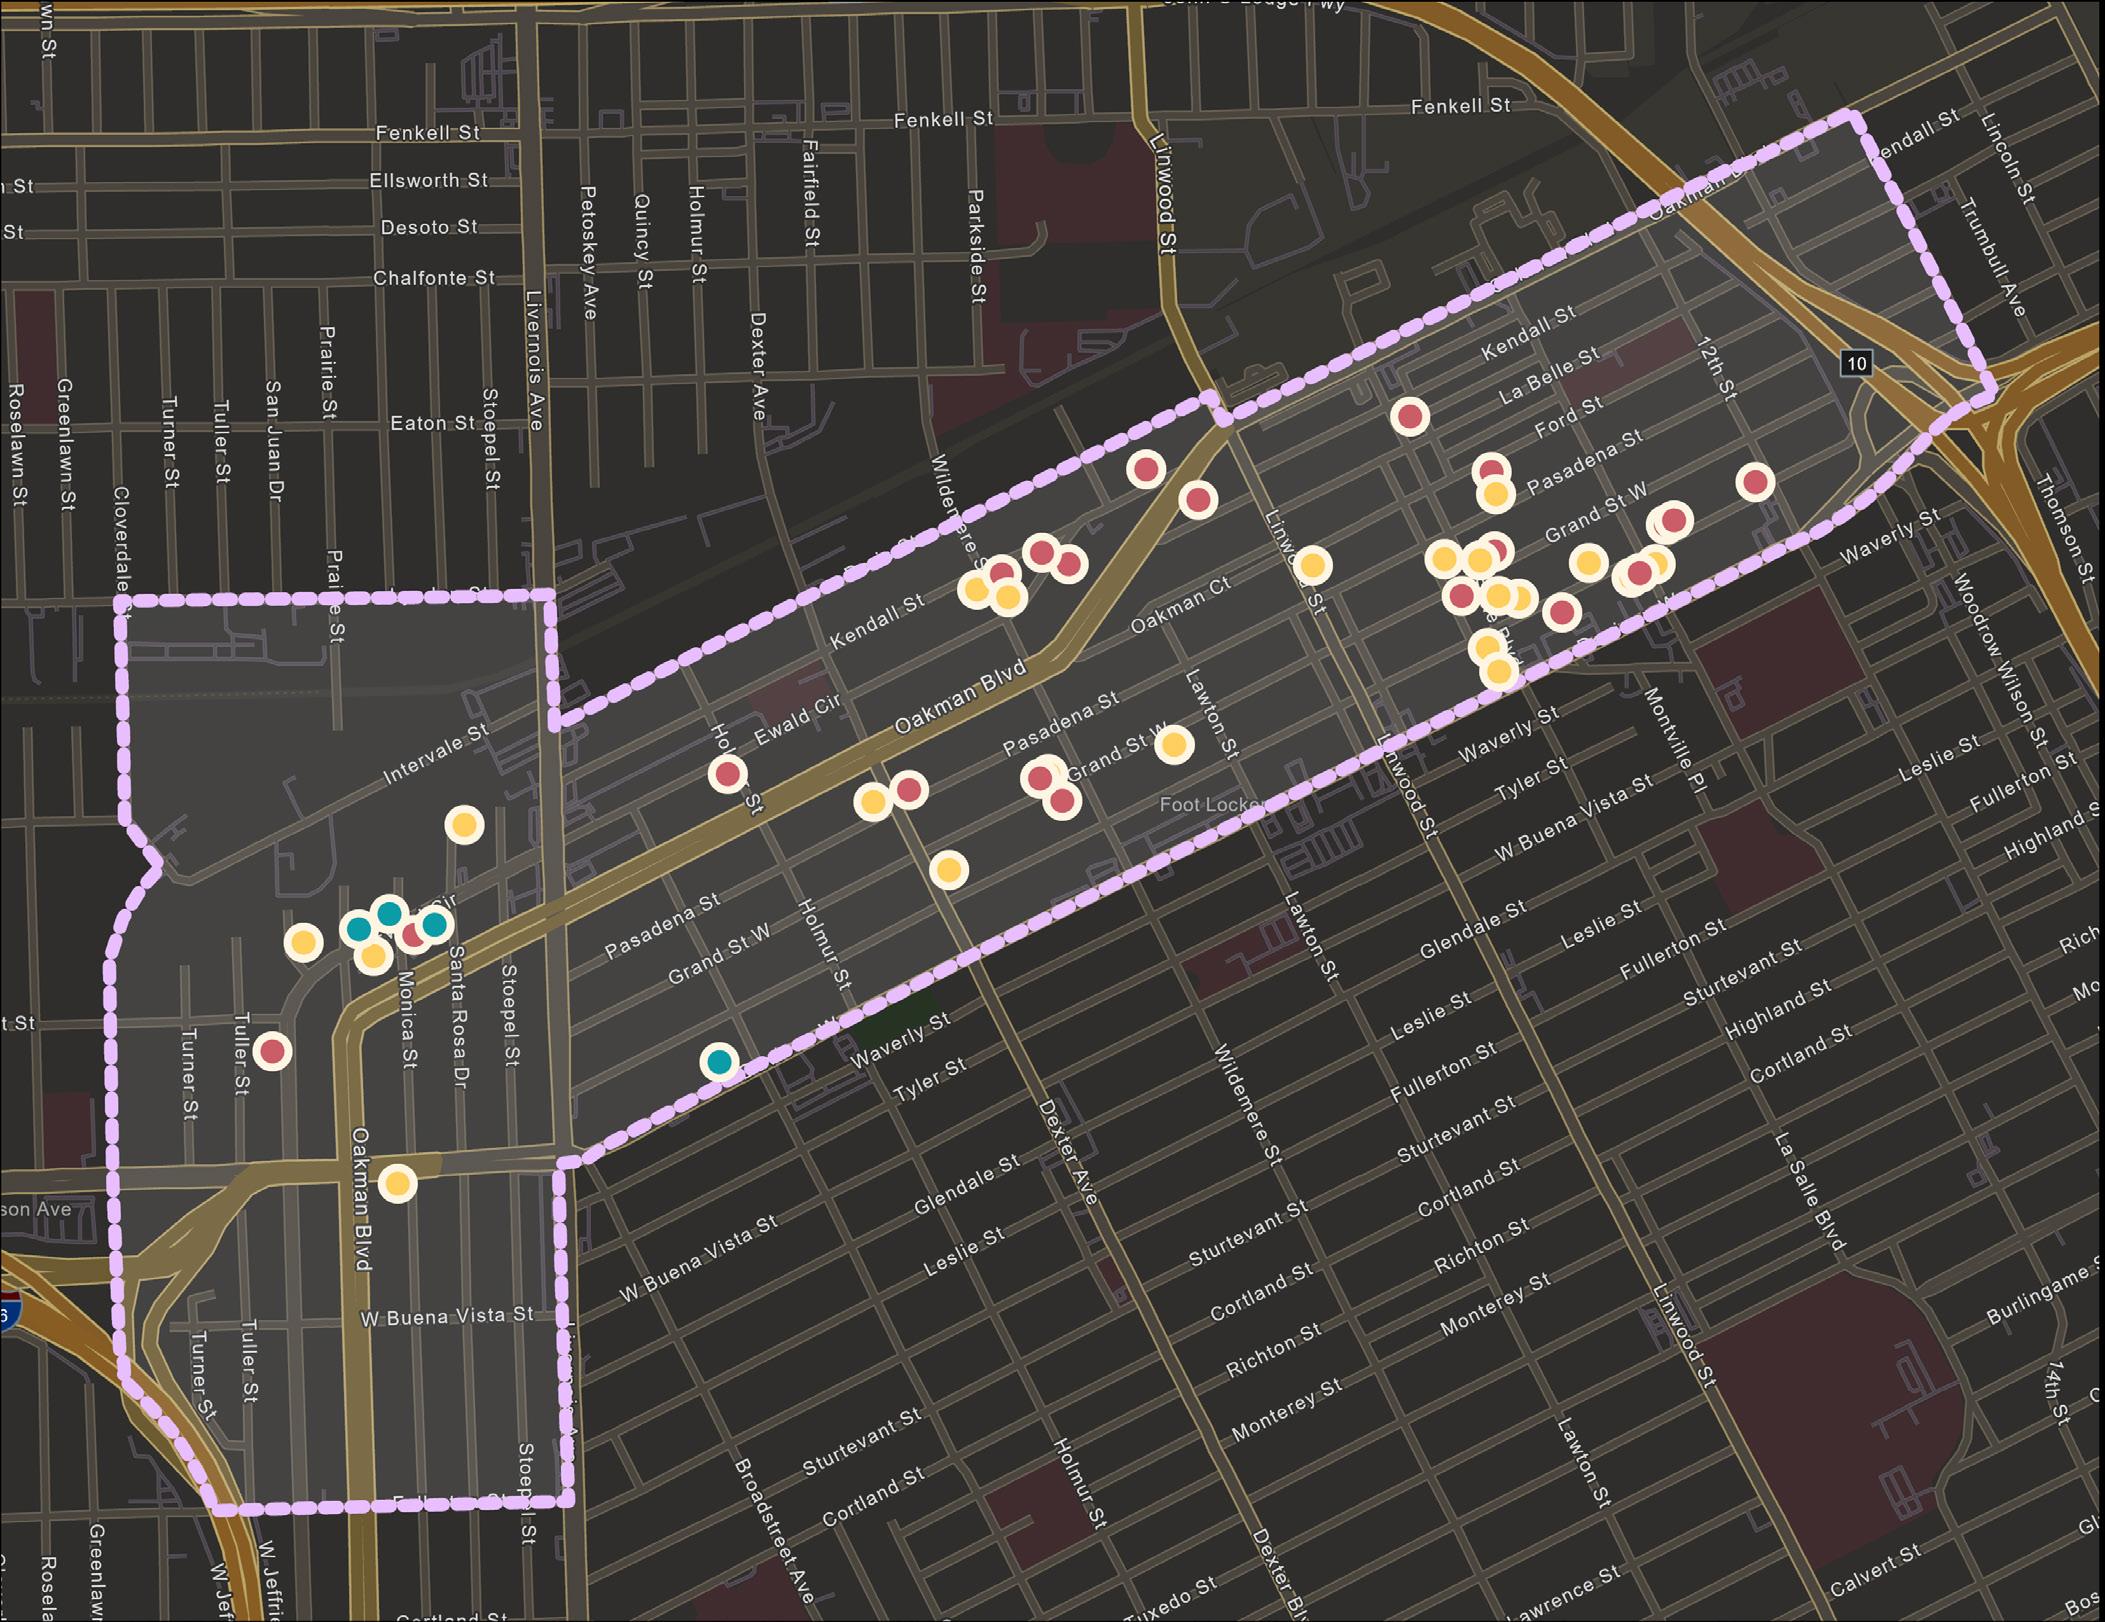
Our team obtained CoStar submarket data to offer context and provide a comparison to NOAH properties in the Oakman Boulevard Community neighborhood. The online CoStar database integrates publicly available commercial real estate records to generate analyses and models of real estate markets as well as information on individual properties. CoStar reflects commercial real estate, including residential rental properties. Through this database, we are able to compile analytics related to property value, rental rate, sales history, sales volume, vacancy, and asset types.
As seen in Figure 7 below, the CoStar study area lies within the Uptown Detroit Submarket, which covers an area extending beyond Oakman. This area includes Highland Park, the North End, Dexter Linwood, Palmer Park, and areas surrounding the former state fairgrounds.
30 | Preserving Small Multi-Family NOAH Properties FINDINGS + ANALYSIS | 31
Source: U.S. Census Bureau, 2022 Census Tracts
Table 4: Oakman NOAH Property Characteristics
Source: City of Detroit Open Data Portal, Parcels
Figure 6: Number of Units Distribution
Source: City of Detroit Open Data Portal, Parcels
Total Properties Total Units Median Number of Units Average Floor Area Average Year Built of Structure 45 465 7 9,615 1934
Figure 7: Year Built Distribution
Source: City of Detroit’s Open Data Portal, Rental Registry
Figure 8: Certificate, Violation, and Ownership Statistics (2011-2021)
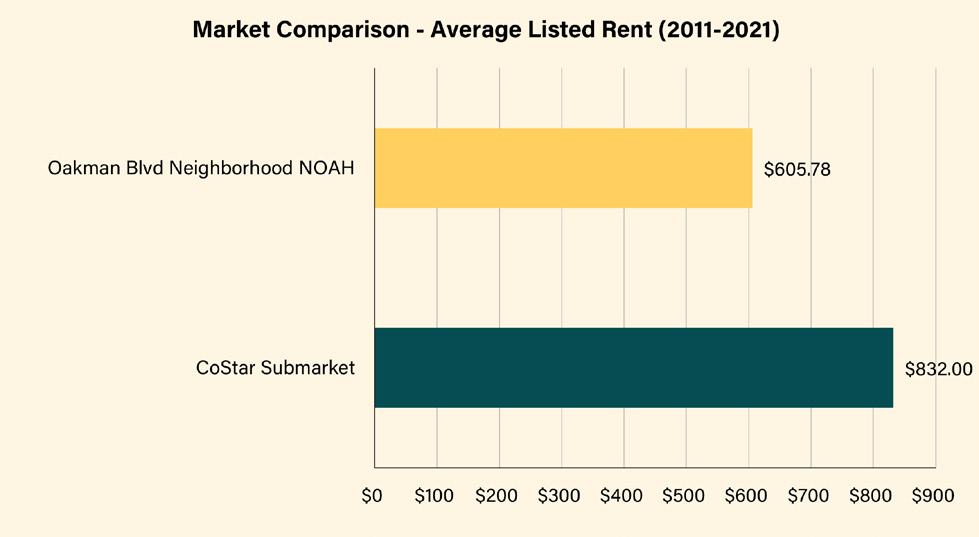
Oakman Boulevard Community neighborhood NOAH properties have an average vacancy percentage of 16.87%, a lower rate than the CoStar Submarket at 21.20%. Additionally, the Oakman average
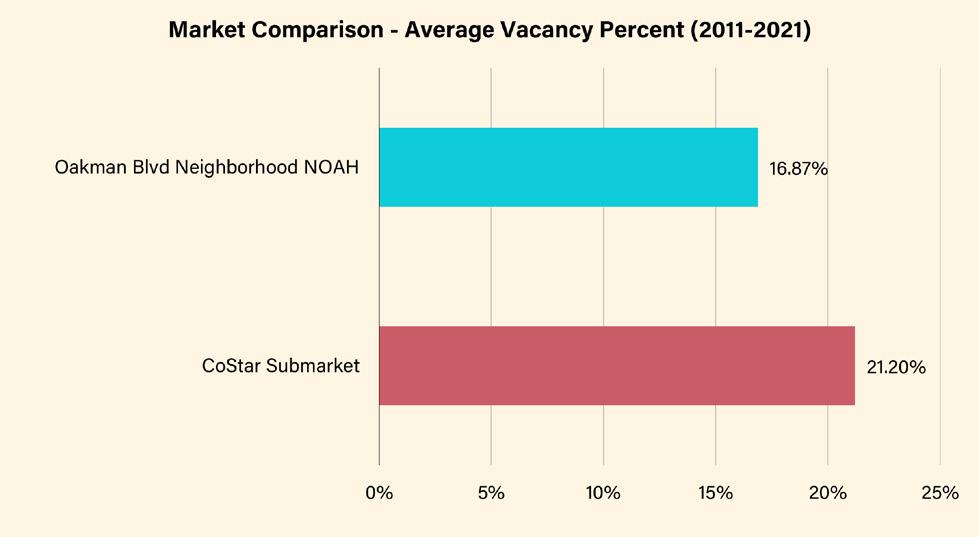
listed rent for NOAH properties is $605.78 whereas for the CoStar Submarket it is $832.00. This shows that with lower vacancy rate and lower rent, there is room for rent growth in the Oakman area.

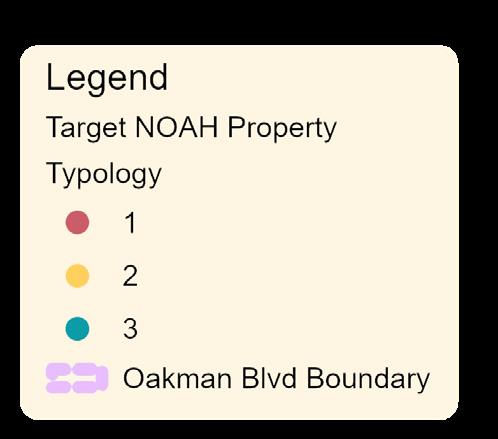
Property Typology represent those that are unregistered; they have obtained neither a rental registration nor a certificate of compliance. Properties in typology 2 represent those that have obtained a rental registration but not a certificate of compliance. Properties in typology 3 represent those that have obtained both a rental registration and a certificate of compliance.
After data identification and initial analysis of NOAH properties in the neighborhood, a property typology was defined by evaluating whether or not properties have obtained rental registration and certificate of compliance. As explained in the previous section, evaluating the characteristics of properties that have or have not obtained a certificate of compliance and/or a rental registry underscores areas for potential improvement.
45 properties were designated into three typology categories (a full list of attributes across typologies can be seen in Appendix C, Table C1). Properties in typology 1


Properties in typology 1 make up 20 of the 45 target NOAH properties. These properties have a high number of units overall (151), but a relatively small number of average units per property (7.6). Properties in typology 1 have the highest average vacancy percent (22.5%) across typologies.

32 | Preserving Small Multi-Family NOAH Properties FINDINGS + ANALYSIS | 33
Source: CoStar Uptown Detroit Multi-Family Submarket Report, 2023
Figure 9: CoStar Submarket
Source: CoStar
Figure 10: Market Comparison - Average Listed Rent (2011-2021)
Source: CoStar
Figure 11: Market Comparison - Average Vacancy Percent (2011-2021)
Source: Authors’ work
Figure 12: Property Typology in Oakman
Of these 20 properties, 20% are owned by LLCs, indicating that this typology is represented by smaller scale landlords. These property characteristics mean that it is more likely that smaller landlords do not obtain rental registration and certificate of compliance, making their properties at greater risk for lower overall conditions.
Properties in typology 2 make up 21 of the 45 target NOAH properties. Compared to typology 1, properties in typology 2 show a higher number of units overall (280) and a higher average number of units (13.3). In contrast, properties in typology 2 have

a lower average vacancy rate (12.08%). Compared to typology 1, 57% of properties in typology 2 are owned by an LLC. The combination of LLC ownership, high average vacancy percentage, and high assessed value indicates possible risk of speculation in this typology.
Properties in typology 3 make up 4 of the 45 NOAH properties. Compared to typology 1 and 2, properties in typology 3 have a very small number of overall units (34) with a relatively low average number of units (8.5). These properties are all owned by LLCs.
Recent Market Trends, Landlord Analysis, and Rent Distribution
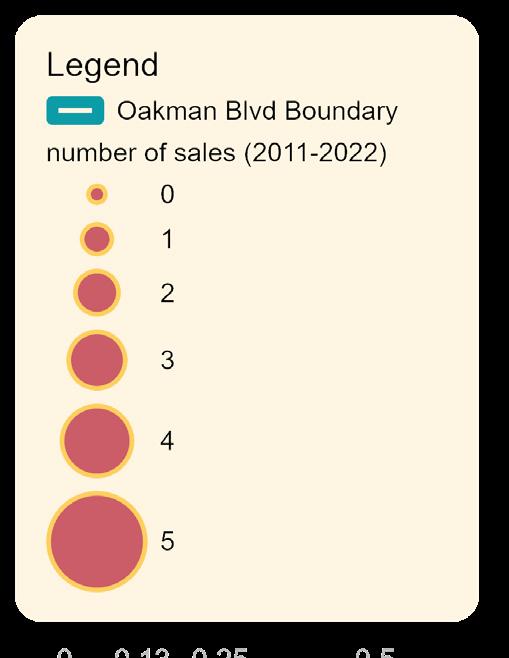
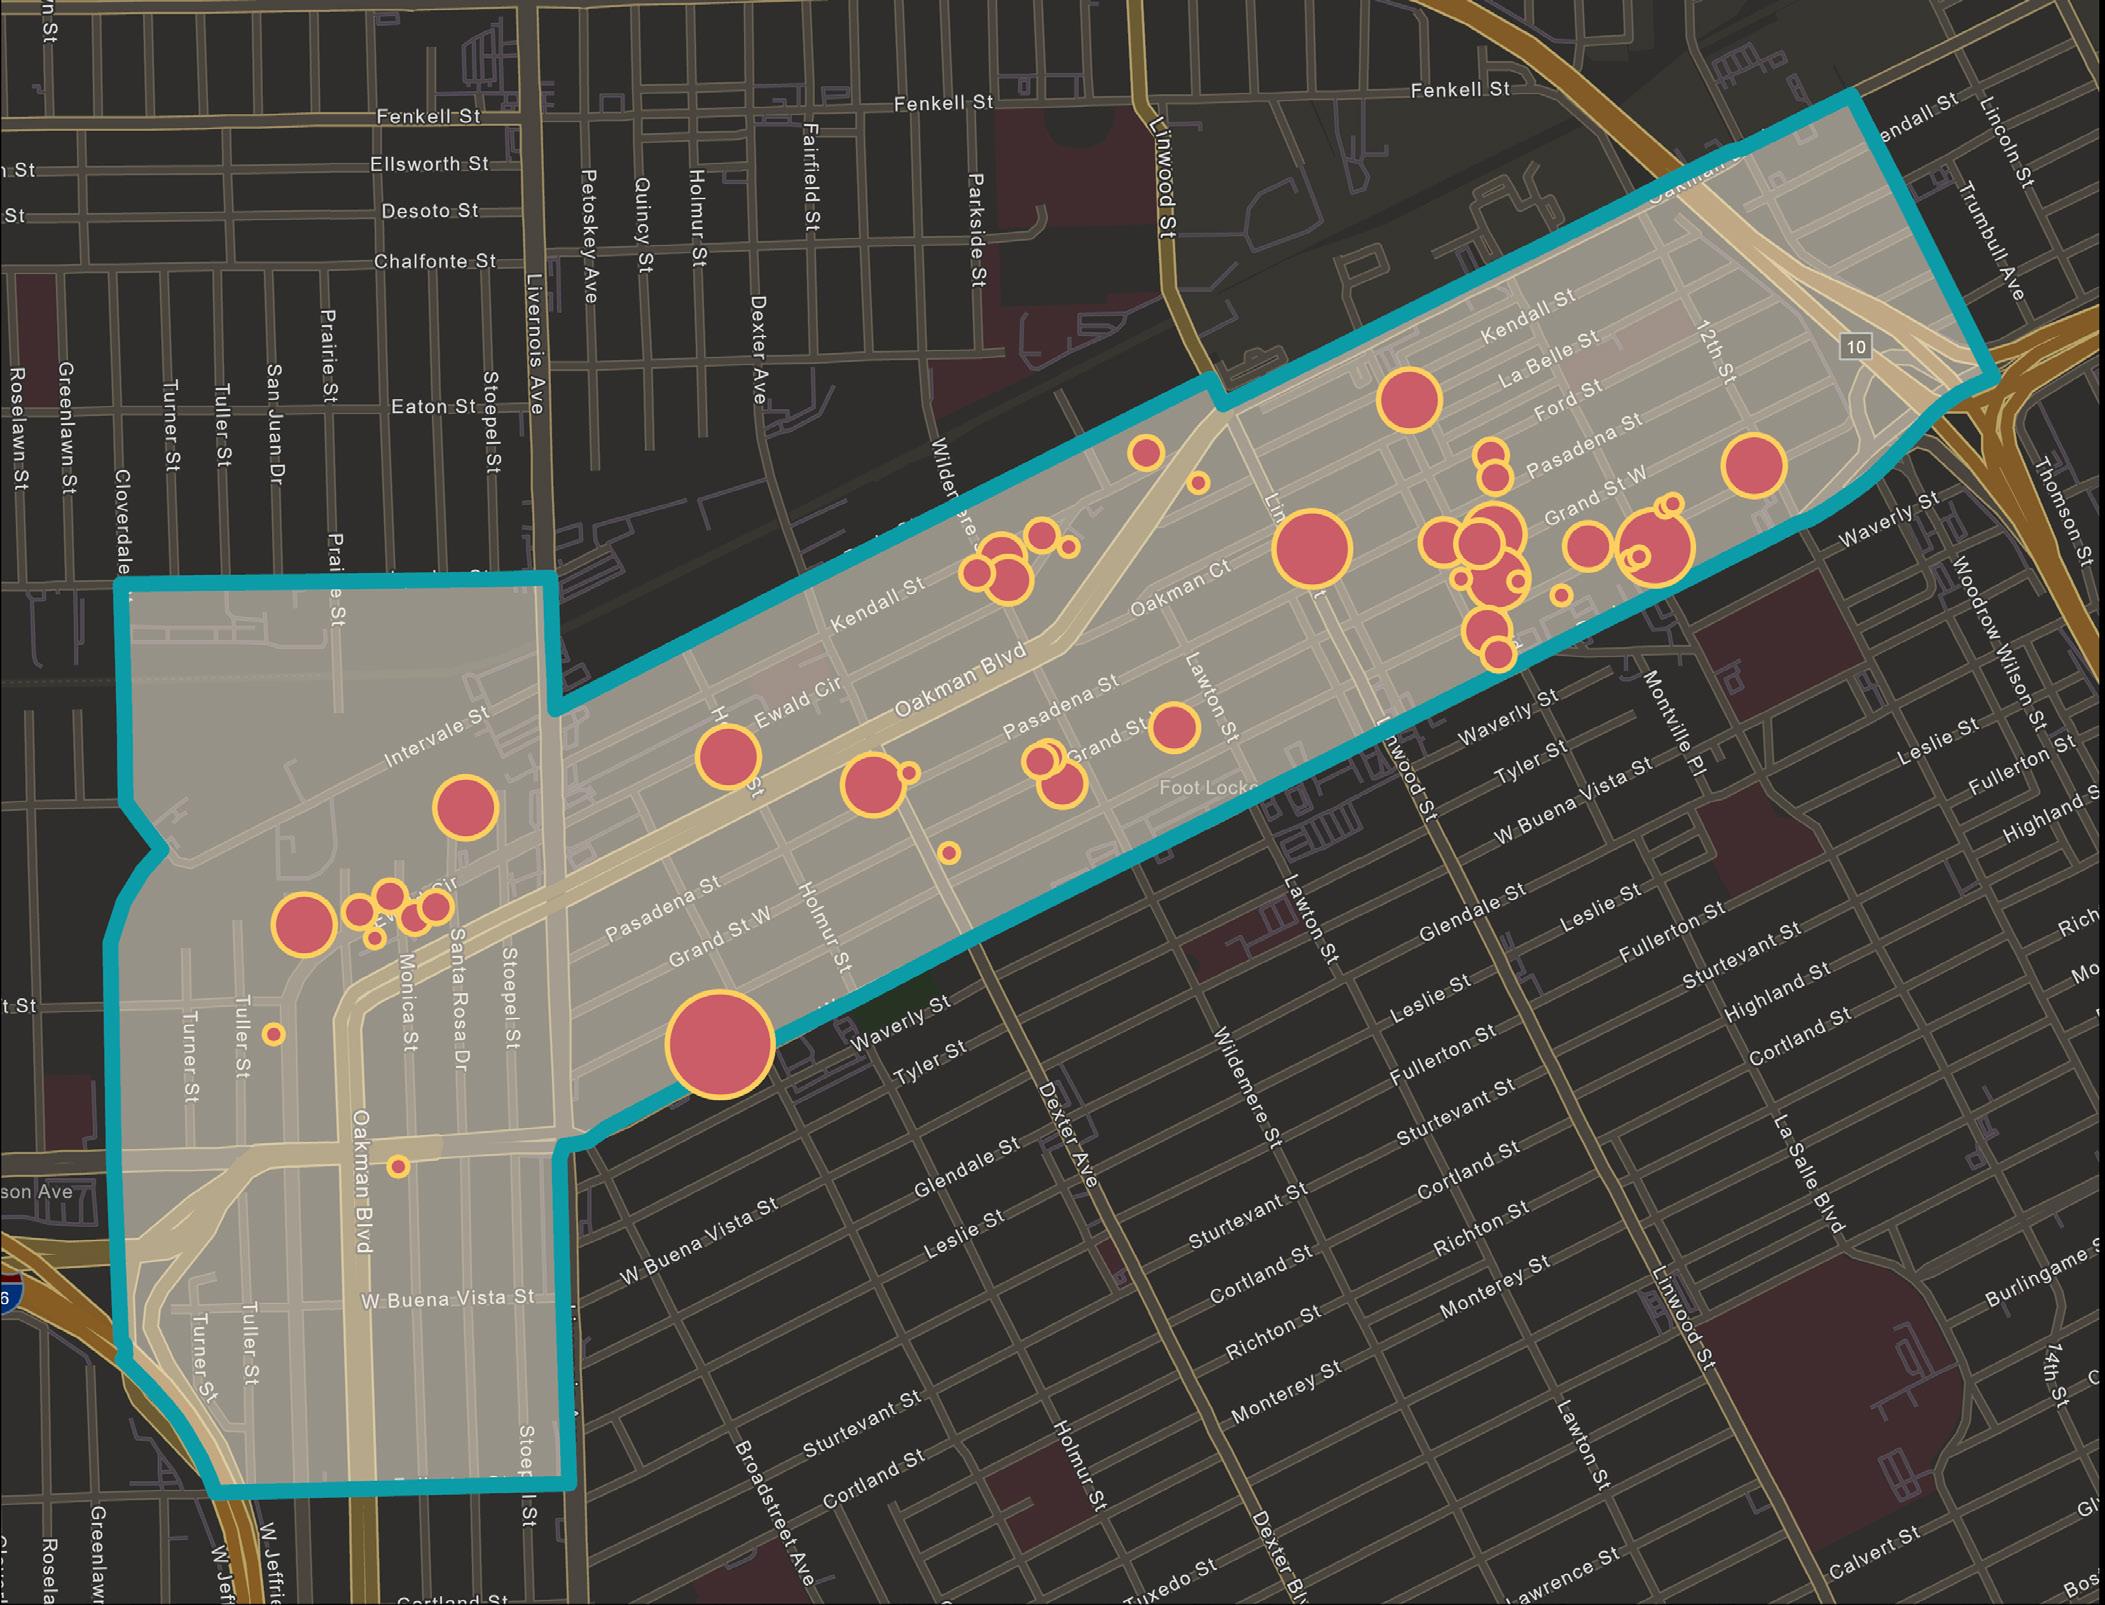
Frequency of sales

Among 45 small multi-family NOAH properties in Oakman Boulevard Community, 31 were sold between 20112022, with a turnover rate of 68.89%. 19 properties were traded multiple times during this period, which signals a potential risk of instability. Of all NOAH property sales occurred in the neighborhood, 43% of them took place between LLCs. For example, a property located at 4234 W Davison was sold five times. Of these five sales, four
of the five the transactions took place between LLCs and were accompanied by an increase in the sale price from $30,000 to $120,000. This pattern reveals the investor’s confidence in the future profitability of the property. However, this investment (or speculative behavior) can signal future rises in listed rent prices and potential instability in similar properties throughout the neighborhood.
We conducted a comparative analysis of the rental landscape in the Oakman Boulevard Community against other selected neighborhoods in the City of Detroit. These selected neighborhoods include West Village, Boston Edison, and
34 | Preserving Small Multi-Family NOAH Properties FINDINGS + ANALYSIS | 35 Source: Authors’ work Table 5: Typology 1: Unregistered Properties Source: Authors’ work Table 6: Typology 2: Rental Registered Properties Source: Authors’ work Table 7: Typology 3: Rental Registered & Certificate of Compliance Properties Total Number of Properties Total Number of Units Average Units Average Vacancy Percentage Average Listed Rent Average Assessed Value Average Number of Sales (20112022) % of LLC Owners 20 151 7.6 22.5% $536 $63,695 0.65 20% Total Number of Properties Total Number of Units Average Units Average Vacancy Percentage Average Listed Rent Average Assessed Value Average Number of Sales (20112022) % of LLC Owners 21 280 13.3 12.08% $636 $137,505 1.19 57% Total Number of Properties Total Number of Units Average Units Average Vacancy Percentage Average Listed Rent Average Assessed Value Average Number of Sales (20112022) % of LLC Owners 4 34 8.5 13.89% $500 $93,175 1.5 100%
Source: City of Detroit’s Open Data Portal, Property Sales
Figure 13: Number of Sales in Oakman Community, 2011-2022
Grandmont. Due to time limitations, we were unable to determine the exact stock of NOAH properties in these neighborhoods, so the comparative analysis focuses on residential properties in general across these neighborhoods.
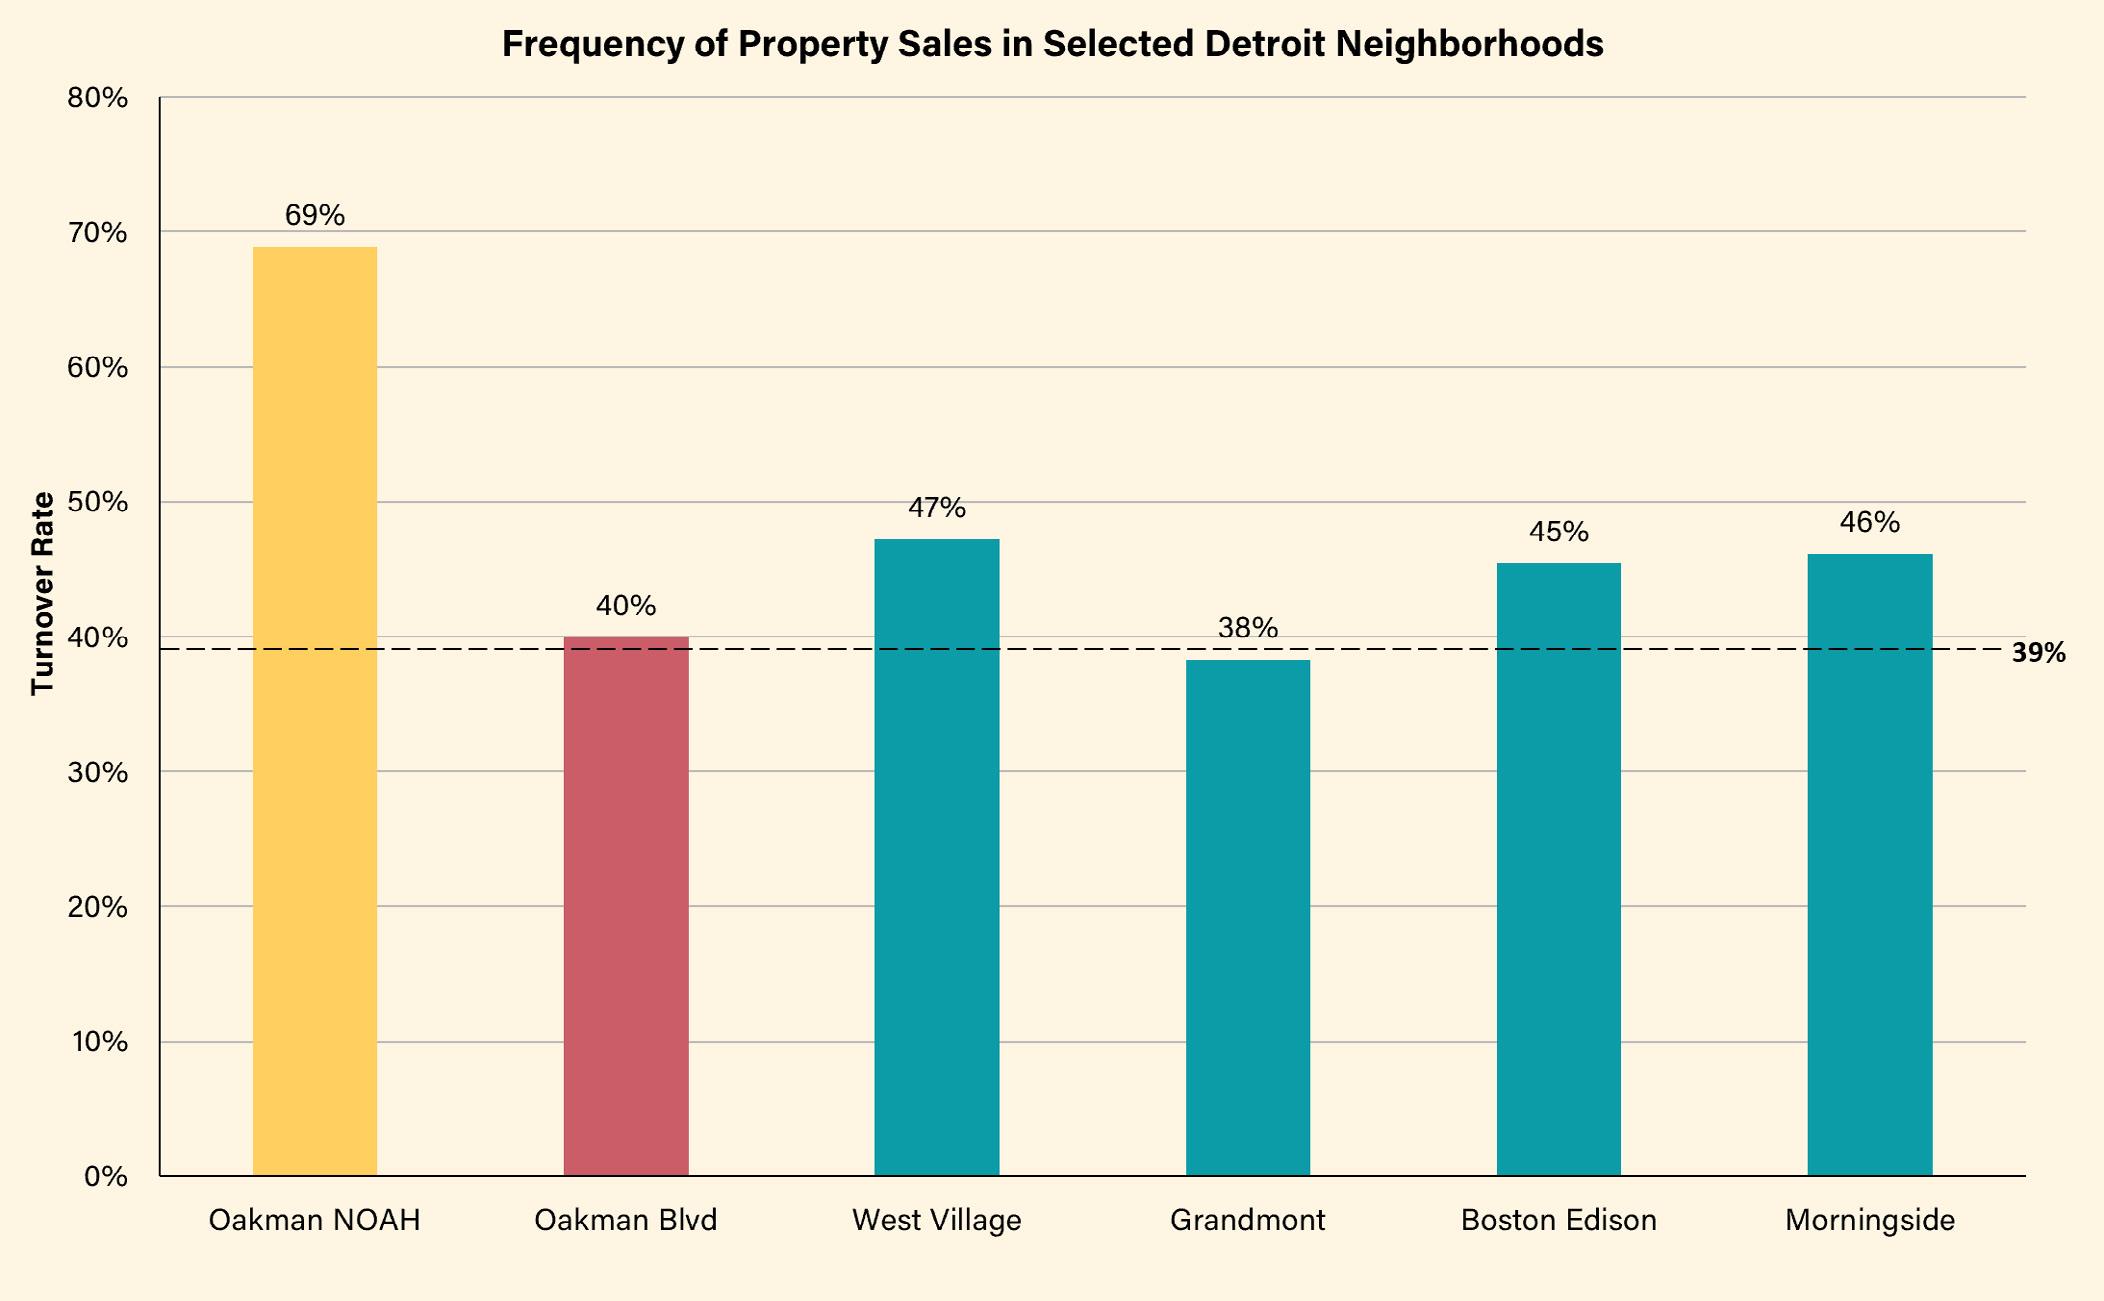
Residential properties in Oakman Boulevard Community are relatively stable with a turnover rate of 39.92%, compared to Detroit’s citywide average of 38.57%. However, the 45 identified NOAH properties in Oakman Boulevard have a higher turnover rate (68.89%), illustrating that NOAH properties have a higher likelihood of being traded on the market.
Comparing across select Detroit neighborhoods shows that those with a greater number of single-family houses tend to have higher turnover rates. For example, West Village has a higher turnover rate with 62.62% single-family houses compared
to Oakman (at large) which has 53.32% single-family houses. Yet, the frequency of transactions for NOAH properties (with a turnover rate of 68.89%) is significantly higher compared to all residential properties (with a turnover rate of 39.92%) in Oakman as well as those in other selected neighborhoods. This shows that the high turnover rate for NOAH properties is not due to property type, but more likely due to increased investment interest in the neighborhood that has been seeing rising values as discussed below.
Market Trends + Risks to NOAH Properties: Sales Analysis + Appreciation Rates
A price trend analysis comparing the 45 target NOAH properties in Oakman Boulevard Community, non-NOAH multifamily properties in the Oakman Boulevard Community, and multi-family
housing in selected neighborhoods adds insight to the landscape of small multi-family NOAH properties in Detroit.
By tracking sales data from 2011-2022 it is evident that multi-family housing prices in Detroit are rising at an average annual appreciation rate of 15.15%. Acknowledging the possible distortion in 2022 due to the small sample size in sales data collection, housing prices in Detroit, as in the rest of the nation, showed a significant price spike during the pandemic.
For the small multi-family NOAH properties in Oakman Boulevard Community, their average annual appreciation rate is 20.52%, around five percentage points higher than the City of Detroit rate. A high average annual appreciation rate combined with these properties’ relatively high turnover rate reveals that small multi-family NOAH properties in the neighborhood are at risk of losing affordability.
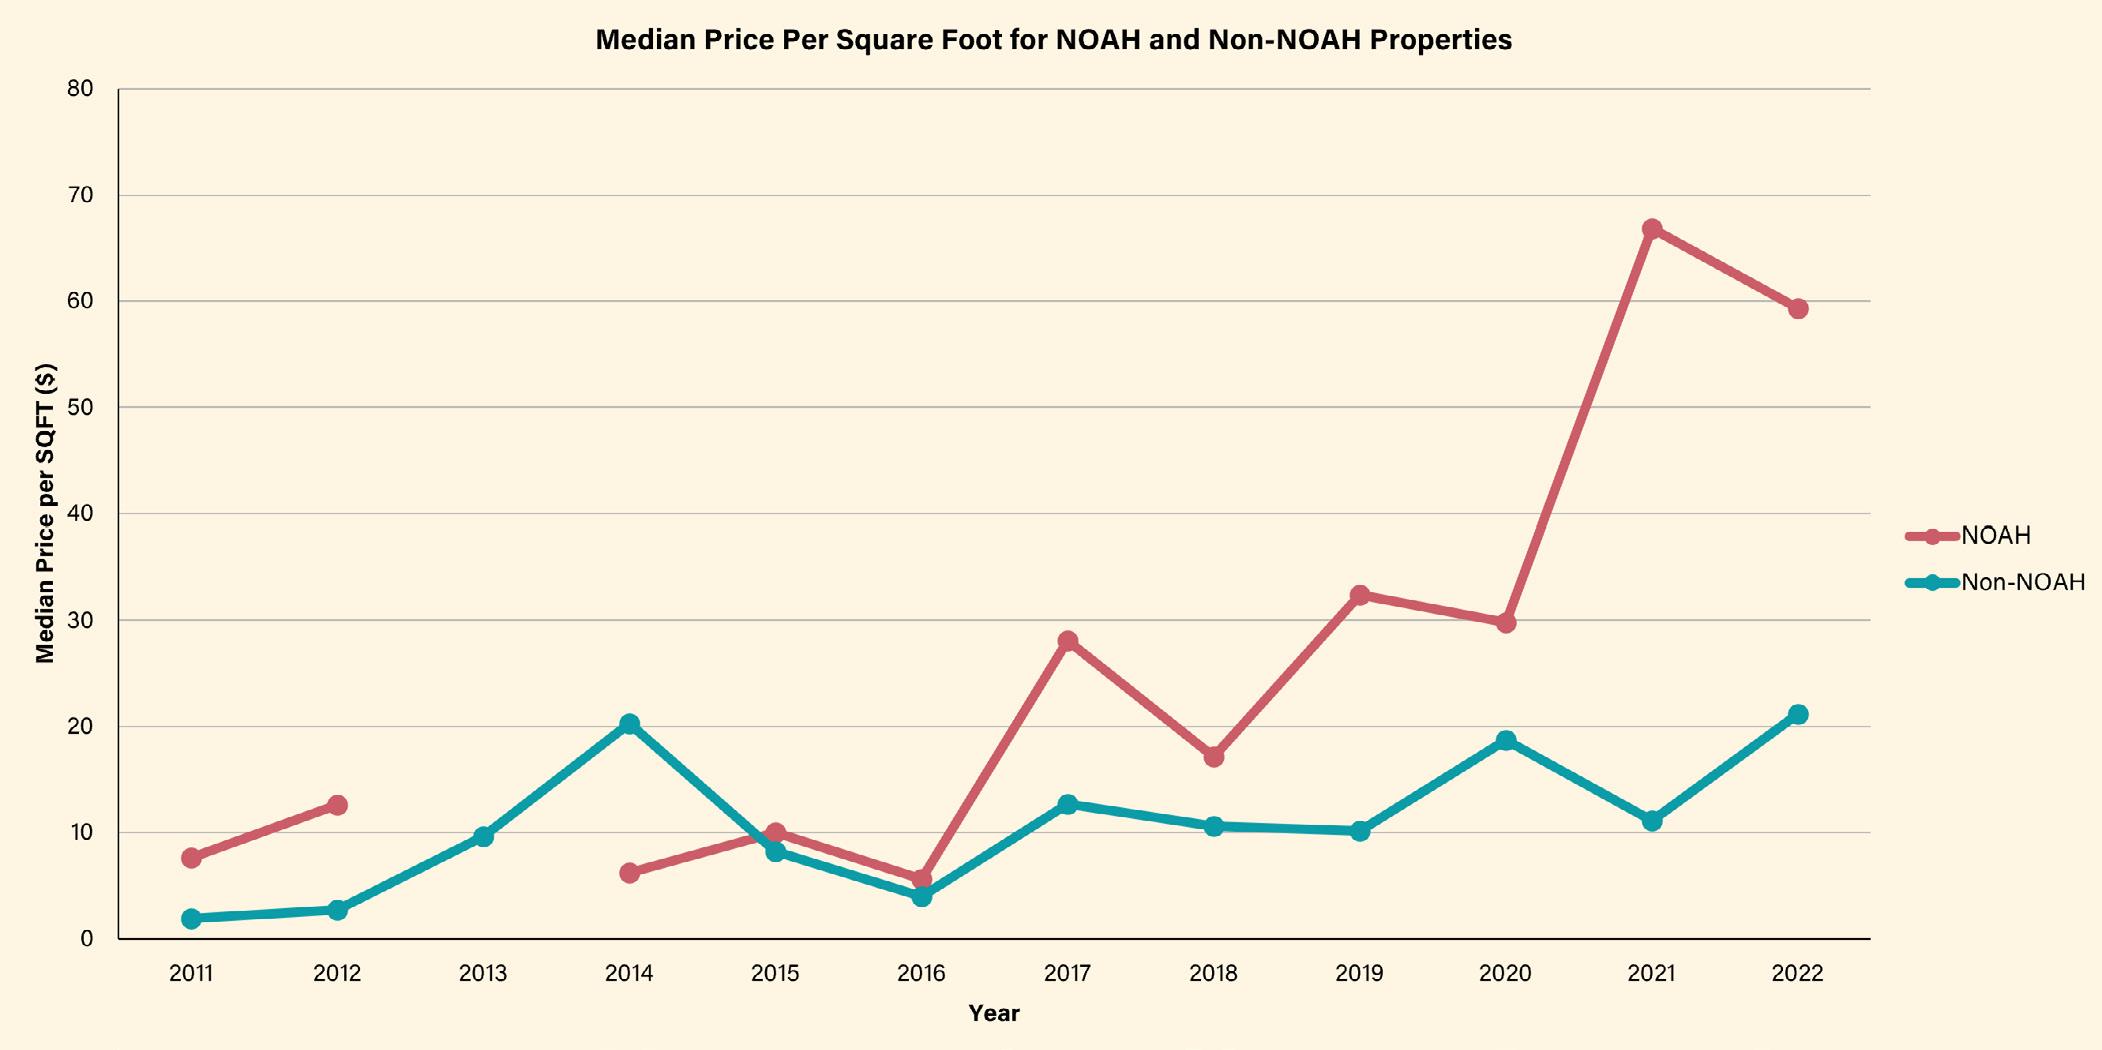
There is a significant difference in price trends between small multi-family NOAH properties in Oakman and other multi-family properties. Since 2018, NOAH properties have risen in price at a faster rate than other properties in the neighborhood, which affirms that NOAH properties can generate higher returns for investors. One possible reason why NOAH properties are more popular with investors may be because the small multi-family NOAH properties allow private investors and small investment institutions to invest with less capital because of their lower price. Another possible reason is its correlation with the announcement of the JLG, which was announced in October 2017. 2
In order to corroborate our findings, we also looked at price per unit across the 45 target NOAH properties. From 2011 to 2022 price per unit shows similar patterns in price increases. Price per unit data can be found in appendix D.
36 | Preserving Small Multi-Family NOAH Properties FINDINGS + ANALYSIS | 37
Source: City of Detroit’s Open Data Portal, Property Sales
Figure 14: Frequency of Property Sales in Selected Detroit Communities
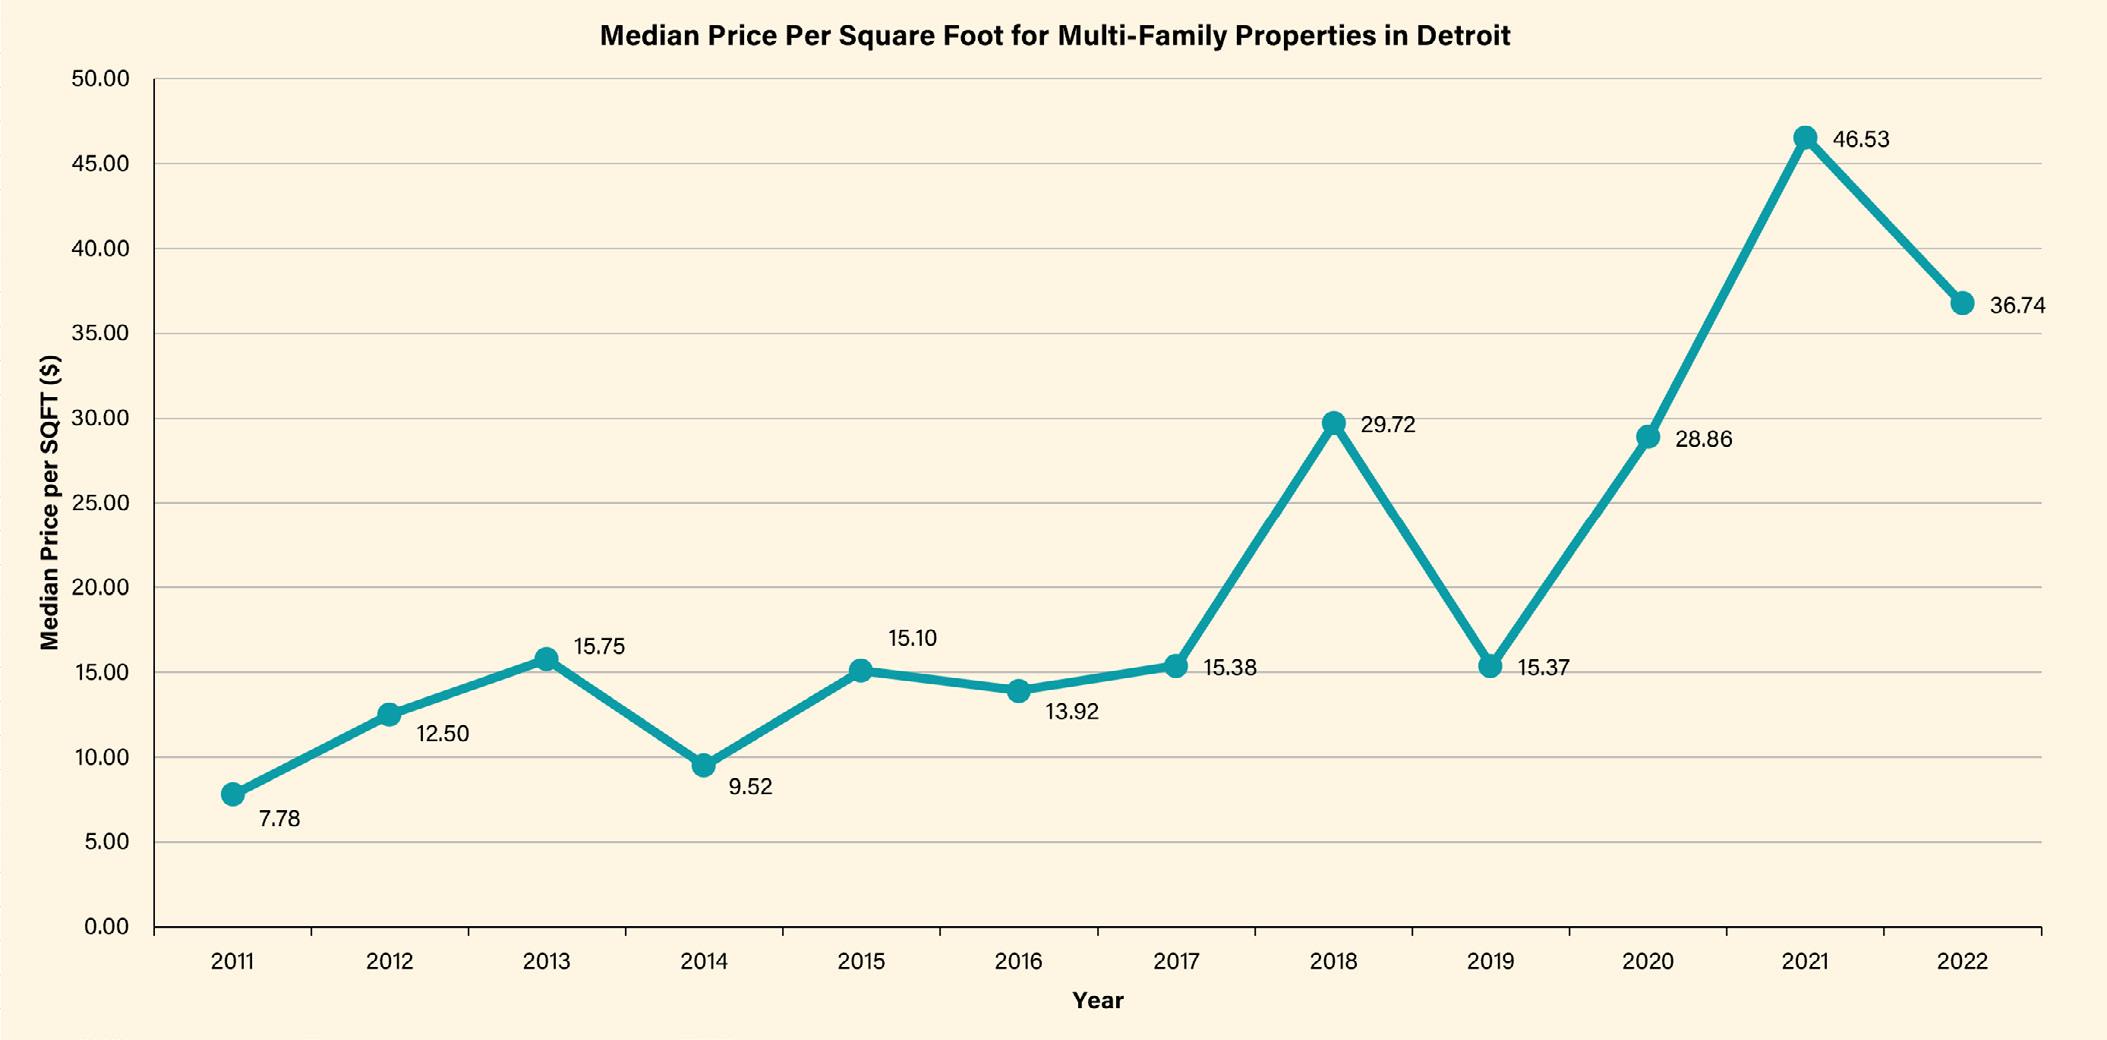
Source: City of Detroit Open Data Portal, Property Sales Database
Figure 15: Median price per square foot for multi-family properties in Detroit
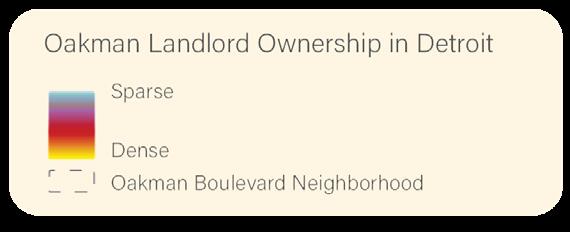
Oakman landlords’ footprint in the
City of Detroit
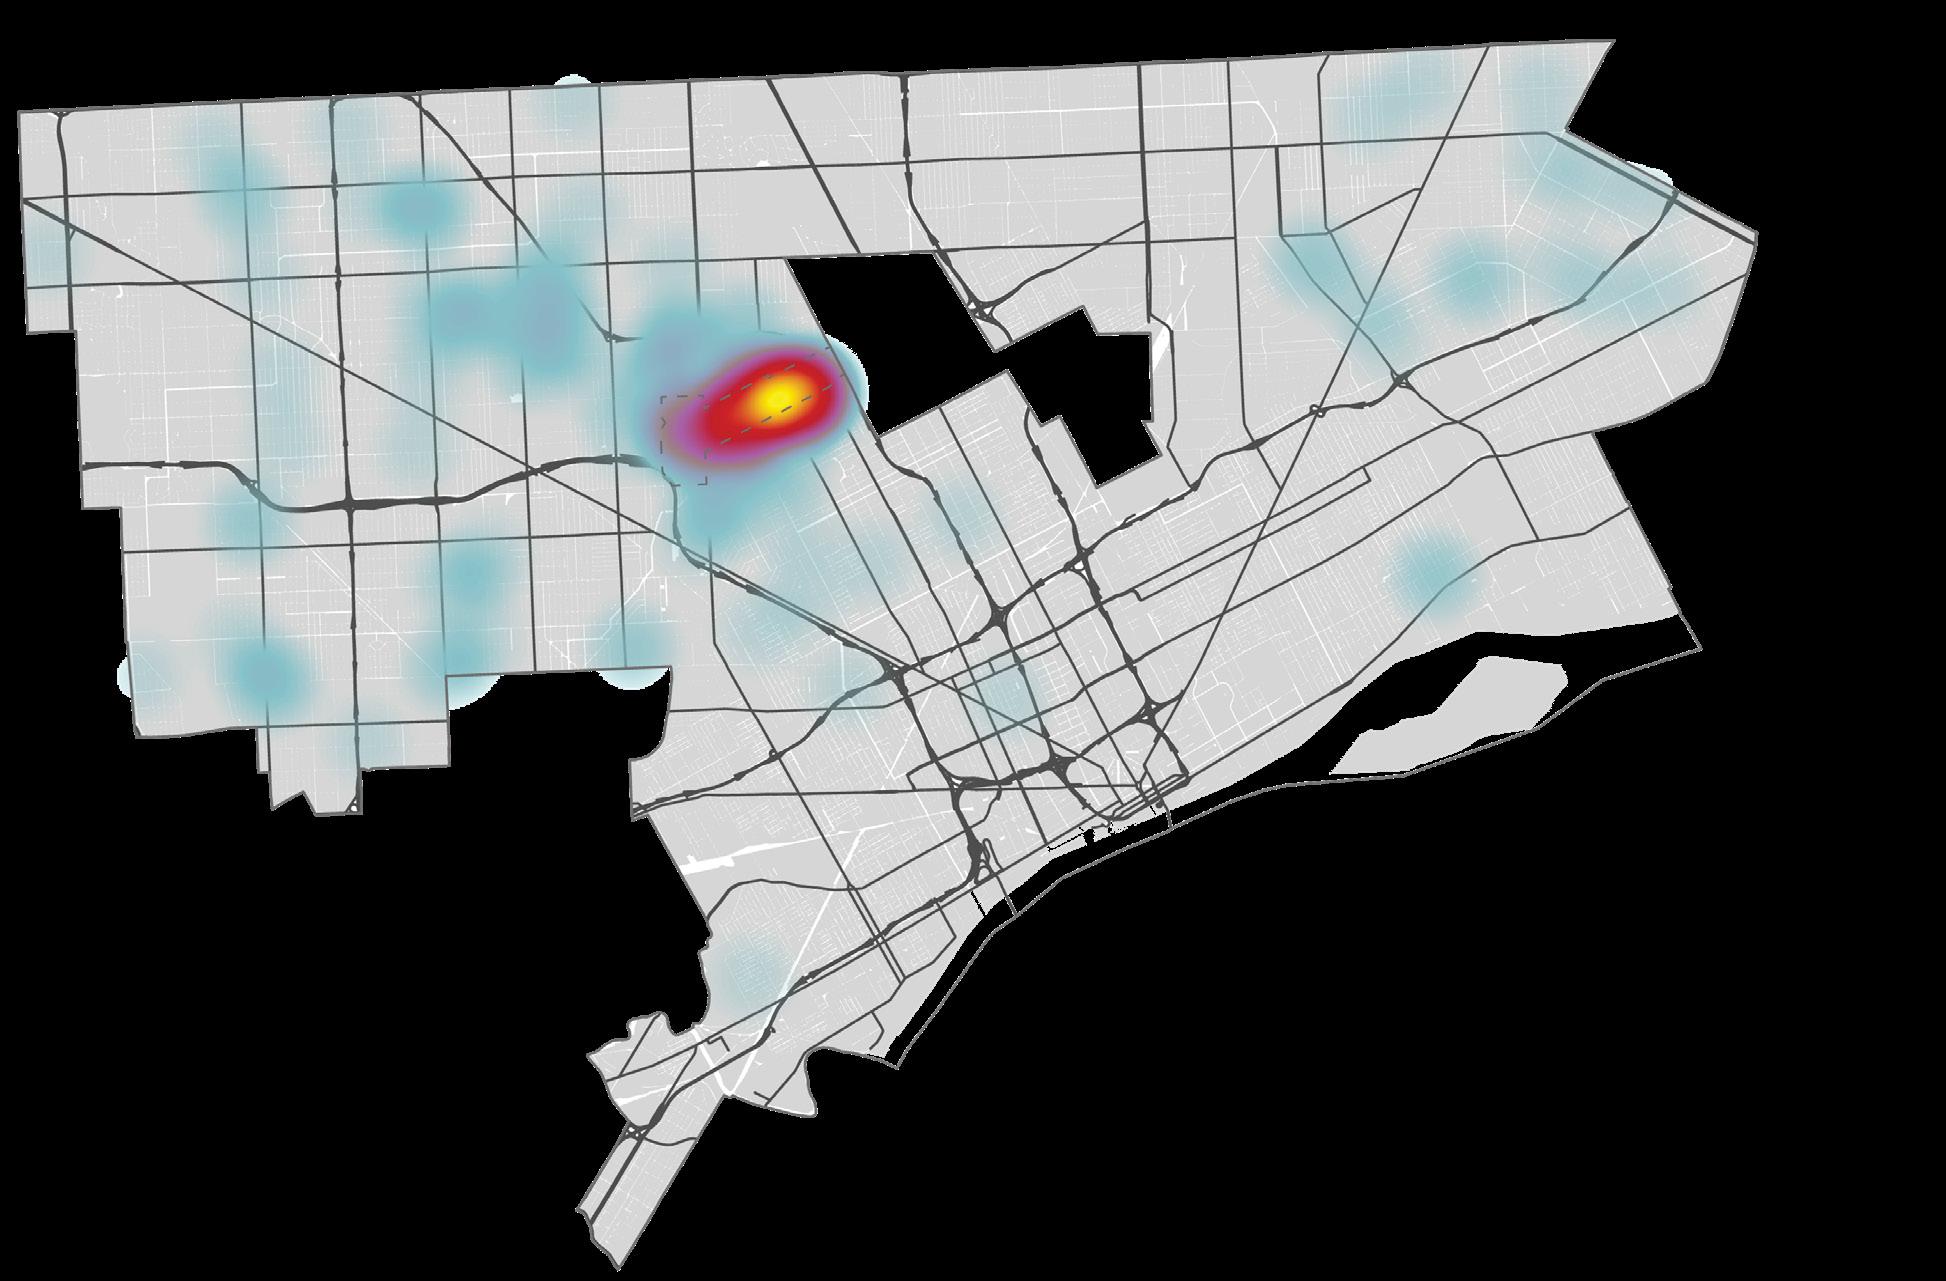
An evaluation of Oakman Boulevard Community’s target 45 NOAH landlords shows that those properties belong to a total of 42 landlords who own 148 properties across the City of Detroit. Of these 148 properties citywide, there are a total of 687 units with an average of 8 units per property. In general, the properties they own range from 4-36 units per property with some single-family properties containing 1 unit, showing that those landlords tend to invest in similar types of properties.
The overwhelming majority (73.81%, 31 landlords) of NOAH landlords are Michiganbased owners who appear to be slowly

collecting additional properties. Meanwhile, 35.71% (15 landlords) of NOAH landlords are Detroit-based owners. Some landlords in Oakman Boulevard Community are larger players with more properties in the citywide rental market. ACP Oakman LLC owns the highest number of units (94) across the City at large, while James Hobbs has the highest number of properties (31).
Should the market trends show an increased value of properties in the Oakman neighborhood, it is possible that some of the landlords with a larger footprint may begin to invest in more properties within Oakman, raising rent values and shifting the landlord market to represent a higher proportion of larger players.
38 | Preserving Small Multi-Family NOAH Properties FINDINGS + ANALYSIS | 39
Source: City of Detroit Open Data Portal, Property Sales Database
Figure 16: Small multi-family NOAH properties vs. other multi-family properties in Oakman Boulevard Neighborhood
Note: There is no sales data for small multi-family NOAH properties in 2013
Source: City of Detroit Open Data Portal, Property Sales Database
Year Median Price per Sqft Min Price per Sqft Max Price per Sqft Number of Sales 2011 7.61 5.92 11.38 5 2012 12.64 0.74 24.54 2 2013 N/A N/A N/A N/A 2014 6.19 0.00 32.88 ( 2nd highest) 12 2015 9.97 0.23 16.69 3 2016 5.61 1.17 24.69 4 2017 28.11 2.07 56.33 6 2018 17.16 15.08 29.54 7 2019 32.36 5.07 66.98 8 2020 29.76 7.02 31.98 3 2021 66.84 0.14 76.03 4 2022 59.30 57.19 61.40 2
Table 8: Price trend statistics for small multi-family NOAH properties in Oakman Boulevard Neighborhood
Source: City of Detroit Open Data Portal, Parcels
Figure 17: Oakman Community Landlord Footprint throughout the City of Detroit
Listed rent is an important part of understanding the affordability of properties within a community. However, obtaining accurate listed rent data for the 45 properties was challenging. Our team relied on MLS data to capture the most current listed rent prices, however the rent data that we were able to gather came from a range of years (2012-2021), making it difficult to accurately assess and analyze.
Of the 45 properties, we gathered listed rents for 18 properties. For the rent information we managed to collect, the data shows that those small multi-family NOAH properties are still relatively affordable, with rent in the range of $450-$895. Across the rent information we collected, the average listed rent is $605.78. In addition to looking at MLS listings to find rent data, our team looked at recent apartment listings on Zillow, Redfin, and LoopNet, knowing that some of the most up-to-date information may not yet be available in MLS. During our search, we found that some recently listed rent prices differed from what we
found in MLS. For example, the rent data listed in MLS before 2020 for 13639 La Salle Boulevard was $450, while recent Zillow postings show recently renovated apartments available for $800 and $850. This example underscores the challenge of accessing real-time rent listings, making it difficult to track whether properties remain affordable or not.
As discussed in our analysis, increased sales frequency and rising property values in the neighborhood indicate that rent levels in these same properties are likely to rise significantly in the near future.
Summary of Findings from Property Research
Through property research, our team found that 45 properties with 4-36 units were identified as NOAH in the Oakman Boulevard Community. All of these NOAH properties were built before 1957, representing a high risk of lead paint exposure in properties that do not hold a certificate of compliance. 41 of the 45 properties have not gone through
the process to receive a certificate of compliance, which indicates a high likelihood of poor exterior and interior conditions. Inspection and lead clearance is imperative in rental-occupied properties due to the aging housing stock in the City of Detroit and the risk of lead exposure to tenants.
An analysis of frequency of sales showed that 31 of the 45 target properties were sold between 2011 and 2022. 19 properties were traded multiple times. Compared to Detroit’s citywide turnover average of 38.57%, residential properties in the Oakman Boulevard Community have a turnover average of 39.92%. However, the 45 target properties have a much higher turnover rate (68.89%), signaling that NOAH properties have a higher likelihood of being traded on the market. The annual appreciation rate for small multi-family NOAH properties in the neighborhood is 20.52%, about five percentage points higher than the City of Detroit (15.15%). This high average annual appreciation rate combined with properties’ high turnover rate signals the risk of NOAH properties losing affordability. Of the rent information we gathered, listed rents ranged from $450-$895 across varying unit sizes. The average rent across the collected data is $605.78. While these properties are affordable at present, the market trend analysis indicates that property values are rising and this will likely increase rent levels in the future.
40 | Preserving Small Multi-Family NOAH Properties FINDINGS + ANALYSIS | 41
Rent level and distribution
Table 9:
Source: City of Detroit Open Data Portal, Parcels
Oakman Community Landlord Summary
Source: City of Detroit Open Data Portal, Parcels
Number of Landlords Total Properties Total Units Median Number of Properties per Landlord Median Number of Units per Landlord 42 148 687 1 8 Percent of Landlords with 1 Property Percent of Landlords with a Total Unit Count of 4 or less Percent of Landlords with Average Unit Count of 4 or less per Property 54.76% 19.05% 50.00%
Table 10: The small-scale scope of Oakman Community Landlords
COMMUNITY ENGAGEMENT
Summary of Findings
This section includes our findings from the community engagement and outreach activities that were conducted. The findings are an integration of the collected property data, observations from the community event and windshield survey, and interviews. The findings serve to construct a deeper understanding of the threats to NOAH properties in the Oakman Boulevard Community as well as an analysis of potential solutions. The findings in this section will help inform our recommendations.
Resident Affordability
• Affordability was not identified as the greatest housing barrier by the neighborhood association. Instead, finding housing that fit a resident’s needs was considered to be more challenging.
• A major neighborhood concern expressed in our community engagement activities was the diminishing resources for unhoused people in Oakman. There is a great need for people to have access to stable housing and health care services within the community.
• Housing vouchers, such as Section 8, offer property owners in Detroit rents that are higher than the prevailing market rate. When many voucher recipients are concentrated in one physical neighborhood, the NOAH rental rates are inflated. This can disadvantage residents who are cost burdened but not recipients of vouchers.
Property Conditions
• According to the neighborhood association, the housing stock in the area is abundant, but the quality is below standard for Detroit. The community
association identified property conditions as the most pressing concern among their members and residents.
• Families with young children value a safe neighborhood more than adequate physical condition of housing.
• The typical demographic profile for NOAH units in Detroit is a single mother with three children. This illustrates the need for policy and programs that improve health outcomes for children such as lead abatement.
• Neither landlord interviewed was aware of any programs or public funding available to improve property condition or preserve affordability of NOAH units.
Property Management Challenges
• Most residential rental property owners in Detroit are in the business due to the cash flow potential, not the property value accrual. However, high property taxes in Detroit disincentivizes investors from entering the market.
• Housing costs have increased in recent years and are exacerbated by (1) the older housing stock that requires additional maintenance, (2) the disproportionately high utility costs, and (3) the disproportionately high property taxes in Detroit.
• The COVID-19 pandemic placed added pressure on local landlords, which contributed to landlord disinvestment in the area.
• Housing vouchers are common in Detroit, and reliability of income reduces labor for landlords.
• Neither landlord interviewed reported passing increased operating cost along to tenants, as the rental market sets the rates, not individual landlords.
Joe Louis Greenway Impacts
• Residents want to see new development in their neighborhood, but recognition of the many historical assets and features in the neighborhood should be elevated. Historical markers or preservation efforts are supported.
• The community association relayed that they have not heard much discussion about the JLG and did not expect redevelopment or increase in rent or property values in the near future.
• To support the transitioning land use character in the neighborhoods along the greenway, the legacy zoning of older industrial lots should be revisited and a large-scale rezoning pursued as part of the Joe Louis Greenway Plan.
• There is support for title clearance and lapsed property tax relief to prevent resident displacement as a result of increased property values.
Opportunities for Improvement
• Despite substantial challenges, the Oakman Boulevard Community has experienced many significant improvements since the Great Recession, assisted by many community-led organizations.
• New policies, new grant funding, and attention from the upcoming Joe Louis Greenway serve to uplift the community and enable actions to improve safety, health, and wellbeing.
Windshield Survey
The windshield survey revealed that the 45 target properties appeared to be in better exterior physical condition compared to the other properties in Oakman. When observing each property, we noticed some recurring property condition issues that resulted in a score of 3, including deteriorating front steps/porches, missing or damaged gutters, and peeling siding, cladding, or paint. The properties with a score of a 2 were typically missing windows. The only property to score a 1 experienced severe damage from a fire in early April; when we originally visited this building in March, we issued a property condition score of 3. Four properties appeared vacant, evident through boarded up windows, fencing, and absent resident activity. One property had a resident eviction sign posted. The full results of the windshield survey are included in Appendix E. A summary of the findings are included below.
42 | Preserving Small Multi-Family NOAH Properties FINDINGS + ANALYSIS | 43
Condition Number of Properties Median Build Year of Properties 1 1 1928 2 7 1930 3 18 1927 4 19 1929 Potentially vacant, any score 4 1928 Potential ongoing/current remodel, any score 8 1927 Eviction notice posted, any score 1 1952
Table 11: Summary of Windshield Survey Findings
POLICY RESEARCH
Before discussing new strategies for preserving NOAH, it was necessary to understand the current strategies and policies that either directly or indirectly influence these properties. The following section will report on local, state, and federal programs currently available to support the preservation of Detroit NOAH properties, and the section will conclude with a discussion of policy case studies from other large cities.
Existing Preservation Efforts in Detroit
Targeted Strategies to Preserve NOAH
In 2018, the City of Detroit created the Preservation Action Plan (the Action Plan), which is a five-year plan laying out strategies to preserve 10,000 units of affordable housing by 2023. This document is the most comprehensive document on affordable housing preservation for the City. The Action Plan described two primary points of concern with regard to NOAH properties in Detroit: rising market rents and the obsolescence or deterioration of aging units. Recognizing that the goals of the Action Plan were set to be achieved in 2023, we interviewed representatives of the Housing and Revitalization Department (HRD) about their progress on the strategies they had set forth.
Detroit Housing for the Future Fund (DHFF)
By far the most targeted approach to NOAH preservation occurs through the Detroit Housing for the Future Fund (DHFF), a part of the Affordable Housing Leverage Fund
which was created as a result of the 2018 Multifamily Affordable Housing Strategy. The DHFF, operated by LISC Detroit, provides four products to assist NOAH property owners and those who wish to purchase NOAH properties, as well as developers of new affordable housing. Table 12 provides a summary of the available programs, their requirements, and the benefits they provide.3
According to representatives of DHFF and LISC, there has been high demand for both loans and for their preferred equity product. Funding is limited, however – the original $58 million designated for early implementation has almost been completely exhausted. The Capital Needs Assessment Grant has not been utilized as frequently as LISC expected, but a new city initiative offers Capital Needs Assessments (CNA) to NOAH owners for free, and this project has been more widely utilized. The free CNA program will likely overtake the grant program based on information provided to us by the DHFF and LISC.
Loans offered by the DHFF are available not only to NOAH owners, but also to developers of affordable housing and purchasers of NOAH properties. This means that the loans are not specifically designated for preservation of NOAH. As a result, there has been wider utilization of the loans by more experienced developers rather than NOAH owners. The team at LISC has done some targeted outreach to less experienced NOAH landlords to offer opportunities to receive loans. However, high demand for such products has led to limited outreach to ensure NOAH owners utilize DHFF loans.
Table
DHFF Product Requirements Benefits
Capital Needs Assessment (CNA) & Green Capital Needs Assessment
Recoverable Grant Program
Low Interest
Subordinate Mini-Perm Loan
- Property must be 100% Affordable units (below 100% AMI) or NOAH.
Low Interest Preservation Acquisition Mini-Perm Loan
- For NOAH and new development, both for-profit and nonprofit.
- Primarily for multifamily projects of ≤75 units.
- After receiving the loan, 50% of units must be affordable for 80% AMI or lower, remaining 50% affordable for no more than 120% AMI. (Deeper affordability scores higher on application.)
- Small/New developers must be partnered with experienced development consultants.
- Subordinate loan which allows for refinancing existing debt, up to $2 million.
- For NOAH, can be used for refinancing and/or renovation.
- For NOAH and new development, both for-profit and nonprofit.
- Primarily for multifamily projects of ≤75 units.
- After receiving the loan, 50% of units must be affordable for 80% AMI or lower, remaining 50% affordable for no more than 120% AMI. (Deeper affordability scores higher on application.)
- Small/New developers must be partnered with experienced development consultants.
- Senior loan which allows for refinancing, up to $5 million for NOAH property owners.
- For NOAH, can be used for refinancing and renovation.
Preferred Equity Product
- For NOAH and new development, both for-profit and nonprofit.
- Primarily for multifamily projects of 75 units or fewer.
- Minimum affordability requirements: 5% of units at 50% AMI, 15% of units at 60% AMI, overall 50% of units at 80% AMI or below.
Source: Detroit Housing for the Future Fund, Our Offerings
- Equity investment in project ownership entity.
- For refinancing, renovation, or acquisition of an existing NOAH project.
44 | Preserving Small Multi-Family NOAH Properties FINDINGS + ANALYSIS | 45
12: DHFF Programs for NOAH Preservation
- Covers the cost of a third-party capital needs assessment.
A New PILOT Ordinance
In December of 2022, the State of Michigan changed the regulations related to municipal PILOT programs, giving local governments more leeway in determining eligibility. This change gives the City of Detroit the opportunity to use PILOTs to preserve naturally occurring affordable housing. The City is currently adapting their PILOT program to make NOAH properties eligible for the PILOT. Although the policy is not fully developed, the City is considering that NOAH properties will pay 10% of rental revenues as a PILOT, and properties with deeper levels of affordability will be able to pay 4% of rental revenues. This change provides a financial incentive for continued affordability, reducing the risks that these units will be converted to market rate.
Inter-Organizational Cooperation
Detroit’s city government has worked to coordinate preservation-related efforts across organizations. In early 2020, a large conference involving the Detroit Housing Commission, MSHDA, HUD, and the City of Detroit met and discussed many topics - preservation among them. Discussions held at this event informed the prioritization framework discussed above. There is not, however, frequent collaboration between all of these agencies; rather, most work happens between two agencies. It was also noted that MSHDA has not been a key partner for NOAH work.
Information Availability
The City’s 2018 Multifamily Affordable Housing Strategy provides a list of existing housing preservation tools. While most were geared toward subsidized housing projects, some were for NOAH. As part of this process, Enterprise Community Partners compiled a Multifamily Affordable Housing Resource Directory which further outlined a number of resources available to multifamily property owners. The City also developed
an internal record of affordable housing in Detroit. According to a representative from HRD, this database includes some known NOAH properties, but details on these properties are hard to obtain, especially for properties whose owners have not properly registered with the City. There is also an Affordable Housing Map open to the public, which shows all rent-restricted properties in the City. This is a part of the City’s goal of identifying affordable housing put forth in the Preservation Action Plan.
State & Federal Programs
Outside of the DHFF, there are few governmental programs in place explicitly to support NOAH properties or property owners. The State of Michigan, through the Michigan State Housing Development Authority (MSHDA), currently has very few programs directed toward NOAH preservation, and what does exist is mostly geared toward nonprofit owners. Since most NOAH properties are owned by private landlords, not nonprofit entities, they are not eligible for gap financing or other funding from MSHDA. Funding from the Federal government through the Department of Housing and Urban Development (HUD), exists to some extent for NOAH property owners, though support is limited. One avenue of potential funding is HUD 221(d)(4) Mortgage Insurance, which is available to finance substantial rehabilitation of a multifamily property. This provides access to loans to those who might not otherwise receive them. Similar to MSHDA, most other available funding is limited to programs already receiving some subsidy or owned by a nonprofit entity.
Case Studies of NOAH Preservation Policies in Other Cities
This section identifies and analyzes affordable housing development and NOAH preservation policies from other large cities across the United States and assesses their applicability to the goals, objectives, and context of NOAH preservation efforts in Detroit. Any policy used as a model for Detroit small multi-family NOAH preservation must address one or both of the risks that these properties face. First, NOAH properties face the risk of conversion to market rate.4 As owners struggle with small profit margins, they may be inclined to rehabilitate the property and place the units back on the market at higher rents. Therefore, the model policies improve the financial health of these multifamily properties while simultaneously attaching affordability restrictions to all or some of the units. Solely applying affordability requirements would push owners out of the market because of the limited returns, and giving them financial benefits without affordability requirements creates no social benefit for the City. Second, NOAH properties face the risk of physical deterioration if there is no investment in renovation.5 Thus, the model policies present various approaches to providing financing for rehabilitation.
The policy models are broken into two specific categories (Tax-Based Strategies and Alternative Financing) with a third catch-all section (Additional Case Studies).
Tax-Based Strategies
The tax-based strategies discussed in this section include a mix of abatements, exemptions, and PILOTs (Payments in Lieu of Taxes). The City of Detroit is currently developing an extension of the existing
PILOT program. The current PILOT program is not available for NOAH properties because they do not receive any form of government subsidy. The expansions to the program will give eligibility to NOAH properties, but the program is still in development. Thus, tax-based strategies could be a potential path forward for Detroit, and the findings we learned from other cities can inform the structure of the new PILOT program.
Five tax-based strategies were identified in this study (see Table 13). All five policies share three similar components: the award, timeline, and eligibility requirements. Between the programs, the award varies based on the scope (the size of the projects and the size of the fund) and goals (priority projects) of the program. For example, the Downtown Property Pilot in Memphis (TN) prioritizes large-scale development, so it provides an exemption for the total value of the improvements.6 On the other hand, Act 42 in Pittsburgh (PA) identifies areas with a greater need for investment and offers greater benefits in those areas relative to the rest of the city.7 The timeline is relatively consistent between the programs, ranging between 10 and 15 years, but the timeline may be longer for projects with greater need or deeper affordability. For example, the J-51 Tax Abatement in New York City provides tax benefits to projects with deeper affordability for 34 years rather than 14 years.8 Finally, the eligibility requirements for these programs vary based on the goals and objectives of their respective cities. These requirements may relate to the type of project, but they may also relate to affordability.
Some additional and optional components of these programs are step-downs, reallocations, and institutional support. A step-down is a gradual decrease in the amount of benefits provided. An analysis
46 | Preserving Small Multi-Family NOAH Properties FINDINGS + ANALYSIS | 47
Tax-Based Strategies
Neighborhood Enterprise Zone
Downtown Property PILOT J-51 Tax Abatement
4d Affordable Housing Incentives Act 42 Class 9
City Detroit, MI Memphis, TN New York City, NY Minneapolis, MN Pitttsburgh, PA Cook County, IL
Maximum Award Tax exemption for the value of all property improvements
75% exemption for value of property improvements
Total exemption for improvements + reduction by 8.3%-12.4% of costs
40% rate reduction for multi-family 20% rate reduction for single-family
Residential: $86,750 for construction, $36,009 for rehab Enhanced Rehab: $250,000
50% reduction to assessments
Timeline 15-17 years 15 years 14 or 34 years (4-year stepdown) 10 years
Residential: 3 years Enhanced Residential: 10 years
10 years
Eligibility
1-8 units Primary purpose must be residential
Within CBID “But for” Construction costs > 60% of project value
Privately- or publiclyfunded rehab, major capital projects, or conversion to multi-unit dwelling
20% of units affordable at 60% AMI Must accept tenant-based assistance
Current use must be residential or vacant Future use must be residential, for sale, or retail
Enhanced Residential within certain areas only
Multifamily with minium 7 units 35% of units or more must be Class 9 units Class 9 tenants must have incomes below 80% AMI
of the Memphis Downtown Property PILOT indicated that step-downs can be an effective way to transition recipients out of the program without experiencing significant financial distress.9 (See Appendix F). A city may also choose to reallocate a portion of the tax benefit to public projects, such as streetscape improvements, if the recipient demonstrates a higher level of financial stability than was expected.10 Finally, the type of institutional support provided to recipients may be a crucial determinant of the effectiveness of the program. Institutional support can include transparency and clarity regarding the application process and program operation, any resources provided to potential recipients to access information about the program, and education to build financial literacy or improve property management.11
these properties, except perhaps in the long-term. In this sense, a lump sum payment as a loan, grant, or equity investment may better serve this purpose. Second, redirecting property tax revenues back to property owners may affect the city’s ability to provide adequate public services.
Takeaways
Pros No cap on the total value of the tax exemption
Incentivizes development for large projects
Step-down provides gradual return to tax payment
Requires rent stabilization
Annual compliance review Incentivizes green development
Enhanced residential targets areas of largest need
Large financial incentives
The structure of tax-based strategies has many benefits for local governments. First, they are flexible, meaning they can be adapted to the objectives of the city and the needs of individual recipients, which may change over time. Second, it is relatively easy to build in compliance checks and monitoring as part of a yearly renewal process to ensure the program and requirements are properly enforced. Finally, tax-based strategies can be easily attached to affordability requirements, green construction standards, or any other social benefit the city may desire.
Cons Total acreage of NEZs must not exceed 15% of city
Limited geographic and project scope Insufficient to completely cover gap in capital stack
S.B. 364, 2021 Reg Sess. (Mich. 2021)
Potential for substantial rent increases after time period
May not be a “deep” subsidy
Cap on maximum value of abatement Short timeline
Affordability restraints could be stronger Not available for small properties
Sources
https://downtownmemphis.com/develop-invest/incentives-programs/downtown-property-pilot/ https://furmancenter.org/coredata/directory/entry/j-51-tax-incentive https://www2.minneapolismn.gov/government/programs-initiatives/housing-development-assistance/rental-property/4d/ https://apps.pittsburghpa.gov/finance/Real-Estate-Tax-Abatement-Programs.pdf
https://www.cookcountyassessor.com/incentives-special-properties# class9
On the other hand, tax-based strategies have two prominent downsides, particularly for NOAH properties in the Detroit context. First, the year-to-year subsidy may not go deep enough to incentivize or enable rehabilitation. Detroit NOAH properties need this tax benefit to not just stabilize and improve cash flow, but to also rehabilitate the properties. A yearly tax abatement, exemption, or PILOT may not provide enough capital reserves to rehabilitate
This analysis presents some key takeaways for tax-based policies for NOAH preservation in Detroit. First, any tax-based strategy, as well as any public funding program, must be connected to affordability requirements. Second, a step-down may be an effective aspect of the program to ensure that properties do not struggle to achieve financial stability absent public funding. Third, the City should ensure that all aspects of the program, including the application process; timeline; requirements; and any reapplication or compliance checks, are explained clearly and resources are provided in an accessible manner. Fourth, because of the general difficulties related to NOAH property ownership and rental management, providing institutional support related to financial literacy, code and ordinance compliance, and management best practices would be beneficial.12 Finally, many of the NOAH properties identified in this report may not be code compliant due to physical issues and lead contamination, among other issues. Many of the existing public programs for affordable housing are tied directly to code compliance, which means that these properties would not be eligible. Thus, any tax-based strategy should be introduced alongside or in tandem with lump sum financing for property rehab.
Alternative Financing
Alternative financing methods may be able to address this deficiency in tax-based strategies. Providing large lump sums up
48 | Preserving Small Multi-Family NOAH Properties FINDINGS + ANALYSIS | 49
Table 13
NOAH Impact Fund Housing Partnershup Equity Trust
New Generation Fund LLC Housing Trust Fund Local Operating Subsidy Program
City Twin Cities, MN National Los Angeles, CA Austin, TX San Francisco, CA
Financing Type Equity Equity Loan Loan/Grant Grant
adapted to the type of project and the needs of the owner. For example, New Generation Fund LLC offers different LTV to nonprofit (130%) and for-profit (90%) owners.13
Purpose
Finance the acquisition of multifamily properties
Missionoritented REIT for acquisition, value add, and redevelopment
Acquistion, predevelopment, and moderate rehab
Development and rehab of owneroccupied, rental development, acquistion
Fills gap between operating costs and revenues for supportive housing
Funding
Source
Institutional investors (through the city)
Privately funded Los Angeles Housing Department and private banks
40% of property tax revenues from properties on previously city-owned properties
City appropriations
Pros
Places NOAH properties in the hands of mission-driven owners
Proven to keep affordability (average of 57.4% AMI across markets)
Variable terms for recipients
Higher LTV for nonprofits
Addresses multiple housing-related issues for lowincome households (repairs, preservation, development)
Addresses the largest concern for NOAH owners (operating costs)
There is, however, one key downside to debt financing. First, these programs have the implicit assumption that there is sufficient cash flow to pay monthly debt service. For owners in a city like Detroit where cash flow is limited, particularly for NOAH owners, they may not be able to repay their loan. Hence, loans may need to be coupled with a tax-based strategy that extends for at least the maturity of the loan, preferably longer, to ensure that owners can pay off their debt. This solution does, however, negate the “budget-neutrality” of a loan.
Equity
Cons
Requires full repayment to investors plus double-bottom line return
Requires dividend payments
Sources
3-year maturity may not be feasible for small-scale developers Requires construction loan to repay
Grants are not budget neutral Not budget neutral
https://noahimpactfund.com/wp-content/uploads/2022/06/NOAH-Impact-Fund-Brochure.pdf https://housingpartnership.net/hpet https://www.newgenerationfund.com/ https://www.austintexas.gov/department/housing-trust-fund https://reports.nlihc.org/rental-programs/catalog/san-francisco-local-operating-subsidy-program
front may allow property owners to invest significantly in the rehabilitation of the property, but the method for delivering these funds to owners can vary based on the goals and restraints of the city. Five alternative financing policy models were identified in this study which use three forms of financing: loans, equity, and grants (see Table 14).
Loans
Two examples of debt financing were included in this study: New Generation Fund LLC in Los Angeles (CA) and the Austin Housing Trust Fund in Austin (TX).
Public low-interest loans to NOAH property owners can provide the necessary injection of cash to rehabilitate their properties, while also ensuring that funds are repaid and are available for future projects. This presents the primary strength of this approach: loans are budget-neutral. Aside from administrative costs, the opportunity cost of not investing in projects with a higher return, and the risk of the borrower defaulting, any money provided to property owners will be paid back over the life of the loan. A secondary benefit of debt financing is that the terms of the loan (debt coverage ratio, interest rate, maturity, etc.) can be
Two examples of equity financing were included in this study: the NOAH Impact Fund and the Housing Partnership Equity Trust. These two strategies take alternative approaches to raising capital. The NOAH Impact Fund uses institutional capital, but is managed by the cities of St. Paul and Minneapolis, MN. The Housing Partnership Equity Trust is also privately funded, but it is a nationwide Real Estate Investment Trust (REIT) managed by the Housing Partnership Network. The benefit of these programs is that they leverage private dollars rather than limited public resources. They also leverage the experience and knowledge of private financiers and developers who can help build management capacity among NOAH owners and managers.
The primary downside of equity financing, however, is that the investors will eventually expect to extract some value from the property: they invest in these funds expecting to either receive annual dividends or a return on their investment once the project is stabilized. Across their portfolio of 13 properties, the Housing Partnership
Equity Trust pulled out over $1.8 million in dividends in 2015 and over $1.7 million in 2016.14 Given the financial constraints facing Detroit NOAH, there may not be enough cash flow to pay these dividends or deliver a return on the investment. Any available cash flow would be better served going back into the property. Thus, because equity is generally a more expensive source of capital relative to debt, loans may be a more suitable form of financing for these properties.
Grants
Two examples of affordable housing grants were included in this study: the Austin Housing Trust Fund and the Local Operating Subsidy Program in San Francisco (CA). Grants are perhaps the most desirable form of renovation financing for NOAH property owners. It is essentially free money. Grants put money in the hands of cash-strapped owners to rehabilitate their property with no expectation of repayment. They would help improve the properties’ quality without placing them under financial stress that would put upward pressure on rents. Grants also have the added benefit of flexibility. The size, purpose, and recipient of the grant can change based on the goals of the city or the needs of the owners. For example, the Local Operating Subsidy Program15 only addresses the gap between operating costs and operating revenues for supportive housing projects, but the Austin Housing Trust Fund provides grants to cover construction costs.16 The structure of these grants is based on the goal of the program. The Local Operating Subsidy Program17 stems from a desire to keep supportive housing projects financially stable, but the Austin Housing Trust Fund18 prioritizes renovation and new construction.
The primary downside of these types of programs is that they require large public investment with no repayment.
50 | Preserving Small Multi-Family NOAH Properties FINDINGS + ANALYSIS | 51
14
Table
- Alternative Financing Case Studies
Only using grants would quickly deplete local resources, limiting the number of projects that can be financed in this way. There is an additional limitation to grants in that it may be harder to mandate longterm affordability or maintain a degree of governmental oversight on these properties, compared to policies discussed earlier such as tax abatements, especially if the money is provided up front. Thus, an effective grant would have to have long-term strings attached to achieve long-term affordability.
Takeaways
Given the relative pros and cons of these different forms of financing, the optimal form of funding depends heavily on the local context, the goals of the city government, and the needs of the property owners. NOAH property owners in Detroit, especially in the Oakman Boulevard Community, need low-cost or no-cost, large lump sum financing. Limited cash flows, especially with the prospect of long-term affordability requirements, may restrict their ability to repay investments with any return, which may eliminate equity from the list of options. For this reason, it is important to consider how a financing package may also be combined with long-term support for covering repayment in the form of tax abatements. Grants are perhaps the best solution to the issue of low cash flow, but they would deplete local finances more quickly. Given the level of need in Detroit and the number of NOAH property owners, grants may not be feasible. Therefore, a 0% interest loan coupled with a tax abatement may be the best strategy for incentivizing renovation of NOAH properties.
Other Types of Support
Four more policy examples were included in this study, and each has its own approach improving the quality of NOAH properties (See Table 15).
Management Support and Training
The Management Training and Support offered to property owners by the Community Investment Corporation (CIC) prioritizes improving the property management standards to ensure that the properties are effectively and efficiently run. CIC offers management workshops and seminars, and they maintain a repository of information on city codes and ordinances and management best practices.19 This approach to NOAH preservation focuses on building management capacity rather than financing renovations based on the assumption that improving management quality will lead to better outcomes for the properties and the tenants. This approach is beneficial in that it may lead to more widespread code compliance, which is an issue that is prevalent in Detroit, and that it can improve transparency and clarity of local ordinances and resources. The downside of this approach, however, is that management workshops and seminars require willingness to participate on behalf of the owners, which has proven to be an issue in the past.
The work of CIC may be an effective model of how to construct a database of local resources and regulations. Creating a clear database can also improve the effectiveness of new and existing policies because improving the clarity regarding what resources are available to NOAH owners may increase usage. In addition, the training seminars may also be effective models of how to structure local workshops and training and perhaps how to increase attendance.
CIC Property Management Training and Support
Troubled Buildings Initiative Transfer of Development Rights
CIC Energy Savers
City Chicago, IL Chicago, IL Seattle, WA Chicago, IL
Category Management Support Financing/Rehabilitation Financing Electrification
Purpose
Improve management capacity and clarity regarding resources and requirements
“Reclaim troubled and abandoned buildings that create dangerous and hazardous conditions for residents, neighbors, and first responders”
Prevents redevelopment of affordable properties
Lower operating costs related to utilities
How It Works
Provides easy-toaccess resource database Management
Toolbox and best practices Management workshops
Identifies toubles and dangerous properties
Encourages rehab
Receiver (CII) places lien on property and rehabs
Owner must repay lien, or property passes to CII
Sending sites sell their development rights to receiving sites, who can build more densely
Updates mechanical systems related to utilities CIC provides low-cost financing with high LTV Utility companies manage contractor and CIC oversees construction
Parties Involved
Community Investment Corporation
Pros Easy-to-access
All in one place
Cons Registration fee for workshops may discourage owners/ managers
City of Chicago Community Initiatives, Inc (affiliate of Community Investment Corporation)
Places higher accountability on property owners
Places affordable properties in the hands of mission-driven organizations
City of Seattle
Puget Sound
Regional Council
Redistributes development rather than prevents it
Provides cash to property owners, which could be invested in rehab
Can cross jurisdictional lines
Philanthropic financers
Utility Companies
Community Investment Corporation
Lowers operating costs
Improves physical quality and tenant experience
Radical approach may invite significant public and private challenges
Sources www.cicchicago.com/programs/property-management-training/ www.cicchicago.com/programs/troubled-buildings-initiative/ www.psrc.org/media/2063
www.cicchicago.com/prloans/#energy
May disincentivize use of other affordability bonuses by receiving sites
Full recourse loan secured against the property
52 | Preserving Small Multi-Family NOAH Properties FINDINGS + ANALYSIS | 53
Table 15 - Other Types of Support
The Troubled Buildings Initiative
The Troubled Buildings Initiative (TBI) in Chicago (IL) is a more radical approach to NOAH preservation. The process begins by the city encouraging owners of troubled (that is, containing health hazards) or abandoned buildings to rehabilitate their properties. If the owners do not follow through, the housing court appoints a third party receiver (Community Initiatives, Inc.) for the property. The receiver is required to rehabilitate the property, which they finance by placing a lien on the property. The owner is then required to repay that lien. If the lien is not repaid, the property is foreclosed and ownership is passed to the receiver. 20
The Troubled Buildings Initiative’s radical nature is simultaneously its biggest strength and weakness. This program represents a stronger approach to enforcement. The hazards created by these buildings pose threats to not just residents, but to everyone who engages with the property. This program ensures that property owners are held accountable for those hazards. The TBI also has the added benefit of placing properties in the hands of missionoriented organizations who will ensure that the physical quality of the property is maintained and that the units remain affordable.
However, this approach also may invite opposition from governmental boards, private owners, and any other stakeholder in the housing market. The program represents a seismic shift in how cities engage with property owners and what rights property owners have. For this reason, any approximation of this program in other cities may be met with strong opposition.
with owners who are unwilling to improve their property.
Transfer of Development Rights
The Transfer of Development Rights program in Seattle (WA) applies a longstanding approach to environmental conservation to affordable housing preservation. By selling their development rights, owners of affordable housing ensure that their properties cannot be redeveloped and replaced with market rate or luxury housing. This is the primary benefit of this program. Through entirely legal mechanisms, subsequent owners of this property are not allowed to further develop on that property, allowing the property to remain at affordable levels in the long term. 21 There are two additional benefits for this program. First, by selling their development rights, property owners can receive an injection of cash which they can use to renovate their property. Second, the program does not eliminate development completely; rather, it shifts market rate and luxury development to other areas of the city by allowing denser development or taller buildings. Thus, development is not halted. It is simply relocated.
The downside to this approach, however, is that the effectiveness of the program is determined by the local zoning code. The zoning regulations in the receiving district (the site that purchases the development rights) must be amenable to denser and taller developments. Thus, this type of program may need to be passed in conjunction with amendments to the zoning code, which may delay and complicate implementation.
CIC Energy Savers Program
The CIC Energy Savers Program offered by the Community Investment Corporation exemplifies some of the quality issues that NOAH properties face and how the city can support these owners. For most properties, utility expenses form a large and uncontrollable portion of their operating expenses. Improving mechanical systems, electrical and plumbing, can reduce operating expenses. 22 This type of work may also help bring out-of-compliance properties up to code.
The primary concern with this approach is that it requires intense coordination between multiple partners. To effectively implement the program, the leading organization must work alongside the city, local utility companies, and property owners. This coordination may slow down the process and limit the number of properties that can be rehabilitated.
This approach highlights how Detroit can target one of the largest concerns for property owners, increase the cash flow for the properties, and improve the tenant experience. In addition, there are many local partners that can be integrated into this program, including DTE.
Endnotes
1. U.S. Census Bureau, “Total Population in Occupied Housing Units by Tenure, 2021 5-Year Estimates.”
2. Joe Louis Greenway. (n.d.). City of Detroit.
3. Our Offerings. Detroit Housing for the Future Fund. (n.d.). https://dhff.org/ apply/#cna.
https://downtownmemphis.com/developinvest/incentives-programs/downtownproperty-pilot/
7. City of Pittsburgh n.d. Real Estate Tax Abatement Programs. https://apps. pittsburghpa.gov/finance/Real-EstateTax-Abatement-Programs.pdf
8. J-51 tax incentive – directory of NYC housing programs. (n.d.). NYU Furman Center. https://furmancenter.org/ coredata/directory/entry/j-51-taxincentive
9. PILOT Program Review. (n.d.). Downtown Memphis Commission. https:// downtownmemphis.com/wp-content/ uploads/2022/07/DMC-PILOT-ReviewFinal-Report.pdf
10. PILOT Program Review.
11. PILOT Program Review.
12. PILOT Program Review.
13. New Generation Fund. (n.d.). https:// www.newgenerationfund.com/
14. Housing Partnership Network. (n.d.). https://housingpartnership.net/hpet
15. State & City Funded Rental Housing Programs. (2016). National Low Income Housing Coalition. http://sf-moh.org/ index.aspx?page=758
16. Housing Trust Fund. (2018). City of Austin, Texas. www.austintexas.gov/department/ housing-trust-fund
17. State & City Funded Rental Housing Programs.
18. Housing Trust Fund.
19. Property Management Training. (n.d.). Community Investment Corporation. www.cicchicago.com/programs/ property-management-training/
20. Troubled Buildings Initiative. (n.d.). Community Investment Corporation. www.cicchicago.com/programs/ troubled-buildings-initiative/
Thus, despite the political volatility of this type of approach, the Troubled Buildings Initiative offers a baseline model of how to manage continually troublesome properties
Despite this added complexity, the Transfer of Development Rights models how a city like Detroit can protect NOAH properties but continue to support development in growing parts of the city.
4. Detroit Preservation Action Plan. (2018). Detroit: City of Detroit.
5. Detroit Preservation Action Plan
6. PILOT (Payment-in-lieu-of-taxes). (2023, January 30). Downtown Memphis.
21. Housing Innovations Program. (2020). Puget Sound Regional Council. 2020. www.psrc.org/media/2063
22. Innovative Financing. (n.d.). Community Investment Corporation. www.cicchicago. com/prloans/#energy
54 | Preserving Small Multi-Family NOAH Properties FINDINGS + ANALYSIS | 55
Limitations
04
Before we propose our recommendations, we would like to note some limitations of this project.
Timeline
Our project timeline was subject to the University of Michigan’s sixteen-week semester. Our preliminary research, action research, engagement, report writing, and final presentation all occurred within those sixteen weeks. This led to a community engagement period of less than two months. During this time, we scheduled and conducted interviews and attended community events. A longer time frame may have afforded us opportunities for greater community outreach, richer discussion with community-led organizations and local nonprofits, and perhaps even resident outreach.
Data Sources and Reliability
The City of Detroit’s Open Data Portal is an excellent resource for initial property identification when researching NOAH properties. However, due to sometimes outdated and unreliable data, it is necessary to refine some of the records using private data sources such as Multiple Listing Services (MLS) in order to provide the most accurate and up-to-date information. In this research, MLS was used to accurately capture listed rental costs and correct errors in the unit numbers found in open-source data. However, even MLS data has its limitations. Gathering robust and accurate rent data from the same year created challenges for analysis.
Constraints of Research Capacity
Site-specific property research is necessary to corroborate open data source records. This process requires researchers to compare, contrast, and correct records based on the most up-to-date and accurate
information. For NOAH research purposes, this process required the use of private databases that public entities may not have access to.
Difficulty in Landlord Identification and Outreach
There is a clear data mismatch between the open source data such as the assessor’s data, and the data obtained by the Wayne County Treasurer through the Register of Deeds (ROD). Given that there is not an automated process that updates property ownership information between the ROD and the assessor’s data, identifying the correct owner for a given property requires additional research.
With limited funding and/or time, researchers can search property owner names in the ROD to obtain accurate information about who presently owns a property. However, for property owners who own multiple properties across the City, it can be difficult to obtain the necessary documents for the specific property in question. With proper funding and/or time, researchers can search by address and are typically able to access all of the necessary documentation to identify the present-day property owner.
Although contact attempts were made to all properties with available contact information, the accuracy of these contacts was low. On the occasions where our team was able to speak with someone, the contact person was only associated with the property 30% of the time. Many voicemail messages were not returned and no emails were returned. Only on one or two occasions did we connect with someone who represented the specific target NOAH property. On both occasions, the contact person identified another member of the management team as the
best person to answer our questions or engage in an interview. On both occasions, the management team member identified for a potential interview never engaged with us. Our team planned to visit on-site leasing or management offices during the ground truthing windshield survey, but none of the forty-five target properties hosted such an on-site office.
58 | Preserving Small Multi-Family NOAH Properties LIMITATIONS | 59
Recommendations

05
Given our property research findings, major actions to preserve housing affordability along the Joe Louis Greenway need to be enacted quickly. There is clear evidence for increased sales and rising sale prices in Oakman, even though rents still appear to be affordable in the neighborhood. Because rising sales prices have to be justified by higher future rent, this counters the widelyheld perception that the neighborhood does not face an immediate threat to affordability. The Joe Louis Greenway project needs to have a concrete plan for preserving affordability in the neighborhoods along the Greenway.
Broad strategies might seek to leverage the rising property values that the Greenway is expected to generate and capture the increased accompanying property tax revenue to create a fund for preserving affordability. A TIF district may accomplish this. Furthermore, a policy that does not uncap the taxable value during a property sale in exchange for maintaining affordable rental rates may also work. Regardless of the revenue capture and resource diversion strategies utilized, ensuring that properties along the Joe Louis Greenway are targeted to preserve affordability will help to limit any negative effects that the Greenway has on the communities.
Our immediate recommended strategies are detailed below, adapting general categories as initially identified from the 2018 Detroit Preservation Action Plan.
Build a NOAH property database and monitor market dynamics of NOAH properties in neighborhoods of concern.
Coordinated monitoring and analysis of market activity of NOAH properties in Oakman will shed additional light onto the market conditions and pressures that are influencing affordability. To streamline data collection and analysis, data sharing across different City departments and agencies will help illustrate the clearest picture of the NOAH market. As our work has shown, developing a small multi-family NOAH database within the neighborhood was critical to conducting deeper analysis of landlords, properties, and market trends. This database contains the most relevant information to analyze the current status and potential future risks of NOAH properties. We also described the process we developed to identify NOAH properties in Appendix C, which could be replicated in other neighborhoods. We recommend continuing efforts to examine the NOAH ecosystem in other areas in Detroit beyond Oakman to see how general market conditions, submarket conditions, and the JLG itself are each contributing to changes in sales price and rents. More specifically, we recommend targeting data collection and monitoring toward selected neighborhoods that are perceived to be at higher risk of rising property values and NOAH conversion into market rate or
where conversion of NOAH properties is expected to have the most harmful effects. We recommend tracking sales data more frequently to facilitate more immediate and effective responses. Using the property research typologies illustrated in our Methodology section, the market dynamics of NOAH properties can be monitored and analyzed, different barriers for each typology can be understood, and at-risk properties can be identified. These insights can help direct the aforementioned landlord outreach – as well as tenant outreach – to identify these at-risk properties. It will also assist in identifying potentially concerning trends in affordability and availability of housing.
Conduct landlord outreach for atrisk NOAH properties.
It is difficult to fully understand what is preventing landlords from receiving certificates of compliance, or what their interest in various benefits or incentives would be, without engaging in direct outreach. A major gap in our research was the challenge of connecting with NOAH property owners and managers in Oakman. Our limited capacity and timeline dictated that we were unable to pursue contact beyond phone calls and emails, as none of the forty-five properties had apparent leasing/management offices when we visited in person. We recommend an open house, informational flyers, a banner link on the City website, and other outreach actions ought to be pursued to connect with NOAH landlords.
2. Address issues causing the low Certificate of Compliance rate. Prioritize resident safety.
The standard for achieving a Certificate of Compliance for old buildings (like the 45 properties in this study) typically
poses costs that the property owners cannot afford. As a result, meeting these standards is often neglected. As mentioned in the Findings section, of the 45 target properties analyzed, only 4 hold Certificates of Compliance from the City. This low compliance rate points to issues with building safety and livability. It is worth noting that days before this report was completed, one of the researched properties, 13505 La Salle Boulevard, was destroyed by a fire that sent at least eleven residents to the hospital.1 This property did not hold a Certificate of Compliance despite being rental-registered. Although we cannot assume that the lack of Certificate of Compliance contributed to the violent nature of the fire, the health and safety impacts of a property not qualifying for a Certificate of Compliance can be severe. Affordability is certainly a priority, but resident safety should also be of the utmost importance. We recommend improving code enforcement programs so that they function to assist property owners to achieve compliance rather than penalize and disincentivize them from further interaction with the City.
Expand the Landlord Repair Program
The Landlord Home Repair Program (LRP), slated to be implemented by the City in late 2024, will offer ARPA funds to assist small landlords with limited resources to provide the necessary improvements to obtain a Certificate of Compliance. As currently described, the funds are meant to be dedicated to improving property conditions prior to occupancy. The funds will also be exclusively available to Landlords who own no more than two properties. The properties can only be 1-2 family properties, duplex properties with the landlord as a principal resident, or second floor units above commercial development. We recommend amending the program to allow for currently-
62 | Preserving Small Multi-Family NOAH Properties RECOMMENDATIONS | 63
1. Create and maintain a Preservation Database for NOAH properties in selected neighborhoods of concern to monitor market activities and adjust priorities accordingly.
rented NOAH properties to access these funds, as well as multi-family properties beyond two units.
Further Support Lead Abatement
According to our interviews, one of the reasons for the low Certificate of Compliance rate is the high penalty fee associated with failing the lead inspection. The average built year of the 45 target properties is 1934, and the newest building was built in 1956. Since lead-based paint was only legally banned in 1978, all of these properties require(d) substantial renovation action in order to pass the lead inspection. Reducing the penalty for failed lead inspections while assisting with mitigation actions may incentivize more property owners to formally register their rentals as well as earn the Certificate of Compliance.
Earmark a portion of the Detroit Housing for the Future Fund (DHFF) for preservation and rehabilitation loans for smallscale NOAH.
Due to high demand for DHFF loans and limited availability of funding, the most experienced housing developers are the most likely to receive funding. NOAH property owners are eligible for the same loan products for refinancing and rehabilitation as more experienced developers, and are expected to be partnered with a developing consultant. Ideally, there would be ample funding for all projects in need. However, because there are fewer funding opportunities for NOAH landlords than for other types of affordable
housing, it would be beneficial to do more targeted outreach and partnership with such property owners to ensure they have access to specialized loan products.
Assist loan recipient NOAH properties in applying for the local PILOT program, or other tax abatements, once enacted.
The age of these NOAH properties and the results of our windshield survey suggest that these properties are in poor physical condition, but the small cash flow available to NOAH property owners limits their ability to substantially invest in renovation. The loans provided by DHFF and other governmental entities can cover the associated up-front costs, but there is the possibility that the limited cash flow may not be sufficient to cover monthly or annual debt repayments, even if the loan is low-interest. Thus, to safeguard the DHFF investment and ensure that NOAH owners do not default on their loan, recipients of these loans should be assisted by LISC Detroit, HRD, or a third-party entity in applying for the local PILOT program, or another local or state tax abatement, once that program is enacted. These programs would lower the NOAH property owners operating expenses, freeing up more cash flow for debt repayment.
Partner with local organizations to provide building electrification services for NOAH properties.
One of the most common physical issues with NOAH properties are the outdated mechanical systems. Old or disfunctional electrical systems are both a public safety hazard and a cause of unnecessarily high utility expenses. A local coalition of governmental representatives from HRD and/or BSEED, DTE, local organizations, and contractors with experience in electrification can be created to leverage
local knowledge and experience to improve the physical quality and safety of NOAH properties while preserving long-term affordability.
The CIC Energy Savers Program in Chicago (IL) can be an excellent model of how to effectively approach building electrification for these properties, and Detroit has the institutions and the existing frameworks to implement a similar program. CIC is actively engaged as a member of the Preservation Partnership, so their work and expertise can guide Detroit in developing a localized approach. In addition, DTE has similar programs where they provide new appliances for low-income households, so there is already a demonstration of a willingness to work with local partners to provide services for low-income households. Thus, Detroit has the need for and the existing frameworks to support the adoption of a building electrification program.
4. Address the operation and management needs to make NOAH properties a sustainable financial model. Make adjustments to the inprogress PILOT program.
The city’s in-progress PILOT program would provide a large subsidy to property owners by reducing property tax payments, which would help NOAH owners ensure the long-term financial stability of their property. There are still, however, additional components that can be adopted into the policy to better support NOAH owners.
One concern of PILOTs is the transition out of the program. Suddenly moving back to paying property taxes from having years of a subsidy can place financial stress on NOAH properties. However, the current intention is
that the Detroit PILOT program would not have an end date for recipients, making this point potentially moot. On the other hand, if the City does decide to set a limit on how long NOAH properties can be part of the program, it may be beneficial to implement a step-down. A step-down would decrease the amount of the subsidy that these properties receive in the final years of the program, which would ease NOAH owners into financial independence rather than cutting them off from one year to the next.
The City must also consider what degree of institutional support it can provide for properties applying to the PILOT program. Governmental funding can often be complex and difficult to navigate, especially for NOAH owners who have limited experience. Ensuring the clarity of the application process (timeline, requirements, etc.), reapplication, compliance checks, and enforcement would ensure that the program is delivered effectively to recipients and that it is accessible to all eligible property owners. The city may consider offering programs such as hosting management training workshops or providing pre-made pro-formas to help property owners apply for resources and programs.
Clarity and transparency encompass not only how program information is provided to recipients, but also how program information is provided to the public. Since the PILOT program diverts property tax revenues from public services back to the property owners, residents have a right to understand how that money is being used and how well the program is functioning. Proper transparency with the public requires regular and accurate data collection from property owners and consistent reporting of outcomes. Thus, the city should release annual reports on the usage, functioning, and outcomes of the program.
64 | Preserving Small Multi-Family NOAH Properties RECOMMENDATIONS | 65
3. Address the financial needs of NOAH properties with regards to physical quality and rehabilitation.
Package the PILOT program with rehabilitation funding.
As mentioned previously, the PILOT program and public funding for rehabilitation should be packaged to help NOAH owners cover their debt repayments. One potential avenue for coordination between LISC Detroit and the Housing and Revitalization Department (HRD) can be through targeted outreach to NOAH owners who receive funding through the DHFF. LISC Detroit and HRD could have regular communication and data sharing regarding both recipients of and applicants to DHFF funding, and HRD can lead targeted outreach to those owners to direct them toward the PILOT program.
Another benefit of packaging DHFF loans and the PILOT program is longterm affordability. Currently, affordability requirements for DHFF loan recipients expire at the end of the loan. With the current intention of not placing a time limit on eligibility for the PILOT, HRD can use the PILOT to retain affordability requirements beyond the life of the loan, preserving longterm affordability.
5. Provide institutional support to help NOAH property owners improve management practices. Create a single landlord portal, where landlords can find information regarding rental registration and Certificate of Compliance, building codes and ordinances, and links to available resources.
The City of Detroit’s website currently has dedicated pages providing information to tenants, as well as to developers on what support they may get. However, there is no centralized source of information for landlords to receive information about regulations and procedures or available funding opportunities. In particular, there should be an explanation of the concept of NOAH and how to know if one is the owner of a NOAH property, so that landlords know that they’re eligible for special funding and assistance. A centralized portal where landlords could submit paperwork, be notified of changes in regulations, and learn about resources available to themselves and their tenants would be a valuable resource for improving the knowledge base of property owners.
Create a formalized network for NOAH property owners that can connect them with other property owners, experienced developers, contractors, and city representatives.
There appears to be a knowledge and resource gap between NOAH property owners and more experienced housing developers. A representative from Southwest Housing Solutions, which offers technical assistance to owners of affordable multi-family housing, explained that the additional effort that NOAH property owners need to make to ensure that tenants meet income requirements can discourage landlords from taking up incentives. This is especially a challenge for small landlords who already struggle to remain compliant with all rental regulations. There are a variety of ways to provide assistance to NOAH landlords. In addition to direct consultation or service from private and public organizations, there could be a way to partner NOAH landlords with willing
developers (of for-profit or non-profit housing) to assist with the various financial and administrative challenges of managing affordable units.
Endnotes
1. Mackay, H., & Ramirez, C. E. (2023, April 7). At least 11 injured in large apartment building fire on Detroit’s West Side. The Detroit News. Retrieved April 18, 2023, from https://www.detroitnews.com/story/news/local/detroit-city/2023/04/07/ firefighters-battle-blaze-at-apartment-building-on-detroits-westside/70091335007/
66 | Preserving Small Multi-Family NOAH Properties RECOMMENDATIONS | 67
CONCLUSION
Using housing and rental market data, demographic data, interviews with experts and local stakeholders, ground truthing data collection, and community engagement, this report aims to offer strategies for tackling the issue of preserving the affordability and physical quality of NOAH properties in Detroit’s Oakman Boulevard Community. Along with offering recommendations to Detroit’s Housing and Revitalization Department, we created a transferable data collection methodology so that other Detroit neighborhoods that stand to be impacted by the planned Joe Louis Greenway may be studied. Implementation of these recommended strategies can assist the owners and managers of small multi-family NOAH properties with property maintenance while maintaining affordability. We hope that this report contributes to the diverse set of strategies employed by the City of Detroit and countless community organizations.
REFERENCES
2021 ACS updates. (2022). Detroit Future City. 4d Affordable Housing Incentive. (n.d.) Minneapolis Community Planning & Economic Development. https://www2.minneapolismn. gov/government/programs-initiatives/ housing-development-assistance/rentalproperty/4d/
About Us. Atlanta Beltline. (n.d.). https:// beltline.org/about-us/
Areas around Atlanta See Rent Increases as High as 83% over Last Year. WSB-TV Channel 2 - Atlanta. June 3, 2022. https://www.wsbtv. com/news/local/atlanta/areas-aroundatlanta-see-rent-increases-high-83-over-lastyear/ATIMRW2BHBGDXII4VNELERDIOY/.
Black, C. (2020, January 30). “Green Gentrification” and Lessons of the 606. The Chicago Reporter. https://www. chicagoreporter.com/green-gentrificationand-lessons-of-the-606/.
Brey, J. (2021, May 4). The Atlanta Beltline Wants to Prevent Displacement of Longtime Residents. Is It Too Late? Next City. https:// nextcity.org/urbanist-news/the-atlantabeltline-wants-to-prevent-displacement-oflongtime-residents.
City of Detroit Open Data Portal. (n.d.) https:// data.detroitmi.gov/
City of Pittsburgh. (n.d.). Real Estate Tax Abatement Programs. https://apps. pittsburghpa.gov/finance/Real-Estate-TaxAbatement-Programs.pdf
Data Driven Detroit. (n.d.). www. datadrivendetroit.org
Detroit Housing for the Future Fund. (n.d.). Our Offerings. https://dhff.org/apply/#cna.
Detroit Preservation Action Plan. (2018). Detroit: City of Detroit.
Downtown Memphis Commission. (2020). PILOT Program Review. Prepared by PGAV Planners. https://downtownmemphis.com/ wp-content/uploads/2022/07/DMC-PILOTReview-Final-Report.pdf
Frequently Asked Questions. The 606. (2019, May 31). https://www.the606.org/resources/ frequently-asked-questions.
HOPE Village Revitalization. (n.d.). hopevillagecdc.org/about-us/#hvr-mission
Housing Innovations Program. (2020). Puget Sound Regional Council. 2020. www.psrc.org/ media/2063
Housing Partnership Network. (n.d.). https:// housingpartnership.net/hpet
Housing Trust Fund. (2018). City of Austin, Texas. www.austintexas.gov/department/ housing-trust-fund
Immergluck, D. (2022). Chapter 2: The Beltline as a Public-Private Gentrification Project. In Red hot city: Housing, race, and exclusion in twenty-first century Atlanta (pp. 59–94). essay, University of California Press.
Incentives and Special Properties (n.d) Cook County Assessor’s Office https://www. cookcountyassessor.com/incentives-specialproperties# class9
Innovative Financing. (n.d.). Community Investment Corporation. www.cicchicago. com/prloans/#energy
J-51 tax incentive – directory of NYC housing programs. (n.d.). NYU Furman Center. https://
APPENDIX | 69
68 | Preserving Small Multi-Family NOAH Properties
furmancenter.org/coredata/directory/entry/j51-tax-incentive

Joe Louis Greenway Framework Plan Vol. 1 The Vision. (2021). General Services Department, SmithGroup, Studio Incognita, Sidewalk Detroit, Toole Design, & HR&A Advisors. Detroit, MI; City of Detroit.
Joe Louis Greenway. (n.d.). City of Detroit. https://detroitmi.gov/departments/generalservices-department/joe-louis-greenway
Laurence, J. & Peña, M. (2021, January 28).
New Ordinance Makes It Harder to Turn Apartments into Single-Family Homes along 606 and in Pilsen. Block Club Chicago. https://blockclubchicago.org/2021/01/27/ new-ordinance-makes-it-harder-to-turnapartments-into-single-family-homes-along606-and-in-pilsen/.
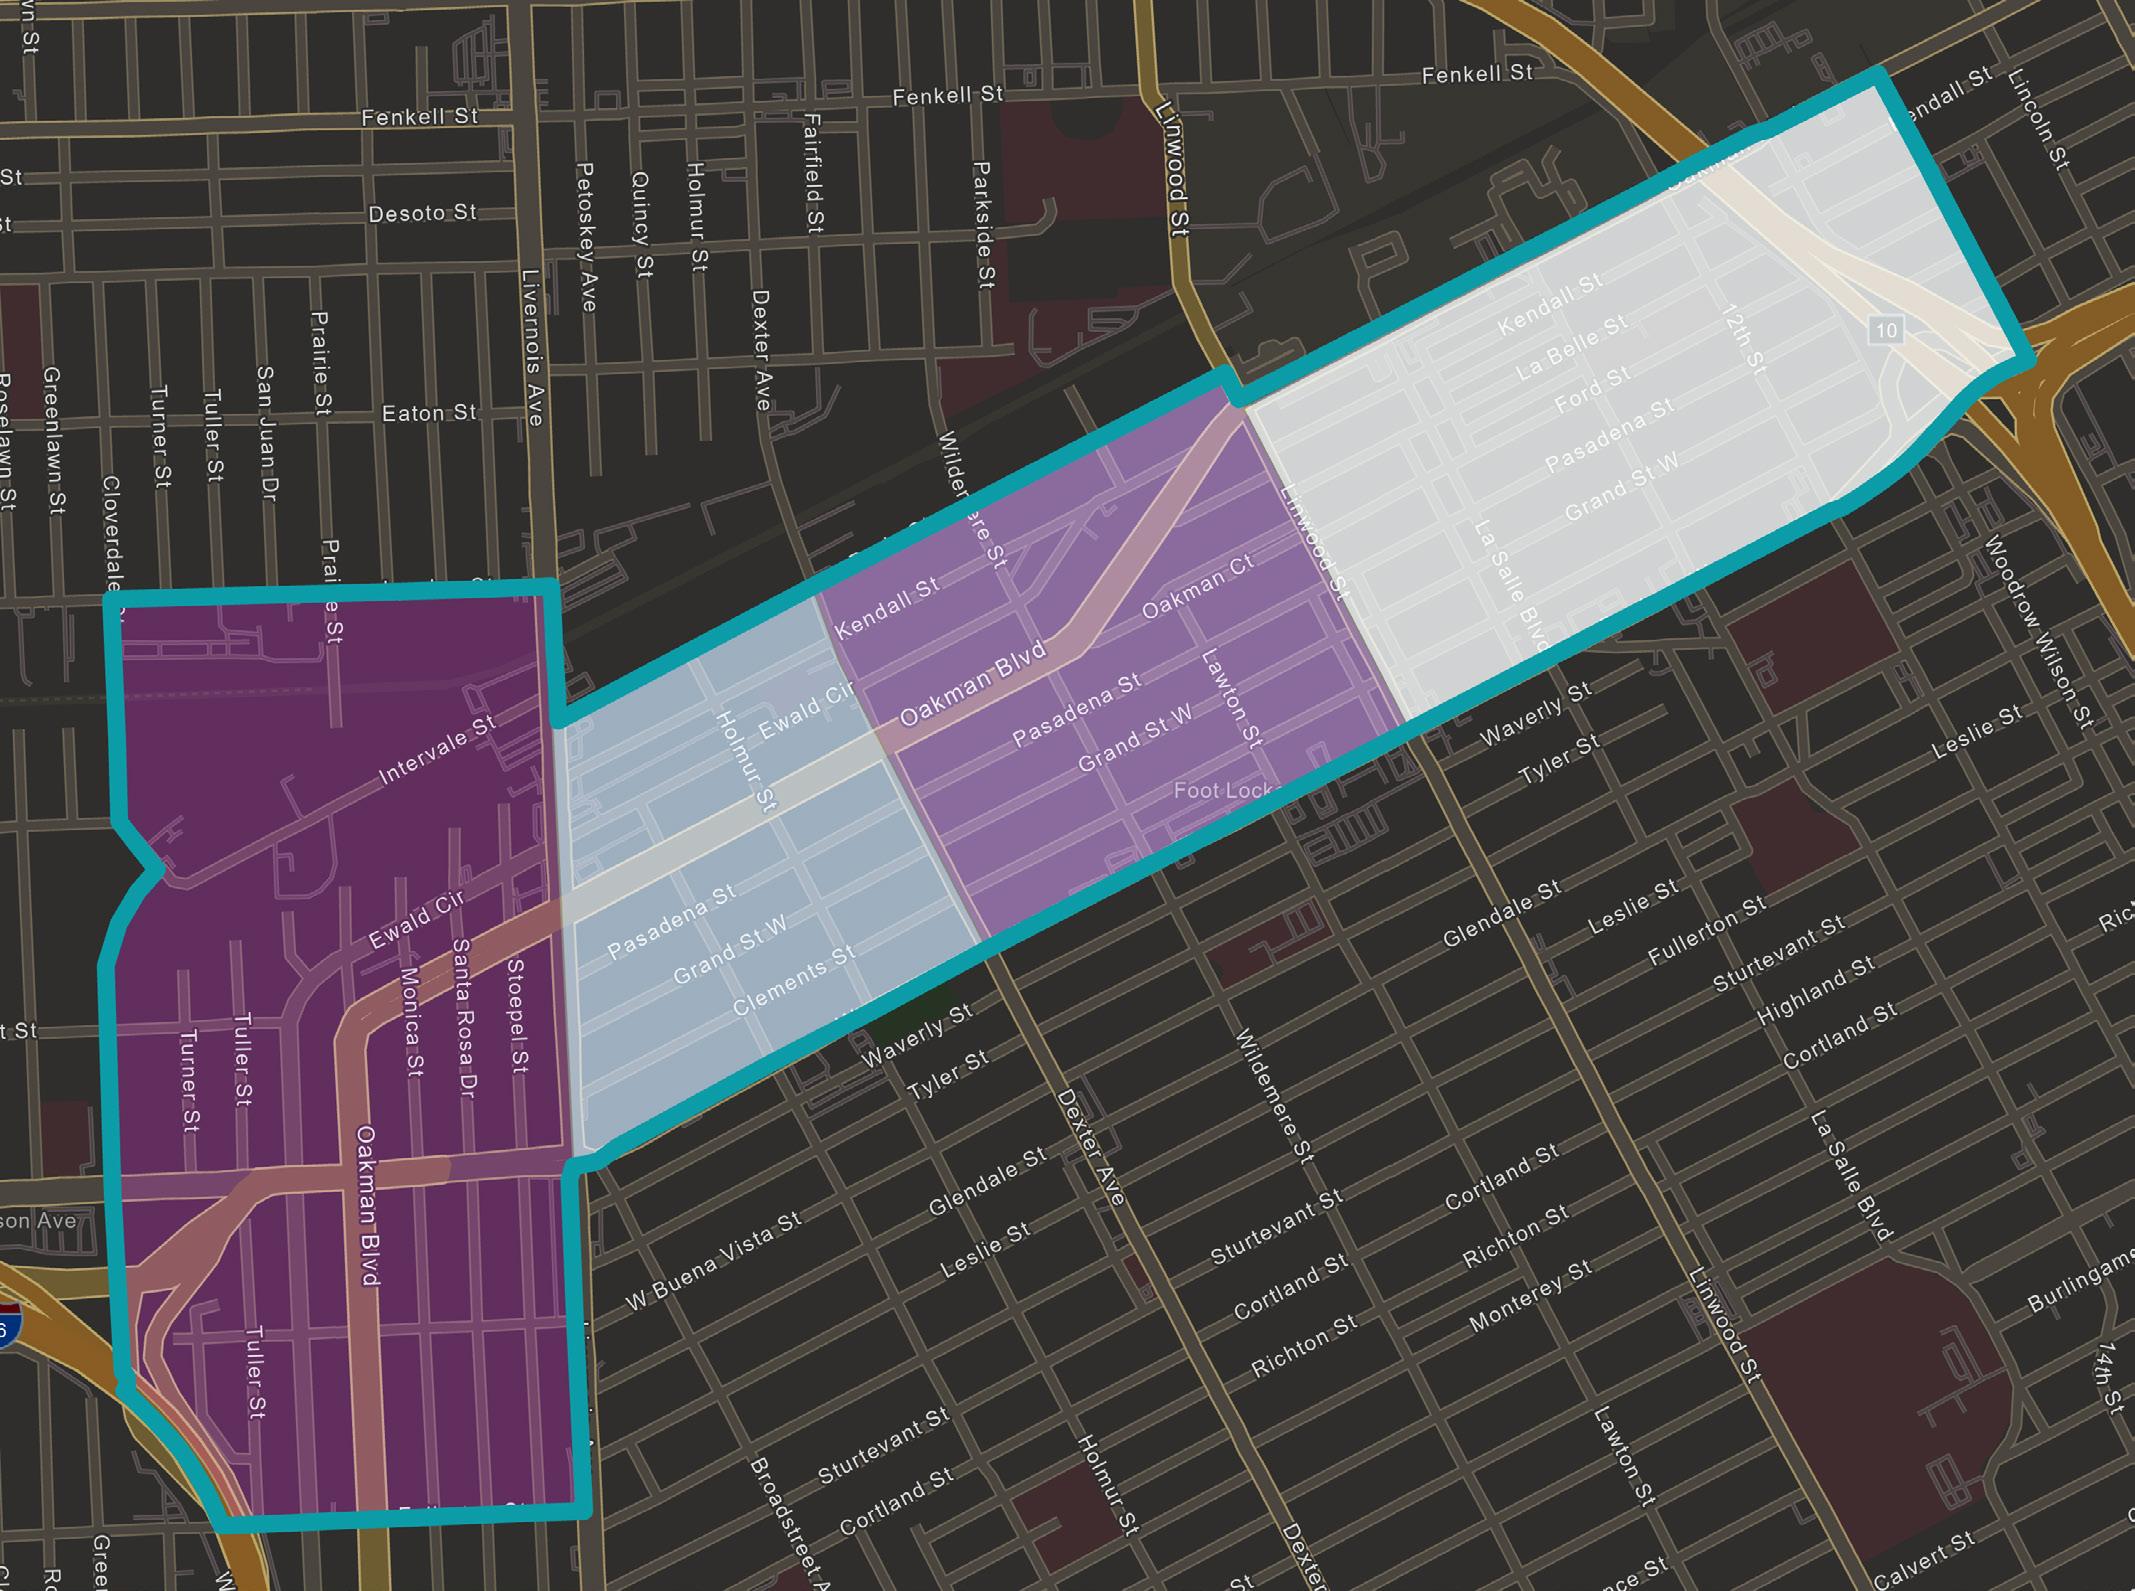
Lee, W. & Greene, M. (2019, June 21). Neighbors Have Embraced the 606 Even as Gentrification and Crime Create a Divided Playground. Chicago Tribune. https://www. chicagotribune.com/news/breaking/ct-606trail-neighborhoods-20190623-20190621ilxlcfqhjffkfgt6rx5k7fyn34-story.html.
Mackay, H., & Ramirez, C. E. (2023, April 7). At least 11 injured in large apartment building fire on Detroit’s West Side. The Detroit News. Retrieved April 18, 2023, from https://www. detroitnews.com/story/news/local/detroitcity/2023/04/07/firefighters-battle-blazeat-apartment-building-on-detroits-westside/70091335007/
downtownmemphis.com/develop-invest/ incentives-programs/downtown-propertypilot/
PILOT Program Review. (n.d.). Downtown Memphis Commission. https:// downtownmemphis.com/wp-content/ uploads/2022/07/DMC-PILOT-Review-FinalReport.pdf
Preserving Naturally Occurring Affordable Housing: NOAH Impact Fund. (n.d). Greater Minnesota Housing Fund. https:// noahimpactfund.com/wp-content/ uploads/2022/06/NOAH-Impact-FundBrochure.pdf
Property Management Training. (n.d.). Community Investment Corporation. www. cicchicago.com/programs/propertymanagement-training/
Rental Dwelling Inspections Requirements. (2018). City of Detroit Property Maintenance Division.
Risk Profile: Distressed NOAH Property Affordable Housing Preservation Strategies. (2021). Detroit Preservation Partnership.
Risk Profile: Distressed NOAH Property Affordable Housing Preservation Strategies. (2021). Detroit Preservation Partnership.
San Francisco Local Operating Subsidy Program. (2016). National Low Income Housing Coalition. https://reports.nlihc.org/ rental-programs/catalog/san-francisco-localoperating-subsidy-program
APPENDIX A: Oakman Boulevard
Maps
Population Maps
Figure A1: 2021 Population Distribution
Source: 2021 American Community Survey, US Census Bureau
New Generation Fund. (n.d.). https://www. newgenerationfund.com/
Oakman Blvd Community Association. (n.d.). from https://oakmanblvd.org/
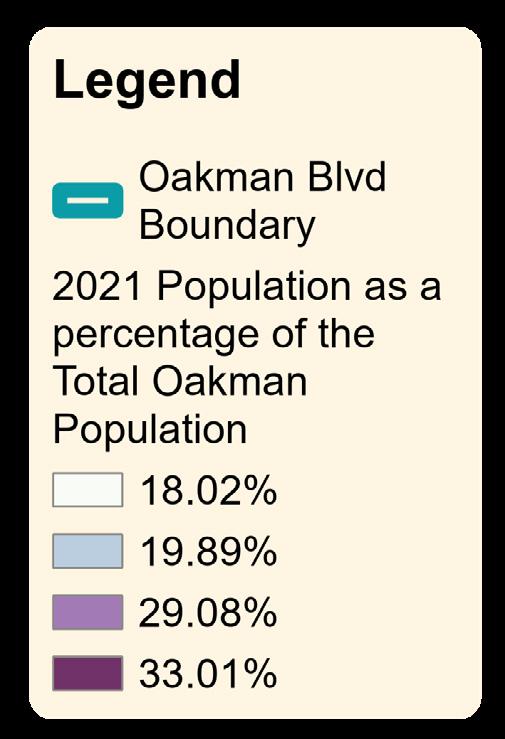
PILOT (Payment-in-lieu-of-taxes). (2023, January 30). Downtown Memphis. https://
S.B. 364, 2021 Reg. Sess. (Mich. 2021). http:// legislature.mi.gov/doc.aspx?2021-SB-0364
Troubled Buildings Initiative. (n.d.). Community Investment Corporation. https://www. cicchicago.com/programs/troubledbuildings-initiative/
70 | Preserving Small Multi-Family NOAH Properties APPENDIX | 71
Housing Maps
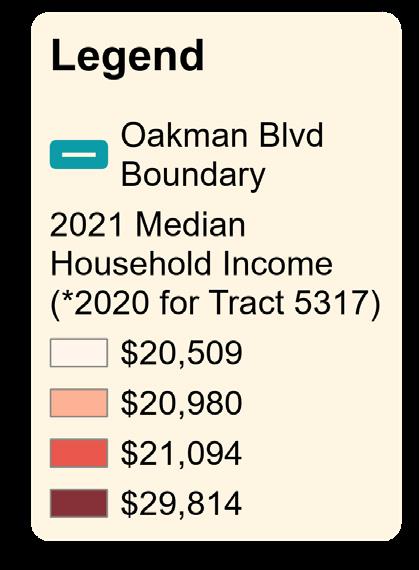
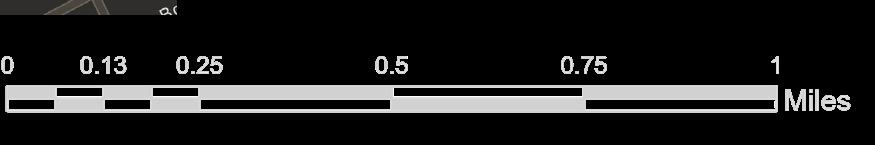
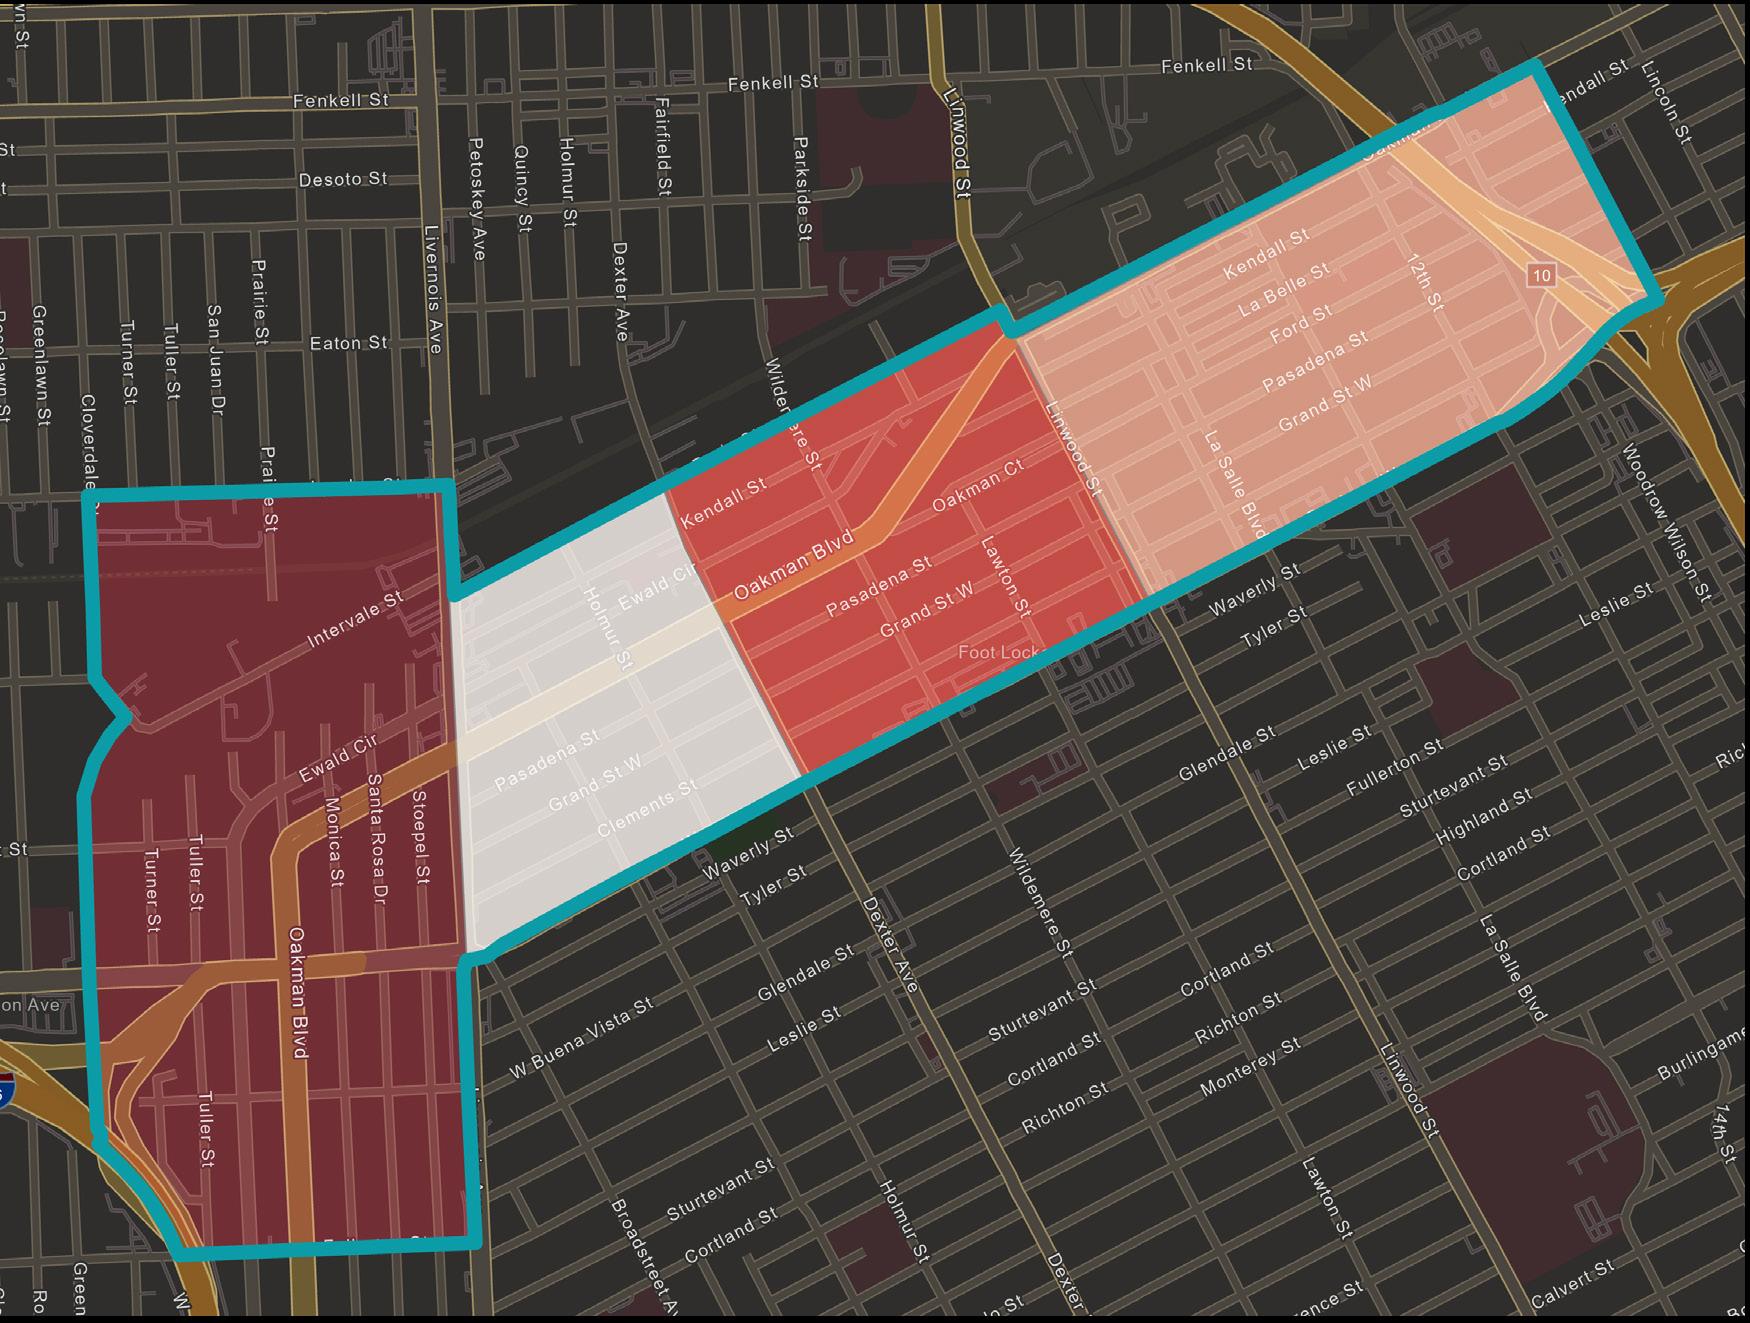
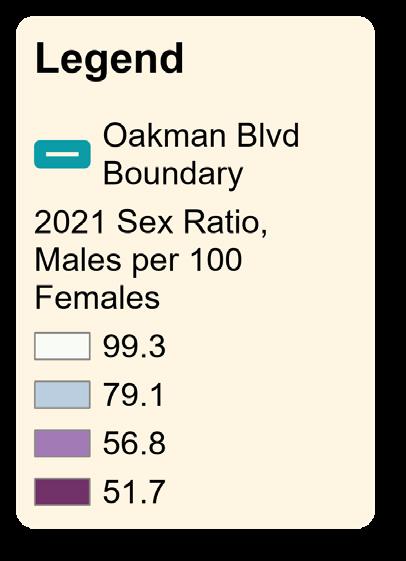

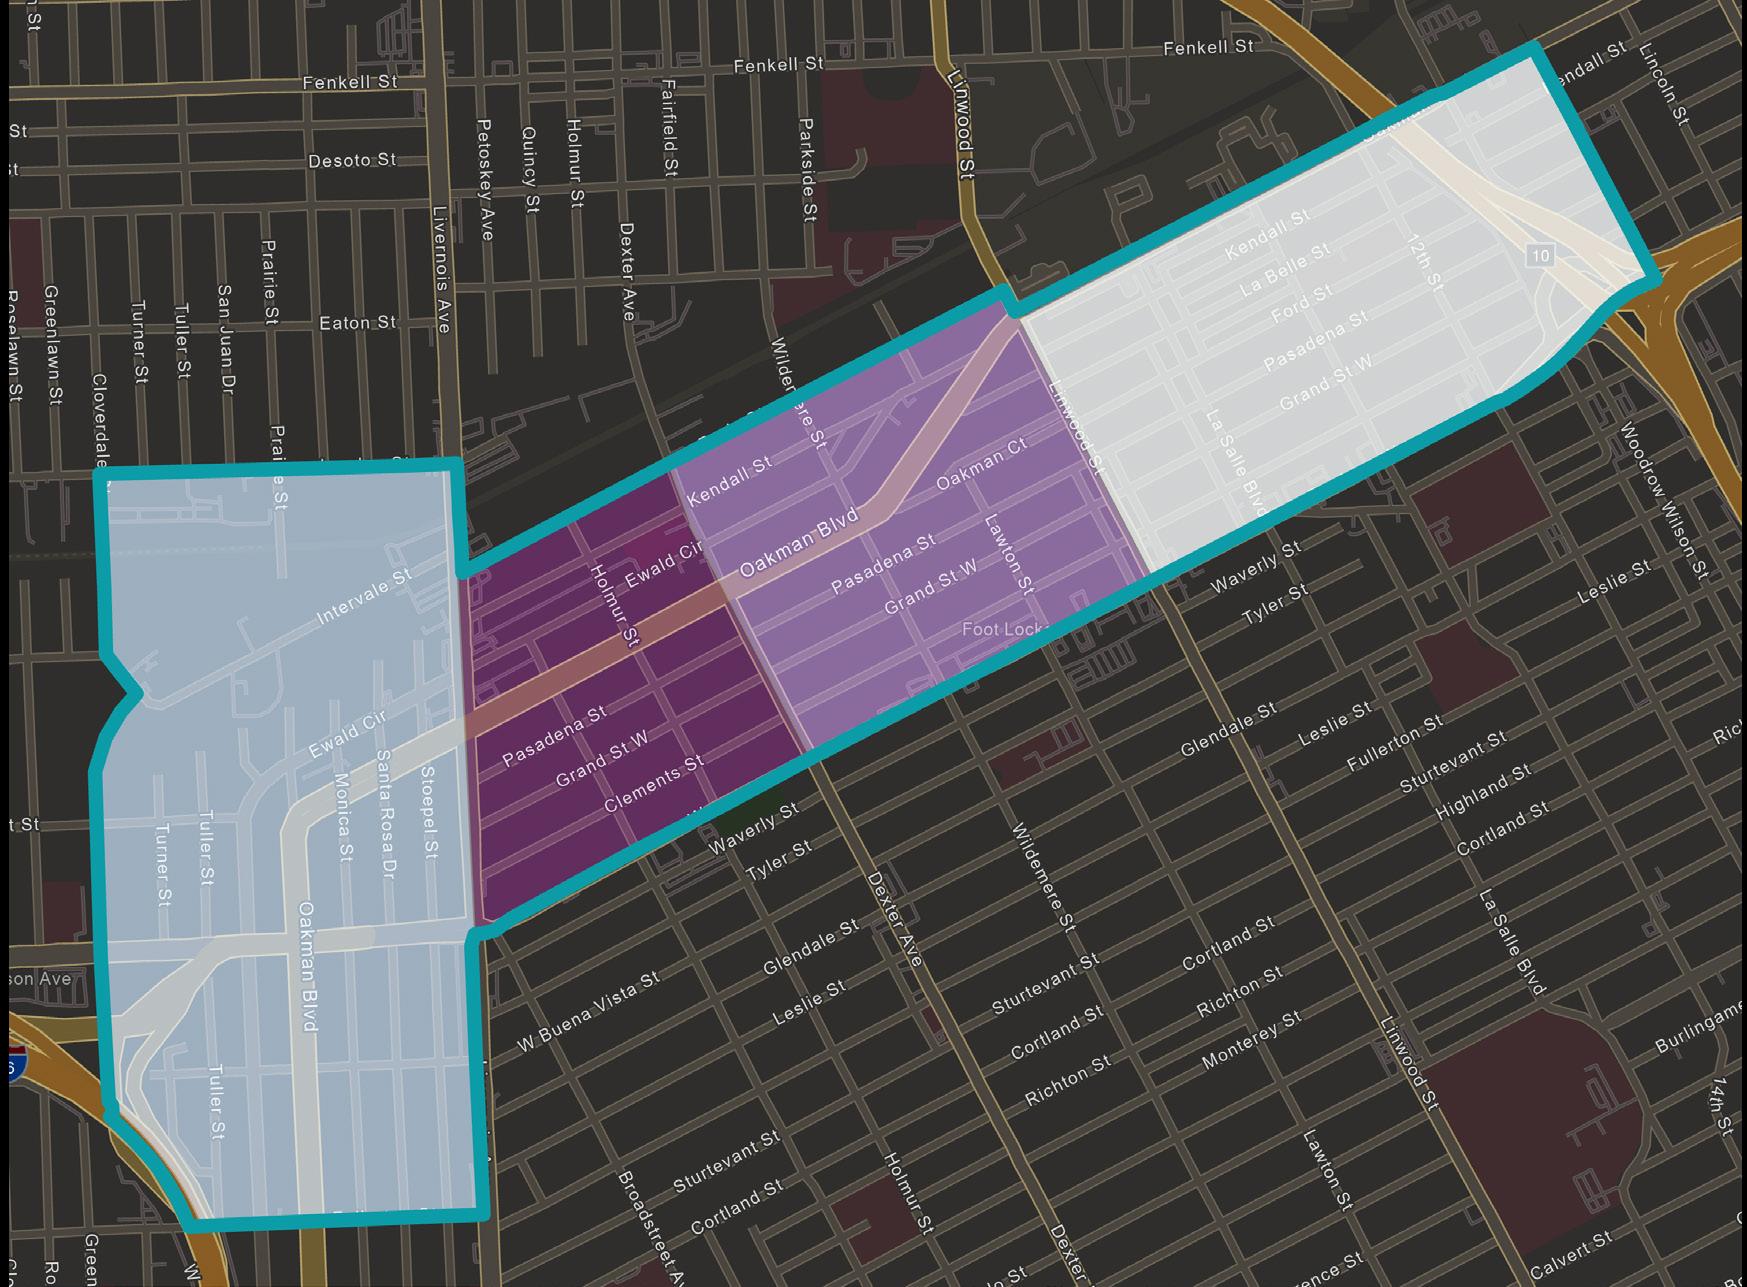
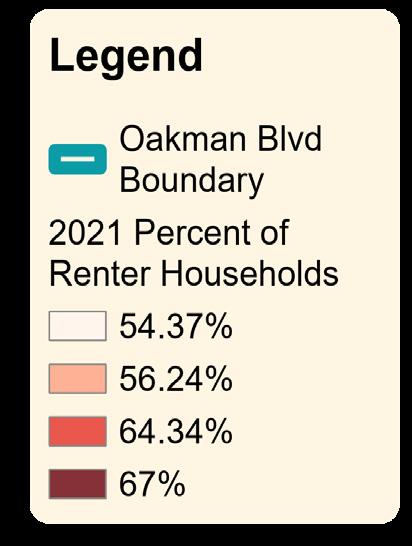
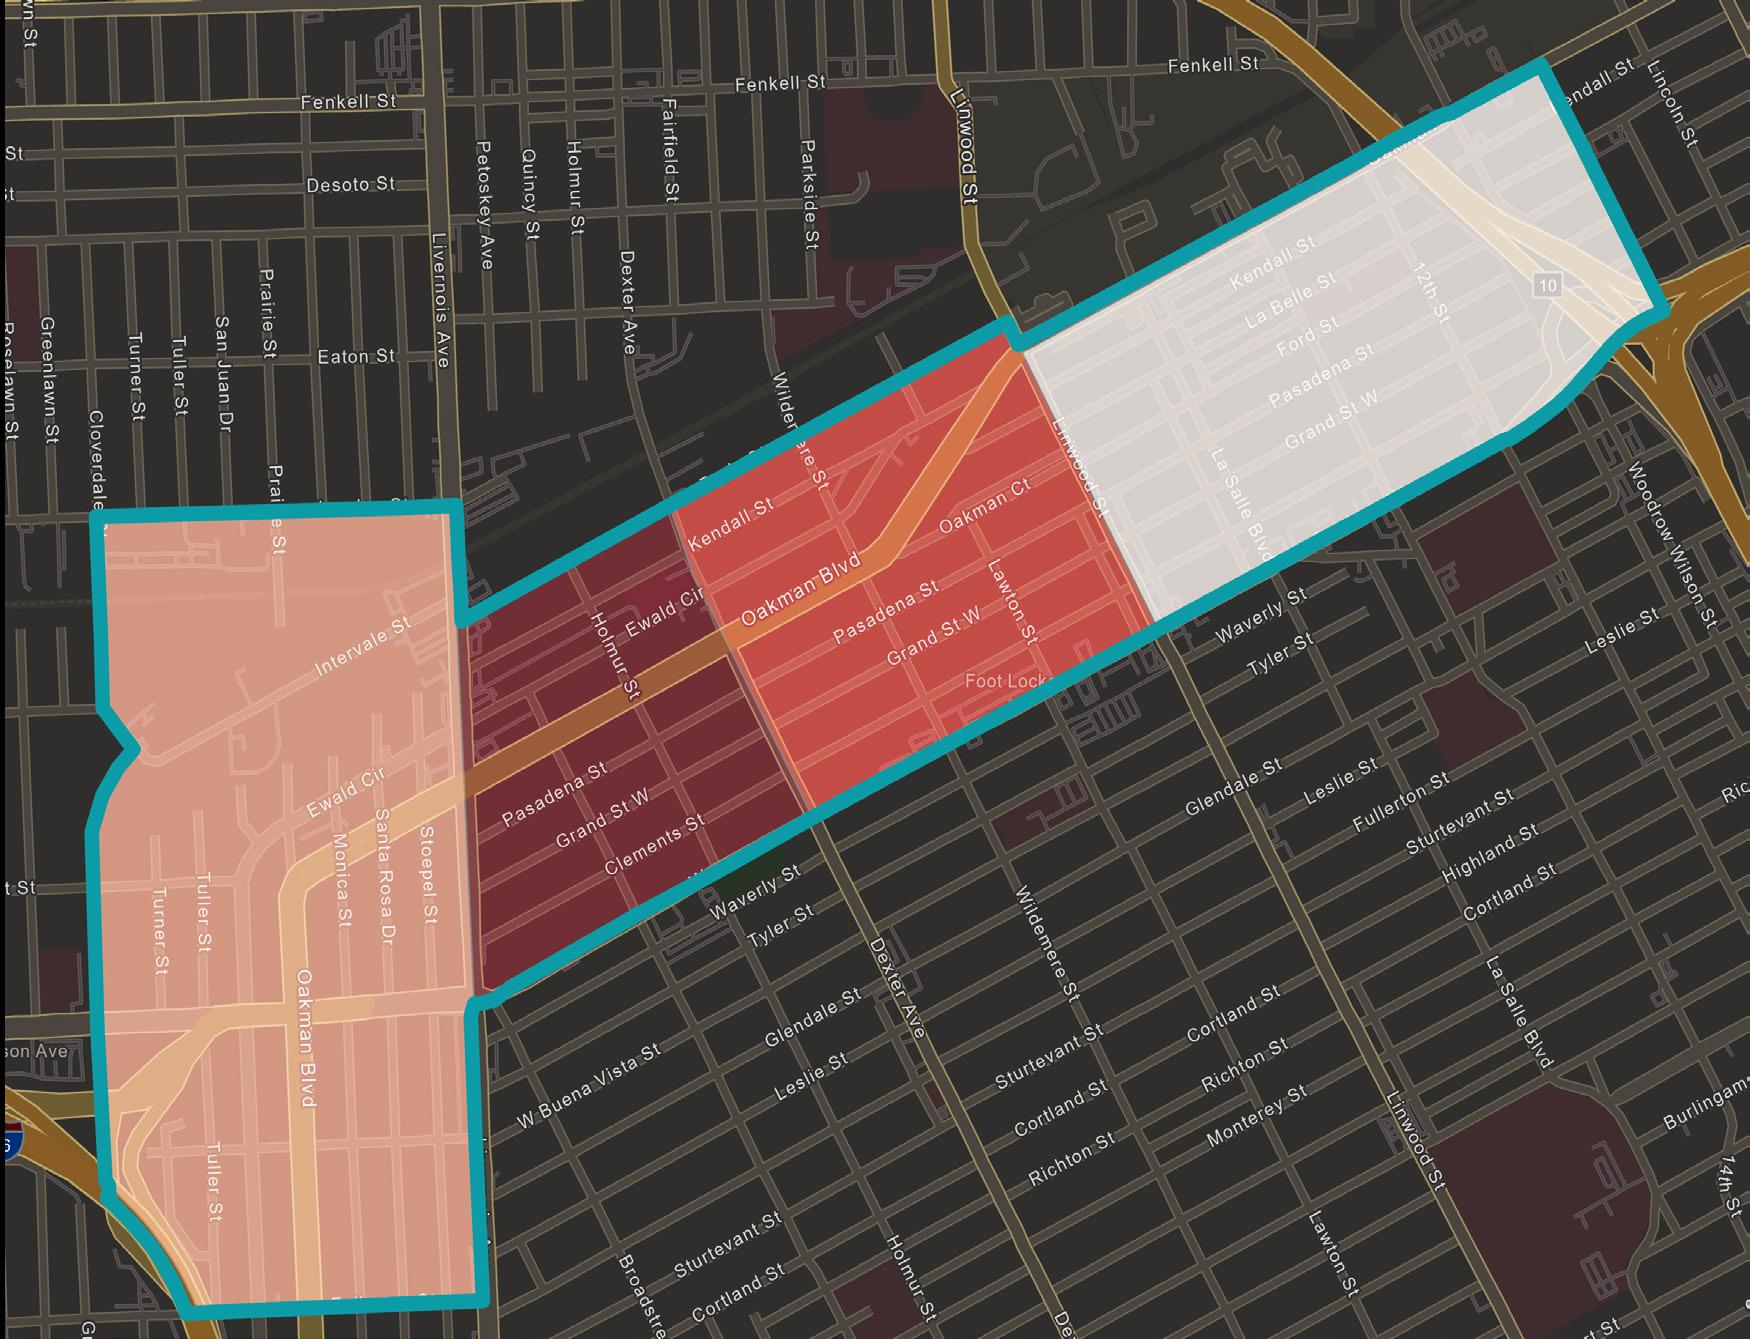
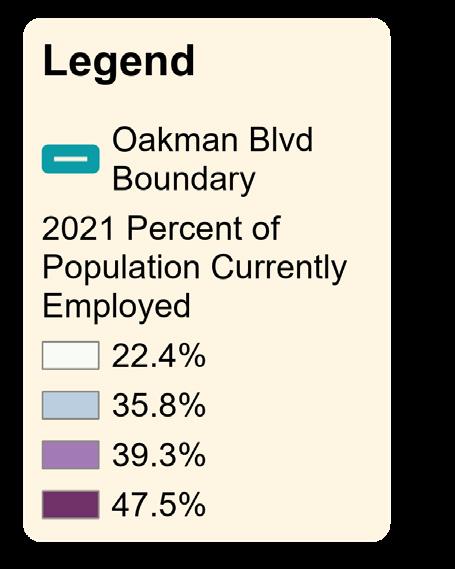
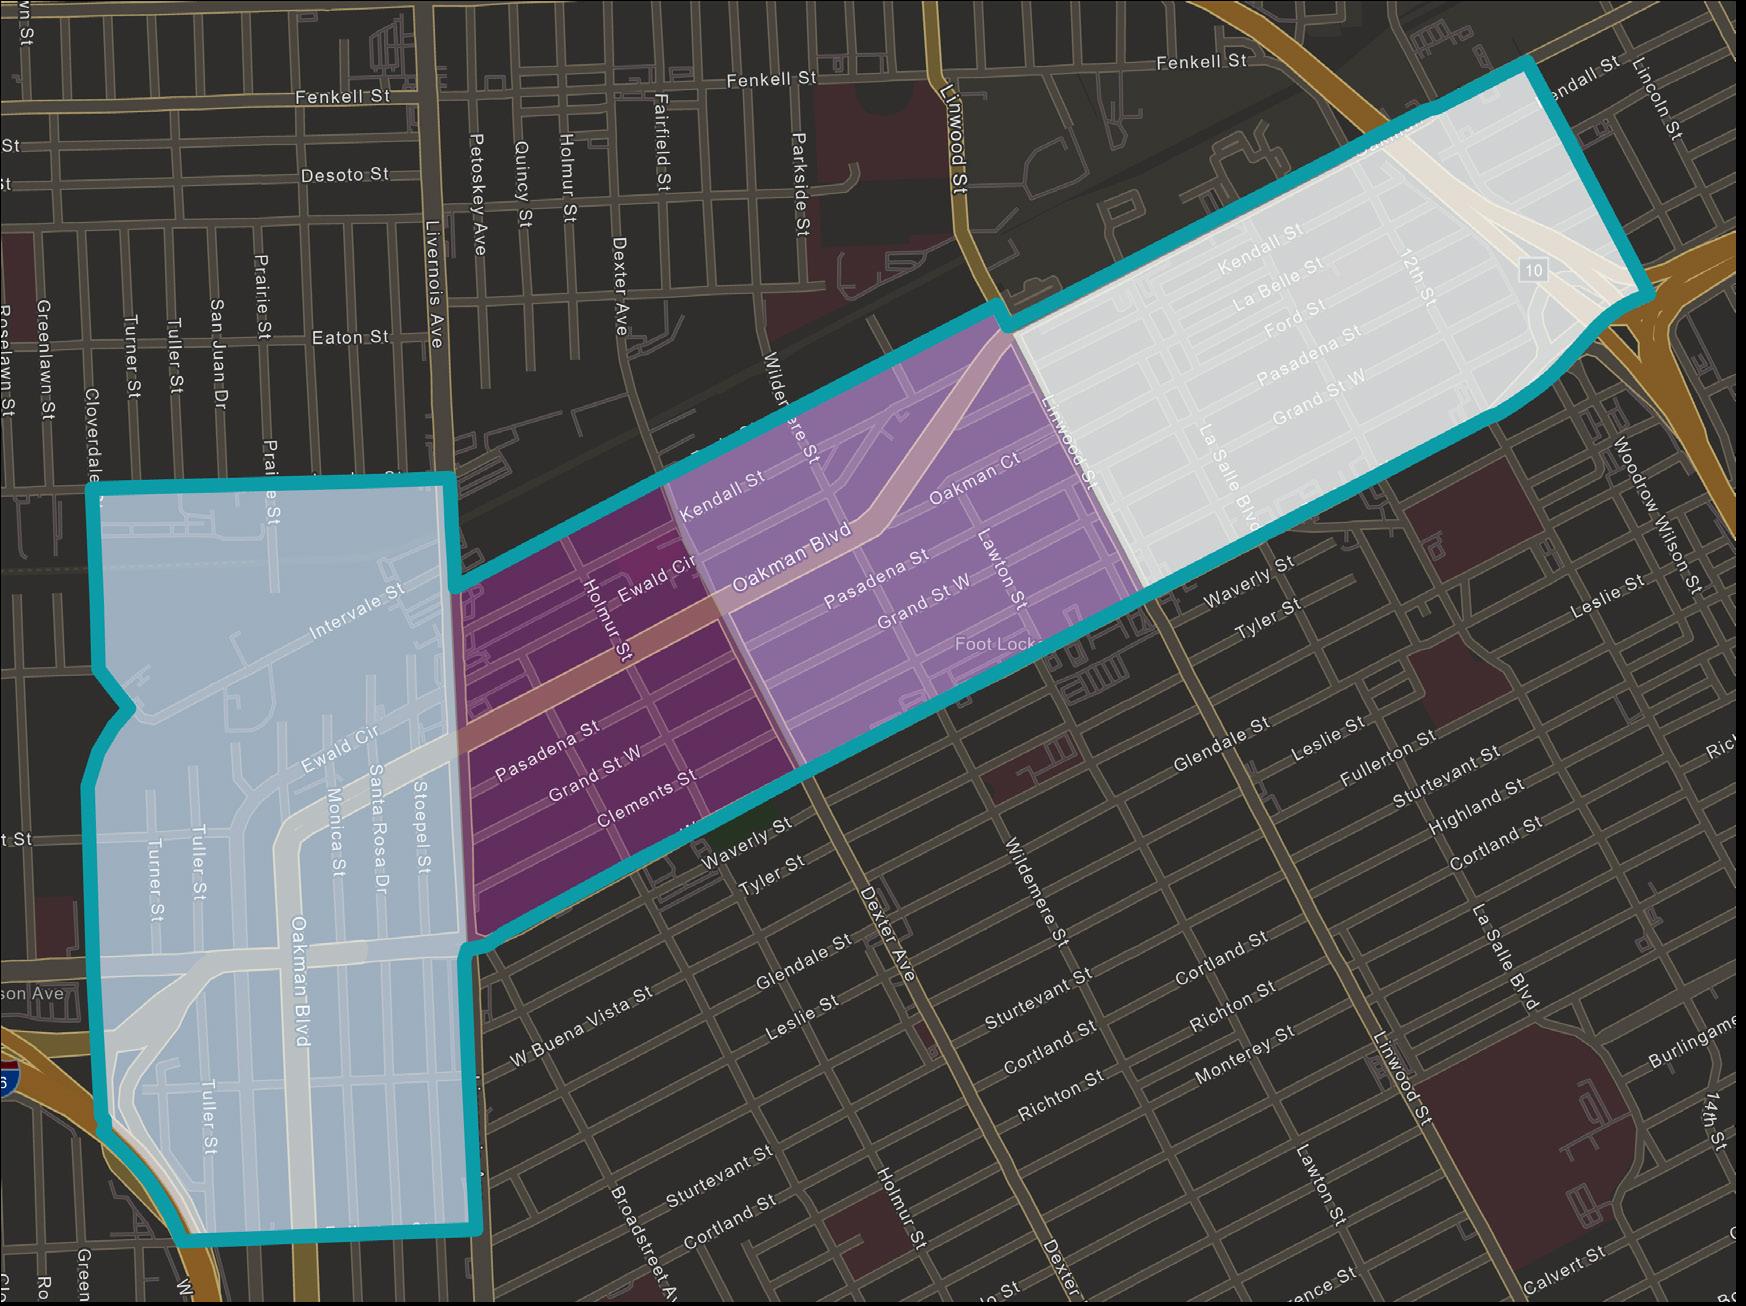
72 | Preserving Small Multi-Family NOAH Properties APPENDIX | 73
Source: 2021 American Community Survey, US Census Bureau
Figure A2: 2021 Employment Rate
Source: 2021 American Community Survey, US Census Bureau
Source: 2021 American Community Survey, US Census Bureau
Figure A5: 2021 Housing Tenure
Figure A3: Sex Ratio
Source: 2021 American Community Survey, US Census Bureau
Figure A4: 2021 Median Household Income
Source: MLS Multiple Listing Service
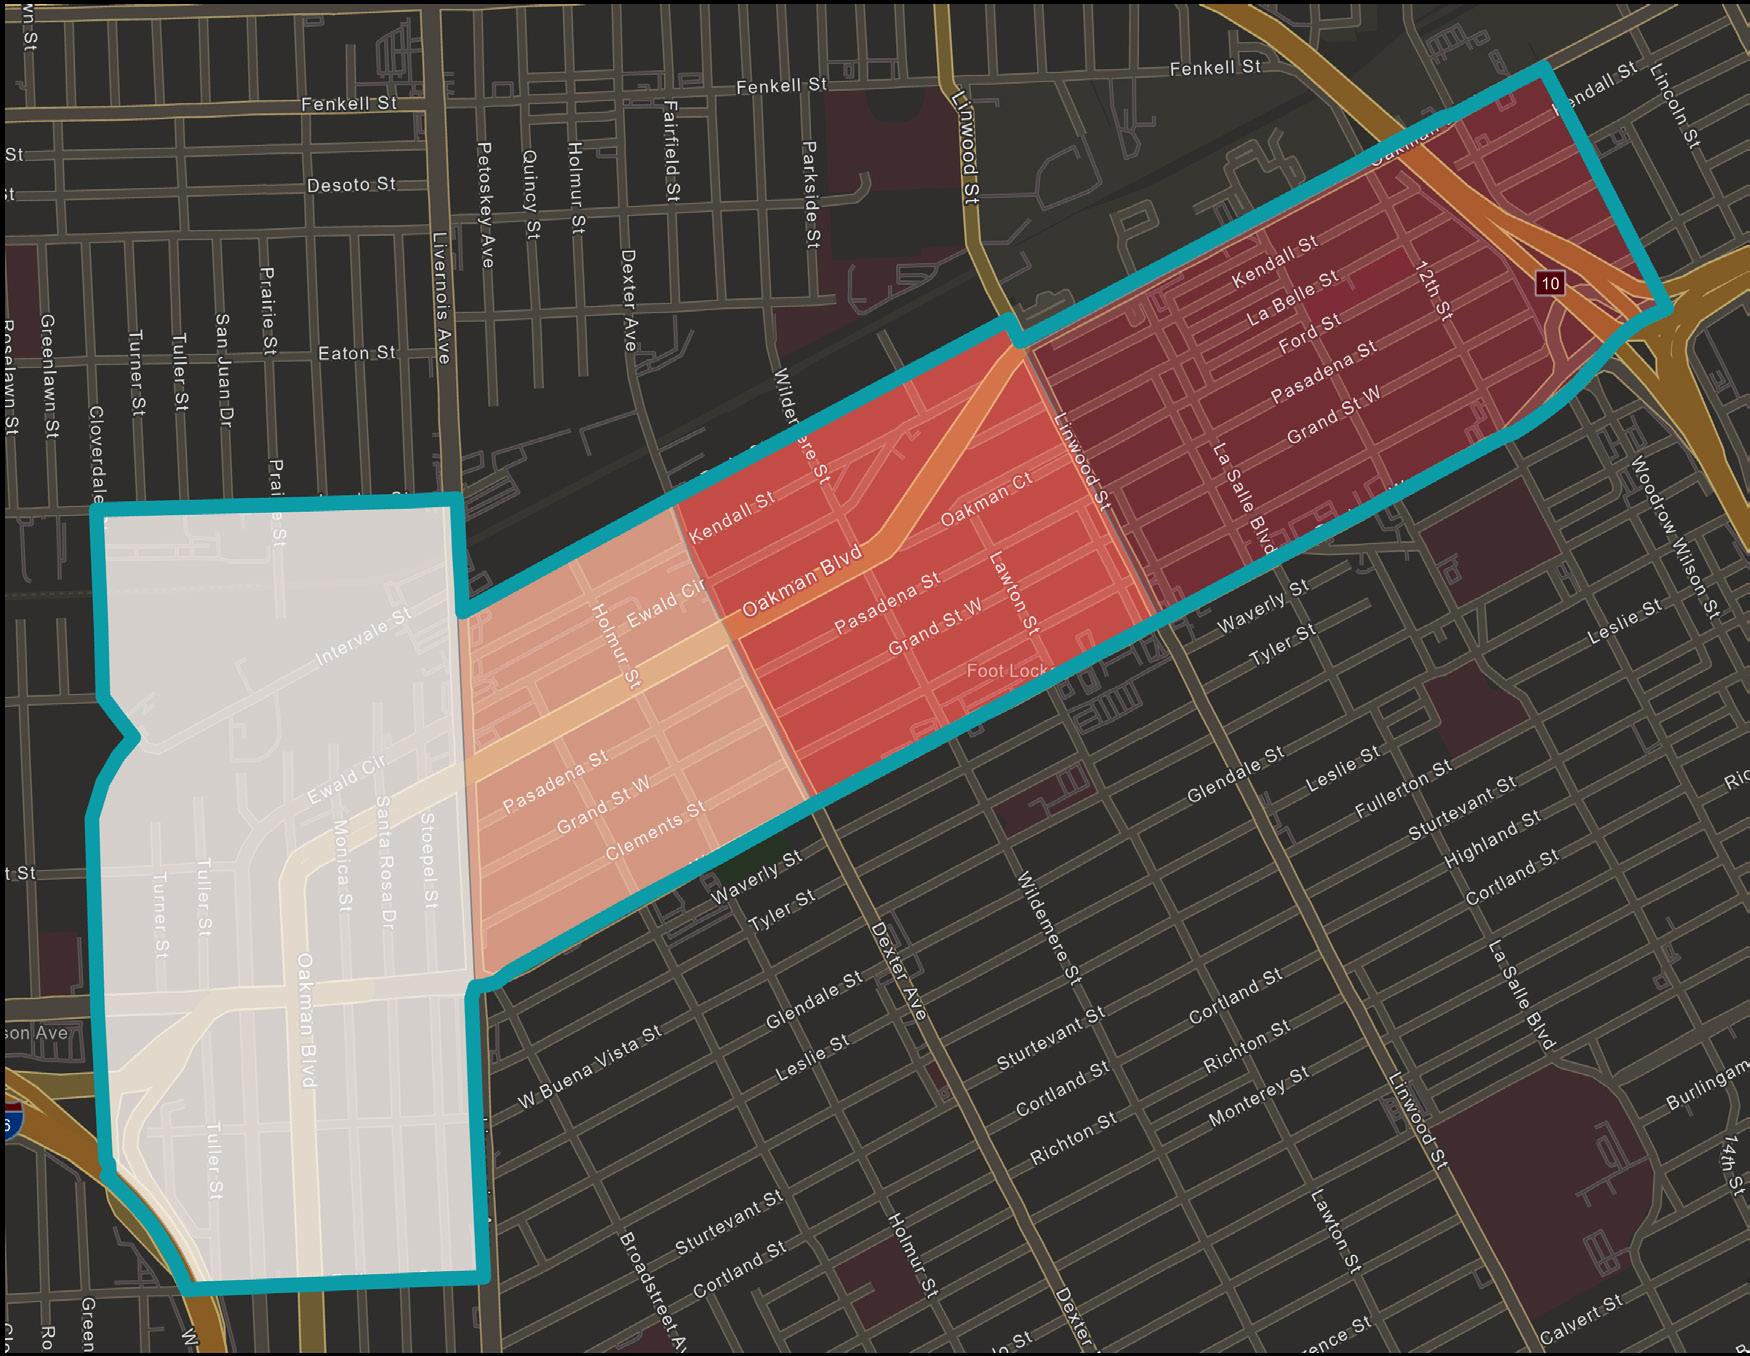
APPENDIX B: Oakman NOAH Property Profiles
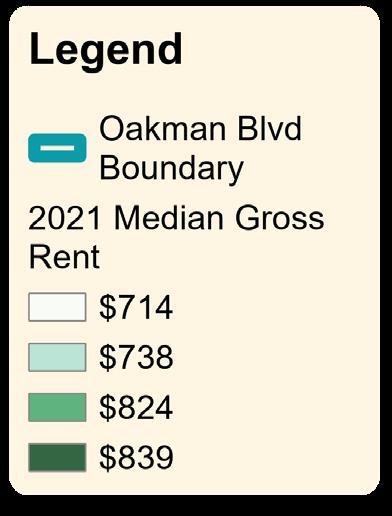
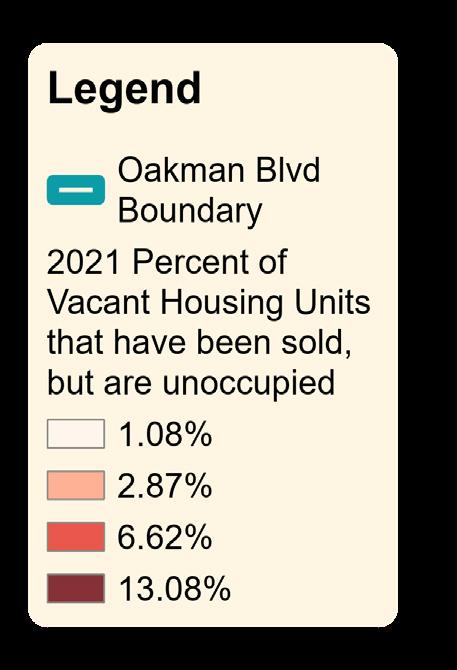
Table D1: Windshield Survey Results of March 2023
EWALD CIRCLE 12005041-4 Ewald Apts LLC Type 1
1906 CLEMENTS 08007868-9 1906 Clements LLC Type 1
1946 EWALD CIRCLE 12005030 Dalino, LLC Type 2
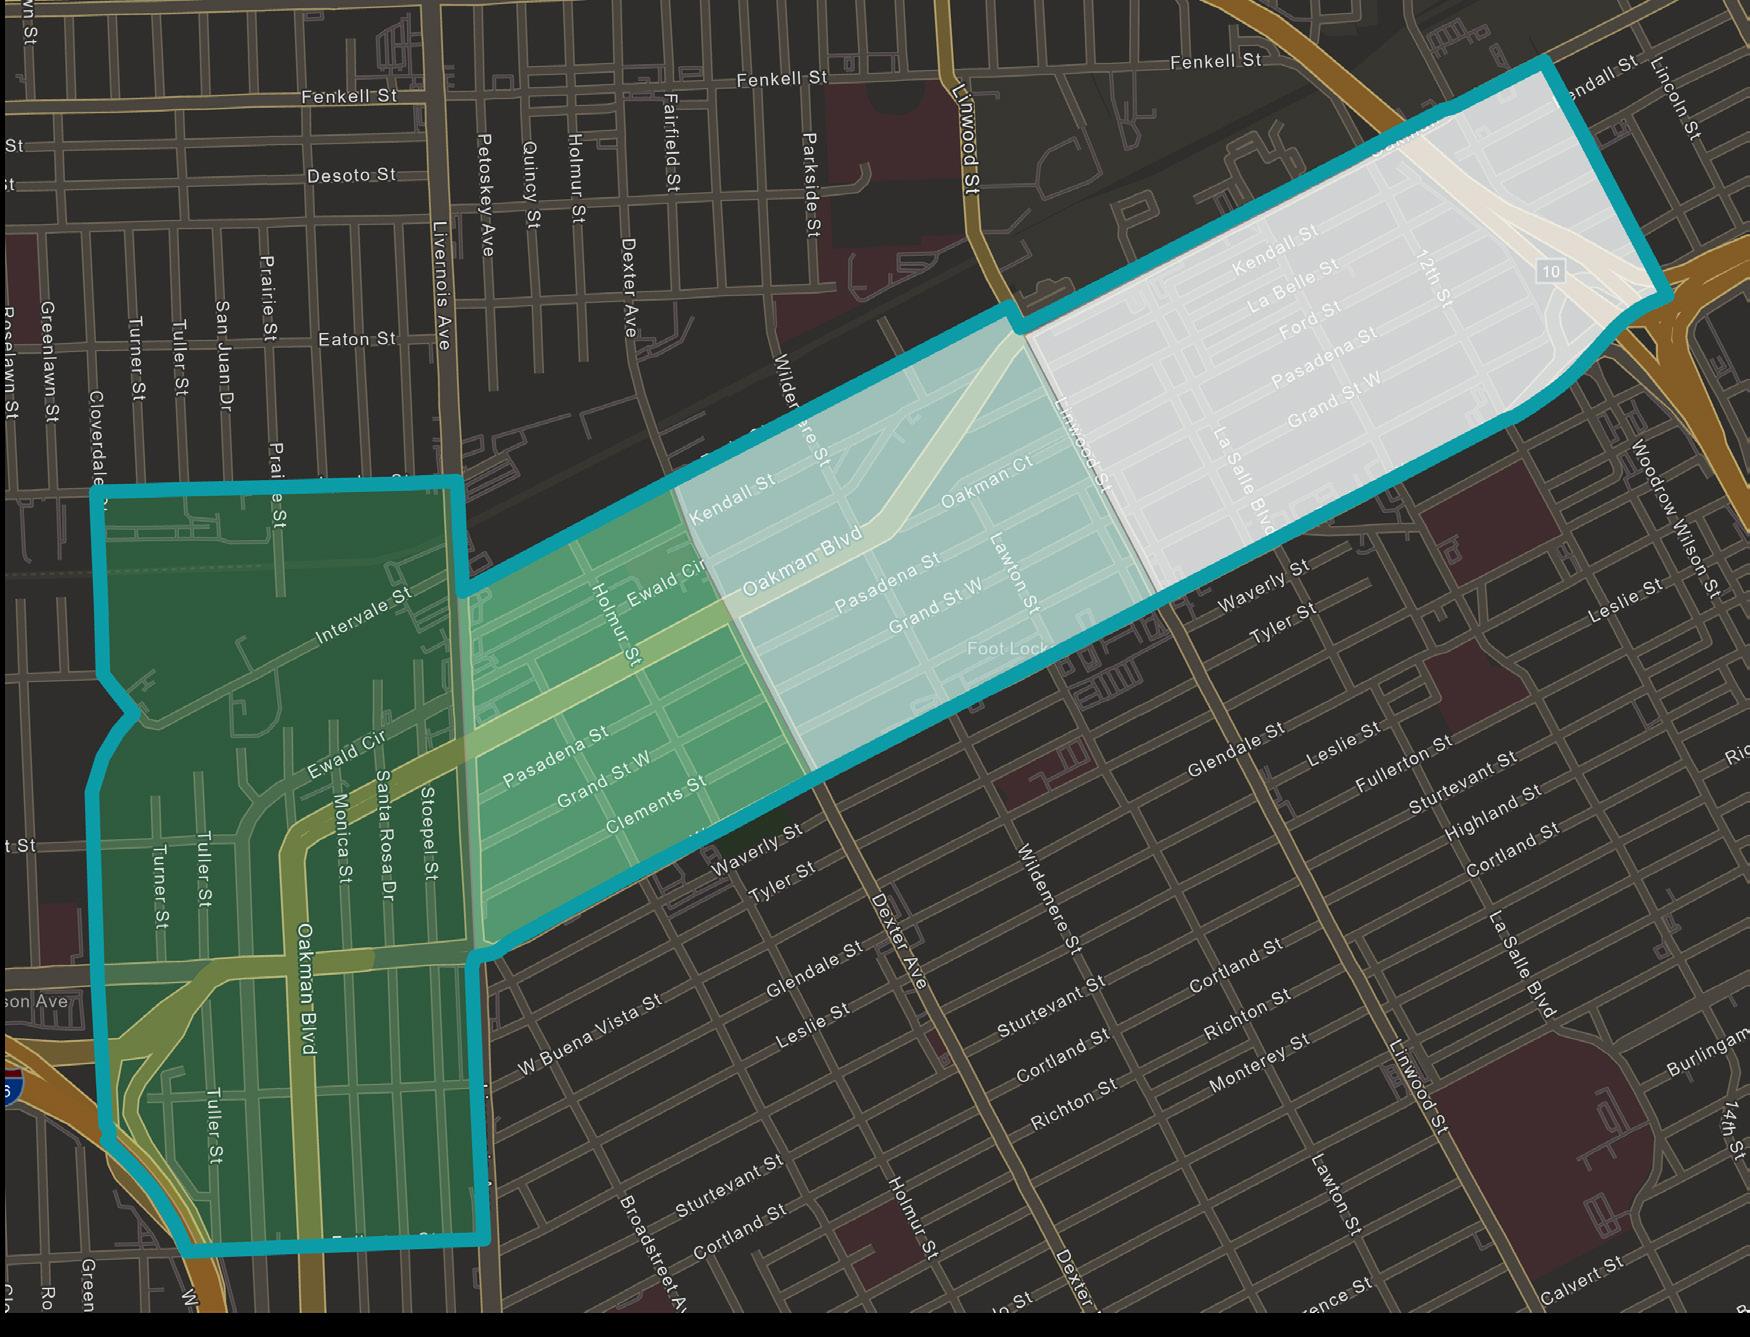
2010 CLEMENTS 8004574 Bean, Reginald C Type 1
2020 CLEMENTS 8004573 Edwards, Eric J Type 1
2055 CLEMENTS 8004529 Boone, Carl Type 2
2201 CLEMENTS 8004530 Lindsay, Essie Type 1
2215 CLEMENTS 8004531 Anderson, Anthony Type 2
2250 CLEMENTS 8004561 Clements Street Realty, LLC Type
Source: 2021 American Community Survey, US Census Bureau
74 | Preserving Small
Multi-Family NOAH Properties
Figure A7: Vacancy of Sold Properties
PROPERTY PROFILE | 75V
Address Parcel Number Property Owner Typology 13245 MONICA 16021903 Fletcher, Roberdia Type 2 13505 LA SALLE BLVD 10008800 Michigan Property Holdings, LLC. Type 2 13535 LA SALLE BLVD 10008797 LaSalle Apartments LLC Type 2 13600 LA SALLE BLVD 08010217-22 ABI Investments, LLC Type 2 13632 DEXTER 12010572-6 Dexter Avenue Baptist Church Type 2 13639 LA SALLE BLVD 10008791 Moore, Jerome W & Harris, Michael W Type 1 13700 LA SALLE BLVD 8010223 Global Land And Property Development Type 2 13725 LA SALLE BLVD 10008789 Castle Properties AG LLC Type 2 14001 MONICA 16024071-3 ACP Oakman LLC Type 3 14022 LA SALLE BLVD 8010240 14022 La Salle LLC Type 1 14030 SAN JUAN 16025390 Jackson, Robert T. Type 2 14066 SANTA ROSA 16020004 Michigan Realtoken II LLC Type 2 1705 OAKMAN BLVD 12004787 Fentress, Thomas J Type 1 1875 EWALD CIRCLE 12004918 Nash, Rachel Type 1 1890
Figure A6: 2021 Median Gross Rent
2 2303 CLEMENTS 8004543 Thomas, Kenneth Type 1
Address Parcel Number Property Owner Typology 2303 FORD 8004776 100 Doors Holding, Inc Type 1 2310 PASADENA 8004708 Edwards, Brenda & Stephanie Type 2 2340 CLEMENTS 8004549 Roberson, C G & W J Type 2 2340 GRAND 8004626 Global Land And Property Dev Et Al Type 1 2341 EWALD CIRCLE 14005925-6 Aboloshi, Fahid M E A M Type 1 2545 FORD 10007521-2 Fauvel Gouraud Distribution Type 2 2671 EWALD CIRCLE 16024024-31 ACP Oakman LLC Type 3 2701 EWALD CIRCLE 16024019-23 Dungey, David & Jennifer Type 1 2710 KENDALL 12005137-42 RS Richmond Properties LLC Type 1 2723 EWALD CIRCLE 16024006-18 ACP Oakman LLC Type 2 2750 EWALD CIRCLE 16024079-83 ACP Oakman LLC Type 3 2880 EWALD CIRCLE 16024095-102 Hobbs, James Type 1 2945 GRAND 12004613 Sikui Housing Group 2 LLC Type 2 3011 KENDALL 12005045-50 Stewart Jr, Taylor Type 1 3205 KENDALL 12005051 Boleman, LLC Type 2 3224 GRAND 12004667 Grand-Bey Estates, LLC Type 2 3225 GRAND 12004631 Benjamin, Willie Jr Type 1 3236 GRAND 12004666 Tidwell, Sean Clear Choice Holdings Type 1 3380 PASADENA 12010581 Jones, Laura S. Type 1 3700 PASADENA 14006165-6 Ttachiules, LLC Type 2 4234 W DAVISON 14005470-1 Purityson LLC Type 3
13245 MONICA STREET
TYPOLOGY: Type 2
PROPERTY OWNER * : Fletcher, Roberdia
NO. OF UNITS#+: 16
CURRENT CONDITIONS
TOTAL SQ. FEET * : 9,182
VACANCY %+: 12.5%
LISTED RENT#: Cannot Determine
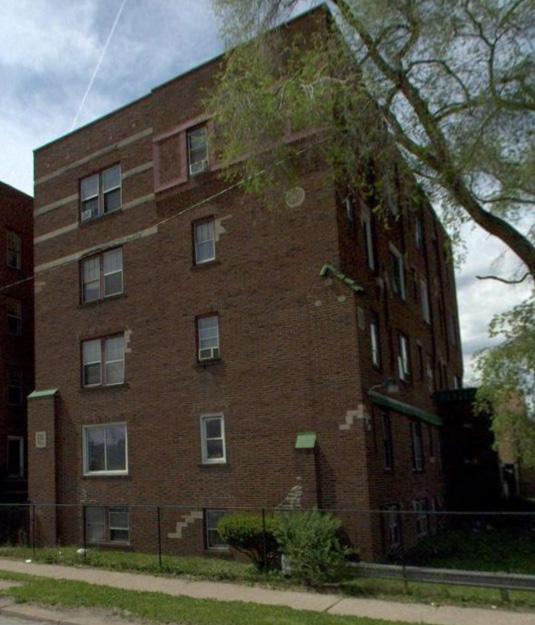
ASSESSED VALUE * : $154,400
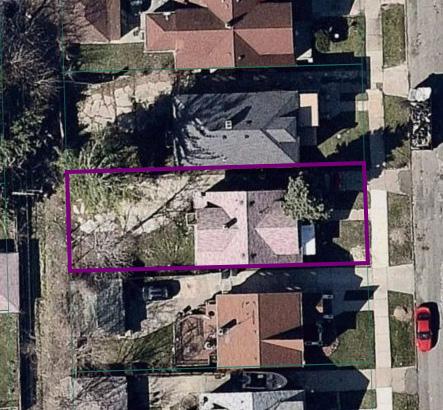
RENTAL REGISTRY * : Yes
CERT. OF COMPLIANCE * : No
ZONING DISTRICT * : R2
TRANSACTION INFO
NO. OF SALES (2011-2022)*: 0
LAST SALE PRICE * : $120,000
LAST SALE PRICE PER UNIT * : $7,500
LAST SALE PRICE PER SQ. FEET * : $13.07
LAST SALE DATE * : 6/1/1991
CHANGE IN SALE PRICE: N/A
OWNER HISTORY (2011-2022)*:
• Fletcher, Roberdia (2011-2022)
13505 LA SALLE BOULEVARD
TYPOLOGY: Type 2
PROPERTY OWNER * : Michigan Property Holdings, LLC
NO. OF UNITS#+: 35
CURRENT CONDITIONS
TOTAL SQ. FEET * : 21,059
VACANCY %+: 14.29%
LISTED RENT#: $530
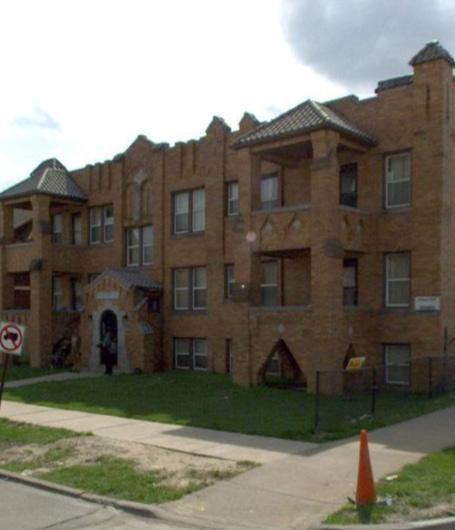
ASSESSED VALUE * : $312,200
RENTAL REGISTRY * : Yes
CERT. OF COMPLIANCE * : No
ZONING DISTRICT * : R5
TRANSACTION INFO
NO. OF SALES (2011-2022)*: 1
LAST SALE PRICE * : $175,000
LAST SALE PRICE PER UNIT * : $5,000
LAST SALE PRICE PER SQ. FEET * : $8.31
LAST SALE DATE * : 9/6/2014
CHANGE IN SALE PRICE: N/A
OWNER HISTORY (2011-2022)*:
• Michigan Property Holdings, LLC (20142022)
• Franklin, Cecilia J. (2011-2014)
SUPPLEMENTAL INFO
BUILDING PERMIT(S)+: No
VIOLATION(S)+: 1 (2012)
YEAR BUILT * : 1930
SITE ACREAGE * : 0.161
COUNCIL DISTRICT * : 7
PROPERTY CONDITION: 4
SUPPLEMENTAL INFO
BUILDING PERMIT(S)+: Yes, 4/11/2019
VIOLATION(S)+: 10 (2018)
YEAR BUILT * : 1928
SITE ACREAGE * : 0.192
SOURCES
*CITY OF DETROIT OPEN DATA PORTAL +DATA DRIVEN DETROIT #REAL COMP MLS
COUNCIL DISTRICT * : 5
PROPERTY CONDITION: 1 (recently burned down)
SOURCES
*CITY OF DETROIT OPEN DATA PORTAL +DATA DRIVEN DETROIT #REAL COMP MLS
76 | Preserving Small Multi-Family NOAH Properties PROPERTY PROFILE | 77
April 2022, Mapillary
Source: Regrid
figure/chart $165,000 $166,000 $167,000 $168,000 $169,000 $170,000 $171,000 $172,000 $173,000 $174,000 $175,000 $176,000 9/16/2014 Sale Price Date 13505 LA SALLE
Sale Price NOAH Average Sale Price (2011-2022)
BLVD
May 2022, Mapillary
13535 LA SALLE BOULEVARD
TYPOLOGY: Type 2
PROPERTY OWNER * : LaSalle Apartments, LLC
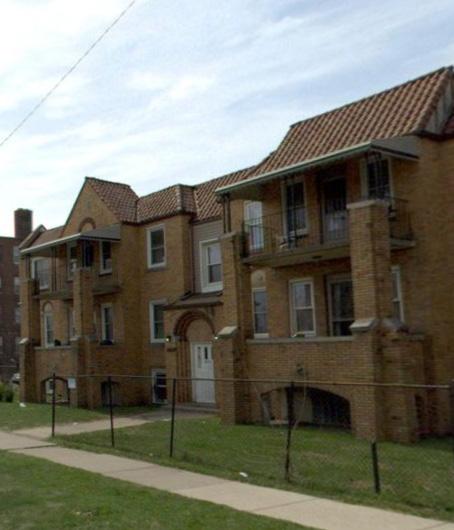
NO. OF UNITS#+: 20
CURRENT CONDITIONS
TOTAL SQ. FEET * : 11,075
VACANCY %+: 10.53%
LISTED RENT#: $895
ASSESSED VALUE * : $191,600
RENTAL REGISTRY * : Yes
CERT. OF COMPLIANCE * : No
ZONING DISTRICT * : R5
13600 LA SALLE BOULEVARD
TYPOLOGY: Type 2
PROPERTY OWNER * : ABI Investments, LLC
NO. OF UNITS#+: 27
CURRENT CONDITIONS
TOTAL SQ. FEET * : 21,310
VACANCY %+: 0%
LISTED RENT#: $575
ASSESSED VALUE * : $326,700
RENTAL REGISTRY * : Yes
CERT. OF COMPLIANCE * : No
ZONING DISTRICT * : R5
Sale Price NOAH Average Sale Price (2011-2022)
SUPPLEMENTAL INFO
BUILDING PERMIT(S)+: No
VIOLATION(S)+: 2 (2016)
YEAR BUILT * : 1929
SITE ACREAGE * : 0.193
COUNCIL DISTRICT * : 5
PROPERTY CONDITION: 3
NO. OF SALES (2011-2022)*: 2
LAST SALE PRICE * : $190,040
LAST SALE PRICE PER UNIT * : $9,502
LAST SALE PRICE PER SQ. FEET * : $17.16
LAST SALE DATE * : 10/17/2018
CHANGE IN SALE PRICE: $189,040
OWNER HISTORY (2011-2022)*:
• Bourlier, James + LaSalle Apartments, LLC (2018-2022)
• The Norrell Group + Wayne County Sheriff (2014-2018)
• Franklin, Ceclia J. (2011-2014)
SUPPLEMENTAL
BUILDING PERMIT(S)+: No
VIOLATION(S)+: 8 (2017)
YEAR BUILT * : 1948
SITE ACREAGE * : 0.57
COUNCIL DISTRICT * : 2
*CITY OF DETROIT OPEN DATA PORTAL +DATA DRIVEN DETROIT #REAL
PROPERTY CONDITION: 2
NO. OF SALES (2011-2022)*: 3
LAST SALE PRICE * : $320,000
LAST SALE PRICE PER UNIT * : $11,852
LAST SALE PRICE PER SQ. FEET * : $15.02
LAST SALE DATE * : 8/15/2019
CHANGE IN SALE PRICE: $107,500
OWNER HISTORY (2011-2022)*:
• ABI Investments, LLC (2019-2022)
• 13600 La Salle LLC (2017-2019)
• Lucille Manor Apartments 1 LLC (20152017)
• Abacus Management Group LLC (20112015)
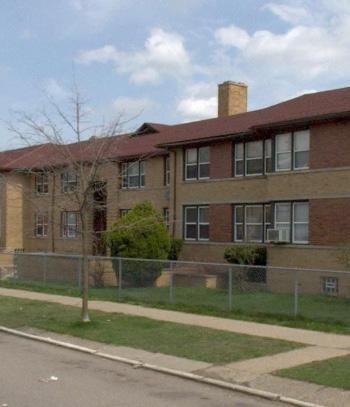
78 | Preserving Small Multi-Family NOAH Properties PROPERTY PROFILE | 79
SOURCES
COMP MLS
TRANSACTION INFO SOURCES
MLS
*CITY OF DETROIT OPEN DATA PORTAL +DATA DRIVEN DETROIT #REAL COMP
INFO $0 $20,000 $40,000 $60,000 $80,000 $100,000 $120,000 $140,000 $160,000 $180,000 $200,000 11/26/2014 10/17/2018 Sale Price Date 13535 LA SALLE BLVD
INFO TRANSACTION
April 2022, Mapillary
$0 $100,000 $200,000 $300,000 $400,000 $500,000 $600,000 $700,000 $800,000 $900,000 2/20/2015 12/29/2017 8/15/2019 Sale Price Date 13600 LA SALLE BLVD Sale Price NOAH Average Sale Price (2011-2022) April 2022, Mapillary
13632 DEXTER AVENUE
TYPOLOGY: Type 2
PROPERTY OWNER * : Dexter Avenue
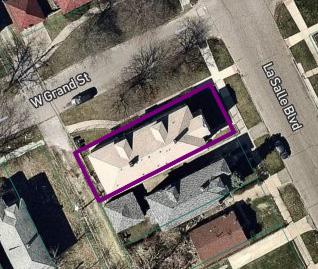
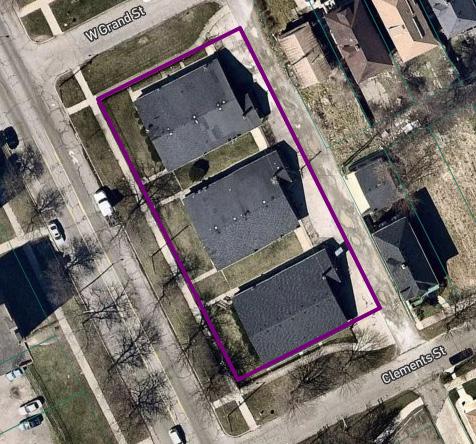
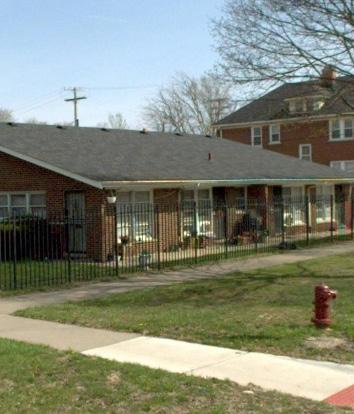
Baptist Church
NO. OF UNITS+: 24
CURRENT CONDITIONS
TOTAL SQ. FEET * : 10,767
VACANCY %+: 45.83%
LISTED RENT#: Cannot Determine
ASSESSED VALUE * : $147,600
RENTAL REGISTRY * : Yes
CERT. OF COMPLIANCE * : No
ZONING DISTRICT * : R5
TRANSACTION INFO
NO. OF SALES (2011-2022)*: 0
LAST SALE PRICE * : $165,000
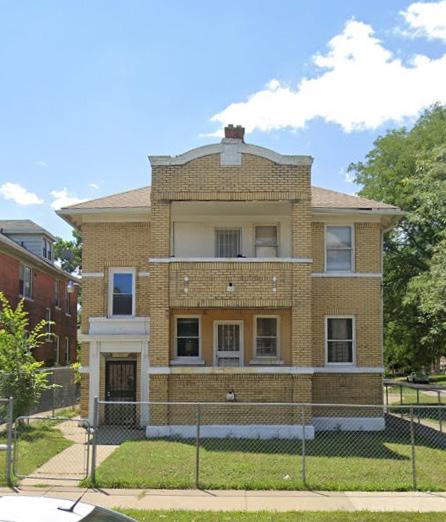
LAST SALE PRICE PER UNIT * : $6,875
LAST SALE PRICE PER SQ. FEET * : $15.32
LAST SALE DATE * : 12/1/1994
CHANGE IN SALE PRICE: N/A
OWNER HISTORY (2011-2022)*:
• Dexter Avenue Baptist Church (20112022)
SUPPLEMENTAL INFO
BUILDING PERMIT(S)+: No
VIOLATION(S)+: 0
YEAR BUILT * : 1952
SITE ACREAGE * : 0.598
COUNCIL DISTRICT * : 7
PROPERTY CONDITION: 4
13639 LA SALLE BOULEVARD
TYPOLOGY: Type 1
PROPERTY OWNER * : Moore, Jerome
W & Harris, Michael W
NO. OF UNITS#+: 6
CURRENT CONDITIONS
TOTAL SQ. FEET * : 4,838
VACANCY %+: 0%
LISTED RENT#: $450
ASSESSED VALUE * : $61,200
RENTAL REGISTRY * : No
CERT. OF COMPLIANCE * : No
ZONING DISTRICT * : R5
TRANSACTION INFO
NO. OF SALES (2011-2022)*: 0
LAST SALE PRICE * : $75,000
LAST SALE PRICE PER UNIT * : $12,500
LAST SALE PRICE PER SQ. FEET * : $15.50
LAST SALE DATE * : 7/14/2006
CHANGE IN SALE PRICE: N/A
OWNER HISTORY (2011-2022)*:
• Moore, Jerome W & Harris, Michael W (2011-2022)
SUPPLEMENTAL INFO
BUILDING PERMIT(S)+: No
VIOLATION(S)+: 0
YEAR BUILT * : 1925
SITE ACREAGE * : 0.098
SOURCES
*CITY OF DETROIT OPEN DATA PORTAL +DATA DRIVEN DETROIT #REAL COMP MLS
COUNCIL DISTRICT * : 5
PROPERTY CONDITION: 3
SOURCES
*CITY OF DETROIT OPEN DATA PORTAL +DATA DRIVEN DETROIT #REAL COMP MLS
80 | Preserving Small Multi-Family NOAH Properties PROPERTY PROFILE | 81
April 2022, Mapillary
Source: Regrid
July 2022, Google Street View
Source: Regrid
13700 LA SALLE BOULEVARD
TYPOLOGY: Type 2
PROPERTY OWNER * : Global Land & Property Development
NO. OF UNITS#+: 6
CURRENT CONDITIONS
TOTAL SQ. FEET * : 6,996
VACANCY %+: 0%
LISTED RENT#: $777
ASSESSED VALUE * : $107,400
RENTAL REGISTRY * : Yes
CERT. OF COMPLIANCE * : No
ZONING DISTRICT * : R5
TRANSACTION INFO
NO. OF SALES (2011-2022)*: 2
LAST SALE PRICE * : $208,200
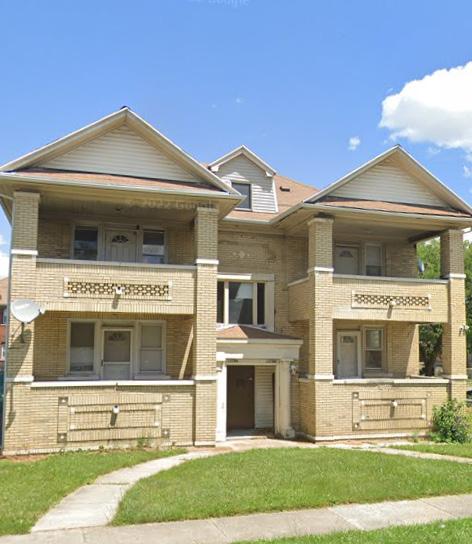
LAST SALE PRICE PER UNIT * : $34,700
LAST SALE PRICE PER SQ. FEET * : $29.76
LAST SALE DATE * : 3/11/2020
CHANGE IN SALE PRICE: - $75,800
OWNER HISTORY (2011-2022)*:
• Global Land & Property Development (2020-2022)
SUPPLEMENTAL INFO
BUILDING PERMIT(S)+: No
VIOLATION(S)+: 0
YEAR BUILT * : 1925
SITE ACREAGE * : 0.119
COUNCIL DISTRICT * : 2
PROPERTY CONDITION: 3
13725 LA SALLE BOULEVARD
TYPOLOGY: Type 2
PROPERTY OWNER * : Castle Properties AG LLC
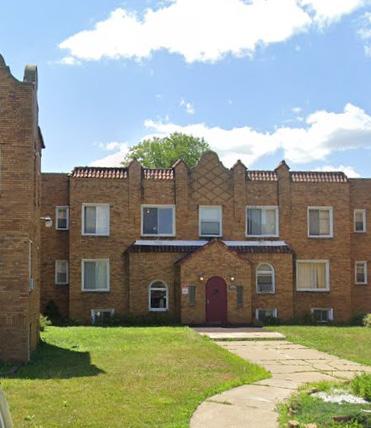
NO. OF UNITS#+: 30
CURRENT CONDITIONS
TOTAL SQ. FEET * : 21,683
VACANCY %+: 10%
LISTED RENT#: Cannot Determine
ASSESSED VALUE * : $371,400
RENTAL REGISTRY * : Yes
CERT. OF COMPLIANCE * : No
ZONING DISTRICT *:R5
TRANSACTION INFO
NO. OF SALES (2011-2022)*: 2
LAST SALE PRICE * : $1,240,000
LAST SALE PRICE PER UNIT * : $41,333
LAST SALE PRICE PER SQ. FEET * : $57.19
LAST SALE DATE * : 1/28/2022
CHANGE IN SALE PRICE: $460,000
OWNER HISTORY (2011-2022)*:
• Castle Properites AG LLC + Coastal Line Homes LLC (2017-2022)
• Duplido Properties 2018 LLC (20192020)
• Mega Management Group, LLC (20112019)
SUPPLEMENTAL INFO
BUILDING PERMIT(S)+: No
VIOLATION(S)+: 5 (2011)
YEAR BUILT * : 1930
SITE ACREAGE * : 0.371
• Brookehaven Apartments LLC (20112017)
SOURCES
*CITY OF DETROIT OPEN DATA PORTAL +DATA DRIVEN DETROIT #REAL COMP MLS
COUNCIL DISTRICT * : 5
PROPERTY CONDITION: 2
SOURCES
*CITY OF DETROIT OPEN DATA PORTAL +DATA DRIVEN DETROIT #REAL COMP MLS
82 | Preserving Small Multi-Family NOAH Properties PROPERTY PROFILE | 83
$0 $50,000 $100,000 $150,000 $200,000 $250,000 $300,000 11/1/2019 3/11/2020 Sale Price Date 13700 LA SALLE BLVD Sale Price NOAH Average Sale Price (2011-2022) July 2022, Google Street View
$0 $200,000 $400,000 $600,000 $800,000 $1,000,000 $1,200,000 $1,400,000 11/30/2017 1/28/2022 Sale Price Date 13725 LA SALLE BLVD Sale Price NOAH Average Sale Price (2011-2022)
July 2022, Google Street View
14001 MONICA STREET
TYPOLOGY: Type 3
PROPERTY OWNER * : ACP Oakman
NO. OF UNITS#+: 5
CURRENT CONDITIONS
TOTAL SQ. FEET * : 3,812
VACANCY %+: 0%
LISTED RENT#: Cannot Determine
ASSESSED VALUE * : $54,000
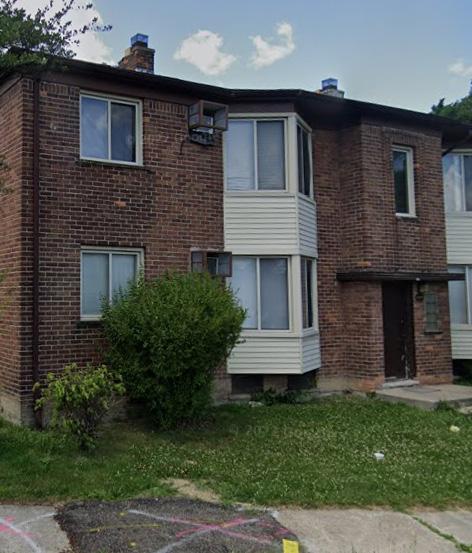
RENTAL REGISTRY * : Yes
CERT. OF COMPLIANCE * : Yes
ZONING DISTRICT * : R3
TRANSACTION INFO
NO. OF SALES (2011-2022)*: 1
LAST SALE PRICE * : $10
LAST SALE PRICE PER UNIT * : $2
LAST SALE PRICE PER SQ. FEET * : $0.002
LAST SALE DATE * : 11/24/2014
CHANGE IN SALE PRICE: N/A
OWNER HISTORY (2011-2022)*:
• ACP Oakman LLC + Interim Holdings, LLC (2014-2022)
14022 LA SALLE BOULEVARD
TYPOLOGY: Type 1
PROPERTY OWNER * : 14022 La Salle
LLC
NO. OF UNITS#+: 14
CURRENT CONDITIONS
TOTAL SQ. FEET * : 7,192
VACANCY %+: 100%
LISTED RENT#: Cannot Determine
ASSESSED VALUE * : $78,700
RENTAL REGISTRY * : No
CERT. OF COMPLIANCE * : No
ZONING DISTRICT *:R5
TRANSACTION INFO
NO. OF SALES (2011-2022)*: 3
LAST SALE PRICE * : $230,000
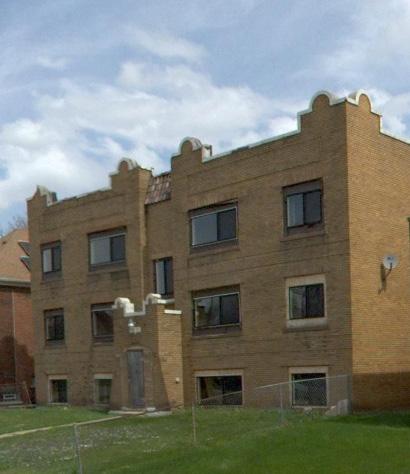
LAST SALE PRICE PER UNIT * : $16,429
LAST SALE PRICE PER SQ. FEET * : $31.98
LAST SALE DATE * : 10/13/2020
CHANGE IN SALE PRICE: $110,000
OWNER HISTORY (2011-2022)*:
• 14022 La Salle LLC (2020-2022)
Sale Price NOAH Average Sale Price (2011-2022)
SUPPLEMENTAL INFO
BUILDING PERMIT(S)+: No
VIOLATION(S)+: 0
YEAR BUILT * : 1948
SITE ACREAGE * : 0.156
COUNCIL DISTRICT * : 7
PROPERTY CONDITION: 4
• Interim Capital, LLC (2011-2014)
SUPPLEMENTAL INFO
BUILDING PERMIT(S)+: No
VIOLATION(S)+: 0
YEAR BUILT * : 1929
SITE ACREAGE * : 0.19
• M&F Housing LLC + Chiaradia, Vincente (2017-2020)
• Siglafe, LLC (2015-2017)
• Henry, Henry, Freddie, Cynthia (20112015)
SOURCES
*CITY OF DETROIT OPEN DATA PORTAL +DATA DRIVEN DETROIT #REAL COMP MLS
COUNCIL DISTRICT * : 2
PROPERTY CONDITION: 4
SOURCES
*CITY OF DETROIT OPEN DATA PORTAL +DATA DRIVEN DETROIT #REAL COMP MLS
84 | Preserving Small Multi-Family NOAH Properties PROPERTY PROFILE | 85
$0 $20,000 $40,000 $60,000 $80,000 $100,000 $120,000 $140,000 $160,000 $180,000 4/15/2014 Sale Price Date 14001 MONICA
June 2022, Google Street View
LLC
$0 $50,000 $100,000 $150,000 $200,000 $250,000 11/19/2015 11/1/2017 10/13/2020 Sale Price Date 14022 LA SALLE BLVD Sale Price NOAH Average Sale Price (2011-2022) April 2022, Mapillary
14030 SAN JUAN DRIVE
TYPOLOGY: Type 2
PROPERTY OWNER * : Jackson, Robert T.
NO. OF UNITS#+: 4
CURRENT CONDITIONS
TOTAL SQ. FEET * : 3,420
VACANCY %+: 0%
LISTED RENT#: $700
ASSESSED VALUE * : $12,400
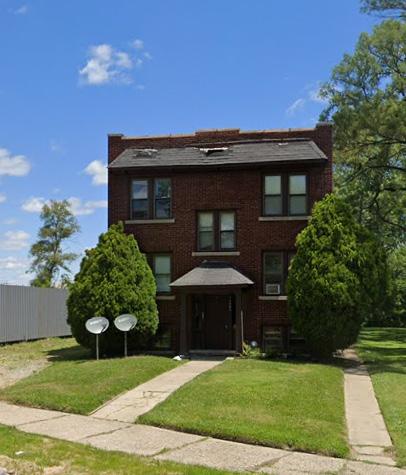
RENTAL REGISTRY * : Yes
CERT. OF COMPLIANCE * : No
ZONING DISTRICT * : R1
TRANSACTION INFO
NO. OF SALES (2011-2022)*: 3
LAST SALE PRICE * : $240,000
LAST SALE PRICE PER UNIT * : $60,000
LAST SALE PRICE PER SQ. FEET * : $70.18
LAST SALE DATE * : 9/15/2021
CHANGE IN SALE PRICE: $236,000
OWNER HISTORY (2011-2022)*:
• Jackson, Robert T. (2021-2022)
• Gonzalez, Felix (2019-2021)
SUPPLEMENTAL INFO
BUILDING PERMIT(S)+: No
VIOLATION(S)+: 3 (2018)
YEAR BUILT * : 1924
SITE ACREAGE * : 0.124
COUNCIL DISTRICT * : 7
PROPERTY CONDITION: 4
14066 SANTA ROSA DRIVE
TYPOLOGY: Type 2
PROPERTY OWNER * : Michigan
Realtoken II LLC
NO. OF UNITS#+: 5
CURRENT CONDITIONS
TOTAL SQ. FEET * : 2,762
VACANCY %+: 20%
LISTED RENT#: $722.20
ASSESSED VALUE * : $17,600
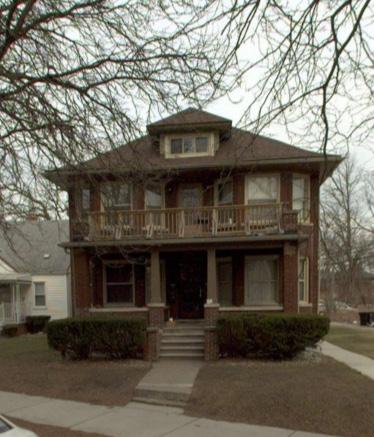
RENTAL REGISTRY * : Yes
CERT. OF COMPLIANCE * : No
ZONING DISTRICT * : R2
TRANSACTION INFO
NO. OF SALES (2011-2022)*: 3
LAST SALE PRICE * : $210,000
LAST SALE PRICE PER UNIT * : $42,000
LAST SALE PRICE PER SQ. FEET * : $76.03
LAST SALE DATE * : 6/24/2021
CHANGE IN SALE PRICE: $196,000
OWNER HISTORY (2011-2022)*:
• Michigan Realtoken II LLC (2021-2022)
(2011-2022)
• Jones, Jason (2016-2019)
• Coleman, Lloyd (2011-2016)
SUPPLEMENTAL INFO
BUILDING PERMIT(S)+: No
VIOLATION(S)+: 0
YEAR BUILT * : 1927
SITE ACREAGE * : 0.101
• D Grant Holdings LLC + GDP Equities LLC (2019-2021)
• D Grant Holdings LLC (2019)
• Carrick Realty Group (2011-2019)
SOURCES
*CITY OF DETROIT OPEN DATA PORTAL +DATA DRIVEN DETROIT #REAL COMP MLS
COUNCIL DISTRICT * : 7
PROPERTY CONDITION: 3
SOURCES
*CITY OF DETROIT OPEN DATA PORTAL +DATA DRIVEN DETROIT #REAL COMP MLS
86 | Preserving Small Multi-Family NOAH Properties PROPERTY PROFILE | 87
$0 $50,000 $100,000 $150,000 $200,000 $250,000 $300,000 10/7/2016 11/18/2019 9/15/2021 Sale Price Date 14030 SAN JUAN Sale
Price NOAH Average Sale Price
March 2021, Mapillary
$0 $50,000 $100,000 $150,000 $200,000 $250,000 4/18/2019 8/19/2019 6/24/2021 Sale Price Date 14066
Sale Price NOAH Average Sale Price (2011-2022)
SANTA ROSA
June
2022, Google Street View
1705 OAKMAN BOULEVARD
TYPOLOGY: Type 1
PROPERTY OWNER * : Fentress, Thomas J
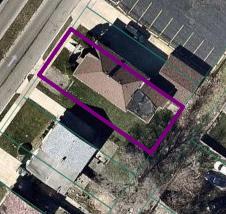
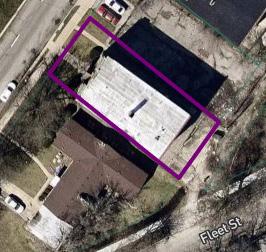
NO. OF UNITS#+: 13
CURRENT CONDITIONS
TOTAL SQ. FEET * : 8,748
VACANCY %+: 0%
LISTED RENT#: Cannot Determine
ASSESSED VALUE * : $107,900
RENTAL REGISTRY * : No
CERT. OF COMPLIANCE * : No
ZONING DISTRICT * : R5
April 2022, Mapillary
TRANSACTION INFO
NO. OF SALES (2011-2022)*: 0
LAST SALE PRICE * : Cannot Determine
LAST SALE PRICE PER UNIT * : N/A
LAST SALE PRICE PER SQ. FEET * : N/A
LAST SALE DATE * : N/A
CHANGE IN SALE PRICE: N/A
OWNER HISTORY (2011-2022)*:
• Fentress, Thomas J (2011-2022)
1875 EWALD CIRCLE
TYPOLOGY: Type 1
PROPERTY OWNER * : Nash, Rachel
NO. OF UNITS#+: 4
CURRENT CONDITIONS
TOTAL SQ. FEET * : 2,840
VACANCY %+: 0%
LISTED RENT#: Cannot Determine
ASSESSED VALUE * : $21,700
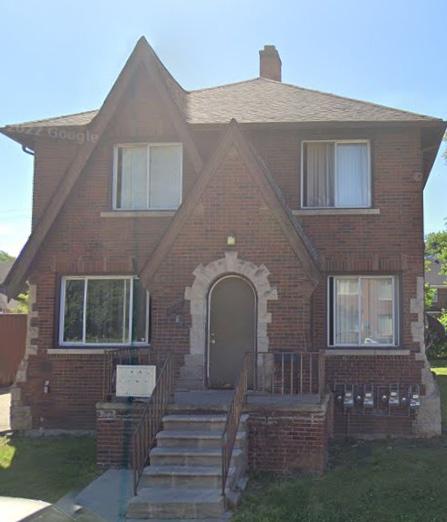
RENTAL REGISTRY * : No
CERT. OF COMPLIANCE * : No
ZONING DISTRICT * : R3
TRANSACTION INFO
NO. OF SALES (2011-2022)*: 0
LAST SALE PRICE * : $100,000
LAST SALE PRICE PER UNIT * : $25,000
LAST SALE PRICE PER SQ. FEET * : $35.21
LAST SALE DATE * : 7/27/2004
CHANGE IN SALE PRICE: N/A
OWNER HISTORY (2011-2022)*:
• Nash, Rachel (2011-2022)
SUPPLEMENTAL INFO
BUILDING PERMIT(S)+: No
VIOLATION(S)+: 2 (2018)
YEAR BUILT * : 1927
SITE ACREAGE * : 0.138
COUNCIL DISTRICT * : 2
PROPERTY CONDITION: 4
SUPPLEMENTAL INFO
BUILDING PERMIT(S)+: No
VIOLATION(S)+: 0
YEAR BUILT * : 1930
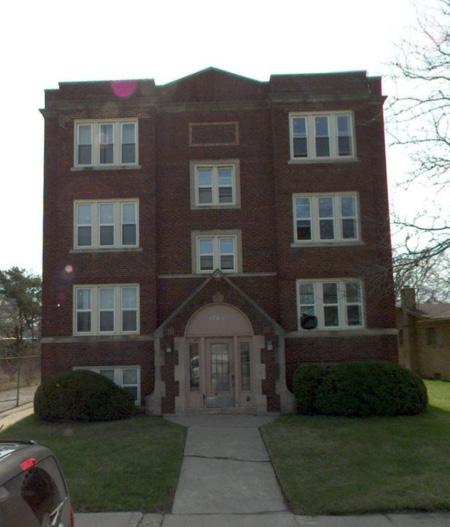
SITE ACREAGE * : 0.09
SOURCES
*CITY OF DETROIT OPEN DATA PORTAL +DATA DRIVEN DETROIT #REAL COMP MLS
COUNCIL DISTRICT * : 2
PROPERTY CONDITION: 3
SOURCES
*CITY OF DETROIT OPEN DATA PORTAL +DATA DRIVEN DETROIT #REAL COMP MLS
88 | Preserving Small Multi-Family NOAH Properties PROPERTY PROFILE | 89
Source: Regrid
June 2022, Google Street View
Source: Regrid
1890 EWALD CIRCLE
TYPOLOGY: Type 1
PROPERTY OWNER * : Ewald Apts
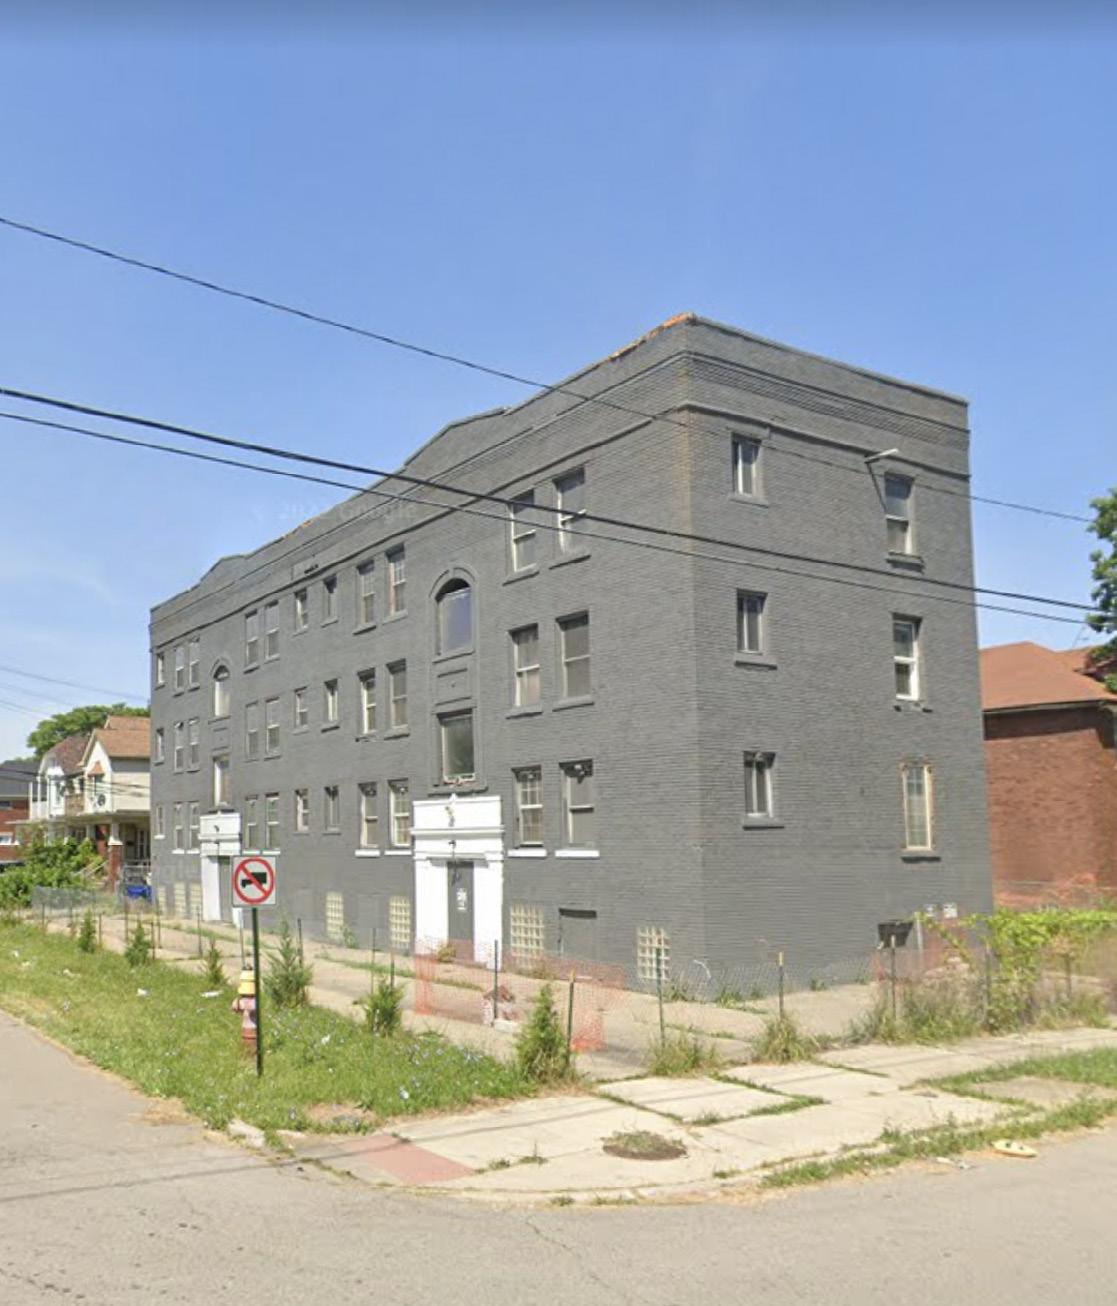
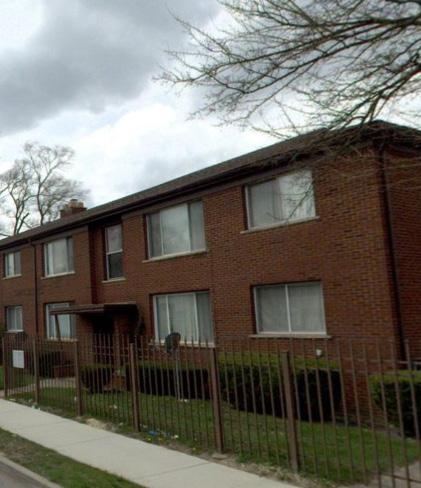
LLC
NO. OF UNITS#+: 8
CURRENT CONDITIONS
TOTAL SQ. FEET * : 5,936
VACANCY %+: 0%
LISTED RENT#: Cannot Determine
ASSESSED VALUE * : $100,200
RENTAL REGISTRY * : No
CERT. OF COMPLIANCE * : No
ZONING DISTRICT * : R3
1890 EWALD CIRCLE
1906 CLEMENTS STREET
TYPOLOGY: Type 1
PROPERTY OWNER * : 1906 Clements
LLC
NO. OF UNITS#+: 7
CURRENT CONDITIONS
TOTAL SQ. FEET * : 6,976
VACANCY %+: 100%
LISTED RENT#: Cannot Determine
ASSESSED VALUE * : $11,200
RENTAL REGISTRY * : No
CERT. OF COMPLIANCE * : No
ZONING DISTRICT * : R2
CLEMENTS
Sale Price NOAH Average Sale Price (2011-2022)
SUPPLEMENTAL INFO
BUILDING PERMIT(S)+: No
VIOLATION(S)+: 0
YEAR BUILT * : 1949
SITE ACREAGE * : 0.284
COUNCIL DISTRICT * : 2
PROPERTY CONDITION: 4
April 2022, Mapillary
TRANSACTION INFO
NO. OF SALES (2011-2022)*: 1
LAST SALE PRICE * : $377,000
LAST SALE PRICE PER UNIT * : $47,125
LAST SALE PRICE PER SQ. FEET * : $63.51
LAST SALE DATE * : 9/29/2021
CHANGE IN SALE PRICE: N/A
OWNER HISTORY (2011-2022)*:
• Ewald Apts LLC (2021-2022)
• Assure Affordable Homes Inc (20112021)
SUPPLEMENTAL INFO
BUILDING PERMIT(S)+: Yes, 12/19/2020
VIOLATION(S)+: 9 (2015)
YEAR BUILT * : 1927
SITE ACREAGE * : 0.074
TRANSACTION INFO
NO. OF SALES (2011-2022)*: 3
LAST SALE PRICE * : $49,000
LAST SALE PRICE PER UNIT * : $7,000
LAST SALE PRICE PER SQ. FEET * : $7.02
LAST SALE DATE * : 01/08/2020
CHANGE IN SALE PRICE: -$5,000
OWNER HISTORY (2011-2022)*:
• 1906 Clements LLC (2020-2022)
• Wayne County Treasurer + Freewind Properties LLC (2015- 2020)
• Robert Douglas Holdings I LLC (20112015)
• Bayview Loan Servicing LLC (2011)
SOURCES
*CITY OF DETROIT OPEN DATA PORTAL +DATA DRIVEN DETROIT #REAL COMP MLS
COUNCIL DISTRICT * : 2
PROPERTY CONDITION: 3
SOURCES
*CITY OF DETROIT OPEN DATA PORTAL +DATA DRIVEN DETROIT #REAL COMP MLS
90 | Preserving Small Multi-Family NOAH Properties PROPERTY PROFILE | 91
$0 $50,000 $100,000 $150,000 $200,000 $250,000 $300,000 $350,000 $400,000 9/29/2021 Sale Price Date
$0 $20,000 $40,000 $60,000 $80,000 $100,000 $120,000 $140,000 $160,000 $180,000 10/21/2011 9/13/2015 1/8/2020 Sale Price Date
Sale Price NOAH Average Sale Price (2011-2022)
1906
June 2022, Google Street View
1946 EWALD CIRCLE
TYPOLOGY: Type 2
PROPERTY OWNER * : Dalino, LLC
NO. OF UNITS#+: 6
2010 CLEMENTS STREET
TYPOLOGY: Type 1
PROPERTY OWNER * : Bean, Reginald C
NO. OF UNITS#+: 4
CURRENT CONDITIONS
TOTAL SQ. FEET * : 6,473
VACANCY %+: 116.67%
LISTED RENT#: $695
ASSESSED VALUE * : $91,000
RENTAL REGISTRY * : Yes
CERT. OF COMPLIANCE * : No
ZONING DISTRICT * : R3
1946 EWALD CIRCLE
TRANSACTION INFO
NO. OF SALES (2011-2022)*: 2
LAST SALE PRICE * : $131,000
LAST SALE PRICE PER UNIT * : $21,833
LAST SALE PRICE PER SQ. FEET * : $20.24
LAST SALE DATE * : 05/23/2017
CHANGE IN SALE PRICE: $131,000
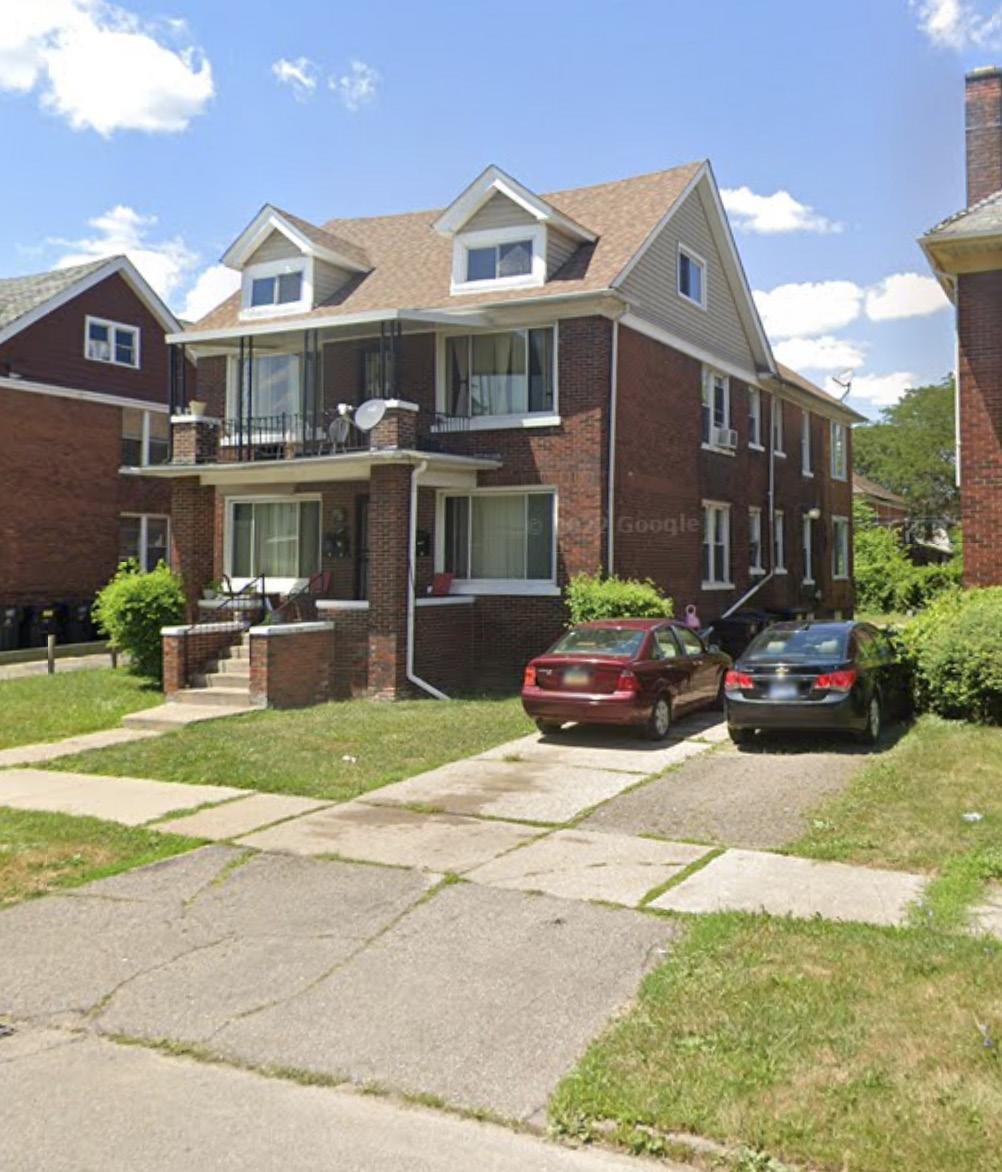
OWNER HISTORY (2011-2022)*:
• Dalino, LLC (2017-2022)
• Kellum Capital Group LLC (2014-2017)
CURRENT CONDITIONS
TOTAL SQ. FEET * : 3,600
VACANCY %+: 0%
LISTED RENT#: $450.00
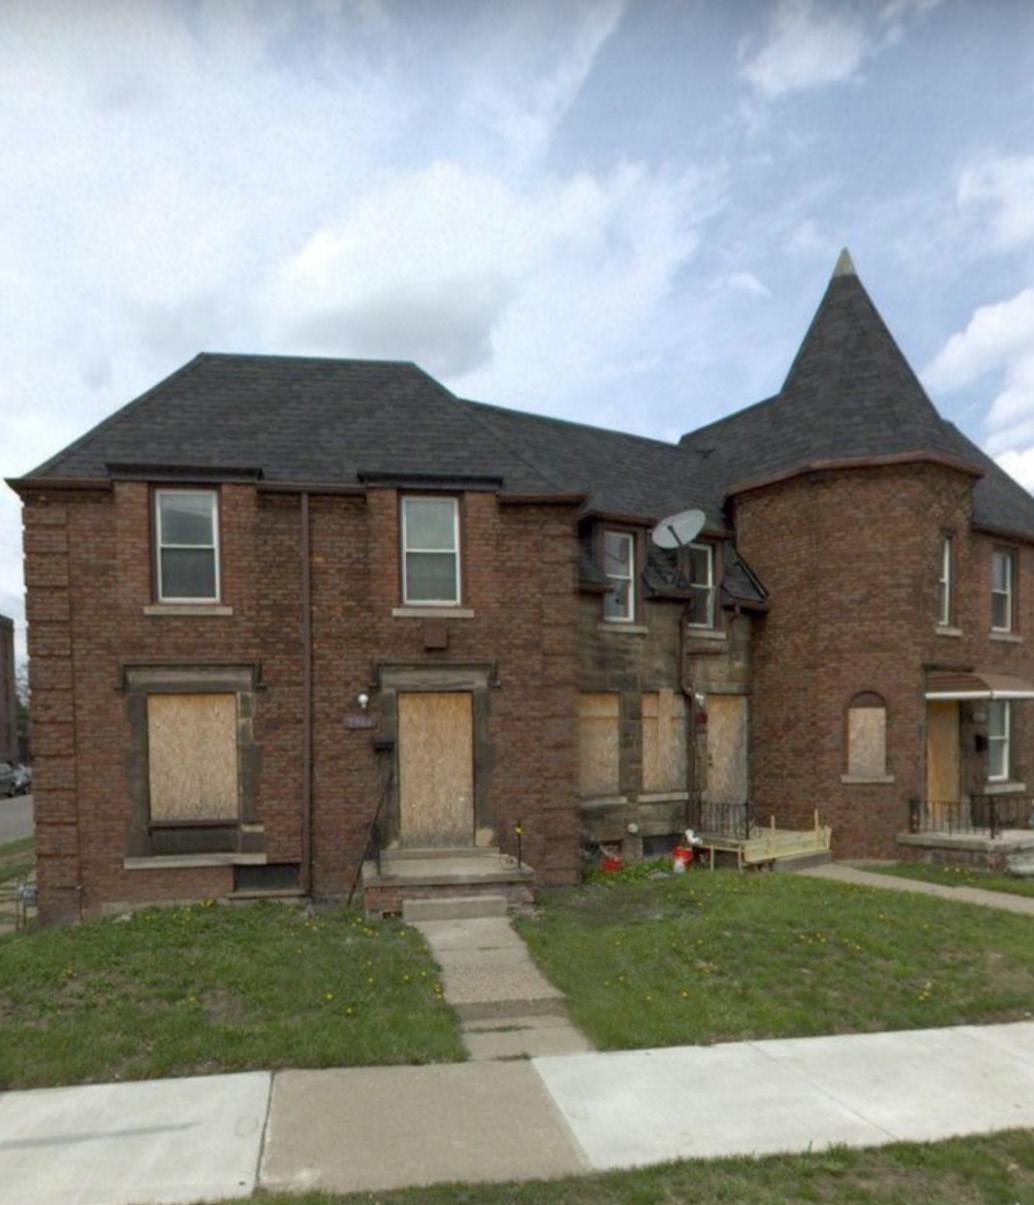
ASSESSED VALUE * : $22,500
RENTAL REGISTRY * : No
CERT. OF COMPLIANCE * : No
ZONING DISTRICT * : R2
TRANSACTION INFO
NO. OF SALES (2011-2022)*: 0
LAST SALE PRICE * : $95,000
LAST SALE PRICE PER UNIT * : $23,750
LAST SALE PRICE PER SQ. FEET * : $26.39
LAST SALE DATE * : 01/09/2004
CHANGE IN SALE PRICE: N/A
OWNER HISTORY (2011-2022)*:
• Bean, Reginald C (2011-2022)
Sale Price NOAH Average Sale Price (2011-2022)
SUPPLEMENTAL INFO
BUILDING PERMIT(S)+: No
VIOLATION(S)+: 1 (2018)
YEAR BUILT * : 1931
SITE ACREAGE * : 0.226
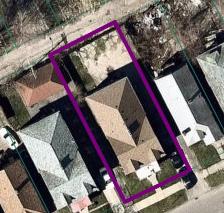
COUNCIL DISTRICT * : 2
PROPERTY CONDITION: 2
• Ewald Circle LLC (2011-2014)
SUPPLEMENTAL INFO
BUILDING PERMIT(S)+: No
VIOLATION(S)+: 0
YEAR BUILT * : 1924
SITE ACREAGE * : 0.144
SOURCES
*CITY OF DETROIT OPEN DATA PORTAL +DATA DRIVEN DETROIT #REAL COMP MLS
COUNCIL DISTRICT * : 2
PROPERTY CONDITION: 2
SOURCES
*CITY OF DETROIT OPEN DATA PORTAL +DATA DRIVEN DETROIT #REAL COMP MLS
92 | Preserving Small Multi-Family NOAH Properties PROPERTY PROFILE | 93
$0 $20,000 $40,000 $60,000 $80,000 $100,000 $120,000 $140,000 $160,000 $180,000 5/14/2014
Sale Price Date
5/23/2017
April 2022, Google Street View
Source: Regrid
July 2022, Google Street View
2020 CLEMENTS STREET
TYPOLOGY: Type 1
PROPERTY OWNER * : Edwards, Eric J
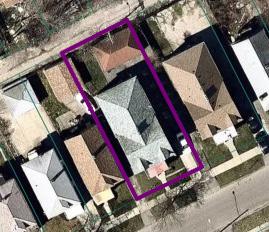
NO. OF UNITS#+: 4
2055 CLEMENTS STREET
TYPOLOGY: Type 2
PROPERTY OWNER * : Boone, Carl
NO. OF UNITS#+: 12
CURRENT CONDITIONS
TOTAL SQ. FEET * : 3,600
VACANCY %+: 50%
LISTED RENT#: $450
ASSESSED VALUE * : $24,000
RENTAL REGISTRY * : No
CERT. OF COMPLIANCE * : No
ZONING DISTRICT * : R2
TRANSACTION INFO
NO. OF SALES (2011-2022)*: 0
LAST SALE PRICE * : $100,000
LAST SALE PRICE PER UNIT * : $25,000
LAST SALE PRICE PER SQ. FEET * : $27.78
LAST SALE DATE * : 05/30/2003 CHANGE IN SALE PRICE: N/A
OWNER HISTORY (2011-2022)*:
• Edwards, Eric J (2011-2022)
SUPPLEMENTAL INFO
BUILDING PERMIT(S)+: No
VIOLATION(S)+: 0
YEAR BUILT * : 1925
SITE ACREAGE * : 0.144
COUNCIL DISTRICT * : 2
PROPERTY CONDITION: 2
CURRENT CONDITIONS
TOTAL SQ. FEET * : 7,360
VACANCY %+: 0%
LISTED RENT#: $538.75
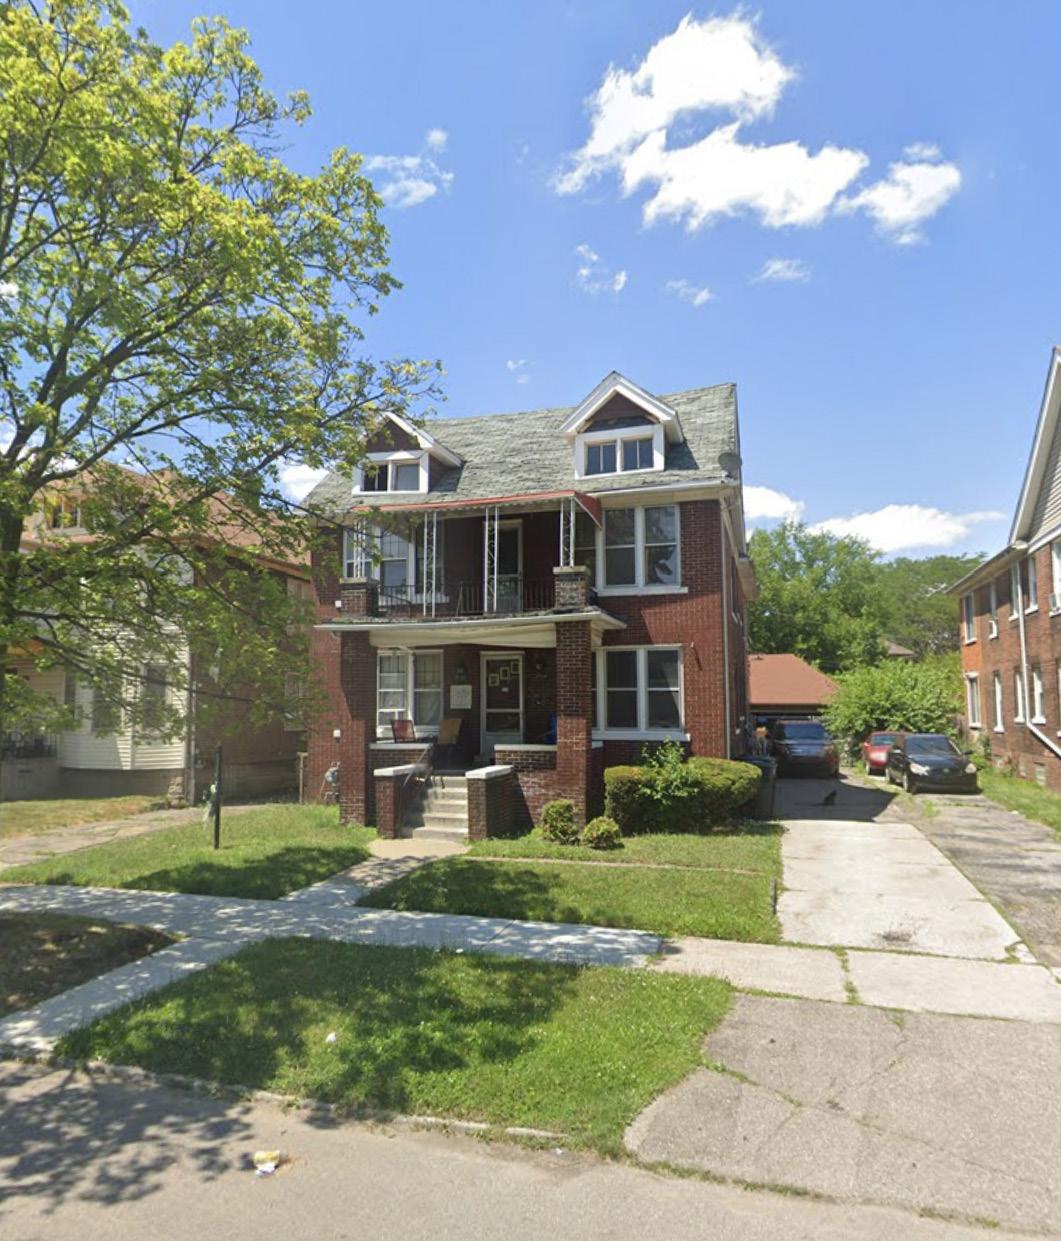
ASSESSED VALUE * : $90,000
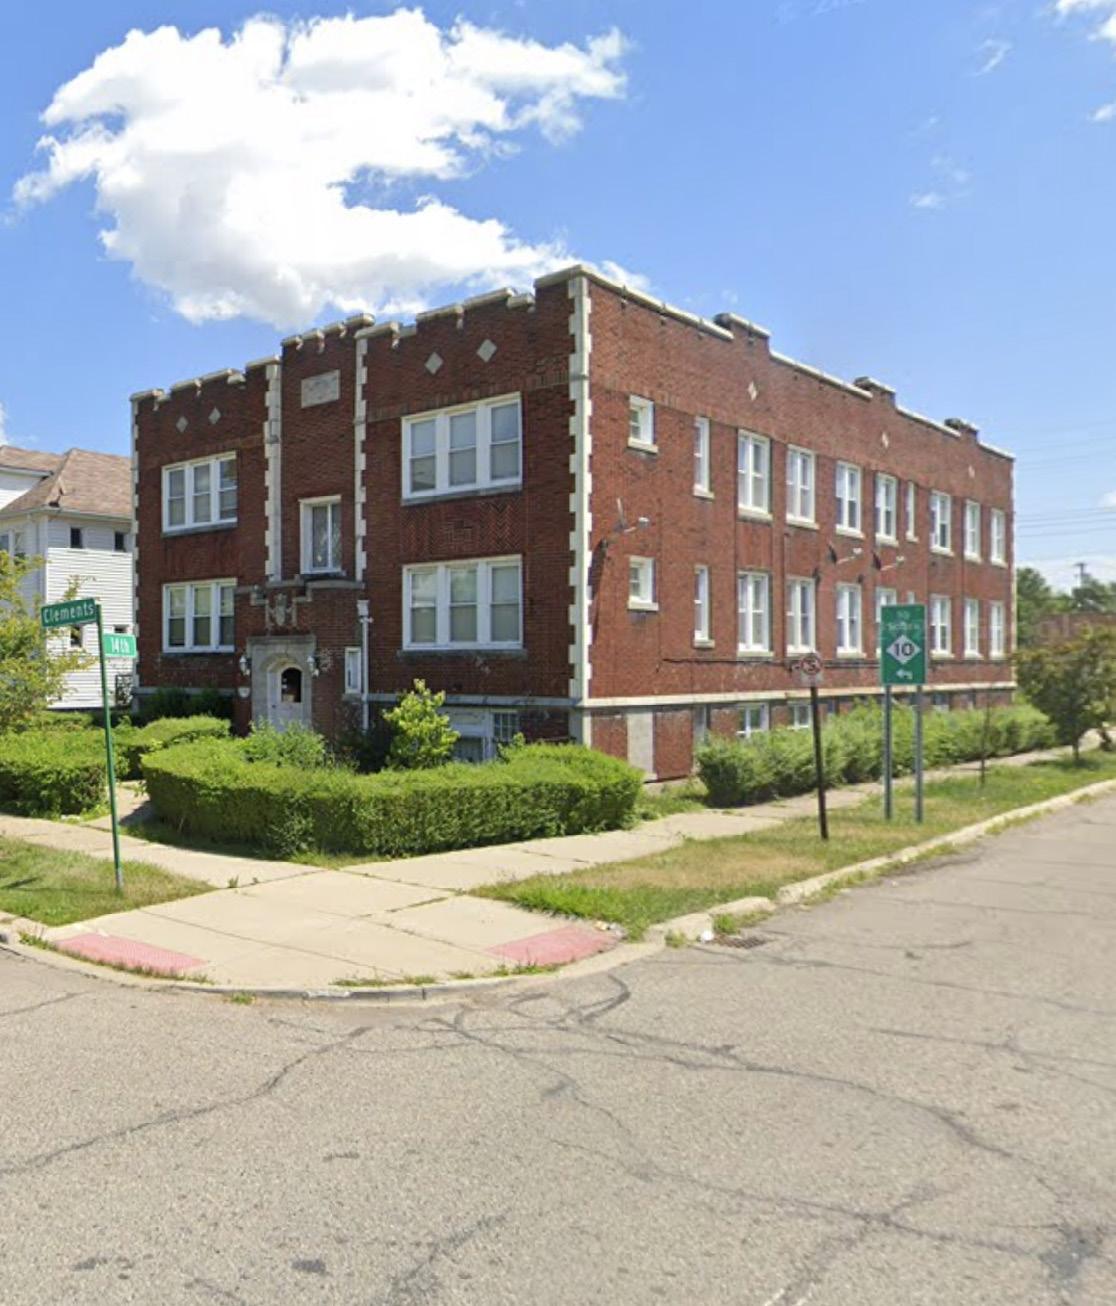
RENTAL REGISTRY * : Yes
CERT. OF COMPLIANCE * : No
ZONING DISTRICT * : R2
2055 CLEMENTS
TRANSACTION INFO
NO. OF SALES (2011-2022)*: 4
LAST SALE PRICE * : $0
LAST SALE PRICE PER UNIT * : $0
LAST SALE PRICE PER SQ. FEET * : $0
LAST SALE DATE * : 08/31/3030
CHANGE IN SALE PRICE: -$100,000
OWNER HISTORY (2011-2022)*:
• Major Holding LLC (2020-2022)
• Boone, Carl (2014-2020)
• Clements CRE 2055, LLC (2014)
SUPPLEMENTAL INFO
BUILDING PERMIT(S)+: No
VIOLATION(S)+: 0
YEAR BUILT * : 1927
SITE ACREAGE * : 0.13
• Lawyers Funding, LLC. (2014)
• Calloway, Martina (Estate) (2011-2014)
SOURCES
*CITY OF DETROIT OPEN DATA PORTAL +DATA DRIVEN DETROIT #REAL COMP MLS
COUNCIL DISTRICT * : 2
PROPERTY CONDITION: 4
SOURCES
*CITY OF DETROIT OPEN DATA PORTAL +DATA DRIVEN DETROIT #REAL COMP MLS
94 | Preserving Small Multi-Family NOAH Properties PROPERTY PROFILE | 95
Source: Regrid
$0 $20,000 $40,000 $60,000 $80,000 $100,000 $120,000 $140,000 $160,000 $180,000 5/9/2014 2/28/2014 2/24/2014 8/31/2020 Sale Price Date
July 2022, Google Street View
Sale Price NOAH Average Sale Price
(2011-2022)
July 2022, Google Street View
2201 CLEMENTS STREET
TYPOLOGY: Type 1
PROPERTY OWNER * : Lindsay, Essie
NO. OF UNITS#+: 2
2215 CLEMENTS STREET
TYPOLOGY: Type 2
PROPERTY OWNER * : Anderson, Anthony
NO. OF UNITS#+: 2
CURRENT CONDITIONS
TOTAL SQ. FEET * : 3,600
VACANCY %+: 0%
LISTED RENT#: Cannot Determine
ASSESSED VALUE * : $23,300
RENTAL REGISTRY * : No
CERT. OF COMPLIANCE * : No
ZONING DISTRICT * : R2
TRANSACTION INFO
NO. OF SALES (2011-2022)*: 0
LAST SALE PRICE * : Cannot Determine
LAST SALE PRICE PER UNIT * : Cannot Determine
LAST SALE PRICE PER SQ. FEET * : Cannot Determine
LAST SALE DATE * : Cannot Determine
CHANGE IN SALE PRICE: N/A
OWNER HISTORY (2011-2022)*:
• Lindsay, Essie (2011-2022)
SUPPLEMENTAL INFO
BUILDING PERMIT(S)+: No
VIOLATION(S)+: 0
YEAR BUILT * : 1924
SITE ACREAGE * : 0.144
COUNCIL DISTRICT * : 2
PROPERTY CONDITION: 4
CURRENT CONDITIONS
TOTAL SQ. FEET * : 3,600
VACANCY %+: 0
LISTED RENT#: Cannot Determine
ASSESSED VALUE * : $22,100
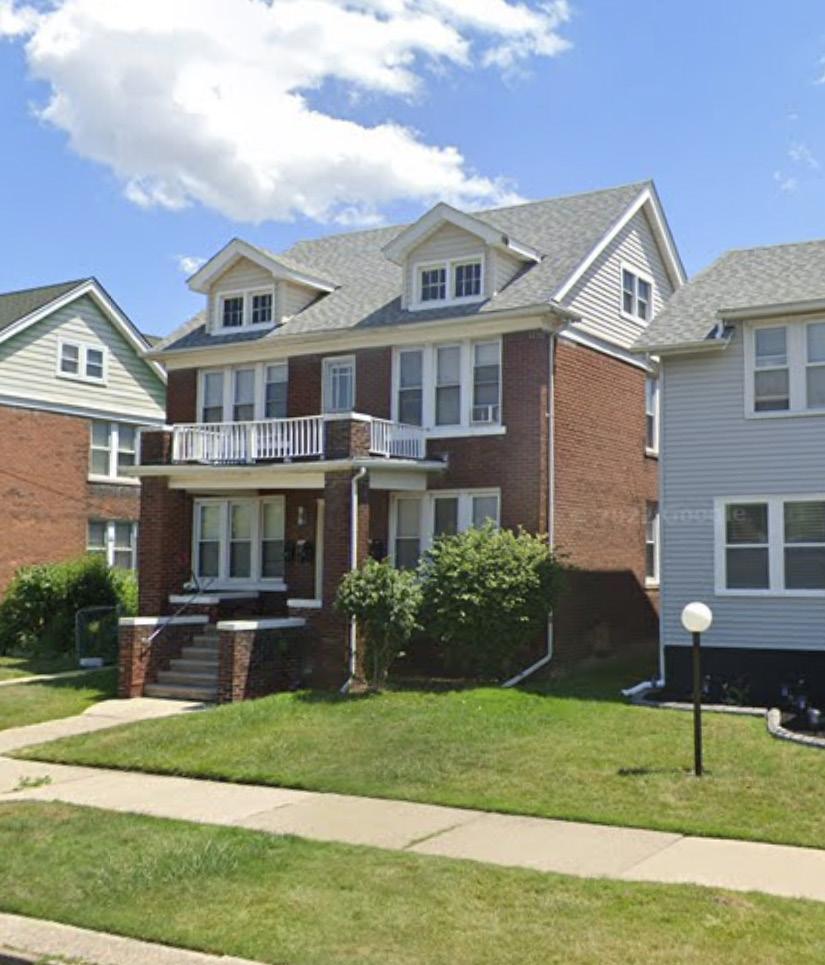
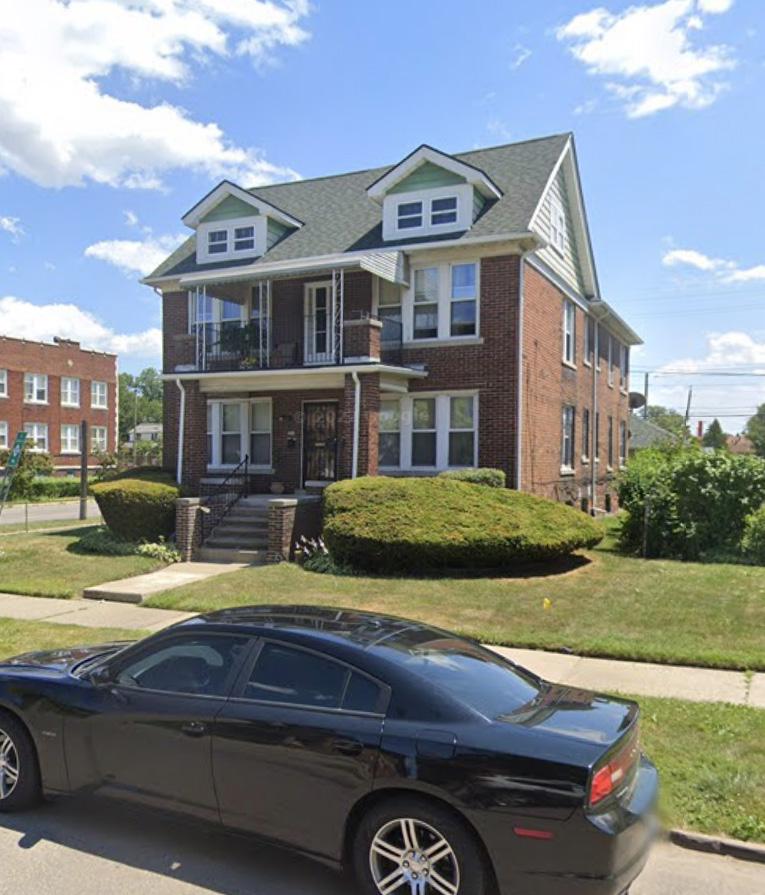
RENTAL REGISTRY * : Yes
CERT. OF COMPLIANCE * : No
ZONING DISTRICT * : R2
TRANSACTION INFO
NO. OF SALES (2011-2022)*: 0
LAST SALE PRICE * : $28,000
LAST SALE PRICE PER UNIT * : $14,000
LAST SALE PRICE PER SQ. FEET * : $7.78
LAST SALE DATE * : 05/01/1993
CHANGE IN SALE PRICE: N/A
OWNER HISTORY (2011-2022)*:
• Anderson, Anthony (2011-2022)
SUPPLEMENTAL INFO
BUILDING PERMIT(S)+: No
VIOLATION(S)+: 0
YEAR BUILT * : 1924
SITE ACREAGE * : 0.143
SOURCES
*CITY OF DETROIT OPEN DATA PORTAL +DATA DRIVEN DETROIT #REAL COMP MLS
COUNCIL DISTRICT * : 2
PROPERTY CONDITION: 3
SOURCES
*CITY OF DETROIT OPEN DATA PORTAL +DATA DRIVEN DETROIT #REAL COMP MLS
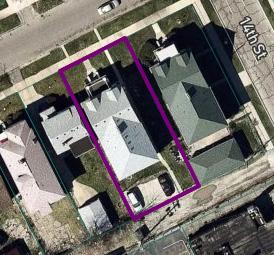
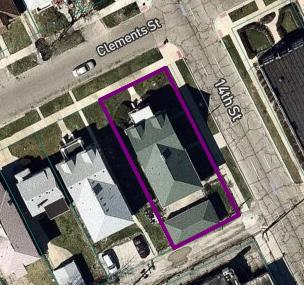
96 | Preserving Small Multi-Family NOAH Properties PROPERTY PROFILE | 97
July 2022, Google Street View
Source: Regrid
July 2022, Google Street View
Source: Regrid
2250 CLEMENTS STREET
TYPOLOGY: Type 2
PROPERTY OWNER * : Clements Street Realty, LLC
NO. OF UNITS#+: 4
CURRENT CONDITIONS
TOTAL SQ. FEET * : 3,456
VACANCY %+: 0%
LISTED RENT#: Cannot Determine
ASSESSED VALUE * : $16,900
RENTAL REGISTRY * : Yes
CERT. OF COMPLIANCE * : No
ZONING DISTRICT * : R2
2250 CLEMENTS
TRANSACTION INFO
NO. OF SALES (2011-2022)*: 2
LAST SALE PRICE * : $1
LAST SALE PRICE PER UNIT * : $0
LAST SALE PRICE PER SQ. FEET * : $0
LAST SALE DATE * : 01/27/2016
CHANGE IN SALE PRICE: -$9,999
OWNER HISTORY (2011-2022)*:
• Clements Street Realty, LLC (20162022)
2303 CLEMENTS STREET
TYPOLOGY: Type 1
PROPERTY OWNER * : Thomas, Kenneth
NO. OF UNITS#+: 4
CURRENT CONDITIONS
TOTAL SQ. FEET * : 4,132
VACANCY %+: 50%
LISTED RENT#: Cannot Determine
ASSESSED VALUE * : $20,100
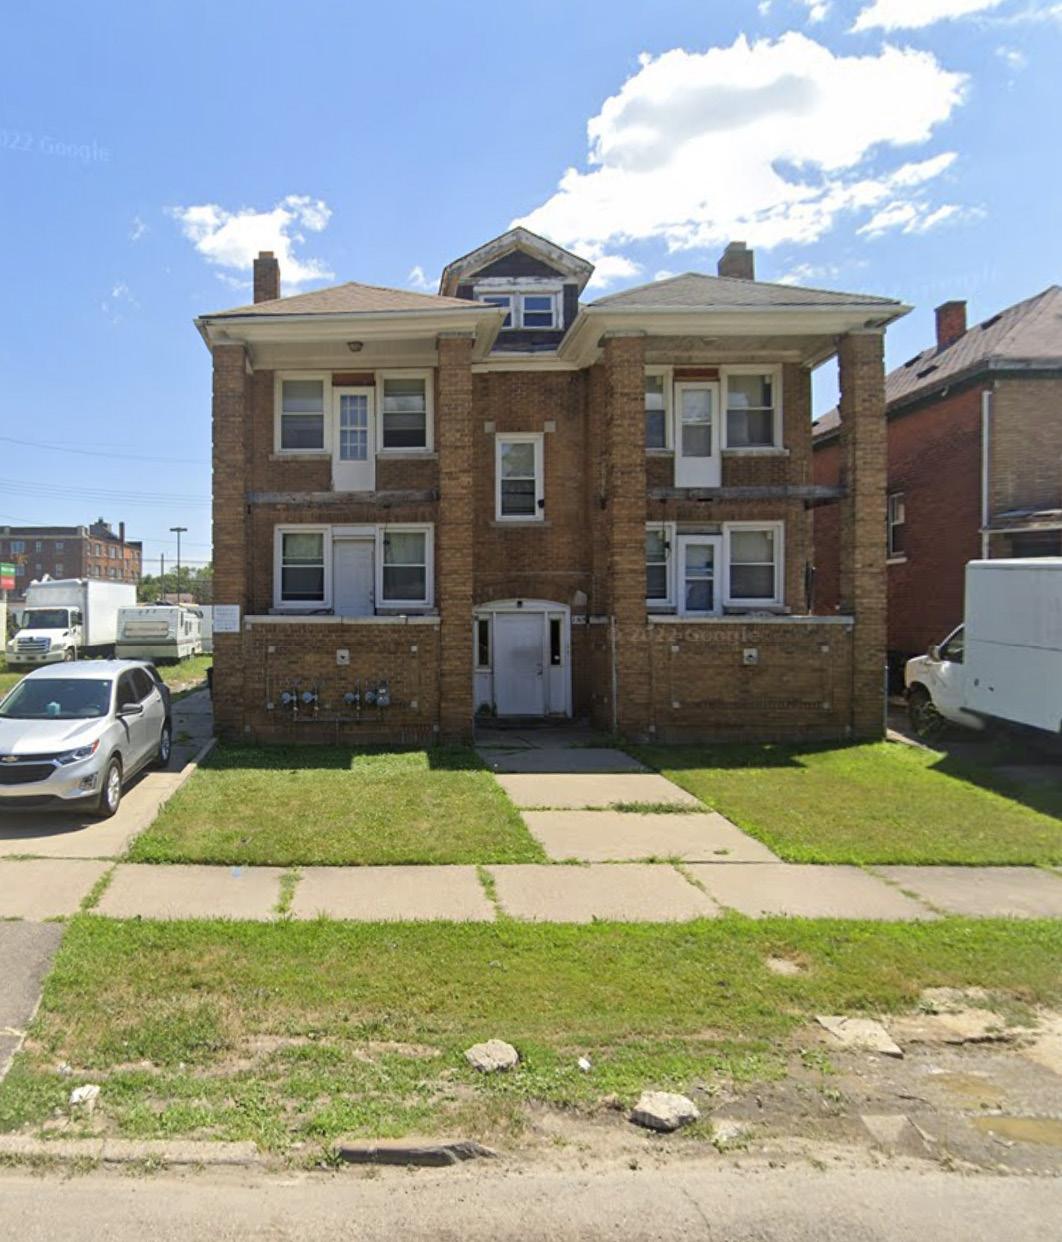
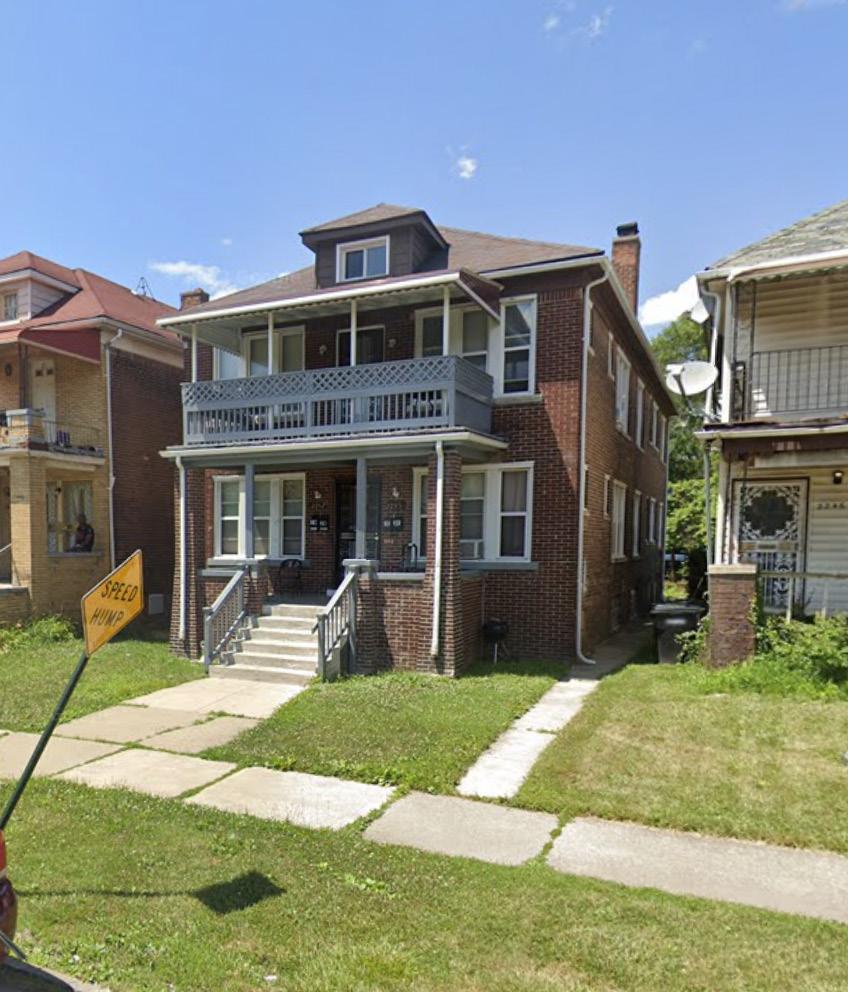
RENTAL REGISTRY * : No
CERT. OF COMPLIANCE * : No
ZONING DISTRICT * : R2
TRANSACTION INFO
NO. OF SALES (2011-2022)*: 0
LAST SALE PRICE * : $115,000
LAST SALE PRICE PER UNIT * : $28,750
LAST SALE PRICE PER SQ. FEET * : $27.83
LAST SALE DATE * : 05/15/2006
CHANGE IN SALE PRICE: N/A
OWNER HISTORY (2011-2022)*:
• Thomas, Kenneth (2011-2022)
Sale Price NOAH Average Sale Price (2011-2022)
SUPPLEMENTAL INFO
BUILDING PERMIT(S)+: No
VIOLATION(S)+: 0
YEAR BUILT * : 1924
SITE ACREAGE * : 0.096
COUNCIL DISTRICT * : 2
PROPERTY CONDITION: 4
• Ferguson, Taazlynne (2014-2016)
• Kimble, Tamekia (2011-2014)
SUPPLEMENTAL INFO
BUILDING PERMIT(S)+: Yes, 10/04/2019
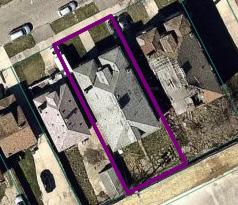
VIOLATION(S)+: 0
YEAR BUILT * : 1924
SITE ACREAGE * : 0.128
SOURCES
*CITY OF DETROIT OPEN DATA PORTAL +DATA DRIVEN DETROIT #REAL COMP MLS
COUNCIL DISTRICT * : 2
PROPERTY CONDITION: 3
SOURCES
*CITY OF DETROIT OPEN DATA PORTAL +DATA DRIVEN DETROIT #REAL COMP MLS
98 | Preserving Small Multi-Family NOAH Properties PROPERTY PROFILE | 99
$0 $20,000 $40,000 $60,000 $80,000 $100,000 $120,000 $140,000 $160,000 $180,000 12/12/2014
Sale Price Date
1/27/2016
July 2022, Google Street View
July 2022, Google Street View
Source: Regrid
2303 FORD STREET
TYPOLOGY: Type 1
PROPERTY OWNER * : 100 Doors
Holding, Inc
NO. OF UNITS#+: 4
CURRENT CONDITIONS
TOTAL SQ. FEET * : 2,650
VACANCY %+: 100%
LISTED RENT#: Cannot Determine
ASSESSED VALUE * : $12,800
RENTAL REGISTRY * : No
CERT. OF COMPLIANCE * : No
ZONING DISTRICT * : R2
2303 FORD
TRANSACTION INFO
NO. OF SALES (2011-2022)*: 1
LAST SALE PRICE * : $1
LAST SALE PRICE PER UNIT * : $0
LAST SALE PRICE PER SQ. FEET * : $0
LAST SALE DATE * : 04/30/2012
CHANGE IN SALE PRICE: N/A
OWNER HISTORY (2011-2022)*:
• Scott, Renia (2012-2022)
2310 PASADENA STREET
TYPOLOGY: Type 2
PROPERTY OWNER * : Edwards, Brenda & Stephanie
NO. OF UNITS#+: 4
CURRENT CONDITIONS
TOTAL SQ. FEET * : 3,534
VACANCY %+: 0%
LISTED RENT#: Cannot Determine
ASSESSED VALUE * : $22,000
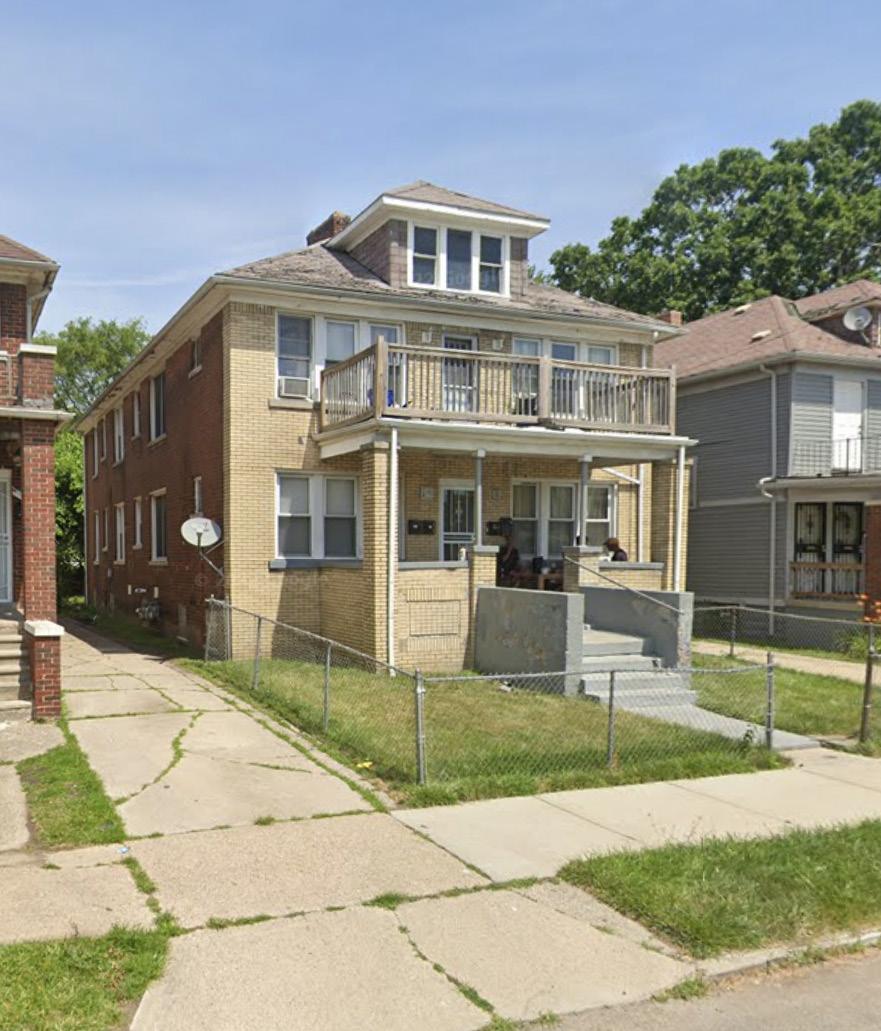
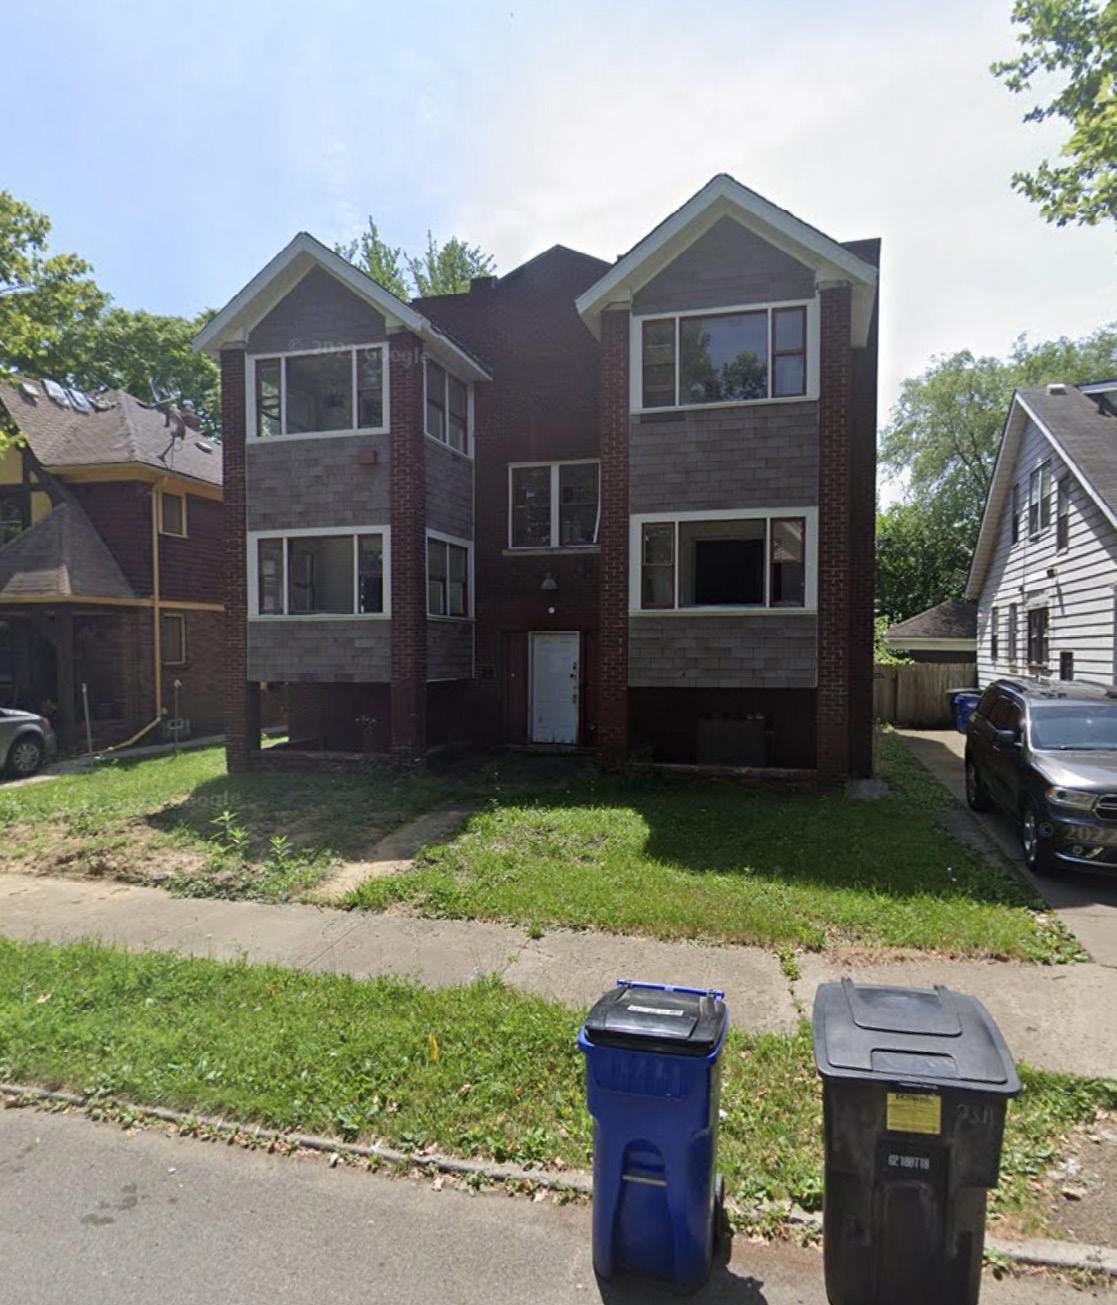
RENTAL REGISTRY * : Yes
CERT. OF COMPLIANCE * : No
ZONING DISTRICT * : R2
TRANSACTION INFO
NO. OF SALES (2011-2022)*: 1
LAST SALE PRICE * : $500
LAST SALE PRICE PER UNIT * : $125
LAST SALE PRICE PER SQ. FEET * : $0.14
LAST SALE DATE * : 06/02/2021
CHANGE IN SALE PRICE: N/A
OWNER HISTORY (2011-2022)*:
Sale Price NOAH Average Sale Price (2011-2022)
SUPPLEMENTAL INFO
BUILDING PERMIT(S)+: No
VIOLATION(S)+: 0
YEAR BUILT * : 1930
SITE ACREAGE * : 0.103
COUNCIL DISTRICT * : 2
PROPERTY CONDITION: 1
• Genesis One Youth Transitional Home (2011-2012)
SUPPLEMENTAL INFO
BUILDING PERMIT(S)+: No
VIOLATION(S)+: 0
YEAR BUILT * : 1924
SITE ACREAGE * : 0.114
• Edward, Brenda & Stephanie (20212022)
• Edwards, George (2011-2021)
SOURCES
*CITY OF DETROIT OPEN DATA PORTAL +DATA DRIVEN DETROIT #REAL COMP MLS
COUNCIL DISTRICT * : 2
PROPERTY CONDITION: 3
SOURCES
*CITY OF DETROIT OPEN DATA PORTAL +DATA DRIVEN DETROIT #REAL COMP MLS
100 | Preserving Small Multi-Family NOAH Properties PROPERTY PROFILE | 101
$0 $20,000 $40,000 $60,000 $80,000 $100,000 $120,000 $140,000 $160,000 $180,000
Sale Price Date
4/30/2012
$0 $20,000 $40,000 $60,000 $80,000 $100,000 $120,000 $140,000 $160,000 $180,000 6/2/2021 Sale Price Date
July 2022, Google Street View
Sale Price NOAH Average Sale Price (2011-2022)
2310 PASADENA
July 2022, Google Street View
2340 CLEMENTS STREET
TYPOLOGY: Type 2
PROPERTY OWNER * : Roberson, C G & W J
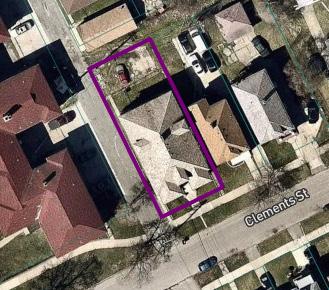
NO. OF UNITS#+: 4
CURRENT CONDITIONS
TOTAL SQ. FEET * : 4,800
VACANCY %+: 75%
LISTED RENT#: Cannot Determine
ASSESSED VALUE * : $28,900
RENTAL REGISTRY * : Yes
CERT. OF COMPLIANCE * : No
ZONING DISTRICT * : R2
TRANSACTION INFO
NO. OF SALES (2011-2022)*: 0
LAST SALE PRICE * : $13,500
LAST SALE PRICE PER UNIT * : $3,375
LAST SALE PRICE PER SQ. FEET * : $2.81
LAST SALE DATE * : 04/01/1993
CHANGE IN SALE PRICE: N/A
OWNER HISTORY (2011-2022)*:
• Roberson, C G & W J (2011-2022)
2340 W GRAND
TYPOLOGY: Type 1
PROPERTY OWNER * : Global Land And Property Dev Et Al
NO. OF UNITS#+: 4
CURRENT CONDITIONS
TOTAL SQ. FEET * : 3,420
VACANCY %+: 0%
LISTED RENT#: $750
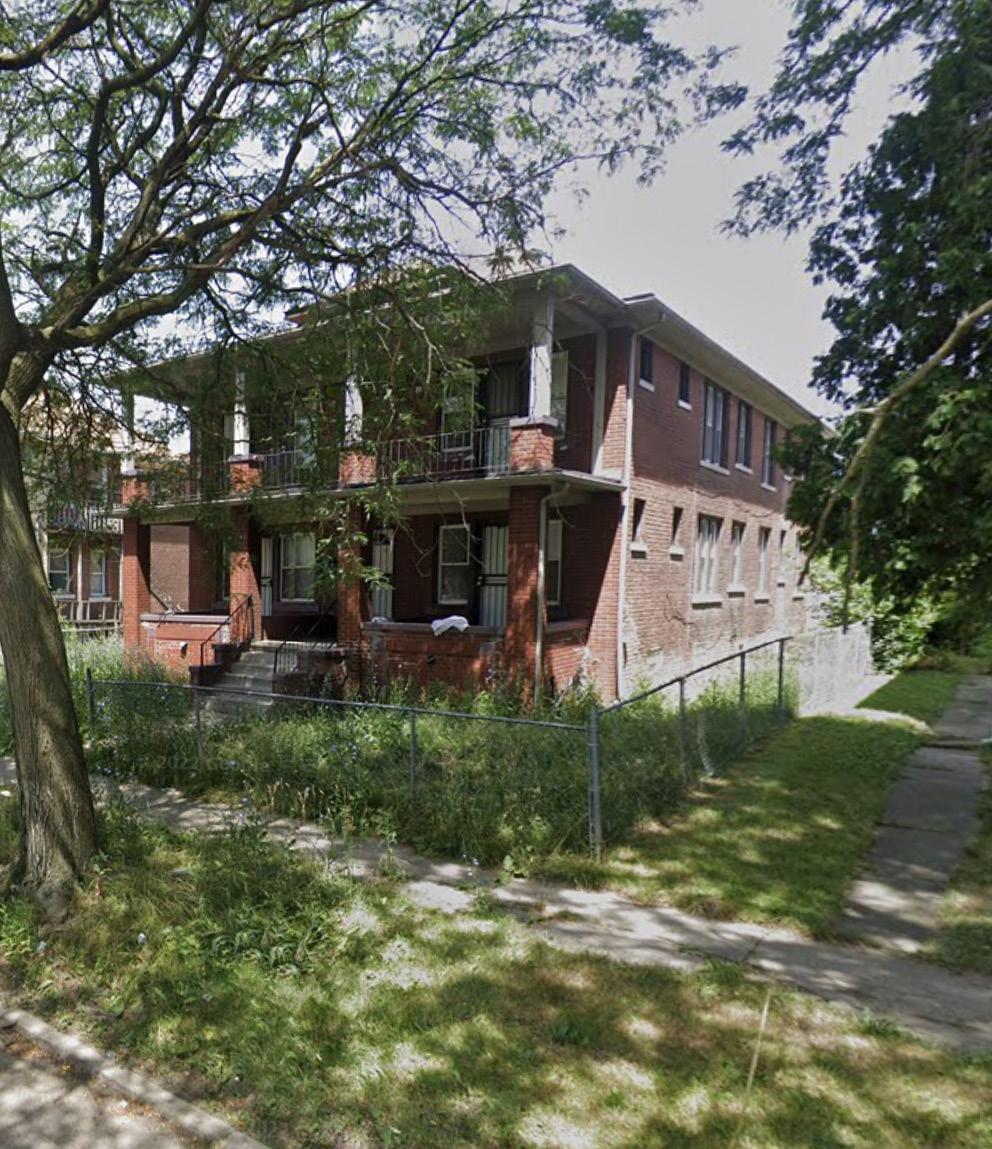
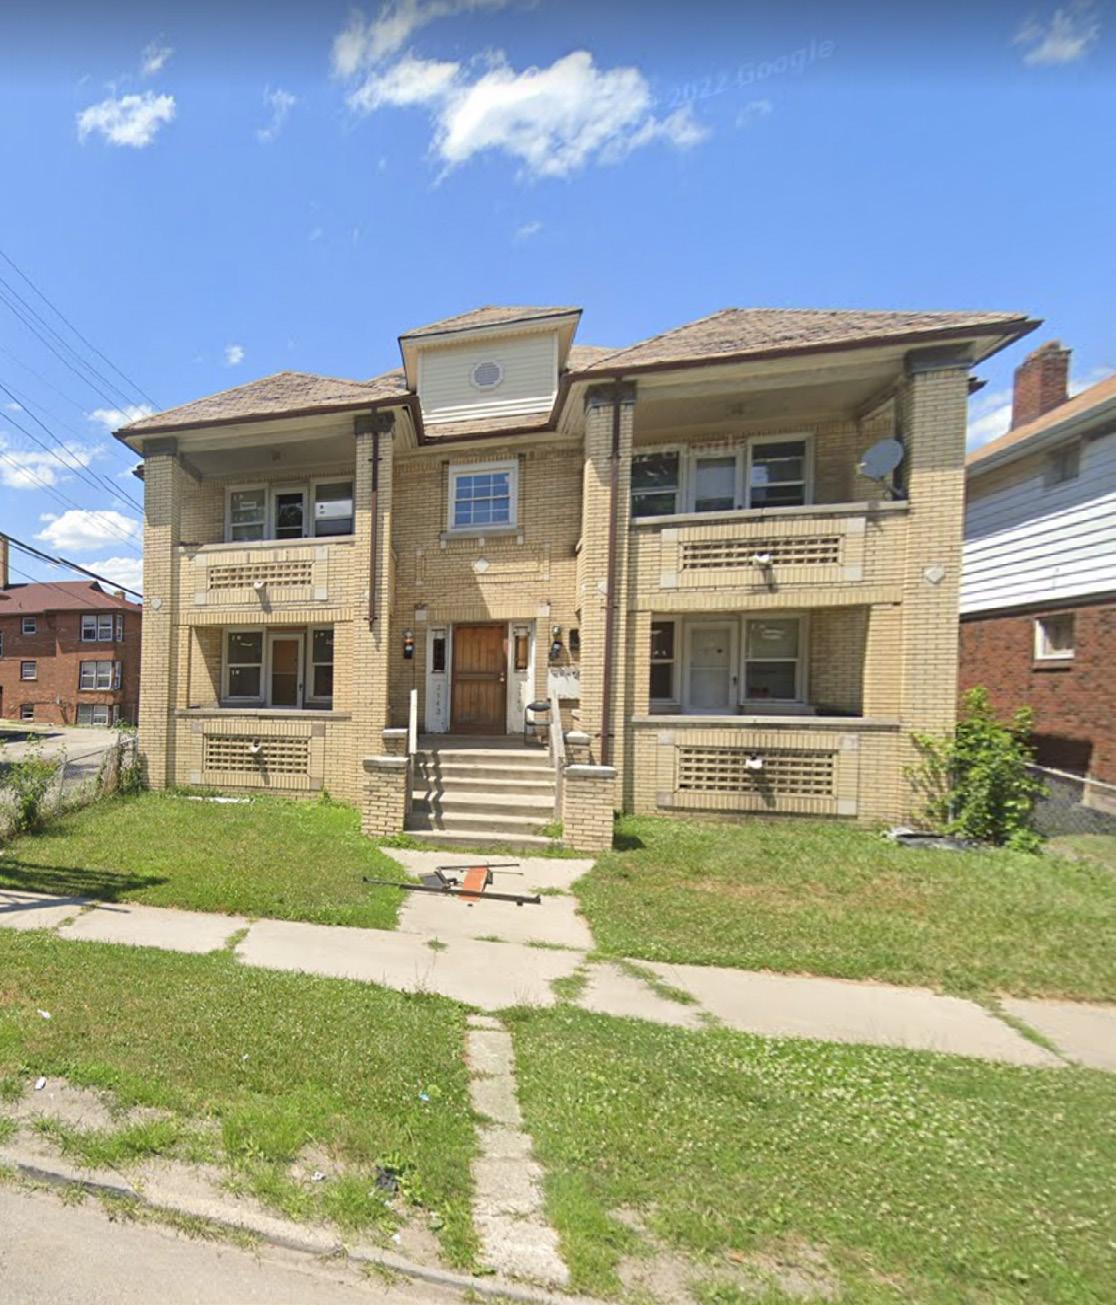
ASSESSED VALUE * : $21,800
RENTAL REGISTRY * : No
CERT. OF COMPLIANCE * : No
ZONING DISTRICT * : R2
STREET
SUPPLEMENTAL INFO
BUILDING PERMIT(S)+: No
VIOLATION(S)+: 0
YEAR BUILT * : 1925
SITE ACREAGE * : 0.135
COUNCIL DISTRICT * : 2
PROPERTY CONDITION: 3
SUPPLEMENTAL INFO
BUILDING PERMIT(S)+: No
VIOLATION(S)+: 0
YEAR BUILT * : 1926
SITE ACREAGE * : 0.117
TRANSACTION INFO
NO. OF SALES (2011-2022)*: 3
LAST SALE PRICE * : $210,000
LAST SALE PRICE PER UNIT * : $52,500
LAST SALE PRICE PER SQ. FEET * : $61.40
LAST SALE DATE * : 06/01/2022
CHANGE IN SALE PRICE: $210,000
OWNER HISTORY (2011-2022)*:
• The Tang-Bo Family Living Trust (2022)
• Global Land And Property Development (2019-2022)
• Mega Management Group LLC +
Duplido Properties 2018 LLC (20182019)
• Brown, Pascal (2011-2018)
SOURCES
*CITY OF DETROIT OPEN DATA PORTAL +DATA DRIVEN DETROIT #REAL COMP MLS
COUNCIL DISTRICT * : 2
PROPERTY CONDITION: 4
SOURCES
*CITY OF DETROIT OPEN DATA PORTAL +DATA DRIVEN DETROIT #REAL COMP MLS
102 | Preserving Small Multi-Family NOAH Properties PROPERTY PROFILE | 103
Source: Regrid
$0 $50,000 $100,000 $150,000 $200,000 $250,000 10/12/2018 11/22/2019 6/1/2022 Sale Price Date 2340 GRAND Sale Price NOAH Average Sale Price (2011-2022)
July 2022, Google Street View
July 2022, Google Street View
2341 EWALD CIRCLE
TYPOLOGY: Type 1
PROPERTY OWNER * : Aboloshi, Fahid M E A M
NO. OF UNITS#+: 8
CURRENT CONDITIONS
TOTAL SQ. FEET * : 3,650
VACANCY %+: 50%
LISTED RENT#: Cannot Determine
ASSESSED VALUE * : $41,400
RENTAL REGISTRY * : No
CERT. OF COMPLIANCE * : No
ZONING DISTRICT * : R3
2341 EWALD CIRCLE
TRANSACTION INFO
NO. OF SALES (2011-2022)*: 3
LAST SALE PRICE * : $120,000
LAST SALE PRICE PER UNIT * : $15,000
LAST SALE PRICE PER SQ. FEET * : $32.88
LAST SALE DATE * : 01/15/2014
CHANGE IN SALE PRICE: $120,000
OWNER HISTORY (2011-2022)*:
• Aboloshi, Fahid M E A M (2014-2022)
• Blackwater Consulting LLC (2014)
2545 FORD STREET
TYPOLOGY: Type 2
PROPERTY OWNER * : Fauvel
Gouraud Distribution NO. OF UNITS#+: 20
CURRENT CONDITIONS
TOTAL SQ. FEET * : 106,913
VACANCY %+: 35%
LISTED RENT#: $550
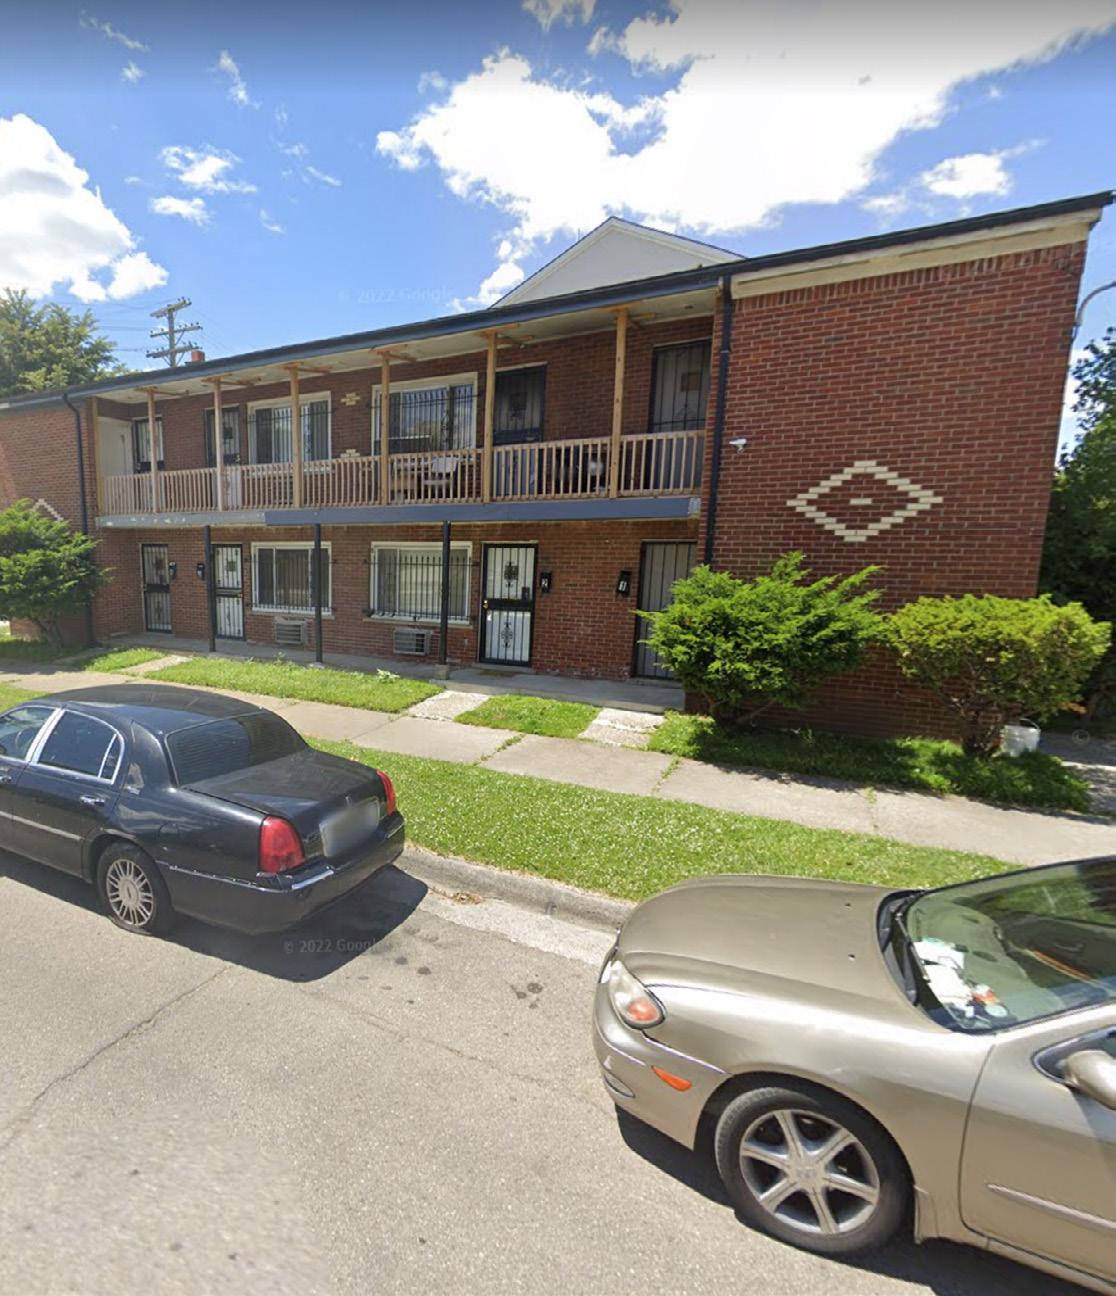
ASSESSED VALUE * : $411,700
RENTAL REGISTRY * : Yes
CERT. OF COMPLIANCE * : No
ZONING DISTRICT * : B4
TRANSACTION INFO
NO. OF SALES (2011-2022)*: 4
LAST SALE PRICE * : $221,000
LAST SALE PRICE PER UNIT * : $11,050
LAST SALE PRICE PER SQ. FEET * : $2.07
LAST SALE DATE * : 09/20/2017
CHANGE IN SALE PRICE: $254,999
OWNER HISTORY (2011-2022)*:
• Fauvel Gouraud Distribution (2017-2022)
• 2545 Ford Street, LLC (2016-2017)
Sale Price NOAH Average Sale Price (2011-2022)
SUPPLEMENTAL INFO
BUILDING PERMIT(S)+: No
VIOLATION(S)+: 15 (2018)
YEAR BUILT * : 1956
SITE ACREAGE * : 0.094
COUNCIL DISTRICT * : 2
PROPERTY CONDITION: 4
• Bridge Hampton Limited LLC (20132014)
• Huntley Properties LLC (2011-2013)
SUPPLEMENTAL INFO
BUILDING PERMIT(S)+: No
VIOLATION(S)+: 2 (2016)
YEAR BUILT * : 1927
SITE ACREAGE * : 0.204
• Asset LLC, 2545 Ford Street T et al + The 2545 Ford Street Strust (2015-2016)
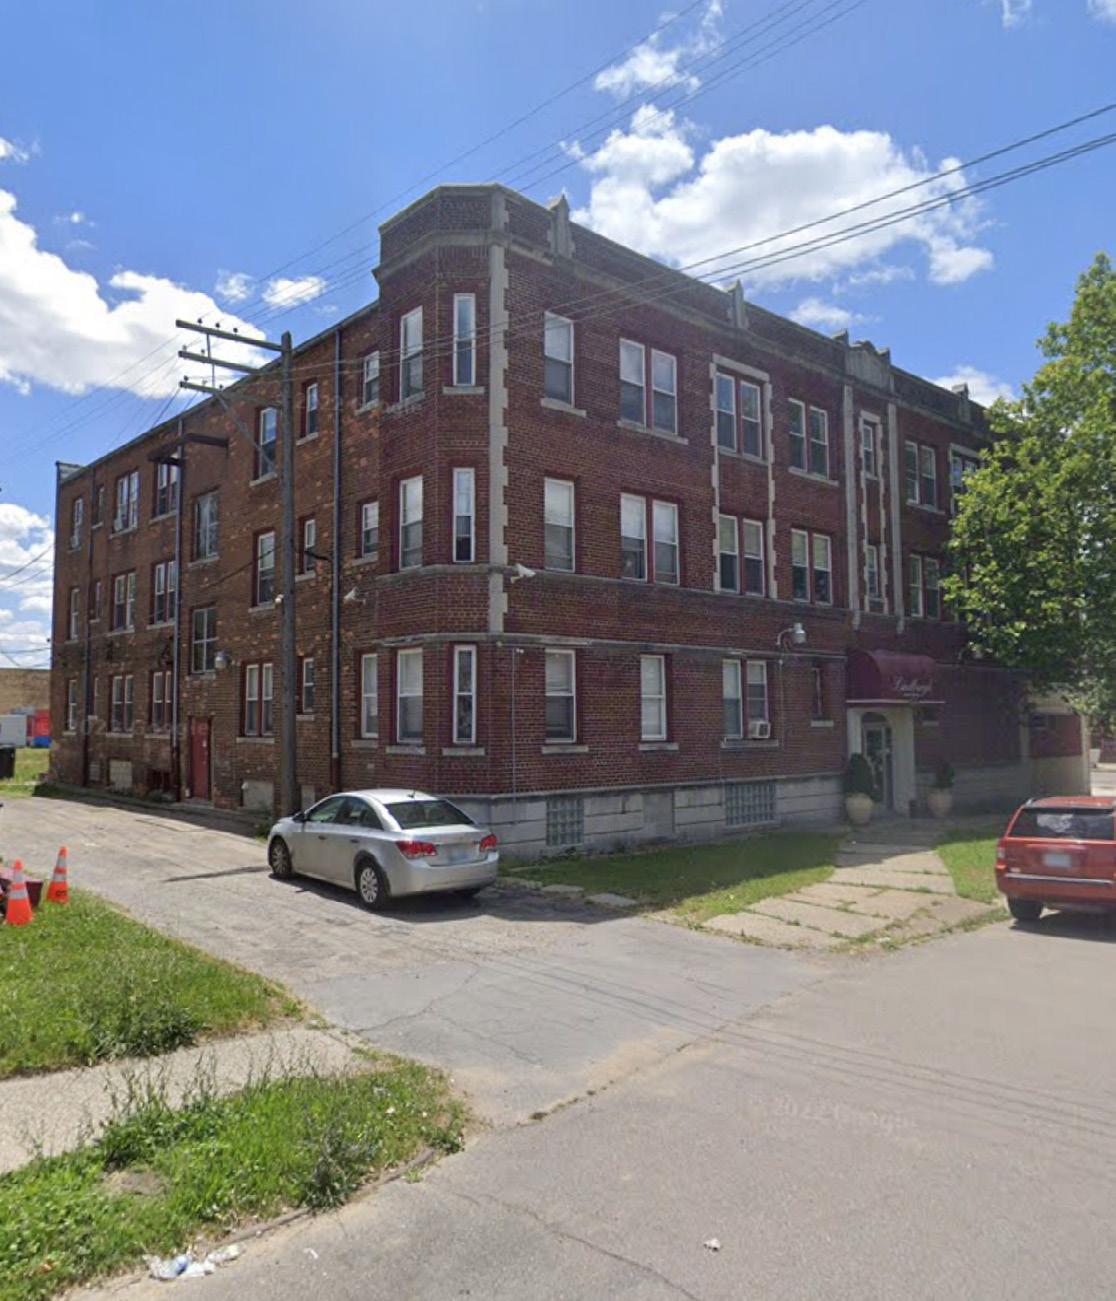
• R S Richmond Inv LLC/ Siberian LLC, Lindbergh Apart et al (2012-2015)
• Romero, Manuel (2011-2012)
SOURCES
*CITY OF DETROIT OPEN DATA PORTAL +DATA DRIVEN DETROIT #REAL COMP MLS
COUNCIL DISTRICT * : 2
PROPERTY CONDITION: 4
SOURCES
*CITY OF DETROIT OPEN DATA PORTAL +DATA DRIVEN DETROIT #REAL COMP MLS
104 | Preserving Small Multi-Family NOAH Properties PROPERTY PROFILE | 105
$0 $20,000 $40,000 $60,000 $80,000 $100,000 $120,000 $140,000 $160,000 $180,000 10/1/2013 1/13/2014 1/15/2014 Sale Price Date
$0 $50,000 $100,000 $150,000 $200,000 $250,000 $300,000 3/25/2012 5/4/2015 4/15/2016 9/20/2017 Sale Price Date 2545 FORD Sale Price NOAH Average Sale Price (2011-2022)
June 2022, Google Street View
June 2022, Google Street View
2671 EWALD CIRCLE
TYPOLOGY: Type 3
PROPERTY OWNER * : ACP Oakman
LLC
NO. OF UNITS#+: 12
2701 EWALD CIRCLE
TYPOLOGY: Type 1
PROPERTY OWNER * : Dungey, David & Jennifer
NO. OF UNITS#+: 7
CURRENT CONDITIONS
CURRENT CONDITIONS
TOTAL SQ. FEET * : 8,476
VACANCY %+: 0%
LISTED RENT#: Cannot Determine
ASSESSED VALUE * : $144,900
RENTAL REGISTRY * : Yes
CERT. OF COMPLIANCE * : Yes
ZONING DISTRICT * : R3
2671 EWALD CIRCLE
11/24/2014
Sale Price NOAH Average Sale Price (2011-2022)
SUPPLEMENTAL INFO
SUPPLEMENTAL INFO
BUILDING PERMIT(S)+: No
VIOLATION(S)+: 1 (2016)
YEAR BUILT * : 1947
SITE ACREAGE * : 0.373
COUNCIL DISTRICT * : 7
PROPERTY CONDITION: 4
TRANSACTION INFO
TRANSACTION INFO
NO. OF SALES (2011-2021)*: 1
LAST SALE PRICE * : $1,900,000
LAST SALE PRICE PER UNIT * : $158,333
LAST SALE PRICE PER SQ. FEET * : $224.16
LAST SALE DATE * : 11/24/2014
CHANGE IN SALE PRICE: N/A
OWNER HISTORY (2011-2022)*:
• ACP Oakman LLC (2014-2022)
• Interim Holdings, LLC (2011-2014)
SOURCES
*CITY OF DETROIT OPEN DATA PORTAL +DATA DRIVEN DETROIT #REAL COMP MLS
CURRENT CONDITIONS
CURRENT CONDITIONS
TOTAL SQ. FEET * : 6,048
VACANCY %+: 0%
LISTED RENT#: Cannot Determine
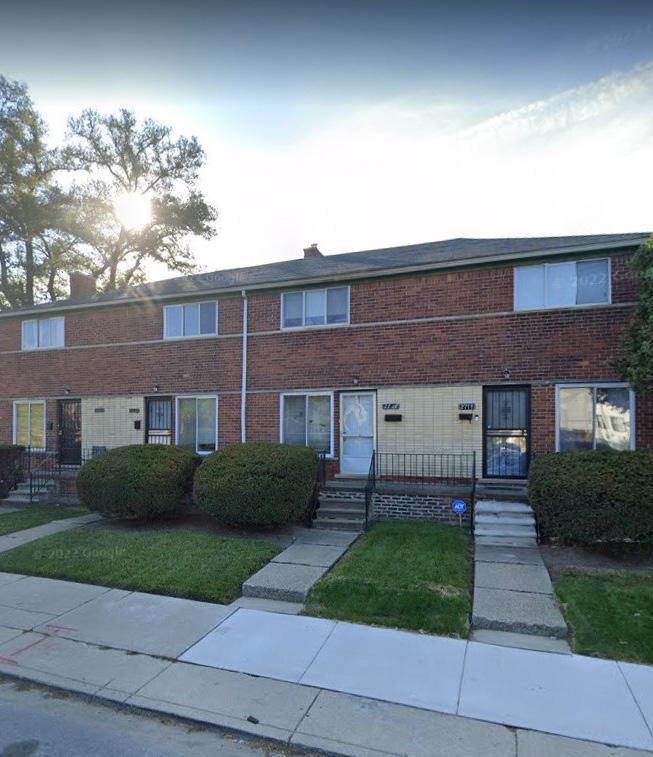
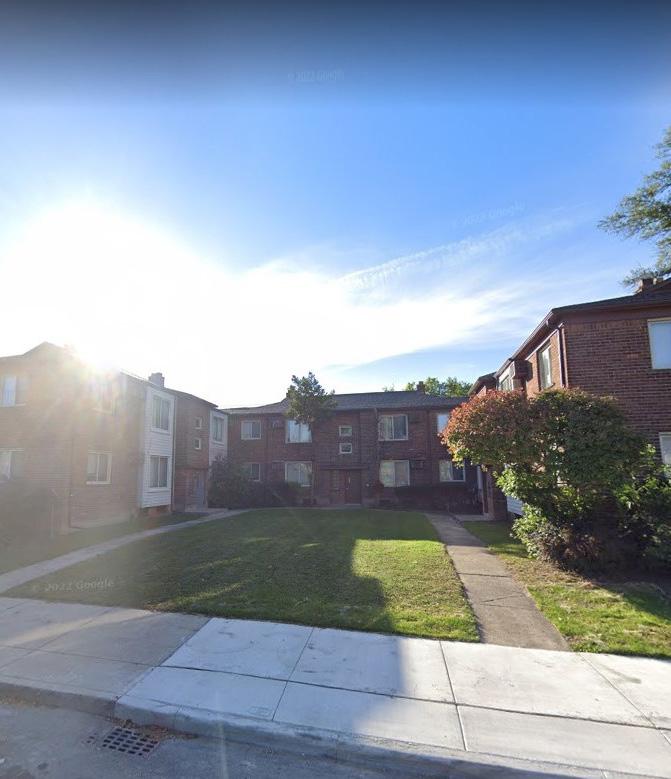
ASSESSED VALUE * : $103,200
RENTAL REGISTRY * : No
CERT. OF COMPLIANCE * : No
ZONING DISTRICT * : R3
TRANSACTION INFO
TRANSACTION INFO
NO. OF SALES (2011-2021)*: 1
LAST SALE PRICE * : $166,500
LAST SALE PRICE PER UNIT * : $23,786
LAST SALE PRICE PER SQ. FEET * : $27.53
LAST SALE DATE * : 10/3/2014
CHANGE IN SALE PRICE: N/A
OWNER HISTORY (2011-2022)*:
• Dungey, David & Jennifer (2014-2022)
• Hutson, Oscar L & Barbara, Shurman (2011-2014)
SUPPLEMENTAL INFO
SUPPLEMENTAL INFO
BUILDING PERMIT(S)+: No
VIOLATION(S)+: 0
YEAR BUILT * : 1952
SITE ACREAGE * : 0.24
COUNCIL DISTRICT * : 7
PROPERTY CONDITION: 3
SOURCES
*CITY OF DETROIT OPEN DATA PORTAL +DATA DRIVEN DETROIT #REAL COMP MLS
106 | Preserving Small Multi-Family NOAH Properties PROPERTY PROFILE | 107
figure/chart $0 $200,000 $400,000 $600,000 $800,000 $1,000,000 $1,200,000 $1,400,000 $1,600,000 $1,800,000 $2,000,000
Sale Price Date
October 2022, Google Street View
figure/chart $165,000 $165,500 $166,000 $166,500 $167,000 $167,500 $168,000 $168,500 $169,000 10/3/2014 Sale Price Date
Sale Price NOAH Average Sale Price (2011-2022)
2701 EWALD CIRCLE
October 2022, Google Street View
2710 KENDALL
TYPOLOGY: Type 3
PROPERTY OWNER * : RS Richmond Properties LLC
NO. OF UNITS#+: 16
CURRENT CONDITIONS
TOTAL SQ. FEET * : 13,874
VACANCY %+: 0%
LISTED RENT#: Cannot Determine
ASSESSED VALUE * : $183,500
RENTAL REGISTRY * : No
CERT. OF COMPLIANCE * : No
ZONING DISTRICT * : R3
TRANSACTION INFO
NO. OF SALES (2011-2021)*: 1
LAST SALE PRICE * : $0
LAST SALE PRICE PER UNIT * : $0
LAST SALE PRICE PER SQ. FEET * : $0
LAST SALE DATE * : 4/15/2015
CHANGE IN SALE PRICE: N/A
OWNER HISTORY (2011-2022)*:
• PS Davison Mangement Group LLC (2015-2022)
SUPPLEMENTAL INFO
BUILDING PERMIT(S)+: No
VIOLATION(S)+: 27 (2017)
YEAR BUILT * : 1948
SITE ACREAGE * : 0.413
COUNCIL DISTRICT * : 2
PROPERTY CONDITION: 3
2723 EWALD CIRCLE
TYPOLOGY: Type 2
PROPERTY OWNER * : ACP Oakman
LLC
NO. OF UNITS#+: 19
• RS Richmond Properties LLC (20112015)
SOURCES
*CITY OF DETROIT OPEN DATA PORTAL +DATA DRIVEN DETROIT #REAL COMP MLS
CURRENT CONDITIONS
CURRENT CONDITIONS
TOTAL SQ. FEET * : 16,221
VACANCY %+: 0%
LISTED RENT#: Cannot Determine
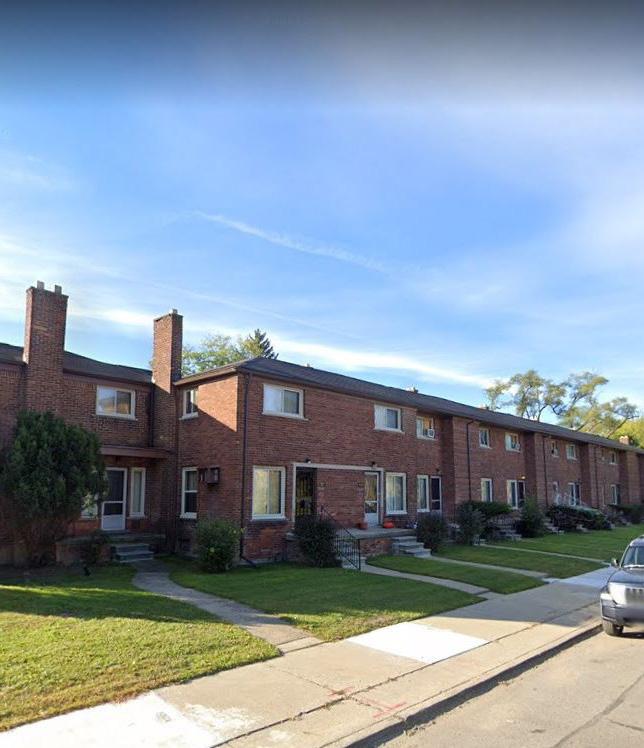
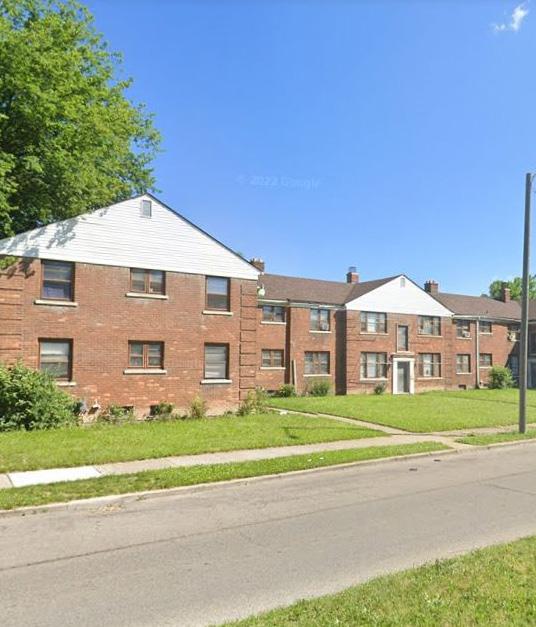
ASSESSED VALUE * : $225,400
RENTAL REGISTRY * : Yes
CERT. OF COMPLIANCE * : No
ZONING DISTRICT * : R3
TRANSACTION INFO
TRANSACTION INFO
NO. OF SALES (2011-2022)*: 0
LAST SALE PRICE * : $1,900,000
LAST SALE PRICE PER UNIT * : $100,000
LAST SALE PRICE PER SQ. FEET * : $117.13
LAST SALE DATE * : 11/24/2014
CHANGE IN SALE PRICE: N/A
OWNER HISTORY (2011-2022)*:
• ACP Oakman LLC (2014-2022)
• Interim Holdings, LLC (2011-2014)
SUPPLEMENTAL INFO
SUPPLEMENTAL INFO
BUILDING PERMIT(S)+: No
VIOLATION(S)+: 1 (2016)
YEAR BUILT * : 1951
SITE ACREAGE * : 0.648
COUNCIL DISTRICT * : 7
PROPERTY CONDITION: 3
SOURCES
*CITY OF DETROIT OPEN DATA PORTAL +DATA DRIVEN DETROIT #REAL COMP MLS
108 | Preserving Small Multi-Family NOAH Properties PROPERTY PROFILE | 109
figure/chart $0 $20,000 $40,000 $60,000 $80,000 $100,000 $120,000 $140,000 $160,000 $180,000 4/1/2015 Sale Price Date 2710
Sale Price NOAH Average Sale Price (2011-2022)
2022,
figure/chart $0 $200,000 $400,000 $600,000 $800,000 $1,000,000 $1,200,000 $1,400,000 $1,600,000 $1,800,000 $2,000,000 11/24/2014 Sale Price Date
KENDALL
June
Google Street View
Sale Price NOAH Average Sale Price (2011-2022)
2723 EWALD CIRCLE
October 2022, Google Street View
2750 EWALD CIRCLE
TYPOLOGY: Type 3
PROPERTY OWNER * : ACP Oakman
LLC
NO. OF UNITS#+: 8
CURRENT CONDITIONS
TOTAL SQ. FEET * : 6,109
VACANCY %+: 0%
LISTED RENT#: Cannot Determine
ASSESSED VALUE * : $100,900
RENTAL REGISTRY * : Yes
CERT. OF COMPLIANCE * : Yes
ZONING DISTRICT * : R3
TRANSACTION INFO
NO. OF SALES (2011-2022)*: 1
LAST SALE PRICE * : $10
LAST SALE PRICE PER UNIT * : $1.25
LAST SALE PRICE PER SQ. FEET * : $0.002
LAST SALE DATE * : 4/15/2014 CHANGE IN SALE PRICE: N/A
OWNER HISTORY (2011-2022)*:
• Interim Holdings, LLC (2014-2022)
• Interim Capital, LLC (2011-2014)
SUPPLEMENTAL INFO
BUILDING PERMIT(S)+: No
VIOLATION(S)+: 2 (2016)
YEAR BUILT * : 1947
SITE ACREAGE * : 0.244
COUNCIL DISTRICT * : 7
PROPERTY CONDITION: 3
2880 EWALD CIRCLE
TYPOLOGY: Type 1
PROPERTY OWNER * : Hobbs, James
NO. OF UNITS#+: 19
CURRENT CONDITIONS
TOTAL SQ. FEET * : 15,323
VACANCY %+: 0%
LISTED RENT#: Cannot Determine
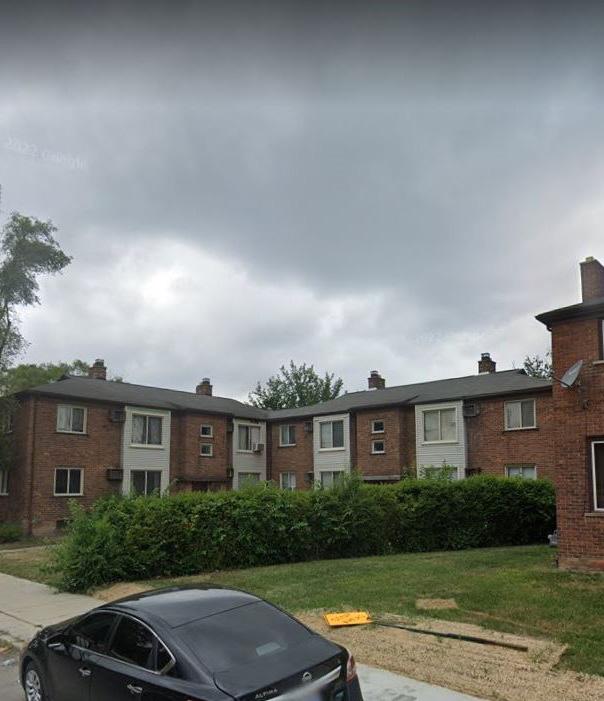
ASSESSED VALUE * : $245,800
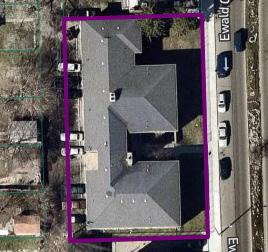
RENTAL REGISTRY * : No
CERT. OF COMPLIANCE * : No
ZONING DISTRICT * : R3
June 2022, Google Street View
TRANSACTION INFO
NO. OF SALES (2011-2022)*: 0
LAST SALE PRICE * : $85,000
LAST SALE PRICE PER UNIT * : $4,473.68
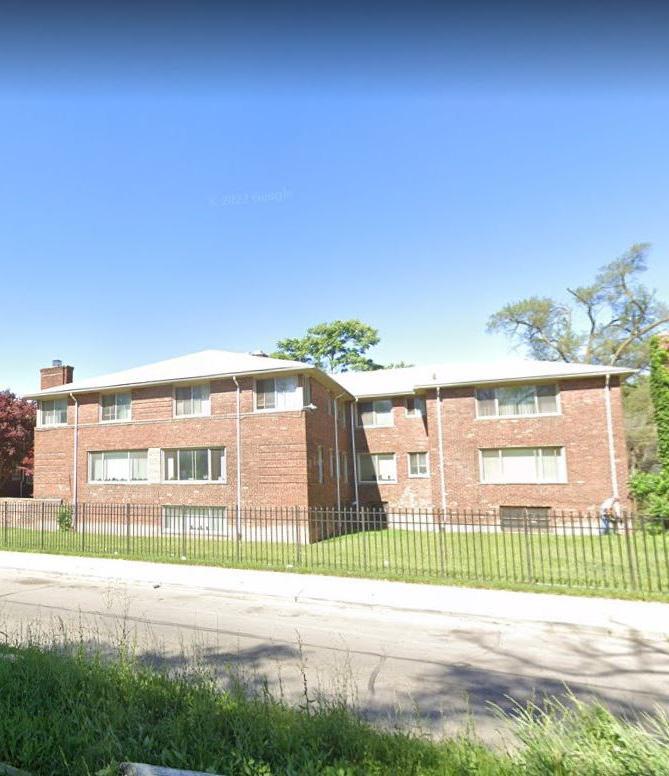
LAST SALE PRICE PER SQ. FEET * : $5.55
LAST SALE DATE * : 2/1/1989
CHANGE IN SALE PRICE: N/A
OWNER HISTORY (2011-2022)*:
• Hobbs, James (2011-2022)
Source: Regrid
SUPPLEMENTAL INFO
BUILDING PERMIT(S)+: No
VIOLATION(S)+: 11 (2018)
YEAR BUILT * : 1946
SITE ACREAGE * : 0.369
SOURCES
*CITY OF DETROIT OPEN DATA PORTAL +DATA DRIVEN DETROIT #REAL COMP MLS
COUNCIL DISTRICT * : 7
PROPERTY CONDITION: 4
SOURCES
*CITY OF DETROIT OPEN DATA PORTAL +DATA DRIVEN DETROIT #REAL COMP MLS
110 | Preserving Small Multi-Family NOAH Properties PROPERTY PROFILE | 111
figure/chart $0 $20,000 $40,000 $60,000 $80,000 $100,000 $120,000 $140,000 $160,000 $180,000 4/15/2014 Sale Price Date 2750 EWALD CIRCLE Sale Price NOAH Average Sale Price
August 2022, Google Street View
(2011-2022)
2945 W GRAND STREET
TYPOLOGY: Type 2
PROPERTY OWNER * : Sikui Housing Group 2 LLC
NO. OF UNITS#+: 4
CURRENT CONDITIONS
TOTAL SQ. FEET * : 4,144
VACANCY %+: 0%
LISTED RENT#: Cannot Determine
ASSESSED VALUE * : $25,200
RENTAL REGISTRY * : Yes
CERT. OF COMPLIANCE * : No
ZONING DISTRICT * : R2
2945 GRAND
TRANSACTION INFO
NO. OF SALES (2011-2022)*: 3
LAST SALE PRICE * : $100,000
LAST SALE PRICE PER UNIT * : $25,000
LAST SALE PRICE PER SQ. FEET * : $24.13
LAST SALE DATE * : 3/8/2019
CHANGE IN SALE PRICE: $ 37,500
OWNER HISTORY (2011-2022)*:
• Sikui Housing Group 2 LLC (2019-2022)
• Detroit Housing Fund (2018-2019)
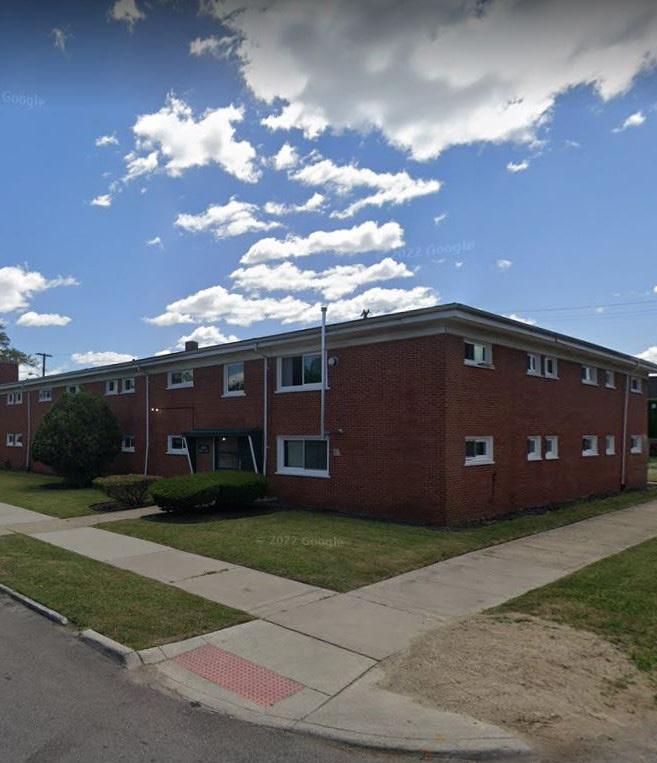
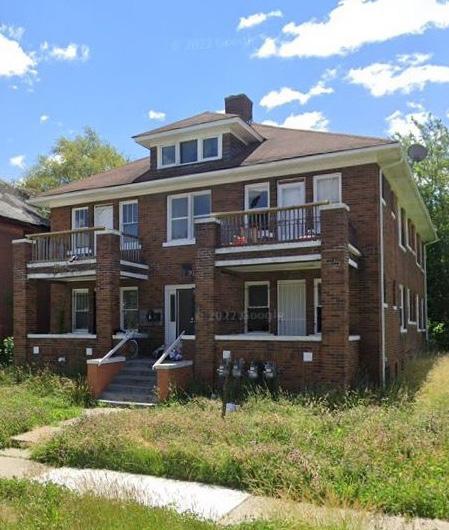
3011 KENDALL STREET
TYPOLOGY: Type 1
PROPERTY OWNER * : Stewart Jr, Taylor
NO. OF UNITS#+: 14
CURRENT CONDITIONS
TOTAL SQ. FEET * : 8,440
VACANCY %+: 0%
LISTED RENT#: $614.00
ASSESSED VALUE * : $78,400
RENTAL REGISTRY * : No
CERT. OF COMPLIANCE * : No
ZONING DISTRICT * : R3
TRANSACTION INFO
NO. OF SALES (2011-2022)*: 2
LAST SALE PRICE * : $103,000
LAST SALE PRICE PER UNIT * : $9,363.64
LAST SALE PRICE PER SQ. FEET * : $12.20
LAST SALE DATE * : 12/1/2019
CHANGE IN SALE PRICE: $53,000
OWNER HISTORY (2011-2022)*:
• Stewart Jr, Taylor (2019-2022)
• Greenshoots Properties LLC (2011-2019)
Sale Price NOAH Average Sale Price (2011-2022)
SUPPLEMENTAL INFO
BUILDING PERMIT(S)+: No
VIOLATION(S)+: 1 (2015)
YEAR BUILT * : 1924
SITE ACREAGE * : 0.145
COUNCIL DISTRICT * : 2
PROPERTY CONDITION: 2
• American Strategic Investmen et al (2018)
• Harvey, Terry (2011-2018)
SUPPLEMENTAL INFO
BUILDING PERMIT(S)+: No
VIOLATION(S)+: 6 (2016)
YEAR BUILT * : 1954
SITE ACREAGE * : 0.306
• Bayview Loan Servicing LLC (2011)
SOURCES
*CITY OF DETROIT OPEN DATA PORTAL +DATA DRIVEN DETROIT #REAL COMP MLS
COUNCIL DISTRICT * : 2
PROPERTY CONDITION: 3
SOURCES
*CITY OF DETROIT OPEN DATA PORTAL +DATA DRIVEN DETROIT #REAL COMP
112 | Preserving Small Multi-Family NOAH Properties PROPERTY PROFILE | 113
MLS
figure/chart $0 $20,000 $40,000 $60,000 $80,000 $100,000 $120,000 $140,000 $160,000 $180,000 3/8/2019 11/9/2018 11/9/2018 Sale Price Date
June 2022, Google Street View
figure/chart $0 $20,000 $40,000 $60,000 $80,000 $100,000 $120,000 $140,000 $160,000 $180,000 5/10/2011 12/1/2019 Sale Price Date 3011
Sale Price NOAH Average Sale Price (2011-2022)
KENDALL
June 2022, Google Street View
3205 KENDALL STREET
TYPOLOGY: Type 2
PROPERTY OWNER * : Boleman, LLC
NO. OF UNITS#+: 26
3224 W GRAND STREET
TYPOLOGY: Type 2
PROPERTY OWNER * : Grand-Bey Estates, LLC
NO. OF UNITS#+: 4
CURRENT CONDITIONS
TOTAL SQ. FEET * : 14,388
VACANCY %+: 3.85%
LISTED RENT#: Cannot Determine
ASSESSED VALUE * : $175,500
RENTAL REGISTRY * : Yes
CERT. OF COMPLIANCE * : No
ZONING DISTRICT * : R2
TRANSACTION INFO
NO. OF SALES (2011-2022)*: 1
LAST SALE PRICE * : $425,000
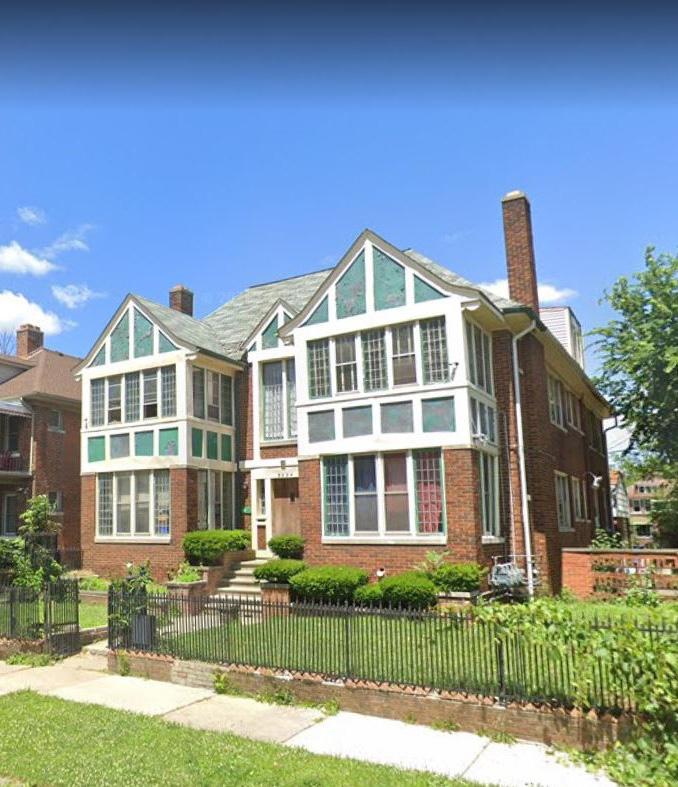
LAST SALE PRICE PER UNIT * : $16,346.15
LAST SALE PRICE PER SQ. FEET * : $29.54
LAST SALE DATE * : 4/30/2018
CHANGE IN SALE PRICE: N/A
OWNER HISTORY (2011-2022)*:
• Boleman, LLC (2018-2022)
• Partal Inc. (2011-2018)
SUPPLEMENTAL INFO
BUILDING PERMIT(S)+: No
VIOLATION(S)+: 0
YEAR BUILT * : 1925
SITE ACREAGE * : 0.196
COUNCIL DISTRICT * : 2
PROPERTY CONDITION: 4
CURRENT CONDITIONS
TOTAL SQ. FEET * : 4,292
VACANCY %+: 0%
LISTED RENT#: $500
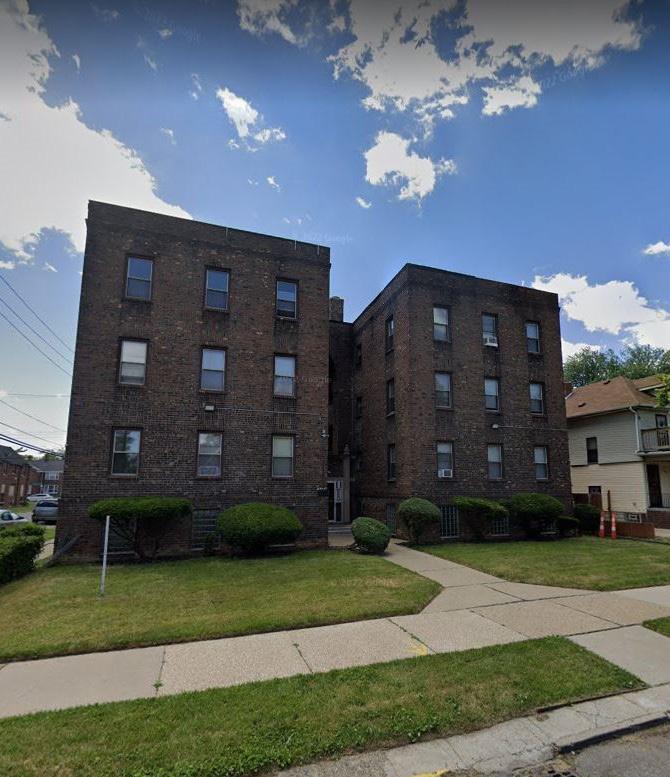
ASSESSED VALUE * : $32,700
RENTAL REGISTRY * : Yes
CERT. OF COMPLIANCE * : No
ZONING DISTRICT * : R2
TRANSACTION INFO
NO. OF SALES (2011-2022)*: 1
LAST SALE PRICE * : $1
LAST SALE PRICE PER UNIT * : $0.25
LAST SALE PRICE PER SQ. FEET * : $0.0002
LAST SALE DATE * : 6/15/2017
CHANGE IN SALE PRICE: N/A
OWNER HISTORY (2011-2022)*:
• Grand Bey Estates LLC (2017-2022)
• Mason Bay Estates LLC (2011-2017)
SUPPLEMENTAL INFO
BUILDING PERMIT(S)+: No
VIOLATION(S)+: 0
YEAR BUILT * : 1924
SITE ACREAGE * : 0.145
SOURCES
*CITY OF DETROIT OPEN DATA PORTAL +DATA DRIVEN DETROIT #REAL COMP MLS
COUNCIL DISTRICT * : 7
PROPERTY CONDITION: 4
SOURCES
*CITY OF DETROIT OPEN DATA PORTAL +DATA DRIVEN DETROIT #REAL COMP MLS
114 | Preserving Small Multi-Family NOAH Properties PROPERTY PROFILE | 115
figure/chart $0 $50,000 $100,000 $150,000 $200,000 $250,000 $300,000 $350,000 $400,000 $450,000 4/30/2018 Sale Price Date 3205 KENDALL Sale Price NOAH Average Sale Price
June 2022, Google Street View figure/chart $0 $20,000 $40,000 $60,000 $80,000 $100,000 $120,000 $140,000 $160,000 $180,000 6/15/2017 Sale Price Date
GRAND Sale Price NOAH Average Sale Price
(2011-2022)
3224
(2011-2022)
June 2022, Google Street View
3225 W GRAND STREET
TYPOLOGY: Type 1
PROPERTY OWNER * : Benjamin, Willie Jr
NO. OF UNITS#+: 4
CURRENT CONDITIONS
TOTAL SQ. FEET * : 3,978
VACANCY %+: 0%
LISTED RENT#: $500
ASSESSED VALUE * : $24,700
RENTAL REGISTRY * : No
CERT. OF COMPLIANCE * : No
ZONING DISTRICT * : R2
TRANSACTION INFO
NO. OF SALES (2011-2022)*: 2
LAST SALE PRICE * : $2,950
LAST SALE PRICE PER UNIT * : $737.50
LAST SALE PRICE PER SQ. FEET * : $0.74
LAST SALE DATE * : 11/29/2012
CHANGE IN SALE PRICE: -$94,668
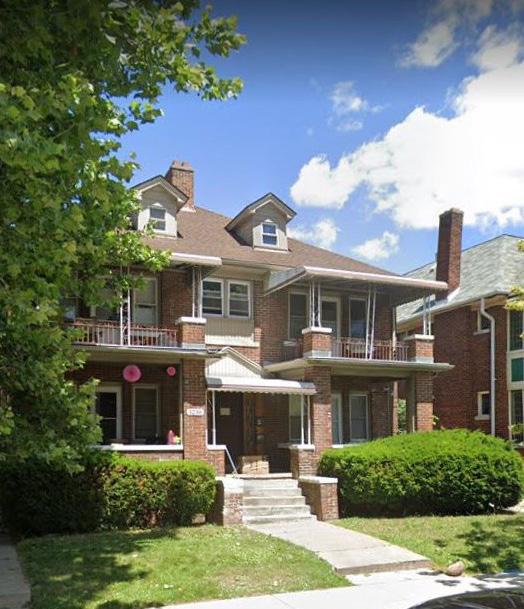
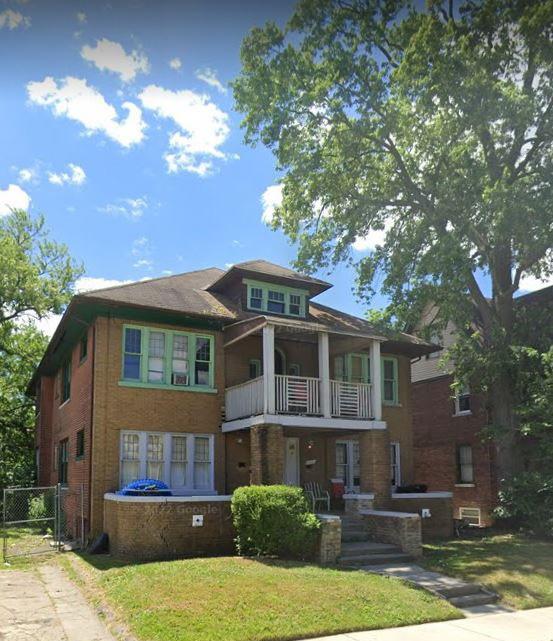
OWNER HISTORY (2011-2021)*:
• Benjamin, Willie Jr (2012-2022)
• Bank of New York Melon (2012-2012)
3236 W GRAND STREET
TYPOLOGY: Type 1
PROPERTY OWNER * : Tidwell, Sean Clear Choice Holdings
NO. OF UNITS#+: 5
CURRENT CONDITIONS
TOTAL SQ. FEET * : 4,174
VACANCY %+: 0%
LISTED RENT#: Cannot Determine
ASSESSED VALUE * : $27,600
RENTAL REGISTRY * : No
CERT. OF COMPLIANCE * : No
ZONING DISTRICT * : R2
TRANSACTION INFO
NO. OF SALES (2011-2022)*: 1
LAST SALE PRICE * : $47,500
LAST SALE PRICE PER UNIT * : $9,500
LAST SALE PRICE PER SQ. FEET * : $11.38
LAST SALE DATE * : 1/3/2011
CHANGE IN SALE PRICE: N/A
OWNER HISTORY (2011-2022)*:
• Manors Worldwide LLC (2011-2022)
• Duncan, Amber D (2011)
Average Sale Price (2011-2022)
SUPPLEMENTAL INFO
BUILDING PERMIT(S)+: Yes, 1/10/2017
VIOLATION(S)+: 6 (2017)
YEAR BUILT * : 1924
SITE ACREAGE * : 0.148
COUNCIL DISTRICT * : 7
PROPERTY CONDITION: 3
• Wayne County Sheriff (2011-2012)
SUPPLEMENTAL INFO
BUILDING PERMIT(S)+: No
VIOLATION(S)+: 0
YEAR BUILT * : 1924
SITE ACREAGE * : 0.125
SOURCES
*CITY OF DETROIT OPEN DATA PORTAL +DATA DRIVEN DETROIT #REAL COMP MLS
COUNCIL DISTRICT * : 7
PROPERTY CONDITION: 3
SOURCES
*CITY OF DETROIT OPEN DATA PORTAL +DATA DRIVEN DETROIT #REAL COMP MLS
116 | Preserving Small Multi-Family NOAH Properties PROPERTY PROFILE | 117
figure/chart $0 $20,000 $40,000 $60,000 $80,000 $100,000 $120,000 $140,000 $160,000 $180,000 11/29/2012 4/5/2012 Sale Price Date 3225 GRAND Sale Price NOAH
June 2022, Google Street View
figure/chart $0 $20,000 $40,000 $60,000 $80,000 $100,000 $120,000 $140,000 $160,000 $180,000 1/3/2011 Sale Price Date 3236 GRAND Sale Price NOAH Average Sale Price (2011-2022)
June 2022, Google Street View
3380 PASADENA STREET
TYPOLOGY: Type 1
PROPERTY OWNER * : Jones, Laura S.
NO. OF UNITS#+: 4
3700 PASADENA STREET
TYPOLOGY: Type 2
PROPERTY OWNER * : Ttachiules, LLC
NO. OF UNITS#+: 10
CURRENT CONDITIONS
TOTAL SQ. FEET * : 3,920
VACANCY %+: 0%
LISTED RENT#: Cannot Determine
ASSESSED VALUE * : $63,900
RENTAL REGISTRY * : No
CERT. OF COMPLIANCE * : No
ZONING DISTRICT * : R5
TRANSACTION INFO
NO. OF SALES (2011-2022)*: 0
LAST SALE PRICE * : Cannot Determine
LAST SALE PRICE PER UNIT * : Cannot Determine
LAST SALE PRICE PER SQ. FEET * : Cannot Determine
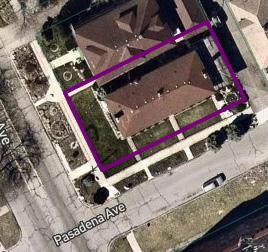
LAST SALE DATE * : Cannot Determine
CHANGE IN SALE PRICE: N/A
OWNER HISTORY (2011-2022)*:
CURRENT CONDITIONS
TOTAL SQ. FEET * : 9,053
VACANCY %+: 10%
LISTED RENT#: $707
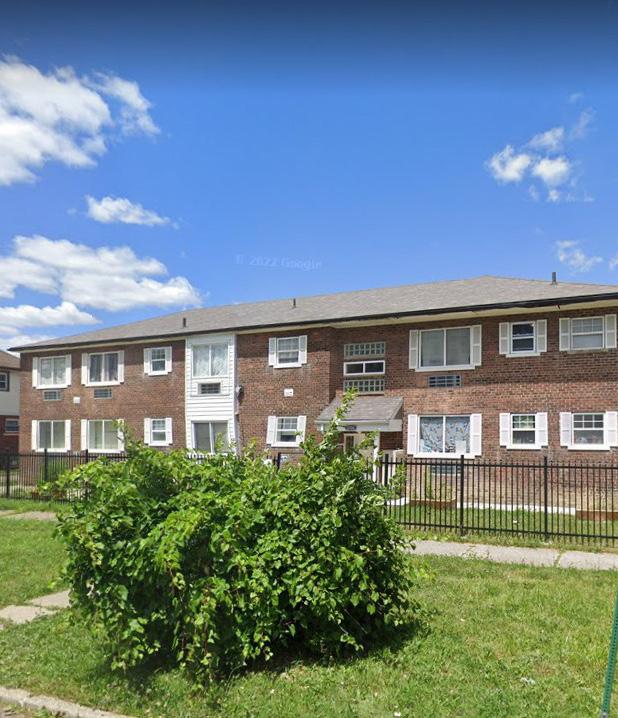
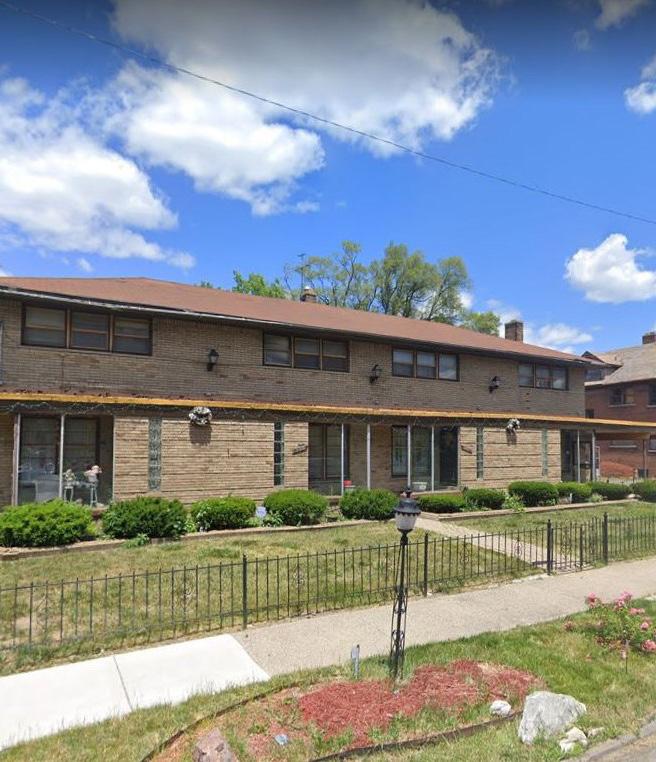
ASSESSED VALUE * : $104,000
RENTAL REGISTRY * : Yes
CERT. OF COMPLIANCE * : No
ZONING DISTRICT * : R5
TRANSACTION INFO
NO. OF SALES (2011-2022)*: 3
LAST SALE PRICE * : $510,000
LAST SALE PRICE PER UNIT * : $51,000
LAST SALE PRICE PER SQ. FEET * : $56.33
LAST SALE DATE * : 7/13/2017
CHANGE IN SALE PRICE: $ 475,000
OWNER HISTORY (2011-2022)*:
• Ttachiules, LLC (2017-2022)
• 810 Complex LLC, (2016-2017)
Source: Regrid
SUPPLEMENTAL INFO
BUILDING PERMIT(S)+: No
VIOLATION(S)+: 0
YEAR BUILT * : 1954
SITE ACREAGE * : 0.163
COUNCIL DISTRICT * : 2
PROPERTY CONDITION: 4
• Jones, Laura S. (2011-2022)
SUPPLEMENTAL INFO
BUILDING PERMIT(S)+: Yes, 6/30/2010
VIOLATION(S)+: 2 (2015)
YEAR BUILT * : 1949
SITE ACREAGE * : 0.247
• 3700 Pasadena LLC (2014-2016)
• McLean, Warren Bruce & Leah (20112014)
SOURCES
*CITY OF DETROIT OPEN DATA PORTAL +DATA DRIVEN DETROIT #REAL COMP MLS
COUNCIL DISTRICT * : 2
PROPERTY CONDITION: 3
SOURCES
*CITY OF DETROIT OPEN DATA PORTAL +DATA DRIVEN DETROIT #REAL COMP MLS
118 | Preserving Small Multi-Family NOAH Properties PROPERTY PROFILE | 119
June 2022, Google Street View
figure/chart $0 $100,000 $200,000 $300,000 $400,000 $500,000 $600,000 10/3/2014 10/20/2016 7/13/2017 Sale Price Date
Sale Price NOAH Average Sale Price (2011-2022)
3700 PASADENA
June 2022, Google Street View
4234 W DAVISON STREET
TYPOLOGY: Type 3
PROPERTY OWNER * : Purityson LLC
NO. OF UNITS#+: 10
APPENDIX C: Small Multi-Family
NOAH Database Development Methodology Overall Workflow
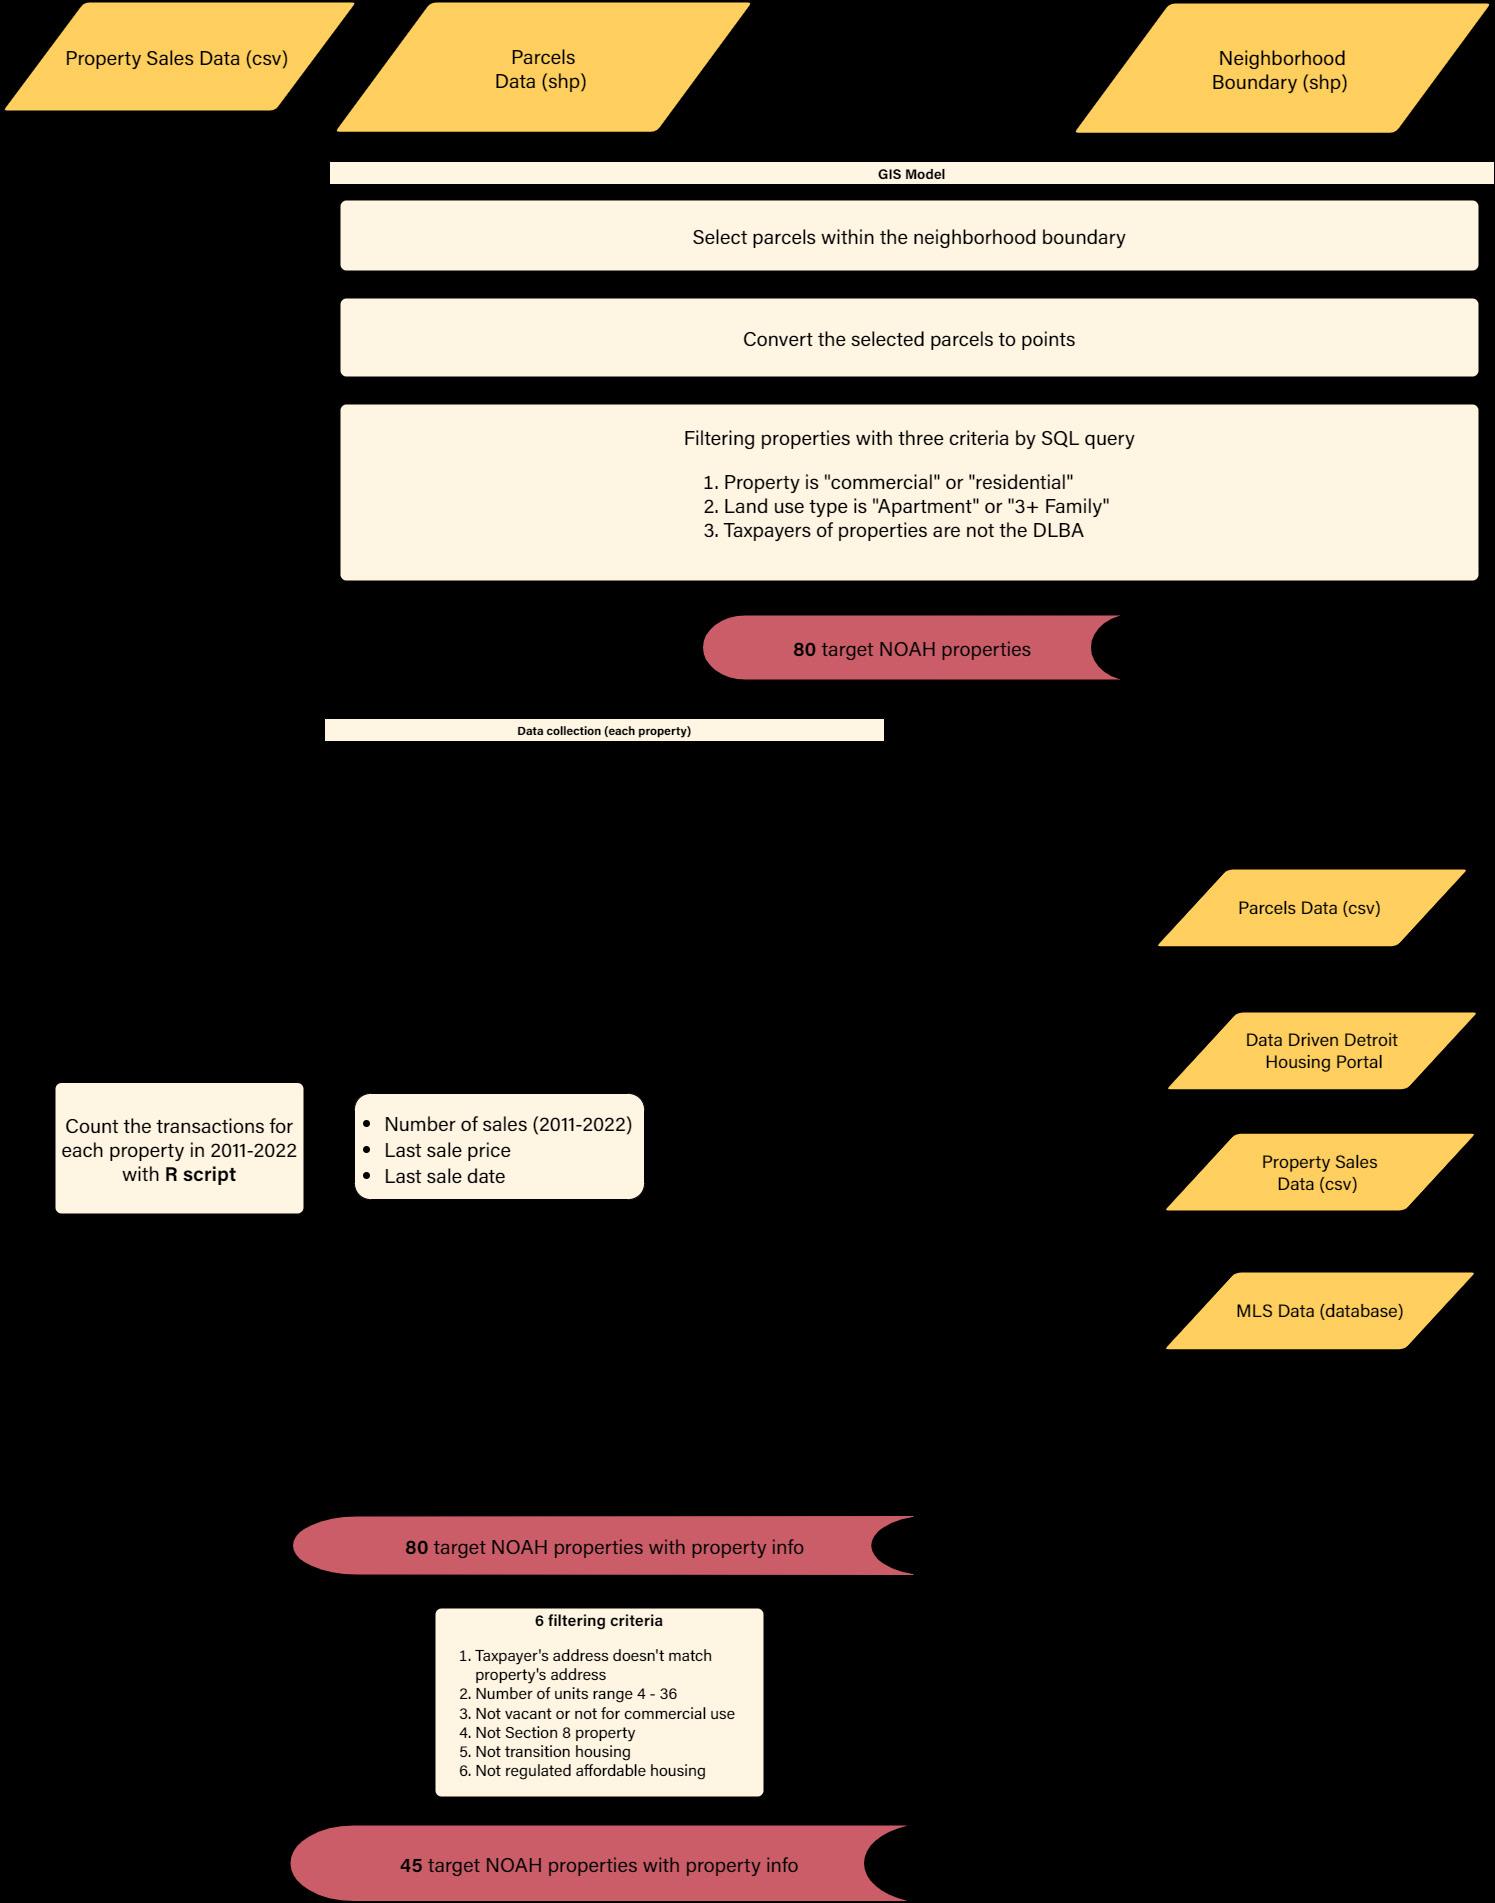
Figure C1: Overall Workflow for Identifying Target NOAH Properties
CURRENT CONDITIONS
TOTAL SQ. FEET * : 4,861
VACANCY %+: 55.56%
LISTED RENT#: $500
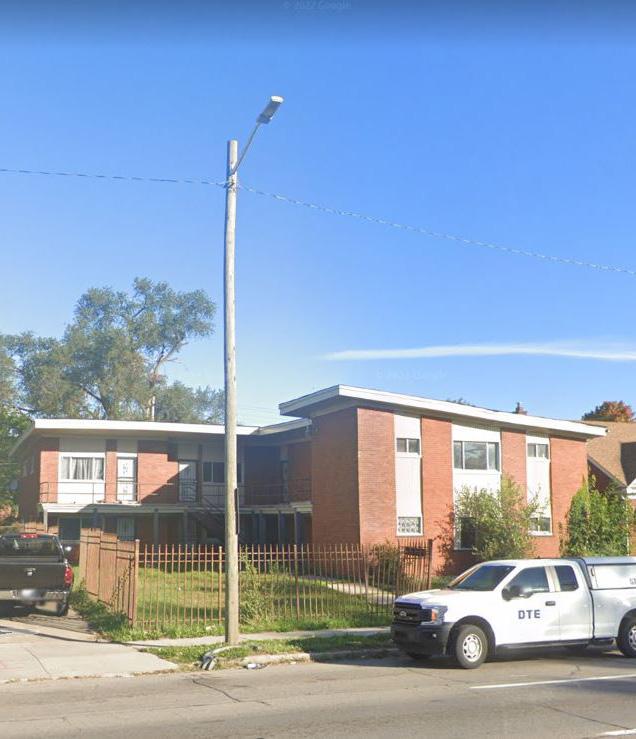
ASSESSED VALUE * : $72,900
RENTAL REGISTRY * : Yes
CERT. OF COMPLIANCE * : Yes
ZONING DISTRICT * : R3
TRANSACTION INFO
NO. OF SALES (2011-2022)*: 5
LAST SALE PRICE * : $120,000
LAST SALE PRICE PER UNIT * : $12,000
LAST SALE PRICE PER SQ. FEET * : $24.69
LAST SALE DATE * : 4/2/2016
CHANGE IN SALE PRICE: $90,000
OWNER HISTORY (2011-2022)*:
• Purityson LLC (2016-2022)
• Sunshine 11 LLC (2013-2016)
Sale Price NOAH Average Sale Price (2011-2022)
SUPPLEMENTAL INFO
BUILDING PERMIT(S)+: No
VIOLATION(S)+: 27 (2018)
YEAR BUILT * : 1954
SITE ACREAGE * : 0.176
COUNCIL DISTRICT * : 7
PROPERTY CONDITION: 4
• Miral LLC (2012-2013)
• Alavizedeh, Farideh (2011-2012)
• Midwest Financial Services LLC (2011)
• Bayview Loan Servicing LLC (2011)
SOURCES
*CITY OF DETROIT OPEN DATA PORTAL +DATA DRIVEN DETROIT #REAL COMP MLS
APPENDIX | 121 120 | Preserving Small Multi-Family NOAH Properties
figure/chart $0 $20,000 $40,000 $60,000 $80,000 $100,000 $120,000 $140,000 $160,000 $180,000 Sale Price Date
4234 W DAVISON
October 2022, Google Street View
Generate Geospatial Data of Properties
A GIS model is created to generate points representing properties based on the Parcels Data. Then a series of filtering processes in the model are applied to narrow down the potential small multi-family NOAH property list. This GIS model (process) starts with the city-wide parcel shape file and the standard Oakman Boulevard Community Neighborhood boundary shape file, and the final output is a points shape file that represents the potential small multi-family NOAH properties in Oakman Boulevard Neighborhood.
SQL query: AND use code d IN (‘APT-FLAT GARDEN TYPE ’, ‘APT-FLAT SLAB TYPE ’, ‘APT-WALK UP’, ‘APT-W/ ELEVATOR’, ‘MIXED USE-APT’, ‘FIVE FAMILY’, ‘FOUR FAMILY’, ‘SIX FAMILY’, ‘ THREE FAMILY’)
c. Taxpayers of properties
Taxpayer IS NOT “DETROIT LAND BANK AUTHORITY”
SQL query:
AND taxpayer 1 <> ‘DETROIT LAND BANK AUTHORITY’
With this criteria, 186 properties in the Oakman Boulevard Neighborhood are identified as potential small multi-family NOAH properties.
Data Collection from Multiple Sources
Systematic data collection can contribute to the development of a small multi-family NOAH property database with comprehensive information. In order to do that, multiple sources of data including open-source data, commercial data, and private data are utilized to refine the database.
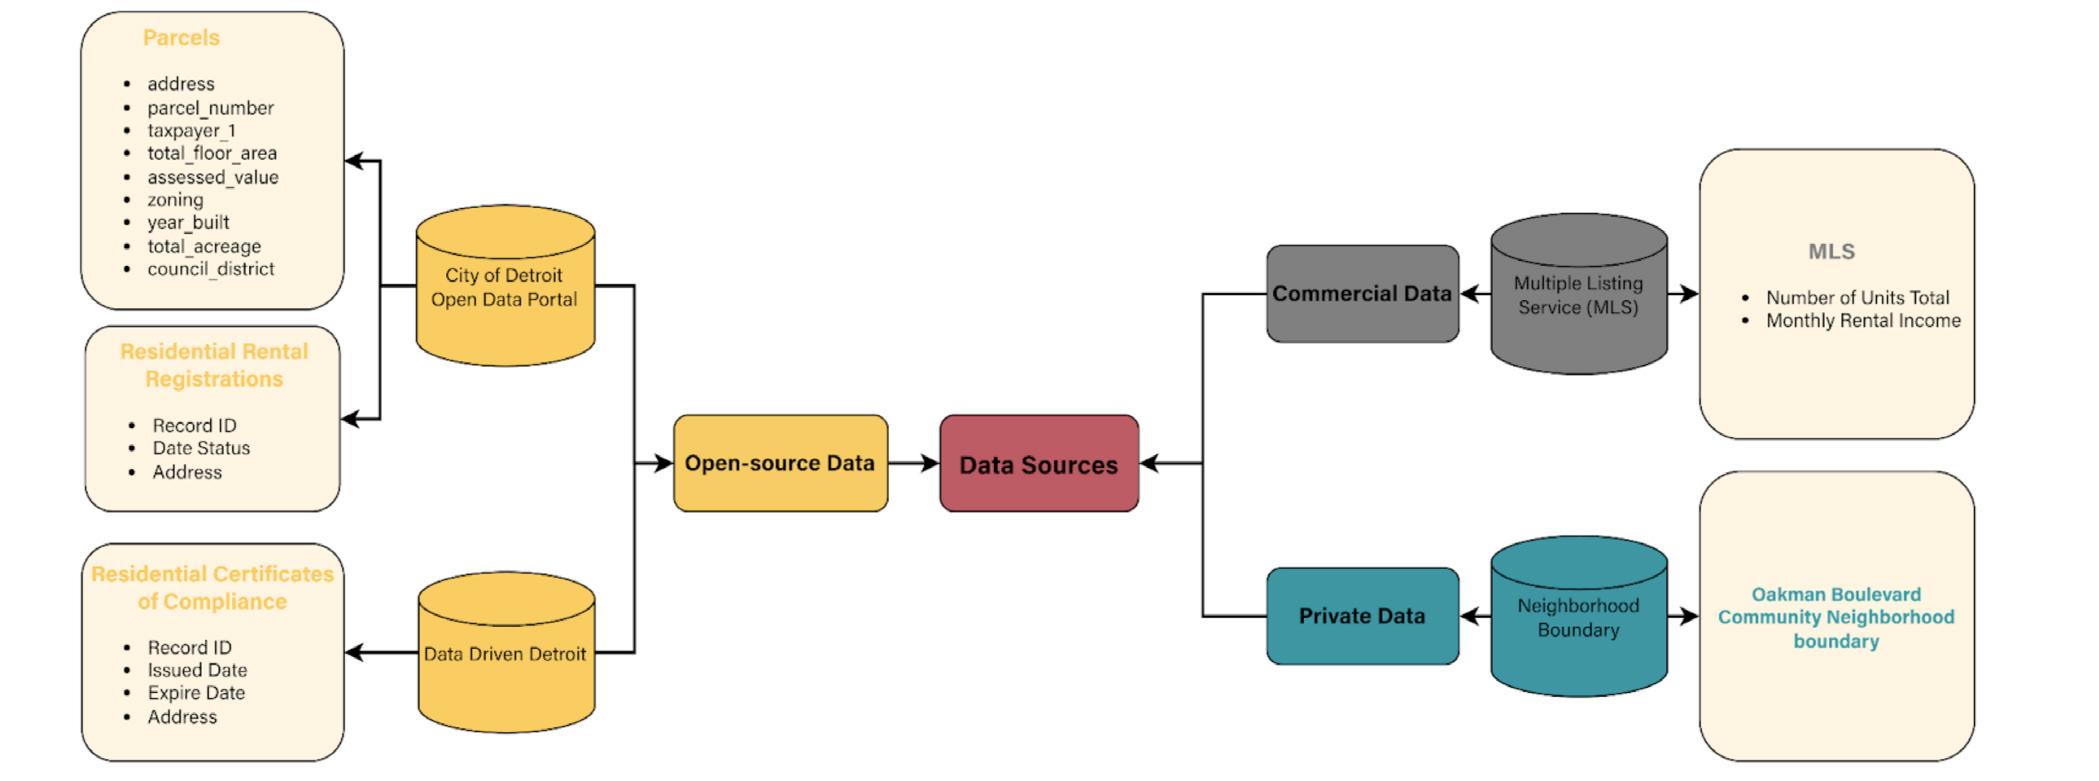
Main Steps to Create GIS Model
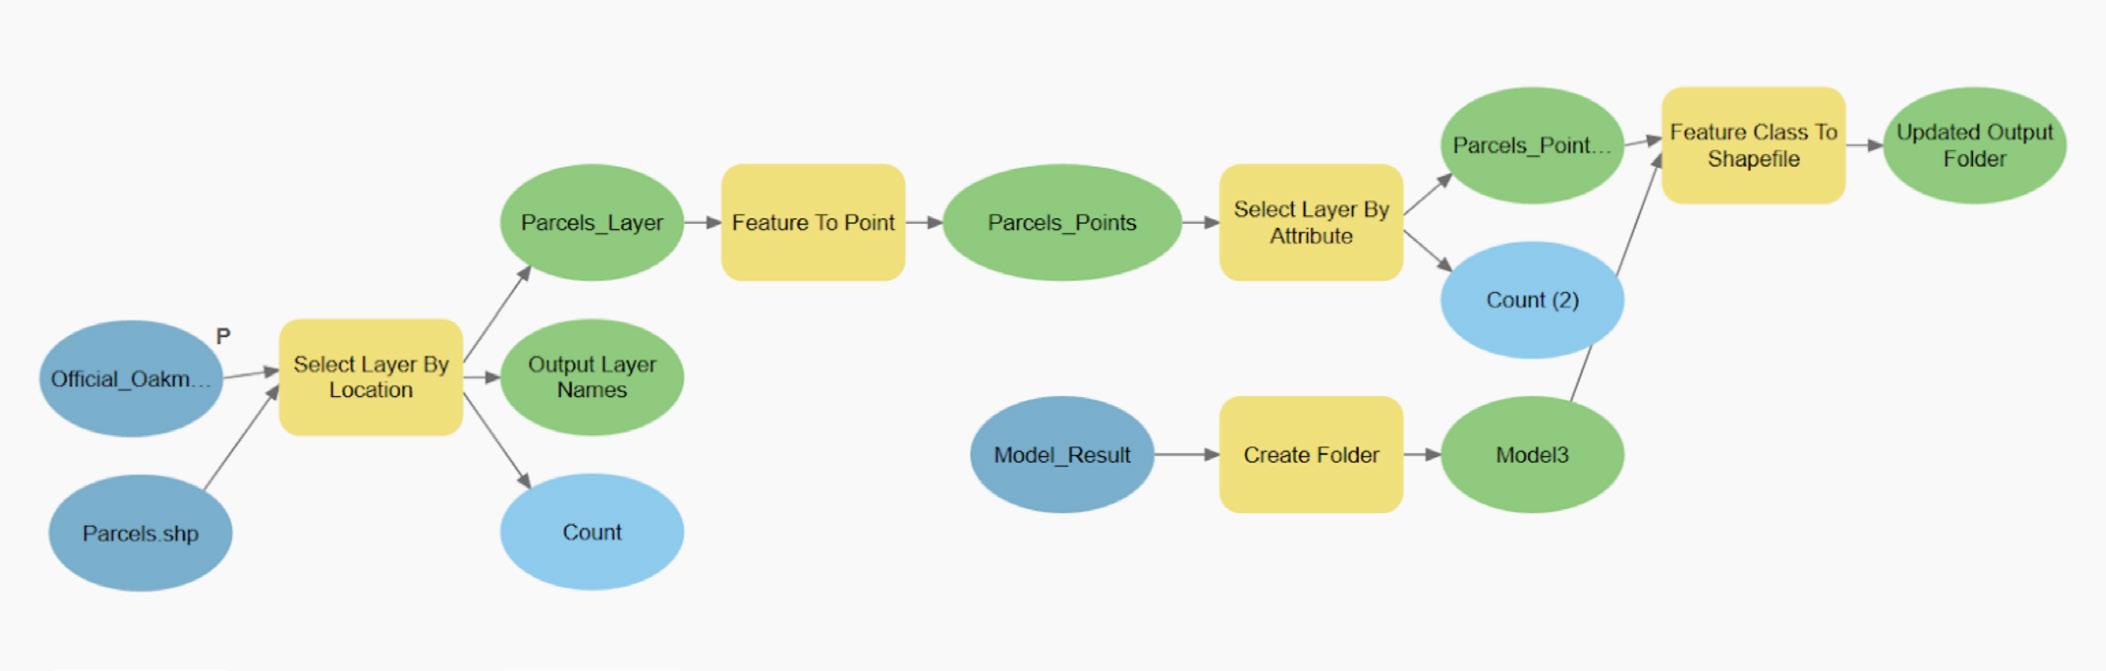
1. Select all parcels within a given neighborhood boundary [parameter = Oakman Blvd]
2. Convert the selected parcels from polygons to points that represent properties
3. Filter the data with 3 criteria by SQL query in ArcGIS
a. Tax Commission Property Classification
Property classes are in:
1. ‘COMMERCIAL’
2. ‘RESIDENTIAL’
SQL query: property 1 IN (‘COMMERCIAL’, ‘RESIDENTIAL’)
b. Land use types
Land use types are in:
1. ‘APT-FLAT GARDEN TYPE’
2. ‘APT-FLAT SLAB TYPE’
3. ‘APT-WALK UP’
122 | Preserving Small Multi-Family NOAH Properties APPENDIX | 123
Figure C2: GIS Workflow for NOAH Property Point Shapefile
Note: GIS Model Designed using ArcGIS Pro “Model Builder” tool.
4. ‘APT-W/ ELEVATOR’
5. ‘MIXED USE-APT’
6. ‘THREE FAMILY’
7. ‘FOUR FAMILY’
8. ‘FIVE FAMILY’
9. ‘SIX FAMILY’’
Figure C3: Workflow for Compiling Information from Multiple Sources
Select and Count Valid Transactions
In addition to the direct data collection from other data sources, counting the number of valid sales of each property is critical to support further analysis. This metric, number of sales (20112022), should also be captured and included in the database. An R script is created to filter valid transactions to exclude non-sale transfers and to count the number of valid market sales for each property during 2011-2022.
Two criteria are adopted to select the valid sales records:
1. Grantee of sales are not in the following list:
a. DETROIT LAND BANK AUTHORITY
b. WAYNE COUNTY LAND BANK
c. FANNIE MAE
d. BANK OF AMERICA
e. BANK OF NY MELLON
f. WELLS FARGO BANK
g. PNC BANK
h. ONE WEST BANK
i. COMERICA BANK
j. US BANK
k. FEDERAL HOME LOAN MORTGAGE CO.
l. HUD
m. SECRETARY OF VETERAN AFFAIRS
n. WAYNE COUNTY
o. CITY OF DETROIT - P&DD
p. FEDERAL NATIONAL MORTGAGE
q. BAC HOME LOANS SERVICING
r. AURORA LOAN SERVICING
s. CITI MORTGAGE INC
t. NATIONSTAR MORTGAGE
2. Sale terms is in the following list:
a. 03-ARM’S LENGTH
b. 10-FORECLOSURE
c. 11-FROM LENDING INSTITUTION EXPOSED
d. 12-FROM LENDING INSTITUTION NOT EXPOSED
e. 13-GOVERNMENT
f. 21-NOT USED/OTHER
R script for Automatic Transaction Count
This script is written in R language, and it could be run in Rstudio. Three packages are required for the data cleaning and transaction count. Property Sales data (.csv) can be downloaded from City of Detroit Open data portal, and the property list can be customized. After running the script, a table storing the result will be exported to the root directory of the script.
# Load packages
library(rstudioapi)
library(dplyr)
library(tidyr)
# set working space
setwd(dirname(rstudioapi::getActiveDocumentContext()$path))
# import data
## import Property Sales data (.csv) sales <- read.csv(“Property Sales Detroit.csv”)
## import property list includes a column “address” properties <- read.csv(“Property List.csv”)
# filtering the valid sales records
## clean up data with two criteria sales clean <- sales %>% filter(!grepl(“DETROIT LAND BANK AUTHORITY|WAYNE COUNTY LAND BANK|FANNIE MAE|BANK OF AMERICA|BANK OF NY MELLON|WELLS FARGO BANK|PNC BANK|ONE WEST BANK|COMERICA BANK|US BANK|FEDERAL HOME LOAN MORTGAGE CO|HUD|SECRETARY OF VETERAN AFFAIRS|CITY OF DETROIT - P&DD|FEDERAL NATIONAL MORTGAGE|BAC HOME LOANS SERVICING|AURORA LOAN SERVICING|CITI MORTGAGE INC|NATIONSTAR MORTGAGE”, grantee)) %>% drop na() %>% filter(grantee != “WAYNE COUNTY MI” & grantee != “WAYNE COUNTY”) %>% filter(sale terms %in% c(“03-ARM’S LENGTH” “10-FORECLOSURE ”, “11-FROM LENDING INSTITUTION EXPOSED” , “12-FROM LENDING INSTITUTION NOT EXPOSED” , “13-GOVERNMNET” , “21-NOT USED/OTHER”))
## select sales records 2011-2012 sales clean datareset <- sales clean %>% mutate(sale date = ymd hms(sale date)) sales 1122 <- sales clean datareset %>% filter(between(as.Date(sale date, format = “%Y-%m-%d”), as.Date(“2011-01-01”), as.Date(“2022-12-31”)))
#count the number of sales of all properties in Detroit transaction detroit <- sales 1122 %>% mutate(sale date = as.Date(sale date, format = “%Y-%m-%d”)) %>% distinct(address, sale date, .keep all = TRUE) %>% group by(address) %>% summarise(transaction count = n())
# select the number of sales of each property in the list transaction count <- transaction detroit %>% inner join(properties, by = “address”) %>% select(address, transaction count)
# write out the result as CSV write.csv(transaction count, “transaction count.csv” , row.names = FALSE)
124 | Preserving Small Multi-Family NOAH Properties APPENDIX | 125
Small Multi-Family NOAH Property Database Development
Based on the data collected from multiple sources and the data generated from R script, a property database that records potential Small Multi-Family NOAH properties could be built. The initial database has 186 potential Small Multi-Family NOAH properties that were identified in the first step. Each property has a series of attributes as shown in the table below. Most of the attributes are from open-source data and commercial data. Two attributes, price per square foot and price per unit are generated based on other existing attributes. Number of sales (2011-2022) can be obtained from the table generated by provided R script.
In the calculation of the price per unit for some property that has missing “listed units” data, the number of units from the open data portal will be used as an alternative option.
Field Name (Attribute) Data Source
Address City of Detroit Open Data Portal, Parcels
Parcel Number City of Detroit Open Data Portal, Parcels
Property Owner City of Detroit Open Data Portal, Parcels
Number of Units Data Driven Detroit, Housing Information Portal
Listed units MLS
Total floor area City of Detroit Open Data Portal, Parcels
Vacant percent Data Driven Detroit, Housing Information Portal
Vacant units Data Driven Detroit, Housing Information Portal
Listed rent MLS
Assessed value City of Detroit Open Data Portal, Parcels
Rental registry City of Detroit Open Data Portal, Residential Rental Registrations
Certificate of Compliance City of Detroit Open Data Portal, Residential Certificates of Compliance
Zoning district City of Detroit Open Data Portal, Parcels
Number of sales (2011-2022) City of Detroit Open Data Portal, Property Sales
Last sale price City of Detroit Open Data Portal, Property Sales
Last sale date City of Detroit Open Data Portal, Property Sales
Price per sqft = ‘Last sale price’ / ‘Total floor area’
Price per unit = ‘Last sale price’ / ‘Listed units’
Building permit Data Driven Detroit, Housing Information Portal
Building permit date Data Driven Detroit, Housing Information Portal
Number of blight violations (2011-2022) Data Driven Detroit, Housing Information Portal
Most recent blight violation date Data Driven Detroit, Housing Information Portal
Demolition status Data Driven Detroit, Housing Information Portal
Year built City of Detroit Open Data Portal, Parcels
Site acreage City of Detroit Open Data Portal, Parcels
Council district City of Detroit Open Data Portal, Parcels
Final Data Filtering
In order to continually narrow down the property list to get a more accurate Small Multi-Family NOAH Property Database, several stricter filtering criteria were applied to the existing database. Manual works of investigating individual properties and filtering out those that do not meet the criteria of small multi-family NOAH properties are necessary.
These stricter criteria are:
1. The property is for rental use
2. Property is neither vacant nor for commercial use
3. The number of units ranges from 4 to 36
4. Property is not regulated affordable housing (Section 8)
5. Property is not transitional housing
After final filtering, the number of small multi-family NOAH properties for Oakman Boulevard Community Neighborhood in the database has been narrowed to 45.
126 | Preserving Small Multi-Family NOAH Properties APPENDIX | 127
Table C1: Database Attributes and Data Sources
Filtering Process Criteria Remaining Properties after Criteria Applied Amount change All Properties in Target Neighborhood 3499 0 Property tax classification is “Residential” or “Commercial” 2405 -1094 In ArcGIS Pro Land use types is “Apartment” or “3+ family” 197 -2208 Taxpayers of properties are not the Detroit Land Bank Authority 186 -11 Taxpayer’s address doesn’t match the property’s address 80 -106 Property is neither vacant nor for commercial use 52 -28 Manual filtering Number of units ranges from 4 to 36 50 -2 Property is not regulated affordable housing (Section 8) 49 -1 Property is not transitional housing 46 -3 Property is unregulated affordable housing (NOAH) 45 -1
Table C1: Database Attributes and Data Sources
APPENDIX D: NOAH Properties Price per Unit
Figure D1: Median price per unit for small multi-family NOAH properties in Oakman Boulevard neighborhood
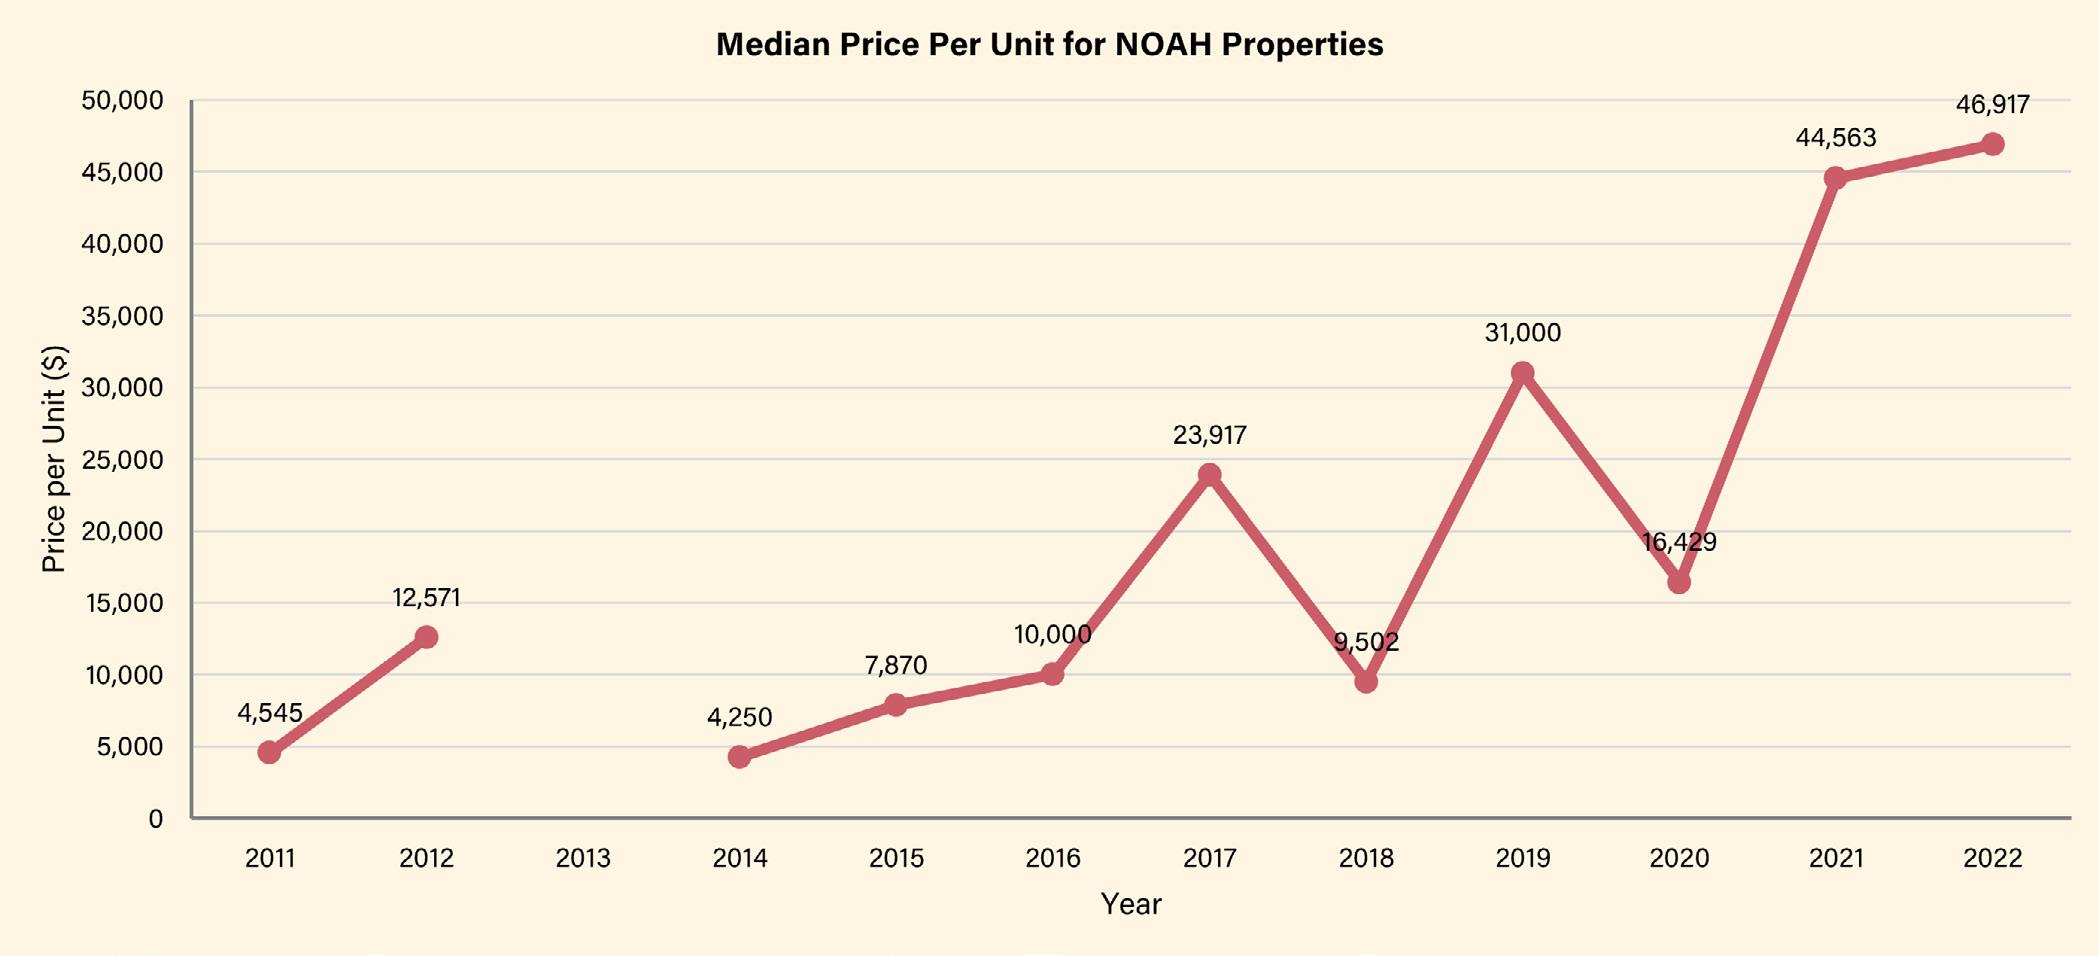
APPENDIX E: Windshield Survey Results
128 | Preserving Small Multi-Family NOAH Properties APPENDIX | 129
Address Score Potential Current/Recent Renovations? Notices/Violations Posted? 13245 MONICA 4 N N 13505 LA SALLE BLVD 1 N N 13535 LA SALLE BLVD 3 Y N 13600 LA SALLE BLVD 2 Y N 13632 DEXTER 4 N Y 13639 LA SALLE BLVD 3 Y N 13700 LA SALLE BLVD 3 Y N 13725 LA SALLE BLVD 2 Y N 14001 MONICA 4 N N 14022 LA SALLE BLVD 4 N N 14030 SAN JUAN 4 N N 14066 SANTA ROSA 3 Y N 1705 OAKMAN BLVD 4 Y N 1875 EWALD CIRCLE 3 Y N 1890 EWALD CIRCLE 4 N N 1906 CLEMENTS 3 N N 1946 EWALD CIRCLE 2 N N 2010 CLEMENTS 2 N N 2020 CLEMENTS 2 N N 2055 CLEMENTS 4 N N 2201 CLEMENTS 4 N N 2215 CLEMENTS 3 N N 2250 CLEMENTS 4 N N 2303 CLEMENTS 3 Y N 2303 FORD 2 N N 2310 PASADENA 3 N N 2340 CLEMENTS 3 N N 2340 GRAND 4 N N 2341 EWALD CIRCLE 4 Y N 2545 FORD 4 N N
Table E1: Windshield Survey Results of March 2023
APPENDIX F: Best Practices for PILOT Programs – An Evaluation of the Memphis Downtown Property PILOT
The Downtown Property PILOT was instituted to support large scale development in the Central Business Improvement District of downtown Memphis. The program allowed developers within the district to pay a fee equivalent to their pre-development taxes plus 25% of the incremental increase in their property taxes from the improvement. After the implementation of the program, a study was commissioned to conduct an impact analysis. The results showed that the program had a positive impact on the tax revenues and on the surrounding areas in the form of increased appraisal values as well as on other indicators such as increased population growth, lower vacancy rates, lower unemployment, and decreased blight. The study also produced four Best Practice Policy Principles for effective implementation of a PILOT program:
1. “Ensure Property Eligibility for PILOT Program”
The eligibility requirements for the PILOT program should correspond to the goals of the city. This will allow the city to target specific types of properties or owners that are in greatest need of the support. This includes creating a standardized process for application that includes an indicator of the degree of need, which may include a “but for” test or other measures of financial health. This process should also be underpinned by a fiscal impact analysis for each project to understand the trade-off between the costs the city will incur and the benefit received from the project.
The amount of the tax benefit provided, the timeline, and other parts of the program’s structure should be determined based on both the program’s goals and the financial need of the recipient. The award can be given as a percentage of revenue or a flat amount of tax revenue, and the timeline should be at least 10-years to match the common debt maturity. Additional components such as a step-down or a reallocation should be considered to ensure that projects are able to transition out of the program smoothly and that program funding is used effectively. The program should also include a renewal process that assesses any changes to the level of need and ensures compliance with program requirements.
The structure and requirements of the program should be presented clearly so that potential applicants can understand what benefits they can receive, determine whether or not they are eligible, and decide whether or not they want to participate. Transparency may also include providing a pro forma with instructions to help inexperienced developers accurately represent their
130 | Preserving Small Multi-Family NOAH Properties APPENDIX | 131 Address Score Potential Current/Recent Renovations? Notices/Violations Posted? 2671 EWALD CIRCLE 4 N N 2701 EWALD CIRCLE 3 N N 2710 KENDALL 3 N N 2723 EWALD CIRCLE 3 N N 2750 EWALD CIRCLE 3 N N 2880 EWALD CIRCLE 4 N N 2945 GRAND 2 N N 3011 KENDALL 3 N N 3205 KENDALL 4 N N 3224 GRAND 4 N N 3225 GRAND 3 N N 3236 GRAND 3 N N 3380 PASADENA 4 N N 3700 PASADENA 3 N N 4234 W DAVISON 4 N N
2. “Determine Appropriate Project Award”
3. “Provide Transparency of Program Function and Impact”
financial need. Transparency also includes the public. There should be a consistent timeline of reports on program updates and impacts so that the public can evaluate the efficiency of the program. This also places a higher degree of accountability on the program managers.
4. “Increase Accountability for Award Recipients”
For both compliance checks and public reporting, individual recipients should be frequently monitored and evaluated. Consistent compliance checks ensure that the program funds are used effectively, and data collection will aid future evaluation and reporting. The criteria for evaluation as well as how compliance is enforced should be made clear for recipients, and the process for determining compliance should be standardized.
(Downtown Memphis Commission, 2020)
132 | Preserving Small Multi-Family NOAH Properties
