
URP 603 | Capstone Studio | Winter 2023
Fostering Racial Equity in Access to Green Spaces in Southeast Michigan: PATHWAYS TOWARDS


REGIONAL EQUITY
Taubman College of Architecture and Urban Planning, University of Michigan, Ann Arbor
Kira Barsten, Kathryn Economou, Dana Gentry, Srishti Jaipuria, Gurleen Kaur, Caroline Lamb, Xianwei Lei, Annie Linden, Manvi Nigam, Anna Pasek, Kimberly Swinehart, and Yuan Wu
Faculty Advisor: Dr. Robert Goodspeed
MEET THE TEAM
Instruction Team
Dr. Robert Goodspeed
Associate Professor
Taubman College of Architecture and Urban Planning, University of Michigan
Shubhayan Ukil
Graduate Student Instructor, Taubman College of Architecture and Urban Planning, University of Michigan
Project Team
Kira Barsten
Katie Economou
Dana Gentry
Srishti Jaipuria
Gurleen Kaur
Caroline Lamb
Xianwei Lei
Annie Linden
Manvi Nigam
Anna Pasek
Kim Swinehart
Yuan Wu
Master of Urban and Regional Planning, Taubman College of Architecture and Urban Planning, University of Michigan
v
ACKNOWLEDGMENTS
This project would not have been possible without the support, insights, and encouragement of various stakeholders, community members, and advocates across Southeast Michigan. We would like to extend our gratitude to Conan Smith and Ross Gavin of the Michigan Environmental Council, who served as the project’s primary client, for this project’s inspiration and the opportunity to explore, communicate, and begin to address racial disparities in the distribution of green space across the state.
An enormous thank you to the following stakeholders and local experts for contributing their time and perspectives to shape this project.
Michigan Environmental Council
Ross Gavin
Galen Hardy
Emily Smith
Conan Smith
MNRTF Board
Steven Hamp
Christina MacInnes
Jon Mayes
William Rustem
Michigan Department of Natural Resources
Dan Lord
We All Rise Consulting
Quincy Brown
Portland Metro
Michael Yun
Baltimore Neighborhood Indicators Alliance
Cheryl Knott
Detroit Park Coalition
Yvette Bass
Detroit Future City
Sarah Hayosh
People for Palmer Park
Rochelle Lento
Huron-Clinton Metroparks Authority
Artina Carter
Amy McMillan
Sarah Plumer
Wayne State University
Nina Kelly
The Nature Conservancy
Shaun Howard
Detroit Audubon
Gretchen Abrams
Southeast Michigan Land Conservancy
Jill Lewis
iii
Pathways Towards Regional Equity
iv Fostering Racial Equity in Access to Green Spaces TABLE OF CONTENTS Executive Summary xii Green Space Equity Key Terms xiv Chapter 1: A Vision of Green Space Equity 01 1. Introduction 03 2. Report structure 03 3. The Benefits of Green Space 05 4. Advancing equity 06 4.1 Core Principles of Green Space Equity 07 Chapter 2: Regional Forces of Inequity 11 Chapter Overview 13 1. The Context: Southeast Michigan 13 1.1 Challenges to Economic, Social, and Physical Mobility 13 1.2 Recent Research on Green Space Inequities 15 Chapter 3: Defining Disparities in Access to Green Space 21 1. Understanding Access & Equity 23 1.1 Interview Themes & Takeaways 23 2. Green Space Visits 25 2.1 Field Oberservations & Takeaways 26 Problem Statement 30 Chapter 4: Green Space Analysis 33 Chapter Overview 35 1. Social Accessibility 35 1.1 Social Obstacles Limiting Green Space Access 36 1.2 Pilot Social Accessibility Survey 42 1.3 ParkScape Mobile Application 43 2. Green Space Availability & Transportation Accessibility 44 2.1 Examining Green Space Availability 45 2.2 Examining Transportation Access to Green Spaces 48 Chapter 5: Embedding Equity in the Planning Process 57 1. Equity Throughout the Planning Process 59 2. Elements of Equitable Processes and Outcomes 59 3. Strategic Racial Equity Framework 61 4. Collaborative Planning Processes 65 4.1 Stakeholder Analysis, Consensus Building, and the DIAD Model 66
v Pathways Towards Regional Equity 5. Pursuing Equity in Investment and Financing 69 5.1 Equity in Traditional, Private, and Civic Funding Models 70 6. The Michigan Natural Resources Trust Fund & Current Funding Methods 73 6.1 Programmatic Challenges to Equitable Outcomes 74 6.2 MNRTF in Southeast Michigan 76 6.3 Spark Grant Funding 78 6.4 Equitable Funding Methods 80 Chapter 6:Suggested Actions to Address Regional Inequity 89 Chapter Overview 91 1. Social Accessibility 92 1.2 Pilot Survey Discussion 92 1.1 Mobile Application Discussion 92 2. Availability & Transportation Accessibility 94 3. Equitable Planning & Financing Processes 96 Team Bios 100 Appendices 105 Appendix 1: Equity Glossary 106 Appendix 2: Stakeholder Interview Questions 116 Appendix 3: Social Accessibility Pilot Survey Questions and Results 122 Appendix 4: ParkScape Mobile Application 132 Appendix 5: GIS Methodology 138
vi Fostering Racial Equity in Access to Green Spaces Figure 1.1. A playground in Lower Huron River Metropark 04 Figure 1.2. Core Green Space Equity Principles. 08 Figure 2.1. Percent Households with No Car compared to the Location of All Southeast Michigan Green Spaces 14 Figure 3.1. Green spaces visited by team on March 22, 2023. 26 Figure 3.2. A playground in Lower Huron River Metropark with a sign indicating that it is designed for children ages 5 to 12 27 Figure 3.3. MoGo station, bike racks, a bike repair station, and a community center at Palmer Par 28 Figure 3.4. Sign explaining restoration upgrades at Palmer Park, which had amenities and recreational space in addition to more natural areas. 28 Figure 3.5. A bike path within a wooded natural area at Lower Huron River Metropark. 29 Figure 4.1. All Green Spaces across Southeast Michigan 37 Figure 4.2. All Green Spaces vs. Natural Areas across Southeast Michigan 38 Figure 4.4. Percentage of Green Spaces in Southeast Michigan with Basic Amenities 38 Figure 4.3. All Green Spaces vs. Basic Amenity Green Spaces across Southeast Michigan 38 Figure 4.5. Percent White per Census Tract vs. All Green Spaces across Southeast Michigan 39 Figure 4.6. All Green Spaces vs. Natural Areas and Basic Amenity Green Spaces across Southeast Michigan 39 Figure 4.7. Equity Emphasis vs. Green Space Acreage per 100 People 41 Figure 4.8. Equity Emphasis vs. Natural Area Acreage per 100 People 41 Figure 4.9. Equity Emphasis vs. Basic Amenity Green Space Acreage per 100 People 41 Figure 4.10. Pilot Survey Responses by SEMCOG ZIP Code Area 43 Figure 4.11. App Screen #3 and App Screen #6 44 Figure 4.12. Availability of all green spaces per 100 people (including natural areas and smaller neighborhood parks) 46 Figure 4.13. Availability of Natural Areas per 100 People 46 Figure 4.14. Availability of Basic Amenity Green Spaces per 100 People 46 Figure 4.16. Availability of natural areas compared to percentage of Black Residents in each county subdivision 47
LIST OF FIGURES
vii Pathways Towards Regional Equity Figure 4.15. Availability of all green spaces compared to percentage of Black Residents in each county subdivision 47 Figure 4.17. Availability of all basic amenity green spaces compared to percentage of Black Residents in each county subdivision 47 Figure 4.18. No. of green spaces within a 10-min walk 50 Figure 4.20. No. of natural areas within a 10-min walk 50 Figure 4.19. No. of green spaces within a 10-min bike trip 50 Figure 4.21. No. of natural areas within a 10-min bike trip 50 Figure 4.22. No. of green spaces within a 30-min transit trip 51 Figure 4.24. No. of natural areas within a 30-min transit trip 51 Figure 4.23. No. of green spaces within a 15-min drive 51 Figure 4.25. No. of natural areas within a 15-min drive 51 Figure 4.26. Percentage of area within a specified travel time to a green space via different modes, compared to percentage of Black Residents 52 Figure 4.27. Percentage of area within a specified travel time to a natural area via different modes, compared to percentage of Black Residents 53 Figure 5.1. Arnstein’s Ladder of Citizen Participation. 60 Figure 5.2. Strategic Racial Equity Framework. 62 Figure 5.3. The DIAD model. 68 Figure 5.4. The DIAD model. 72 Figure 5.5. Total MNRTF Funding by Black Population in Southeast Michigan Counties 76 Figure 6.1. Reccomendations for Equitable Access to Green Spaces 91 Figure 6.2. Social Accessibility Reccomendations 93 Figure 6.3. Availability and Transportation Accessibility Reccomendations 95 Figure 6.4. Equitable Planning and Funding Processes Reccomendations 97 Figure A.1. How often do you visit a green space? 124 Figure A.2. How do you usually get to green spaces? Check all that apply. 124 Figure A.3. Approximately how long of a walk from your home is in the nearest park or green space? 125 Figure A.4. Approximately how long of a walk from your home is in the nearest park or green space? 125 Figure A.5. How satisfied are you with each of the following terms of quality? 126 Figure A.6. How safe do you feel in your local green spaces? 126 Figure A.7. Do you agree with the following statement: all communities in Southeast
viii Fostering Racial Equity in
to Green
Michigan have equal access to green spaces? 127 Figure A.8. Do you agree with the following statement: green spaces are equally distributed across different neighborhoods in your community? 127 Figure A.9. What is your gender? 128 Figure A.10. What is your age range? 128 Figure A.11. Are you Hispanic/Latino? 129 Figure A.12. Are you Arab? 129 Figure A.13. What is your race/ethnicity? Check all that apply: 130 Figure A.14. What is your annual household income, before taxes? 130 Figure A.1. SEMCOG’s ParkFinder App 135 Figure 11.1. ParkScape App Mock-Ups 136 Figure A.1. GIS Methodology 139 Figure A.2. Percent Non-White of Total Population by Census Tract, Southeast Michigan 142 Figure A.3. Population Density per acre by Census Tract, Southeast Michigan 143 Figure A.4. Median Household Income by Census Tract, Southeast Michigan 144 Figure A.5. Percent Population Ages 65 & Up vs. All Green Space Acreage per 100 People by Census Tract 146 Figure A.6. Percent Population Ages 65 & Up vs. Natural Area Acreage per 100 People by Census Tract 147 Figure A.7. Percent Population Ages 65 & Up vs. Basic Amenity Space Acreage per 100 People by Census Tract 148 Figure A.8. Percent Population Children Ages 0 to 17 vs. All Green Space Acreage per 100 People by Census Tract 149 Figure A.9. Percent Population Children Ages 0 to 17 vs. Natural Area Acreage per 100 People by Census Tract 150 Figure A.10. Percent Population Children Ages 0 to 17 vs. Basic Amenity Space Acreage per 100 People by Census Tract 151 Figure A.11. Percent Minority of Total Population vs. All Green Space Acreage per 100 People by Census Tract 152 Figure A.12. Percent Minority of Total Population vs. Natural Area Acreage per 100 People by Census Tract 153 Figure A.13. Percent Minority of Total Population vs. Basic Amenity Green Space Acreage per 100 People by Census Tract 154 Figure A.14. Percent Households in Poverty vs. All Green Space Acreage per 100 People by Census Tract 155
Access
Spaces
ix Pathways Towards Regional Equity Figure A.15. Percent Households in Poverty vs. Natural Area Acreage per 100 People by Census Tract 156 Figure A.16. Percent Households in Poverty vs. Basic Amenity Green Space Acreage per 100 People by Census Tract Density per acre by Census Tract, Southeast Michigan 157 Figure A.17. Percent Households that are Transit-Dependent vs. All Green Space Acreage per 100 People by Census Tract 158 Figure A.18. Percent Households that are Transit-Dependent vs. Natural Area Acreage per 100 People by Census Tract 159 Figure A.19. Percent Households that are Transit-Dependent vs. Basic Amenity Green Space Acreage per 100 People by Census Tract 160 Figure A.20. Percent Black of Total Population vs. All Green Space Acreage per 100 People by Census Tract 161 Figure A.21. Percent Black of Total Population vs. Natural Area Acreage per 100 People by Census Tract 162 Figure A.22. Percent Black of Total Population vs. Basic Amenity Green Space Acreage per 100 People by Census Tract 163 Figure A.23. Percent Asian of Total Population vs. All Green Space Acreage per 100 People by Census Tract 164 Figure A.24. Percent Asian of Total Population vs. Natural Area Acreage per 100 People by Census Tract 165 Figure A.25. Percent Asian of Total Population vs. Basic Amenity Green Space Acreage per 100 People by Census Tract 166 Figure A.26. Percent Hispanic of Total Population vs. All Green Space Acreage per 100 People by Census Tract 167 Figure A.27. Percent Hispanic of Total Population vs. Natural Area Acreage per 100 People by Census Tract 168 Figure A.28. Percent Hispanic of Total Population vs. Basic Amenity Green Space Acreage per 100 People by Census Tract 169 Figure A.29. Percent All Other Minority of Total Population vs. All Green Space Acreage per 100 People by Census Tract 170 Figure A.30. Percent All Other Minority of Total Population vs. Natural Area Acreage per 100 People by Census Tract 171 Figure A.31. Percent All Other Minority of Total Population vs. Basic Amenity Green Space Acreage per 100 People by Census Tract 172 Figure A.32. Percent Households with Limited English Proficiency vs. All Green Space Acreage per 100 People by Census Tract 173 Figure A.33. Percent Households with Limited English Proficiency vs. Natural Area
x Fostering Racial Equity in Access to Green Spaces Acreage per 100 People by Census Tract 174 Figure A.34. Percent Households with Limited English Proficiency vs. Basic Amenity Green Space Acreage per 100 People by Census Tract 175 Figure A.35. Percent Households with No Car vs. All Green Space Acreage per 100 People by Census Tract 176 Figure A.36. Percent Households with No Car vs. Natural Area Acreage per 100 People by Census Tract 177 Figure A.37. Percent Households with No Car vs. Basic Amenity Green Space Acreage per 100 People by Census Tract 178 Figure A.38. Percent Households Housing Cost Burdened vs. All Green Space Acreage per 100 People by Census Tract 179 Figure A.39. Percent Households Housing Cost Burdened vs. Natural Area Acreage per 100 People by Census Tract 180 Figure A.40. Percent Households Housing Cost Burdened vs. Basic Amenity Green Space Acreage per 100 People by Census Tract 181 Figure A.41. Median Household Income vs. All Green Space Acreage per 100 People by Census Tract 182 Figure A.42. Median Household Income vs. Natural Area Acreage per 100 People by Census Tract 183 Figure A.43. Median Household Income vs. Basic Amenity Green Space Acreage per 100 People by Census Tract 184 Figure A.44. Percent Population with a Disability of Total Population vs. All Green Space Acreage per 100 People by Census Tract 185 Figure A.45. Percent Population with a Disability of Total Population vs. Natural Area Acreage per 100 People by Census Tract 186 Figure A.46. Percent Population with a Disability of Total Population vs. Basic Amenity Green Space Acreage per 100 People by Census Tract 187 Figure A.47. Unemployment Rate vs. All Green Space Acreage per 100 People by Census Tract 188 Figure A.48. Unemployment Rate vs. Natural Area Acreage per 100 People by Census Tract 189 Figure A.49. Unemployment Rate vs. Basic Amenity Green Space Acreage per 100 People by Census Tract 190
xi Pathways Towards Regional Equity
Table 4.1. Percentage of residents who can access a green or natural space by different transportation modes for specified travel times 49 Table 5.1. MNRTF & Demographic Characteristics of Southeast Michigan Counties 77 Table 5.2. Comparing MNRTF and Spark Grant Award Requirements and Distribution 79 Table 5.3. MNRTF Requirements & Core Principles of Green Space Equity 82
LIST OF TABLES
EXECUTIVE SUMMARY
Southeast Michigan has experienced social, racial, and economic inequalities for decades. Exclusionary policies and individual discrimination together have produced patterns of racial segregation that pose challenges to economic, physical, and social mobility today. Among these challenges is the focus of this report: stark disparities in equitable access to green spaces. To guide this capstone project, our team created and utilized five core principles of green space equity that were developed from leading theories:
1. Acknowledge and confront systemic oppression;
2. Discard universal approaches to localized issues;
3. Recenter community in process design and decision-making;
4. Build community power and capacity; and
5. Commit to sustained green space equity.
Following in the spirit of these principles,and to better understand the dimensions of equity and access in terms of green space access in the region, our team conducted interviews with various stakeholders and conducted supplementary research, resulting in a shared problem statement. This problem statement identified three major dimensions to accessibility (1) Social accessibility, (2) Green space availability and transportation accessibility, and (3) Embedding equity in the planning process. This report contains detailed analyses conducted across these three dimensions, resulting in key strategies for how the region can pursue greater equity in green space.
Our analysis of social accessibility to green spaces included exploring the connection between locations and regional demographic patterns, as well as investigating perceptions through interviews and a pilot survey. While there are many green spaces in the region, they are not equitably distributed geographically, making them inaccessible to many residents in the region. Additionally, our interviews and survey highlighted how marginalized communities face racial profiling, discrimination, and threats of physical harm when accessing green spaces, further reinforcing inequities in access along lines of race and identity.
To determine the geographic disparities in access to green space, our team performed a Geographic Information System (GIS) analysis of availability by population, transportation accessibility of green spaces and natural areas more specifically, and transportation access to green space and natural areas for the region’s Black population. Our analysis found that green space is less common in areas with higher percentages of Black populations. When differentiating between green spaces and natural areas, the differences are more stark: for the region’s Black residents, walkability, bikeability, and public transit access to natural areas is low. If looking at green space with a broader definition which includes neighborhood parks, accessibility for Black residents through transportation modes of walking, biking, and public transit access is much higher. Finally, our transportation network analysis revealed the regional differences in access to green space by walking, biking, public transit, and cars. When looking at natural areas only, access is much lower, especially within Detroit’s city limits. Our transportation analysis reveals the need for expanded bicycle and pedestrian networks, as well as better public transit connectivity.
xii
Fostering Racial Equity in Access to Green Spaces
Pathways Towards Regional Equity
Finally, we explored how to further embed equity in planning processes and institutions. To do this, we suggest a racial equity framework in order to avoid perpetuating and deepening racial inequalities in the allocation and improvement of green spaces in Southeast Michigan. The Strategic Racial Equity Framework offers three key principles in order to fulfill this objective:
(1) Attending to the relationships between power, race, and identities; (2) Actively naming and addressing hidden and visible indicators; and (3) Generating power among marginalized communities to create transformative policies.
We recommend stakeholders implement the spirit of this framework through the use of collaborative planning practices which foster improved collaboration and participation over conventional engagement approaches. We also suggest reforms to existing green space funding programs to foster greater equity. Various opportunities to invest in green space developments through traditional, private, and civic sources of funding are explored through an equity lens and subsequently recommended based on their implications for addressing the disparities our analyses have uncovered. Evidence of successful equity-based funding models in the parks and recreation space are presented as case studies and offered as guidelines to rectify a history of uneven community investments in quality and accessible green spaces.
Our team provide recommendations for various regional green space stakeholders. We recommend that the Michigan Environmental Coalition find the means to scale up the team’s pilot survey to get a representative sample of Southeast Michigan residents’ perceptions of green spaces. This will allow for a more informed analysis. Additionally, we recommend a web app concept that will bridge information gaps and in turn will reduce barriers to green spaces that stem from information-based limitations. The app was developed to consolidate public information regarding modes of green space access and promote various public events.
xiii
GREEN SPACE EQUITY KEY TERMS
The following are definitions of key concepts used in this report. Definitions for additional terms are contained in Appendix 1. We recognize there are diverse perspectives on these terms and concepts, but offer them to explain our perspective and to promote dialogue and discussion around the intersecting issues of equity, access, and inclusion in the region.
Equity Concepts and Practices
• Equity: An approach to policy and distribution of opportunity that “ensures that outcomes in the conditions of well-being are improved for marginalized groups, lifting outcomes for all. Equity is a measure of justice.”1 Equity acknowledges diversity in experience and the impact of history and social structures that advantage certain groups and disadvantage others. Equity entails differential allocation of opportunity for groups that have been disadvantaged.2
• Racial Equity: The “process of eliminating racial disparities and improving outcomes for everyone. It is the intentional and continual practice of changing policies, practices, systems, and structures by prioritizing measurable change in the lives of people of color.”3
• Justice: “Justice requires repairing and transforming circumstances, structure, contexts, and systems themselves so that they can achieve and sustain equity and justice through proactive and preventative measures.”4
• Environmental Justice: Environmental justice refers to “the right to a safe, healthy, productive, and sustainable environment for all, where ‘environment’ is considered in its totality to include the ecological (biological), physical (natural and built), social, political, aesthetic, and economic environments. Environmental justice refers to the conditions in which such a right can be freely exercised, whereby individual and group identities, needs, and dignities are preserved, fulfilled, and respected in a way that provides for self-actualization and personal and community empowerment. This term acknowledges environmental ‘injustice’ as the past and present state of affairs and expresses the sociopolitical objectives needed to address them.”5
• Equity Frameworks: Equity frameworks include concepts which provide an individual or an organization a foundation to guide their efforts to advance equity through intentional action. Equity frameworks assist individuals, organizations, and institutions in creating the conditions necessary to instill equity in their aims and action by highlighting its manifestation in intrapersonal, organizational, and societal institutions and practices. Frameworks often serve as a measure of accountability.
• Equality: “Equality requires that every person or community receives the exact same resources and opportunities.”6 Relates to equal distribution of opportunity, an approach commonly used in policy that lacks fundamental understandings of power imbalances
xiv Fostering
in
to
Racial Equity
Access
Green Spaces
between white and marginalized groups and is unlikely to produce equitable outcomes.7
• Color-blind/Race-neutral Frameworks: Color-blind and race-neutral frameworks are a dominant mode of “race consciousness” used by policy-makers that largely ignores critical dimensions of identity, which is ill equipped to address racial inequities. Colorblind frameworks “shift focus from addressing racial discrimination toward a more generalized goal of promoting diversity.”8 These diversity-centric approaches often disregard legitimate discussions of race in addressing inequity.
Inequity Context
• Structural Racism: Structural racism relates to “racial inequities across institutions, policies, social structures, history, and culture. Structural racism highlights how racism operates as a system of power with multiple interconnected, reinforcing, and selfperpetuating components which result in racial inequities across all indicators for success. Structural racism is the racial inequity that is deeply rooted and embedded in our history and culture and our economic, political, and legal systems.”9
• Intergenerational Immobility: Intergenerational immobility is “the transmission of disadvantages between generations in a variety of dimensions (e.g. income, education, occupations, and traits), and the extent to which these key characteristics and outcomes for children are similar to those for their parents.”10
• Marginalized Communities: Marginalized communities are “communities that experience discrimination and exclusion (social, political and economic) because of unequal power relationships across economic, political, social and cultural dimensions.”11 They are also described as “populations [that] include people who experience discrimination of any kind and encounter challenges (e.g., racial, ethnic, gender, sexual orientation, economic, cultural, and/or linguistic) to accessing goods and services.”12
Green Space Analysis and Planning
• Accessibility: As a planning concept, accessibility encompasses three distinct dimensions, which are addressed through different sections of the report: (1) physical and geographic accessibility, (2) social accessibility, and (3) historical patterns of investment.
о Green Space Availability and Transportation Accessibility: This includes Southeast Michigan residents’ proximity to green spaces; connectivity between residential and recreational spaces; and the extent to which mobility is supported through various modes of transportation, such as cars, public transit, walking, and biking.
о Social Accessibility: Social accessibility includes the extent to which an individual perceives their own sense of belonging in a space; perceived and felt
xv Pathways Towards Regional Equity
Fostering Racial Equity in Access to Green Spaces
safety in terms of active usage and threats of racial profiling; affordability of any entry fees into parks and green spaces; and challenges to accessing information. Compliance with the Americans with Disability Act (ADA) and accessibility as it relates to individuals with various abilities were also a focus of numerous interviews. The design of the space or facility is often identified as the source of a barrier to a green space.
о Historical Investment and Accessibility: Historical investment and accessibility explores discrepancies in green space quality and uneven geographic distributions that have a direct correlation to disinvestment of marginalized communities due to segregation and systemic policies of exclusion and opportunity withholding. The historic practice of redlining and its assessment of lending risk based on a city’s racial geography has longstanding impacts on disparities in investment that are explicitly tied to race. Both systemic and racist urban policies and procedures (such as racially restrictive covenants) shape present inequities.
• Quality of Green Space: Quality of green space can be measured to proximate committees in the scope of amenities, design, programming, natural quality, and overall staff capacity to maintain the space.
о Indicators of Green Space Quality: Indicators of green space quality is further explored in the “Understanding Green Space Quality” section of the report. Indicators can include: cleanliness, maintenance, ecological features, social uses, facilities, amenities, accessibility, safety, quietness, spaciousness, design, and aesthetics.
• Stakeholders: Stakeholders are all parties interested in and affected by decisions. Stakeholder identification involves recognizing “active” (those who affect a decision) and “passive” (those who are affected by a decision, either directly or indirectly) stakeholders as well as all other interested parties.13 It is important to note that some have proposed avoiding the term “stakeholder” due to its association with economic ownership, and, potentially, processes of colonization. In this analysis, we have followed the tradition in collaborative policy and planning to use the term “stakeholder” to encompass all affected and interested communities, groups, individuals, organizations, and institutions.
xvi
ENDNOTES
1. Race Forward, “What Is Racial Equity?”, Race Forward, accessed April 12, 2023, https://www. raceforward.org/about/what-is-racial-equity-key-concepts.
2. Elizabeth Green, “Understanding Equity and Justice,” Big Cities Health Coalition, June 1, 2022, https://www.bigcitieshealth.org/uha-understanding-equity-and-justice/.
3. Race Forward, “What Is Racial Equity?”
4. Green, “Understanding Equity and Justice.”
5. The University of Michigan, “Environmental Justice Definitions,” NRE 392 Coursepack: Environmental Justice, 1997, https://www.nmhealth.org/publication/view/help/309/.
6. Green, “Understanding Equity and Justice.”
7. Race Forward, “What Is Racial Equity?”
8. Liliana M. Garces and Cynthia Gordon da Cruz, “A Strategic Racial Equity Framework.” Peabody Journal of Education 92, no. 3 (2017): 326.
9. Race Forward, “What Is Racial Equity?”
10. Anna Cristina d’Addio, “Intergenerational Transmission of Disadvantage,” OECD Social, Employment and Migration Working Papers, no. 52 (2007): 10.
11. National Collaborating Centre for Determinants of Health, “Marginalized populations,” Glossary of Essential Health Equity Terms, accessed April 12, 2023, https://nccdh.ca/glossary/ entry/marginalized-populations.
12. Health Equity & Policy Lab, “Systematically Disadvantaged Populations, Areas And Facilities,” Health Equity & Policy Lab, 2019, https://www.healthequityandpolicylab.com/ underserved-populations-areas-and-facilities.
13. Mark S. Reed, Anil Graves, Norman Dandy, Helena Posthumus, Klaus Hubacek, Joe Morris, Christina Prell, Claire H. Quinn, and Lindsay C. Stringer, “Who’s in and Why? A Typology of Stakeholder Analysis Methods for Natural Resource Management,” Journal of Environmental Management 90, no. 5 (March 17, 2009): 1934.
xvii Pathways Towards Regional Equity
Belle Isle, Detroit
Source: Steve Neavling, “Belle Isle,” Detroit Metro Times, May 2020, https://www.metrotimes.com/news/belle-isle-closed-twice-sunday-over-largecrowds-but-not-because-of-social-distancing-24464527

Chapter 1 : A Vision of Green Space Equity
This chapter introduces the project’s origin and guiding equity principles that outline its relevance to the pursuit of racial equity.
In this Section: KEY TERMS:
1. Introduction
2. Report Structure
3. The Benefits of Green Space
4. Advancing Equity
4.1 Core Principles of Green Space Equity
Accessibility: As a planning concept, accessibility encompasses three distinct dimensions, which are addressed through different sections of the report: (1) physical and geographic accessibility, (2) social accessibility, and (3) historical patterns of investment.
Equality: “Equality requires that every person or community receives the exact same resources and opportunities.” Relates to equal distribution of opportunity, an approach commonly used in policy that lacks fundamental understandings of power imbalances between white and marginalized groups and is unlikely to produce equitable outcomes.
Equity: An approach to policy and distribution of opportunity that “ensures that outcomes in the conditions of well-being are improved for marginalized groups, lifting outcomes for all. Equity is a measure of justice.” Equity acknowledges diversity in experience and the impact of history and social structures that advantage certain groups and disadvantage others. Equity entails differential allocation of opportunity for groups that have been disadvantaged.
Equity Frameworks: Equity frameworks include concepts which provide an individual or an organization a foundation to guide their efforts to advance equity through intentional action. Equity frameworks assist individuals, organizations, and institutions in creating the conditions necessary to instill equity in their aims and action by highlighting its manifestation in intrapersonal, organizational, and societal institutions and practices. Frameworks often serve as a measure of accountability.
Quality of Green Space: Quality of green space can be measured to proximate committees in the scope of amenities, design, programming, natural quality, and overall staff capacity to maintain the space.
1. INTRODUCTION
Michigan is renowned for its scenic beauty and the state boasts millions of acres of permanently protected land in an extensive system of state and regional parks, public federal or conservation lands, and local parks. However, the state’s residents experience unequal access to these amenities. Stakeholders that work with state programs related to green space, as well as residents of the Southeast Michigan region, are increasingly concerned with disparities in the distribution, quality, and access to green spaces based on Michigan’s racial geographies. These discrepancies and related concerns are an issue of racial equity that have been long absent from discourse surrounding parks and recreation planning within the region.
Effectively addressing these access disparities requires acknowledging the history of disinvestment and taking a broad perspective on accessibility grounded in the experience of marginalized communities. To explore green space investment and access and generate useful suggestions, we used a modified version of the double diamond model for design, resulting into the following four phases:
1. Discovery
2. Problem Definition
3. Development of Analyses
4. Delivery of Recommendations
Our initial Discovery phase and subsequent Problem Definition phase was conducted collaboratively, and was based on 19 stakeholder interviews and other research. It resulted in a problem statement which identified social accessibility, green space availability and transportation accessibility, and resource constraints to the equitable access of green spaces on the basis of racial identity. Guided by five Core Principles of Green Space Equity, our team analyzed how each constraint to full accessibility is experienced across the Southeast Michigan region. Our recommendations respond to the present inequities of the region by providing possibilities for their rectification in both equitable planning processes and project outcomes.
2. REPORT STRUCTURE
The process, methods, and research our capstone team used for this project are organized in the following way:
A Vision of Green Space Equity (Chapter 1)
This chapter introduces the project’s origin and guiding equity principles that outline its relevance to the pursuit of racial equity.
03 Chapter 1: A Vision of
Green Space Equity
Regional Forces of Inequity (Chapter 2)
This chapter provides historical context to the region and the ways in which disinvestment of marginalized communities is a driver of inequity, including in the accessibility of green spaces.
Understanding Disparities in Access to Green Space (Chapter 3)
This chapter outlines our team’s preliminary research and methods within the problem discovery and definition phase of the project. In this stage of the project, our team sought to define the problem and produce a problem statement through exploratory interviews and field visits to parks and green spaces across the region.
Green Space Analysis (Chapter 4)
This section provides spatial and survey analysis of green space access in Southeast Michigan to illustrate dimensions and characteristics of green space availability, as well as social and transportation-related barriers to access.

Embedding Equity in the Planning Process (Chapter 5)
This chapter explores equity in both the processes and outcomes of planning for green spaces and provides context and research for communities to consider in their own endeavors. Equitable financing options are explored as tools to aiding community autonomy in their own processes of decision-making.
04 Fostering
Racial Equity in Access to Green Spaces
Source: Capstone team field visit, 3/22/23.
Figure 1.1. A playground in Lower Huron River Metropark
Suggested Actions to Address Regional Inequity (Chapter 6)
This section contains a series of recommendations and guidelines for communities to consider as they seek to mitigate inequitable access to green spaces. Recommendations include considerations for physical access, including infrastructure for various modalities of transportation and geographic location of green spaces; social access, inclusivity, and information-sharing; and opportunities to pursue equitable processes of planning and financing.
3. THE BENEFITS OF GREEN SPACE
Green spaces, ranging from neighborhood parks to larger nature preserves with conservation functions, have been integral to urban planning and the structure of cities for decades, and there is a growing awareness of the many benefits they provide.
Green spaces provide important environmental benefits, such as carbon sequestration and stormwater management, that have far-reaching benefits to the overall health of a community.1 In urban areas especially, green space can help manage runoff through stormwater retention, creating permeable surfaces that filter stormwater and keep it from polluting local waterways.2 Similarly, it can act as green stormwater infrastructure that reduces flooding by absorbing, filtering, and storing excess stormwater.3 Because parts of Southeast Michigan exist in floodplains and don’t have proper mitigation infrastructure, the risk of environmental and human health hazards is likely to increase during storm events.4 Green space is especially beneficial in more “porous” natural landscapes, including meadows and forests, and these types of landscapes typically feature native plants that are more hardy and less water intensive.5 Additionally, green spaces are cooling which helps reduce the urban heat island effect in which impervious, paved surfaces absorb and emit heat in highly urbanized areas.6
Additionally, green spaces also provide many social benefits. Green spaces and their relative quality may have implications for the degree of satisfaction that residents of a neighborhood feel about their surroundings. One study found positive relationships between neighborhood satisfaction and quality of green space, as well as neighborhood satisfaction and well-being, indicating that green space quality may be an indirect predictor of well-being.7 Additionally, people value green space that can be used socially. One public health researcher notes, “if it’s a social space, where people meet together and chat and go on walks…that’s probably where the real impact is coming from that gives people a sense of well-being.”8 There are also social benefits for people of all ages; parks may be more inviting to children and adolescents if they create social opportunities by providing facilities like playgrounds and sports fields.9
Despite the well-established public health, social, and environmental health benefits that green spaces offer, access to green space is not equitable for all communities, particularly marginalized populations and those with lower incomes.10 There is also evidence of disparities in tree canopy coverage for lower income communities.11 These findings raise concerns about runoff management, heat island effects, and other environmental and health-related issues. As our analysis on green space availability in Chapter 4 of this report details, access to natural
05 Chapter 1: A Vision of Green Space Equity
areas is not equitable in Southeast Michigan, and access to natural areas specifically is severely lacking in the City of Detroit and other communities near the region’s center.
It is essential to ensure that green spaces are accessible to all, and the quality of these spaces must be assessed and maintained. When it comes to green space, some studies find that the quality of these spaces may have a stronger effect on individual neighborhood satisfaction than quantity.12 Quality judgments may vary, but research finds that various dimensions, such as cleanliness, maintenance, ecological features, facilities and amenities, feelings of safety, and the ability for people of all ages to use green spaces socially, are important to people’s perceptions about the quality of green space. Therefore, it is important to focus on both the quality of green spaces available to residents and their proximity to them. By fostering racial equity in access to green spaces, Southeast Michigan can promote a more just and sustainable future for all.
4. ADVANCING EQUITY
In planning, equity is commonly understood as the use of equitable and inclusive processes to spur equitable outcomes. This project examines both facets of equity planning in depth. Part of the scope of this project entailed developing a concrete understanding of equity to undergird the entire report through shared principles of equity. These principles are outlined in the “Core Principles of Green Space Equity” subsection later in this chapter and in “Chapter 5: Embedding Equity in the Planning Process” of the report.
Our team investigated the diversity and complexity of perspectives on equity and, through conversations with stakeholders and preliminary research, arrived at principles relevant to the Michigan Environmental Council (MEC) and other regional stakeholders that we present and encourage for their consideration. When speaking with different stakeholders to grasp a better understanding of equity, the distinction between equity and equality, as well as the concept of justice, were commonly referenced (see “Green Space Equity Key Terms” section at the beginning of this report for detailed definitions). The majority of stakeholders described equity as a commitment that accounts for historic marginalization and relates to justice while the pursuit of equality lacks a critical attention to historic imbalances in distribution of opportunity.
A familiarity with the general principles of equity is important to assist in developing more targeted strategies that tackle specific cases of disparity along the lines of identity in a fixed scope. By reviewing many different equity frameworks, our team identified common themes and emergent equity principles across various scales and institutions. The research illuminated that common principles of equity often emphasize understanding, intentionality, and accountability and commitment:
• Understanding: A commitment to continuous learning that surrounds the root causes of systematic exclusion and its various manifestations across levels. Developing and learning language and skills that address inequity and power discrepancies are ways to work towards more equitable outcomes.13
06 Fostering
Racial Equity in Access to Green Spaces
• Intentionality: Embracing active and intentional approaches to combat inequity, starting with the recognition and direct inclusion of groups that historically and/or currently face exclusion in order to establish a fair distribution of opportunity.14
• Accountability and Commitment: Creating mechanisms for both organizational and community accountability and commitment to further institutional change to both repair lasting harm and actualize equitable outcomes.15
To assist MEC in promoting equitable access to green space while simultaneously ensuring that equity is the basis of both this analysis and the outcomes that may result from its findings and recommendations, our team has developed the Core Principles of Green Space Equity. Existing general and race-specific equity frameworks (detailed in Chapter 5) have informed our team’s approach to creating these principles. Additional resources to assist MEC in communicating principles of equity can be found in Appendix 1.
4.1 Core Principles of Green Space Equity
Communities in Southeast Michigan do not enjoy equitable access to high quality green space; centering equity in green space planning is central to improving outcomes for all residents. In addition to research on green space equity methods, the following actions have also informed our team’s approach to crafting core principles of green space equity: interviewing professionals in the equity space, analyzing findings from a survey distributed to residents surrounding green space access, and an interview with a long-term resident about personal experience in green spaces. The core principles of green space equity are as follows (see Figure 1.2):
• Acknowledge and Confront Systemic Oppression: Pervasive systematic oppression upholds both visible and invisible challenges to accessing green space. Recognizing historic racial inequities and environmental injustices that disproportionately impact marginalized communities in access to green space is critical in advocating for transformative change.
• Discard Universal Approaches to Highly-Specific Localized Issues: Communities are not a monolith; “one-size-fits-all” planning and policy actions are ill-equipped to address varied community needs across broad geographies. Acknowledging and embracing diversity within and between communities is key in delivering effective, equitable outcomes.
• Center Community in Process Design and Decision-making: Empowering communitydriven planning by providing information and resources rather than prescribing outcomes at each stage of green space planning, implementation, evaluation, and management is necessary to co-create spaces that are reflective of local identities and needs.
• Build Community Power and Capacity: Support community capacity building efforts
07 Chapter 1: A Vision of Green Space Equity
Fostering Racial Equity in Access to Green Spaces
through knowledge and resource sharing, relationship building, and direct inclusion in green space planning to amplify power among marginalized communities.

• Commit to Sustained Green Space Equity: Create direct channels of accountability to achieve green space equity. Resource equity must be a central aim of organizations tasked with the allocation, betterment, and management of green spaces to produce lasting impact. Explicitly stating the prioritization of green space equity and dedicating financial resources and time to further this aim can assign accountability in strengthening equity.
This report encapsulates the Core Principles of Green Space Equity by offering recommendations to MEC and other relevant regional stakeholders to actualize the vision of greater regional green space equity. The report offers recommendations for using a Strategic Racial Equity Framework to acknowledge systematic oppression, adopting collaborative
08
Source: Template provided by Slidesgo and Freepik, graphic created by Kathryn Economou.
Figure 1.2. Core Green Space Equity Principles.
ENDNOTES
1. Yang Zhang, Agnes E. Van den Berg, Terry Van Dijk, and Gerd Weitkamp. “Quality over Quantity: Contribution of Urban Green Space to Neighborhood Satisfaction,” International Journal of Environmental Research and Public Health 14, no. 5 (2017): 535.
2. NRDC, “Green Infrastructure: How to Manage Water in a Sustainable Way,” National Resources Defense Council, July 25, 2022, https://www.nrdc.org/stories/green-infrastructurehow-manage-water-sustainable-way.
3. Erica Gies, “As Floods Increase, Cities like Detroit Are Looking to Green Stormwater Infrastructure,” Ensia, April 16, 2019, https://ensia.com/features/flooding-increase-cities-livewith-water-green-stormwater-infrastructure/.
4. Gies, “Cities like Detroit Are Looking to Green Stormwater Infrastructure.”
5. NRDC, “Green Infrastructure”; Laura Daily, “Grass is a water hog. Here’s how to create a drought-tolerant yard,” The Washington Post, June 29, 2022, https://www.washingtonpost.com/ home/2022/06/29/drought-tolerant-plants-yard/.
6. U.S. Environmental Protection Agency, “Reduce Urban Heat Island Effect,” U.S. Environmental Protection Agency, March 6, 2023, https://www.epa.gov/green-infrastructure/ reduce-urban-heat-island-effect.
7. Zhang et. al, “Quality over Quantity.”
8. Abigail Abrams, “What Green Spaces Can Do to Your Mood,” Time, August 7, 2017, https:// time.com/4881665/green-spaces-nature-happiness/.
9. Gavin R. McCormack, Melanie Rock, Ann M. Toohey, and Danica Hignell, “Characteristics of urban parks associated with park use and physical activity: a review of qualitative research,” Health Place 16, no. 4 (2010): 716.
10. Salvatore Saporito and Daniel Casey, “Are There Relationships Among Racial Segregation, Economic Isolation, and Proximity to Green Space?” Human Ecology Review 21, no. 2 (2015):
113; Jennifer Wolch, John P. Wilson, and Jed Fehrenbach, “Parks and Park Funding in Los Angeles: An Equity-Mapping Analysis,” Urban Geography 26, no. 1 (2005): 4-35.
11. Kirsten Schwarz, Michail Fragkias, Christopher G. Boone, Weiqi Zhou, Melissa McHale, J. Morgan Grove, Jarlath O’Neil-Dunn, Joseph P. McFadden, Geoffrey L. Buckley, Dan Childers, Laura Ogden, Stephanie Pincetl, Diane Pataki, Ali Whitmer, and Mary L. Cadenasso, “Trees Grow on Money: Urban Tree Canopy Cover and Environmental Justice,” PLoS ONE 10, no. 4 (2015): 1-17.
12. Zhang et al., “Quality over Quantity,” 535.
13. Garces and Gordon da Cruz, “A Strategic Racial Equity Framework,” 331.
14. Piper Anderson, “Building a Culture of Accountability,” Stanford Social Innovation Review, June 28, 2021, https://ssir.org/articles/entry/building_a_culture_of_accountability.
15. Anderson, “Building a Culture of Accountability.”
09 Chapter 1: A
Vision of Green Space Equity
 Source: Capstone team field visit, 3/22/23.
Lower Huron Metropark, Belleville
Source: Capstone team field visit, 3/22/23.
Lower Huron Metropark, Belleville
Chapter 2 : Regional Forces of Inequity
This chapter provides historical context to the region and the ways in which disinvestment of marginalized communities is a driver of inequity, including in the accessibility of green spaces.
In this Section: KEY TERMS:
1. The Context: Southeast Michigan
1.1 Challenges to Economic, Social, and Physical Mobility
1.2 Recent Research on Green Space Inequities
Marginalized Communities: Marginalized communities are “communities that experience discrimination and exclusion (social, political and economic) because of unequal power relationships across economic, political, social and cultural dimensions.”1 They are also described as “populations [that] include people who experience discrimination of any kind and encounter challenges (e.g., racial, ethnic, gender, sexual orientation, economic, cultural, and/or linguistic) to accessing goods and services.”2
Historical Investment and Accessibility: Historical investment and accessibility explores discrepancies in green space quality and uneven geographic distributions that have a direct correlation to disinvestment of marginalized communities due to segregation and systemic policies of exclusion and opportunity withholding. The historic practice of redlining and its assessment of lending risk based on a city’s racial geography has longstanding impacts on disparities in investment that are explicitly tied to race. Both systemic and racist urban policies and procedures (such as racially restrictive covenants) shape present inequities.3
CHAPTER OVERVIEW
In order to set the stage for our analysis of contemporary patterns, this chapter provides an overview of some of the forces which have resulted in regional racial inequity in Southeast Michigan, as well as what researchers have learned through investigations of this topic in Michigan and elsewhere. By providing this brief introduction, we invite readers to deepen their own understanding of history as an essential first step towards a more equitable future.
1. THE CONTEXT: SOUTHEAST MICHIGAN
The long and complicated history of redlining and intentional racial segregation has had a profound impact on Southeast Michigan’s socioeconomic and racial geographies that persist in the region. In 2020, 78 percent of Detroit’s population was Black, the highest proportion of any major city in the United States. Conversely, only 23 percent of Detroit’s metropolitan population is Black, while 68 percent is White. This illustrates the severity of the region’s racial segregation, with the region’s Black population concentrated in the urban core. The spatial patterns of racial settlement in the region contribute to Detroit’s standing as the most racially segregated region in the country.4 Intertwined with racial segregation is economic segregation which has resulted in socioeconomic divisions across communities.
1.1 Challenges to Economic, Social, and Physical Mobility
The intertwined pattern of racial and socioeconomic segregation is the product of many forces, including discrimination against and oppression of Black residents, and related stigma against public transit, the prioritization of suburban expansion and infrastructure investment, and other policies.5 Coupled with systemic policies and practices which have fostered segregation, unequal distributions of wealth and opportunities, and challenges to homeownership, Detroit’s transportation systems have also shaped the city and region, and played a huge role in its disinvestment.
The rise of personal automobiles led to policy shifts in Michigan and nationwide to invest heavily in highway and auto infrastructure and not public transit, fostering a sprawling and segregated region. With many Black households not owning a car and being heavily reliant on public transit, these policies harmed Black communities by hindering their access to regional opportunity.6 These supposedly “race-neutral” federal transportation policies provided an advantage to mostly white suburbanites who commuted by car, and resulted in a flow of public and private resources and investments toward affluent communities and away from residents of traditional urban centers.7
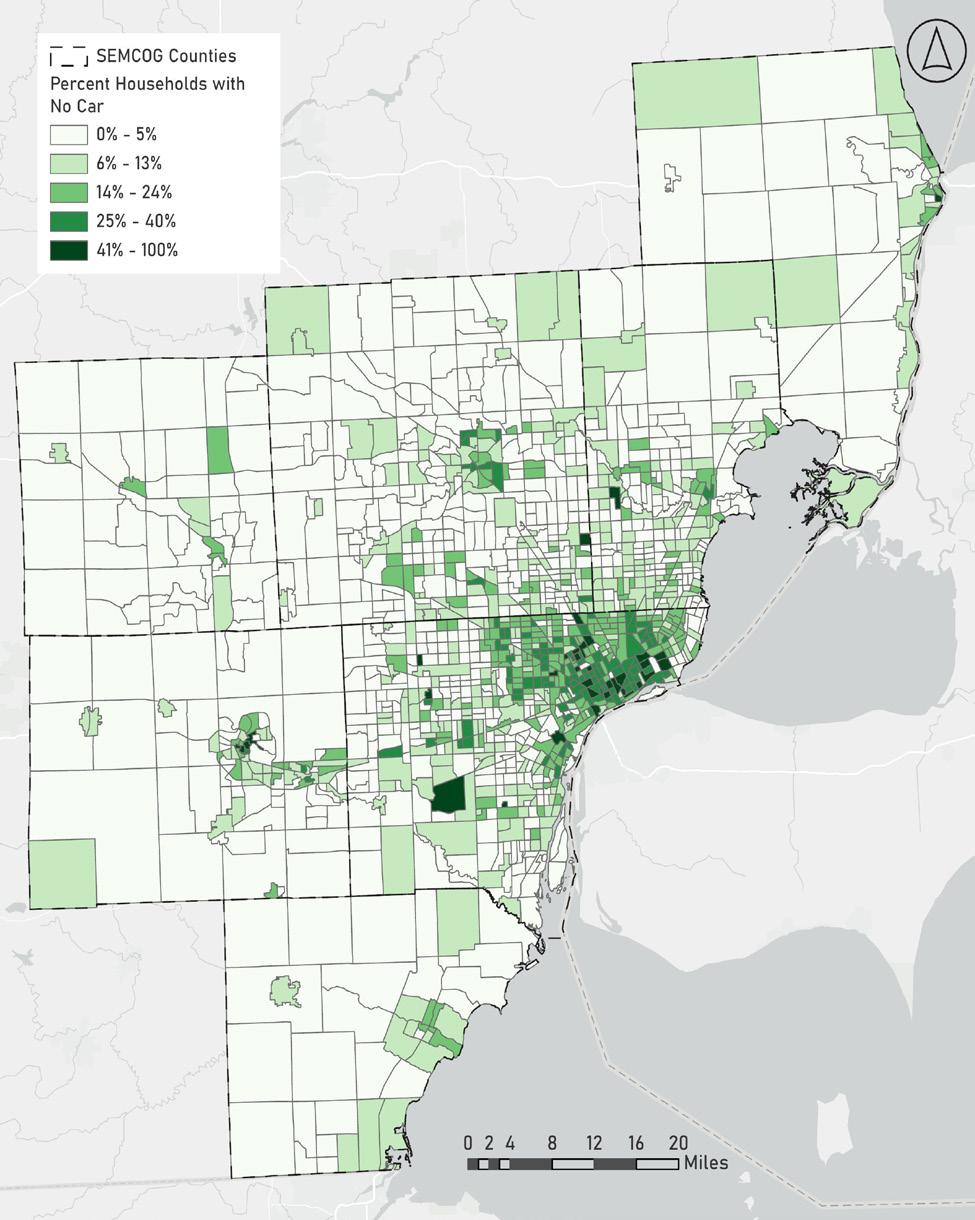
According to the U.S. Census Bureau, in 2019, only 73.5 percent of households in Detroit owned a car, compared to a national average of 91.5 percent.8 Figure 2.1 evinces these metrics. The 2017 Detroit Metropolitan Area Communities Study survey found similar results. With a large
13 Chapter
2: Regional Forces of Inequity
Fostering Racial Equity in Access to Green Spaces
proportion of the city relying on private vehicles and the lower costs of auto insurance, public transportation, which remains a main mode of transportation for carless households, has not been prioritized.9
Affluent white neighborhoods in Southeast Michigan have consistently received funding dollars for park infrastructure while redlined neighborhoods suffered. Those neighborhoods also had greater financial capacity to navigate state and federal programs to secure park dollars. Consequently, parks in or near wealthy neighborhoods had better recreational infrastructure which the small pocket parks of the city’s predominantly Black neighborhoods lacked. This discrepancy was further exacerbated by cuts in funding for public parks after Detroit lost nearly 150,000 manufacturing jobs in the years following World War II. The remaining funding for park maintenance was used for urban renewal projects like highway building, and redlined neighborhoods saw a sharp decrease in investment in green and open spaces.10
Broader patterns of municipal finance have also impacted the ability of different communities to provide high-quality green spaces for their residents. Limited access and inadequate resourcing resulted in burdensome financial stresses for municipalities as they tried to make

14
Source: SEMCOG 2022, USCB 2016-2020 ACS
2.1.
Percent Households with No Car Percent Households with No Car vs. Regional Green Spaces
5-year estimates Figure
Percent Households with No Car compared to the Location of All Southeast Michigan Green Spaces
decisions about where investment should be directed. The impact of these difficult decisions were especially pronounced during the mortgage crisis of 2008 when seven municipalities in the Detroit metropolitan area were placed under the control of state-appointed emergency management between 2009 and 2013, right before Detroit declared bankruptcy.11 These seven emergency-managed cities were home to 66.1 percent of the Black population in the Detroit metropolitan area, and just 5.6 percent of the area’s white population. This illustrates a general trend that relates the region’s racial composition to fiscal capacity and general spending ability.12
In the time of emergency management, newly appointed managers enacted massive budget cuts to essential and nonessential services, including parks and recreation programming. This happened without the consent of the public or their elected officials, disproportionately disenfranchising marginalized populations in their ability to voice their own priorities for how their municipality’s money should have been managed. Prior to declaring bankruptcy in 2013, Detroit’s local governmental officials slashed department budgets and closed nearly 50 parks across the city, exacerbating the need for green space in the region’s urban core.13 Fortunately, investments in parks in the City of Detroit have been increasing recently but there remains many needs due to a legacy of past disinvestment.
1.2 Recent Research on Green Space Inequities
As part of our project, we reviewed research investigating green space inequities in Southeast Michigan and beyond. While these studies do not directly address how to solve the lack of access to green spaces in Southeast Michigan, this research provides useful information that has helped to shape our understanding of the issue, our analyses, and suggestions for more equitable planning processes and outcomes.
Several studies have identified racial disparities in green space access at the neighborhood and city levels. For example, the Trust for Public Land found that cities with majority Black populations tend to have less park acreage. Just five percent of the land in Memphis, Tennessee is dedicated to parkland; in Baton Rouge, Louisiana, only three percent of the city is dedicated to parkland. The severity of these limited designations are illustrated when compared to the national median of 15 percent.14 One study that looked at green space access in Atlanta found uneven distribution of “spatial accessibility” to green space and that Black residents of Atlanta have a “deprivation” of access.15 Though not exactly measuring green space equity, researchers Zhou and Kim found that neighborhoods with large numbers of racial and ethnic minorities have lower tree canopy coverage than whiter neighborhoods.16
There are also notable differences in green space access when considering income levels.17
Researchers in one study found that low-income neighborhoods in U.S. cities have less tree canopy coverage compared to wealthier neighborhoods.18 However, while this may be the case for tree canopy coverage, it may not hold true for proximity to green spaces; a U.S.-based study looking at five cities, including Detroit, found that when the results are statistically significant, low-income individuals are located closer to parks.19 However, this speaks to green space access
15
Chapter 2: Regional Forces of Inequity
Fostering Racial Equity in Access to Green Spaces
in general rather than access to more specific types of green spaces, including the natural areas that many of our analyses emphasize.
It is also important to consider how local governments in Michigan currently think about equity during the planning process. Carolyn G. Loh and Rose Kim’s equity evaluation tool determines the extent of equitable goals in local governments’ comprehensive plans in the state of Michigan. They determined that statewide, very few Michigan communities consider equity in their master plans which is a likely contributor to the green space accessibility issues that we see in the state currently.20 Less than half of the plans that Loh and Kim studied mentioned the word equity or similar concepts (like equality, justice, and fairness). Master plans that mentioned equity tended to be more recent, and were more likely to be from communities with more planners working in them (i.e. greater capacity). They were also more likely to come from communities that practiced more participatory planning methods.21 Loh and Kim recommend that communities make equity a main organizing principle of master plans, so that the planning process can do a better job representing diverse resident voices, creating equitable transit options, and highlighting major land use changes.22
These inequities are examined further in Chapter 4, where our team analyzes green space accessibility using GIS data and a pilot social accessibility survey. Changes to green space planning processes are described in Chapter 5. Prior to that, our team sought to define the problem through exploratory interviews and field visits, which is described in the following chapter.
16
ENDNOTES
1. National Collaborating Centre for Determinants of Health, “Marginalized populations,” Glossary of Essential Health Equity Terms, accessed April 12, 2023, https://nccdh.ca/glossary/ entry/marginalized-populations.
2. Health Equity & Policy Lab, “Systematically Disadvantaged Populations, Areas And Facilities,” Health Equity & Policy Lab, 2019, https://www.healthequityandpolicylab.com/ underserved-populations-areas-and-facilities.
3. Race Forward, “What Is Racial Equity?”, Race Forward, accessed April 12, 2023, https://www. raceforward.org/about/what-is-racial-equity-key-concepts.
4. Othering and Belonging Institute, “City Snapshot: Detroit,” Othering and Belonging Institute, accessed April 9, 2023, https://belonging.berkeley.edu/city-snapshot-detroit.
5. June Manning Thomas, “The Making of a City: Detroit and the Metropolitan Context,” in Mapping Detroit: Land, Community, and Shaping a City, ed. June Manning Thomas and Henco Bekkering (Detroit: Wayne State University Press, 2015), 17-37.
6. Clare Eby and Sarah Jo Peterson, “A Fare Share: A Proposed Solution to Address the Racial Disparity in Access to Public Transportation Funding in America,” Michigan Journal of Race & Law 26, no. 1 (2020): 307-340.
7. Amanda Hess, “Race, Class and the Stigma of Riding the Bus in America,” Bloomberg Citylab, July 10, 2012, https://www.bloomberg.com/news/articles/2012-07-10/race-class-and-thestigma-of-riding-the-bus-in-america.
8. U.S. Census Bureau, “Table B25044: Tenure by Vehicles Available,” 2019 American Community Survey 1-Year Estimates, accessed April 16, 2023, https://data.census.gov/cedsci/ table?q=B25044&hidePreview=true&tid=ACSDT1Y2019.B25044.
9. University of Michigan Poverty Solutions, “The Detroit Metropolitan Area Communities Survey Winter 2017 Summary Report,” University of Michigan Poverty Solutions, 2017, https:// poverty.umich.edu/files/2018/04/winter-2017-summary-report-final.pdf.
10. Mickey Lyons, “In search of greenspace equity: A short history of Detroit’s parks,” Planet Detroit, February 1, 2023, https://planetdetroit.org/2023/02/in-search-of-greenspace-equity-ashort-history-of-detroits-parks/.
11. Alexa K. Eisenberg, “Race, Property, and Population Health: Examining Policy-Driven Patterns of Whiteness, Anti-Blackness and Health Inequity in Metropolitan Detroit” (doctoral dissertation, University of Michigan, 2021), 66.
12. Eisenberg, “Race, Property, and Population Health,” 66.
13. Eisenberg, 66.
14. Shivani Shukla, “Racial Disparities in Access to Public Green Space,” Chicago Policy Review, September 23, 2020, https://chicagopolicyreview.org/2020/09/23/racial-disparity-in-access-topublic-green-space/.
15. Dai, Dajun, “Racial/ethnic and socioeconomic disparities in urban green space accessibility:
17
Chapter 2: Regional Forces of Inequity
Fostering Racial Equity in Access to Green Spaces
Where to intervene?”, Landscape and Urban Planning 102, no. 4 (2011): 234-244.
16. Xiaolu Zhou and Jinki Kim, “Social disparities in tree canopy and park accessibility: A case study of six cities in Illinois using GIS and remote sensing,” Urban Forestry & Urban Greening 12, no. 1 (2013): 88.
17. Zhou and Kim, “Social disparities in tree canopy and park accessibility,” 94; Lorien Nesbitt, Michael J. Meitner, Cynthia Girling, Stephen R.J. Sheppard, Yuhao Lu, “Who has access to urban vegetation? A spatial analysis of distributional green equity in 10 US cities,” Landscape and Urban Planning 181 (2019): 64; Shukla, “Racial Disparities in Access to Public Green Space.”
18. Schwarz et al. “Trees Grow on Money,” 1.
19. Tim G. Williams, Tom M. Logan, Connie T. Zuo, Kevin D. Liberman, and Seth D. Guikema, “Parks and safety: a comparative study of green space access and inequity in five U.S. cities,” Landscape and Urban Planning 201 (2020): 9.
20. Carolyn C. Loh and Rose Kim, “Are We Planning for Equity?: Equity Goals and Recommendations in Local Comprehensive Plans,” Journal of the American Planning Association 87, no. 2 (2021): 181.
21. Loh and Kim, “Are We Planning for Equity?”, 189-190.
22. Loh and Kim, 191.
18
 Source: Capstone team field visit, 3/22/23.
A Playground in Lower Huron Metropark, Belleville
Source: Capstone team field visit, 3/22/23.
A Playground in Lower Huron Metropark, Belleville
Chapter 3 : Defining Disparities in Access to Green Space
This chapter outlines our team’s preliminary research and methods within the problem discovery and definition phase of the project. Our team sought to define the problem and produce a problem statement through exploratory stakeholder interviews and field visits to parks and green spaces across the region.
In this Section: KEY TERMS:
1. Understanding Access & Equity
1.1 Interview Themes & Takeaways
2. Green Space Visits
2.1 Field Oberservations & Takeaways
Equity (Racial Context): “Ensures that outcomes in the conditions of well-being are improved for marginalized groups, lifting outcomes for all. Equity is a measure of justice.”1
Equity: “The fair treatment, access, opportunity and advancement for all people, while at the same time striving to identify and eliminate setbacks that prevent the full participation of some groups. The principle of equity acknowledges that there are historically underserved and underrepresented populations and that fairness regarding these unbalanced conditions is necessary to provide equal opportunities to all groups.”2
Racial Equity: “A process of eliminating racial disparities and improving outcomes for everyone. It is the intentional and continual practice of changing policies, practices, systems, and structures by prioritizing measurable change in the lives of people of color.”3
1. UNDERSTANDING ACCESS & EQUITY
From its inception, this project adopted a collaborative approach to comprehensively identify and understand how inequitable access to green space manifests across Southeast Michigan. In keeping with this approach, we sought the input from regional stakeholders to help us define the project’s broad topical focus. Doing so helped make these ideas more tangible in real-life practice and comprehensively establish a foundational understanding of our project goals.
To develop a problem statement that captured the nuances and roots of challenges to access, our team conducted a round of interviews with a wide range of stakeholders conducted in concert with other background research. During our initial round of exploratory research, our team used digital resources and published materials to investigate a range of topics both within Michigan and more broadly in the planning field, including parks and recreation planning, regional park systems within the state, mechanisms of funding, equity frameworks and approaches, histories of disinvestment, community advocacy groups, and more. From this preliminary research, we developed a list of 28 individuals and organizations to speak with, 19 of whom agreed to participate in interviews. The groups of stakeholders we spoke to broadly represented work that is currently taking place in the domains of diversity, equity, and inclusion (DEI) promotion and implementation, residential and neighborhood advocacy, park planning, outdoor recreation grant funding, and statewide coalition building for the purpose of promoting environmental stewardship and outdoor recreation.
Our team conducted these interviews using a semi-structured protocol (detailed in Appendix 2) to allow interviewees to discuss and share insights about the following topics:
• Categorization, definition, and importance of green space
• General accessibility and related challenges as they relate to outdoor recreation
• The types of outdoor spaces that are important to people
• Differences in access that relate to identity and race
• The role and promotion of equity in their respective positions
• Specific information about their own roles in relation to the trajectory of our project
Upon completion of the 19 interviews, we collectively reviewed interview notes, transcripts, and key takeaways from each conversation to synthesize an understanding of how equity in general, racial equity in particular, dimensions of accessibility, and green space are discussed and understood among direct stakeholders. We also gained initial anecdotal evidence of the challenges to accessing green spaces along lines of race which informed our guiding problem statement and shaped the research focus of the project.
1.1 Interview Themes & Takeaways
Understanding Accessibility: In defining accessibility, our interviewees overwhelmingly acknowledged and affirmed that challenges to equitable access manifest in numerous and varied ways. Broadly speaking, physical, geographic, social, and monetary characteristics that relate to and impact the quality and distribution of green space were all identified as significant
23
Chapter 3: Defining Disparities in Access to Green Spaces
Fostering Racial Equity in Access to Green Spaces
challenges to the full enjoyment and utilization of green spaces.
• Physical and geographic challenges to green space access include Southeast Michigan residents’ proximity to green spaces; connectivity between residential and recreational spaces; and the existence of infrastructure supporting mobility to reach green spaces through various modes, including by car, public transit, walking and biking. Interviewees described how transit access for low-income, transit-dependent households is a big issue in the region; getting people anywhere in modes other than by car is an especially weak spot. They offered insights into a pilot program led by SMART to connect people to Lake St. Clair Metropark using on-demand transit, but indicated there were logistical issues with running this program and that future programs that connect people to green spaces through transit should focus on expanding partnerships with providers. Compliance with the Americans with Disabilities Act and accessibility as it relates to individuals with various abilities was also a focus of numerous interviews which often identified the design of the space or facility as a barrier to usage.
• Social challenges to green space access include the following experiences:
• The extent to which an individual perceives their own sense of belonging in a space;
• Perceived and felt safety regarding threats of racial profiling;
• Affordability of any entry fees into green spaces; and
• Challenges to accessing information and knowing which spaces are open to the public.
• Financial limitations to accessing well-resourced green spaces include past and present elements of unequal access to funding. Policies that promoted spatial segregation between races also rendered marginalized communities at a disadvantage when local and state decision-makers made investments in parks and recreational spaces. Interviewees also discussed the benefits and limitations of existing grant programs in both the application and allocation process, highlighting the likelihood that their execution may also perpetuate inequities in green space availability and quality.
Consider the Type and Quality of Green Space: An individual’s ability to access green spaces and areas of outdoor recreation is further complicated by considering the quality, amenities, and components of each green space and/or recreational facility. An individual’s physical proximity or transportation-based access to green spaces does not fully account for the quality of what is being accessed in terms of the amenities, design, programming, natural quality, and overall staff capacity to maintain the space.
Historic Disinvestment
as a Driver of Challenges to Access:
Discrepancies in green space quality and uneven geographic distributions have a direct correlation to histories of disinvestment for marginalized communities as informed by regional segregation, redlining, and opportunity withholding. The historic practice of redlining and its assessment of lending risk based on a city’s racial geography has longstanding impacts on disparities in investment that are explicitly tied to race. Both systemic and racist urban policies and procedures (such as racially restrictive covenants) have retained significance into the present across the United States, and
24
certainly in Michigan.
Racial Equity as both Abstract and Ultra-Tangible: Racial equity and the broad idea of equality are understood and discussed to varying degrees among stakeholder groups and, presumably, across the region at large. Interviewees across stakeholder groups generally acknowledged that equality is different from equity in that equality focuses on sameness and standardized actions, as opposed to equity which targets the needs of specific groups. However, explicit discussion of how access to green space differs across racial groups, particularly the region’s Black communities, varied. Some individuals shared anecdotes of how Black and other marginalized communities experience recreational spaces, including adverse experiences of discrimination or racial profiling, while others did not acknowledge equitable access in terms of racial identity.
Interviewees that worked in DEI spaces discussed green space and park planning processes that center racial equity as being culturally responsive and intentional in providing resources and support to marginalized individuals who live in disadvantaged communities. The lack of explicitly race-informed approaches to equity in city and regional plans, including SEMCOG’s Parks and Open Space Plan (2015), was seen as a problem by some. This absence illuminates a large gap that the analysis, findings, and recommendations of this project have a great opportunity to fill.
Given the findings from our initial interview series, and the resulting problem statement, our team created three analytical subgroups to further explore the main drivers of inequitable access to green spaces in Southeast Michigan:
• Green space availability and transportation accessibility;
• Social accessibility; and
• Equitable institutions and planning processes.
2. GREEN SPACE VISITS
Once we conducted interviews to better understand dimensions of green space access and investment quality in Southeast Michigan, our team conducted field visits to a selection of green spaces across the region. The green spaces we visited were selected and grouped based on three classifications: green spaces and parks located in racially segregated areas of the region (majority White or majority Black communities); green spaces with different characterizations and funding sources (city-, county-, or state-funded); and green spaces of various qualities. The green spaces we visited were:
• Belle Isle State Park (Detroit)
• Chandler Park (Detroit)
• Frog Island Park (Ypsilanti)
• Lake Erie Metropark (Brownstown Township)
• Lower Huron River Metropark (Belleville)
• Palmer Park (Detroit)
• Riverside Park (Ypsilanti)
• Rouge Park (Detroit)
25
Chapter 3: Defining Disparities in Access to Green Spaces
Our team used the visits to enrich our understanding of green spaces and how they are used in the region by assessing transportation infrastructure both within and in close proximity to the park, recreational facilities, amenities, amount of tree cover, and any perceived challenges to accessing them. The goal was to get an idea of the types of green space available to residents in the region and to help our team understand the geography and qualities of green spaces in Southeast Michigan. We took note of the following features:

• Sidewalk infrastructure;
• Transportation infrastructure and travel behavior;
• Tree cover/greenness;
• Surrounding landscape;
• Cleanliness/signs of maintenance;
• Lighting;
• Signage; and
• Facilities (recreational areas, social gathering areas, restrooms, etc.).
2.1 Field Oberservations & Takeaways
Despite the cold and overcast weather conditions on the day of our field visits (March 22, 2023), all of the green spaces were in use. We noticed people using them for recreational purposes (e.g., skateboarding, playground use, and disc golfing) as well as for active purposes (e.g., trail walks and dog walking). Some notable features included:
26
Fostering Racial Equity in Access to Green Spaces
Source: Created by Manvi Nigam in ArcGIS.
Figure 3.1. Green spaces visited by team on March 22, 2023.
• Facilities and recreational opportunities: Most parks we visited had some form of recreational facilities, including playgrounds, splash pads, picnic and community

of varying qualities; for example, one park had only half a basketball court, which we thought would discourage groups of people from playing games.
• Various levels of transportation access: Though most people we observed accessed the parks by vehicle, there were also various types of bike lanes and bus stops close to the parks. Some had very few accommodations for various modes. Bike lanes ranged from unprotected, protected by bollards, or part of a shared-use path away from the road (we specifically noticed this on a busy road leading into Chandler Park). It was unclear how often bike lanes were utilized, as we did not notice high use of bike racks, but this could have been due to the weather conditions; it would be useful to observe travel behavior during spring and summer months. However, bicycle usage also likely depends on proximity of the green space to busy roads and more populated areas. Transit access also depends on proximity of the green space to populated areas; for example, parks we visited in Ypsilanti had access to a few different public transit routes (operated by TheRide), whereas Lower Huron River Metropark, which is in a less populated area, did not have significant access to transit.
27
Chapter 3: Defining Disparities in Access to Green Spaces
Source: Capstone team field visit, 3/22/23
Figure 3.2. A playground in Lower Huron River Metropark with a sign indicating that it is designed for children ages 5 to 12
Fostering Racial Equity in Access to Green Spaces

• Evidence of maintenance and upgrades: All green spaces we visited showed evidence of ongoing maintenance , though some had more litter than others; this may be attributed to lower use in the winter months. One green space we visited, Palmer Park in Detroit, is currently undergoing a habitat restoration project that would clean and improve the shoreline of a lake within the park, upgrade habitats for birds and pollinators, provide more signage for educational purposes, add restrooms, and improve stormwater management. Palmer Park is considered a natural area by SEMCOG, so it was encouraging to see a park within the city have both amenities that people value and accessible green areas that can provide public health and environmental benefits.

28
Source: Capstone team field visit, 3/22/23.
Figure 3.3. MoGo station, bike racks, a bike repair station, and a community center at Palmer Par
Source: Capstone team field visit, 3/22/23.
Figure 3.4. Sign explaining restoration upgrades at Palmer Park, which had amenities and recreational space in addition to more natural areas.
• Varying degrees of “natural areas”: We observed natural areas – “nature preserves, conservation land, and sites with other natural features, such as rivers, wetlands, or woodlands,” per SEMCOG’s definition – of varying degrees.1 Some green spaces, like Palmer Park, featured both a high number of facilities and access to natural areas. Again, these two things are not necessarily at odds, and we observed this in our own visits. That said, we also noticed that green spaces were in use for various recreational activities even if they had low levels of greenness.
• Park entry fees: Because fees can be a barrier to entry, it was important to note whether green spaces required them or not. We found that municipal parks did not require entry fees. Metroparks typically charge entry fees for vehicles, as does Belle Isle Park for driving onto the island, although neither facilities requested payment or checked our vehicle for Recreational Passport the day we visited. Metroparks allow residents to buy annual vehicle passes at a reduced rate (or a flat daily rate); entering on foot or by bike is free at all Metroparks. Meroparks offers senior discounts for entry, but there is no information on their website about reduced rates for other groups.

29
Chapter 3: Defining Disparities in Access to Green Spaces
Source: Capstone team field visit, 3/22/23.
Figure 3.5. A bike path within a wooded natural area at Lower Huron River Metropark.
PROBLEM STATEMENT
We created a problem statement to generate a consensus within our group and inform the more detailed analysis. To do that, we held an internal collaborative workshop to draw on the background research and stakeholder interviews. We identified social challenges, lack of available green space, and insufficient transportation accessibility as three main factors that prevent equitable access to green space in the region. The statement is as follows: The State of Michigan contains a wealth of green spaces (including public parks and natural areas), which provide the state’s residents opportunities for fostering mental and physical wellbeing in many ways, including through recreation, community gathering, and experiencing nature.
Michigan communities experience inequitable access to green spaces along lines of race, income, and other social factors. Additionally, there are discrepancies between communities in the allocation of public resources dedicated to creating, improving, and maintaining quality green spaces. Racial segregation, inter-municipal fragmentation, lack of regional transit, and urban sprawl result in these inequities. Further, marginalized communities have experienced disinvestment, resulting in systemic racism, geographic segregation from green spaces, and discrepancies in funding to support green space maintenance and programming. As a result, some communities lack resources to meet the full needs and desires of their communities for green spaces. These inequities are reinforced by the rules of prominent grant programs that present challenges to accessing funds because of matching and application requirements. Communities have had many successes recently to address this historical legacy. However, there are still a variety of obstacles in place that prevent all residents of Southeast Michigan from enjoying equitable access to green spaces.
A key issue is the sheer number of green spaces, or lack thereof. Addressing this inequity requires improving existing green spaces and creating new ones when necessary. This delineation is important as it is not simply access to any green space that is an issue. There may be situations in which new green spaces need to be created in order to address inequitable access. For the high-quality green spaces that do currently exist, actually getting to them is often an issue. Factors impacting transportation accessibility to green spaces include reliance on a car to get there, limited public transit options, limited amount of green spaces within walking distance, and lack of complete and safe pedestrian and bicycle infrastructure to access nearby green spaces.
Beyond transportation and proximity-based accessibility concerns, there are many social dimensions that limit accessibility. Communities may also face social hurdles related to overt or covert exclusion, safety concerns, affordability hurdles, language barriers, access to information, and socioeconomic factors. Black residents in particular often face disproportionate challenges to enjoying their time in green spaces, including racial profiling, discrimination, threats of physical harm, and a lack of culturally-responsive design, amenities, and programming in green spaces.
ENDNOTES
1. Race Forward, “What Is Racial Equity?”
2. The University of Washington.
3. Race Forward.
4. SEMCOG, “Southeast Michigan ParkFinder,” SEMCOG, https://maps.semcog.org/ ParkFinder/#.
31
Chapter 3: Defining Disparities in Access to Green Spaces
Lake Erie Metropark, Brownstown
Source: “Lake Erie Metropark,” Huron-Clinton Metroparks, Accessed April 24 2023, https://www.metroparks.com/lake-erie-metropark/

Chapter 4 : Green
Space Analysis
This section provides spatial and survey-based analysis of green space access in Southeast Michigan to illustrate dimensions and characteristics of green space availability, transportation-related and social challenges to access.
In this Section: KEY TERMS:
1. Social Accessibility
1.1 Social Obstacles Limiting Green Space Access
Maps
Maps
1.2 Pilot Social Accessibility Survey Pilot Survey Methodology & Structure Pilot Survey Analysis
1.3 ParkScape Mobile Application ParkScape Mock-up
2. Green Space Availability & Transportation Accessibility
2.1 Examining Green Space Availability
Green Spaces: All green spaces in Southeast Michigan which are not confined to a singular recreational use (e.g., golf courses or ski areas).
Natural Areas: A subset of total green spaces in Southeast Michigan categorized as ‘Natural Areas’ by SEMCOG, which include nature preserves, conservation lands, and sites with natural features like rivers, wetlands, or woodlands
Basic Amenity Green Spaces: A subset of total green spaces in Southeast Michigan that are not exclusive ‘residents-only’ spaces, that do not charge an entry fee, and that include a play area, restroom, and shelter facilities.
Social Access Challenge: The statistics that encompassed social access challenges included:
• Demographic identity, including racial identity, age, disability status, and English proficiency.
• Economic status, including income, housing cost burden, poverty, and unemployment rate.
• Transit dependency, including household public transit dependency and car access.
2.2 Examining Transportation Access to Green Spaces Analyzing Green Space Access Compared to Black Population Percentage
Equity Emphasis Score: SEMCOG’s Equity Emphasis Areas dataset provides geospatial information on socioeconomically vulnerable populations in Southeast Michigan, including a composite ‘equity emphasis’ score. This composite score represents the average of a specified set of statistics, each set portraying the density of a socioeconomically vulnerable population relative to the regional average per specified geographic unit. Higher scores indicate higher equity emphasis, and lower scores indicate lower equity emphasis (i.e., the density of socioeconomically vulnerable populations relative to the regional average).
Thematic
Bivariate
Analyzing Green Space Availability Compared to Black Population Percentage
CHAPTER OVERVIEW
Fostering green space equity in Southeast Michigan requires mapping demographics, examining resources available to various populations, and considering the various obstacles residents face to benefit from green spaces. Southeast Michigan’s existing green spaces, though plentiful,1 are not equitably distributed across the region. Discrepancies in the density, quality, and geographic accessibility of green spaces present key challenges that prevent residents from enjoying the many opportunities for outdoor recreation available in the region.
In this section, the distributional density, quality, and geographic accessibility of green spaces are analyzed to compare available green spaces with the locations of marginalized populations and existing transportation infrastructure. In addition, we explore residents’ perceptions through a pilot survey and interviews.
1. SOCIAL ACCESSIBILITY
As applied to this capstone project, accessibility is primarily understood as the ease of access to a destination, namely the green spaces across Southeast Michigan. Social accessibility extends beyond simple measures of geographic distance, to include more nuanced factors such as identities, socioeconomic status, information gaps, and perceptions. Due to the complexity of social accessibility, we explored it through a variety of quantitative and qualitative methods. First, using demographic data, we constructed the following maps and quantitative analyses to explore how regional demographic patterns shape social accessibility to green spaces:
• Thematic maps displaying distributions of green spaces and socioeconomic demographics related to social access challenges;
• Bivariate maps displaying distributions of green spaces and socioeconomic demographics related to social access challenges and visualizing various disparities with respect to green space access; and
• Maps of survey results from survey respondents self-identifying as residents of the region administratively managed by the Southeast Michigan Council of Governments (SEMCOG).
However, enhancing green space equity through a social accessibility lens requires going a step further. Though they reveal regional disparities, quantitative analytical methods do not speak to community experiences relative to green spaces. Therefore, we used qualitative methods to explore perceptions, especially by feelings of inclusion and exclusion among marginalized communities. The qualitative methods we used were stakeholder interviews (described above), as well as a Pilot Social Accessibility Survey and proposed ParkScape Mobile Application. We report key findings from a social accessibility survey of Southeast Michigan residents run for the purpose of this report over the course of the last three weeks of March 2023. We also present the design and concept for a mobile application which consolidates information about public green spaces and possible ways to access them. The app intends to increase social connections in green spaces by addressing gaps in knowledge about programming and features of the green spaces themselves.
35 Chapter 4:
Green Space Analysis
1.1 Social Obstacles Limiting Green Space Access
While quantitative measures of social accessibility are typically based only on the time it takes to access green spaces and the modes of transportation available for arrival, this project’s quantitative analysis uses equity-based measures of green space social accessibility. In their 2021 evaluation of “accessibility” as a key metric to spatially contextualize regional systems, researchers Richa Ahuja and Geetam Tiwari cite addressing community-wide issues of access and accounting for collective needs and resources as critical to fostering equity.2 Equitybased measures of accessibility not only catalog existing and lacking resources, but delineate those resource distributions in geospatial context to social obstacles, or access challenges. Equity-based measures of green space access both define existing regional green spaces and geographic sub-regions that lack proximity to green space and also delineate green space distribution in geospatial contexts to statistical metrics of socioeconomic inequities. Understanding where various types of green spaces are concentrated is the first step, but it is critical to place those concentrations in their geospatial contexts to marginalized regional populations.3
This social accessibility analysis used demographic and socioeconomic statistics per census tract to place green space acreage concentrations in geospatial context to the locations of socioeconomically marginalized populations across the Southeast Michigan region. The statistics that encompassed social access challenges included:
• Demographic identity, including race, age, disability status, and English proficiency.
• Economic status, including income, housing cost burden, poverty, and unemployment rate.
• Transit dependency, including household public transit dependency and car access.
As a further consideration, green spaces across Southeast Michigan vary vastly in type and quality. Regional green spaces were divided into three categories to analytically account for these variations. These three categories are not mutually exclusive and were used separately throughout the following spatial analyses:
• “All Green Spaces,” or total green spaces in Southeast Michigan which are not confined to a singular recreational use.
• “Natural Areas,” a subset of total green spaces in Southeast Michigan categorized as ‘Natural Areas’ by SEMCOG.
• “Basic Amenity Green Spaces,” a subset of total green spaces in Southeast Michigan that are not exclusive ‘residents-only’ spaces, that do not charge an entry fee, and that include a play area, restroom, and shelter facilities.
36 Fostering Racial
in
Equity
Access to Green Spaces
Defining how many natural areas there are as compared to all spaces broadly characterized as green spaces distinguishes concentrations of smaller municipal green spaces from large undeveloped green spaces. Defining basic amenity green spaces as compared to all green spaces highlights concentrations of better quality green spaces and indicates which areas within the region may already enjoy well-resourced green spaces. Green space acreage per 100 people was used as a standard metric of green space availability across the three defined categories of green spaces. “Appendix 5: GIS Methodology,” describes geospatial data sources, analysis methods, and mapping techniques used in greater detail.
The following Thematic Maps and Bivariate Maps sections discuss mapped data which represent social access challenges and geographic green space availability. The maps included in these sections as well as in “Appendix 2: Additional Social Accessibility Maps” clearly show that socioeconomic inequities geospatially intersect with less total acres of green space overall across the Southeast Michigan region. They also evince that certain demographic and socioeconomic groups are at a greater disadvantage with respect to geographic availability of various types of green space.
Thematic Maps
There are 2,883 total green spaces across 1,475 census tracts within the boundaries of the seven SEMCOG counties that constitute the Southeast Michigan region. Out of all these green spaces, there are only about 591 natural areas and 375 basic amenity green spaces. Eighty-one basic amenity green spaces are also considered natural areas.
Out of all Southeast Michigan’s green spaces shown in Figure 4.1 above, about 45 percent have a play area and nearly 50 percent have some form of shelter. However, only around 20 percent have a restroom (Figure 4.4). Shown in Figure 4.3, only 13 percent of all green spaces in Southeast Michigan are free for all and include restrooms, a play area, and some form of shelter. Figures 4.14.3 above clearly show that residents of the northwestern portions of the region enjoy more total park acreage proximal to their census tract, especially Livingston, Oakland, and Washtenaw county residents. Perhaps unsurprisingly, these three counties have the highest median household incomes of the region.

37 Chapter 4:
Green Space Analysis
Source: SEMCOG 2022, USCB 2020
Figure 4.1. All Green Spaces across Southeast Michigan
Fostering Racial Equity in Access to Green Spaces


Natural
Basic
of green spaces are open to all, do not charge and entry fee, and have a restroom


19.8% only 13.0%
46.5% 48.5%
of green spaces are open to all, do not charge and entry fee, and have a play area

of green spaces are open to all, do not charge and entry fee, and have a shelter area

of green spaces are open to all, do not charge and entry fee, and have a restroom, a play area, and a shelter area
38
Source: SEMCOG 2022, USCB 2020
Source: SEMCOG 2022, USCB 2020
Source: SEMCOG 2022
Figure 4.2. All Green Spaces vs. Natural Areas across Southeast Michigan
Figure 4.4. Percentage of Green Spaces in Southeast Michigan with Basic Amenities
Figure 4.3. All Green Spaces vs. Basic Amenity Green Spaces across Southeast Michigan
Areas vs. All Green Spaces
Amenity Green Spaces vs. All Green Spaces
Chapter 4: Green Space Analysis
Within the same northwestern portions of the Southeast Michigan region, census tracts that have higher percentages of white residents overlap with more natural areas and basic amenity green spaces, as shown by Figures 4.5 and 4.6.


39
Source: SEMCOG 2022, USCB 2016-2020 ACS 5-year estimates
Figure 4.5. Percent White per Census Tract vs. All Green Spaces across Southeast Michigan
Source: SEMCOG 2022, USCB 2020
Figure 4.6. All Green Spaces vs. Natural Areas and Basic Amenity Green Spaces across Southeast Michigan
Natural Areas vs. All Green Spaces
Basic Amenity Green Spaces vs. All Green Spaces
Bivariate Maps
For each of the three green space categories — “All Green Spaces,” “Natural Areas,” and “Basic Amenity Green Spaces”— our group created bivariate maps of key demographics and socioeconomic statistics as compared to green space acreage per 100 people using SEMCOG’s Equity Emphasis Areas dataset.4 This dataset provides geospatial information on socioeconomically vulnerable populations in Southeast Michigan, including a composite ‘equity emphasis’ score. This composite score represents the average of a specified set of statistics, each set portraying the density of a socioeconomically vulnerable population relative to the regional average per specified geographic unit. Higher scores indicate higher equity emphasis, and lower scores indicate lower equity emphasis (i.e., the density of socioeconomically vulnerable populations relative to the regional average). Bivariate mapping of equity emphasis and green space acreage per 100 people per census tract shows the spatial relationship between each measure by representing both phenomena simultaneously. Regional distributions shown by these bivariate maps display intersections of social access challenges and green space acreage per 100 people at the localized census tract scale. The specified set of statistics used to calculate the composite equity emphasis score per census tract across the Southeast Michigan region includes fifteen American Community Survey (ACS) estimates:
1. Percent of Population – Ages 65 and Up
2. Percent of Population – Children Ages 0 to 17
3. Percent Minority of Total Population
4. Percent Households in Poverty
5. Percent of Households that are Transit Dependent
6. Percent Black of Total Population
7. Percent Asian of Total Population
8. Percent Hispanic of Total Population
9. Percent All Other Minorities of Total Population
10. Percent of Households that are Limited English Proficiency
11. Percent of Households with No Car
12. Percent of Households that are Housing Cost Burdened
13. Median Household Income
14. Percent Population with a Disability
15. Unemployment Rate
Out of the ACS estimates available within the SEMCOG Equity Emphasis Areas dataset, these best encompass the statistical categories of Demographic Identity, Economic Status, and Transit Dependency which are outlined as critical to green space social accessibility. More detailed information about the SEMCOG Equity Emphasis Areas dataset and bivariate mapping techniques can be found in Appendix 5: GIS Methodology under the Social Accessibility section.
40 Fostering Racial
Equity in Access to Green Spaces
Figures 4.7, 4.8, and 4.9 below show the relative concentration of equity emphasis and, respectively, all green space, natural area, and basic amenity acreage per 100 people across the Southeast Michigan region. Green spaces, as a whole, are lacking in census tracts where Equity Emphasis is high. Natural areas are not well distributed throughout the region. Notably, the majority of high Equity Emphasis census tracts drastically lack natural areas.5 Most census tracts overall contain basic amenity green spaces for every 100 people. However, the average total amount of basic amenity green space per 100 people is relatively low regionally,6 especially in census tracts where Equity Emphasis is high.7


41
Chapter 4: Green Space Analysis
Source: SEMCOG 2022, USCB 2016-2020 ACS 5-year estimates
Figure 4.7. Equity Emphasis vs. Green Space Acreage per 100 People
Source: SEMCOG 2022, USCB 2016-2020 ACS 5-year estimates
Source: SEMCOG 2022, USCB 2016-2020 ACS 5-year estimates
Figure 4.8. Equity Emphasis vs. Natural Area Acreage per 100 People Figure 4.9. Equity Emphasis vs. Basic Amenity Green Space Acreage per 100 People
Natural Areas Basic Amenity Green Spaces
1.2 Pilot Social Accessibility Survey
To better understand the qualitative components of social access to green spaces, including Southeast Michiganders’ perceptions of their local green spaces and the extent to which they experience challenges to access, use, and inclusion, our team designed, tested, and distributed a pilot survey. The pilot survey methods are described in further detail below and included online distribution, exploratory questions, and descriptive survey design. The results of this survey and their implications for working towards more equitable access to Southeast Michigan’s green spaces can be found in “Appendix 3: Social Accessibility Pilot Survey Questions and Results.” Although not reaching a sufficiently representative sample to produce regionally-valid results, we hope the pilot survey demonstrates the value of surveys to investigate this topic and generated findings which deserve further investigation.
Pilot Survey Methodology & Structure
The aim of the survey was to reach residents of Southeast Michigan in order to get a better understanding of how they access and experience local green spaces. The survey consisted of the following five sections of questions:
1. General multiple choice questions about the respondent’s frequency of green space visits;
2. Two specific questions about green space social interactions that utilized a likert scale;
3. Two questions about racial equity;
4. Demographic questions (similar to the U.S. Census questions); and
5. Optional short answer questions.
Before the pilot survey was distributed, it was beta-tested by students outside of the capstone group. Next, the pilot survey was distributed online to various facebook groups, reddit channels, peer networks, and through other connections. A total of 104 residents completed the pilot survey, but most responses were collected from Washtenaw County. The survey’s full list of questions and their aggregated results can be found in “Appendix 3: Social Accessibility Pilot Survey Questions and Results.”
Pilot Survey Analysis
Since the respondents were mostly White and high income, they are not representative of the region, but did identify some conclusions which may have broader relevance, such as the need for better facilities, (i.e., restrooms or shelter) and modes of transit to green spaces, as most respondents’ top reasons for not visiting green spaces more often were time and weather limitations. We recommend scaling up our pilot survey to a representative sample of Southeast Michigan residents.
42 Fostering Racial
in
Equity
Access to Green Spaces
1.3 ParkScape Mobile Application
Our exploratory interviews uncovered two issues related to limitations in the use and patronage of the region’s green spaces: limited information about community-building events and activities held within these spaces, and a lack of satisfaction with the types and quality of events and activities that are available in Southeast Michigan’s green spaces. These themes were mirrored in responses gathered through our pilot survey. Some stakeholders indicated that the lack of satisfaction with the quality of green space events was attributed to a lack of a streamlined source of information on regional green spaces. To address this, we created a mock-up of a mobile app with the potential to provide residents an easily accessible platform with up-todate information on nearby green spaces. This can address the need for a singular source of information on community green spaces. The app should include features like GPS location services, green space amenities, offered events or activities, and a way to share regional green space reviews and recommendations.
As of 2021, 85 percent of American adults own a smartphone.8 The rapid growth in smartphone adoption makes promoting a prospective app much easier; compared with traditional media channels, mobile apps are more likely to be recommended to friends and families, especially if they have a specific regional focus.9 While we acknowledge the digital divide and inherent limitations in information access that are rooted in uneven distributions of internet infrastructure, we present this app as a starting place for digital community building to garner more support for, and investment in, green space programming across the region. By mocking up a conceptual prototype, we aim to leverage the widespread accessibility of smartphones nowadays to ensure a broad reach to Southeast Michigan residents. Details regarding the app can be found in Chapter 6 and Appendix 5. Appendix 5 also features a detailed description of differences between ParkScape and SEMCOG’s ParkFinder.

43 Chapter 4:
Analysis
Green Space
Source: SEMCOG 2022, USCB 2016-2020 ACS 5-year estimates
Figure 4.10. Pilot Survey Responses by SEMCOG ZIP Code
ParkScape Mock-up


2.
GREEN SPACE AVAILABILITY & TRANSPORTATION ACCESSIBILITY
There are two key components to assessing racial equity in the physical access of green spaces in Southeast Michigan: the availability of green spaces (including their locations) and the ability to access these spaces through different modes of transportation. To analyze both dimensions of physical access to green spaces, the following research questions guided our investigations and subsequent analyses:
1. How does the amount of local green spaces differ across Southeast Michigan?
2. For green spaces that currently exist in the region, how can people get to them? Is a car required for access? And of the green spaces that can be reached without a car, what type of green spaces are they?
44 Fostering
in
Racial Equity
Access to Green Spaces
Explore park events by keywords and algorithm feed Explore/search for green spaces by category
Figure 4.11. App Screen #3 and App Screen #6
2.1 Examining Green Space Availability
Park coverage is shown to be positively associated with physical health as well as community well-being.10 As part of our analysis of green space availability, our team began by investigating whether or not there is a standard or suggestion of how much green space should be available per person. However, we found that there is no single accepted measure. One standard presented by the World Health Organization (WHO) is that cities should have nine square meters of green space per person. However, there is no official WHO documentation supporting this number.11 Another standard is the more recently proposed “3-30-300” rule, or the idea that all residents of a jurisdiction should be able to see three trees from their home, every neighborhood should have 30 percent tree canopy, and every person should be able to walk to a park or green space within 300 meters (about 0.2 miles) of their home.12 Unlike the parameters outlined by WHO, the 3-30-300 rule is not at odds with densely populated cities and urban cores and, subsequently, does not necessarily require a sprawling metropolitan structure to be achieved. Instead of choosing a per-person metric that we believe the region should aspire to achieve, we instead directed our analysis to the differences in regional coverage of different types of green spaces.
Through GIS analysis, our team sought to understand availability per 100 people of the following geographic dimensions:
• Green spaces, which are constituted by parks of all shapes and sizes, ranging from state parks to metro parks to neighborhood parks.
• Natural areas, which include nature preserves, conservation lands, and sites with natural features like rivers, wetlands, or woodlands.13
• Basic amenity green spaces, which uses our definition of green spaces and further filters them based on whether they are free for all and include a basic set of amenities such as restrooms, a play area, and some type of a shelter.
Green spaces that are considered or include natural areas are a key element of our analysis. These areas are distributed less equitably than neighborhood parks and many parks run by their respective cities; these parks are included in our definition of “green spaces” on our maps. Natural areas also offer unique benefits such as the feeling of immersion in nature and away from urban settings, as well as environmental benefits such as stormwater management. Examining the average size of green spaces and natural areas in the region can illuminate disparities in the total quantity of green spaces and natural areas that people are able to access within cities as opposed to suburban areas that are inherently low-density and typically in closer proximity to nature. We also investigated the third category, basic amenity green spaces, because respondents in our initial interviews identified key characteristics that are desired in green spaces, including restrooms, no entrance fees, and an area for children to play. This was supported by findings in a literature review of qualities people value in green spaces.
45 Chapter 4: Green Space Analysis
Fostering Racial Equity in Access to Green Spaces
Figures 4.12 - 4.14 display how much acreage is currently available per 100 people in each county subdivision across Southeast Michigan for green spaces, natural areas, and basic amenity green spaces. These differences should be addressed in connection to, and consideration of, unique community needs and the quality of green spaces that are available. However, this visualization can serve as a starting point for this conversation.


Figures 4.12 and 4.13 especially highlight the difference in availability between all green spaces in general, and natural areas specifically. We observe that large natural areas are less common in large urban areas, and that the metro Detroit area in particular has far less natural area availability than green space availability. When honing in on the distribution of basic amenity green spaces more specifically, Figure 4.14 reveals that, compared to green spaces broadly, availability across these added factors and amenities is further reduced across the region.

46
Source: SEMCOG 2022, USCB 2020
Source: SEMCOG 2022, USCB 2020
Figure 4.13. Availability of Natural Areas per 100 People
Figure 4.14. Availability of Basic Amenity Green Spaces per 100 People
Source: SEMCOG 2022, USCB 2020
Figure 4.12. Availability of all green spaces per 100 people (including natural areas and smaller neighborhood parks)
Analyzing Green Space Availability Compared to Black Population Percentage

Figures 4.15-4.17 show that park availability is much lower for the region’s Black residents based on their geographic residences. When looking at green spaces and the percentage of Black residents in a city or township, it is clear that the majority of green spaces exist in areas without large Black populations. When exploring natural areas only, the results are even more stark and point to a notably limited availability for areas with high proportions of a Black population. Access to basic amenity green spaces is similarly reduced and highlights the fact that residents in Detroit and much of Southeast Michigan do not have access to natural areas nor basic amenity green spaces.

Source: SEMCOG 2022, USCB 2020

47 Chapter 4: Green Space Analysis
Source: SEMCOG 2022, USCB 2020
Source: SEMCOG 2022, USCB 2020
Figure 4.15. Availability of all green spaces compared to percentage of Black Residents in each county subdivision
Figure 4.16. Availability of natural areas compared to percentage of Black Residents in each county subdivision
Figure 4.17. Availability of all basic amenity green spaces compared to percentage of Black Residents in each county subdivision
2.2 Examining Transportation Access to Green Spaces
To help inform our transportation network analyses, we also conducted research about standards for access by wlaking, biking, transit, and driving. One U.S.-focused study used a maximum walking distance of 1,000 meters (about 0.6 miles) to green spaces as ideal because research findings suggest that this distance is the maximum average that most urban residents would be willing to walk to access a park.14 The Trust for Public Land, creator of ParkScore, uses a 10-minute walk as a metric to determine park accessibility.15 Furthermore, the Trust for Public Land leads the 10-Minute Walk Initiative, of which Detroit and Ann Arbor are each member cities.16 Being a member city means that the 10-minute walking metric is used as the standard for planning access to parks. Because ParkScore is a commonly used metric to determine park accessibility in the U.S., and because Detroit and Ann Arbor have already expressed commitment to a 10-minute standard, our team used this metric to look at green space proximity in Southeast Michigan, specifically in our walkability and bikeability analysis. Similarly, we considered a 10-minute bike ride and a 30-minute transit trip as an average time threshold for accessing green spaces. Then, we compared the number of green spaces accessible via walking, biking and transit within these standard time thresholds, to the number of green spaces accessible via a 15-minute drive. Again, it is important to note how this differs between types of green space being discussed. With this standard, walkability is expectedly much higher when considering a broader definition of green space compared to a narrower definition of natural areas.
The maps below (Figure 4.18 - 4.25) compare access via different modes of transportation (walking, biking, public transit, and driving) to green spaces and natural areas. When looking at access to all green spaces across all modes, it is clear that access by walking is most limited (Figure 4.18). Green space accessibility by walking is concentrated in the Detroit area and Ann Arbor with a few other pockets of walkable access scattered across the rest of Southeast Michigan. Bicycle accessibility (Figure 4.19) is slightly more broad than public transit accessibility (4.22) since the only concentrated areas of public transit in Southeast Michigan are in Ann Arbor and Detroit. Driving access to green space is, again, most concentrated in Ann Arbor and Detroit and operationalized as access within a 15 minute drive (Figure 4.23). In considering these analyses alone, it appears that biking and public transit are fairly competitive options to access green spaces in comparison to car-based access. This is important because Figures A.36-A.38 illustrate disparities in car ownership for residents of Detroit.
However, when looking only at natural areas, the story changes drastically. Access by walking is virtually nonexistent outside of Ann Arbor (Figure 4.20). Access by biking also diminishes rapidly, with access again concentrated in Ann Arbor, as well as some outlying suburbs, and all but disappearing for areas in and directly surrounding Detroit (Figure 4.21). Transit access essentially disappears for Detroit as well, with access by transit most concentrated in Ann Arbor compared to the rest of the region (Figure 4.24). Driving is the same; access levels are high in Ann Arbor and some Detroit suburbs, but low elsewhere (Figure 4.25). The table (Table 4.1) below shows the percentage of residents who live within walking distance, biking
48 Fostering Racial Equity in Access to
Green Spaces
distance, or within a transit service area to a green space or a natural area. Comparing these to the percentage of residents living within a 15-minute drive to a green space or natural area, it is clear that pedestrian, bicycle, and public transit infrastructure are not equitable modes of transportation for allowing residents of the region to access natural areas.
To Any Green Space To a Natural Area
The City of Ann Arbor, for example, has more natural areas that are accessible via walking, biking, and public transit than many other areas in Southeast Michigan. Although Detroit appears to have adequate infrastructure to support biking access to green spaces, this nearly disappears when looking at just natural areas. This confirms that while residents have access to neighborhood parks, access to natural areas is much more limited and highlights the spatial inequities in access to natural areas in Southeast Michigan. Access to these spaces is important for a variety of reasons that were identified in our initial stakeholder interviews and background research, including mental and physical health, recreational opportunities, growing a sense of environmental stewardship, and more. Many natural areas are simply not accessible to residents in Southeast Michigan who hope to reach these places by walking, biking, or public transit. Even for those who have access to a car, reaching a natural area requires driving for longer than 15 minutes unless one lives in Ann Arbor or one of Detroit’s wealthier suburbs.
49
Chapter 4: Green Space Analysis
% residents living within a 10-min walk 31.2% 4.5% % residents living within a 10-min bike ride 59.4% 17.1% % residents living within a 30-min transit ride 59.6% 29.3% % residents living within a 15-min drive 98.00% 89.90%
Source: SEMCOG 2022, USCB 2020
Table 4.1. Percentage of residents who can access a green or natural space by different transportation modes for specified travel times
50 Fostering Racial Equity in Access to Green Spaces


10-min Walk

10-min Bike Trip

Source: SEMCOG 2022, USCB 2020
Source: SEMCOG 2022, USCB 2020
Source: SEMCOG 2022, USCB 2020
Source: SEMCOG 2022, USCB 2020
Figure 4.18. No. of green spaces within a 10-min walk Figure 4.19. No. of green spaces within a 10-min bike trip Figure 4.20. No. of natural areas within a 10-min walk Figure 4.21. No. of natural areas within a 10-min bike tripALL GREEN SPACES NATURAL AREAS
30-min Transit Trip

Source: SEMCOG 2022, USCB 2020
AREAS


Chapter 4: Green Space Analysis
15-min Drive

Source: SEMCOG 2022, USCB 2020
Source: SEMCOG 2022, USCB 2020
Source: SEMCOG 2022, USCB 2020
51
Figure 4.22. No. of green spaces within a 30-min transit trip Figure 4.23. No. of green spaces within a 15-min drive
Figure 4.24. No. of natural areas within a 30-min transit trip Figure 4.25. No. of natural areas within a 15-min drive
NATURAL
ALL GREEN SPACES
Analyzing Green Space Access Compared to Black Population Percentage


Disparities in access to green spaces via different modes of transportation are also racialized. Comparing green spaces that are accessible through different modes of transportation to the percentage of Black residents in townships and county subdivisions reveal different degrees of accessibility in the region (Figure 4.26). Residents in Detroit, a predominantly Black city, are shown to have high degrees of access to green space across transportation modes as this data includes all types of municipal parks.


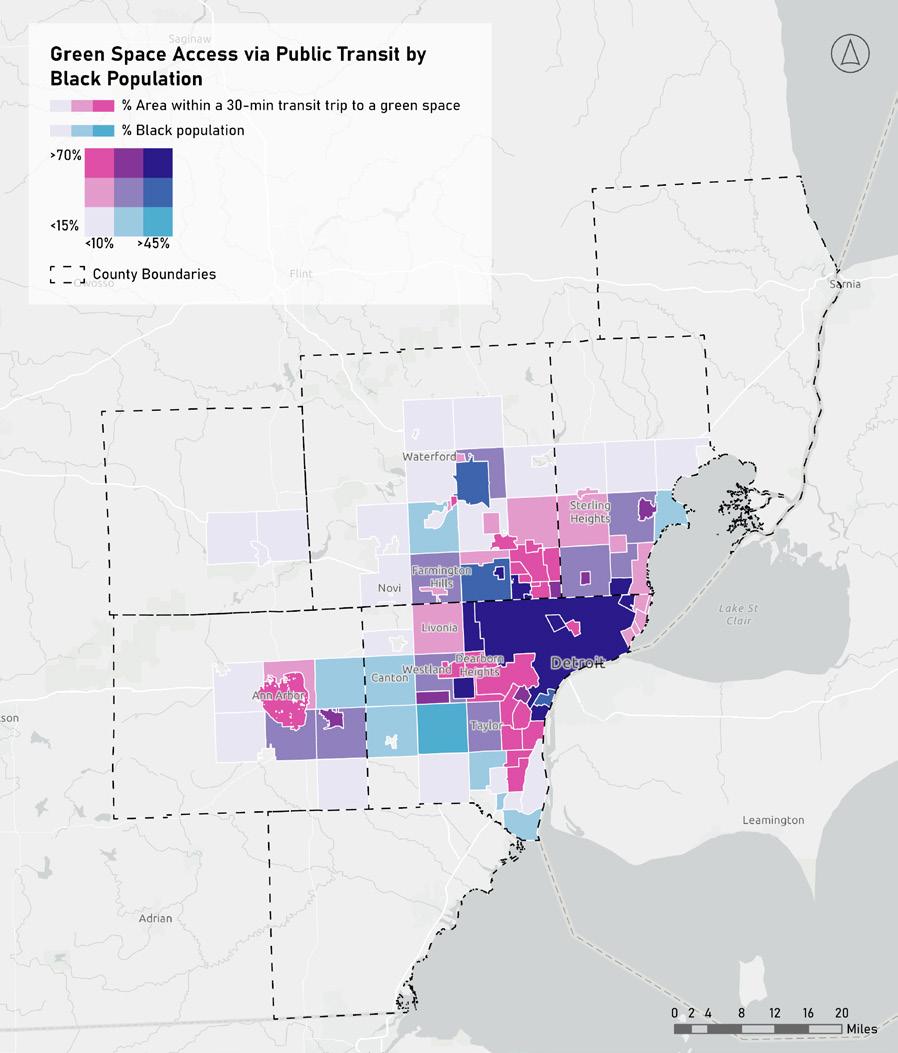


52 Fostering Racial Equity in Access to Green
Spaces
Source: SEMCOG 2022, USCB 2020
Figure 4.26. Percentage of area within a specified travel time to a green space via different modes, compared to percentage of Black Residents
However, when analyzing access to only natural areas, the differences in access across modes are very different (Figure 4.27). For walking, the natural areas that are easily walked to are not located in areas where a high proportion of Black residents live. While biking and transit access offer greater connectivity to natural areas for Black residents, areas with greater portions of Black residents continue to portray a lesser degree of less access to natural areas overall. Driving shows greater access, but as mentioned earlier, many Detroit residents do not have cars. These maps help to highlight the racialized disparities in access to natural areas in Southeast Michigan, particularly when thinking of transportation access via walking, biking, or using public transit.


53
Chapter 4: Green Space Analysis
Source: SEMCOG 2022, USCB 2020
Figure 4.27. Percentage of area within a specified travel time to a natural area via different modes, compared to percentage of Black Residents
ENDNOTES
1. The 2,883 total green spaces spread across 1,475 census tracts within the seven SEMCOG counties make up a total of 219,540 acres, or 7.4 percent of the region’s total land area.
2. Richa Ahuja and Geetam Tiwari, “Evolving Term ‘Accessibility’ in Spatial Systems: Contextual Evaluation of Indicators,” Transport Policy 113 (March 16, 2021): 4-11.
3. Danning Zhang, Gabriel Hoh Teck Ling, Siti Hajar binti Misnan, and Minglu Fang,“A Systematic Review of Factors Influencing the Vitality of Public Open Spaces: A Novel Perspective Using Social–Ecological Model (SEM),” Sustainability 15, no. 6 (2023): 5235.
4. SEMCOG, “SEMCOG Equity Emphasis Areas,” Southeast Michigan Council of Governments, accessed April 12, 2023, https://maps.semcog.org/EquityEmphasisAreas/.
5. Four hundred four census tracts, 27.4 percent of all within the region, are categorized as high Equity Emphasis. On average, for every 100 people there are 11.3 acres of total green space and 4.9 acres of natural areas per high Equity Emphasis tract.
6. For all census tracts, per every 100 people, there are an average of 102.3 acres of total green space, and 102 acres of natural areas, and only 2.4 acres of basic amenity green space per census tract.
7. The average amount of basic amenity green space for every 100 people is 0.11 acres in high Equity Emphasis census tracts. In the 576 low Equity Emphasis census tracts, the average amount of basic amenity green space for every 100 people is nearly fifty times greater, at 5.4 acres.
8. Pew Research Center, “Demographics of Mobile Device Ownership and Adoption in the United States,” Pew Research Center, April 7, 2021, https://www.pewresearch.org/internet/factsheet/mobile/.
9. Cindy Krum, Mobile Marketing: Finding Your Customers No Matter Where They Are (Que Publishing, 2010).
10. Lincoln R. Larson, Viniece Jennings, and Scott A. Cloutier, “Public Parks and Wellbeing in Urban Areas of the United States,” PLOS ONE 11, no. 4 (2016), 1.
11. Venus Tao, August, 21, 2017, question on ResearchGate, August 21, 2017, “I see many studies citing WHO for their international minimum for green space.”
12. Cecil Konijnendijk van den Bosch, “Promoting health and wellbeing through urban forests – Introducing the 3-30-300 rule,” IUCN Urban Alliance, February 22, 2021, https:// iucnurbanalliance.org/promoting-health-and-wellbeing-through-urban-forests-introducing-the-330-300-rule/.
13. SEMCOG, “Southeast Michigan ParkFinder.”
14. Nesbitt et al., “Who has access to urban vegetation?”, 56.
15. Trust for Public Land, “Park Score: About, Methodology, and FAQ,” Trust for Public Land, https://www.tpl.org/parkscore/about.
16. Trust for Public Land: 10-Minute Walk, “10-Minute Walk: Home Page,” Trust for Public Land, https://10minutewalk.org/make-the-commitment/.
54
Fostering Racial Equity in Access to Green Spaces
 Eliza Howell Park, Detroit
Source: Friends of Eliza Howell Park. “Eliza Howell Park Landing Page.” Sidewalk Detroit, accessed on May 1, 2023,
Eliza Howell Park, Detroit
Source: Friends of Eliza Howell Park. “Eliza Howell Park Landing Page.” Sidewalk Detroit, accessed on May 1, 2023,
https://www.sidewalkdetroit.com/eliza-howell-park-landing.
Chapter 5 : Embedding Equity in the Planning Process
This chapter explores equity in both the processes and outcomes of planning for green spaces and provides context and research for communities to consider in their own endeavors. Equitable financing options are explored as tools to aiding community autonomy in their own processes of decision-making.
In this Section: KEY TERMS:
1. Equity Throughout the Planning Process
2. Elements of Equitable Processes and Outcomes
3. Strategic Racial Equity Framework
3.1.1 Principle 1: Addressing Dynamic Relationships Between Power, Race, and Identity
3.2.2 Principle 2: Naming Hidden and Visible Contributors to Inequity
3.3.3 Principle 3: Generating Power
4. Collaborative Planning Processes
4.1 Stakeholder Analysis, Consensus Building, and the DIAD Model
5. Pursuing Equity in Investment and Financing
5.1 Equity in Traditional, Private, and Civic Funding Models
6. The Michigan Natural Resources Trust Fund & Current Funding Methods
6.1 Programmatic Challenges to Equitable Outcomes
6.1.1 Application & Eligibility Requirements
6.2.2 Matching Requirements
7. MNRTF in Southeast Michigan
8. Spark Grant Funding
9. Equitable Funding Methods
Equity: An approach to policy and distribution of opportunity that “ensures that outcomes in the conditions of well-being are improved for marginalized groups, lifting outcomes for all. Equity is a measure of justice.” Equity acknowledges diversity in experience and the impact of history and social structures that advantage certain groups and disadvantage others. Equity entails differential allocation of opportunity for groups that have been disadvantaged.
Racial Equity: The “process of eliminating racial disparities and improving outcomes for everyone. It is the intentional and continual practice of changing policies, practices, systems, and structures by prioritizing measurable change in the lives of people of color.”
Justice: “Justice requires repairing and transforming circumstances, structure, contexts, and systems themselves so that they can achieve and sustain equity and justice through proactive and preventative measures.”
Environmental Justice: Environmental justice refers to “the right to a safe, healthy, productive, and sustainable environment for all, where ‘environment’ is considered in its totality to include the ecological (biological), physical (natural and built), social, political, aesthetic, and economic environments. Environmental justice refers to the conditions in which such a right can be freely exercised, whereby individual and group identities, needs, and dignities are preserved, fulfilled, and respected in a way that provides for self-actualization and personal and community empowerment. This term acknowledges environmental ‘injustice’ as the past and present state of affairs and expresses the sociopolitical objectives needed to address them.”
Equity Frameworks: Equity frameworks include concepts which provide an individual or an organization a foundation to guide their efforts to advance equity through intentional action. Equity frameworks assist individuals, organizations, and institutions in creating the conditions necessary to instill equity in their aims and action by highlighting its manifestation in intrapersonal, organizational, and societal institutions and practices. Frameworks often serve as a measure of accountability.
1. EQUITY THROUGHOUT THE PLANNING PROCESS
Access to quality green space is a core facet in the quality of life for communities. These spaces provide critical social, psychological, and physical health benefits to communities. Their value spans beyond health outcomes as green spaces often serve as sites of community gathering, cultural significance, volunteerism, recreation, and stewardship. As green spaces are less accessible and plentiful to marginalized communities in Southeast Michigan, action must be taken to ameliorate this lasting disparity.
Given the complexity and large geographic scope of regional problems, sweeping action is often prescribed to address the breadth of these challenges, often by higher-level planning and government entities.1 Top-down solutions carried out by decision-makers that lack meaningful engagement with the communities that are closest to proposed changes often result in outcomes that are disjointed from the community’s needs, desires, and visions.2 Further, regional approaches in addressing issues may not account for important local differences in preferences and capacity.3 There is no one-size-fits-all approach to solving multi-faceted localized issues; a “fix” in one community could have negative impacts upon another or be entirely irrelevant to resident needs and desires. Although equitable access to green space is a regional issue, research and planning processes that are tailored to community history and contexts are necessary to define unique needs of each community and create an enduring positive impact. While this analysis is specific to Southeast Michigan, our project team has explored additional opportunities to use a mix of state, regional, and local-level equitable planning approaches to address discrepancies in access to and quality of green spaces across the region. The following approaches to green space planning and resourcing are intended to support equitable processes and outcomes as they relate to improving access to and the quality of green spaces at the community level in Southeast Michigan.
2. ELEMENTS OF EQUITABLE PROCESSES AND OUTCOMES
Crafting equitable processes and delivering equitable outcomes entails meaningful and continuous community engagement.4 Traditional approaches to public participation in government have historically excluded marginalized, minority, and low-income communities,5 consequently resulting in skewed resource allocations that favor predominantly white, higherincome single family neighborhoods,” and maintaining racial and class-based inequity.6 Countless research findings demonstrate that attendees of public meetings (i.e., a dominant mode of participation), particularly in jurisdictions with larger populations of low-income and minority individuals, are often unrepresentative of an area’s socioeconomic and demographic makeup.7
Adopting equitable planning processes that champion inclusive engagement practices can
59 Chapter 5:
in the
Process
Embedding Equity
Planning
“build civic trust, social capital, and increase the likelihood of an equitable distribution of community benefits.”8 These processes seek to empower residents to play a greater role in shaping decisions that impact their communities. These methods work to elevate community perspectives (particularly those of underserved and underrepresented groups), acknowledge historic inequities produced and maintained by civic institutions, broaden participation tactics, and redistribute decision-making power.9 Collaborative planning can also help produce consensus which smooths the way for implementation and reduces the potential for future conflict.
Arnstein’s “Ladder of Citizen Participation” (see Figure 5.1) is a dominant model used to analyze democratic public participation and intersecting issues of power.10 This model is useful for evaluating how tokenistic forms of participation may impose harm, and participation that favors increased community control may be more beneficial. While the ladder is a useful model to understand power and participation, its use as a professional tool may be limited. The ladder does not productively address major setbacks to participation such as systemic racism, unequal information, diverse forms of organizing, and institutional resistance to redistributing power.11 Despite its limitations, the ladder remains useful as a lens through which decision-makers can analyze the extent to which their community engagement practice legitimately affects outcomes.
On Arnstein’s ladder, “manipulation” (1) and “therapy” (2) sit at the base of the ladder representing “distortions of participation into a public relations vehicle by power holders” and disingenuous consultation.12 These lower-rung approaches have historically been used to promote and perpetuate harmful, discriminatory policies (e.g., urban renewal).13 Rungs six through eight represent higher “levels of citizen power” and “increasing degrees of decisionmaking clout,” wherein community members may grasp a greater effect on outcomes.14

60
Fostering Racial Equity in Access to Green Spaces
Note: The above image was recreated in the article, Theodora Vardouli, “Who Designs? Technological Mediation in Participatory Design,” in DigitalSTS: A Handbook and Fieldguide, ed. Janet Vertesi and David Ribes (Princeton, NJ: Princeton University Press, 2019), 17-29.
Source: Sherry R. Arnstein’s “A Ladder of Citizen Participation,” Journal of the American Institute of Planners 35, no. 4 (1969): 217.
Figure 5.1. Arnstein’s Ladder of Citizen Participation.
Although there are heightened requirements for public entities to work more directly with the community and incorporate more participatory features in decision-making processes, “many studies indicate that participation often falls on the lower rungs of Arnstein’s ladder.”15 Rudimentary participation tactics (e.g., increasing frequency of public meetings) commonly applied to ‘tick boxes’ for civic engagement are generally ineffective in collecting and incorporating community voice and desires into decisions. Shifts towards more meaningful engagement are necessary to address community needs and desires in policy and planning. Equitable planning processes that uplift community voice and power in decision-making (i.e., beyond tokenistic engagement and towards co-production) are often positioned towards the highest rungs of Arnstein’s ladder.16 Equitable planning processes, such as collaborative planning (discussed in more detail below), that center community and build citizen power in the process are feasible and effective approaches.
3. STRATEGIC RACIAL EQUITY FRAMEWORK
Greater community involvement in planning processes is an important foundation for increasing equity, but equitable planning is also concerned with the dynamics within organizations and meetings. Getting people in the room is the first step, but full equity requires they are heard and respected. Doing so often requires challenging existing practices and dynamics that may be alienating and exclusionary and may even occasionally include personal attacks or incidents of racism. A racial equity framework allows practitioners to anticipate and respond to this, and proactively build inclusive spaces.
In the planning discipline, the “equitable process, equitable outcomes” approach is commonly adopted. While this is a valuable method in broadly advancing equity, building on this with a specific racial equity lens is critical to go beyond a slogan and develop thoughtful and truly inclusive processes. Planners ought to take intentional strides in adopting racial equity frameworks to fully comprehend issues of structural racism (i.e., including those that the field has contributed to such as redlining, urban renewal, and concentrated urban poverty), craft inclusive planning practices, and evaluate the impact of programs in meeting racial equity goals. Sweeping regional approaches to advancing equity may fall short in meeting community-level needs, especially in the context of supporting marginalized communities in Southeast Michigan. Developing a more detailed notion of equity that explicitly devotes attention to racial disparities is a powerful step in actualizing justice
To avoid perpetuating and/or deepening racial inequities in the allocation and improvement of green spaces in Southeast Michigan, adhering to a racial equity framework is essential. Racial equity frameworks are used to empower the full participation of interested and affected communities, especially those who have been historically marginalized and/or excluded in traditional public participation processes.17 MEC and other regional stakeholders can use a racial equity framework to better communicate racialized inequities in the allocation of and access to green spaces in Southeast Michigan when advocating for social change. Decisionmakers and practitioners in the realm of green space planning can also use a racial equity framework to both communicate racialized inequities and ensure actions do not further
61
Chapter 5: Embedding Equity in the Planning Process
exclusion.
Racial equity “is a process of eliminating racial disparities and improving outcomes for everyone. It is the intentional and continual practice of changing policies, practices, systems, and structures by prioritizing measurable change in the lives of people of color.”18 Scholars of critical race theory in education, Liliana M. Garces and Cynthia Gordon da Cruz, developed the “Strategic Racial Equity Framework” that supports transformative processes to advance racial equity across disciplines. After reviewing and discussing 10 prominent racial equity frameworks, our team selected the “Strategic Racial Equity Framework” as the most effective option in achieving organizational and institutional change. This framework, compared to the others, had a more actionable approach that may be more applicable to planning or green space practitioners. This framework is helpful in articulating historic factors and systemic racism that have reproduced racial disparities and in offering actionable pathways forward towards greater equity. The “Strategic Racial Equity Framework” offers three key principles and sub-aims to fulfill this objective (see Figure 5.2):

1. “Attending to the dynamic relationship among power, race, and identities.”19
• Decision-makers must develop racial literacy.
• Conduct power analysis and examine with an intersectional lens.
2. “Actively naming and addressing hidden and visible contributors to inequity.”20
• Developing critical consciousness.
• Using accessible language to name and discuss inequitable structures.
3. “Generating power among marginalized communities toward transformative policies.”21
• Integrating key lessons of community-organizing and social capital theory to actualize change.
62
Fostering Racial Equity in Access to Green Spaces
Note: Template provided by Slidesgo and Freepik, graphic created by Kathryn Economou.
Source: Information provided by Liliana M. Garces and Cynthia Gordon da Cruz’s, “A Strategic Racial Equity Framework.”
Figure 5.2. Strategic Racial Equity Framework.
3.1.1 Principle 1: Addressing Dynamic Relationships Between Power, Race, and Identity
The first prong in this framework is “attending to the dynamic relationship among power, race, and identities,” this prescribes that practitioners ought to gain “racial literacy” and conduct “power analysis” through an intersectional lens.22 Racial literacy entails developing critical knowledge and insight to meaningfully engage in discussions surrounding race and racism.23 This encompasses enriching one’s vocabulary and developing greater perception skills to identify and address racial inequity. Furthermore, this does not only focus upon race; to become racially literate, individuals must “interrogate the dynamic relationship among race, class, geography, gender, and other explanatory variables.”24 These relationships cannot be explored without attention to power. In practice, building racial literacy and instilling AntiRacism as an organizational value can take shape in many forms. Exercises in developing racial literacy can include reflection exercises, reading groups,25 self-examination, identity workshops, and community talking circles.26
Conducting Power Analysis requires exploring the relationship between race and power. The goal of Power Analysis is to better understand how practices and processes (i.e., from system down to the individual levels) have caused or intensified inequity and limited individuals with marginalized identities’ ability to express power. Power in this context refers to “having the capacity to do something” (i.e., the ability to exercise agency in action and the capacity to access resources).27 Power analysis is a powerful tool to transform processes and move beyond damaging ‘understandings’ of race and identity that uphold manifestations of white supremacy and privilege.28 Additionally, this process encourages the consideration of dimensions of identity, race, and power, uncovering convergences to realize transformational social change.29 Power analysis can be conducted with different tools such as targeted strategy development activities, accountability matrices, and power mapping.30
Practitioners and communities alike can use power mapping, a visual tool of power analysis, to identify where power dynamics exist surrounding key issues, and then find opportunities to redistribute power to uplift marginalized communities and heighten equity. Power mapping is most effective when the community itself participates in the process to provide valuable knowledge in local assets, community issues, and power holders.31 The Restorative Justice Project offers a step-by-step “Guide to Power Mapping” to assist organizations and communities with power mapping.32
Strategic power mapping involves identifying key issues negatively impacting a community, identifying what forces are perpetuating the issues, identifying stakeholders (i.e., power holders, opposition groups, ally groups, etc.), and placing the stakeholders on a relative power map grid.33 On the grid, the entities are positioned on the vertical axis in relation to their power and along the horizontal axis relative to their political positioning on the issue at hand.34 Once the power map is complete it can be analyzed to recognize where power is concentrated and how it may perpetuate issues of inequity, then opportunities for community building may present themselves across entities on the map to challenge and redistribute power back into the hands of the community.
63 Chapter 5:
in the
Process
Embedding Equity
Planning
3.1.2 Principle 2: Naming Hidden and Visible Contributors to Inequity
The second prong in this approach is “actively naming and addressing hidden and visible contributors to inequity,” this notes that practitioners must develop “critical consciousness” and use accessible language when discussing inequitable societal structures.35 Acknowledging contributors to inequity starts with gaining critical consciousness to understand how processes and practices across systems and levels “systematically privilege whiteness.”36 Critical consciousness is a practice in actionable self-awareness to build stronger skills in both identifying and working against racial inequity.37 This practice requires that individuals analyze how their personal identities affect their perceptions of and power in society. Similarly to improving racial literacy, assessing one’s positionality allows individuals to better and more directly address systemic inequities.
Using accessible language to discuss inequity calls for accurate articulation of the problem and its root causes, those who are burdened, and challenges to ameliorate the issue.38 Using clear and direct language is a concrete step in uncovering, opposed to camouflaging, actions that uphold racial inequity. Language is important; using racially sensitive terms and effective communication practices is important to center the perspectives of marginalized groups, avoid using problematic language, and create safe spaces. Organizations can use inclusive language guides to fulfill this aim to ensure that both interpersonal and group communications (i.e., written and verbal) are infused with principles of racial literacy in a clear, effective manner.
3.1.3 Principle 3: Generating Power
The third prong in this approach, “generating power among marginalized communities of color toward transformative policies,” uses teachings of community-organizing theory and social capital theory to create positive social change.39 Applications of these tactics to create new strategies to advance equity include:
• Naming hidden contributors of racial inequity and interrupting dominant discourses that sustain marginalization.
• Emphasizing focus on shared interests across seemingly dissimilar, shifting identities.
• Developing leadership capacity and building relationships.
• Leveraging power through organized and informed channels.40
This expanded approach has the potential to create collective agency and power, increasing the influence of marginalized communities in increasing racial equity through advocating for socially transformational policies, processes, and action. Decision-makers can support community power building by enabling greater opportunities for meaningful participation in planning processes. In practice, this may be accomplished through actions including supporting grant applications of community-based organizations, supporting the development of local
64 Fostering
Racial Equity in Access to Green Spaces
community leaders, and creating resident advisory boards.
Overall, combining the “Strategic Racial Equity Framework” with “Core Green Space Equity Principles” (see “Chapter 1: A Vision of Green Space Equity”) is a tangible step MEC and other regional stakeholders can use to address ongoing racial inequities in access to green spaces.
4. COLLABORATIVE PLANNING PROCESSES
In essence, collaborative planning (CP) is an approach that begins by identifying and systematically involving affected communities and other stakeholders. Using lessons learned from CP, policy advocates across levels and decision-makers at the local government level can work alongside the community to equitably improve quality of and access to green spaces. CP methods align closely with core principles of equity, in particular, the necessity of community involvement at each stage of the process (i.e., from problem definition to evaluation).41
Practitioners of CP work create an environment wherein governments and different relevant stakeholders (i.e., all parties interested in and affected by decisions) come together to participate in collective decision-making processes.42 To promote collaboration, CP centers on creating opportunities for dialogue with the end goal of building trust, consensus, and mutuallybeneficial outcomes. CP encourages diverse forms of knowledge sharing and plan-making between technical experts, decision-makers, and community members to illuminate pathways towards partnership and co-production.43 Research has shown that collaborative planning and forms of engagement help decision-makers “understand local public knowledge, assists in identifying needs, contributes to the dynamic exchange of information, and promotes the consolidation of diverse perspectives, empowers people,” while simultaneously improving the accountability of public officials.44 Select goals of using CP include:
• Empowering underrepresented stakeholders to participate and affect greater change in the process and resulting outcomes.45
• Enabling clearer understandings of multifaceted issues affecting stakeholders to accurately define problems and create stronger solutions by combining local and expert forms of knowledge.46
• Building consensus between conflicting interests, values, and perspectives.47
• Strengthening community power and capacity in public problem solving and creating networks between stakeholders to pool and mobilize resources.48
• Improving the legitimacy of public institutions through collaborative governance, which heightens trust between community and decision-makers, and among stakeholders.49
Although often encompassing a wide variety of tools and strategy, projects using CP have a consistent approach. Collaborative planning “incorporates plan-making and implementation processes where all community members feel welcome to participate and are confident that their participation can positively affect outcomes.”50 CP is an active, constantly evolving process
65
Chapter 5: Embedding Equity in the Planning Process
intended to adapt to shifting perspectives, relationships, needs, interests, and capabilities of stakeholders.51
CP involves convening diverse stakeholders to address and combat a shared issue, resulting in mutually-beneficial outcomes (e.g., jointly produced action plans, vision statements, agreements, etc.).52 Fundamentally, CP is a practice in negotiation between interests and individuals. Genuine stakeholder participation and engagement in CP is a precondition for equitably, co-produced outcomes.53 In this sense, negotiation between stakeholders and decision-makers redistributes power and grants greater citizen influence over outcomes.54 Specific CP tools used to enhance collaboration and participation so that resulting outcomes reflect community identity and priorities include stakeholder analysis and the diversity, interdependence, and authentic dialogue (DIAD) model.
4.1 S takeholder Analysis, Consensus Bui lding, and the DIAD Model
Stakeholder analysis is a key tool of CP that works to understand and identify differing interests, concerns, and relationships of affected/involved individuals in the context of a particular issue or project. Stakeholders refers to all interested and affected parties, commonly within a specific geographic area.55 Stakeholder analysis assigns accountability by ensuring that all stakeholders are considered so that outcomes do not create or deepen problems for particular individuals, groups, or communities.56 Stakeholder analysis seeks to prevent stakeholders with more relative power from having “a greater influence on decision-making outcomes than more marginalized groups.”57 Conducting stakeholder analysis is a three step process involving different methods that fit varied processes and projects. Steps of stakeholder analysis include:
1. Identifying stakeholders.
2. Differentiating between and categorizing stakeholders.
3. Investigating relationships between stakeholders.58
The first step of identifying stakeholders involves recognizing “active” (i.e., those who affect a decision) and “passive” (i.e., those who are affected by a decision, either directly or indirectly) stakeholders as well as all other interested parties.59 There are many useful methods to assist the identification process such as conducting focus groups and interviews, snowball sampling, and surveying.60 The second step of stakeholder categorization entails classifying stakeholders to consider and weigh their interest and influence given a particular issue or project. Methods of categorization include creating interest-influence matrices, stakeholder-led categorization, Q methodology, and radical transactiveness.61 The third step of investigating stakeholder relationships is used to better understand interrelationships of stakeholders.62 Commonly used methods include actor-linkage matrices, social network analysis, and knowledge mapping.63 Stakeholder analysis is an important first step in developing collaborative processes. Ensuring that all interested and affected parties are adequately represented is crucial before convening stakeholders.
66 Fostering Racial
in
Equity
Access to Green Spaces
5: Embedding Equity in the Planning Process
After the identification and analysis stage, convening the identified stakeholders to participate in planning process development follows. Consensus building among stakeholders is an important aspect in facilitating productive and respectful meetings to co-create beneficial outcomes for all participants. Consensus building approaches (CBA) are practical and flexible strategies to achieve stakeholder agreement, which are beneficial to various group sizes, identities, and dynamics.64 CBA is a viable alternative to standard public meeting approaches that often default to favoring the desires of the “majority.” Conventional “majority rule” approaches can lessen the influence of minority groups and underrepresented interests and in turn may result in heightened inequity.65 Additionally, rejecting “majority rule” procedures gives way to worthwhile dialogue between diverse stakeholders on issues, which may uncover innovative solutions that could remain hidden in the instance of rudimentary “majority rule” voting procedures.66 As detailed in Lawrence Susskind and Jeffery Cruikshank’s book Breaking Robert’s Rules, CBA is a five step process that entails:
1. Convening: “Agreeing to use a particular decision making process, defining the problem, agreeing who needs to be at the table and how to get them there, and completing some of the other preliminaries for a productive dialogue.”67
2. Assigning Roles and Responsibilities: “Clarifying who will be in charge, specifying the ground rules, defining the role of a facilitator (i.e., either an outside professional or someone from within the group), making sure someone is keeping track of what has been decided, and laying out the rules about how observers may participate.”68
3. Facilitating Group Problem Solving: “Generating mutually advantageous proposals and confronting disagreements in a respectful way. Effective problem solving draws upon the best available information and ensures that a range of possible solutions, including some that no one may have thought of before, are considered in an effort to do everything possible to meet the concerns of all participants.”69
4. Reaching Agreement: “Deciding isn’t as simple as voting. It’s about coming as close as possible to meeting the important interests of everyone concerned, and documenting how and why an agreement was reached.”70
5. Holding People to their Commitments: “This involves more than each person simply doing what they promised. It’s also about keeping the parties in touch with each other so that unexpected problems can be addressed together.”71
As aforementioned, fostering an inclusive and respectful environment with meaningful dialogue is essential to CP when negotiating across many differing identities and interests. Value, identity, and other dimensions of difference between stakeholders often give rise to conflict, and when mismanaged, can result in costly setbacks and heightened community division.72 Conditions for productive dialogue within meetings are further described by Innes and Booher’s Diversity, Interdependence, and Authentic Dialogue (DIAD) model. The DIAD model (see Figure 5.3) gives additional insight to CP network dynamics (i.e., the complex dynamics of stakeholders in CP processes, wherein information and dialogue is exchanged, and participants develop networked power to affect outcomes).73 Further, the DIAD model explains how the interconnectedness of
67
Chapter
diversity, interdependence, and authentic dialogue can be harnessed to create positive group dynamics to deliver beneficial outcomes.74
In this model diversity refers to variable perspectives of participants in relation to an issue or project. Diversity gives way to innovative ideas for approaches and empowers the use of local knowledge.75 Interdependence encompasses the interests of individual stakeholders in reference to that of other participants.76 Conditions of diversity and interdependence then present the opportunity for authentic dialogue, wherein participants speak candidly about their experiences and interests and realize shared priorities and negotiate through divergence to co-create beneficial outcomes.77

Effective CP is contingent on trust-building with stakeholders (i.e., interested and affected parties, particularly underserved and underrepresented groups) initiated by decision-makers.78 Generating trust requires authentic dialogue, rooted in core principles of inclusion, equity, diversity, and interdependence. 79 Public meetings that have authentic dialogue would feature the following conditions:
• Stakeholders set ground rules for communication to engage in truthful, mutually respectful dialogue with one another.
• Stakeholders have equal access to information to weigh their self-interest in relation to others.
• Stakeholders listen to and acknowledge the legitimacy of all participants, regardless of their relative power.
68 Fostering
Racial Equity in Access to Green Spaces
Source: Judith Eleanor Innes and David E. Booher’s Planning with Complexity: An Introduction to Collaborative Rationality for Public Policy.
Figure 5.3. The DIAD model.
• Stakeholders engage in dialogue to “deliberate on the problems they face together” in a collaborative and rational manner.80
These conditions work to equalize power, meaning “everyone has the right to a point of view, no one is too dominant, and all are engaged and interacting.”81 Acknowledging and balancing power dynamics in CP is essential to make certain that stakeholders that are historically marginalized in decision-making processes have equal voice and sway in the process. Authentic dialogue often necessitates the presence of a skilled facilitator to guide the process, ensure all conditions for authentic dialogue are centered, and address power dynamics that may impact outcomes.82
An illustrative example of collaborative planning for green spaces can be viewed through the City of Vancouver’s park planning and management system. The City of Vancouver uses a hybrid public-private partnership model for the funding and management of parks in combination collaborative tools of engagement.83 The City of Vancouver uses stakeholder analysis to identify and organize participants and consensus building approaches among stakeholders for the visioning and planning of new urban parks. This approach was valuable in “enabling local citizens to develop skills in collective endeavors such as public participation and consensus building in the development and management of parks.”84 Additionally participants viewed the increased inclusion of the public as a positive step towards “good governance” and it was “helpful to imagine how collective decisions can be made in large communities.”85 As collaborative planning and tools give community members greater voice and power in shaping outcomes that most directly impact them, this is a valuable approach to create/improve green spaces in an equitable and representative manner.
5. PURSUING EQUITY IN INVESTMENT AND FINANCING
Equitable planning processes entail inclusive dialogue among diverse stakeholders and collaborative decision-making to subvert systemic structures of power and the implementation of solutions that are traditionally imposed from the top-down. Our team acknowledges that the actual decisions and resulting projects that come from community-based dialogue and planning should be specific to the context in which they are being created. However, access to resources and funding that may not have been historically available plays a fundamental role in enabling communities to make these responsive, collaborative decisions about the outdoor recreational spaces and facilities they want to see in their community, including green spaces. Given that inequities in funding and resource allocation present substantial hurdles to the quality and availability of green spaces across Southeast Michigan, the following section will explore and evaluate numerous funding models, including the prominent Michigan Natural Resources Trust Fund and American Rescue Plan Act-supported Spark Grants, for their potential and limitations in promoting equitable access to outdoor recreation and green spaces.
69 Chapter
5: Embedding Equity in the Planning Process
5.1 Equity in Tr aditional, Private, and Civic Funding Mod el s
For all funding opportunities that exist in public, private, and civic spheres, there are opportunities for each to promote equity in resource collection and distribution. Because our team understands equity as targeted actions to promote understanding, intentionality, and accountability and commitment in support of favorable access to opportunities for marginalized communities, funding mechanisms that uphold these tenets hold the greatest promise in realizing equitable outcomes. Being mindful of where resources to support recreational advancements come from and where they are applied is critical for the application of equitable investments. This section provides a brief overview of commonly utilized sources of funding across sectors.
While, on their face, traditional sources of parks and recreation funding may not always embody equity in their creation or application, there are opportunities for them to address disparities as they relate to green space distribution and quality. These models are provided below:
• Bonds & Voter Referenda
• Property Taxes
• Sales Taxes
• User Fees & Earned Revenue
• Land & Water Conservation Fund and the Outdoor Recreation Legacy Partnership Program
General obligation bonds, especially when approved by voter referenda, can reflect a community’s willingness and desire to support outdoor recreation across a jurisdiction. Balloted measures to approve bond financing can specifically promote equity by outlining the ways in which this form of investment will be applied to communities that most need it. As a stable source of funding that is the predominant source of a municipality’s general budget, property taxes can support sustained investments in outdoor recreation. While property taxes are somewhat regressive because their payment is proportional to the value of an owner’s property, which may be used as a proxy for total wealth, they are not directly reflective of the actual income of a property owner. Dedicated property tax funds in particular have an inherently redistributive effect for a community as a whole and are especially effective when equity considerations and frameworks guide their distribution.
Sales taxes and user fees present the greatest challenges to equitable financing among these traditional models. Sales taxes, unless allocated to green space planning from luxury goods taxes, are unlikely to redistribute wealth and resources in an equitable manner, and user (entrance) fees have a high likelihood of prohibiting low-income individuals and families from
70 Fostering Racial Equity in Access to Green Spaces
in
Process visiting a park or recreational facility.
A federal funding program, the Outdoor Recreation Legacy Partnership Program (funded by the National Park Service’s Land and Water Conservation Fund) was established to fund recreation projects in “economically disadvantaged” urban communities that are “underserved” in terms of available parks and recreation investments. Awards distributed by ORLP typically prioritize the development of new outdoor recreation spaces, investments and improvements to existing facilities, and programming to encourage connection between community members and the outdoors.86
Though not a replacement for public sources of funding backed by local units of government, private funding mechanisms and resources provided by civic society, including resources related to advocacy efforts and the capacity of facility personnel, are important supplements to sustain recreational investments. Examples of these models are given below:
• Developer Fees, Incentives, & Concessions
• Community Development Block Grants
• Conservancies, Friend Groups, & Public Corporations
• Community Ownership
• Philanthropic Partnerships
Case Study: Pittsburgh’s Parks Plan
The following case study provides an example of equitable park planning that aligns with the principles of collaboration and collaboration that were previously outlined in this chapter. The planning process also blends a number of mechanisms of equitable park funding.
The collaborative approach to creating Pittsburgh’s Parks Plan illustrates how support for investment in parks across the city can be garnered through the backing and support of a formalized community-based conservancy and sustained through voter-approved ballot referenda that support an increase in outdoor recreation investments. Local park conservancies are valuable community partners that commit to raising funds and resources to support the development and improvement of parks across their city. Conservancies also cultivate a “vocal constituency” of support for equitable park investments and advocate for communitydriven solutions to present inequities.87 The approval of general obligation bonds through voter referenda generally illustrates the perceived value of parks and recreation investment within a community and, subsequently, commits to city-backed support. The parameters of specific voting measures can promote equity by explicitly naming intentional investments in marginalized communities as a priority of the program in question.88
In partnership with the City of Pittsburgh, the Pittsburgh Parks Conservancy enacted its strategic plan’s equity-focused initiative by pursuing the goal to support a high level of quality
71
Chapter 5: Embedding Equity
the Planning
Fostering Racial Equity in Access to Green Spaces
in parks and green spaces of all neighborhoods across the city. To fulfill this goal and equitably target investments to neighborhood recreation spaces with the highest need, the Conservancy and City of Pittsburgh called upon data-driven insights that came directly from residential feedback and priorities, information about neighborhood park conditions and investments, and demographic characteristics of each park’s surrounding community.

Through community engagement processes and sessions that reached nearly 10,000 residents, the resulting Parks Plan detailed equitable investment approaches to improve the safety of parks, prioritize maintenance, increase community responsive programming, and upgrade facilities for neighborhood recreation spaces across the city. Community feedback was particularly useful to confirm trends and stark disparities that existed in the current conditions and resourcing of park sites. This feedback also informed the prioritization of relevant maintenance needs and culturally responsive programming activities for each neighborhood. “Need,” as operationalized by park conditions and community characteristics (including racial concentrations of poverty, prevalence of various health conditions across the neighborhood, crime rates, vacancy, and so on), was used to create a schedule of priority for neighborhood parks with the most evidence of current disinvestment and, subsequently, establish an order in which to address discrepancies in quality.89
https://pittsburghparks.org/our-work/restoring-pittsburgh-parks/.
To ensure the sustainability and implementation of the Parks Plan, Pittsburgh voters passed a parks tax referendum in November 2019 that allocated $10 million of public funding annually to the plan. The intentionality of the role that community input and engagement played in
72
Source: Restoring Pittsburgh Parks,
Figure 5.4. Overview of residential feedback that informed the Pittsburgh Parks Plan
the plan’s creation speaks to the support of the referendum and how democratic processes of plan creation and municipal budgeting hold promise to promote equitable solutions. Successfully allocating annual referendum funding to the Parks Plan’s implementation illustrates a tangible payoff of the Conservancy and City of Pittsburgh’s dual efforts to garner and consider community input. Though certainly time consuming and requiring a lot of resources and capacity, prioritizing community engagement and input to structure the plan garnered investment for residents across the city which then enabled a lasting mechanism of financial support backed by participants and stakeholders across the city.90
6. THE MICHIGAN NATURAL RESOURCES TRUST
FUND & CURRENT FUNDING
METHODS
The Michigan Natural Resources Trust Fund (MNRTF) provides major grant funding to state and local units of government across Michigan to acquire land for resource conservation and/or to support the development of public outdoor recreation spaces, including recreational facilities. The MNRTF formed in 1976 when the Kammer Recreational Land Trust Fund Act created the Michigan Land Trust Fund (MLTF) program to support public land acquisitions and the subsequent protection of natural resources and outdoor recreation for communities across the state.91 The funding is administered by the Michigan Department of Natural Resources (DNR) and supported by lease and royalty payments from the state’s oil, gas, and mineral industries.92 Each year, $15 to $20 million in grant funding are allocated to recipients across the state.93
Grant applications and eligible projects are broadly grouped into two categories: land acquisition and development. The most recent change to Michigan’s constitution and parameters regarding the distribution of MNRTF funding took place in 2020 when state residents voted to pass a proposal to enable greater flexibility in the extent to which annual grant funds support acquisition versus development projects.94 This amendment established that acquisition and development projects will each receive a minimum of 25 percent of MNRTF’s total funding for every application cycle, leaving a full 50 percent of total NRTF funding available to be distributed to projects in either category based on the application trends and project needs of that year’s cycle. This funding distribution is a notable shift from the previous standard of allocation in which 75 percent of total funding was dedicated to land acquisition and just 25 percent supported development projects.95
The inequitable distribution of green and outdoor recreation spaces across Michigan points to development funding that supports recreational needs of maintenance, facility construction and renovation, programming, repairs, and expansion as notably promising in its potential to begin to remedy disparities in the availability of well-resourced outdoor recreation spaces in marginalized communities. Given Michigan’s history of urban decline resulting in weak real estate markets in many urban centers, the cost of land acquisition in urban areas is often a lesser need than funds for environmental remediation, maintenance, and the development of visitor amenities natural and green spaces. Conservation needs are certainly present in the
73 Chapter
5: Embedding Equity in the Planning Process
acquisition and repurposing of vacant land, but improving the quality of urban green space through development efforts holds great importance and equity considerations that are aligned with our team’s Core Principles of Green Space Equity.
Beyond the Trust Fund’s annual funding distribution structure, enabling legislation of the MNRTF has set a $15,000 funding minimum and $300,000 maximum for development projects but does not specify a minimum or maximum amount for land acquisition requests. Regardless of the project type, all recipients of MNRTF funds are required to match 25 percent of the grant award; applicants with the fiscal capacity to match a greater portion of requested funds receive greater consideration during the decision making process.96
6.1 Progra mmatic Challenges to Equitable Outcom es
As a consistent source of funding for the acquisition of land and its development to support recreational uses, the MNRTF illustrates Michigan’s commitment to supporting the reach of quality outdoor recreation across the state. However, various mechanisms of this grant program, including the parameters that are a fixed part of the state constitution, point to limitations in the MNRTF’s ability to support equitable access to parks, green, and natural spaces in municipalities across the state. The following two subsections analyze four elements of the MNRTF application process from an equity standpoint to illuminate the ways in which the program could consider the exclusionary elements of its requirements.
6.1.1 Application & Eligibility Requirements
The eligibility requirements of potential grant recipients as well as the components of the application for grant funding present concrete challenges to seeking out and receiving funding from the MNRTF. These requirements have had the inadvertent effect of reinforcing challenges that communities with limited capacity and resources face in their endeavors to increase access to green space. MNRTF funding may only be awarded to state and local units of government with the authority to provide public outdoor recreation.97 While governmental entities are wellversed in community needs and how to strategically disperse funds to ensure their fullest utility, limiting applicants to the public sector can simultaneously overburden these public entities who are eligible (and expected) to apply, and also prevent applications from more novel publicprivate partnerships that would be well equipped and dedicated to progressing a mission of equitable access to outdoor recreation, such as the Detroit Riverfront Conservancy.
Further, this requirement assumes that all municipalities that would be interested in applying for financial support through the MNRTF have a governmental unit with the authority to support public outdoor recreation. This is not inherently true for all communities across the state and, as a requirement, is arguably in tension with the aims of any grant distributed to rectify pervasive community needs relating to current discrepancies. Municipalities without an eligible governmental unit like a parks and recreation department are automatically barred from
74 Fostering Racial Equity in Access to Green Spaces
accessing funding that might otherwise progress community goals regarding acquisition and development projects.
For municipalities with governmental units that are eligible to apply, designating them as the only entity that can seek out funding inevitably burdens smaller, fiscally stressed communities that may not have the capacity to prioritize parks- and recreation-related programming and development. As a part of the application, the MNRTF requires an up-to-date five-year parks and recreation plan applicable to the current year for all applicants which, in itself, requires a history of investment in and dedicated capacity to consider and plan outdoor recreation. This may not be available for some communities without some initial degree of support, but support from the MNRTF presupposes this investment.
Inherently, wealthy localities’ fiscal strength supports budgetary flexibility and the ability to invest in parks, recreation, and outdoor spaces to a larger degree.98 Alternatively, investment in parks and recreational spaces is not as highly prioritized by municipalities with poorer financial health from smaller and/or declining tax bases. In these instances, there is often a question of where the municipality should begin to cut funding, and it is often the case that access to green spaces and recreational facilities is regarded with less importance than housing, education, public safety, and other services likely to be encountered (or needed) on an everyday basis.
6.1.2 Matching Requirements
Beyond meeting various parameters in the application process itself, a municipality’s receipt of MNRTF funding is contingent upon its ability to match a minimum of 25 percent of the total award. Match requirements present an obvious challenge to fiscally stressed communities that would benefit from fully external funding. Communities with small tax bases often lack a park millage or general fund resources that would support a match to MNRTF funds. Despite benefits to physical, mental, and community health that parks provide to local residents, investment in recreational services and public outdoor spaces can be held at odds with other pressing local needs and regarded as a tradeoff for fund distributions in communities that face fiscal precarity.
In addition to this requirement presenting a barrier to communities whose budgets are fully reliant on external funding to support applicable recreation projects, it also reinforces the trend that wealthier municipalities are better able to take advantage of the Trust Fund. For well-resourced communities with the capacity and experience to successfully navigate the application process, MNRTF is an annual source of funding that provides three times the funds that the community can commit to provide for proposed projects. Grants are often regarded as a way to equitably account for historic inequities and divestment along lines of race and class. However, this purpose can be compromised when wealthy localities approach the grant application process as a procedural opportunity to access money rather than honoring the grant as an avenue to address demonstrated need.
Finally, limitations to the amount of funding that development projects can receive may hinder
75
Chapter 5: Embedding Equity in the Planning Process
the types of projects that a municipality chooses to take on. The 25 percent match requirement is certainly a higher total amount of money ($75,000) for development projects that receive the maximum funding amount of $300,000; however, for significant projects in densely populated urban areas of the state like Detroit, total project funding of $375,000 may not be sufficient to reach the fullest extent of the city’s goals as they relate to the development of outdoor recreation opportunities.
6.2 MNRTF in Southeast Michigan
To evaluate the presence of MNRTF across our project’s region of focus, we investigated funding awards at the county level by demographic characteristics of Southeast Michigan’s seven counties. Our team acknowledges that disparities in access to funding, including those present in the application process, may be felt more severely at the municipal level which is not captured by the following analysis. While there is more specificity to delve into, the preliminary analyses by county point to evidence of discrepancies in funding allocation that reflect the racial compositions of all seven areas.
In general, Figure 5.5 shows the distribution of MNRTF funding awards for counties across Southeast Michigan and illustrates the trend that counties with a higher percentage of a Black population receive less funding per capita from the Trust Fund. St. Clair County has the second lowest percentage of Black residents across the seven county region, but has received by far the most funding per capita from the MNRTF throughout the history of the program. Similarly, Monroe County has the second highest per capita funding from the MNRTF and the

76
Fostering Racial Equity in Access to Green Spaces
Source: MNRTF Grant Total by County as of December 31, 2022; U.S. Census Bureau QuickFacts by Southeast Michigan County.
Figure 5.5. Total MNRTF Funding by Black Population in Southeast Michigan Counties
third lowest percentage of Black residents of all counties across the region. Wayne County, on the other hand, has the highest percentage of Black residents of the region’s counties and encompasses the city of Detroit but receives the second least in MNRTF funding per capita. Macomb County receives the lowest funds per capita and has the third highest percentage of Black residents in the region.
While Livingston County, Oakland County, and Washtenaw County deviate slightly from the previously identified trends in funding, Table 5.1 (below) and the median household income of each county may inform some elements of these differences. These counties have the highest median household income of all seven counties in the region. While Livingston County holds the largest white population and the most wealth of all counties in Southeast Michigan, MNRTF funds per capita are the second lowest. This discrepancy may point to Livingston’s ability to fund its parks and outdoor recreational spaces without the assistance of the Trust Fund. While the Black population of both Oakland and Washtenaw County comprise 13.3 percent of each county’s total population and, consequently, have the third highest Black populations of the region, the relative wealth and available resources of both counties more than likely speak to each county’s ability to access funds from MNRTF.
77
Chapter 5: Embedding Equity in the Planning Process
County Total MNRTF Awards (19782022) Total MNRTF Funds per Capita (2022 population) Median Household Income (2022) % White Population (2022) Livingston County $12,409,865 $63.64 $88,908.00 96.30% Macomb County $20,457,855 $23.40 $67,828.00 79.00% Monroe County $15,449,375 $99.28 $68,006.00 93.90% Oakland County $94,267,717 $74.26 $86,275.00 75.00% St. Clair County $23,587,249 $147.28 $62,847.00 93.90% Washtenaw County $31,141,114 $85.00 $79,198.00 74.30% Wayne County $108,824,003 $61.5 $52,830.00 54.70%
31, 2022; U.S. Census
Source: MNRTF Grant Total by County as of December
Bureau QuickFacts by Southeast Michigan County
Table 5.1. MNRTF & Demographic Characteristics of Southeast Michigan Counties
6.3 Spark Grant Funding
The Michigan Spark Grant program is made possible by the Building Michigan Together Plan and largely supported by funding from the American Rescue Plan Act (ARPA) distributed to state and local governments in response to the COVID-19 pandemic (i.e., funds must be spent before December 2026).99 In general, the parameters that guide Spark funding distributions are less restrictive than those that dictate how awards are provided by the MNRTF. The eligibility of grant applicants is much broader for those pursuing grant funding – applications are not required to have an accompanying five-year parks and recreation plan, the requirement to match a portion of awarded funds is lifted, and the types of projects that funding may support are more broadly defined.
The potential for Spark funding to fill in the gaps that MNRTF leaves is illustrated in the demand for grant support. An astounding 462 applicants seeking $280 million of Spark funding far outpaces both the cap of total funds allocated to the Spark program ($65 million) as well as requested grant support from the Michigan Department of Natural Resources’s three most popular recreation program grants (the MNRTF, Land and Water Conservation Fund, and Recreation Passports Grant). In 2022, these programs received a combined 150 applications to support recreation projects seeking an aggregate of $65 million of funding.100 Table 5.2 outlines the differences in the requirements and distributions of support from each grant program, further illustrating how Spark Grants can provide a broader range of support to recreational needs across the region and state.
Eligible Applicants
Local and state units of government with authority to enable outdoor recreation.
Any entity with the legal ability to provide public recreation. Nongovernmental entities may apply if they have a defined regional focus on recreation.
Eligible Projects
Land acquisition and development projects. For both categories, projects that support trails, wildlife habitat, and access to rivers and lakes are currently a priority.
Application Requirements
A five-year parks and recreation plan approved by the Michigan Department of Natural Resources.
Development projects that may include the construction, renovation, or redevelopment of recreational facilities, recreational equipment, and programming.
Proposed projects must include a connection to COVID-19 impacts on the applying community.
78 Fostering Racial Equity in Access to Green Spaces
Michigan Natural Resources Trust Fund (MNRTF)
Spark Grants
Funding Parameters
All awarded grants must have a minimum 25% match; willingness to provide a higher match percentage is viewed favorably in the evaluation process.
2022 Applicant Needs
2022 Grant Awards
150 applicants requesting $65 million in total for three big programs
45 projects received a total of $23,306,200 in funding
• 15 total land acquisition projects received $15,003,500 of funding
• 30 development projects received $8,302,700 of funding
Financial matches are encouraged, but not required.
Enabling Funds and/ or Statutes
Grant revenue is generated through royalty payments for fossil fuel use on state-owned land as outlined in the Natural Resources and Environmental Protection Act of 1994 (Act 451, Part 19).
• On a yearly basis, approximately $15 to $20 million are available for grant awards
462 applicants requesting $280 million of project funding in total
In the first round of fund distributions, 21 projects received a total of $14,178,900 in funding
2022’s Public Act 53 allocated a total of $65 million of state and local COVID-19 recovery funds to Spark awards.
• $15 million of this funding was distributed in February 2023
• The remaining $50 million will be awarded by the end of 2023
Despite the promise that Spark grants hold in meeting a wide variety of community needs that pertain to supporting access to outdoor recreation, there is a definitive limitation to the program because it is enabled by recovery funds tied to COVID-19 relief. Given the likelihood that total support provided by these awards is a one-time opportunity, there is a question of how projects that receive Spark funding will create their own capacity to uphold project maintenance and development once grant funding runs out. MNRTF’s annual availability may provide an avenue for Spark-funded projects to sustainably uphold necessary improvements,
79
Chapter 5: Embedding Equity in the Planning Process
Source: Department of Natural Resources – Michigan Spark Grants and Natural Resources Trust Fund.
Table 5.2. Comparing MNRTF and Spark Grant Award Requirements and Distribution
expansions, and/or maintenance, but only if communities that were granted Spark funding are able fulfill the MNRTF’s application and distribution requirements.
6.4 Equitable Funding Methods
To reimagine Michigan’s predominant source of funding for green space and outdoor recreation opportunities, Table 5.3 assesses MNRTF’s program structure against the Core Principles of Green Space Equity and offers recommendations to more intentionally promote equity in both the program structure and funding distributions. Recommendations to promote equity through funds and resourcing are not constrained to potential MNRTF reforms alone. A discussion of supplementary funding sources and their alignment with equity goals follows the equity analysis of the MNRTF.
Core Principles of Green Space Equity MNRTF Analysis
Recommendations to Promote Equity
Acknowledge & Confront Systemic Oppression
MNRTF does not explicitly consider elements of systemic oppression in grant distributions. “Need for Project” and “Financial Need of the Applicant” are two pieces of criteria that may indirectly account for histories of disinvestment for applicant communities. However, these considerations are arguably offset by other pieces of criteria (“Amount of Applicant Match” and “MNRTF Priority Project”) which may dilute the extent to which projects driven by community needs and insight are able to confront histories of oppression.
Spark Grant applications provide a more open opportunity for applicants to describe the need for proposed projects. This implies a greater attention to local contexts, community wishes, and resulting solutions to address systemic oppression as the drivers of project plans. The match requirement (and, relatedly, MNRTF’s favoring of applicants with the ability to match a higher percentage of awarded funds) is at odds with this principle of green space equity and merits some consideration of how persistent disinvestment can be remedied by a more equitable application and awarding process.
80 Fostering Racial Equity in Access to
Green Spaces
Discard Universal Approaches to Localized Issues
The point system that MNRTF uses to award funding to applicants offers mixed evidence of the extent to which localized issues are considered and addressed. While each application and project is considered separately based on the applicant’s context and the content of each plan, the process by which MNRTF funding is accessed does not change based on community need nor capacity. Neither 5-year park and recreation plans nor match requirements are waived to create greater access to funding for communities with local issues that prevent them meeting these parameters.
Considering the context of local issues and removing universal approaches to address them includes the preliminary requirements of the MNRTF application. While individual projects are evaluated for their ability to serve their community and address local needs, this is undermined when entire communities are barred from receiving any programmatic funding.
Center Community in Process Design & Decision- Making
MNRTF’s 5-year parks and recreation plan requirement stands in as a proxy measure for community engagement and community desires in recreation planning. While projects that receive MNRTF funding presumably follow and fulfill the visions laid out in the 5-year plan, they are not necessarily specific to or guided by community input.
MNRTF can promote this principle of green space equity by having a higher and more defined requirement for community engagement and input in the scoping of proposed MNRTF projects. While acknowledging that this requires greater capacity on behalf of engagement facilitators and planners, funding opportunities to support this work can be explored. Further, the Pittsburgh Parks Plan shows evidence that greater community involvement is conducive to voting referenda that enable changes to MNRTF’s instatute requirements.
81 Chapter 5:
Embedding Equity in the Planning Process
Build Community Power & Capacity
The MNRTF does not explicitly support capacity or coalition building efforts as they relate to parks and recreation support and planning. While development grants can be awarded to a wider range of projects and uses, they remain specific to facility development, construction, and maintenance without explicit attention to the personnel whose capacity is required for each facility’s regular functioning.
MNRTF can support this principle by broadening applicable uses of development grant funds to capacity building and training, community engagement efforts related to recreation planning, and ensuring the sustainability of project sites by supporting community member ownership and management. Related to the third principle of green space equity, MNRTF funds can also be allocated towards sustained and collaborative community engagement efforts that inform future project plans.
Commit to Sustained Green Space Equity
As an annual source of funding, MNRTF provides a stable source of potential support to recreation projects on a yearly basis. In theory, the MNRTF provides an avenue to ensure targeted investments to projects that fulfill the program’s parameters. While the limitations of the program pose challenges to fully sustained investments, including the maximum development award amount of $300,000, the MNRTF’s existence in statute is promising in the valuation of recreation work.
With fewer application requirements, the Spark Grant program illustrates the extent of recreational need across the state but is compromised by its temporary implementation. Should the MNRTF address the exclusionary aspects of its application process and grant distribution requirements by looking to Spark as a model, the program embodies a definitive commitment to sustainable green space investment. MNRTF may reconsider its maximum award of $300,000 for development projects. While, in theory, this funding is available annually, municipalities may benefit from access to a larger sum of money upon initial application and approval to fully achieve recreational development goals.
82 Fostering
Racial Equity in Access to Green Spaces
Source: Viola Bay, “Fiscal Focus: Michigan Natural Resources Trust Fund,” Michigan House of Representatives, 19-20.
Table 5.3. MNRTF Requirements & Core Principles of Green Space Equity
It is important to note that the most limiting components of the MNRTF program do not impact or restrict all communities in the same way. Wealthy jurisdictions more than likely have access to financial resources and enough professional capacity to easily fulfill all Trust Fund requirements. To fully act as a proponent of equity in green space support, access, and financing, any opportunity to change the Trust Fund and remove the program’s exclusionary factors should explicitly be implemented in service of the most marginalized and fiscally stressed municipalities. Equitable reforms are most equitable when they are available to communities with the highest need; providing flexibility to identified communities and considering their applications without penalty will effectively support this pursuit.
83
Chapter 5: Embedding Equity in the Planning Process
ENDNOTES
1. Kathryn Foster, “Challenges Ahead for US Regional Planning Governance,” Town Planning Review 81, no. 5 (2010): 490.
2. David Morley, “Inclusive Planning Processes,” American Planning Association, October 1, 2019, https://planning-org-uploaded-media.s3.amazonaws.com/publication/download_pdf/ PAS-QuickNotes-82.pdf.
3. Kathryn Foster, “Challenges Ahead,” 489-490.
4. Morley, “Inclusive Planning Processes.”
5. Morley.
6. Morley.
7. Katherine Levine Einstein, Maxwell Palmer, and David M. Glick, “Who Participates in Local Government? Evidence from Meeting Minutes,” Perspectives on Politics 17, no. 1 (2018): 14.
8. Einstein, Palmer, and Glick, 1.
9. Einstein, Palmer, and Glick, 2.
10.Sherry R. Arnstein, “A Ladder of Citizen Participation,” Journal of the American Institute of Planners 35, no. 4 (1969): 217.
11. Archon Fung, “Varieties of Participation in Complex Governance,” Public Administration Review 66, no. s1 (2006): 67.
12. Arnstein, “A Ladder of Citizen Participation,” 218-219.
13. Arnstein, 218.
14. Arnstein, 217.
15. Santina Contreras, “Using Arnstein’s Ladder as an Evaluative Framework for the Assessment of Participatory Work in Postdisaster Haiti,” Journal of the American Planning Association 85, no. 3 (January 2019): 219.
16. Contreras, “Using Arnstein’s Ladder,” 225.
17. Garces and Gordon da Cruz, “A Strategic Racial Equity Framework,” 322.
18. Race Forward, “What Is Racial Equity?”
19. Garces and Gordon da Cruz, “A Strategic Racial Equity Framework,” 324.
20. Garces and Gordon da Cruz, 324.
21. Garces and Gordon da Cruz, 324.
22. Garces and Gordon da Cruz, 331.
23. Garces and Gordon da Cruz, 331.
24. Garces and Gordon da Cruz, 331.
25. Note: The Chicago Public Library has an “Anti-Racist Reading List” created by Ibram X. Kendi with great suggestions for books and other resources surrounding anti-racism to build racial literacy. Additionally, Ruchika Tulshyan’s book titled Inclusion on Purpose: An Intersectional Approach to Creating a Culture of Belonging at Work offers great recommendations for preventing workplace bias while centering people of color.
26. Yolanda Sealey-Ruiz, “Racial Literacy,” National Council of Teachers of English, November 2021, https://ncte.org/wp-content/uploads/2021/04/SquireOfficePolicyBrief_RacialLiteracy_ April2021.pdf.
27. Garces and Gordon da Cruz, “A Strategic Racial Equity Framework,” 331.
28. Garces and Gordon da Cruz, 332.
29. Garces and Gordon da Cruz, 332-333.
84 Fostering Racial Equity in Access to Green Spaces
30. JASS, “Power Analysis for Strategy,” Just Associates, April 2021, https://werise-toolkit.org/ en/system/tdf/pdf/tools/Power-Analysis-for-Strategy_0.pdf?file=1&force=.
31. Impact Justice, “Resource Guide to Power Mapping,” Restorative Justice Project at Impact Justice, 2023, https://rjdtoolkit.impactjustice.org/wp-content/uploads/2019/04/Resource_Guide-to-Power-Mapping_.pdf.
32. Impact Justice, “Resource Guide to Power Mapping.”
33. Impact Justice.
34. Impact Justice.
35. Garces and Gordon da Cruz, “A Strategic Racial Equity Framework,” 333.
36. Garces and Gordon da Cruz, 333.
37. Garces and Gordon da Cruz, 335.
38. Garces and Gordon da Cruz, 335.
39. Garces and Gordon da Cruz, 336.
40. Garces and Gordon da Cruz, 336-337.
41.Judith Eleanor Innes and David E. Booher, Planning with Complexity: An Introduction to Collaborative Rationality for Public Policy, (Routledge, 2018), 92.
42. Innes and Booher, Planning with Complexity, 1.
43. Innes and Booher, 34.
44. Contreras, “Using Arnstein’s Ladder as an Evaluative Framework,” 220.
45. Innes and Booher, 192.
46. Innes and Booher, 165-195.
47. Innes and Booher, 200.
48. Innes and Booher, 10-39.
49. Innes and Booher, 195.
50. Morley, “Inclusive Planning Processes.”
51. Innes and Booher, Planning with Complexity, 35.
52. Innes and Booher, 192.
53. Katrin Prager, “Is Co-Creation More than Participation?,” The James Hutton Institute, December 13, 2016, https://www.hutton.ac.uk/blogs/segs/co-creation-more-participation.
54. Prager, “Is Co-Creation More than Participation?,” 221-222.
55. Reed et al., “Who’s in and Why?”, 1934.
56. Reed et al., 1935.
57. Reed et al., 1935.
58. Reed et al., 1935.
59. Reed et al., 1934.
60. Reed et al., 1938.
61. Reed et al., 1938.
62. Reed et al., 1933.
63. Reed et al., 1939.
64. Lawrence Susskind and Jeffrey L. Cruikshank, Breaking Robert’s Rules: The New Way to Run Your Meeting, Build Consensus, and Get Results (Oxford: Oxford University Press, 2006), xvi.
65. Susskind and Cruikshank, Breaking Robert’s Rules, 6.
66. Susskind and Cruikshank, 30-31.
67. Susskind and Cruikshank, 4.
85
Chapter 5: Embedding Equity in the Planning Process
86 Fostering Racial Equity in Access to Green Spaces
68. Susskind and Cruikshank, 4.
69. Susskind and Cruikshank, 4.
70. Susskind and Cruikshank, 4.
71. Susskind and Cruikshank, 4.
72. Lawrence Susskind, Sarah McKearnan, and Jennifer Thomas-Larmer, The Consensus Building Handbook: A Comprehensive Guide to Reaching Agreement (Thousand Oaks, CA: Sage Publications, 1999), 104.
73. Innes and Booher, Planning with Complexity, 32.
74.Innes and Booher, 37.
75. Innes and Booher, 32.
76. Innes and Booher, 35.
77. Innes and Booher, 36.
78. Morley, “Inclusive Planning Processes.”
79. Innes and Booher, Planning with Complexity, 36.
80. Innes and Booher, 8-9.
81. Innes and Booher, 109.
82. Innes and Booher, 108.
83. Stephen Appiah Takyi and Andrew D. Seidel, “Adaptive Management in Sustainable Park Planning and Management: Case Study of the City of Vancouver Parks,” Journal of Urban Ecology 3, no. 1 (2017).
84. Takyi and Seidel, “Adaptive Management in Sustainable Park Planning and Management.”
85. Takyi and Seidel.
86. Matt Eldridge, Kimberly Burrowes, Patrick Spauster, “Investing in Equitable Urban Park Systems: Emerging Funding Strategies and Tools,” The Urban Institute (July 2019), https:// cityparksalliance.org/wp-content/uploads/2019/07/Equity_and_Parks_Funding_7.16.19.pdf.
87. Eldridge, Burrowes, and Spauster, “Investing in Equitable Urban Park Systems,” 24.
88. Eldridge, Burrowes, and Spauster, 16.
89. City Parks Alliance, “Pittsburgh: Parks for All (Case Study | Equity)”, City Parks Alliance, 2020, https://cityparksalliance.org/resource/pittsburgh-parks-for-all/.
90. City Parks Alliance, “Pittsburgh: Parks for All”
91. Michigan Department of Natural Resources, “Trust Fund history,” Michigan Department of Natural Resources, accessed March 23, 2023, https://www.michigan.gov/dnr/about/boards/ mnrtf/history-of-the-michigan-natural-resources-trust-fund.
92. Michigan DNR, “Trust Fund history.”
93. Michigan Department of Natural Resources, “Natural Resources Trust Fund,” Michigan Department of Natural Resources, accessed March 21, 2023, https://www.michigan.gov/dnr/ buy-and-apply/grants/rec/mnrtf.
94. Michigan DNR, “Trust Fund history.”
95. Michigan DNR, “Trust Fund history.”
96. Dan Lord (Grant Program Manager with the Michigan Department of Natural Resources) in correspondence with team members over Zoom, February 1, 2023.
97. Michigan Department of Natural Resources, “Recreation Grant Program Fact Sheet,” Michigan Department of Natural Resources, accessed March 15, 2023, https://www.michigan. gov/dnr/-/media/Project/Websites/dnr/Documents/Grants/FOD-Grants/RecGrants_Fact_ Sheet.docx.
98. Eisenberg, “Race, Property, and Population Health,” 61-62.
99. National Conference of State Legislatures, “ARPA State Fiscal Recovery Fund Allocations Database,” National Conference of State Legislatures, last updated February 10, 2023, https://www.ncsl.org/fiscal/arpa-state-fiscal-recovery-fund-allocations.
100. Michigan Department of Natural Resources, “21 communities to share $14.2 million in Michigan Spark Grants for outdoor recreation projects,” February 9, 2023, https://www. michigan.gov/dnr/about/newsroom/releases/2023/02/09/michigan-spark-grants-2023
87
Chapter 5: Embedding Equity in the Planning Process
 Source: Capstone team field visit, 3/22/23.
Lower Huron Metropark, Belleville
Source: Capstone team field visit, 3/22/23.
Lower Huron Metropark, Belleville
Chapter 6 : Suggested Actions to Address Regional Inequity
This section contains a series of recommendations and guidelines for communities to consider as they seek to mitigate inequitable access to green spaces.
In this Section: KEY TERMS:
1. Social Accessibility
1.2 Pilot Survey Discussion
1.1 Mobile Application Discussion Limitations
2. Availability & Transportation Accessibility
3. Equitable Planning & Financing Processes
Equity: An approach to policy and distribution of opportunity that “ensures that outcomes in the conditions of well-being are improved for marginalized groups, lifting outcomes for all. Equity is a measure of justice.”1 Equity acknowledges diversity in experience and the impact of history and social structures that advantage certain groups and disadvantage others. Equity entails differential allocation of opportunity for groups that have been disadvantaged.
6: Suggested Actions to Address Regional InequityCHAPTER OVERVIEW
Throughout the project process, our team sought to understand dimensions of green space inequity as they impact marginalized communities across Southeast Michigan. In addition to defining the problem, we have considered how community-led initiatives can be supported in employing equitable planning practices to counteract a history of exclusion and disinvestment that continues to impact access to green space.
In identifying recommendations with the potential to address the inequities of green space access, quality, resourcing, and distribution, our team acknowledges that the processes and outcomes of implementing change must center community autonomy and intentional, inclusive decision-making to truly promote and embody equity. It is not our team’s role nor intention to prescribe solutions that purport to mitigate the disparities that our project has uncovered so that inequitable access to green space is “solved.” Rather, we hope that our findings will serve as a tool to amplify the experiences of Southeast Michigan communities with limited access to green spaces, and provide ideas which can be taken up by various stakeholders to take action to move the region towards greater racial equity.
The following section outlines a series of recommended actions to address existing regional inequities in the access and use of its green spaces. Informed by our team’s spatial analysis, qualitative research, interview results, and review of the literature, these recommendations require consideration alongside specific community needs, ideals, desires, and plans so that changing land uses are responsive to individual community contexts.

91
Chapter
Source: Graphic template provided by Slidesgo and Freepik, graphic created by Kim Swinehart.
Figure 6.1. Reccomendations for Equitable Access to Green Spaces
1. SOCIAL ACCESSIBILITY
Based on the comprehensive analysis of social accessibility in Southeast Michigan, it is evident that existing green spaces are not equitably distributed, with marginalized communities (especially non-white communities, low-income households, and no-car households) facing additional accessibility challenges. To address these disparities and enhance the social accessibility of green spaces in the region, we recommend the following actions:
1. Create a mobile application that consolidates public information about green spaces and events to reduce challenges to green space access. Details can be found in Appendix 5 and limitations are discussed below.
2. Identify potential funding sources for developing, operating, and marketing the application.
3. Building off of our survey design work, scale up the pilot survey to get a representative sample of green space perceptions in the region. To increase pilot survey representativeness conduct door-to-door surveying for those with limited internet access (e.g., elderly populations and lower-income households). Hold focus groups using the same survey questions and offer an incentive (e.g., childcare or gift cards) to get more input. This would be especially useful for low-income households with children.
1.2 Pilot Survey Discussion
Our initial stakeholder interviews revealed nuanced dimensions of social accessibility that our team did not fully analyze (e.g., fears of physical safety and harassment in public spaces based on race or other dimensions of identity, the suitability of existing green spaces for different populations, and other aspects related to fostering greater inclusion in public spaces). As a result, we designed a pilot survey to get a better understanding of Southeast Michiganders perceptions of green spaces. The survey informs our analysis about green space accessibility. However, the pilot survey was not a representative sample of the region. We recommend scaling up the pilot survey in order to conduct a more informed and comprehensive analysis. The survey should be administered by other academic researchers or managers of green spaces as part of a collaborative planning process, and could be used to inform decisions about park development, improvement, programming, and more.
1.1 Mobile Application Discussion
The proposed mobile app has the potential to significantly improve access to and awareness of green spaces in Southeast Michigan. By providing real-time information, personalized recommendations, and facilitating social connections, the app can empower residents to access their local green spaces in a more convenient way.
92 Fostering Racial Equity in Access to Green
Spaces
Chapter
6: Suggested Actions to Address Regional InequityDespite the potential benefits of an app in increasing accessibility to green spaces, it is essential to acknowledge the limitations arising from the digital divide. As of 2020, approximately 30 percent of households in Detroit and 21 percent in the state of Michigan lack access to broadband internet.1 Additionally, 15 percent of American adults do not own a smartphone, with this percentage being higher among low-income and elderly individuals.2 This digital divide presents a barrier to using the app for those without access to a smart device or the internet, potentially exacerbating existing inequities. To address this limitation, we recommend partnering with local community organizations and libraries to provide access to the app on public devices. Furthermore, we suggest distributing printed materials, such as maps and event schedules, in accessible community locations to ensure that information on green spaces is available to all residents, regardless of their access to digital resources.
Second, this mock-up is an idealized version of an actual app. The real development and operation of the app requires significant human and financial resources to support. Without a clear business model, the app may require subsidies or underwriting to work. Additionally, the app’s effectiveness in increasing accessibility to green spaces depends on various factors, such as community members’ willingness to use the app and the availability of resources like the integration of green space information.

93
Figure 6.2. Social Accessibility Reccomendations
2. AVAILABILITY & TRANSPORTATION ACCESSIBILITY
Creating equitable access to green space, particularly natural areas, in Southeast Michigan involves improving the availability of green spaces in many communities and transportation access to all green spaces via walking, biking, and public transit. The analysis conducted in this report reveals that there are large disparities in access across transportation modes (walking, biking, public transit, and driving), types of parks (all green spaces versus natural spaces), and racial geographies. To address these disparities, we recommend the following:
1. Follow above-outlined equitable planning processes in order to determine where a) new green spaces could be located and b) where existing green spaces could be invested in. Factors such as community need and existing or planned connections to sidewalks, bicycle lanes, or public transit lines should be considered for future green space planning. Look closely at ways to equitably and collaboratively improve the availability of green spaces in predominantly Black neighborhoods that do not currently have high levels of access so that new and improved green spaces are created which meet community needs.
2. Work with regional stakeholders and local jurisdictions to study expanding public transit routes in order to reach more green spaces in Southeast Michigan. Expansion of transit access should follow the outlined equitable planning processes and should focus on connecting low-income communities, marginalized communities, and communities with low rates of car ownership to the green spaces and natural areas that currently exist in the region.
3. Parks departments and regional planning organizations should seek out stronger, ongoing intergovernmental partnerships with transit providers. We discovered during interviews that parks departments have difficulty providing sustainable transit service to parks in part because coordinating with multiple providers makes these services logistically difficult. These partnerships can help create sustainable solutions that are currently difficult to provide. Pilot programs also need to have a strong champion who can help make such programs more sustainable, and who can ensure that the programs are reaching those who need them the most.
4. Expand pedestrian and bicycle infrastructure networks to improve equitable access to existing and future green spaces. Where this infrastructure already exists, further improvement to enhance user safety is needed. A particular emphasis can be placed on expanding these networks around existing green spaces, particularly in areas that have a high share of green spaces but minimal ways to access them without an automobile. This is also an important consideration since Metroparks are free for people who access the parks without a vehicle.
94 Fostering Racial Equity in Access to Green Spaces
Chapter 6: Suggested Actions to Address Regional Inequity
5. Prioritize access to natural areas when improving transit, bicycle, and pedestrian infrastructure. There are stark differences in access to and availability of SEMCOG’s “natural area” designation in comparison to all green spaces which points to accessing these spaces as an important consideration.
6. Prioritize infrastructure improvements in marginalized communities. For all modes of access, attention should be paid to the racial differences across the region. For example, Detroit has a large Black population and a low availability of natural areas compared to the rest of the region. All work done to improve transportation access and green space availability needs to take race into account in order to address lasting racial inequities in access to green space. This work should utilize above-described equitable planning processes in order to ensure that improving infrastructure does not contribute to gentrification and is aligned with community goals and visions.

95
Figure 6.3. Availability and Transportation Accessibility Reccomendations
3. EQUITABLE PLANNING & FINANCING PROCESSES
Conducting equitable processes and ensuring the full inclusion of all stakeholders is a practical means of improving access to and quality of green spaces. Equity-centric planning processes, financial approaches, and frameworks have the potential to produce community-valued green spaces that are:
• Culturally-informed: The green space reflects community identities in design, amenities, and programming.
• Accommodating to community needs and interests: The green space contributes to the specific social, psychological, and physical health and well-being needs of the community.
• Spaces for connection and community building: The green space enriches the sense of belonging, community empowerment, and builds mutual support networks.
• Venues for environmental stewardship: The green space presents opportunities for greater community stewardship, ownership, and management.
• Accessible to all community members: Increase multimodal access to the green space and ensure all users are able to use and enjoy the site.
MEC should consider advocating for embedding a strategic racial equity framework and core green space equity principles in organizational aims between members and in practice when supporting green space access. MEC should also support greater use of equitable planning processes such as collaborative planning and equitable financing approaches to lessen discrepancies in access and quality between communities in Southeast Michigan. Our team’s recommendations to improve planning processes to expand green space equity in Southeast Michigan are as follows
1. Green space stewards adopt the Strategic Racial Equity Framework to adequately address ongoing racial inequities and offer considerations for prioritizing racial justice.
2. Center Core Green Space Equity Principles in green space stewards’ organization aims and practices to prioritize equity and assign greater accountability to actualize equitable outcomes in green space planning, allocation, and improvements.
3. Practitioners involved in green space planning should use collaborative planning processes and tools to enable the full inclusion and participation of all stakeholders to give community members greater voice and power in shaping outcomes that most directly impact them.
96 Fostering Racial Equity in Access to Green
Spaces
Chapter 6: Suggested Actions to Address Regional Inequity
4. Engage in a collaborative process to develop specific revisions to MNRTF policies and practices, such as matching fund requirements and limitations on applicants that are restricted by and unable to fulfill such requirements. Lessons from the Spark grant program may inspire more equitable green space financing approaches.

97
Figure 6.4. Equitable Planning and Funding Processes Reccomendations
ENDNOTES
1. Elizabeth Green, “Understanding Equity and Justice,” Big Cities Health Coalition, June 1, 2022, https://www.bigcitieshealth.org/uha-understanding-equity-and-justice/.
2. National Digital Inclusion Alliance. (2020). “Worst Connected Cities 2020.” Retrieved from https://www.digitalinclusion.org/worst-connected-cities-2020/.
3. National Digital Inclusion Alliance, “Worst Connected Cities 2020.”
98 Fostering Racial Equity in Access to Green Spaces
TEAM BIOS


Kira Barsten is a Master of Urban and Regional Planning student in Taubman College at the University of Michigan, deeply passionate about climate justice, community empowerment, and transportation planning as tools for co-creating equitable, resilient cities. They received a Bachelor of Science in Society and Environment from the University of California, Berkeley, with minors in Peace & Conflict Studies and Climate Science & Economics. Before coming to Michigan, Kira’s passion for public service brought them to the City of Mountain View where they worked as a Sustainability Analyst specializing in community outreach and engagement. While at the University of Michigan, Kira interned with the City of Ann Arbor to develop a circular economy strategy, codeveloped and co-lead the Radical Planning course at Taubman College, and currently works as an intern in the Transit Service Planning division for the San Francisco Municipal Transportation Agency.


Kathryn Economou is a Master of Urban and Regional Planning student in Taubman College at the University of Michigan, graduating this spring. Her interests lie at the intersection of communitybased planning and sustainable development practice. At the University of Michigan, Kathryn works as a Research Associate and Local Government Sustainability Aide at the Graham Sustainability Institute. Kathryn is the co-developer and a current student lead of the radical planning course at Taubman College.


Dana Gentry is a Master of Urban and Regional Planning student in Taubman College at the University of Michigan and a graduate of the University of North Carolina at Chapel Hill with a Bachelor of Arts in Public Policy and Geography. For four years prior to coming to Michigan, Dana taught middle school math in Jacksonville, FL and Memphis, TN. She is passionate about urban planning’s potential to address socio-spatial inequity by advocating for equitable community investment and facilitating access to high quality services, institutions, and amenities. Throughout her time as a graduate student, Dana has gained professional experience in systemic vacancy and land banking research, comprehensive planning, and community program evaluation. At the university, she has worked as a Public Engagement Fellow with the Office for the Vice President of Research and as a Graduate Student Instructor in Taubman and LSA.
Srishti Jaipuria is a Master of Urban and Regional Planning student in Taubman College at the University of Michigan, with a focus in transportation. She is not only studying transportation planning, but she is also gaining hands-on experience as a transport planning intern at AECOM. She also works as a Research Assistant at the university working on finding green housing solutions for low-income families in São Paulo, Brazil. Srishti is incredibly passionate about finding the right balance between social, economic, and environmental development.
Gurleen Kaur is a Master of Urban and Regional Planning student in Taubman College at the University of Michigan. Also pursuing a Graduate Certificate in Data Science, her interests lie in connecting data to planning and public policy decision-making in order to foster equitable and sustainable communities. During her graduate studies, she worked as a Research Assistant assessing environmental resiliency around the Great Lakes Coastal region. She is also interning with the Chicago Metropolitan Agency for Planning where she has contributed to a variety of regional transportation and community development projects.
Caroline Lamb is a Master of Urban and Regional Planning and Master of Public Policy student at the University of Michigan. She is interested in transportation, land use, and climate resiliency, and how to address these topics through local and state policy. Originally from North Carolina, she earned a Bachelor of Arts degree in Journalism and Environmental Studies from the University of North Carolina at Chapel Hill. Before graduate school, Caroline worked in communications for a coastal environmental nonprofit and as a Qualitative Research Assistant. During graduate school, she has worked as a transportation planning intern at WSP, served as Editor-in-Chief of the Agora Journal of Urban Planning and Design, and worked as a Research Assistant at Taubman College and the Center for Local, State, and Urban Policy.
Xianwei Lei is a Master of Urban and Regional Planning and Master of Human-Computer Interaction student at the University of Michigan. With a diverse background in GIS, transportation, and userexperience design, Xianwei focuses on vulnerable populations and consistently puts people at the center of his design process. This semester, Xianwei is collaborating with the university’s Tech Service Department to improve the UI/UX design of the University of Michigan App. He also previously interned as a product designer in PowerChina, and as a planner in a local architecture studio.
Annie Linden is finishing dual master’s degrees at the University of Michigan’s School for Environment and Sustainability and Taubman College, where she is specializing her coursework in Environmental Justice, Sustainable Development, and Urban Planning. During her graduate studies, Annie has had many opportunities, including working as a Research Assistant examining naturebased solutions, serving as a Detroit Mayoral Fellow working with Detroit’s Environmental and Planning Department, working as a Dow Sustainability Fellow examining accessibility in Pittsburgh’s Strip District, and as a Graduate Student Research Consultant with the United Nations Development Program analyzing the environmental practices of two Costa Rican agricultural companies.
She hopes to utilize both of her degrees to work in the realm of climate change adaptation and resilience.
Manvi Nigam is a Master of Urban and Regional Planning student in Taubman College at the University of Michigan. She is also completing a Graduate Certificate in Urban Informatics. Her focus is on transportation planning, with a special emphasis on data analysis in advancing goals of transportation equity. She completed her Bachelor of Architecture degree from Delhi, India in 2019. In the summer of 2022, she interned at Fehr & Peers, a transportation planning consultancy firm in Oakland, California, where she worked on several projects related to transit, complete streets, and road safety. Currently, Manvi is working as a Research Assistant at the Graham Sustainability Institute, on a project that aims to increase awareness around sustainable transportation options available on campus.
Anna Pasek is a Master of Urban and Regional Planning student in Taubman College at the University of Michigan. Her focus is on climate adaptation planning and geographic information systems, with a special passion for inclusive climate action. She completed her Bachelor of Science degree in Environmental Engineering in 2021 at the University of Michigan, and interned with the City of Ann Arbor’s transportation engineering and planning team during the summer of 2021 prior to starting her master’s degree. She has a wide range of planning interests including sustainable design, participatory planning, and community engagement.
Kimberly Swinehart is currently a Master of Urban and Regional Planning student at the University of Michigan. She has a wide range of planning interests including housing, land use, urban design, historic preservation, and environmental justice. She also went to Michigan for her undergraduate studies, earning her Bachelor of Arts degree in Psychology and Urban Studies. Kim has previously worked as an intern for the Southwest Detroit Community Benefits Coalition and as a Research Assistant for the Michigan Institute for Data Science. They hope to work in the intersection of community engagement and sustainable development after graduation.
Yuan Wu is a graduate student at the University of Michigan, pursuing dual master’s degrees in Urban and Regional Planning from Taubman College and Information Sciences from the School of Information. With a keen interest in the intersection of urban planning and information technology, she is passionate about leveraging information tools to promote effective civic engagement and enable better interaction between communities and local governments. Yuan has previously worked as an intern at the City of Lansing, and has also interned as a product designer at Zoom and NBCUniversal.
Appendices
APPENDIX 1: EQUITY GLOSSARY
A.1 Glossary Overview
Advancing equity requires accessible vocabulary and strong understanding of equity principles to avoid miscommunication, which has the ability to potentially delegitimize and harm efforts. Language is a powerful tool in communicating the importance of fostering greater equity in the allocation and improvement of green spaces.
The purpose of the Equity Glossary is to enhance discussions surrounding equity. This glossary does not include all key terms associated with equity, however, it is a valuable starting point for holding meaningful conversations in the realm of advancing equity. The equity glossary is broken into three key sections with important equity concepts and definitions: “Equitable Green Space Access,” “Racial Equity,” and “Diversity, Equity, and Inclusion.” The “Equitable Green Space Access” section defines key terms and concepts within the report, the “Racial Equity” section has race-specific terminology, and the “Diversity, Equity, and Inclusion” section has general definitions in the realm of equity and social justice.
Racial Equity
Race Forward, a social advocacy group, published a racial equity guide titled “What is Racial Equity: Understanding Key Concepts Related to Race” that has a wealth of resources and helpful definitions to build racial literacy. Select race-related concepts from this guide are included below:1
Racial Equity, Equality, and Justice
• Equity (racial context): “Ensures that outcomes in the conditions of well-being are improved for marginalized groups, lifting outcomes for all. Equity is a measure of justice.”2
• Equality (racial context): “Sameness; everyone gets the same thing. Equality focuses on everyone getting the same opportunity, but often ignores the realities of historical exclusion and power differentials among whites and other racialized groups.”
• The difference between equity and equality: “Equality uses the same strategies for everyone, but because people are situated differently, they are not likely to get the same outcomes. Equity uses differentiated and targeted strategies to address different needs and to get to fair outcomes. Equalityfocused strategies don’t work for, or benefit, everyone ( e.g., teaching everyone the same way does not work for different kinds of learners; each must be taught the appropriate way for them). Using targeted or differentiated strategies to achieve universal goals is referred to as targeted universalism.”3
• Racial Justice: “A vision and transformation of society to eliminate racial hierarchies and
107 Appendices
advance collective liberation, where Black, Indigenous, Latinx, Asian Americans, Native Hawaiians, and Pacific Islanders, in particular, have the dignity, resources, power, and selfdetermination to fully thrive.”4
• Racial Equity: “Is a process of eliminating racial disparities and improving outcomes for everyone. It is the intentional and continual practice of changing policies, practices, systems, and structures by prioritizing measurable change in the lives of people of color.”5
• The difference between racial equity and racial justice: “Racial equity is the process for moving towards the vision of racial justice. Racial equity seeks measurable milestones and outcomes that can be achieved on the road to racial justice. Racial equity is necessary, but not sufficient, for racial justice.”6
Racial Diversity and Inclusion
• Diversity: “A variety of racial identities or characteristics (e.g., African Americans, Native Americans, Latinx). Diversity is a quantitative measure of representation.”7
• Inclusion: “The measure of the quality of representation, such as full access, authentic representation, empowered participation, true belonging and power-sharing. Inclusion is a qualitative measure of representation and participation.”8
• The difference between diversity and inclusion: “You can have diversity without inclusion (e.g., tokenism, assimilation). You can’t have inclusion without diversity. Focusing on inclusion gets you further than just focusing on diversity.”9
Race, Racism, and Racial Bias
• Explicit/Conscious Racial Bias: “Conscious attitudes and beliefs about a person or group; also known as overt and intentional racial bias.”10
• Implicit/Unconscious Racial Bias: “Attitudes or stereotypes that affect our understanding, decisions and actions in an unconscious manner.”11
• Individual Racial Bias: “Bias by individuals. But if the individual is acting in an institutional capacity (e.g., a teacher or a police officer) their individual bias is also a manifestation of institutional bias.”12
• Internalized Racism: “lies within individuals. These are private beliefs and biases about race that reside inside our own minds and bodies. For white
108 Fostering
in
to
Racial Equity
Access
Green Spaces
people, this can be internalized privilege, entitlement, and superiority; for people of color, this can be internalized oppression. Examples: prejudice, xenophobia, conscious and unconscious bias about race, influenced by the white supremacy.”13
• Interpersonal Racism: “occurs between individuals. Bias, bigotry, and discrimination based on race. Once we bring our private beliefs about race into our interactions with others, we are now in the interpersonal realm. Examples: public expressions of prejudice and hate, microaggressions, bias and bigotry between individuals.”14
• Institutional Racial Bias: “Bias by institutions – such as patterns, practices, policies, or cultural norms that advantage or disadvantage people of color.”15
• Institutional Racism: “occurs within specific institutions. It involves unjust policies, practices, procedures, and outcomes that work better for white people than people of color, whether intentional or not. Example: A school district that concentrates students of color in the most overcrowded, under-funded schools with the least experienced teachers.”16
• Structural Racism: “Racial inequities across institutions, policies, social structures, history, and culture. Structural racism highlights how racism operates as a system of power with multiple interconnected, reinforcing, and self-perpetuating components which result in racial inequities across all indicators for success. Structural racism is the racial inequity that is deeply rooted and embedded in our history and culture and our economic, political, and legal systems. Examples: The ‘racial wealth gap,’ where whites have many times the wealth of people of color, resulting from the history and current reality of institutional racism in multiple systems.”17
• Environmental Racism: “Racial discrimination in environmental policy-making, enforcement of regulations and laws, and targeting of communities of color for toxic waste disposal and siting of polluting industries.”18
109 Appendices
Diversity, Equity, and Inclusion
The University of Washington’s College of the Environment hosts a comprehensive diversity, equity, and inclusion (DEI) glossary filled with many definitions in the realm of DEI. Select equity-related concepts from this guide are included below:`19
DEI
• Diversity: “Socially, it refers to the wide range of identities. It broadly includes race, ethnicity, gender, age, national origin, religion, disability, sexual orientation, socioeconomic status, education, marital status, language, veteran status, physical appearance, etc. It also involves different ideas, perspectives and values.”20
• Equity: “The fair treatment, access, opportunity and advancement for all people, while at the same time striving to identify and eliminate setbacks that prevent the full participation of some groups. The principle of equity acknowledges that there are historically underserved and underrepresented populations and that fairness regarding these unbalanced conditions is necessary to provide equal opportunities to all groups.”21
• Environmental Equity: “An ideal of equal treatment and protection for various racial, ethnic, and income groups under environmental statutes, regulations, and practices applied in a manner that yields no substantial differential impacts relative to the dominant group--and the conditions so-created. Although environmental equity implies elements of ‘fairness’ and ‘rights,’ it does not necessarily address past inequities or view the environment broadly, nor does it incorporate an understanding of the underlying causes and processes.”22
• Inclusion: “The act of creating an environment in which any individual or group will be welcomed, respected, supported and valued as a fully participating member. An inclusive and welcoming climate embraces and respects differences.”23
• Intersectionality: “A social construct that recognizes the fluid diversity of identities that a person can hold such as gender, race, class, religion, professional status, marital status, socioeconomic status, etc.”24
• Multicultural Competency: “A process of embracing diversity and learning about people from other cultural backgrounds. The key element to becoming more culturally competent is respect for the ways that others live in and organize the world, and an openness to learn from them.”25
• Social Justice: “Social justice constitutes a form of activism, based on principles of
110 Fostering Racial Equity in Access to Green Spaces
equity and inclusion that encompasses a vision of society in which the distribution of resources is equitable and all members are physically and psychologically safe and secure. Social justice involves social actors who have a sense of their own agency as well as a sense of social responsibility toward and with others.”26
• Ally: “Someone who supports a group other than one’s own (in terms of multiple identities such as race, gender, age, ethnicity, sexual orientation, religion, etc.). An ally acknowledges oppression and actively commits to reducing their own complicity, investing in strengthening their own knowledge and awareness of oppression.”27
Systems of Oppression and Discrimination
• System of Oppression: “Conscious and unconscious, non-random and organized harassment, discrimination, exploitation, discrimination, prejudice and other forms of unequal treatment that impact different groups. Sometimes it is used to refer to systemic racism.”28
• Privilege: “Exclusive access or access to material and immaterial resources based on the membership to a dominant social group.”29
• Patriarchy: “Actions and beliefs that prioritize masculinity. Patriarchy is practiced systemically in the ways and methods through which power is distributed in society (jobs and positions of power given to men in government, policy, criminal justice, etc.) while also influencing how we interact with one another interpersonally (gender expectations, sexual dynamics, space-taking, etc.).”30
• White Supremacy: “A power system structured and maintained by persons who classify themselves as white, whether consciously or subconsciously determined; and who feel superior to those of other racial/ethnic identities.”31
• Tokenism: “Performative presence without meaningful participation. For example, a superficial invitation for the participation of members of a certain socially oppressed group who are expected to speak for the whole group without giving this person a real opportunity to speak for her/himself.”32
• Discrimination: “The unequal treatment of members of various groups, based on conscious or unconscious prejudice, which favors one group over others on differences of race, gender, economic class, sexual orientation, physical ability, religion, language, age, national identity, religion, and other categories.”33
• Harassment: “The use of comments or actions that can be perceived as offensive,
111 Appendices
Fostering Racial Equity in Access to Green Spaces
embarrassing, humiliating, demeaning, and unwelcome.”34
• Microaggression: “The verbal, nonverbal, and environmental slights, snubs, insults, or actions, whether intentional or unintentional, which communicate hostile, derogatory, or negative messages to target persons based solely upon discriminatory belief systems.”35
• Prejudice: “A preconceived judgment or preference, especially one that interferes with impartial judgment and can be rooted in stereotypes, that denies the right of individual members of certain groups to be recognized.”36
• Cultural Appropriation: “The non-consensual/misappropriate use of cultural elements for commodification or profit purposes – including symbols, art, language, customs, etc. – often without understanding, acknowledgment, or respect for its value in the context of its original culture.”37
• Inequity: Relates to injustice; unequal distribution of and/or access to resources and opportunities.
• Power: Refers to “having the capacity to do something” (i.e., the ability to exercise agency in action and the capacity to access resources).38
Race, Indentity, and Ability
• People of Color: “A collective term for men and women of Asian, African, Latinx and Native American backgrounds, as opposed to the collective white.”39
• Race: “A social construct that artificially divides people into distinct groups based on characteristics such as physical appearance (particularly race), ancestral heritage, cultural affiliation, cultural history, ethnic classification, and the social, economic, and political needs of a society at a given period of time.”40
• Sexual Orientation: “An individual’s enduring physical, romantic, and/or emotional attraction to another person. Gender identity and sexual orientation are not the same. Transgender people may be straight, lesbian, gay or bisexual.”41
• Gender Identity: “Distinct from the term ‘sexual orientation,’ refers to a person’s internal sense of being male, female or something else. Since gender identity is internal, one’s gender identity is not necessarily visible to others.”42
• BIPOC: “An acronym used to refer to Black, Indigenous and people of color. It is based on the recognition of collective experiences of systemic racism. As with any other identity term, it is up to individuals to use this term as an identifier.”43
112
• Cisgender: “A term for people whose gender identity, expression or behavior aligns with those typically associated with their assigned sex at birth.”44
• Queer: “An umbrella term that can refer to anyone who transgresses society’s view of gender or sexuality. The definitional indeterminacy of the word Queer, its elasticity, is one of its characteristics: a zone of possibilities.”45
• LGBTQIA: “An inclusive term for those who identify as lesbian, gay, bisexual, transgender, queer, intersex, and asexual.”46
• Non-Binary/Gender Non-Conforming: “An individual whose gender expression is different from societal expectations related to gender.”47
• Disability: “Physical or mental impairment that affects a person’s ability to carry out normal day-to-day activities.”48
113 Appendices
ENDNOTES
1. Race Forward, “What is Racial Equity? Key Concepts,”, https://www.raceforward.org/ aboutwhat-is-racial-equity-key-concepts. 2.
18. The University of Michigan, “Environmental Justice Definitions.”, https://www.nmhealth.org/ publication/view/help/309/
19. The University of Washington, “Diversity, Equity and Inclusion Glossary,” College of the Environment at The University of Washington, accessed March 13, 2023, https:// environment.uw.edu/about/diversity-equity-inclusion/tools-and-additional-resources/glossarydei-concepts/.
20. The University of Washington, “Diversity, Equity and Inclusion Glossary.”
21. The University of Washington.
22. The University of Michigan, “Environmental Justice Definitions.”
23. The University of Washington, “Diversity, Equity and Inclusion Glossary.”
24. The University of Washington.
25. The University of Washington.
26. The University of Washington.
27. The University of Washington.
28. The University of Washington.
29. The University of Washington. 30. The University of Washington. 31. The University of Washington.
32. The University of Washington.
33. The University of Washington.
34. The University of Washington.
35. The University of Washington.
36. The University of Washington.
37. The University of Washington.
38. Leslie Garces and Kim Gordon da Cruz, “A Strategic Racial Equity Framework,” Equity &
114 Fostering Racial Equity in Access to Green Spaces
3. Race Forward. 4. Race Forward. 5. Race Forward. 6. Race Forward. 7. Race Forward. 8. Race Forward. 9. Race Forward. 10. Race Forward. 11. Race Forward. 12. Race Forward. 13. Race Forward. 14. Race Forward. 15. Race Forward. 16. Race Forward.
Race
Race Forward.
17.
Forward.
Excellence in Education 47, no. 3 (2014): 331.
115 Appendices
39. The University of Washington. 40. The University of Washington. 41. The University of Washington. 42. The University of Washington. 43. The University of Washington. 44. The University of Washington. 45. The University of Washington. 46. The University of Washington. 47. The University of Washington. 48. The University of Washington.
APPENDIX 2: STAKEHOLDER INTERVIEW QUESTIONS
As part of our problem definition phase, our team split into three groups to interview stakeholders who could speak to this project. The findings of these interviews are detailed in Chapter 3. All interviewees were asked a core set of questions, and the rest of the questions were specific to the expertise of the person we were speaking to. The three groups of experts we interviewed were: equity and resident groups, people who worked in park planning or conservation, and people from MEC and the Natural Resources Trust Fund.
A.1 Semi-Structured Interview Guide
Interview Details Core Questions (All Interviews)
Interviews took place through video call or phone.
• Our group is working to define the following terms: green space, parks, natural space. How does your organization define and/or categorize these spaces?
о What attracts people to green spaces? What would you like to see in the green spaces you know of/interact with?
o What are the characteristics of natural or green spaces that are most important to the communities you work with?
• How do you define access to green spaces?
о When you think about accessibility, what are the different issues that come to mind?
о Are you aware of any data sources for looking at who/how people access green spaces?
• How do you define equity?
о Specifically, how do you define racial equity?
о Do you think people in all communities share equitable access to natural and green spaces in our region and across the state?
о What are the barriers to accessing green space?
Equity & Resident Group Interview Questions
Equity Questions
• Tell us about your organization and how your organization thinks about racial equity?
о How do your responsibilities in this position address issues of racial inequity?
о What are the demographics of the communities your organization partners with?
о How does your organization reach underrepresented groups in Southeast Michigan?
• Does your organization follow an external or self-made racial equity framework?
117 Appendices
о How does this framework inform your approach to working with the community?
о How does your organization plan to maintain progress in advancing racial equity?
• How does your organization analyze local accessibility to green spaces?
о What is your approach to quantify spatial accessibility to green spaces (e.g., GIS informatics or function model build)?
о What indicators (e.g., park need, income, poverty) do you use to assess equity?
о How did you narrow your focus? What data sources did you use to research?
• Do you know anyone working in this space that we should talk to?
Resident Group Questions
• Have you or your members ever faced inequity in access to green spaces? If so, describe the situation.
• What do you think should be the top priorities for improving access to green spaces in your community?
• What are some of the activities that people in your community like to do outdoors?
о Do you feel like the existing green spaces in your community fulfills those needs?
• Do you know anyone working in this space that we should talk to?
Parks Interview Questions
General Questions (All Park Interviews)
• What are some challenges you are facing to ensure your outdoor spaces are enjoyed by a wide variety of people?
Metroparks Questions
• How is your organization working to expand access?
• How did Metroparks measure success in the Metroparks Express program? How will this model inform future programs? (e.g., surveys, evaluation reports, etc.)
• What other access and equity projects are currently under consideration, and how are these projects prioritized?
• How does your organization analyze local accessibility to green spaces?
• What is your approach to researching local inequities?
о What data sources/indicators (e.g., park need, income, poverty) do you use to assess equity? How did you narrow your focus?
118 Fostering
Racial Equity in Access to Green Spaces
• Does your organization follow an external or self-made racial equity framework?
о How does this framework inform your approach to working with the community?
о How does your organization plan to maintain progress in advancing racial equity?
Community Group Questions
• What are some challenges related to racial equity and access to green spaces that your organization is working on?
о What does that look like?
• What are ones that you are not focused on but you believe need to be addressed that are related to racial equity and access to green spaces?
• Do you interact with the Natural Resources Trust Fund?
Larger Organizations Questions
• What are some challenges related to racial equity and access to green spaces that your organization is working on?
о What does that work look like?
• Do you interact with the Natural Resources Trust Fund?
MEC/NRTF Interview Questions
NRTF Questions
Funding & Grant Awards
• Can you give a few examples of how grant applicants articulate their need for NRTF development funding? I.e. how do grant applicants sufficiently demonstrate “need,” “proximity to a populace,”
• Is there a set threshold for financial need, or is need defined in a variety of ways (related to access, equity, racial histories, etc)?
• (Time permitting) One application criteria for NRTF grant evaluation is the “proximity to a populace”—How do you define proximity? Does this definition of proximity reflect your definition of access?
• (Time permitting) How do you assess “access to parks” when approving grant funding applications? How do you define access and accessibility?
• (Time permitting) What analyses could we do that would help you ensure you are directing funds to the communities that need them most? What, if anything, can you provide to inform these analyses?
119 Appendices
Projects
• To your knowledge, to what extent do community members provide their input for park development plans?
о Is this a part of the application evaluation process?
о If so, is community engagement required prior to the application, or as a plan for project development after funds have been awarded?
о Are there evaluation mechanisms in place to assess how NRTF awarded projects have addressed community needs? Based on existing evaluations of NRTF-funded projects, have they addressed the formerly-identified needs of the community?
• (Time permitting) How rigidly do applicants or the NRTF define the “baseline” of a community and the conditions to which development projects are being compared?
• (Time permitting) How do you define “public recreation” in grant applications, specifically for projects that are not accepted (because they do not have enough emphasis on “public recreation”)?
MEC Questions
MEC Goals & Practices
• What are the MEC’s priorities with respect to the Equitable Access to Green Space Project description given to you today?
о How are these balanced with the priorities of the communities the MEC’s service impacts?
о What would you like to see from this project?
• Does the MEC have any existing relationships or partnerships with community groups that might have a particular interest in this project?
о Is community stakeholder input regularly considered and centered in project decision-making processes?
Extra MEC Questions
• In what capacity have various Michigan transit agencies collaborated with authorities (e.g., nonprofits, government agencies) to improve access to parks previously (& vice versa)?
• What is the average scope of an MEC project comparable to this one? Are there any parameters the MEC is aware of that may inform the scope of this project?
120 Fostering Racial Equity in Access to
Green Spaces
APPENDIX 3: SOCIAL ACCESSIBILITY PILOT SURVEY QUESTIONS AND RESULTS
A.1 Pilot Survey Initial Analysis
An analysis of the 104 responses to our pilot survey revealed the following:
Limited Walkability: Distance appears to be a significant barrier to accessing green spaces, with 31 out of 104 respondents selecting “Distance” and an additional 19 respondents selecting “Lack of nearby green spaces” as reasons for not visiting green spaces more often. Moreover, in response to the“How do you usually get to green spaces,” where respondents could select more than one answer, 71 selected that they usually drive to green spaces, 67 selected walking, and 21 chose biking. It is important to invest in improving walkability and connectivity between neighborhoods and green spaces. This can be achieved by creating safe pedestrian paths, bike lanes, and ensuring access to public transportation.
Satisfaction Gap: Survey respondents expressed relatively low satisfaction with the quality of events/activities and facilities in green spaces. Analysis of the responses to the fifth question, “How satisfied are you with each of the following in terms of quality,” revealed that there are relatively more respondents who chose “Unsatisfactory” or “Moderately Unsatisfactory” for “Events/activities” and “Facilities” options. This suggests that improvements may be needed in these areas in Southeast Michigan’s green spaces. Efforts should be made to improve and maintain green spaces, including providing better amenities, organizing community events, and ensuring regular maintenance and litter cleanup.
Perceived Inequity: Respondents generally perceived inequities in access to green spaces. In response to the last two questions, “Do you agree with the following statement: All communities in Southeast Michigan have equal access to green spaces” and “Do you agree with the following statement: green spaces are equally distributed across different neighborhoods in your community,” only 14.4 percent and 24.9 percent of respondents agreed, respectively. This finds that a majority of respondents do not believe that everyone has equal access to green spaces, suggesting that issues of racial inequity may exist. Prioritizing the development and improvement of green spaces in low-income areas and communities of color can help address this issue. Additionally, it is important to promote accessibility and ensure that residents are aware of existing green spaces and their accessibility through public transportation is crucial. Information campaigns and collaborations with local transportation providers can help achieve this goal.
This pilot survey did not result in a representative sample of Southeast Michigan, and thus our analysis is not statistically significant. Still, our pilot survey can serve as a starting point and we recommend scaling up in order to conduct a more informed analysis.
123 Appendices
A.2 Accessing Green Spaces Pilot Survey Results
few times a month less than once a month multiple times a week once a week
124 Fostering Racial Equity in Access to Green Spaces
27% 25% 30% 18%
Figure A.1. How often do you visit a green space?
0 10 20 30 40 50 60 70 80 Walk Bike Public Transport Drive Other
Figure A.2. How do you usually get to green spaces? Check all that apply.
Physical barriers (like lack of accessible infrastructure)
Lack of nearby green spaces
I don’t feel welcome or comfortable
Lack of a reliable mode of transportation
125 Appendices
9% 63% 19% 9% > 30-minute walk ≤ 10-minute walk ≤ 20-minute walk ≤ 30-minute walk
Figure A.3. Approximately how long of a walk from your home is in the nearest park or green space?
0 10 20 30 40 50 60 70 Distance
Figure A.4. Approximately how long of a walk from your home is in the nearest park or green space?
Fee(s)
time Weather Other
Limited
A.3 Interacting with Green Spaces Pilot Survey Results
126 Fostering Racial Equity in Access to Green Spaces
0 10 20 30 40 50 60 Events Facilties Infrastructure Maintainance Unsatisfactory Moderately Unsatisfactory Neither satisfied nor dissatisfied Moderately Satisfactory Satisfactory Figure A.5. How satisfied are you with each of the following terms of quality? 2% 8% 10% 46% 34% Very unsafe Moderately unsafe Neither safe nor unsafe Moderately safe Very safe
A.6. How safe do you feel in your local green spaces?
Figure
Agree Disagree Neutral Strongly agree Strongly disagree
Figure A.7. Do you agree with the following statement: all communities in Southeast Michigan have equal access to green spaces?
Agree Disagree Neutral Strongly agree Strongly disagree
Figure A.8. Do you agree with the following statement: green spaces are equally distributed across different neighborhoods in your community?
127 Appendices 10% 36% 13% 5% 36%
21% 36% 13% 4% 26%
A.4 Pilot Survey Demographics Results
128 Fostering Racial Equity in Access to Green Spaces
0 10 20 30 40 50 60 70 I prefer not to answer. Man Nonbinary Woman
0 5 10 15 20 25 30 35 18 to 25 years 26 to 34 years 35 to 39 years 40 to 49 years 50 to 64 years 65+ years I prefer not to answer
Figure A.9. What is your gender?
Figure A.10. What is your age range?
I prefer not to answer. No Yes
I prefer not to answer. No Yes
129 Appendices 4% 95% 1%
4% 89% 7%
Figure A.11. Are you Hispanic/Latino?
Figure A.12. Are you Arab?
I prefer not to answer.
I prefer not to answer Some other race
130 Fostering
0 10 20 30 40 50 60 70 80 90 100 White Asian American Indian and Alaska Native Native Hawaiian and Other Pacific Islander
African
Racial Equity in Access to Green Spaces
Black or
American
0 5 10 15 20 25 30 35 40
$49,999
$100,000 or more $25,000 to
$50,000 to $74,999 $75,000 to $99,999
$25,000
Less than
Student/Currently Unemployed
Figure A.13. What is your race/ethnicity? Check all that apply:
Figure A.14. What is your annual household income, before taxes?
APPENDIX 4: PARKSCAPE MOBILE APPLICATION
App Goals
The proposed mobile app has three major goals:
First, real-time information and updates. As an information provider, it is crucial to provide users with real-time updates about green spaces. Compared with traditional notice methods like posters and flyers, providing the latest updates on park conditions and events on mobile apps are more effective, economically and in terms of information range
Second, personalization and algorithm recommendation. Mobile apps can offer personalizedzand customized experiences for users, allowing them to find green spaces that cater to their specific preferences and needs. Mobile apps can also give users a chance to create lists of favorite green spaces by features and activities, and can recommend similar green spaces and events users may like.
Third, facilitating social connections. Apps can help build social connections among users by allowing them to share experiences, reviews, and recommendations related to green spaces.
App Development Process
Based on an established methodology regarding user-centered information app development,1 the following steps were taken to ensure that our recommended app could address the inequities of green space accessibility effectively:
Problem Identification and Goal-setting
Based on our problem statement and background review, we conceptualized the idea of creating a mock-up app to address the issue of inequitable accessibility. We also aimed to include features that meet user needs (i.e., location services, search and filter options, events feed, explore destinations, etc.).
Users and Stakeholders Analysis
We identified stakeholders who would benefit from this app, such as local residents, environmental council board, park administrators, and community-based organizations. We took advantage of interviews and the pilot survey to identify needs that may be met by an app.
Mockup Design and Development
We designed and developed the mock-up, incorporating the key features like Map and Location Services, Search and Filter Options, and so on. We ensured that the app followed usability principles and created a visual representation of the app’s user interface, layout, and functionality, matching it to our report branding before moving on to actual development on the client’s end.
133 Appendices
App Functionality
The features of this app aim to empower residents with the tools and information they need to discover, explore, and appreciate the green spaces in their communities, while promoting mental and physical well-being and fostering social connections. The following app features attempt to address inequitable access to green spaces in Southeast Michigan:
Explore
The Explore feature serves as the main page of the app, offering users an engaging and intuitive interface to search for green spaces and discover new locations. By including search and filter options, users can find green spaces that cater to their specific preferences and requirements. Trending locations and activities are also highlighted to encourage users to explore different green spaces and engage in various activities. This feature aims to increase awareness of the available green spaces and help users make informed decisions about the spaces they visit.
Map and Location Service
The Map and Location Service feature helps users find nearby green spaces and provide directions to their desired locations. By integrating ratings and reviews, users can make betterinformed decisions based on the experiences of others. This feature addresses the challenge of finding green spaces within walking or biking distance and facilitates more equitable access by making it easier for users to navigate to green spaces in their communities.
My Favorite
My Favorite feature allows users to save their preferred parks in a customized list for easy access. This feature enhances user engagement by enabling them to keep track of the green spaces they love and return to them more easily. By providing users with a personalized experience, the app encourages users to explore and appreciate their local green spaces more frequently.
Events
The Events feature uses an algorithm to suggest events and activities happening in green spaces that users may be interested in. Users can also search for events by keywords, allowing them to find activities tailored to their interests. This feature aims to promote community engagement and foster social connections among users by encouraging them to participate in events and activities within green spaces.
Information
The Information page provides users with essential details about the app, contact information, and external websites related to green spaces and community resources. This feature ensures transparency and allows users to reach out to the app developers and other relevant organizations for support or further information.
134 Fostering Racial
Equity in Access to Green Spaces
Competitor Analysis
In 2018, SEMCOG launched the Southeast Michigan ParkFinder app which includes information about park amenities throughout the region, allowing users to see all parks, along with private recreation and conservation land, all on one streamlined map.

Indeed, ParkFinder provided detailed amenity information of all parks in Southeast Michigan, and also helped inform our GIS analyses. But there are a few notable differences between ParkFinder and ParkScape. The information on ParkFinder is delivered in a traditional format with static lists and layers. The interfaces and filtering processes between the two apps are also different. In ParkFinder, users must filter and search for information manually, whereas ParkScape would allow people to search keywords or park event information.
ParkFinder also differs from ParkScape because it does not feature personalized recommendations. In ParkScape, personalized experiences would be tailored to individual user preferences and needs, using algorithms to recommend green spaces and events that match users’ interests. Also, ParkScape facilitates social connections by encouraging users to share their experiences, review, fostering a sense of community and enabling users to discover new places based on valuable peer input. Finally, ParkScape can be scaled up to a statewide level, whereas ParkFinder relies on SEMCOG data and is only applicable to users in Southeast Michigan.
135 Appendices
Source: Photo by Eduardo Cano Photo Co. on Unsplash
Figure A.1. SEMCOG’s ParkFinder App


136
Fostering Racial Equity in Access to Green Spaces
Figure 11.1. ParkScape App Mock-Ups
ENDNOTES
1. Mohammad Zarour and Mubarak Alharbi, “User experience framework that combines aspects, dimensions, and measurement methods,” Cogent Engineering 4, no. 1 (2017): 1-25.
137 Appendices
APPENDIX 5: GIS METHODOLOGY
Equity Emphasis Composite Scores
Census Data
Transportation data Parks Data
All Green Spaces
Only Natural Areas
All Green Spaces
Only Natural Areas Only High-Amenity Green Spaces
Calculating Green Space area per 100 people at census tract level
Calculating Green Space area per 100 people at subdivision level
Creating 10-min Walk Service Areas
Creating 30-min Transit Service Areas
Bivariate maps comparing availability and Equity Emphasis score (Figures 4.1-4.9)
Comparing areas with high and low availability (Figures 4.12-4.14)
Creating 10-min Bike Service Areas
Creating 15-min Drive Service Areas
Identifying areas with high and low access to green spaces (Figures 4.18-4.25)
Equity Emphasis Areas
(See ‘Bivariate Mapping Methods’ in Appendix 5)
Bivariate maps comparing availability and Black Population Percentage (Figures 4.15-4.17)
Source: Created by Manvi Nigam on InDesign
Bivariate maps comparing Accessibility and Black Population Percentage (Figures 4.26 & 4.27)
139 Appendices
Figure A.1. GIS Methodology
Collecting the data 1 Filtering and categorizing green spaces 2 Analyzing transportation access via diff. modes 3C Analyzing availability and Black population 3B Analyzing availability and Equity Emphasis 3A Network Analysis
Fostering Racial Equity in Access to Green Spaces
A.1 Data Collection
The data used in the GIS analysis for this project was mainly collected from the U.S. Census Bureau, the SEMCOG Open Data Portal, and transit feed data from various transit agencies. A complete list of data sources can be found below:
1. Parks Data:
• SEMCOG, Parks, 2021 (April 25, 2022), SEMCOG Open Data Portal, https://maps-semcog.opendata.arcgis.com/datasets/SEMCOG::parks-2021/ explore?location=42.441441%2C-83.278089%2C9.50.
• SEMCOG, Park Attributes (January 5, 2023), SEMCOG Open Data Portal, https:// maps-semcog.opendata.arcgis.com/datasets/park-attributes-1/explore.
• SEMCOG, Community Explorer (2020), SEMCOG Open Data Portal, https://maps. semcog.org/CommunityExplorer/?shortcut=Total_Population
2. Demographics Data:
• U.S. Census Bureau, P2 | Hispanic or Latino, and not Hispanic or Latino By Race (2020), https://data.census.gov/table?t=Race+and+Ethnicity&tid=DECENNIALPL2020.P2.
• SEMCOG, Equity Emphasis Areas (2022), SEMCOG Map Gallery, https://maps.semcog. org/
3. Transportation Data:
• SEMCOG, Bicycle Network, 2020 (April 3, 2020), SEMCOG Open Data Portal, https:// maps-semcog.opendata.arcgis.com/datasets/SEMCOG::bicycle-network-2020-1/ explore?location=42.274968%2C-83.716862%2C14.61.
• SEMCOG, Sidewalks and Crosswalks 2019 (January 6, 2023), SEMCOG Open Data Portal, https://maps-semcog.opendata.arcgis.com/datasets/SEMCOG::sidewalks-andcrosswalks-2019/explore?location=42.427849%2C-83.278450%2C8.59.
• State of Michigan, All Roads (v17a) (July 30, 2015), Michigan GIS Open Data, https://gis-michigan.opendata.arcgis.com/datasets/Michigan::all-roads-v17a/ explore?location=44.531174%2C-86.307700%2C7.52.
• City of Detroit, DDOT GTFS file (2017), Detroit Open Data Portal, https://data. detroitmi.gov/documents/1de3fec8cc894fdbbc03c5d31bca32d4/about.
• University of Michigan Parking and Transportation Services, U-M Transit GTFS Data (January 28, 2022), TransitFeeds, https://transitfeeds.com/p/university-of-michiganparking-transportation-services/316.
• Detroit Transportation Corporation, DDOT GTFS Data (October 18, 2019), TransitFeeds, https://transitfeeds.com/p/detroit-transportation-corporation/1043.
• QLine Detroit, QLine GTFS Data (n.d.), Transitland, n.d.,
• https://www.transit.land/operators/o-dpsbv-qlinedetroit.
• Ann Arbor Transportation Authority, TheRide GTFS Data (April 16, 2020), TransitFeeds, https://transitfeeds.com/p/ann-arbor-transportation-authority/147.
• SMART (Suburban Mobility Authority for Regional Transportation), SMART GTFS Data (June 2021), Transitland, https://www.transit.land/operators/o-dps-smart#routes.
140
• Ann Arbor Transportation Authority, TheRide GTFS Data (April 16, 2020), TransitFeeds, https://transitfeeds.com/p/ann-arbor-transportation-authority/147.
• SMART (Suburban Mobility Authority for Regional Transportation), SMART GTFS Data (June 2021), Transitland, https://www.transit.land/operators/o-dps-smart#routes.
A.2 Analysis Methodology
After collecting the relevant data from the above sources, the analysis was split into three sections – the availability of green spaces compared to different social accessibility factors, the availability of green spaces compared to concentrations of Black population, and the transportation access to green spaces using different modes.
Before analyzing the availability of green spaces, we cleaned the data to only include green spaces that are publicly accessible, and support recreational activities. To do this, we excluded all spaces that were categorized as golf courses, ski areas, or hunt clubs, and also excluded some spaces marked as research areas or private recreation areas.
Social Accessibility Analysis
After cleaning the parks data to include only publicly accessible green spaces supporting recreational activities, census tract level U.S. Census Bureau and SEMCOG geospatial data were used to analyze the social accessibility of the amount of green space per census tract in Southeast Michigan. As the smallest standard administrative statistical unit, census tracts contextualize the impacts of social factors on residents’ ease of access to green space and inequitable regional distributions of green space access in the greatest local detail.
Thematic Mapping Methods
As a technique, thematic mapping is meant to portray the pattern or distribution of a particular subject (i.e., a theme) over a geographic area. In this case, the geographic area of interest is the Southeast Michigan region, and ease of green space access is the theme. Thematic maps provide insight on the concentrations of critical populations and resources, potentially revealing correlated, pattern spatial inequalities. Patterns of spatial inequalities observed over the area of interest can then serve as a starting point for assessing regional distributional inequities.
Demographic identity and socioeconomic status statistics were thematically mapped to display social access challenge patterns influencing ease of green space access for regional residents. Statistics were sourced from the SEMCOG Community Explorer (CE) dataset, which summarizes U.S. Census Bureau 2016-2020 ACS 5-year estimates. The specific statistics used to create Figures 4.3 and 4.4 the Thematic Maps section of Chapter 4 and Figures A.1 through A.4 in this section include:
• Percent White of Total Population
141 Appendices
Fostering Racial Equity in Access to Green Spaces
• Percent Non-White of Total Population (Sum of Black or African American, Asian, American Indian or Alaskan Native, Native Hawaiian and other Pacific Islander, and Some Other Race populations per census tract.)
• Population Density per Acre
• Median Household Income
All separating the data into 5 classes using the Jenks distribution, the resulting thematic maps display densities of population groups and resources across the region.

142
Source: SEMCOG 2020, USCB 2016-2020 ACS 5-year estimates.
Figure A.2. Percent Non-White of Total Population by Census Tract, Southeast Michigan

143 Appendices
Source: SEMCOG 2020, USCB 2016-2020 ACS 5-year estimates.
Figure A.3. Population Density per acre by Census Tract, Southeast Michigan
144 Fostering Racial Equity in Access to Green Spaces
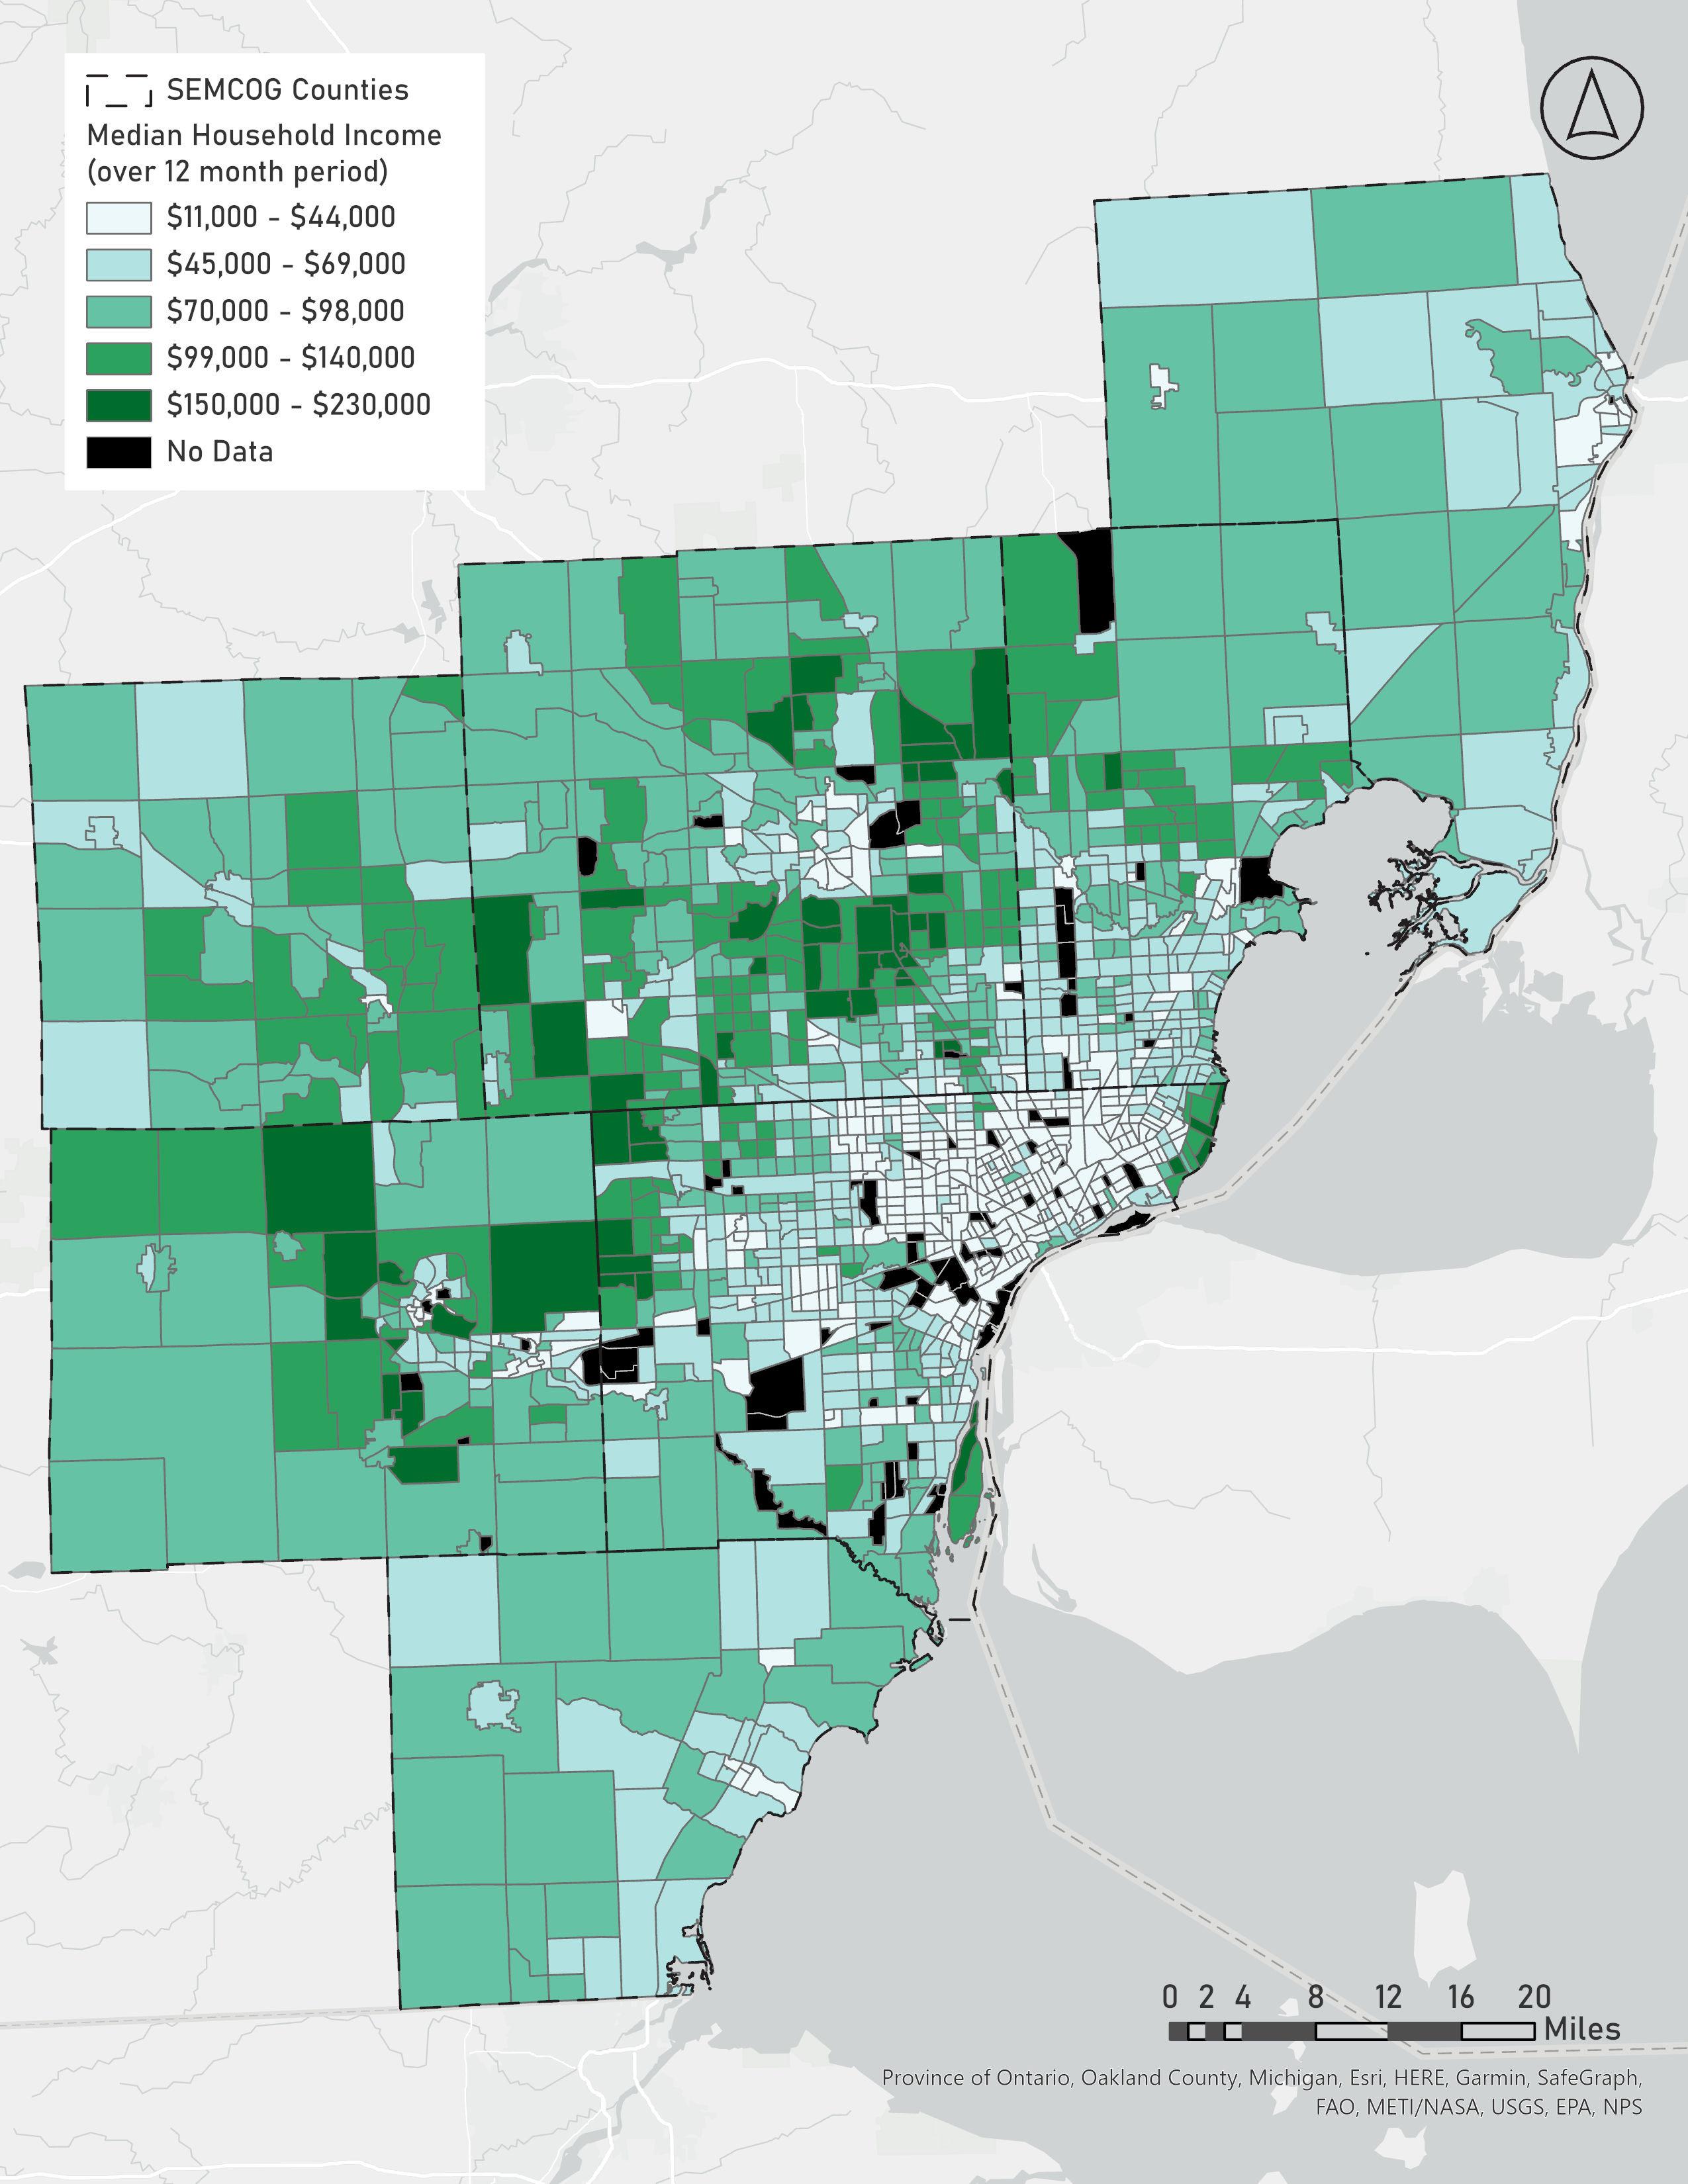 Source: SEMCOG 2020, USCB 2016-2020 ACS 5-year estimates.
Figure A.4. Median Household Income by Census Tract, Southeast Michigan
Source: SEMCOG 2020, USCB 2016-2020 ACS 5-year estimates.
Figure A.4. Median Household Income by Census Tract, Southeast Michigan
Bivariate Mapping Methods
Observing pattern spatial inequalities in tandem over the area of interest assesses the presence of relationships between the patterns of those inequalities. In order to explore the relationship between the social accessibility of green space and critical social statistics, we constructed bivariate maps displaying the spatial patterns between these two variables. Critical social statistics used include all fifteen ACS estimates used to calculate the ‘Equity Emphasis’ per census tract, discussed in the Bivariate Maps section of Chapter 4:
• Percent of Population Ages 65 and Up
• Percent of Population Children Ages 0 to 17
• Percent Minority of Total Population
• Percent Households in Poverty
• Percent of Households that are Transit Dependent
• Percent Black of Total Population
• Percent Asian of Total Population
• Percent Hispanic of Total Population
• Percent All Other Minorities of Total Population
• Percent of Households that are Limited English Proficiency
• Percent of Households with No Car
• Percent of Households that are Housing Cost Burdened
• Median Household Income
• Percent Population with a Disability
• Unemployment Rate
Bivariate maps of all fifteen ACS estimates by green space acreage per 100 people were produced for each of the three green space categories—All Green Space, Natural Areas, and Basic Amenity Green Space. Green space acreage per 100 people for each of the three green space categories was calculated by applying (1) below to each census tract.
Bivariate maps of all fifteen ACS estimates by green space acreage per 100 people were produced for each of the three green space categories—All Green Space, Natural Areas, and Basic Amenity Green Space. Green space acreage per 100 people for each of the three green space categories was calculated by applying (1) below to each census tract.
145 Appendices
146 Fostering Racial Equity in Access to Green Spaces
Percent Population Ages 65 & Up
 Source: SEMCOG, USCB 2016-2020 ACS 5-year estimates
Figure A.5. Percent Population Ages 65 & Up vs. All Green Space Acreage per 100 People by Census Tract
Source: SEMCOG, USCB 2016-2020 ACS 5-year estimates
Figure A.5. Percent Population Ages 65 & Up vs. All Green Space Acreage per 100 People by Census Tract
Source: SEMCOG, USCB 2016-2020 ACS 5-year estimates

147 Appendices
Figure A.6. Percent Population Ages 65 & Up vs. Natural Area Acreage per 100 People by Census Tract
Fostering Racial Equity in Access to Green Spaces

148
Source: SEMCOG 2020, USCB 2016-2020 ACS 5-year estimates.
Figure A.7. Percent Population Ages 65 & Up vs. Basic Amenity Space Acreage per 100 People by Census Tract
Percent Population Children Ages 0 to 17
Source: SEMCOG, USCB 2016-2020 ACS 5-year estimates

149 Appendices
Figure A.8. Percent Population Children Ages 0 to 17 vs. All Green Space Acreage per 100 People by Census Tract
150 Fostering Racial Equity in Access to Green Spaces
 Source: SEMCOG 2020, USCB 2016-2020 ACS 5-year estimates.
Figure A.9. Percent Population Children Ages 0 to 17 vs. Natural Area Acreage per 100 People by Census Tract
Source: SEMCOG 2020, USCB 2016-2020 ACS 5-year estimates.
Figure A.9. Percent Population Children Ages 0 to 17 vs. Natural Area Acreage per 100 People by Census Tract

151 Appendices
Source: SEMCOG 2020, USCB 2016-2020 ACS 5-year estimates.
Figure A.10. Percent Population Children Ages 0 to 17 vs. Basic Amenity Space Acreage per 100 People by Census Tract
Fostering Racial Equity in Access to Green Spaces
Percent Minority of Total Population

152
Source: SEMCOG 2020, USCB 2016-2020 ACS 5-year estimates.
Figure A.11. Percent Minority of Total Population vs. All Green Space Acreage per 100 People by Census Tract

153 Appendices
Source: SEMCOG 2020, USCB 2016-2020 ACS 5-year estimates.
Figure A.12. Percent Minority of Total Population vs. Natural Area Acreage per 100 People by Census Tract
Fostering Racial Equity in Access to Green Spaces
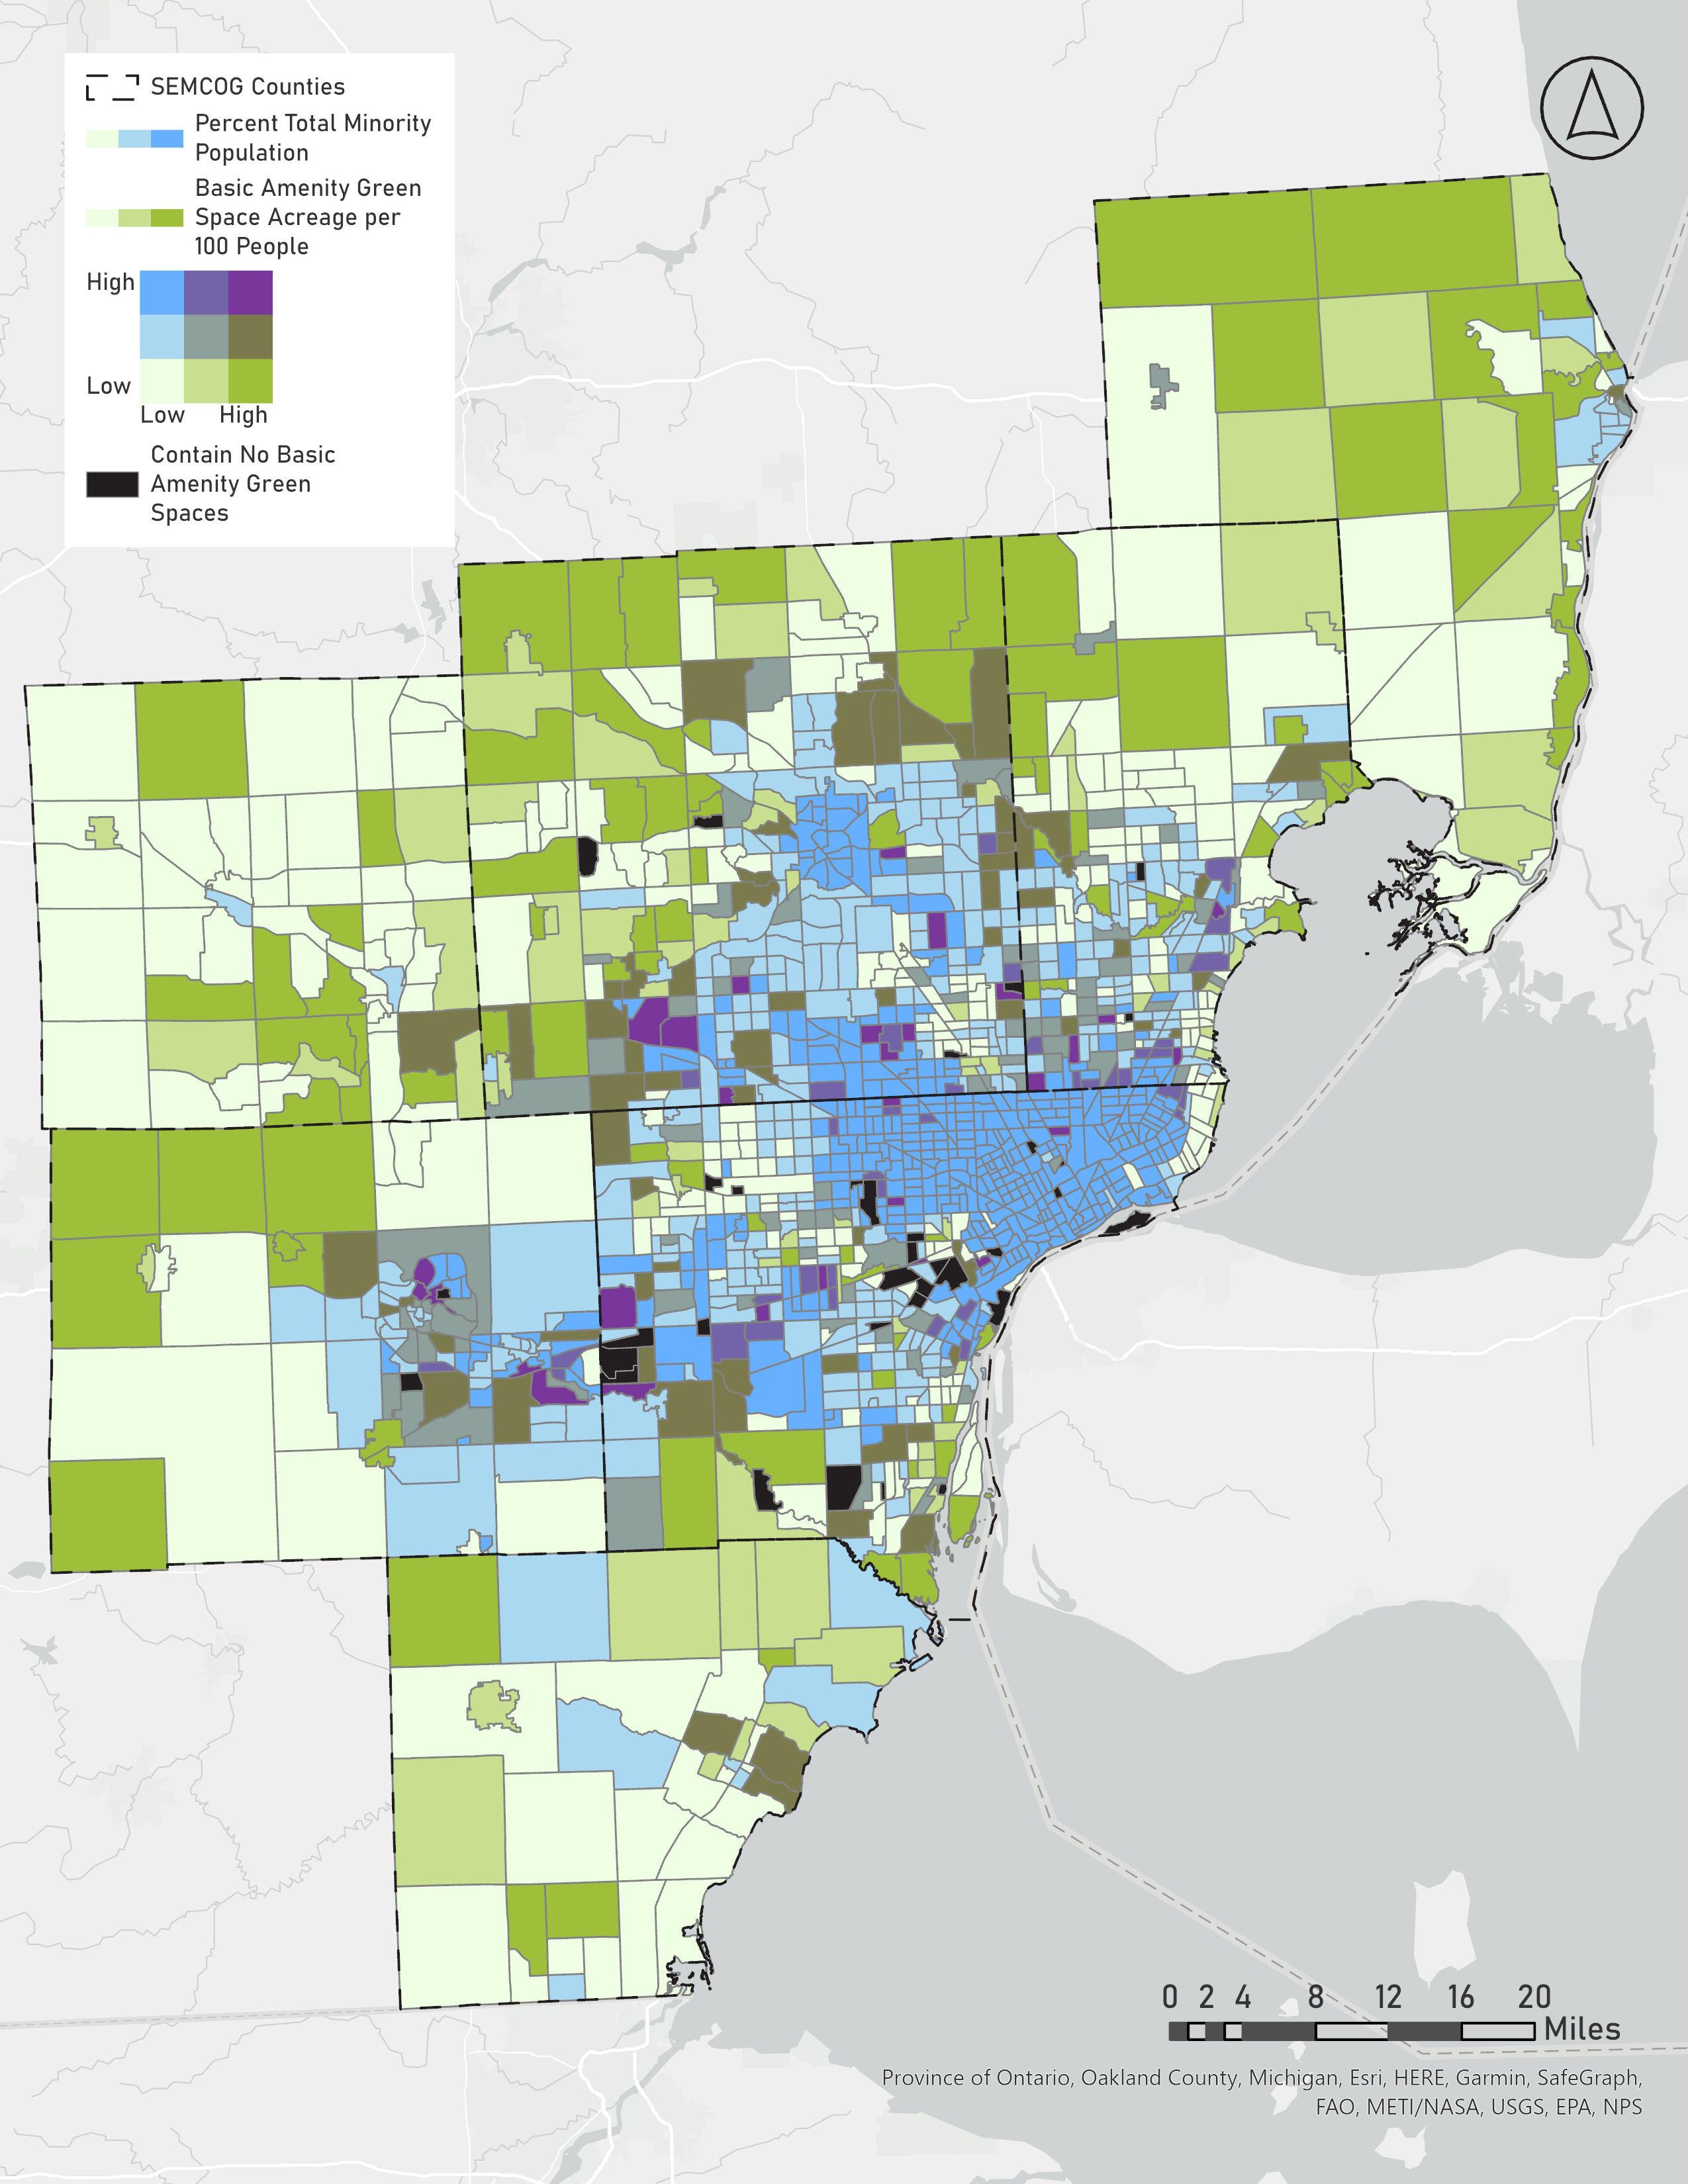
154
Source: SEMCOG 2020, USCB 2016-2020 ACS 5-year estimates.
Figure A.13. Percent Minority of Total Population vs. Basic Amenity Green Space Acreage per 100 People by Census Tract
Percent Households in Poverty

155 Appendices
Source: SEMCOG 2020, USCB 2016-2020 ACS 5-year estimates.
Figure A.14. Percent Households in Poverty vs. All Green Space Acreage per 100 People by Census Tract
Fostering Racial Equity in Access to Green Spaces

156
Source: SEMCOG 2020, USCB 2016-2020 ACS 5-year estimates.
Figure A.15. Percent Households in Poverty vs. Natural Area Acreage per 100 People by Census Tract
Source: SEMCOG 2020, USCB 2016-2020 ACS 5-year estimates.

157 Appendices
Figure A.16. Percent Households in Poverty vs. Basic Amenity Green Space Acreage per 100 People by Census Tract Density per acre by Census Tract, Southeast Michigan
Fostering Racial Equity in Access to Green Spaces
Percent Households that are Transit-Dependent

158
Source: SEMCOG 2020, USCB 2016-2020 ACS 5-year estimates.
Figure A.17. Percent Households that are Transit-Dependent vs. All Green Space Acreage per 100 People by Census Tract

159 Appendices
Source: SEMCOG 2020, USCB 2016-2020 ACS 5-year estimates.
Figure A.18. Percent Households that are Transit-Dependent vs. Natural Area Acreage per 100 People by Census Tract
160 Fostering Racial Equity in Access to Green Spaces
 Source: SEMCOG 2020, USCB 2016-2020 ACS 5-year estimates.
Figure A.19. Percent Households that are Transit-Dependent vs. Basic Amenity Green Space Acreage per 100 People by Census Tract
Source: SEMCOG 2020, USCB 2016-2020 ACS 5-year estimates.
Figure A.19. Percent Households that are Transit-Dependent vs. Basic Amenity Green Space Acreage per 100 People by Census Tract
Percent Black of Total Population

161 Appendices
Source: SEMCOG 2020, USCB 2016-2020 ACS 5-year estimates.
Figure A.20. Percent Black of Total Population vs. All Green Space Acreage per 100 People by Census Tract
Fostering Racial Equity in Access to Green Spaces

162
Source: SEMCOG 2020, USCB 2016-2020 ACS 5-year estimates.
Figure A.21. Percent Black of Total Population vs. Natural Area Acreage per 100 People by Census Tract

163 Appendices
Source: SEMCOG 2020, USCB 2016-2020 ACS 5-year estimates.
Figure A.22. Percent Black of Total Population vs. Basic Amenity Green Space Acreage per 100 People by Census Tract
164 Fostering Racial Equity in Access to Green Spaces
Percent Asian of Total Population
 Source: SEMCOG 2020, USCB 2016-2020 ACS 5-year estimates.
Figure A.23. Percent Asian of Total Population vs. All Green Space Acreage per 100 People by Census Tract
Source: SEMCOG 2020, USCB 2016-2020 ACS 5-year estimates.
Figure A.23. Percent Asian of Total Population vs. All Green Space Acreage per 100 People by Census Tract

165 Appendices
Source: SEMCOG 2020, USCB 2016-2020 ACS 5-year estimates.
Figure A.24. Percent Asian of Total Population vs. Natural Area Acreage per 100 People by Census Tract
166 Fostering Racial Equity in Access to Green Spaces
 Source: SEMCOG 2020, USCB 2016-2020 ACS 5-year estimates.
Figure A.25. Percent Asian of Total Population vs. Basic Amenity Green Space Acreage per 100 People by Census Tract
Source: SEMCOG 2020, USCB 2016-2020 ACS 5-year estimates.
Figure A.25. Percent Asian of Total Population vs. Basic Amenity Green Space Acreage per 100 People by Census Tract
Percent Hispanic of Total Population

167 Appendices
Source: SEMCOG 2020, USCB 2016-2020 ACS 5-year estimates.
Figure A.26. Percent Hispanic of Total Population vs. All Green Space Acreage per 100 People by Census Tract
Fostering Racial Equity in Access to Green Spaces

168
Source: SEMCOG 2020, USCB 2016-2020 ACS 5-year estimates.
Figure A.27. Percent Hispanic of Total Population vs. Natural Area Acreage per 100 People by Census Tract

169 Appendices
Source: SEMCOG 2020, USCB 2016-2020 ACS 5-year estimates.
Figure A.28. Percent Hispanic of Total Population vs. Basic Amenity Green Space Acreage per 100 People by Census Tract
170 Fostering Racial Equity in Access to Green Spaces
Percent All Other Minority of Total Population
 Source: SEMCOG 2020, USCB 2016-2020 ACS 5-year estimates.
Figure A.29. Percent All Other Minority of Total Population vs. All Green Space Acreage per 100 People by Census Tract
Source: SEMCOG 2020, USCB 2016-2020 ACS 5-year estimates.
Figure A.29. Percent All Other Minority of Total Population vs. All Green Space Acreage per 100 People by Census Tract

171 Appendices
Source: SEMCOG 2020, USCB 2016-2020 ACS 5-year estimates.
Figure A.30. Percent All Other Minority of Total Population vs. Natural Area Acreage per 100 People by Census Tract
172 Fostering Racial Equity in Access to Green Spaces
 Source: SEMCOG 2020, USCB 2016-2020 ACS 5-year estimates.
Figure A.31. Percent All Other Minority of Total Population vs. Basic Amenity Green Space Acreage per 100 People by Census Tract
Source: SEMCOG 2020, USCB 2016-2020 ACS 5-year estimates.
Figure A.31. Percent All Other Minority of Total Population vs. Basic Amenity Green Space Acreage per 100 People by Census Tract
Percent Households with Limited English Proficiency

173 Appendices
Source: SEMCOG 2020, USCB 2016-2020 ACS 5-year estimates.
Figure A.32. Percent Households with Limited English Proficiency vs. All Green Space Acreage per 100 People by Census Tract
Fostering Racial Equity in Access to Green Spaces

174
Source: SEMCOG 2020, USCB 2016-2020 ACS 5-year estimates.
Figure A.33. Percent Households with Limited English Proficiency vs. Natural Area Acreage per 100 People by Census Tract

175 Appendices
Source: SEMCOG 2020, USCB 2016-2020 ACS 5-year estimates.
Figure A.34. Percent Households with Limited English Proficiency vs. Basic Amenity Green Space Acreage per 100 People by Census Tract
176 Fostering Racial Equity in Access to Green Spaces
Percent Households with No Car
 Source: SEMCOG 2020, USCB 2016-2020 ACS 5-year estimates.
Figure A.35. Percent Households with No Car vs. All Green Space Acreage per 100 People by Census Tract
Source: SEMCOG 2020, USCB 2016-2020 ACS 5-year estimates.
Figure A.35. Percent Households with No Car vs. All Green Space Acreage per 100 People by Census Tract

177 Appendices
Source: SEMCOG 2020, USCB 2016-2020 ACS 5-year estimates.
Figure A.36. Percent Households with No Car vs. Natural Area Acreage per 100 People by Census Tract
178 Fostering Racial Equity in Access to Green Spaces
 Source: SEMCOG 2020, USCB 2016-2020 ACS 5-year estimates.
Figure A.37. Percent Households with No Car vs. Basic Amenity Green Space Acreage per 100 People by Census Tract
Source: SEMCOG 2020, USCB 2016-2020 ACS 5-year estimates.
Figure A.37. Percent Households with No Car vs. Basic Amenity Green Space Acreage per 100 People by Census Tract
Percent Households Housing Cost Burdened

179 Appendices
Source: SEMCOG 2020, USCB 2016-2020 ACS 5-year estimates.
Figure A.38. Percent Households Housing Cost Burdened vs. All Green Space Acreage per 100 People by Census Tract
180 Fostering Racial Equity in Access to Green Spaces
 Source: SEMCOG 2020, USCB 2016-2020 ACS 5-year estimates.
Figure A.39. Percent Households Housing Cost Burdened vs. Natural Area Acreage per 100 People by Census Tract
Source: SEMCOG 2020, USCB 2016-2020 ACS 5-year estimates.
Figure A.39. Percent Households Housing Cost Burdened vs. Natural Area Acreage per 100 People by Census Tract

181 Appendices
Source: SEMCOG 2020, USCB 2016-2020 ACS 5-year estimates.
Figure A.40. Percent Households Housing Cost Burdened vs. Basic Amenity Green Space Acreage per 100 People by Census Tract
Fostering Racial Equity in Access to Green Spaces
Median Household Income

182
Source: SEMCOG 2020, USCB 2016-2020 ACS 5-year estimates.
Figure A.41. Median Household Income vs. All Green Space Acreage per 100 People by Census Tract

183 Appendices
Source: SEMCOG 2020, USCB 2016-2020 ACS 5-year estimates.
Figure A.42. Median Household Income vs. Natural Area Acreage per 100 People by Census Tract
Fostering Racial Equity in Access to Green Spaces

184
Source: SEMCOG 2020, USCB 2016-2020 ACS 5-year estimates.
Figure A.43. Median Household Income vs. Basic Amenity Green Space Acreage per 100 People by Census Tract
Percent Population with a Disability of Total Population

185 Appendices
Source: SEMCOG 2020, USCB 2016-2020 ACS 5-year estimates.
Figure A.44. Percent Population with a Disability of Total Population vs. All Green Space Acreage per 100 People by Census Tract
Fostering Racial Equity in Access to Green Spaces

186
Source: SEMCOG 2020, USCB 2016-2020 ACS 5-year estimates.
Figure A.45. Percent Population with a Disability of Total Population vs. Natural Area Acreage per 100 People by Census Tract

187 Appendices
Source: SEMCOG 2020, USCB 2016-2020 ACS 5-year estimates.
Figure A.46. Percent Population with a Disability of Total Population vs. Basic Amenity Green Space Acreage per 100 People by Census Tract
Fostering Racial Equity in Access to Green Spaces
Unemployment Rate

188
Source: SEMCOG 2020, USCB 2016-2020 ACS 5-year estimates.
Figure A.47. Unemployment Rate vs. All Green Space Acreage per 100 People by Census Tract

189 Appendices
Source: SEMCOG 2020, USCB 2016-2020 ACS 5-year estimates.
Figure A.48. Unemployment Rate vs. Natural Area Acreage per 100 People by Census Tract
190 Fostering Racial Equity in Access to Green Spaces
 Source: SEMCOG 2020, USCB 2016-2020 ACS 5-year estimates.
Figure A.49. Unemployment Rate vs. Basic Amenity Green Space Acreage per 100 People by Census Tract
Source: SEMCOG 2020, USCB 2016-2020 ACS 5-year estimates.
Figure A.49. Unemployment Rate vs. Basic Amenity Green Space Acreage per 100 People by Census Tract
Analyzing Availability of Green Spaces
After analyzing the availability compared to different demographic factors at the census tract level, we calculated the amount of green space available in each county subdivision (i.e., each city or township in Southeast Michigan) in order to better contextualize the analysis within the jurisdictions. By dividing this amount by the population, we mapped the green space acreage available per 100 people in a county subdivision. This result can be seen in Figure 4.12. Then, we brought in race data from the 2020 Decennial Census to create a bivariate map comparing the green space area available per 100 people to the percentage of Black population in that subdivision (Figure 4.15).
Analysis Transportation Access to Green Spaces via Different Modes
Network analysis is a powerful tool in ArcGIS Pro that can be used to analyze transportation systems, including walking, biking, public transit, and driving networks. To include network analysis methodology in our report, we followed these steps:
• Data Preparation: Before starting the network analysis, we prepared the data. We collected the GIS data from SEMCOG Open Data Portal such as sidewalks and crosswalks, bike lanes, GTFS Data, and road networks. This includes importing and creating the network dataset and defining network attributes such as travel speed and travel time to the network dataset.
• Creating Network Analysis Layer: Once the data was ready, the team created a network analysis layer by selecting the appropriate analysis type (i.e., service area). Each analysis type has different parameters and settings that were customized based on the mode of transportation. We used 3 mph average speed for walking, 10 mph average speed for biking, 30-min average travel time for public transportation and 15-min average travel time for driving.
• Setting up Analysis Parameters: After creating the network analysis layer, we set up the analysis parameters such as the parks (as point of interests), mode of transportation, travel time or speed. For example, to find the service area for parks by walking, we selected the Walk mode and set the time cutoff as 10 minutes.
• Running the Analysis: After setting the analysis parameters, we ran the analysis and generated the results. The results included a map showing the service area for green spaces and natural areas by four different modes of transportation.
• Analyzing Results: After creating the service areas for the four modes, we analyzed the results in two ways to gain insights about the transportation system and whether access is equitable. First, we calculated the overlaps between service areas created around each park to assess the number of green spaces or natural spaces that are accessible via that particular mode. Next, we calculated the percentage of each subdivision that lies within at least one service area, to assess how much of the subdivision lives within walking/biking/transit distance to a green space. By comparing these percentages with the percentage of Black population, we analyzed the accessibility of areas with high concentrations of Black population.
• Presenting Results: We generated the bivariate maps comparing the transportation access to green spaces and natural areas and black population.
191 Appendices
Taubman College of Architecture and Urban Planning, University of Michigan, Ann Arbor
Kira Barsten, Kathryn Economou, Dana Gentry, Srishti Jaipuria, Gurleen Kaur, Caroline Lamb, Xianwei Lei, Annie Linden, Manvi Nigam, Anna Pasek, Kimberly Swinehart, and Yuan Wu
Faculty Advisor: Dr. Robert Goodspeed