DETROIT’S LOWER CASS AND BRUSH PARK NEIGHBORHOODS:
A PRELIMINARY NEEDS ASSESSMENT
AUTHORS:
AAYAT ALI, MIKE AUERBACH, BADER BAJABER, XIAOYA CHEN, XIAORAN DANG, SONJA KARNOVSKY, ANDREW MCINTYRE, BITHIA RATNASAMY, JERMAINE R RUFFIN, LIANG YUE, MANJUN ZANG
ADVISORS:
ERIC DUEWEKE
HARLEY ETIENNE
UNIVERSITY OF MICHIGAN TAUBMAN COLLEGE OF ARCHITECTURE AND URBAN PLANNING
Detroit’s Lower Cass and Brush Park Area: A Preliminary Needs Assessment would not have been possible without the support of key individuals and organizations. The project team appreciates the opportunity to contribute to this Community Needs Assessment process and are hopeful that the project will serve as a resource for area community members.
First and foremost, the team wants to thank the residents, public service providers, and small business owners who shared their experience throughout the process of putting together this preliminary needs assessment.
Throughout the planning process, the following individuals have shared countless insights and hours with us:
• Members of the Neighborhood Advisory Committee
• Members of the Project Advisory Committee
• Selwin O’Neal, Homeless Action Network of Detroit
We also want to thank our project partners for their invaluable input throughout this preliminary needs assessment.
• Data Driven Detroit
• JFM Consulting Group
The introduction outlines the scope and timeline of this preliminary needs assessment and the partners who worked on the project.
Chapter 1 is a historic overview of the LCBPA that frames changing demographic and social conditions in the area and the historic roots of present needs.
Chapter 2 captures data and analysis from the stakeholder survey. This survey was a preliminary look at current stakeholdersʼ self-identified needs.
Chapter 3 is a profile of current conditions in the LCBPA that frames the area as it exists currently and identifies assets and needs that exist today.
Chapter 4 builds on needs and assets described in Chapters 2 and 3 and offers some recommendations to address needs.
“Detroit’s Lower Cass and Brush Park Area: A Preliminary Needs Assessment” aims to:
• Provide historical context of the Lower Cass, Brush Park, and Grand Circus areas of central Detroit
• Provide a profile of the current conditions
• Capture stakeholder priorities
• Identify needs, assets, and recommendations for future action
This report is a first step toward a more detailed community needs assessment, to be completed by JFM Consulting Group in conjunction with Data Driven Detroit for the Detroit Downtown Development Authority.

JFM’s mission is to identify innovative and effective ways to help the nonprofit, philanthropic and public sectors increase the impact of their work and improve the quality of life in the communities they serve. For more than 20 years, JFM has worked in partnership with philanthropy, non-profit organizations, and public sector agencies to identify solutions to economic and social challenges, especially in urban and historically underserved communities.
Project Role: JFM assisted the team’s effort by assembling a project advisory committee and providing leadership and technical assistance.

Data Driven Detroit (D3) began as a data hub for community organizations, foundations, governments, and other organizations in need of reliable data to help them make better decisions about the future of Detroit and the surrounding region. Today, D3 continues to fill this role, functioning as a data intermediary and a partner to socially-minded groups seeking data to drive decision-making. D3 provides accessible high-quality information and analysis to drive informed decision-making. Our vision is that essential and unbiased information is used by all.
Project role: D3 assisted the team in developing parcel surveys and in verifying data used in analyses.
JANUARY FEBRUARY MARCH APRIL
Project Planning
Historical context
Quantitative Research Field Research
Quantitative Analysis Stakeholder Survey Survey Analysis Convey Results
MAP CREATION DATE: APR. 27, 2017
MAP AUTHOR: PROJECT TEAM
MAP NOTES
a Southeast Michigan Council of Governments (SEMCOG), “Roads,” Retrieved from Open Data Portal, Accessed May 1, 2017.
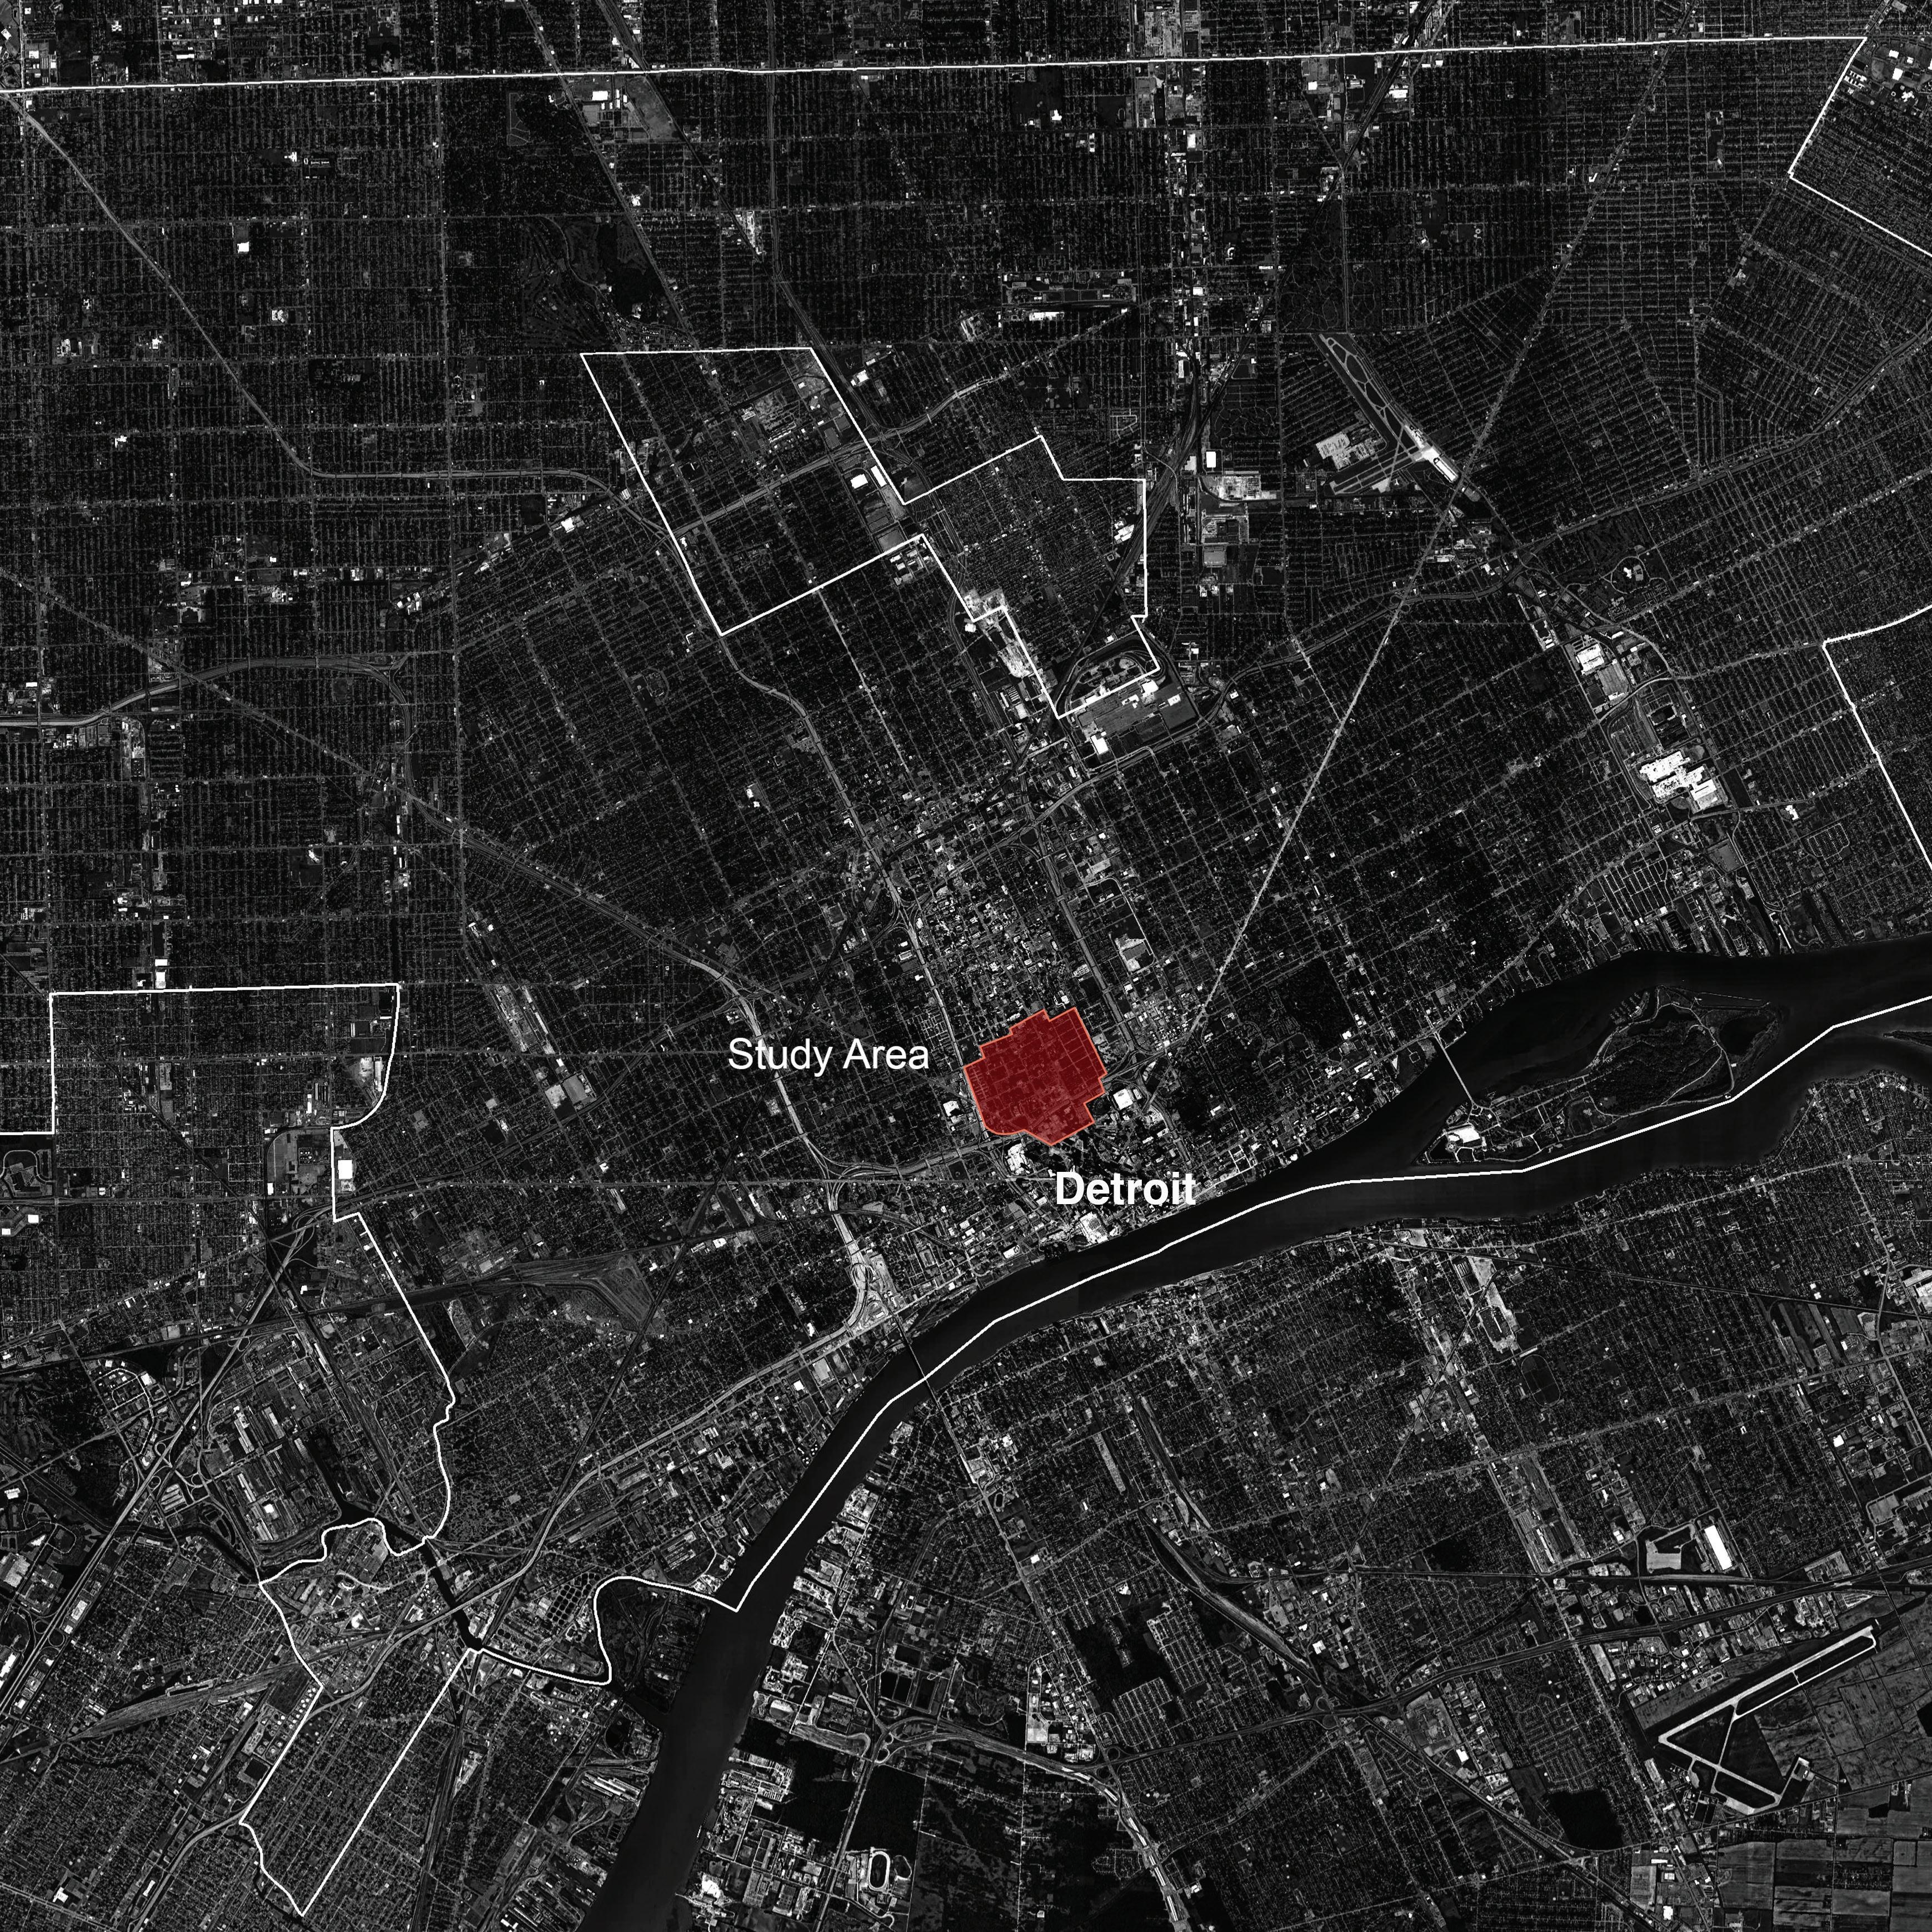
The Lower Cass and Brush Park Area (LCBPA) has a rich history shaped by changes in population demographics, industrial shifts, and transportation. As the LCBPA is currently experiencing the impacts of the Little Caesars Arena and other development, an analysis of its past serves the purpose of providing context for present stakeholders’ concerns.
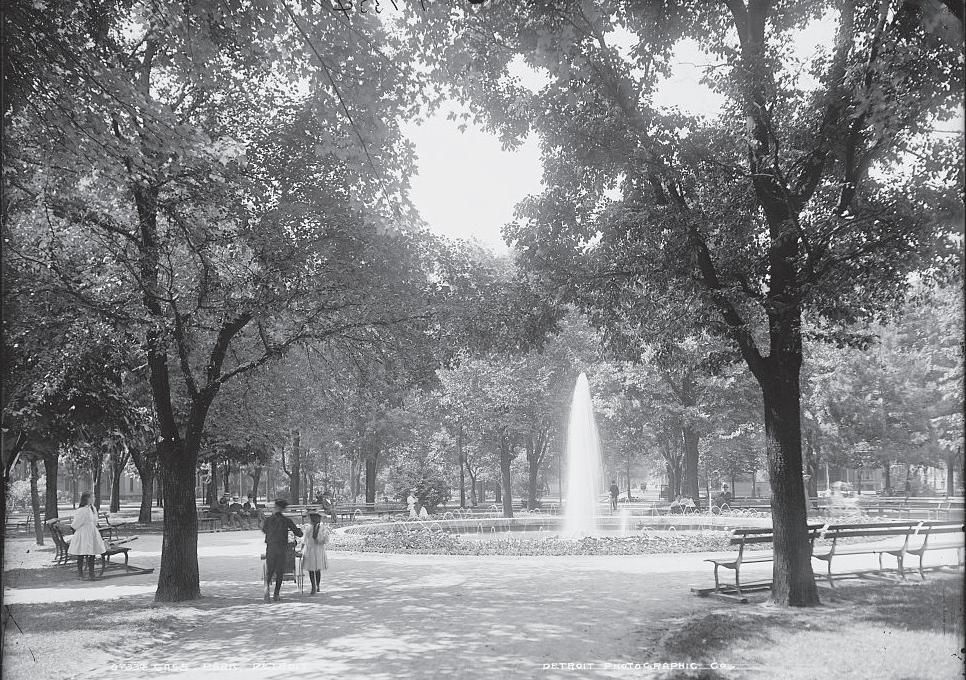
Upon the arrival of settlers of European descent, the LCBPA was used as farm land. A large section of this land was owned by Lewis Cass, Michigan’s second governor.1 In 1860, he donated almost five acres of his property to the City of Detroit to be developed as a park; today, this park is Cass Park, located at Second Avenue and Temple Street.2 By 1870, there were over 79,600 residents in Detroit.3 Across the city, railroads were built and carriages became a common form of transportation. Additionally, the streetcar line on Woodward Avenue became a key amenity.4 As a result, the LCBPA developed into one of Detroit’s most popular “streetcar suburbs.”5
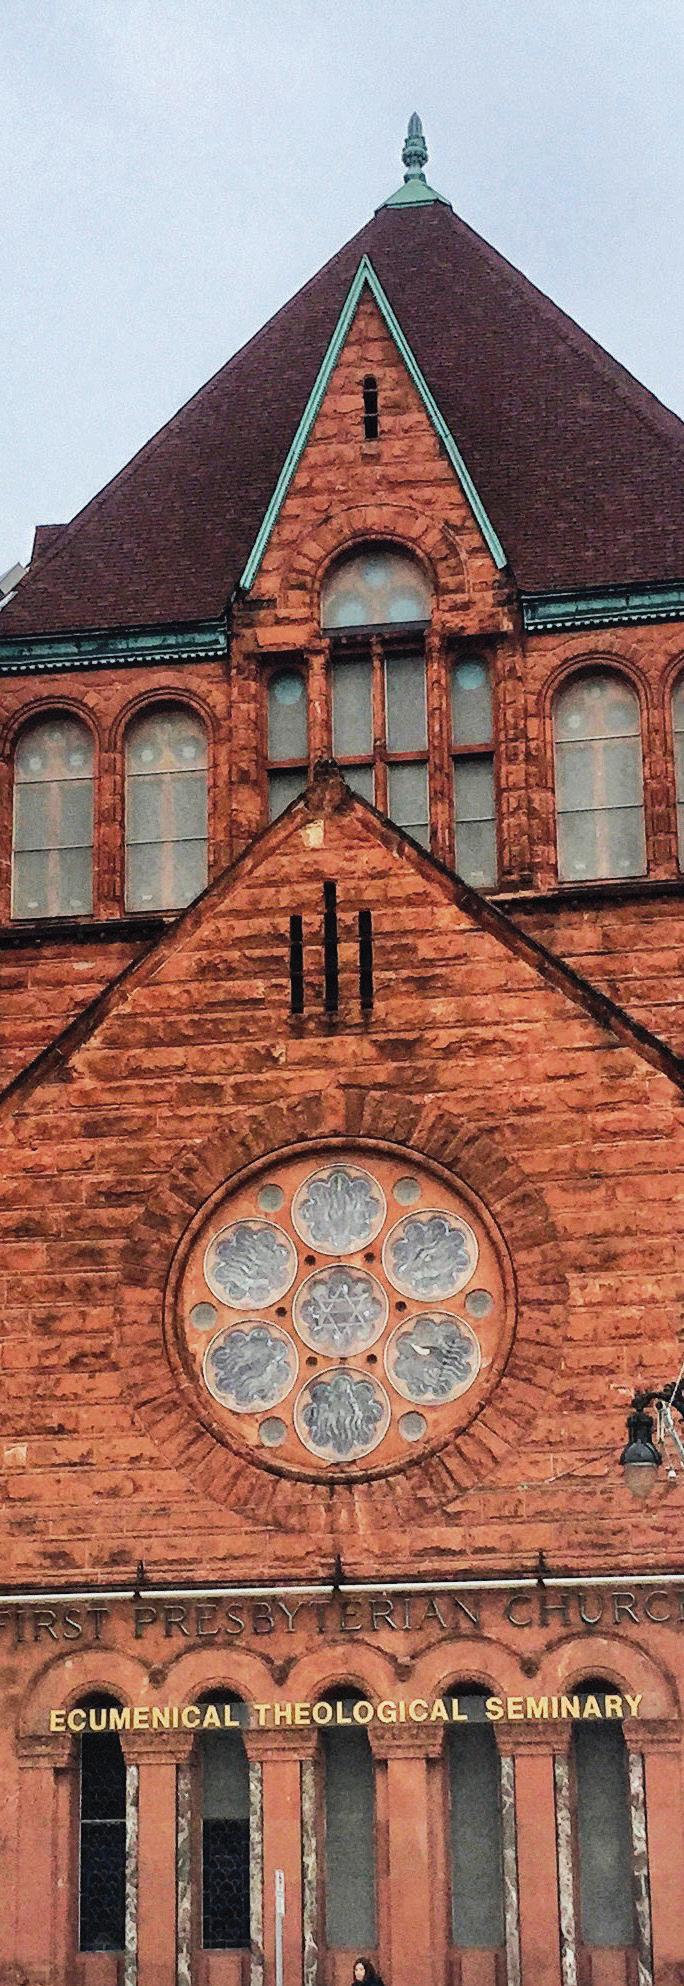
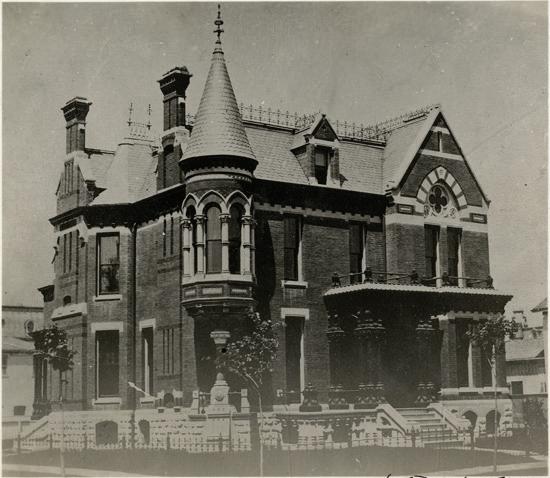
Toward the end of the nineteenth century, the LCBPA became a central hub for recreation and socialization. Home to many gathering places, including the Detroit Riding Company and Cass Park, the area was a vibrant and quickly growing community.6 Several churches were built on Woodward Avenue, including First Presbyterian Church, First Unitarian Church, and Woodward Avenue Baptist Church in Brush Park.7 St. Peter Claver Catholic Church on Beaubien Street primarily served the African American community.8
By 1900, Detroit was home to 285,704 residents.11 As it became an industrial powerhouse, automobile showrooms and other commercial and retail uses became a part of the city’s fabric. At this point, the LCBPA began transforming into a neighborhood full of apartments, department stores, and showrooms.12 Many of the historic apartment buildings that are still standing today, including the Davenport (1905), the Cromwell (1905) and the Ansonia (1908), were constructed during this era.13 Architect Albert Kahn built one of his earliest projects on Woodward Avenue, Temple Beth El, a synagogue constructed in 1902. Kahn also built a home for himself in Brush Park at the corner of Mack Avenue and John R Street.14
In the 1920s, the LCBPA became the center of Detroit’s automobile sales. The area also became a prime location for prominent businesses’ headquarters and institutions.15 Some iconic buildings constructed during the 1920s include:
• Standard Accident Insurance Company (640 Temple Street) - 1921
• Historic Cass Tech High School building (2501 Second Avenue) - 1922
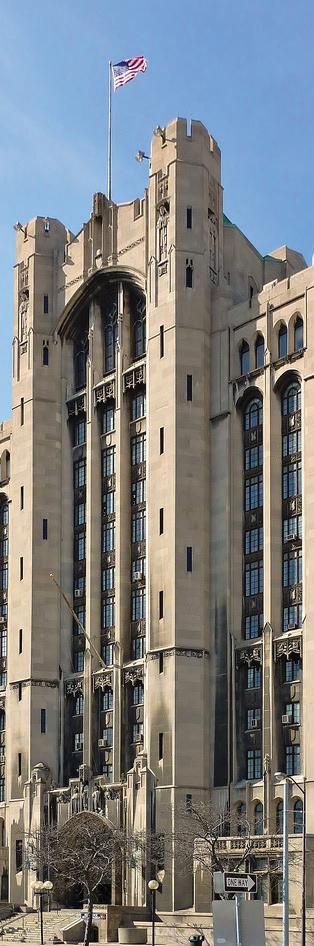
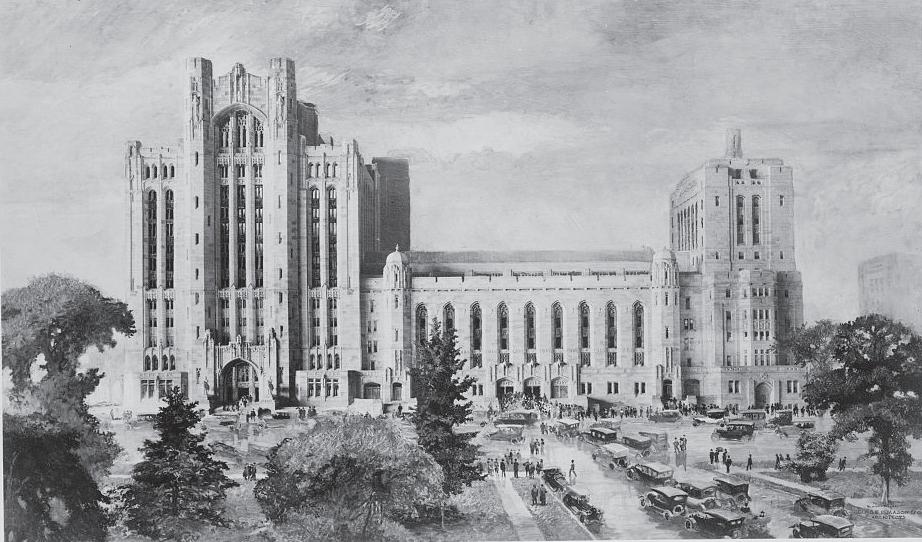
• Masonic Temple (500 Temple Street) - 1926
• Fort Wayne Hotel (408 Temple Street) - 1926
• Knights of Pythias headquarters (314 East Baltimore Avenue) - 1926
• S.S. Kresge headquarters (2727 Second Avenue) - 192716
In the 1950s and 1960s, Detroit changed quickly in terms of population, economy, culture, and transportation. During the 1950s, Detroit embraced the title of Motor City. After 93 years, the Detroit Street Railway ended service in 1956 and the city’s bus system expanded.19 Also, the M-10 Freeway (the Lodge) and US Interstate 75 (Fisher Freeway) were constructed in the 1950s and early 1960s, respectively.20 These highways instantly became barriers that separated the LCBPA from other parts of the city, especially downtown Detroit.21 The increased availability of motor vehicles and high speed freeways enabled residents to move out of the LCBPA and the city at large.
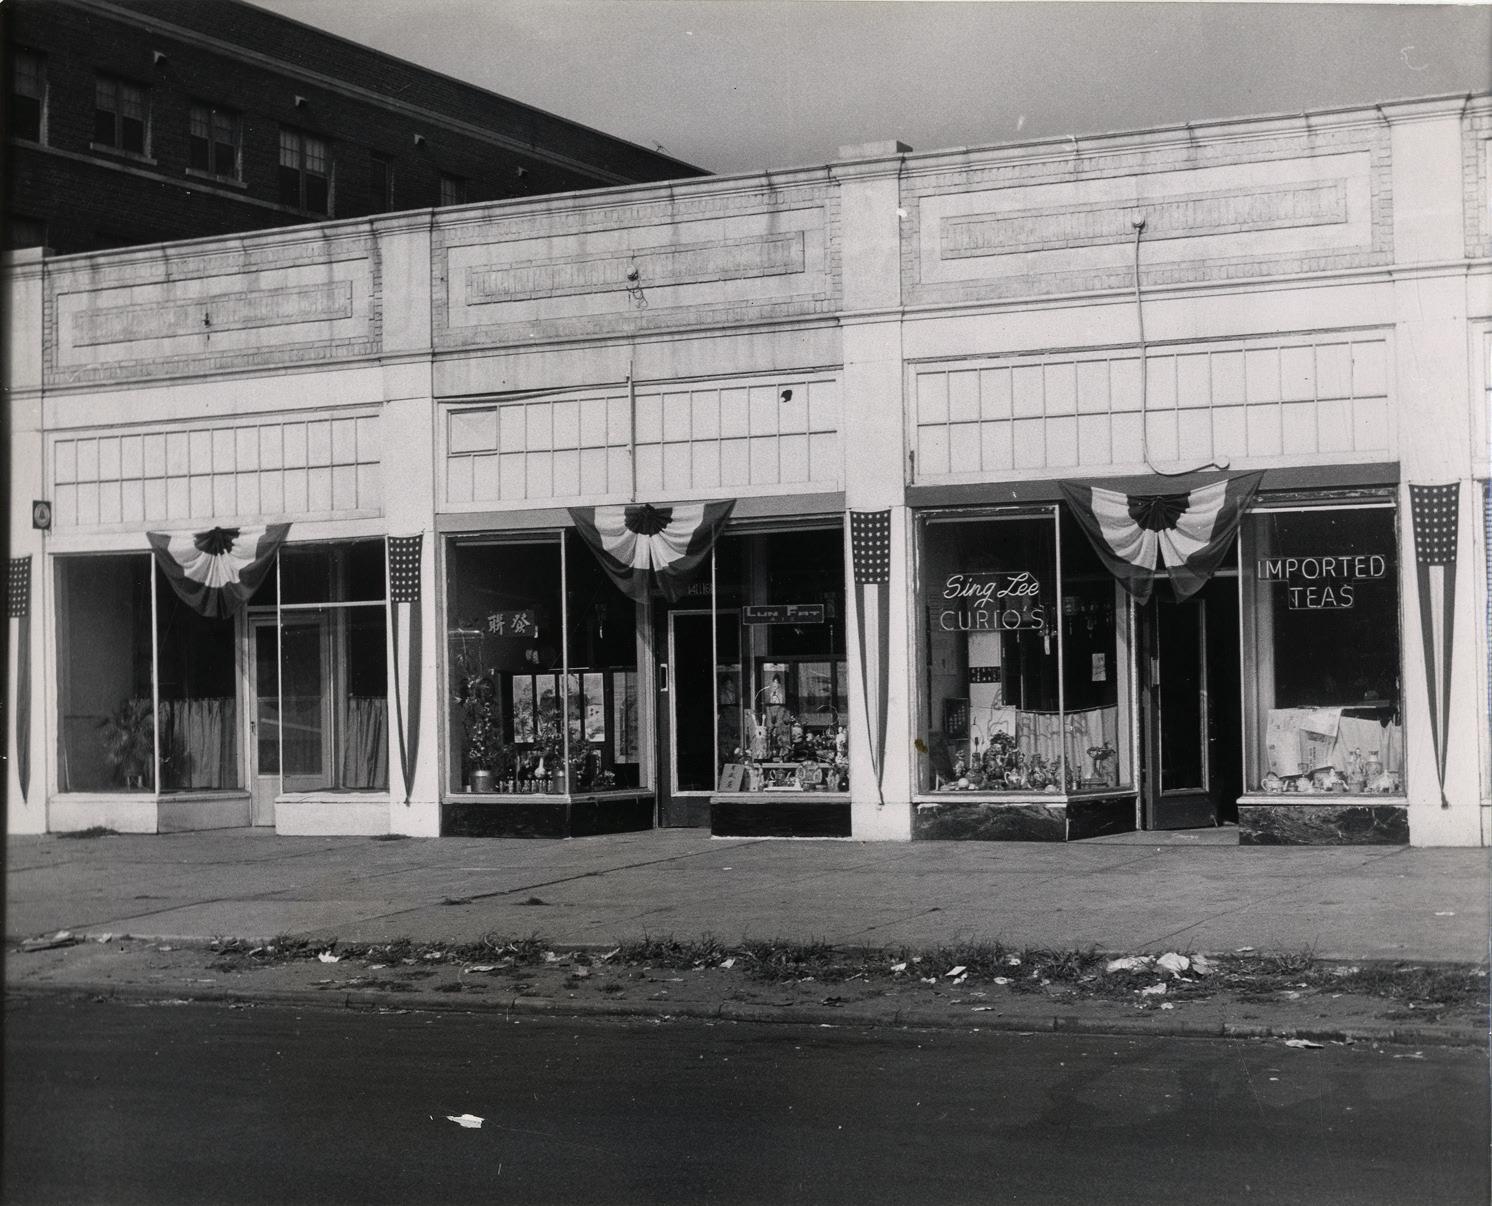
To make way for the M-10 and new commercial development, Chinese immigrants were forced to move from the original Chinatown at the corner of Third Avenue and Porter Street. This was a controversial move that hurt the thriving Chinese migrant community in Detroit. Chinatown was relocated to the corner of Peterboro Street and Cass Avenue.22
As large corporations and businesses followed the white population movement to the suburbs during the late 1960s and 1970s, many buildings in the Cass Park area became utilized by non-profit organizations or city agencies. The Kresge Corporation, for example, donated its building to the Detroit Institute of Technology after moving its administrative offices to Troy, Michigan in 1972. After the closing of the Detroit Institute of Technology, the building was renovated and became the Metropolitan Center for High Technology in the early 1980s. Additionally, the Fort Wayne Hotel was renovated and converted into the Americana Hotel during the 1960s, but was abandoned in the early 1980s.2
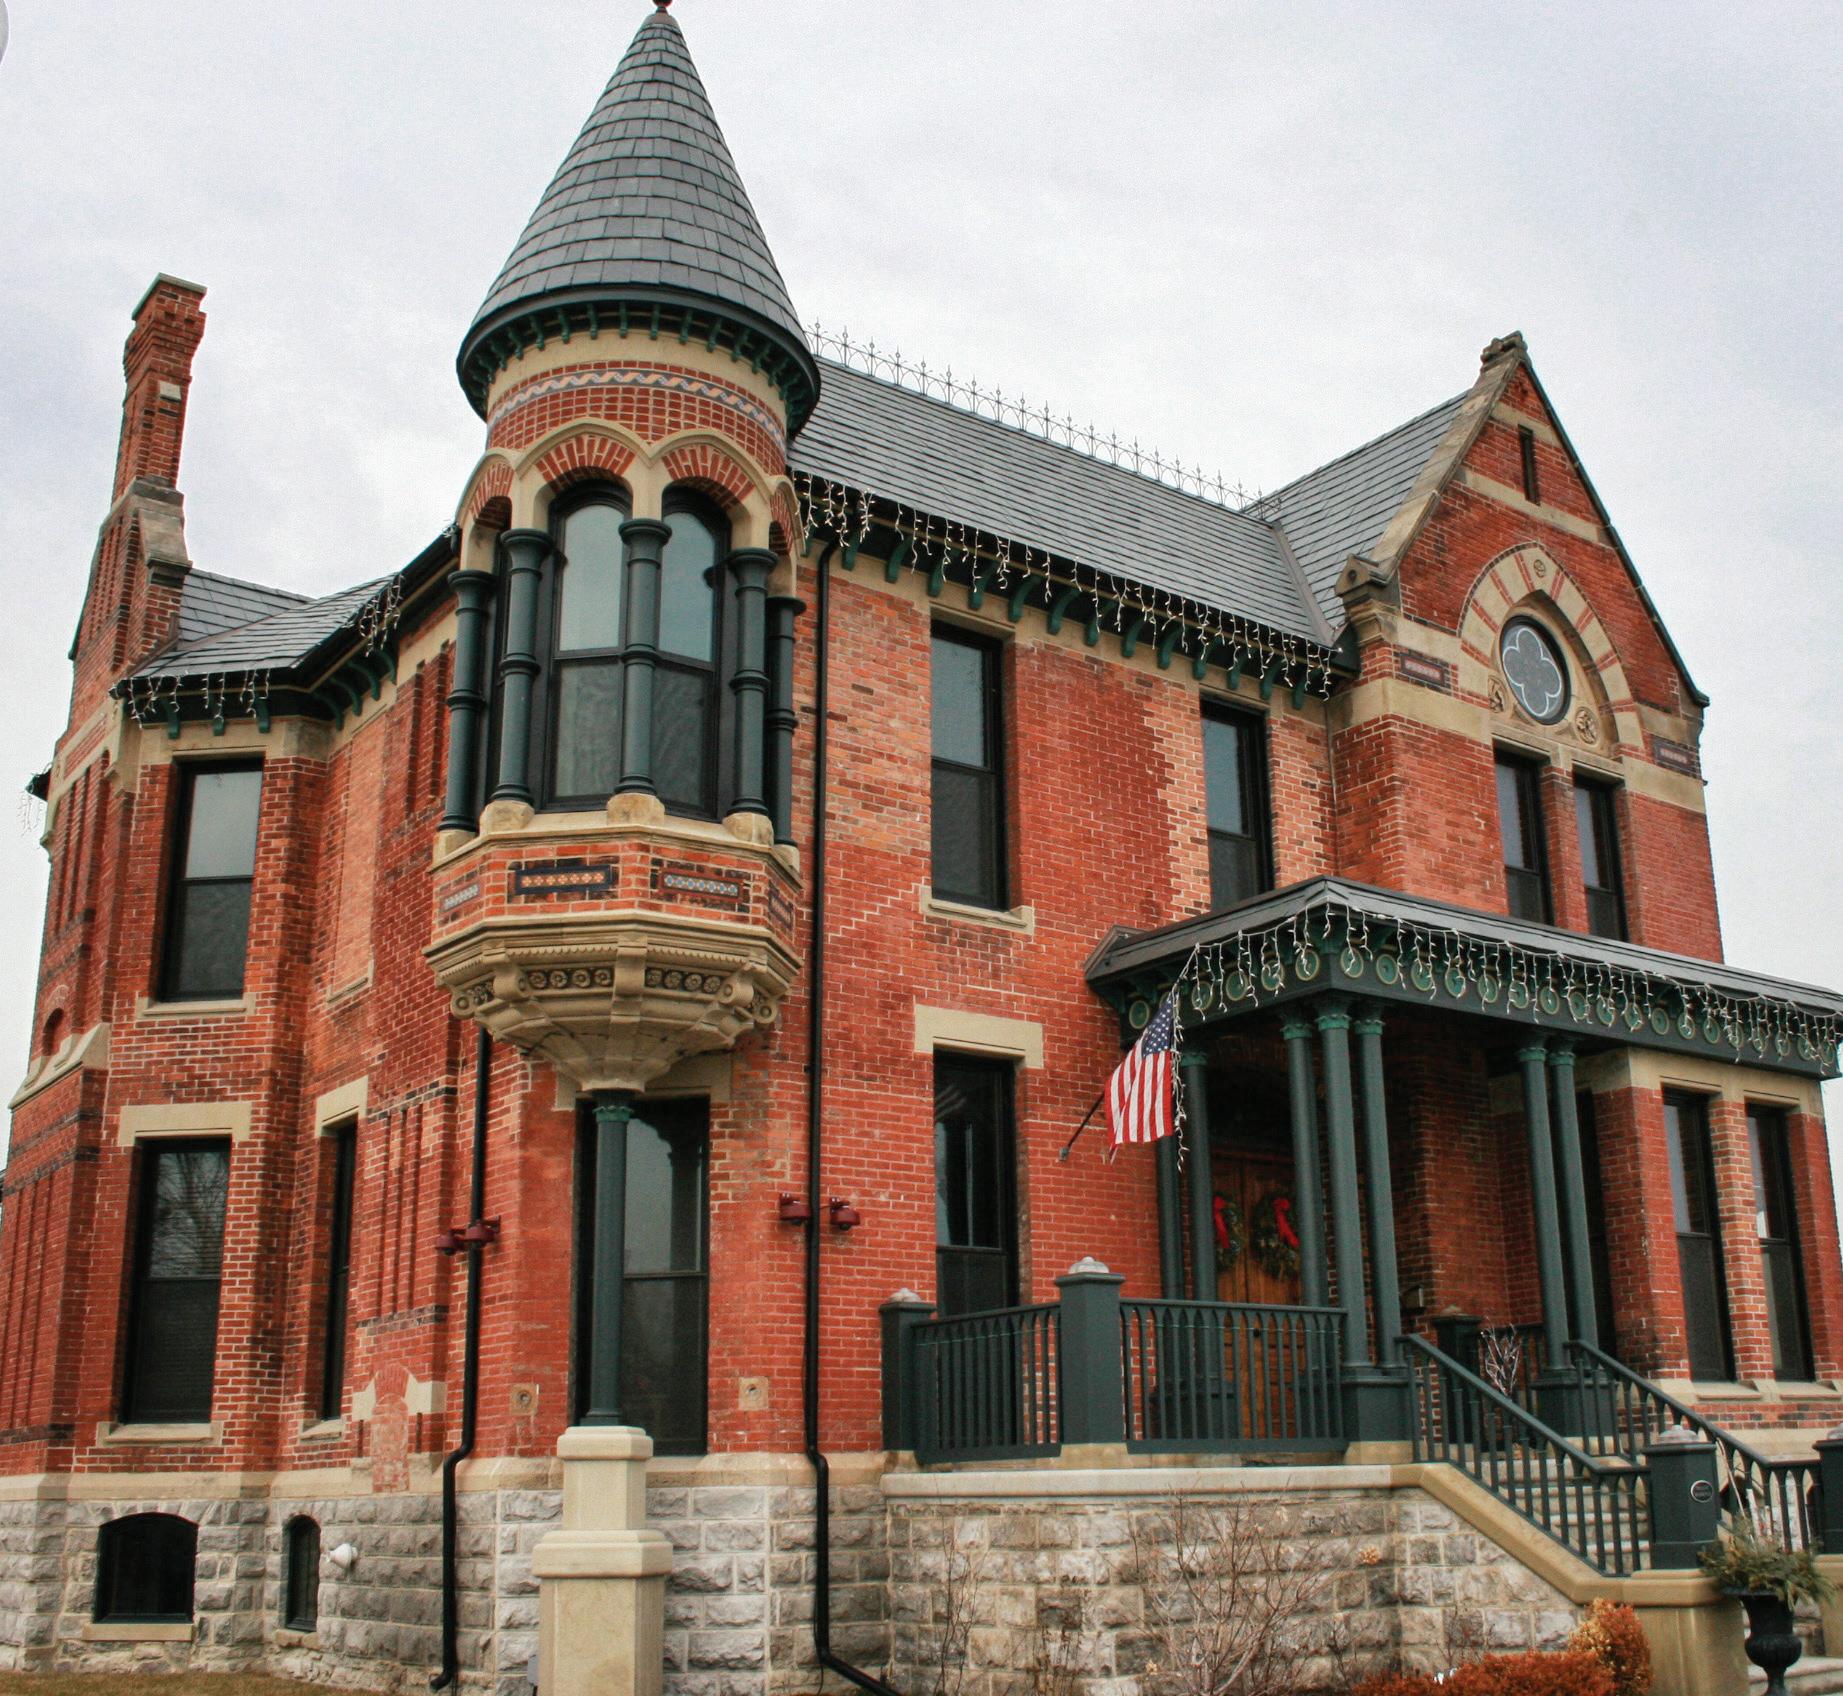
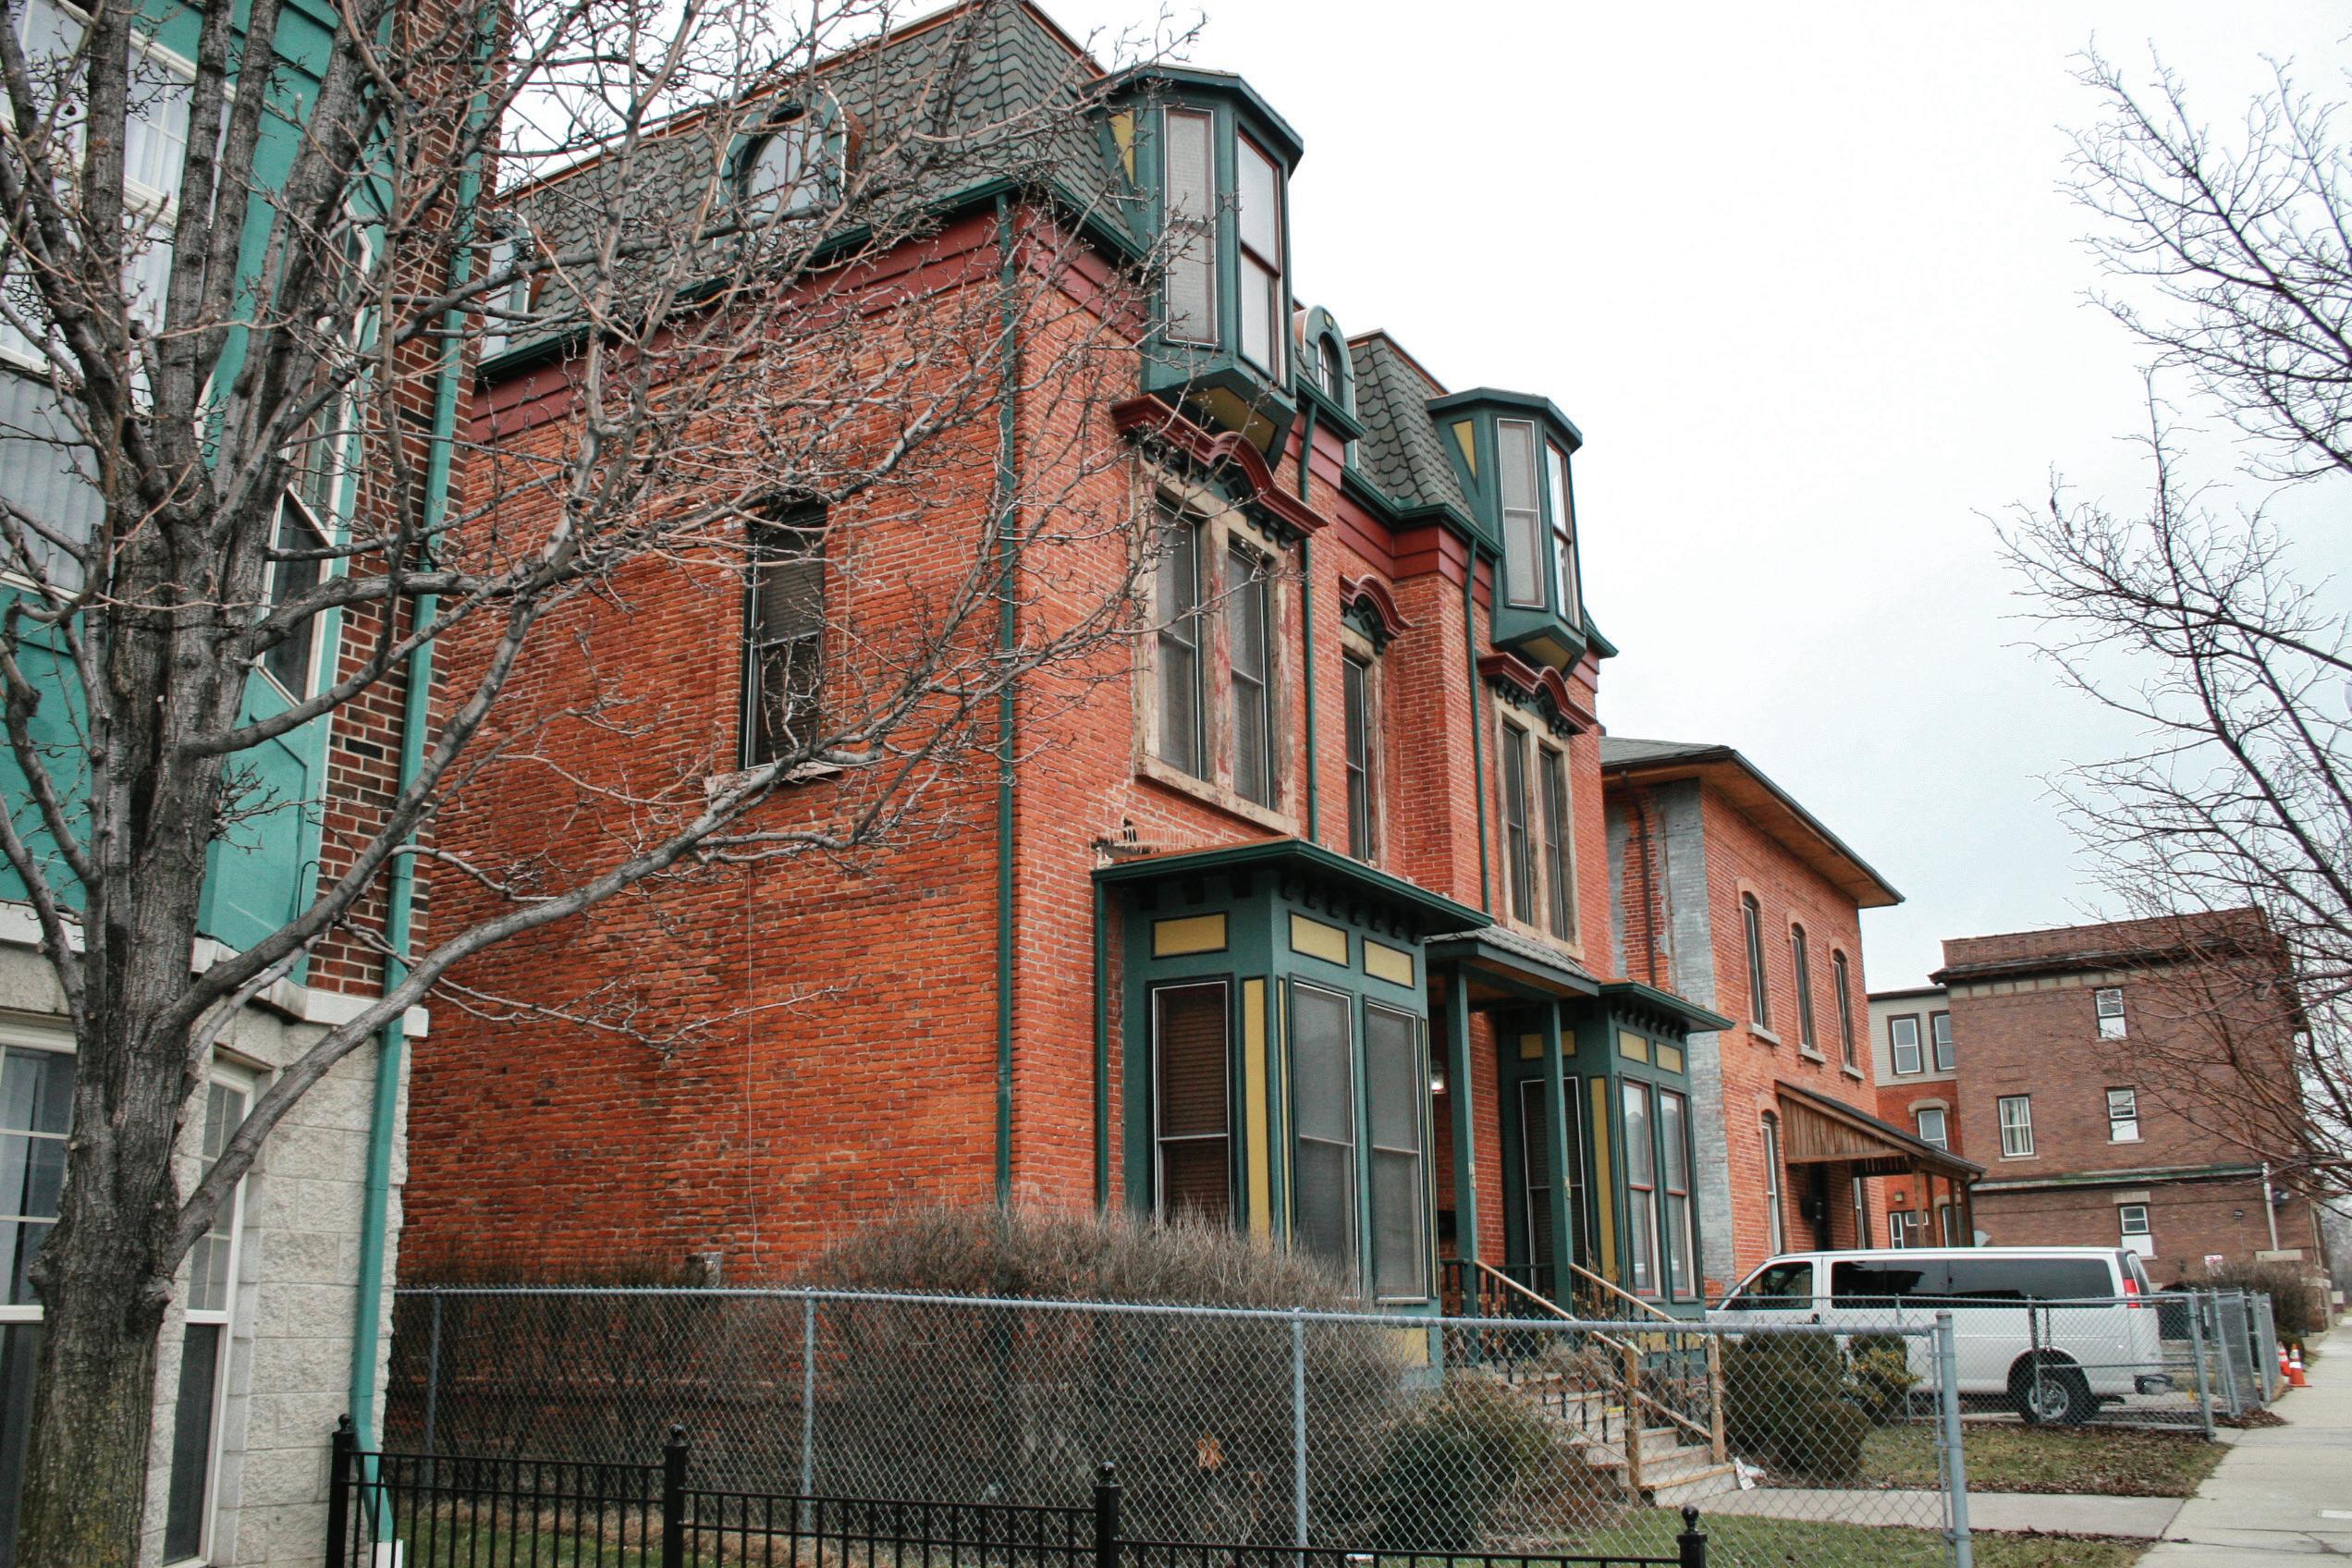
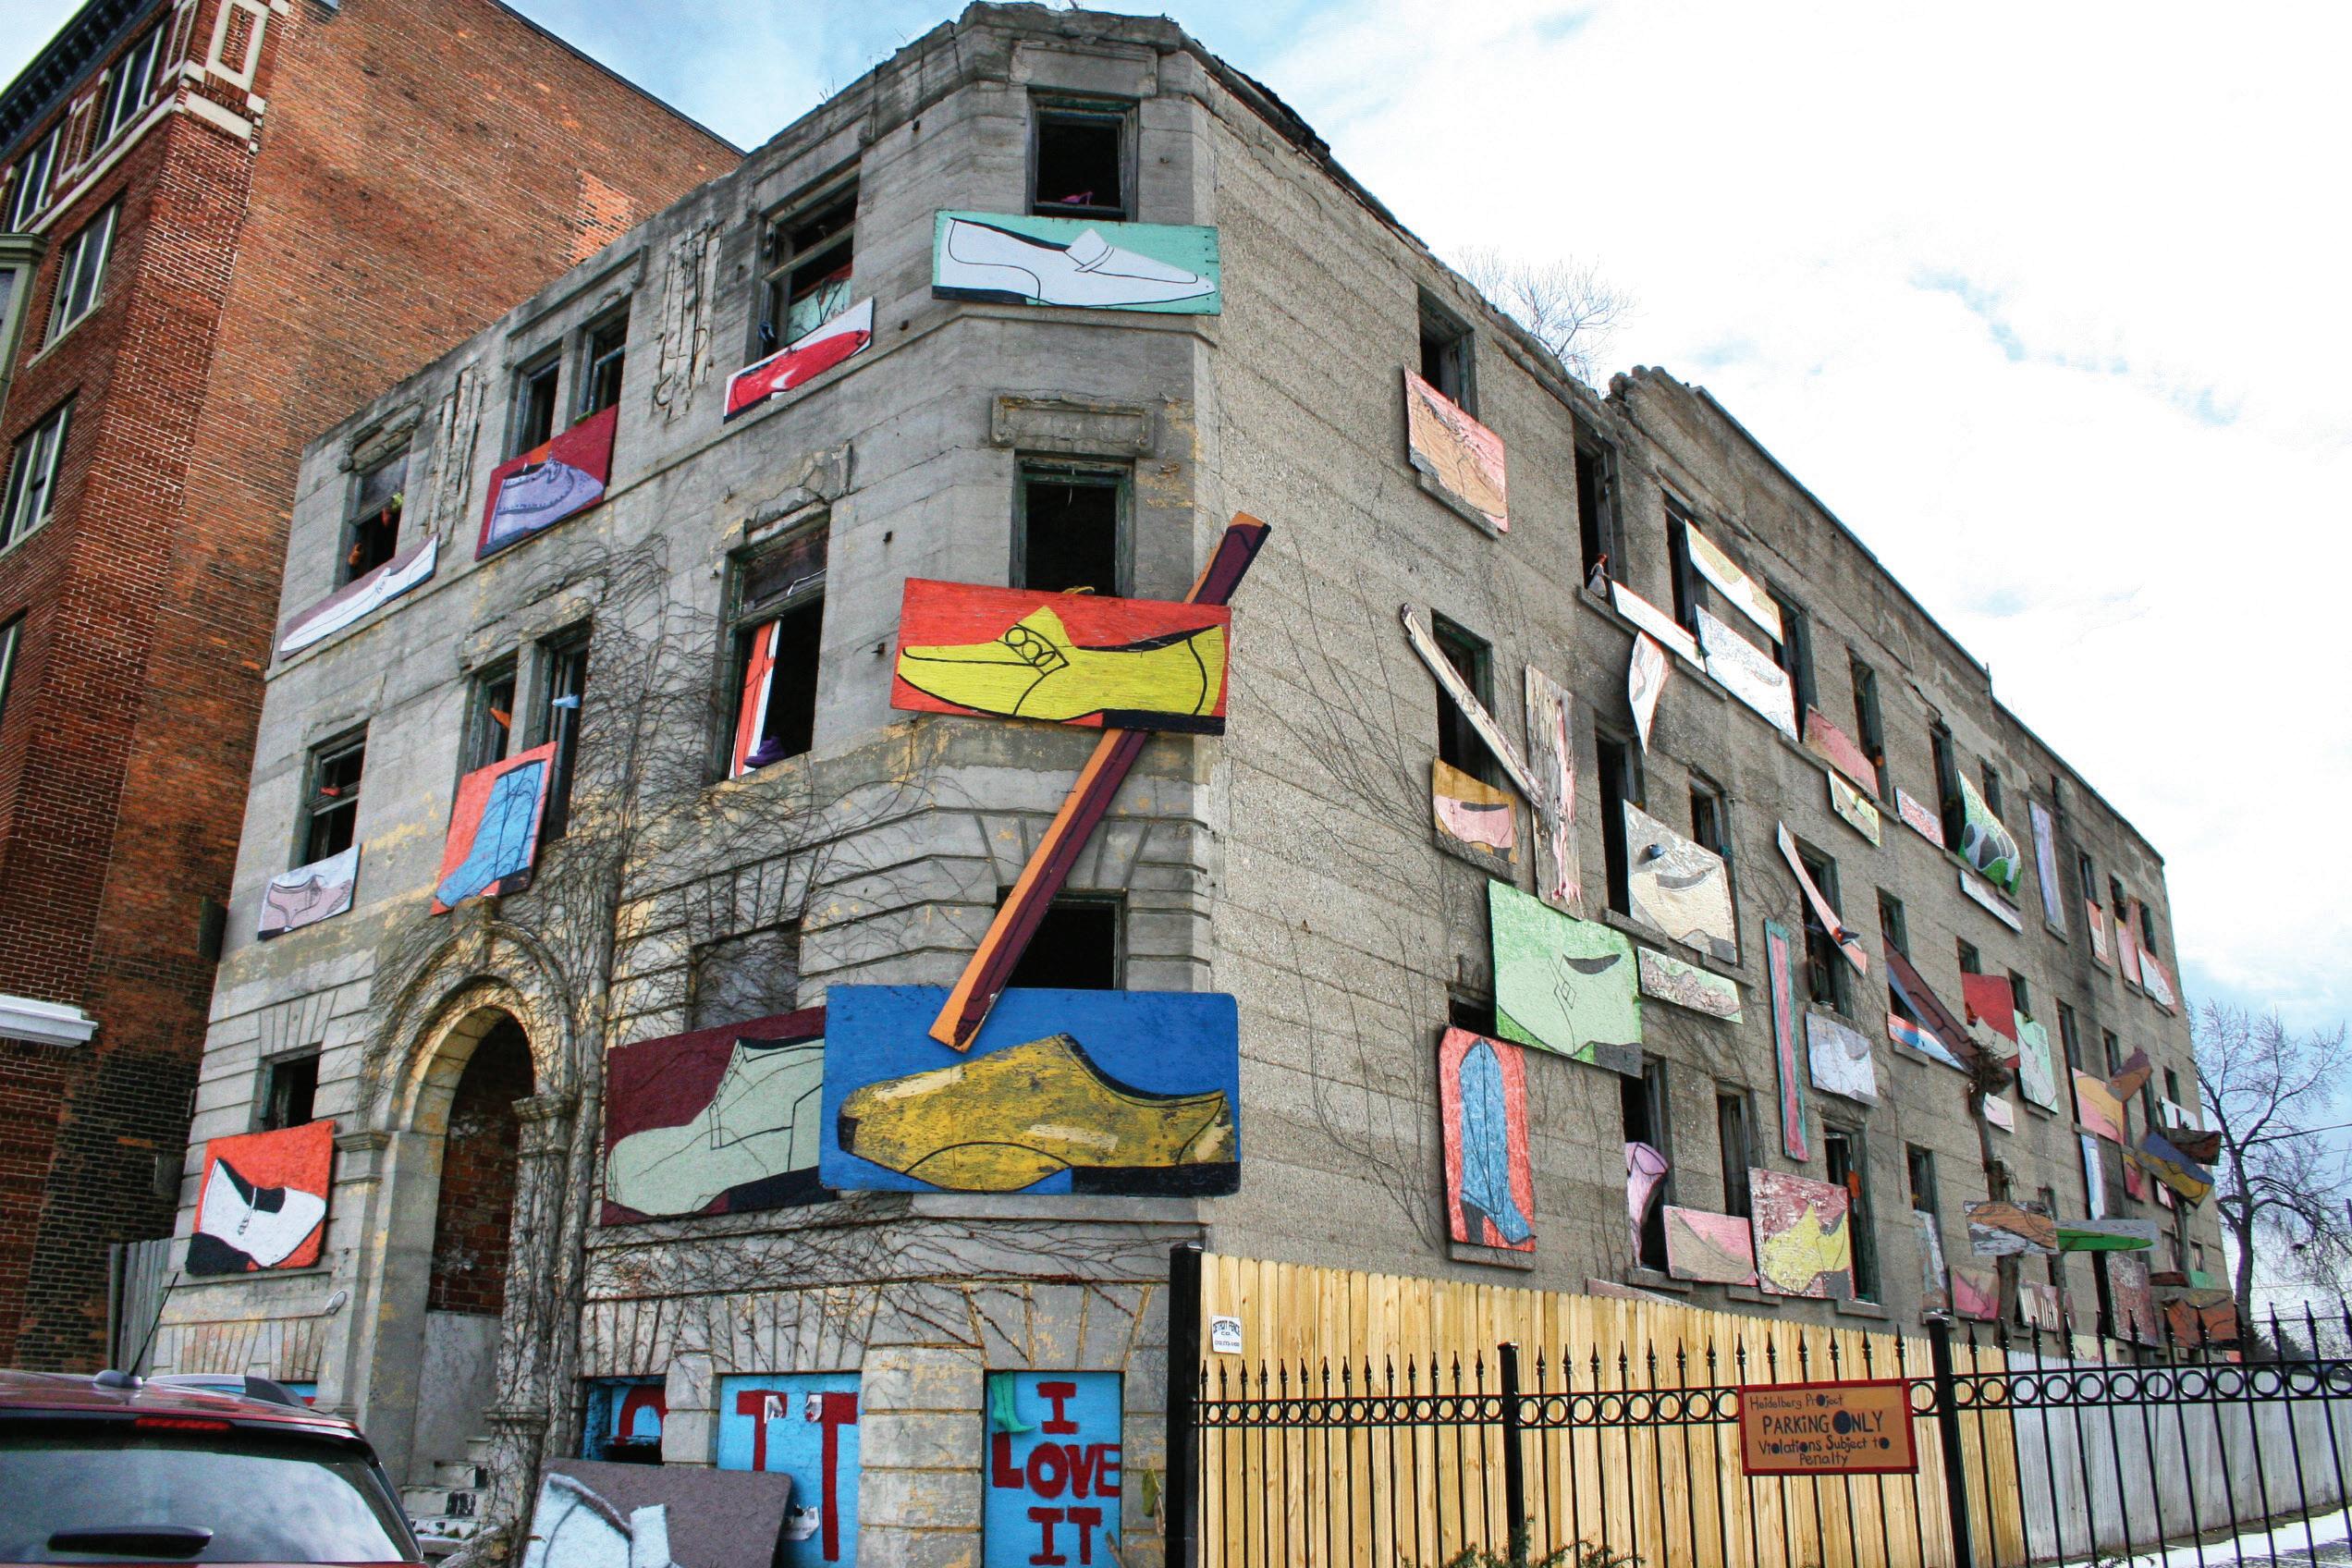
Large portions of Brush Park that once housed Detroit’s elite in Victorian mansions became increasingly vacant over time. In recent years, the neighborhood continued to see demolitions, as well as restorations and new construction. Over the years, many historic homes and some historic institutions in Brush Park have been demolished. The City of Detroit received state and federal grants to address blighted structures and used some of those funds to tear down a significant number of vacant properties in the area, as well.26 However, in recent years residents and institutions have sought to restore homes throughout the study area. For example, Albert Kahn’s house became the offices of the Detroit Urban League.27 Developers also constructed new multi-family apartments, condominiums, and senior housing in the area, including Woodward Place at Brush Park and Brush Park Manor.
Change has been a constant theme throughout the history of the LCBPA. With a history of both vibrancy and instability, the construction of Little Caesars Arena provides an opportunity for an assessment of current conditions in the study area. Looking toward today and tomorrow, this preliminary needs assessment will address the current economic, population, transportation, and residential changes now taking place throughout the LCBPA.
1 “Proposed Cass Park Local Historic District,” City of Detroit: City Council: Historic Designation Advisory Board, November 25, 2014, pg. 4.; David Hartman, “The Development of Detroit’s Cass Corridor: 1850-1975,” Ethnic Studies Division, November 1975, pgs. 1-2.
2 “Proposed Cass Park Local Historic District,” City of Detroit: City Council: Historic Designation Advisory Board, November 25, 2014, pg. 4.
3 ibid, pg. 5.
4 ibid, pg. 5.
5 ibid, pg. 5.
6 ibid, pg. 5.
7 “Proposed Brush Park Local Historic District Final Report,” City of Detroit: City Council: Historic Designation Advisory Board, 2010, pg. 4.
8 ibid, pg. 4.
9 “Cass Park, Detroit,” Detroit Publishing Co.: Library of Congress, 1880-1899, https:// www.loc.gov/item/det1994004620/PP/.
10 “Ransom Gillis Residence,” Burton Historical Documents, Accessed April 8, 2017, https://digitalcollections.detroitpubliclibrary.org/.
11“Industrial Detroit (1860-1900),” Detroit Historical Society, Accessed April 26, 2017, https://detroithistorical.org/learn/timeline-detroit/industrial-detroit-1860-1900
12 David Hartman, “The Development of Detroit’s Cass Corridor: 1850-1975,” Ethnic Studies Division, November 1975, pg. 4
13 ibid, pg. 4.
14 “Proposed Brush Park Local Historic District Final Report,” City of Detroit: City Council: Historic Designation Advisory Board, 2010, Page 4.
15 David Hartman, “The Development of Detroit’s Cass Corridor: 1850-1975,” Ethnic Studies Division, November 1975, pg. 4.
16 “Proposed Cass Park Local Historic District,” City of Detroit: City Council: Historic Designation Advisory Board, November 25, 2014, pgs. 6-9.
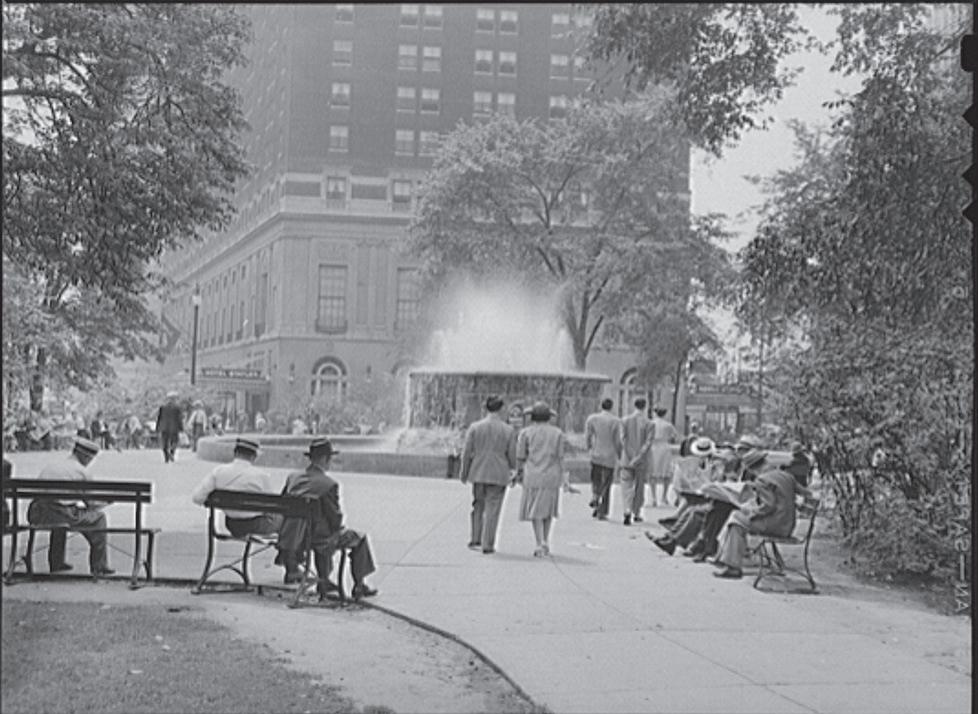
17 John Vachon, “Detroit, Michigan. Grand Circus Park,” Library of Congress, August, 1942, https://www.loc.gov/item/owi2001009340/PP/.
18 Roger Birona, “Detroit Michigan, new Masonic Temple, S.E. view,” Library of Congress, March, 1922, 30https://www.loc.gov/item/2005676208/.
19 Kenneth Schramm, “The P.C.C. Era in Detroit – Part 5: The Ending of an Era in Detroit and The México City Sale,” Detroit Transit History.info. Accessed March 18, 2017. http:// www.detroittransithistory.info/PCC/DetroitPCC-5.html.
20 Thomas Sugrue, The Origins of the Urban Crisis: Race and Inequality in Postwar Detroit: Race and Inequality in Postwar Detroit, (Princeton, N.J.: Princeton University Press, 2014), pgs. 47-48.
21 Thomas J. Manning, Redevelopment and race: planning a finer city in postwar Detroit, (Detroit: Wayne State University Press, 2013), pg. 68.
22 “Chinatown,” Ethnic Layers of Detroit: Wayne State University, Accessed April 9, 2017. http://www.clas.wayne.edu/ELD/Chinatown.
23 “Proposed Cass Park Local Historic District,” City of Detroit: City Council: Historic Designation Advisory Board, November 25, 2014, pg. 4.
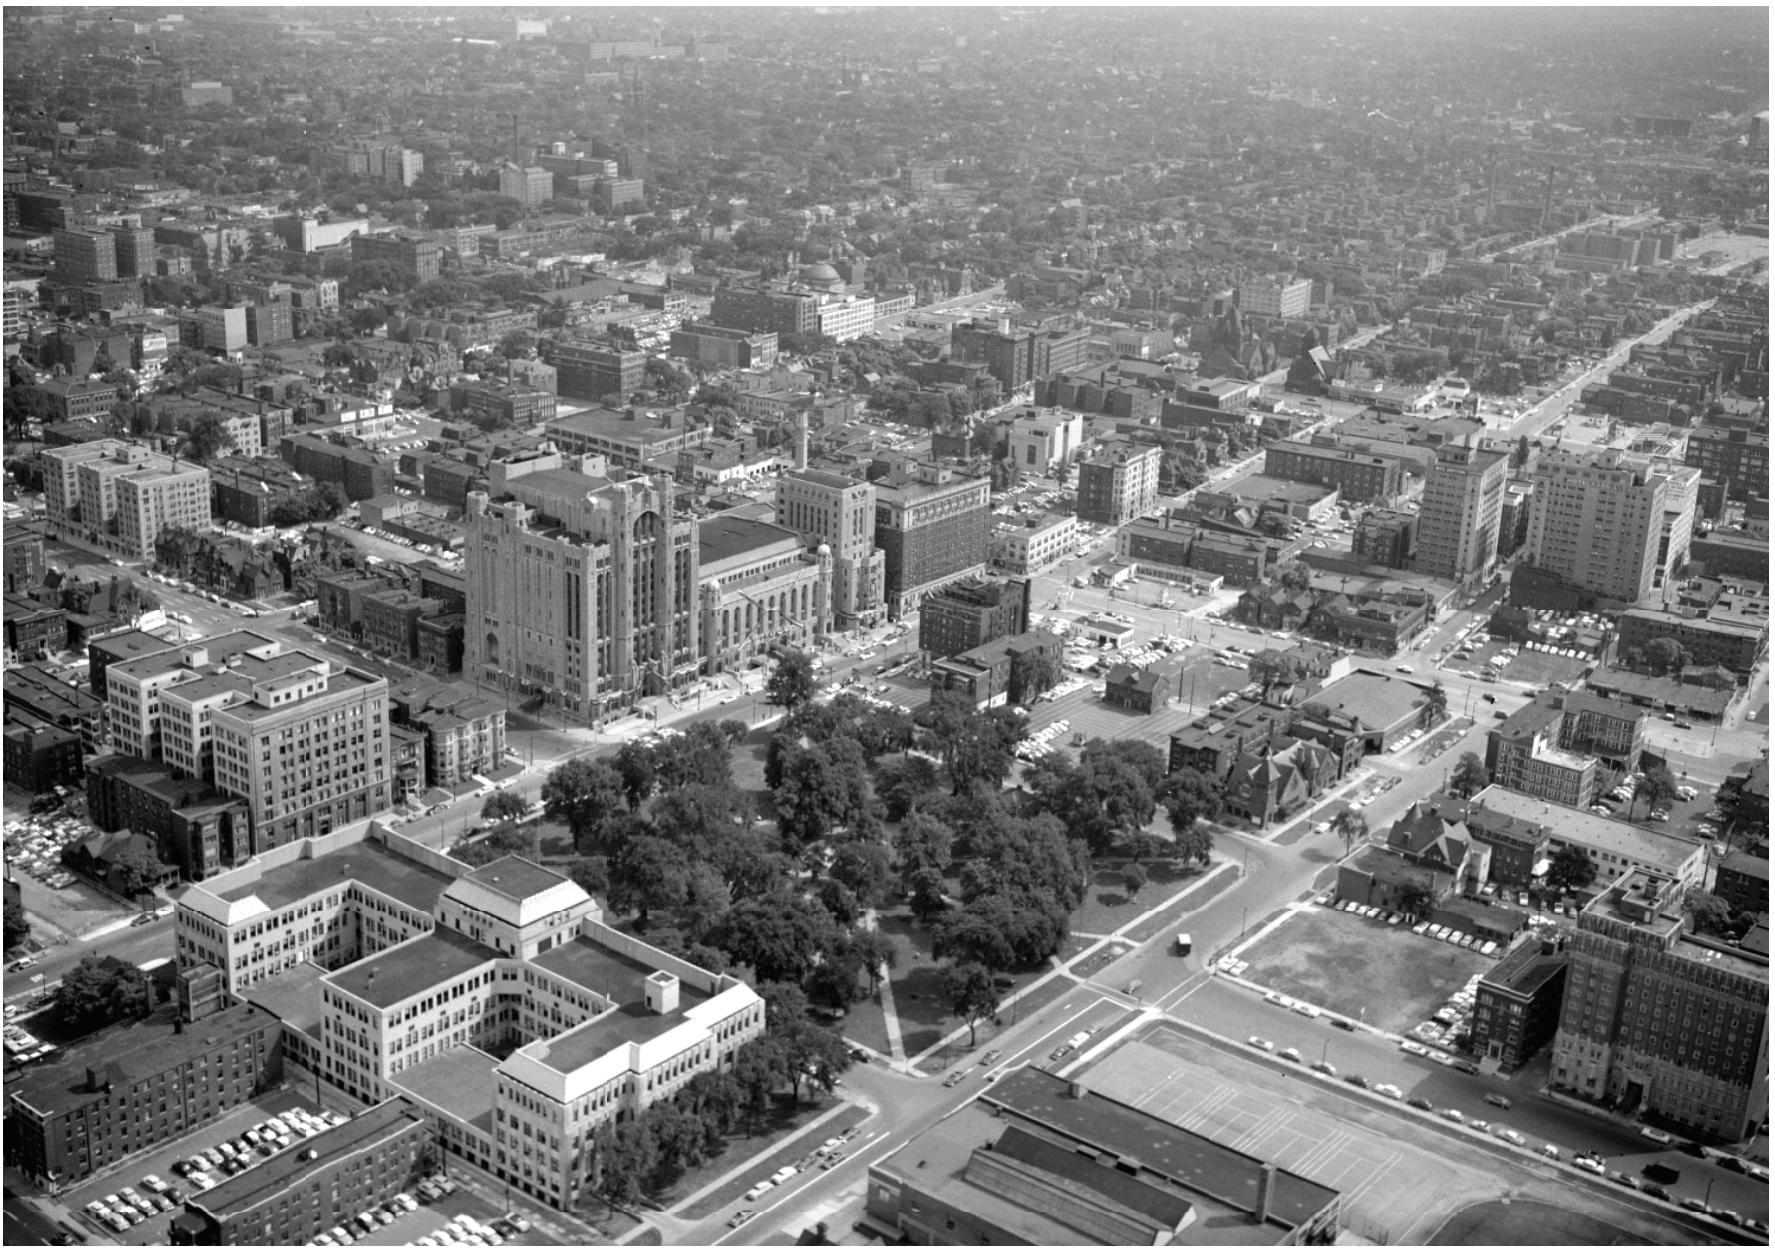
24 “Cass Park Aerial. 1956,” Virtual Motor City, Wayne State University: Detroit News. Accessed April 10, 2017.
25 “Chinatown Detroit,” Burton Historical Documents. Accessed April 8, 2017, http:// www.detroit.lib.mi.us/featuredcollection/burton-historical-collection.
26 “Proposed Brush Park Local Historic District Final Report,” City of Detroit: City Council: Historic Designation Advisory Board, 2010, pg. 4.
27 ibid, pg. 4.
Community engagement is a critical part of successful planning and development to ensure that plans reflect community needs and wishes. Engaging residents to understand community needs is especially important in the LCBPA due to the rate of change that will follow the opening of the Little Caesars Arena. The team focused on marshalling the perspectives of residents, workers, business owners, and other stakeholders in the Lower Cass and Brush Park Area (LCBPA) to ensure their opinions are considered in shaping the area’s future.
Multiple engagements with residents, business owners, and service providers across the study area informed this project. Meetings with members of the Neighborhood Advisory Committee (NAC) and a project advisory committee (PAC), as well as a stakeholder survey helped provide an understanding of the challenges and opportunities found within the study area.
The stakeholder survey was designed in concert with JFM Consulting and with the counsel of the PAC. This 31- question survey asked respondents to answer questions on the following topics:
• Availability and quality of services and amenities in the study area;
• Housing options and affordability;
• Transportation options
• Parking availability
• Safety; and,
• Perceptions of the potential impact of Little Caesars Arena.
The project team distributed the survey to residents, business owners, and service providers throughout the study area via collected community email lists, and through paper surveys distributed to area businesses, apartment buildings, and community groups between March 24 and April 5. In all, 221 responses were included in this analysis.1 An analysis of survey results is presented in the next section. The complete survey can be found in Appendix A.
In February 2014, the City of Detroit’s City Council authorized the creation of this committee composed of residents and area stakeholders to help guide the development of the area around the new arena. The project team met and communicated with the NAC regularly throughout the course of this project. Below is a timeline summarizing key dates:
January
• Initial meeting between the team and the NAC;
• NAC provided assistance in clarifying the scope of the project and provided feedback on study area boundaries;
• NAC members led the project team on a site visit to help familiarize the project team with the Lower Cass and Brush Park area;
February
• Project team presented NAC with proposed area boundaries;
• NAC provided feedback to the project team on an outreach strategy for the distribution of stakeholder survey; and,
March
• Project team presented preliminary results from streetscape survey.
The Community Needs Assessment Project Advisory Committee (PAC) was established by JFM Consulting Group to provide direction and feedback to the team and their own work which will continue beyond this project. It is made up of neighborhood leaders, business owners, local urban designers, and representatives from: the office of Detroit Council Member Raquel
Castañeda-López, the Detroit Economic Growth Corporation, Cass Technical High School, JPMorgan Chase, the NAC, and the City of Detroit Planning and Development Department. In the March PAC meeting, the PAC shaped the survey (see below) and advised the team on how to distribute it.
Throughout the project, stakeholders invited team members to several events and meetings, including:
25)
The United States Department of Housing and Urban Development coordinates an annual, nationwide survey to assess the number of homeless persons. Several members of the team assisted the 2017 count in Detroit, which is coordinated by the Homeless Action Network of Detroit (HAND). Team members accompanied professional social workers to distribute blankets, food, and to assist in finding spaces in area shelters for unsheltered homeless individuals. Through this experience, team members learned more about the temporary and supportive housing programs available within the study area, and throughout the city.
The day after the PIT Count, several team members conducted interviews at two locations in the study area where they asked homeless individuals about transportation options and their thoughts on how arena construction has changed the area.2
Professor Etienne was invited by an officer of the Brush Park CDC member to attend this meeting, where several development proposals were discussed. Etienne informed the meeting participants about the needs assessment project and encouraged participation in the stakeholder survey.
8)
One team member attended the March Ellington Condominium Association meeting. She introduced residents to the project and reached an agreement with the association’s leadership to distribute the stakeholder survey to residents.
Cass Tech High School’s Alumni Association hosts an annual pancake breakfast fundraiser. One team member and one faculty advisor attended the event and engaged a number of current Cass Tech faculty and staff members, as well as approximately 20 alumni. In addition, team members circulated an email sign-up sheet to faculty and staff to facilitate survey distribution.
The Brush Park Master Board Meeting provided an opportunity to reach out to the three homeowners associations in Brush Park #1, #2, and #3 as well as residents of the Garden Lofts and the townhomes. Attending this Master Board meeting facilitated outreach to an entire neighborhood for survey distribution.
This stakeholder survey was distributed to a convenience sample—not a randomized sample--of individuals who live, work, or own property in the area. With the assistance of the NAC, PAC, and JFM Consulting, the project team made an engaged and deliberate effort to distribute the survey to a wide array of area stakeholders to ensure that the results included a diversity of opinions and perspectives. Survey data collection was done in a two-week window during this preliminary phase of the community needs assessment. There was also a technical challenge with the online survey platform QuestionPro which was used to administer the survey electronically. During
the course of data collection throughout April 2017 data for two questions from the online survey were lost.3
In total, 125 respondents lived in the area, 85 worked and owned a business in the area, and 70 owned residential or commercial property in the area (See Figure 2.2).
Of the 174 respondents who reported their age, the majority were in the 25-49 age range (64 percent) and 50-74 age range (34 percent). 174 respondents reported their gender; 54 percent of respondents identified as women and 43 percent as men. Of the 172 respondents who reported their race, 48 percent identified as African American or Black, 36 percent identified as Caucasian and 9 percent identified as other.4
of Relationship to Area by Relationship to Area
Figure 2.1 Length of Relationship to Area by Relationship to Area
The survey asked respondents how long they had lived in the area as well as their income, both of which were then analyzed in conjunction with race. 35 percent of respondents who identified as African American or and 20 percent who identified as Caucasian had lived in the area for less than 3 years. There were more African American or Black respondents with a relationship to the area of more than 10 years than Caucasian. Most residents who responded to the survey had lived in the area for less than three years. However, of those who work in the area, most had a relationship with the area for over ten years.
The survey also asked respondents to self-report their annual income. Most of the survey respondents earn under $100,000 annually (67 percent). The two largest income categories for respondents who identify as Caucasian were $50,001-$100,000 and $150,001 or higher. For African Americans and Blacks, most survey respondents reported an income under $50,000.
To better understand local retail patterns, respondents were asked how often they frequent local businesses. 48 percent of survey respondents visited a business in the neighborhood once a week and 34 percent visited more than once a week.
RESPONSE COUNTS
TOTAL SURVEY RESPONSES: 221 SEVENTEEN LOCATIONS WERE INVALID OR BEYOND THE MAP EXTENT, AND ARE NOT SHOWN. SEVENTY-EIGHT RESPONDENTS DID NOT PROVIDE THEIR NEAREST CROSS-STREET.
MAP CREATION DATE: APR. 27, 2017
MAP AUTHOR: PROJECT TEAM
2.3 Satisfaction with Availability of Retail Goods by Income
2.4 Satisfaction with Quality of Retail Goods by Income
However, the rate of shopping for goods or services in the LCBPA dropped upon further analysis. More than 59 percent of respondents did less than 25 percent of their shopping within the LCBPA boundaries and only 4 percent of respondents shopped 76-100 percent locally. These numbers indicate that survey respondents had some interest in shopping within the LCBPA but existing stores do not meet all their needs.
The survey also included questions pertaining to “satisfaction with the quality” of local retail. Overall, half of the survey respondents stated that they were satisfied with the quality of retail goods available within the LCBPA, but
57 percent were dissatisfied with availability of retail options. However, respondents’ level of satisfaction varied by their reported incomes. 68 percent of respondents who reported earning $50,000 per year or less were satisfied with the availability of retail goods, compared to only 20 percent of respondents earning more than $50,000 per year. A majority of respondents earning $50,000 or less were also satisfied with the quality of retail goods and respondents earning more than $50,000 were evenly divided on satisfaction with quality of retail goods.
Without considering income, 24 percent of all respondents were very unsatisfied with the availability of grocery stores and 15 percent of all respondents were very unsatisfied with the quality of grocery stores in the LCBPA. Looking closer, 87 percent of residents earning over $50,000 were unsatisfied with availability of grocery stores, while 52 percent of respondents earning under $50,000 were satisfied with availability grocery stores. There were no trends by income with regard to quality of area grocery stores.
Over 70 percent of respondents reported that they were very satisfied or satisfied with the availability and quality of health care services in the LCBPA. These positive responses are likely due to the area’s proximity to the Woodward Corridor Family Health Center, Detroit Medical Center, John D. Dingell VA Medical Center, and Henry Ford Hospitals.
Likelihood of Moving Away by Income
I don't currently live in this neighborhood. Not likely at all
very likely
Perceptions of Parking Availability and Crime
Based on feedback from the NAC, the survey included questions about car
and parking availability in the study area. 81 percent of respondents in the study area identified as car owners. Nearly 60 percent of respondents were somewhat or very unsatisfied with the availability of parking and 55 percent were similarly unsatisfied with the quality of parking spaces. Of respondents who were unsatisfied with parking space availability, more than 58 percent reported having access to a private parking space and an additional 28 percent park in shared private lots. As the arena opens, perceptions of parking availability may change. (See Chapter 3 for analysis of available street parking and parking lots).
I don't currently live in this neighborhood. Not likely at all Not very likely Somewhat likely
Respondents shared positive responses about the overall impact the Little Caesars Arena would have, which the project team looked at in conjunction with respondents’ responses about their income. Overall, 90 percent of respondents shared the view that the Little Caesars Arena will have a somewhat positive (40 percent) to a very positive (50 percent) impact on the LCBPA. These responses did not show strong trends by income level; regardless of reported income, survey respondents had positive feelings about the impact of the Little Caesars Arena.
Likelihood to Remain/Move
Survey respondents were also asked about their likelihood of moving away from the LCBPA in the next 2-3 years, which the team examined in conjunction with race and income. The majority of respondents indicated that they are not likely to move away from the LCBPA. There were no trends observed in these responses by race or by income.
• The majority of survey respondents who lived in the area had been there for less than three years while the majority of survey respondents who worked in the area had been in the area for over ten years.
• The majority of survey respondents owned cars and were dissatisfied with parking availability regardless of where they currently park their vehicles.
• Respondents shopped frequently in the LCBPA but for a small portion of their overall retail needs.
• The impact of the Little Caesar’s Arena was viewed positively by the majority of respondents across all incomes.
1 Respondents were not required to answer every question so total response numbers will vary by question.
2 These interviews served to help orient the Project Team to the LCBPA, but were not formally recorded or used as primary data in this preliminary needs assessment.
3 Data were lost for Question 12, “Most days, how do you travel to or within the neighborhood?” and Question 20, “When you think about the impact of the Little Caesars Arena, what do you most want to see in the neighborhood? (Please ONLY choose 4 options).” were omitted from data analysis.
4 For the purposes of survey analysis, the categories Asian/Native Hawaiian/Pacific Islander, two races, and three or more races were combined into “Other”.
a Report Authors, Stakeholder Survey, April, 2017; Southeast Michigan Council of Governments (SEMCOG), “Roads,” Retrieved from Open Data Portal, Accessed May 1, 2017, http://maps-semcog.opendata.arcgis.com/ datasets?keyword=transportation&sort_by=relevance.
This chapter offers a profile of the study area as it exists today. A demographic profile of the Lower Cass and Brush Park Area (LCBPA) describes figures on people living in the area. Then, analysis focuses on different categories of conditions that affect day-to-day interactions, as well as larger systems that have long-range effects. Describing current conditions enables a robust understanding of community needs and assets and uncovers strategies that address these needs.
The analysis of current conditions incorporated information from U.S. Census Bureau’s American Community Survey (ACS) 2011-2015 5-Year Estimates, Point-in-Time count from the Homeless Action Network of Detroit (HAND), the City of Detroit’s Open Data Portal, proprietary data from spatial data and analysis company, ESRI’s, Business Analyst platform, and the U.S. Census Bureau’s On the Map platform which contains data from the Longitudinal Employment and Housing Dynamics Survey. The ACS 5-Year estimates from 2011-2015 offer the most precise and up-to-date demographic data available.
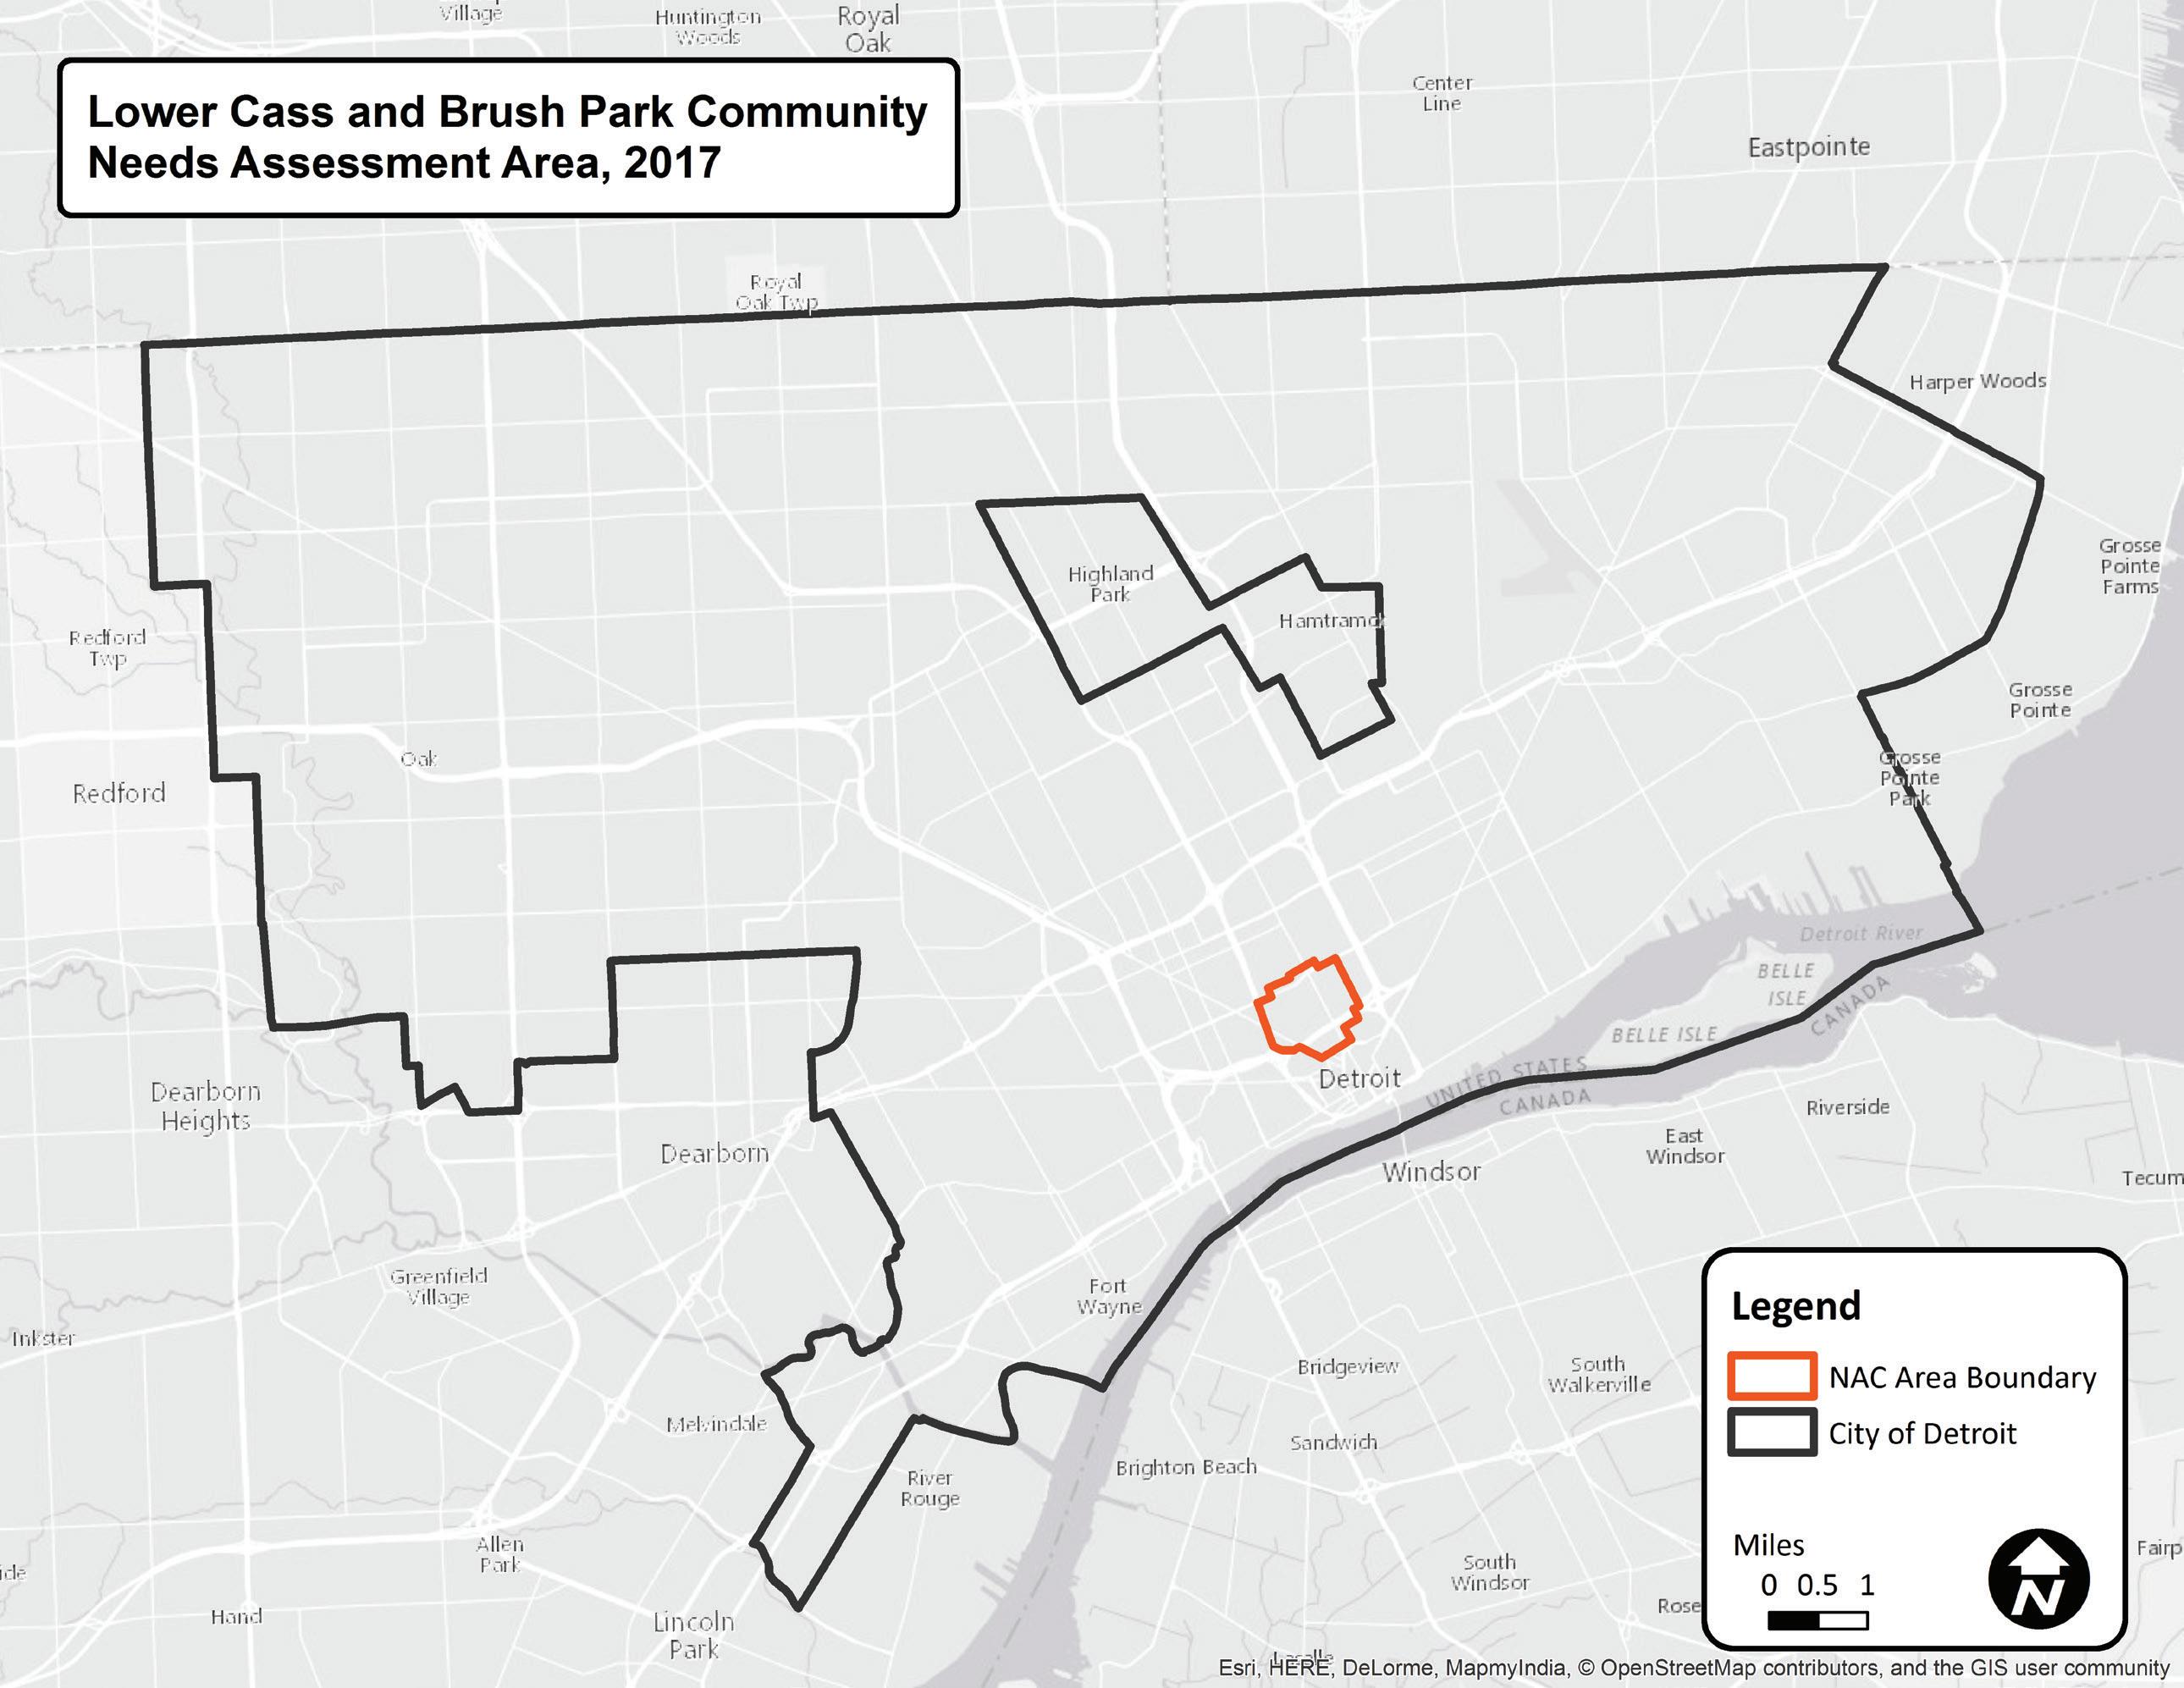
The boundaries of the LCBPA study area encompass five U.S. Census block groups within three census tracts: Census Tract 5173-Block Group 1, Census Tract 5225-Block Group 1, Census Tract 5225-Block Group 2, Census Tract 5225-Block Group 3, Census Tract 5207-Block Group 1. Block groups are divisions of census tracts, generally containing between 600 and 3,000 people. Block group data best represent this area, because the census tracts cover a wider geography.1
For clarity, the team grouped five block groups into three subareas: Brush Park (Census Tract 5173, Block Group 1), Lower Cass (Census Tract 5225 Block Group 1,2, and 3) and Grand Circus (Census Tract 5207, Block Group 1). Figure 3.1 shows boundaries of the five block groups and three neighborhoods.
During February and March, 2017, the project team executed parcel and streetscape surveys to assess parcel uses, building conditions, and sidewalk and road conditions within the LCBPA (See Appendix B). The team developed a parcel survey based on Data Driven Detroit’s 2014 Motor City Mapping project to compile an up-to-date inventory of all area properties.
Team members employed a second survey to record the location and condition of sidewalks, sidewalk ramps, free and metered street parking, bus stops, and bike lanes. Sidewalk segments and ramp locations were rated based on general compliance with the standards of the Americans with Disabilities Act.
Exploring the demographic data of the LCBPA allowed the project team to better understand the residents of the area and in turn to offer recommendations to address needs.2 Data discussed in this section include total population, race, age, household type, earnings, median household income, and poverty status.
The estimated total population of the LCBPA as of 2015, totaled 3,511, with the majority of residents living in the three Lower Cass block groups. While these three block groups were less densely populated than Brush Park and Grand Circus Park, they collectively represented 45.9 percent of the population (See Table 3.1).
Population trends in the LCBPA area reflected a greater decrease than in the City of Detroit as a whole. Between 2000 and 2010, the study area lost 2,044 residents while the City of Detroit, lost 237,493 residents4 5 These losses represented 53.9 percent and 33.2 percent respectively.
Table 3.1 Total Population, LCBPA, 20153
Understanding the racial composition and losses or gains in racial groups over the years is important for decision makers moving forward. Comparing decennial census data between 1990, 2000, and 2010, the African American population in the study area decreased from 2,647 individuals in 1990 to 1,319 individuals in 2010.6 Today, African Americans still comprise a higher percentage of the total LCBPA population than whites. The following census tracts were used for the decennial census: 1990—5205 and 5206; 2000— 5205 and 5206; 2010—5225 (See Table 3.2).
According to the 2015 5-year estimates, African American and White populations were 95 percent of the population. The most diverse block groups were Census Tract 5173, Block Group 1 in Brush Park and Census Tract 5225, Block Group 3 in Lower Cass.9 Whites were the second highest racial group, with a total of 1,302 individuals across all block groups.10 The total population for all racial groups were 3,511 for all block groups using 5-year 2015 estimates. The total population included other racial groups such as Asian, Native American, and Pacific Islander (See Figure 3.2).
There is a higher percentage of males in the study area than in the City of Detroit as Table 3.3 by total block group indicates. This percentage aligns with stakeholder survey results, as described in Ch. 2.
Looking at household structure, it appears that few family households lived in the study area. The Table 3.4 percentage of households by household types indicates that 55.7 percent of households in Census tract 5225, Block Group 1 in Lower Cass were families.12 This is the highest rate in the LCBPA. Other block groups average only about 3 percent family households.13 Fewer children below 17 years of age lived in the area compared to the City of Detroit as a whole, with 7.6 percent in the LCBPA and 25. 4 percent in the City of Detroit (See Table 3.5). A diversity of age cohorts in neighborhoods can lead to population stability and patrons for different retail goods or amenities.
Table 3.4 Percentage of Households by Houshold Type, LCBPA and City of Detroit, 201514
Block Group 1 1 1 2 3
No Wife
Households with earnings indicates that at least one member of the household has a steady income, which is important for Census Tract 5173, Block Group 1 in Brush Park and Census Tract 5225, Block Group 1 in Lower Cass, both of which had close to 70 percent of households with earnings in 2015.16 Census Tract 5225, Block Group 2 in Lower Cass, had the lowest proportion of households with income in the study area, with 24.5 percent of households without earnings.17 Households without earnings receive some form of government assistance (See Table 3.6).
3.5
Learning more about how residents receive income or assistance to live in LCBPA is crucial when identifying potential needs and access to resources. Census Tract 5173, Block Group 1 in Brush Park had 97.9 percent of households not receiving public assistance.19 Conversely, Census Tract 5225, Block Group 1 in Lower Cass included 51.2 percent of households receiving public assistance.20 Census Tract 5225, Block Group 1 also contained the highest percentage of family households at 55.7 percent.21
This overlap is notable because a concentration of households with children who receive public assistance deserves special consideration when community needs are assessed (See Table 3.7).
Table 3.7 Other Household Earnings by Type, LCBPA and City of Detroit, 201522
3.8 Median Household Income in the Past 12 Months, LCBPA, 201526
Differences in median household income provide a snapshot of the economic realities within the LCBPA. The highest median income was $48,207 in Census Tract 5173, Block Group 1 in Brush Park, and the lowest was $9,239 in Census Tract 5225, Block Group 2 in Lower Cass.23 Median household income in the past 12 months across all block groups was $16,147, as of
2015.24 Comparatively, the median household income in the City of Detroit was $25,764, with the national median at $53,889 (See Table 3.8 and Figure 3.3).25
The lowest percentage of earned income, 24.5 percent, is in Census Tract 5225, Block Group 2 in Lower Cass. This block group has 46.1 percent of households receiving Supplemental Security Income, many of whom have no retirement income nor public assistance. In fact, 93-95 percent of residents in all three block groups in the Lower Cass area do not receive public assistance.
All LCBPA block groups show high percentages (85-94 percent) of households not receiving retirement income, despite the fact that nearly 13 percent of residents are over the age of 65.27
More than 68 percent of all families in the Lower Cass area lived below the federal poverty line in 2015.28 For a family of three, an income below $20,420 places that family 100 percent below the federal poverty line.29 Conversely, families in Brush Park and Grand Circus Park ranked nearly 70 percent above the poverty level.30 Poverty rates are the lowest in Brush Park, where less than 24% of families lived below the poverty line (See Table 3.9).31
• Lower Cass is the largest proportion of the study area by geography and population.
• African Americans are the largest racial group in the LCBPA but the proportion of Whites has been steadily increasing since 1990.
• Brush Park is economically stable with a high proportion of households with earnings and not receiving public assistance and a high median household income.
• Lower Cass shows a higher percentage of residents below the poverty level and low median household incomes.
FIGURE 3.3
Affordable housing not only fulfills a basic human need for shelter and contributes to the wellbeing of individuals and families, but also is important for the economic vitality of a neighborhood. Accordingly, the project team assessed the housing needs in the LCBPA through analyzing a variety of housing characteristics, as well as the affordability of housing in the area. Subsidized housing data came from the Michigan State Housing Development Authority (MSHDA) and the United States Department of Housing and Urban Development (HUD).
Overall, as of the 2015 ACS release, there were an estimated 3,645 housing units in the LCBPA, or one percent of the city’s housing units. Of these, 1,220 units were in Grand Circus Park and accounted for one-third of units in the study area (See Table 3.10).
MAP CREATION DATE: APR. 27, 2017
MAP AUTHOR: PROJECT TEAM
Table 3.10
Housing Units, LCBPA and City of Detroit, 201533
Table 3.11 Housing Units in Structures, LCBPA and City of Detroit, 201534
In the LCBPA, much of the area’s housing units existed in multi-family structures. Only 11.1 percent of units were in single-family houses, while 19.1 percent units were in buildings with 20 - 49 units and 57.2 percent of units were in buildings with more than 50 units (See Table 3.11).
Table 3.12 Year Structures Built, LCBPA, 201536
Overall, the median year that structures in the LCBPA were built is 1940.35
The median year that structures in Brush Park were built was 2000 while the median year that structures were built in Grand Circus was 1939. Of all residential buildings constructed in the LCBPA before 1950, 49.7 percent of them were in the Grand Circus; of those constructed between 1950 and 1999, 57.2 percent of them were in Census Tract 5225, Block Group 2 in Lower Cass area (See Table 3.12). In Brush Park, over 52.5 percent of housing units were built between 2000-2009. These units alone accounted for 11.0 percent of units in LCBPA.
According to 2015 ACS estimates, a total of 2,156 occupied housing units and 1,489 vacant units existed in the LCBPA. Overall, the occupancy rate in the study area was 59.1 percent, a relatively low rate compared to the city’s overall occupancy rate of 70.0 percent (See Table 3.13). Brush Park had the highest occupancy rate (82.5 percent) while both Lower Cass and Grand Circus had lower-than-average occupancy rates. In Lower Cass, the most occupied housing units were in Census Tract 5225, Block Group 2 (See Figure 3.4).
Of the vacant units in 2015, 31.3 percent were for rent or listed as rented but not occupied, 6.2 percent were for sale or listed as sold but not yet occupied, and 60.4 percent were classified as “other vacant.” Project team members observed several possible reasons for the high percentage of other vacant units during their site visits in 2017. Many housing units appear to be in the process of construction, or renovation, or look recently abandoned, or demolished. Of note, 51.4 percent of vacant housing units in Grand Circus were for rent (See Table 3.14).
Home ownership in the LCBPA trended significantly low when compared to the city of Detroit (See Table 3.15). Within the LCBPA, the largest portion of owner-occupied housing units were in Brush Park, where many townhomes were built in the 2000s.
Table 3.13 Occupancy Status, LCBPA and City of Detroit, 201537
Table 3.14 Vacancy Status, LCBPA and City of Detroit, 201538
The median 2011-2015 estimated gross rent40 in the study area was $464, which was 37.9 percent lower than the city’s median gross rent of $747.
Across the five block groups, there were a range of median gross rents. Grand Circus and Brush Park had the highest median gross rents of $597 and $566, respectively. Census Tract 5225, Block Group 2 in Lower Cass had the lowest median gross rent of $252 per month (See Table 3.16).
More than half of rental units in the LCBPA were reported to have had 2015 monthly rental rates of less than $500, which is very high compared to the citywide rate of only 18% below $500 (See Figure 3.5). Of the units renting for $1,000 or more, 90.1 percent were in Brush Park and Grand Circus.42
Percentage of Rental Units Grouped by Gross Rent, 2011-2015
The median housing value for owner-occupied housing units, 14.2 percent of units in the study area, was $115,147 while the median housing value for the city of Detroit was $42,300 (See Table 3.17). Of the owner-occupied housing units in the LCBPA, 70.0 percent were financed with a mortgage, home equity loan, or similar debt.45
Around 59.9 percent of renter households in the study area were costburdened in 2015.46 Around 51.4, 37.7, and 10.9 percent of those considered to be cost-burdened households lived in Lower Cass, Grand Circus, and Brush Park, respectively.47 The data also show that households earning less than $10,000, which represent 45.4 percent of total renter households, were the most cost-burdened (See Figure 3.6). As with most
areas, as household incomes increase, the rates of cost-burdened households decrease. However, it is important to note that these figures include households residing in subsidized housing and/or receiving rental assistance.
The area median family income (AMFI) for the Detroit-Warren-Livonia Michigan metro area was $67,700 in 2015.53 Within the study area in 2015, at least 1,650 households earned at or below $54,26054, 80 percent of the AMFI, a common standard used to determine who qualifies for incomerestricted housing. This represents 76.5 percent of the households in the study area, which is similar to the citywide rate of 75.1 percent. 55 According to data collected from HUD and MSHDA (Michigan State Housing Development Authority), there were 634 income-restricted housing units in the study area in 2016 (See Table 3.18). Of these units, 41.5 percent were income-restricted through the Low-Income Housing Tax Credit (LIHTC) program. The LIHTC program is a significant source of affordable housing (See Figure 3.7). However, by design, the long-term affordability of LIHTC units is not guaranteed after the 15-year period of
Number of Households
Figure 3.6
Cost -Burdened Renter Households (ACS, 5YR, 2015)
Renter Households, LCBPA, 201548
compliance.56 Consequently, the LCBPA community is at risk of losing many of their affordable housing units in the future, unless local organizations are able to maintain funding to continue to subsidize rental costs. In the study area, there are 263 active LIHTC units (See Table 3.18). Since 2012, 486 LIHTC units in the study area have expired.57 Further research is needed to discover whether these units remained affordable after their LIHTC credits expiration.
Table 3.18 Housing Subsidy Programs by Number of Units, LCBPA, 201652 Subsidy Program Number of Units
LIHTC: Expire in 2019
in 2020
in 2025
Expire in 2026
Section 221(d)(4) New Construction / Substantial Rehabilitation49
Section 202 Capital Advance for Elderly50
According to HUD, “[LIHTC] provides a subsidy to private developers of affordable housing through the federal tax code… Properties must meet one of two criteria to qualify for tax credits:
• Either a minimum of 20 percent of the units must be occupied by tenants with incomes less than 50 percent of Area Median Income (AMI) [i.e. $33,850 for Detroit in 2015],
• or 40 percent of units must be occupied by tenants with incomes less than 60 percent of AMI [i.e. $40,620 for Detroit in 2015].
These affordability restrictions remain in place for a minimum of 15 years.”58
• Around 85.8 percent of households in the LCBPA were renters in 2015. Of those households, 59.9 percent spent more than 30 percent of their income on housing costs.
• The 2015 housing vacancy rate in the study area was around 40.9 percent while the citywide housing vacancy rate was 30.0 percent.
• Though the LIHTC program is highly utilized in the study area, the community is at risk of losing significant affordable housing units in the future as many LIHTC units are approaching Year 15 of their respective terms.
The project team created profiles of the LCBPA’s business sector and area employment in order to examine the number of area businesses by sector, available retail amenities, demand for new retail services, and employment and labor force information that will complement data gathered in the stakeholder survey (See Chapter 2).
To create these profiles, the team gathered proprietary information from ESRI’s Business Analyst59 to assemble an up-to-date count of operating businesses in the study area. Additionally, the team examined the retail trade sector to analyze the number and types of small businesses and to understand market potential through an analysis of leakage/surplus factor in the area.
The top 5 major industry sectors in 2016 were: Other services (Except Public Administration) (16.6 percent), Professional, Scientific & Tech Services (13.9 percent), Accommodation & Food Services (11.1 percent), Healthcare Health Care & Social Assistance (8.6 percent) and Retail Trade (8.6 percent) (See 3.19).60
There are currently 31 retail establishments throughout the LCBPA. Grocery stores and corner markets account for 9 of the 31 retail establishments (See Table 3.20).
To present information on the amount of additional retail that could be developed in the area, the project team used leakage/surplus factor. Leakage represents a shortage of supply of goods or services for local shoppers. Thus, these local dollars “leak” out of the area being examined when local people need to shop outside the area to satisfy their demand. Surplus represents an excess market supply of goods or services for local shoppers (See Figure 3.8).
A positive leakage/surplus factor indicate that there are insufficient retail options in those sectors to satisfy demand, while a negative score indicates a surplus.
Health & Personal Care Stores, Clothing Stores, and Grocery Stores all had positive leakage/surplus factors, which indicated that the area met only a portion of local demand for health & personal care stores, clothing stores and
Table 3.20 Retail Business Profile, LCBPA, 201664
by NAICS Code, 2016
grocery stores. This indicates that area residents must shop in other areas to meet all their needs for this type of retail needs.
Conversely, Restaurants/Other Eating Places, Drinking Places, Office Supplies, Stationery & Gift Stores, Electronics & Appliance Stores, and Beer, Wine & Liquor Stores all had negative leakage/surplus factors. These negative values indicated that the LCBPA had a surplus of retail options across these sectors compared to local demand.
is a key characteristic in determining the vibrancy of a community. As of 2015, the population of those over sixteen in the study area was 3,336.66 Of the 3,336, 7.8 percent were unemployed and 49.9 percent were not in the labor force, which indicates that these individuals were neither employed nor actively looking for employment.67 In the City of Detroit as a whole, the unemployment rate was 13.2 percent and 47 percent
Electronics & Appliance Stores
Restaurant/Other Eating Places
Drinking Places-Alcoholic Beverages
Office Supplies, Stationery & Gift Stores
Stores
Health & Personal Care Stores Grocery Stores
Beer, Wine & Liquor Stores
were not in the labor force.68 The unemployment rate in the LCBPA was roughly one sixth that of the city as a whole. However, the percentage of those not participating in the labor force was slightly higher in the study area than in Detroit. This merits further examination to understand the causes of unemployment at a point in time, captured by the unemployment rate and long-term unemployment, captured by lack of participation in the labor force.
The top five largest employing job sectors in the study area were: manufacturing (12.8 percent), healthcare and social assistance (10.8 percent), accommodation and food services (8.8 percent), retail trade (7.4 percent), and professional scientific and technical services (6.8 percent) (See Table 3.21).
Table 3.21 Jobs by Sector, LCBPA, 201569
When analyzing job sectors it is also useful to examine wages and affordability of these sectors. One way to examine the affordability of a city is through its “living wage”, which differs considerably from a minimum wage.70 In 2017, the minimum wage in the State of Michigan is $8.90.71 The living wage in the Detroit metropolitan area is $10.32 for one adult, $22.27 for one adult and one child, $27.66 for one adult and two children, $8.11 for two adults, $12.69 for two adults and one child, $15.12 for two adults and two children.72 As a result, a worker making minimum wage in the study area will have a difficult time making ends meet.73
Using data from the U.S. Census Bureau’s Longitudinal Employment and Housing Dynamics Survey, the project team determined where residents in the area work and where people who work in the LCBPA live. There was a mismatch between the large number of jobs in the study area and the small proportion of those who live in the area and hold these local jobs. In 2014, 14,657 people were employed in the LCBPA and lived outside of the community. In contrast, 1,349 people lived in the the study area and were employed outside of the community.
Most noteworthy is that only 51 people were both employed and lived in the study area.74 This is somewhat consistent to the mismatch seen in the city as a whole. There were 184,157 people employed in the city but living elsewhere. In contrast, 125,273 people lived in Detroit and were employed outside of the city. Only 62,218 people were both employed and lived in Detroit.75
Residents who live in the LCBPA commute to a variety of locations. The largest share of commuters from the LCBPA go to the City of Detroit as a whole (37.3 percent). The majority work in the Downtown, Midtown, and New Center areas of Detroit.76
• The LCBPA has sufficient Restaurants/Other Eating Places, Drinking Places, Office Supplies, Stationery & Gift Stores, Electronics & Appliance Stores, and Beer, Wine & Liquor Stores to meet local demand. These sectors are not good places to expand retail options.
• There is a shortage of Health & Personal Care Stores, Clothing Stores, and Grocery Stores in the study area, which indicates that residents likely shop in other areas to meet their needs. It also presents opportunities for new retailers to start business or existing retailers to extend market in those industries.
• There is a mismatch between job opportunities provided in LCBPA and area residents holding those jobs. There are a large number of employment opportunities in the LCBPA but only a small portion of residents work in the area.
The project team analyzed education in the Lower Cass and Brush Park Area to gain an understanding of available services and resources in and around the study area and educational attainment among the area’s working age population.
There were 267 residents under the age of 18 in the LCBPA as of 2015.77 Approximately 94 percent of them were enrolled in nursery, kindergarten and K-12 schools.78 School enrollment for the City of Detroit as a whole was 80 percent, which was lower than the LCBPA (93.6 percent).79 The only exception was Census Tract 5207, Block Group 1 in Grand Circus area, whose enrollment rate is around 72 percent (See Table 3.22).80
There were 3,006 people aged 25 and over in the study area and 1.4 percent of them had not completed any school, which was lower than the City of Detroit as a whole (2 percent).83 52.8 percent of residents in the area earned a high school diploma, its equivalent, or attended some college, but only 13.4 percent received a bachelor’s degree.84 Table 3.23 shows the various levels of education by block group. Census Tract 5173, Block Group 1 in Brush Park had higher educational attainment rates at higher levels of education than the rest of the LCBPA (31.6 percent of residents above 25 years of age have a bachelor’s degree).85 Lower Cass had lower educational attainment at the same level of education: 13.1 percent of residents have earned a bachelor’s degree.86 In the study area overall, 31.5 percent of residents attended some amount of college but only 13.4 percent earned Bachelor’s degrees.87
Table 3.22 School Enrollment by Age, LCBPA and City of Detroit, 201581
Brush
There are six schools in the area that provide education ranging from prekindergarten to high school.88 These schools are all magnet or charter schools that do not exclusively serve children in the LCBPA.89 These schools have a variety of specialties, including technology, arts, and language education.90 There are three child care service providers in the LCBPA, providing services to 120 children under age 5.91
Cass Technical High School, which is a part of Detroit Public Schools (DPS), is located in the Lower Cass portion of the LCBPA. Cass Technical High School is a magnet school with particularly high educational attainment that provides a range of services and opportunities to students and the community. In the 2014-2015 school year, there were approximately 2,328 students and 119 teachers at Cass Tech.92 The student body was 87% African American. Cass Tech had a 97% attendance rate and 98% graduation rate.93
In addition, there are several schools near the study area also provide educational services to children living in the area.94 All schools in or around the LCBPA enroll students from larger geographies than the LCBPA alone.
Spain Elementary-Middle School serves children from pre-kindergarten to 8th grade with 399 current enrolled students. Each grade has enrolled 40 students on average.95 Detroit School of Arts provides a range of arts courses to 392 students between 9th and 12th grade in the current school year. The
Table 3.23 Education Attainment for Population 25 Years and Older, LCBPA and City of Detroit, 201582
average enrolled students for each grade is 98.96 Benjamin Carson High School of Science and Medicine provides courses for students interested in science and medicine. The school has 396 students between 9th and 12th grades in the current year with an average of 99 students enrolled for each grade.97
• Educational attainment was highest in Brush Park for bachelor’s degrees; however Lower Cass had comparable or higher attainment levels for high school diplomas.
• There are few school-age children in the LCBPA but enrollment in k-12 schools is high within this small group.
• The LCBPA does not have a truly local school, all of the schools in the area are either magnets or charters that serve students across the city.
Social service organizations play an integral role in many individuals’ lives: some provide meals and shelter, others assist individuals with finding employment, and others focus on youth development. Over 30 social service organizations are located in and around the LCBPA, including:
• Cass Community Social Services
• Matrix Human Services
• Detroit Central City
• Neighborhoods Service Organization
• Mariners Inn
• Coalition on Temporary Shelter
• Goodwill Industries of Greater Detroit
• Detroit Rescue Mission Ministries
With this many social services clustered in the study area, the project team researched how these providers are meeting the needs of local residents. Several of these agencies work with individuals experiencing homelessness. Accordingly, their employees are well positioned to understand many of the needs that exist in the community. Throughout the preliminary needs assessment process, the team made special efforts to attend community meetings, gauge stakeholder opinions through a survey, and research social service organizations.
It should be noted that some data in this report are from providers located outside of the study area. Many LCBPA residents engage with service providers closest to the place they call home. Figure 3.9 shows the locations of social service providers in or near the LCBPA.
SERVICE PROVIDERS BY PARCEL MAP CREATION DATE: APR. 27, 2017 MAP AUTHOR: PROJECT TEAM
Table 3.24 Capacity of Homeless Service Providers, LCBPA, 2017102
count is a total of all programs at the respective social service agencies
Table 3.25 Comparison of PIT Count, Sheltered v. Unsheltered, LCBPA, 2017103
Through site visits with neighborhood residents, team members observed a sizeable homeless population in the study area. According to the most recent Detroit Point-In-Time (PIT) count, approximately 206 unsheltered adults above the age of 24 and 320 homeless veterans were reported.98 Unsheltered individuals are people who live on the streets, in abandoned buildings, or in other places not meant for human habitation. Additionally, a total of 530 adults and children sheltered at various homeless shelters across Detroit, many of which are located within the study area.99 The six homeless service providers in the study area are Mariner’s Inn, Detroit Rescue Mission, Coalition on Temporary Shelter (COTS), Homeless Action Network of Detroit (HAND), Covenant House, and Neighborhood Service Organization (NSO).100 The Table 3.24 shows the capacity of homeless service providers in the study area.
According to the PIT count data, the citywide results showed a decrease in
unsheltered individuals (See Table 3.25). This indicates a higher need for homelessness services and housing options in the area.
To gain a more thorough understanding of the LCBPA service providers’ target populations, total individuals served, and program funding according to their most recent annual reports (See Table 3.26).
Service providers have a strong presence and benefit many residents in the study area. As an increase in homelessness and other social issues without preventive and reactive strategies can be harmful, it is important for service providers to maintain their central locations and connections to the community. As shown in Table 3.26 the selected LCBPA service providers had aggregated annual program budgets of over $128 million and served around 120,000 individuals in 2016.
Because the network of service providers often work in collaboration, negative impacts on related organizations may occur when an agency relocates to a different area. At the time of this writing, Neighborhood Service Organization’s Tumaini Center has announced plans to leave the LCBPA. Decision-makers and stakeholders should consider the advantages, as well as disadvantages of having longstanding service providers clustered in the study area.
3.26
• There are 30 social service providers in and around the LCBPA that serve a large, diverse client base.
• The number of sheltered homeless individuals is decreasing while the number of unsheltered homeless individuals is increasing.
• Social service providers are often able to better serve their clients when located in close proximity to other providers.
Safety is fundamental to promoting the wellbeing of communities as well as attracting businesses and investment. A strong perception of safety can also lead to positive impacts on perceptions of quality of life and enhance opportunities for physical activity. The analysis that follows was conducted in part due to concerns raised by the NAC about safety in the study area.
The team used two data sets collected by the City of Detroit Open Data Portal from the Detroit Police Department. This analysis had two primary components: records of 911 emergency calls by location from January to September, 2016113 and reported incidents by location from January 2009 to March 2017.114
Table 3.27 Call Categories, LCBPA, 2016116
Table 3.28 Number and Percentage of 911 Calls by Area, LCBPA, 2016117
Call data showed that there were a total of 7,236 calls about incidents within the LCBPA in the nine-month period between January and September 2016.115 The largest proportion of 911 calls during this time period were regarding investigating someone [suspicious], traffic incidents, and disorderly people (See Table 3.27). The majority of the incidents took place in the Lower Cass area, which is geographically and demographically the largest portion of the study area (See Table 3.28).
In all, there were 14,456 incidents118 reported within the study area between January 2009 and March 2017.119 In 2016, the largest incident categories were larceny, assault, and traffic incidents (See Table 3.29). Most of the 14,456 incidents occurred in the Lower Cass area, which mirrors the trend seen in 911 calls (See Table 3.30). This is a function both of the relative size of the Brush Park area versus Lower Cass and the number of incidents reported.
Table 3.29 Frequently Reported Incidents, LCBPA, 2009 to 2016120
Table 3.30 Incidents by Area, LCBPA, 2009 to 2016121
Figure 3.10 Number of Reported Incidents, LCBPA and City of Detroit, 2009 to 2016122
The number of incidents reported in the City of Detroit decreased by 31.8 percent from 2009 to 2016 (See Figure 3.10). Similarly, the number of incidents reported within the study area decreased by 28.0 percent from 2,023 incidents in 2009 to 1,457 incidents in 2016.
• The number of reported crimes has been declining since 2009, both in the LCBPA and the City of Detroit as a whole.
• Lower Cass is the largest part of the study area but even accounting for this, it had the largest proportion of 911 calls placed and incidents reported.
This section summarizes the condition and use of roadways, sidewalks, transit service, and parking options within the LCBPA. While each transportation element can be evaluated on its own, it is clear that all transportation systems are interrelated. In addition to focusing on transportation options and the needs of current residents, employees, and visitors, this analysis also considers the impact that new stadium traffic may have on the area.
The transportation evaluation is divided into four components. The first includes an estimate of current vehicle traffic and recent changes in traffic volume. The project team analyzed crash data to identify sections of roadway and intersections within the LCBPA that appear dangerous for pedestrians and bicyclists. A second component evaluates transit service coverage and frequency of bus trips within the area. Bus stop coverage is an indicator of transit service accessibility and frequency is a measure of service quality. The third section includes a parking inventory, although additional study is necessary to determine whether currently available parking can accommodate residents’ needs. The final transportation section reviews the condition of LCBPA sidewalks and pedestrian safety. Given the number of area residents who primarily walk, bike, or use transit to get around, sidewalk quality and accessibility are especially important.
Traffic counts and crash locations are based on 2011-2015 data published by the Southeast Michigan Council of Governments (SEMCOG). While upcoming changes in traffic flow, volume, or street and sidewalk conditions could not be captured in this analysis, the trends offer a preliminary indication of locations that may need facility improvements to keep pedestrians safe from stadium traffic. The transit analysis is based on data from the City of Detroit’s Open Data Portal.
The project team recorded the conditions of LCBPA sidewalks, sidewalk ramps, and street parking using ArcGIS Collector, a mobile phone application. For descriptions of ArcGIS Collector and the recorded data points (See Appendix B). Sidewalk and sidewalk ramp conditions were rated on a general scale of accessibility for wheelchair users. Sidewalks that were assessed as “good” and “fair” were presumed to be wheelchair accessible, though sidewalks in “fair” condition show some visible damage. Sidewalks with broken or uneven segments or other barriers to wheelchair users received “bad” condition ratings. However, the project team did not evaluate sidewalks to determine if they met the Americans with Disabilities Act (ADA) requirements for width and steepness. Street parking locations include legal street parking that is free, metered, or handicap-only.
The LCBPA study area contained very few—only 7.5 percent—households with children.123 As of 2015, about 12.6 percent of residents were over the age of 65.124 These two populations combined make up a little over 20 percent of the population. As these populations have unique needs, their safety concerns deserve special consideration when making transportation decisions.
Most LCBPA residents (60.4 percent) commuted to work by car, van, or truck, while 21.1 percent walked to work and 8.7 percent rode public transportation to work.125 In comparison, across the city of Detroit, 82.0 percent of residents arrived to work by car, van or truck, 9.1 percent utilized public transportation, and 3.6 percent of residents walked to work.126 From these data, two trends appear. Compared to the other Detroit citizens, a high percentage of LCBPA residents walked to work. Conversely, a lower percentage of residents in the LCBPA utilized vehicles to get to work. Yet
a majority of LCBPA people used their personal vehicles to travel to work, making the quality of both sidewalks and roads important to the study area.
The project team used vehicle ownership as one indicator for transportation needs in the LCBPA. Most residents of the area (52.2 percent) did not own a car, while 33.1 percent of residents owned one car and nearly 15 percent of residents owned two or more cars.127
In the LCBPA and across the city, many residents depended on bus service for getting to work and completing day-to-day errands. While the LCBPA is situated between Detroit’s largest employment and medical centers, few jobs and essential services are located within walking distance of LCBPA households.128 The high rate of households without cars in the LCBPA in part reflects the high cost of owning a vehicle in Detroit.
Buses often serve a critical role for those without cars or other modes of transportation. Residents have many route options in the LCBPA, including 16 (Dexter), 18 (Fenkell), 21 (Grand River), 23 (Hamilton), 43 (Schoolcraft), 47 (Tireman), 49 (Vernor), and 53 (Woodward) (See Table 3.31).129
Figure 3.11 shows bus stops service map depicts stops within a quarter mile walking distance of the LCBPA. The light purple portion highlights areas that are within a quarter mile of a bus stop, while the white portion shows areas that are not covered.
Table 3.31 Weekday Service Frequency for Bus Routes, LCBPA, 2017130
Walking and biking are common means of transportation in the LCBPA. As noted above, a large proportion of LCBPA residents walk to work. Seniors who no longer drive and wheelchair users often rely on sidewalks to get around independently.131
Throughout the LCBPA, the sidewalk network is generally complete, though a few areas remain without any sidewalks. Surveyors ranked most LCBPA sidewalks and sidewalk ramps in good condition, as summarized in Table 3.31. While damage is uncommon, ramps and sidewalks observed as bad condition likely impede wheelchair users. Figure 3.12 displays the location and condition of sidewalks and sidewalk ramps within the LCBPA, as well as locations with missing sidewalks.
Half of all sidewalk damage, observed on approximately 1.1 miles of sidewalk, appeared related to current construction. Most construction-related damage was concentrated in the southwest
CREATION DATE: APR. 27, 2017
corner of the LCBPA, south of I-75 and west of Park Avenue. Sidewalks in that area had been removed to accommodate the installation of new curbs or utility work apparently related to parking lot construction. While these sidewalks seem destined for replacement, they remain currently inaccessible to wheelchair users.
The greatest concentration of non-construction related sidewalk damage was observed to the immediate east and west of Grand River Avenue, south of Temple Street, and east of the Lodge Freeway. Damage in this area appeared to be a result of neglect. While additional community feedback may determine if residents prioritize sidewalks in this area, another notable feature is the study area’s only pedestrian footbridge over M-10 nearby.
As shown in Table 3.32, the most pedestrian and bicyclistinvolved crashes occurred at intersections along the Woodward Avenue and Martin Luther King Jr. Boulevard corridors, as well as near highway service drives. Further study is necessary to determine the causes of these crashes, if this volume of crashes is abnormal given the level of pedestrian and vehicle traffic, and what interventions might reduce the number of crashes.
COMPLIANT
MAP CREATION DATE: APR. 27, 2017
MAP AUTHOR: PROJECT TEAM
The most pedestrian-involved crashes occurred at the Martin Luther King Jr., Boulevard and Third Avenue intersection. This intersection may receive more pedestrian traffic than others due to its proximity to the Neighborhood Service Organization and Cornerstone Estates, one of the LCBPA’s largest housing developments. The intersection’s proximity to the John C. Lodge Freeway could also be a factor (See Figure 3.13).
The second and third highest-frequency crash intersections were Woodward Avenue and Martin Luther King Jr., Boulevard and the entrance to the Whole Foods parking lot near John R Street and Brady Street, respectively. Like Martin Luther King Jr. Boulevard and Third Avenue, pedestrian traffic may be more frequent at these intersections than others.
Citywide trends in pedestrian-involved crashes can inform strategies to increase pedestrian safety in the LCBPA.
Approximately 30 percent of crashes in Detroit occurred when a vehicle was in reverse, either leaving a driveway or pulling into a parking space.134 While the distinction was smaller, crashes were also more common at intersections and when pedestrians were traveling on the same side of the road as vehicles. These trends further emphasize the need for a complete sidewalk network that is both safe and accessible to all LCBPA residents.
Parking availability is an eminent community issue that residents fear will increase significantly when the arena opens. According to a traffic study commissioned by Olympia Development of Michigan, sold-out events at the arena will bring approximately 6,640 cars to the area.135 While additional paid parking
MAP CREATION DATE: APR. 27, 2017
Table 3.32 Bicycle and Pedestrian Crash Locations, LCBPA, 2011 to 2015133
lots and structures are currently under construction, it seems likely that event attendees will look for alternative, free parking spaces in LCBPA neighborhoods.
This section includes an inventory of on-street parking and parking lots within the LCBPA, shown in Figure 3.14. The count of available parking spaces in this report can help stakeholders choose a parking management strategy that minimizes parking conflicts between stadium-goers and LCBPA residents, businesses, and organizations.
Approximately 2,833 on-street parking spaces exist in the LCBPA, as shown in Figure 3.14. Most are located in the Lower Cass area, west of Second Avenue. This estimate includes both free and metered on-street parking.
Table
The project team identified approximately 56 acres of parking lots, also shown in Figure LCBPA Parking Lots. This estimate does not include on-site parking spaces located on the same parcel as a building. For example, the resident parking spaces at Cornerstone Estates, the Ellington Lofts, and the Woodward Place Townhomes are not included in the estimate (See Table 3.33).
At minimum, 6.8 acres of parking lot are currently under construction and ten acres of unpaved parking lots are currently in use. Many of these lots have a semi-durable surface, such as gravel, but some are dirt. Dirt lots are currently in use for construction-related parking, equipment storage areas, and some informal parking lots. Neighborhood Advisory Council members have reported that
and mud tracked into the street from unpaved
construction parking lots has been a problem along segments of Henry Street, Second Avenue, and Temple Street (See Table 3.34).
The authors suggest an additional study to evaluate parking needs for LCBPA businesses and agencies, though currently available street parking appears adequate for LCBPA residents. As shown in Figure LCBPA Free and Metered On-Street Parking Spaces, approximately one street parking space exists for every occupied residential unit, in addition to on-site spaces adjacent to most residential buildings. The ratio of parking spaces per unit is highest to the west of Second Avenue. However, fewer on-street parking spaces are available in the Brush Park and Grand Circus Park areas, which exhibit greater residential density.
Counts of parked cars and length of stay may prove better indicators of parking needs than a ratio of spaces per unit. For businesses, parking needs are often measured by of spaces per square foot, which the project team did not calculate for this assessment. Parking costs also impact drivers’ parking choices. In 2015, the City of Detroit implemented a new metered parking system that includes some of the streets in the Grand Circus Park area of the LCBPA.138 The cost to park on streets close to the arena, as well as private surface lots and structures, will influence the extent that stadium-goers look for free parking within the LCBPA.
DATE: APR. 27, 2017
Pedestrian safety is an important issue in the LCBPA, given that around half of all households do not own vehicles.
• The intersections along Martin Luther King, Jr. Boulevard and Woodward Avenue are high-risk areas for pedestrian and bicyclist-involved traffic crashes.
• Given the ample amount of on-street parking available in the LCBPA, the city should consider a parking-management strategy to preserve parking spaces for residents and businesses.
This section summarizes the types of structures, land uses, and open spaces that currently exist in the LCBPA. Land use patterns create social, environmental, and economic impacts and often indicate overall current conditions in the area. Population density and a mix of residential and commercial uses reduce the percapita cost of public services like transit or sanitation, encourage new job growth and retail markets, and eliminate blight. New development can also bring negative consequences. Housing prices may increase, and historic or culturally significant buildings or gathering places could be lost. This section also reviews land ownership, which may provide clues about future development in the area.
Most of the land use data in this section represent findings from the project team’s parcel survey. Prior to this project, the most recent information about land use in the LCBPA was collected
DATE: APR. 27, 2017
Table 3.35 Land Use by Parcel Acreage, LCBPA, 2017141
FIGURE 3.16
during Data Driven Detroit’s Motor City Mapping project of 2014. The reported acreage of land uses reflects the total areas of parcels, and the parcels’ primary land use. Approximately 20.2 acres of LCBPA properties, equivalent to 7.3 percent of the total area, were not surveyed at the time of this report.
Property ownership information was sourced from Property Praxis, and provided by D3 for this report. Property Praxis is a collective of researchers who identify the individuals and companies who own large quantiles of land in Detroit.139
At the time of surveying, approximately 44 percent of LCBPA properties contained structures, as shown in Table 3.35. While most buildings in the area were multi-unit structures, the area as a whole was not densely developed. By comparison, parcels with structures covered approximately 62 percent of Detroit’s Downtown in 2014.140 The area had approximately 62 acres of open space. Parks and playgrounds represented only 10 percent of this open space and the remainder were undeveloped
DEVELOPMENT SITES BY PARCEL
MAP CREATION DATE: APR. 27, 2017
MAP AUTHOR: PROJECT TEAM
Table 3.36 Developed Land Uses, LCBPA, 2017142
FIGURE 3.17
lots. Some empty lots had been reclaimed for cookouts and community gatherings.
About 56 acres of parking lots existed in the LCBPA, 18 acres of which were unpaved lots. Devoting such a large percentage of land to parking adds significant impervious surface to the area, which can increase the risk of flooding from storm water runoff, and radiates excess heat form absorbed sunlight. The combined surface area of paved parking lots and roadways was approximately 119 acres, out of a total of 277.7 acres, assuming a roadway width of 30 feet.
The Little Caesars Arena and other proposed developments will significantly contrast with current prevailing land uses in the LCBPA. At the time of surveying, the area was predominantly residential, as shown in Figure 3.15. At least half of the mixed-use buildings in the LCBPA also contained residential
LAND COMPANY
URBAN HORTICULTURE PROPERTIES BY PARCEL
MAP CREATION DATE: APR. 27, 2017
MAP AUTHOR: PROJECT TEAM
Table 3.37 Property Under Development, LCBPA, 2017143
Sites
Table 3.38 Major Property Owners, LCBPA, 2015144
Property Owner
units. Office space was the second-most prevalent land use after the arena itself, although the project team found that approximately half of all office properties sit vacant. The area had approximately 11.5 acres of institutional uses, including Cass Tech and Capstone Academy Charter School, the Engine 1 Fire Station, as well as the Masonic Temple and historic churches. While the LCBPA had some restaurants and bars, they are fewer in number than in Downtown and Midtown (See Table 3.36).
Including the arena, approximately 33.3 acres of property appeared to be under development at the time of this report (See Figure 3.16). This estimate included 6.8 acres of parking lots that were in the process of being paved or re-paved. As previously stated, devoting such a large portion of land to parking could have negative impacts (See Table 3.37).
Several property owners have assembled large areas of land in the LCBPA. As shown in Figure 3.17, Olympia Development is one of the area’s largest land holders. At the time of surveying, most of the 21.6 acres of property that Olympia owned in addition to the stadium were devoted to stadium parking or utilities. Joel Landy, who owned approximately 5.4 acres of property in the LCBPA, had already begun several mixed-use and market-rate residential developments. Private property owners not only influence the LCBPA’s current conditions, but will shape the future of the area through their investments (See Table3.38).
• The LCBPA overall is not densely populated compared to Detroit as a whole. However, there is planned development that may change the density and prevailing land uses in the LCBPA.
• Additional community consultation is necessary to set future land use goals and to establish priorities for development around existing structures.
• Twenty percent of the LCBPA land is already devoted to parking. Additional evaluation is needed to determine if devoting more land to parking or impervious surface will pose a flood risk.
• A parking management strategy is necessary to ensure residents and businesses have access to parking after the stadium is built.
1 Block groups are the best option among available Census geography but they do cover area outside of the LCBPA. In particular, Census Tract 5207, Block Group 1, which covers Grand Circus, extends beyond the boundaries of the LCBPA.
2 This analysis is done at the block group level and some indicators were not available due to the small geography.
3 United States Census Bureau. “B01003. Total Population.” 2011-2015 American Community Survey, 5-year estimates. Retrieved from Social Explorer. Accessed April 7, 2017.
4 United States Census Bureau. “SE:T1. Total Population.” 2000 and 2010 American Community Survey, Decennial. Retrieved from Social Explorer. Accessed April 7, 2017.
5 We focused on Lower Cass census tracts when comparing decennial data because the boundaries changed between the ten years.
6 United States Census Bureau. “SE:T14, T54, T12. Race.” 1990, 2000, 2010 American Community Survey, Decennial Census. Retrieved from Social Explorer. Accessed April 7, 2017.
7 This table gives figures for the largest racial groups in the LCBPA (Black or African American and White), not total population
8 United States Census Bureau. “SE:T14, T54, T12. Race.” 1990, 2000, 2010 American Community Survey, Decennial Census. Retrieved from Social Explorer. Accessed April 7, 2017.
9 United States Census Bureau. “B02001. Race.” 2011-2015 American Community Survey, 5-year estimates. Retrieved from Social Explorer. Accessed April 7, 2017.
10 ibid.
11 United States Census Bureau. “SE:T4. Sex.” 2011-2015 American Community Survey, 5-year estimates. Retrieved from Social Explorer. Accessed April 7, 2017.
12 United States Census Bureau. “SE:T20. Population in Households by Household Type and Relationship.” 2011-2015 American Community Survey, 5-year estimates. Retrieved from Social Explorer. Accessed April 7, 2017.
13 ibid.
14 United States Census Bureau. “SE:T20. Population in Households by Household Type and Relationship.” 2011-2015 American Community Survey, 5-year estimates. Retrieved from Social Explorer. Accessed April 7, 2017.
15 United States Census Bureau. “SE:T7. Age.” 2011-2015 American Community Survey, 5-year estimates. Retrieved from Social Explorer. Accessed April 7, 2017.
16 United States Census Bureau. “SE:T74. Households with Earnings.” 2011-2015 American Community Survey, 5-year estimates. Retrieved from Social Explorer. Accessed April 7, 2017.
17 ibid.
18 ibid.
19 United States Census Bureau. “SE:T79, T80, T81. Households with SSI, Public Assistance, and Retirement .” 2011-2015 American Community Survey, 5-year estimates. Retrieved from Social Explorer. Accessed April 7, 2017.
20 ibid.
21 ibid.
22 ibid.
23 United States Census Bureau. “B19013. Median Household Income in the Past 12 Months (In 2015 Inflation-Adjusted Dollars).” 2011-2015 American Community Survey, 5-year estimates. Retrieved from Social Explorer. Accessed April 7, 2017.
24 ibid.
25 ibid.
26 ibid.
27 United States Census Bureau. “SE:T79, T80, T81. Households with SSI, Public Assistance, and Retirement .” 2011-2015 American Community Survey, 5-year estimates. Retrieved from Social Explorer. Accessed April 7, 2017.
28 “Federal Poverty Guidelines,” Families USA, February, 2017, http://familiesusa.org/ product/federal-poverty-guidelines.
29 ibid.
30 ibid.
31 ibid.
32 United States Census Bureau. “SE:T113. Poverty Status in 2015 of Families by Family Type by Presence of Children Under 18 Years.” 2011-2015 American Community Survey, 5-year estimates. Retrieved from Social Explorer. Accessed April 7, 2017.
33 United States Census Bureau. “B25001. Housing Units.” 2011-2015 American Community Survey, 5-Year Estimates. Retrieved from Social Explorer. Accessed March 1, 2017.
34 United States Census Bureau. “B25024. Units in Structure.” 2011-2015 American Community Survey, 5-Year Estimates. Retrieved from Social Explorer. Accessed March 1, 2017.
35 United States Census Bureau. “B25035. Median Year Structure Built.” 2011-2015 American Community Survey, 5-Year Estimates. Retrieved from Social Explorer. Accessed March 1, 2017.
36 United States Census Bureau. “B25034. Year Structure Built.” 2011-2015 American Community Survey, 5-Year Estimates. Retrieved from Social Explorer. Accessed March 1, 2017.
37 United States Census Bureau. “B25002. Occupancy Status.” 2011-2015 American Community Survey, 5-Year Estimates. Retrieved from Social Explorer. Accessed March 1, 2017.
38 United States Census Bureau. “B25004. Vacancy Status.” 2011-2015 American Community Survey, 5-Year Estimates. Retrieved from Social Explorer. Accessed March 1, 2017.
39 United States Census Bureau. “B25003. Tenure.” 2011-2015 American Community Survey, 5-Year Estimates. Retrieved from Social Explorer. Accessed March 1, 2017.
40 According to United States Census Bureau, gross rent is the contract rent plus the estimated average monthly cost of utilities (electricity, gas, and water and sewer) and fuels (oil, coal, kerosene, wood, etc.).
41 United States Census Bureau. “B25064. Median Gross Rent (Dollars).” 2011-2015 American Community Survey, 5-Year Estimates. Retrieved from Social Explorer. Accessed
March 1, 2017.
42 United States Census Bureau. “B25064. Median Gross Rent (Dollars).” 2011-2015 American Community Survey, 5-Year Estimates. Retrieved from Social Explorer. Accessed March 1, 2017.
43 United States Census Bureau. “B25063. Gross Rent.” 2011-2015 American Community Survey, 5-Year Estimates. Retrieved from Social Explorer. Accessed March 1, 2017.
44 United States Census Bureau. “B25075. Value.” 2011-2015 American Community Survey, 5-Year Estimates. Retrieved from Social Explorer. Accessed March 1, 2017.
45 United States Census Bureau. “B25081. Mortgage Status.” 2011-2015 American Community Survey, 5-Year Estimates. Retrieved from Social Explorer. Accessed March 1, 2017.
46 According to HUD, households who pay more than 30 percent of their income on housing costs are considered “cost-burdened.”
47 United States Census Bureau. “B25074. Household Income by Gross Rent as a Percentage of Household Income in the Past 12 Months.” 2011-2015 American Community Survey, 5-Year Estimates. Retrieved from Social Explorer. Accessed March 1, 2017.
48 ibid.
49 For more information about Section 221(d)(4) New construction / Substantial Rehabilitation program: The U.S. Department of Housing and Urban Development (HUD), “Mortgage Insurance for Rental and Cooperative Housing: Section 221(d)(4),” Accessed April 28, 2017, https://portal.hud.gov/hudportal/HUD?src=/program_offices/housing/mfh/progdesc/ rentcoophsg221d3n4
50 For more information about Section 202 Capital Advance for Elderly program: The U.S. Department of Housing and Urban Development (HUD), “Section 202 Supportive Housing for the Elderly Program,” Accessed April 28, 2017, https://portal.hud.gov/ hudportal/HUD?src=/program_offices/housing/mfh/progdesc/eld202
51 For more information about Public Housing: The U.S. Department of Housing and Urban Development (HUD), “Public Housing,” Accessed April 28, 2017, https://portal.hud.gov/hudportal/HUD?src=/program_offices/ public_indian_housing/programs/ph
52 Michigan State Housing Development Authority (MSHDA), “Affordable Rental Housing Directory (ARHD),” 2016, Accessed March 1, 2017; United States Department of Housing
and Urban Development (HUD), “LIHTC Database Access,” 2014, Accessed March 1, 2017.
53 The U.S. Department of Housing and Urban Development’s (HUD’s) Office of Policy Development and Research (PD&R), “FY 2015 Multifamily Tax Subsidy Project Income Limits Summary,” 2015, Accessed March 25, 2017.
54 United States Census Bureau. “B19001. Household Income in the Past 12 Months (In 2015 Inflation-Adjusted Dollars).” 2011-2015 American Community Survey, 5-Year Estimates. Retrieved from Social Explorer. Accessed March 1, 2017.
55 ibid.
56 Jill Khadduri, Carissa Climaco, Kimberly Burnett, Laurie Gould, and Louise Elving, “What Happens to Low-Income Housing Tax Credit Properties at Year 15 and Beyond?” The U.S. Department of Housing and Urban Development’s (HUD’s) Office of Policy Development and Research (PD&R), 2012, pgs. 1-2. https://www.huduser.gov/portal/publications/ what_happens_lihtc_v2.pdf
57 Michigan State Housing Development Authority (MSHDA), “Affordable Rental Housing Directory (ARHD),” 2016, Accessed March 1, 2017; United States Department of Housing and Urban Development (HUD), “LIHTC Database Access,” 2014, Accessed March 1, 2017.
58 Jill Khadduri, Carissa Climaco, Kimberly Burnett, Laurie Gould, and Louise Elving, “What Happens to Low-Income Housing Tax Credit Properties at Year 15 and Beyond?” The U.S. Department of Housing and Urban Development’s (HUD’s) Office of Policy Development and Research (PD&R), 2012, pgs. 1-2. https://www.huduser.gov/portal/publications/ what_happens_lihtc_v2.pdf
59 Esri Business Analyst is a software extension that provides tools for mapping, analysis and work management to analyze data for insights and patterns in a business and find solutions for market planning and site selection.
60 The North American Industry Classification System (NAICS) is the standard used by Federal statistical agencies in classifying business establishments for the purpose of collecting, analyzing, and publishing statistical data related to the U.S. business economy. United States Census Bureau, https://www.census.gov/eos/www/naics/.
61 Educational services include k-12 schools and childcare providers.
62 Esri, “Business Summary,” 2016. Accessed April 2017.
63 Non-store retail refers to the selling of goods and services outside the confines of an established retail facility.
64 Esri, “Retail Business Profile,” 2016. Accessed April 2017.
65 Esri, “Retail Marketplace Profile,” 2016. Accessed April 2017.
66 “Local Area Directory,” Midtown Detroit, INC., 2017, http://midtowndetroitinc.org/ visit/local-area-directory.
67 United States Census Bureau. “C24030. Sex by Industry for the Civilian Employed Population 16 Years and Over (Male and Female numbers combined).” 2011-2015 American Community Survey, 5-Year Estimates. Retrieved from Social Explorer. Accessed March 1, 2017.
68 United States Census Bureau. “B23025: Employment Status for the Population 16 Years and Older.” 2011-2015 American Community Survey, 5-Year Estimates. Retrieved from Social Explorer. Accessed March 1, 2017.
69 ibid.
70 Amy K. Glassmeier, “Living Wage Calculation for Detroit-Warren-Dearborn,” Living Wage Calculator: Massachusetts Institute of Technology, 2017, http://livingwage.mit.edu/ metros/19820.
71 “What is the Minimum Wage,” Department of Licensing and Regulatory Affairs, Accessed April 2017, http://www.michigan.gov/lara/0,4601,7-154-11407_32352-140972--,00. html.
72 U.S. Census Bureau. 2016. OnTheMap Application. Longitudinal-Employer Household Dynamics Program. http://onthemap.ces.census.gov/, accessed May 2017.
73 There are some limitations with this measure. The only data available was at the Metropolitan level and not city or block group level. Thus, suburban areas may be skewing the living wage data. Regardless of geographic limitations, it is the case that an individual living in the LCBPA making minimum wage would not have sufficient income to meet living expenses.
74 U.S. Census Bureau. 2016. OnTheMap Application. Longitudinal-Employer Household Dynamics Program. http://onthemap.ces.census.gov/, accessed May 2017.
75 ibid.
76 ibid.
77 United States Census Bureau. “B01001. Sex by Age.” 2011-2015 American Community Survey, 5-Year Estimates. Retrieved from Social Explorer. Accessed March 20, 2017.
78 United States Census Bureau. “B14007. School Enrollment by Detailed Level of School for the Population 3 Years and Over.” 2011-2015 American Community Survey, 5-Year Estimates. Retrieved from Social Explorer. Accessed March 20, 2017.
79 ibid.
80 ibid.
81 ibid.
82 ibid.
83 United States Census Bureau. “B15003. Educational Attainment for the Population 25 Years and Over.” 2011-2015 American Community Survey, 5-Year Estimates. Retrieved from Social Explorer. Accessed March 20, 2017.
84 ibid.
85 ibid.
86 bid.
87 ibid.
88 “Schools”. Detroit Public Schools, Accessed March 20, 2017, http://detroit.k12.mi.us/ schools/all-schools/.
89 ibid.
90 ibid.
91 United States Census Bureau. “B01001. Sex by Age.” 2011-2015 American Community Survey, 5-Year Estimates. Retrieved from Social Explorer. Accessed March 20, 2017.
92 “Cass Tech 2014-2015 School Profile,” Cass Technical High School, Assessed March, 2017, http://casstech.schools.detroitk12.org/about-us/cass-tech-profile/.
93 ibid.
94 “Schools”. Detroit Public Schools, Accessed March 20, 2017, http://detroit.k12.mi.us/ schools/all-schools/.
95 “Spain Elementary-Middle School”. Detroit Public Schools, Accessed March 20, 2017, http://detroit.k12.mi.us/schools/school/215/demographics/.
96 “Detroit School of Arts”. Detroit Public Schools, Accessed March 20, 2017, http:// detroit.k12.mi.us/schools/school/327/demographics/.
97 “Carson, Benjamin High School For Science And Medicine”. Detroit Public Schools, Accessed March 20, 2017, http://detroit.k12.mi.us/schools/school/505/demographics/.
98 “Homeless Action Network of Detroit, “2017 Point-In-Time Count Summary Data Report,” March 28, 2017.
99 ibid.
100 Mariners Inn serves single men; Detroit Rescue Mission Ministries serves men, women and children; Coalition on Temporary Shelter serves men, women and children; Covenant House serves homeless youth; Neighborhood Service Organization Tumaini Center serves single men and women
101 Includes multiple locations: Genesis House III, Oasis, and Detroit Rescue Mission Ministries.
102 Homeless Action Network of Detroit, “2017 Point-In-Time Count Summary Data Report,” March 28, 2017.
103 Homeless Action Network of Detroit, “2017 Point-In-Time Count Summary Data Report,” March 28, 2017.
104 “We are DCHC: Community Focused, Health Centered,” Detroit Community Health Connection, Inc., Accessed April 6, 2017, http://dchcquality.com/wp-content/ uploads/2014/11/DCHC-AnnualReport_2014_wBleed_optimized.pdf.
105 “CCSS 2015 Annual Report,” Cass Community Social Services: Fighting Poverty, Creating Opportunity, Accessed April 6th, 2017, https://casscommunity3.files.wordpress. com/2012/06/ccss-2015-ar-text-1.pdf.
106 “2015 Annual Report,” Mariners Inn, Accessed April 6, 2017, http://marinersinn.org/ assets/annual-reports/2015-Annual-Report.pdf.
107 “Detroit Rescue Mission Ministries 2014 Annual Report,” Detroit Rescue Mission Ministries, Accessed April 6, 2017, http://drmm.org/wp-content/uploads/2015/09/ Annual-Report-2014-2.pdf.
108 “COTS’ Effectiveness,” COTS: Hope, Help, Housing, Accessed April 6, 2017, http:// media.wix.com/ugd/0b3055_23bba18de3dd4b60af53f57c8ccd52b0.pdf.
109 Matric Human Services 2015 Programs,” Matrix Human Services, Accessed April 6, 2017, http://www.matrixhumanservices.org/wp-content/uploads/2016/03/MATRIXHUMAN-SERVICES-2015.pdf.
110 “Goodwill Industries of Greater Detroit Annual Report 2015,” Goodwill Industries of Greater Detroit, Accessed April 6, 2017, http://www.goodwilldetroit.org/wp-content/ uploads/2013/08/Goodwill-Annual-Report-2015-Single-Pages-081716.pdf.
111 “Covenant House Michigan: Opening Doors for Homeless Youth,” Covenant House Michigan, Accessed April 6, 2017, https://covenanthousemi.org/wp-content/ uploads/2017/01/CHM-AUDITED-FS-FY-16-LONG-1.pdf.
112 “IMPACT: Empowering People and Our Community,” Neighborhood Service Organization, Accessed April 6, 2017, https://www.nso-mi.org/ uploads/8/3/3/9/83390098/2014_annual_report.pdf.
113 This time period was used based on data availability from Detroit Open Data Portal.
114 The team identified total numbers of 911 calls and reported incidents, what type of incidents were reported, and locations within the LCBPA that had higher numbers of reported incidents.
115 Detroit Police Department. “DPD: 911 Calls for Service,” 2011-2015 American Community Survey, 5-Year Estimates. Retrieved from Open Data Portal for the City of Detroit. Accessed March 1, 2017.
116 ibid.
117 ibid.
118 The reported incidents dataset reflects reported criminal and non-criminal offenses (excluding sexual assaults) that have occurred in the study area since January 1, 2009.
119 Detroit Police Department. “DPD: All Crime Incidents, 2009 - Present (Provisional),” 2011-2015 American Community Survey, 5-Year Estimates. Retrieved from Open Data Portal for the City of Detroit. Accessed March 1, 2017.
120 ibid.
121 ibid.
122 ibid.
123 United States Census Bureau. “B11005.Households by Presence of People Under 18 Years by Household Type.” 2011-2015 American Community Survey, 5-Year Estimates, Retrieved from Social Explorer. Accessed April, 2017.
124 United States Census Bureau. “B01001. Sex by Age.” 2011-2015 American Community Survey, 5-Year Estimates. Retrieved from Social Explorer. Accessed April, 2017.
125 United States Census Bureau. “B08301. Means of Transportation to Work.” 2011-2015 American Community Survey, 5-Year Estimates. Retrieved from Social Explorer. Accessed April, 2017.
126 United States Census Bureau. “SE:128. Means of Transportation to Work for Workers 16 Years and Over.” 2011-2015 American Community Survey, 5-Year Estimates. Retrieved from Social Explorer. Accessed April 2017.
127 United States Census Bureau. “B25044. Tenure by Vehicles Available.” 2011-2015 American Community Survey, 5-Year Estimates. Retrieved from Social Explorer. Accessed April 2017.
128 On The Map, “Longitudinal-Employer Household Dynamics Program,” 2016. Accessed April 2017
129 City of Detroit, “Bus Schedules,” Accessed April 7, 2017, http://www.detroitmi.gov/ How-Do-I/Locate-Transportation/Bus-Schedules.
130 ibid.
131 “Safety Benefits of Walkways, Sidewalks, and Paved Shoulders,” The Federal Highway Administration, Accessed April 15, 2017, https://safety.fhwa.dot.gov/ped_bike/tools_ solve/walkways_trifold/.
132 Report Authors, Field Survey, 2017.
133 Southeast Michigan Council of Governments (SEMCOG), “Crash Location Shapefiles, 2011 to 2015,” Retrieved from Open Data Portal, Accessed April 21, 2017.
134 Southeast Michigan Council of Governments (SEMCOG), “Crash and Road Data,” Retrieved from Open Data Portal, Accessed April 21, 2017.
135 “Detroit Events Center Project: Traffic Management Study,” Parsons Brinckerhoff, March 20, 2015.
136 Report Authors, Field Survey, 2017.
137 ibid.
138 Joe Guillen, “What You Need to Know about New Detroit Parking System,” Detroit Free Press, September 13, 2015, http://www.freep.com/story/news/2015/09/13/what-youneed-know-new-detroit-parking-system/72061966/.
139 While the Property Praxis dataset is only current through January of 2016, it was used because it identifies the companies or individuals associated with the Limited Liability Corporations that are listed as property owners.
140 Data Driven Detroit, “Motor City Mapping, Certified Results, Winter 2013-14 (Census Tract Aggregation),” December 30, 2014, https://www.arcgis.com/home/item. html?id=6d51c9a94e2944d1bffc24f95c9b08e8.
141 Report Authors, Loveland Technology, 2017.
142 ibid.
143 ibid.
144 “City of Detroit,” Detroit Open Data Portal: City Assessor 2015, Retrieved from Data Driven Detroit, Accessed March 30, 2017, http://www.propertypraxis.org/.
a US Census Bureau Geography, “TIGER/Line® Shapefiles and TIGER/Line® Files,” accessed May 1, 2017, https://www.census.gov/geo/maps-data/data/tiger-line.html; Southeast Michigan Council of Governments (SEMCOG), “Roads,” Retrieved from Open Data Portal, Accessed May 1, 2017, http://maps-semcog.opendata.arcgis.com/datasets?keyword=transportation&sort_by=relevance
b US Census Bureau Geography, “TIGER/Line® Shapefiles and TIGER/Line® Files,” accessed May 1, 2017, https://www.census.gov/geo/maps-data/data/tiger-line.html; Southeast Michigan Council of Governments (SEMCOG), “Roads,” Retrieved from Open Data Portal, Accessed May 1, 2017, http://maps-semcog.opendata.arcgis.com/datasets?keyword=transportation&sort_by=relevance; ; United States Census Bureau. “B02001. Race.” 2011-2015 American Community Survey, 5-Year Estimates. Retrieved from Social Explorer. Accessed April, 2017.
c US Census Bureau Geography, “TIGER/Line® Shapefiles and TIGER/Line® Files,” accessed May 1, 2017, https://www.census.gov/geo/maps-data/data/tiger-line.html; Southeast Michigan Council of Governments (SEMCOG), “Roads,” Retrieved from Open Data Portal, Accessed May 1, 2017, http://maps-semcog.opendata.arcgis.com/datasets?keyword=transportation&sort_by=relevance; United States Census Bureau. “B19013. Median Household Income in the Past 12 Months (In 2015Inflation-Adjusted Dollars).” 2011-2015 American Community Survey, 5-Year Estimates. Retrieved from Social Explorer. Accessed April, 2017.
d Data Driven Detroit, “Motor City Mapping, Winter 2013-14 Certified Results,” 2016, Accessed March 30, 2017, http://portal.datadrivendetroit.org/datasets/80f30d7f6683441cacef62574a22d8a9_0; Southeast Michigan Council of Governments (SEMCOG), “Roads,” Retrieved from Open Data Portal, Accessed May 1, 2017, http:// maps-semcog.opendata.arcgis.com/datasets?keyword=transportation&sort_by=relevance
e Data Driven Detroit, “Motor City Mapping, Winter 2013-14 Certified Results,” 2016, Accessed March 30, 2017, http://portal.datadrivendetroit.org/datasets/80f30d7f6683441cacef62574a22d8a9_0; Southeast Michigan Council of Governments (SEMCOG), “Roads,” Retrieved from Open Data Portal, Accessed May 1, 2017, http:// maps-semcog.opendata.arcgis.com/datasets?keyword=transportation&sort_by=relevance
f City of Detroit, “2016 DDOT Bus Routes,” 2016, Retrieved from Open Data Portal, Accessed May 1, 2017, https://data.detroitmi.gov/browse?category=Transportation; City of Detroit, “DDOT Bus Stops,” 2016, Retrieved from Open Data Portal, Accessed May 1, 2017, https://data.detroitmi.gov/browse?category=Transportation; City of Detroit, “SMART Bus Stops,” 2016, Retrieved from Open Data Portal, Accessed May 1, 2017, https://data.detroitmi.gov/browse?category=Transportation; Southeast Michigan Council of Governments (SEMCOG), “Roads,” Retrieved from Open Data Portal, Accessed May 1,
2017, http://maps-semcog.opendata.arcgis.com/datasets?keyword=transportation&sort_ by=relevance
g Southeast Michigan Council of Governments (SEMCOG), “Roads,” Retrieved from Open Data Portal, Accessed May 1, 2017, http://maps-semcog.opendata.arcgis.com/datasets?keyword=transportation&sort_by=relevance
h Southeast Michigan Council of Governments (SEMCOG), “Crash Location Shapefiles, 2011 to 2015,” Retrieved from Open Data Portal, Accessed April 21, 2017, http:// maps-semcog.opendata.arcgis.com/datasets?keyword=transportation&sort_by=relevance; Southeast Michigan Council of Governments (SEMCOG), “Roads,” Retrieved from Open Data Portal, Accessed May 1, 2017, http://maps-semcog.opendata.arcgis.com/datasets?keyword=transportation&sort_by=relevance
i Southeast Michigan Council of Governments (SEMCOG), “Roads,” Retrieved from Open Data Portal, Accessed May 1, 2017, http://maps-semcog.opendata.arcgis.com/datasets?keyword=transportation&sort_by=relevance
j Data Driven Detroit, “Motor City Mapping, Winter 2013-14 Certified Results,” 2016, Accessed March 30, 2017, http://portal.datadrivendetroit.org/datasets/80f30d7f6683441cacef62574a22d8a9_0; Southeast Michigan Council of Governments (SEMCOG), “Roads,” Retrieved from Open Data Portal, Accessed May 1, 2017, http:// maps-semcog.opendata.arcgis.com/datasets?keyword=transportation&sort_by=relevance
k “City of Detroit,” Detroit Open Data Portal: City Assessor 2015, Retrieved from Data Driven Detroit, Accessed March 30, 2017, http://www.propertypraxis.org/; Roads,” SEMCOG (Southeast Michigan Council of Governments) Open Data Portal, accessed May 1, 2017, http://maps-semcog.opendata.arcgis.com/datasets?keyword=transportation&sort_ by=relevance
l City of Detroit, “Detroit Open Data Portal: City Assessor 2015,” Retrieved from Data Driven Detroit, Accessed March 30, 2017, http://www.propertypraxis.org/; Data Driven Detroit, “Motor City Mapping, Winter 2013-14 Certified Results,” 2016, Accessed March 30, 2017, http://portal.datadrivendetroit.org/datasets/80f30d7f6683441cacef62574a22d8a9_0; Southeast Michigan Council of Governments (SEMCOG), “Roads,” Retrieved from Open Data Portal, Accessed May 1, 2017, http://maps-semcog.opendata.arcgis.com/ datasets?keyword=transportation&sort_by=relevance
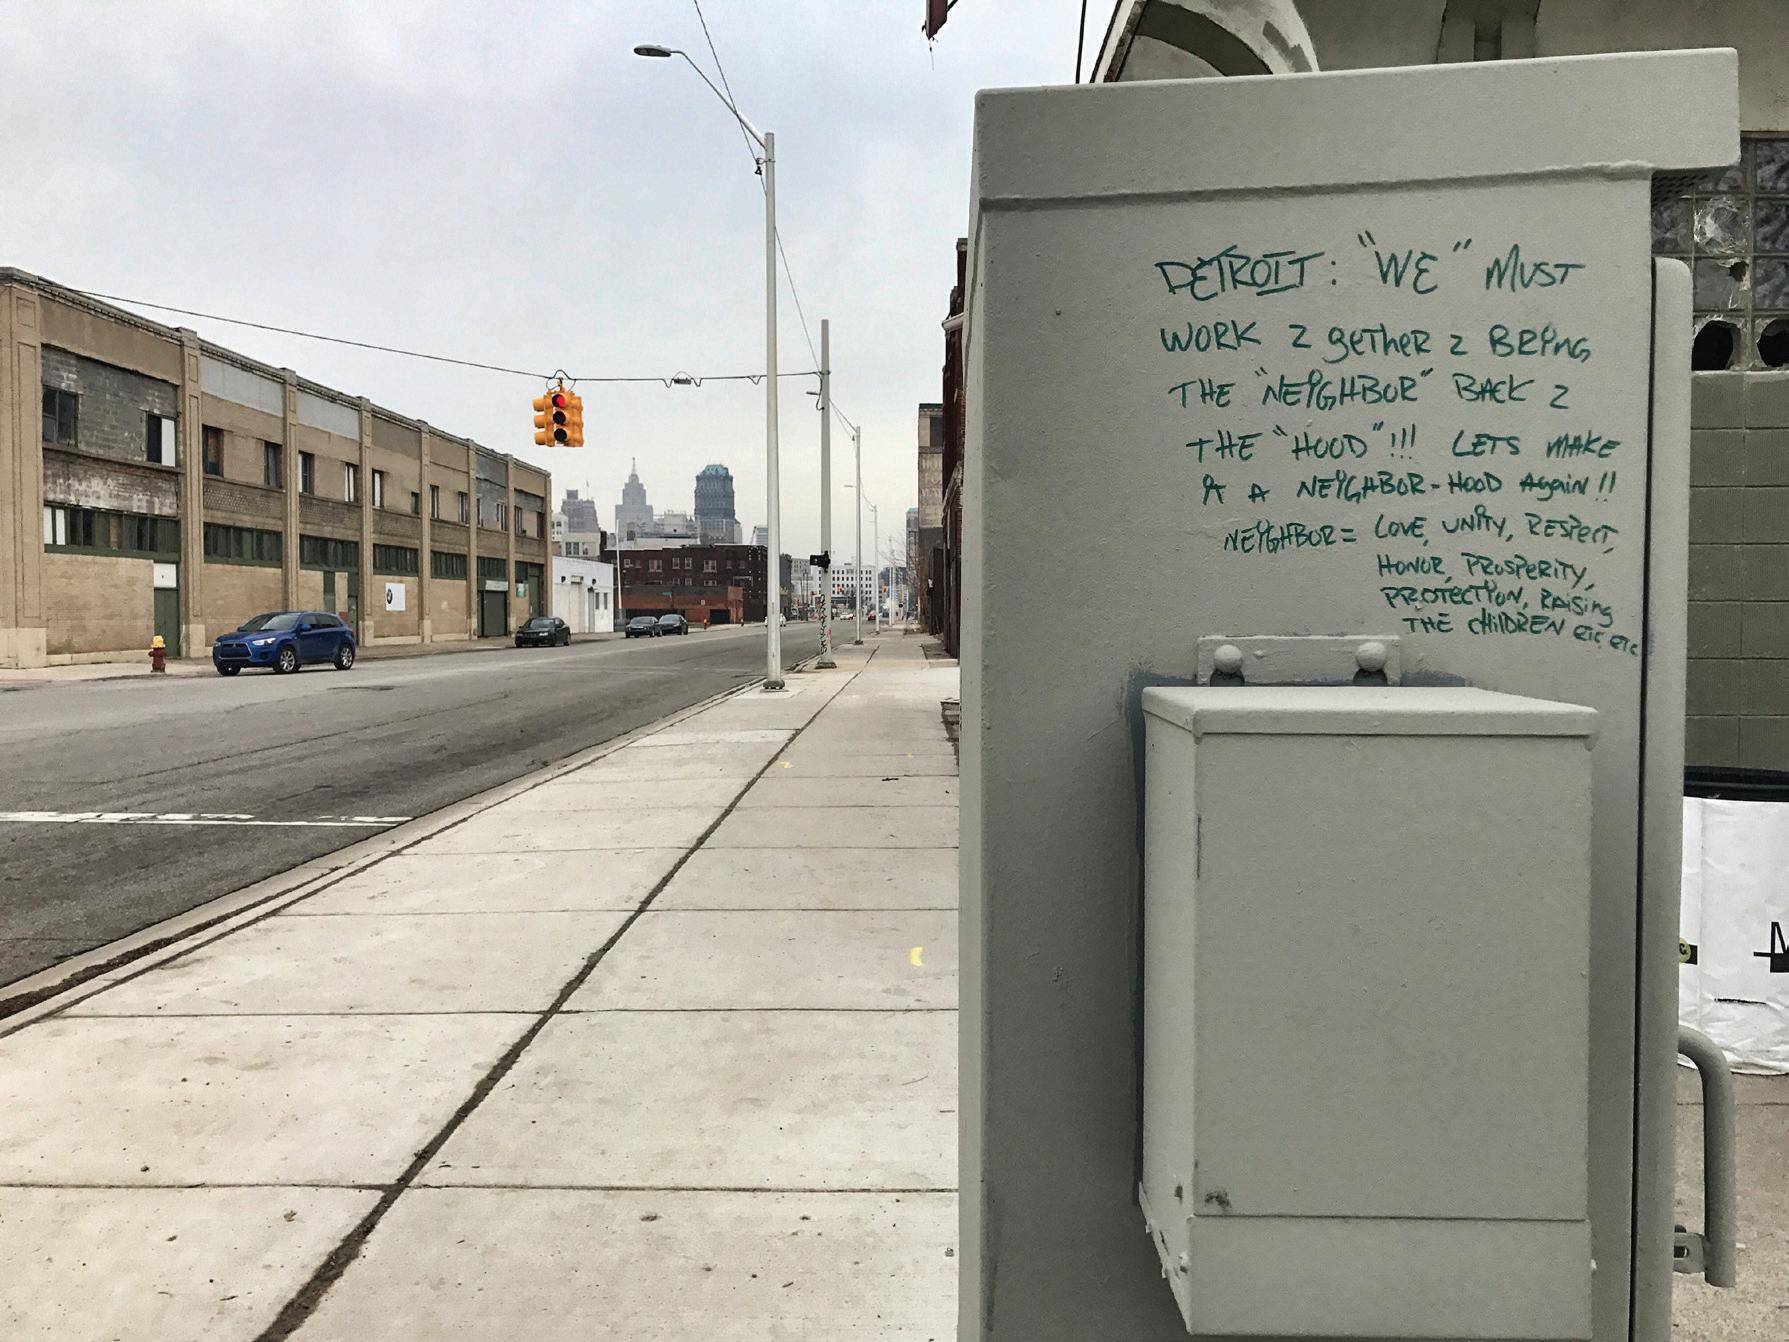
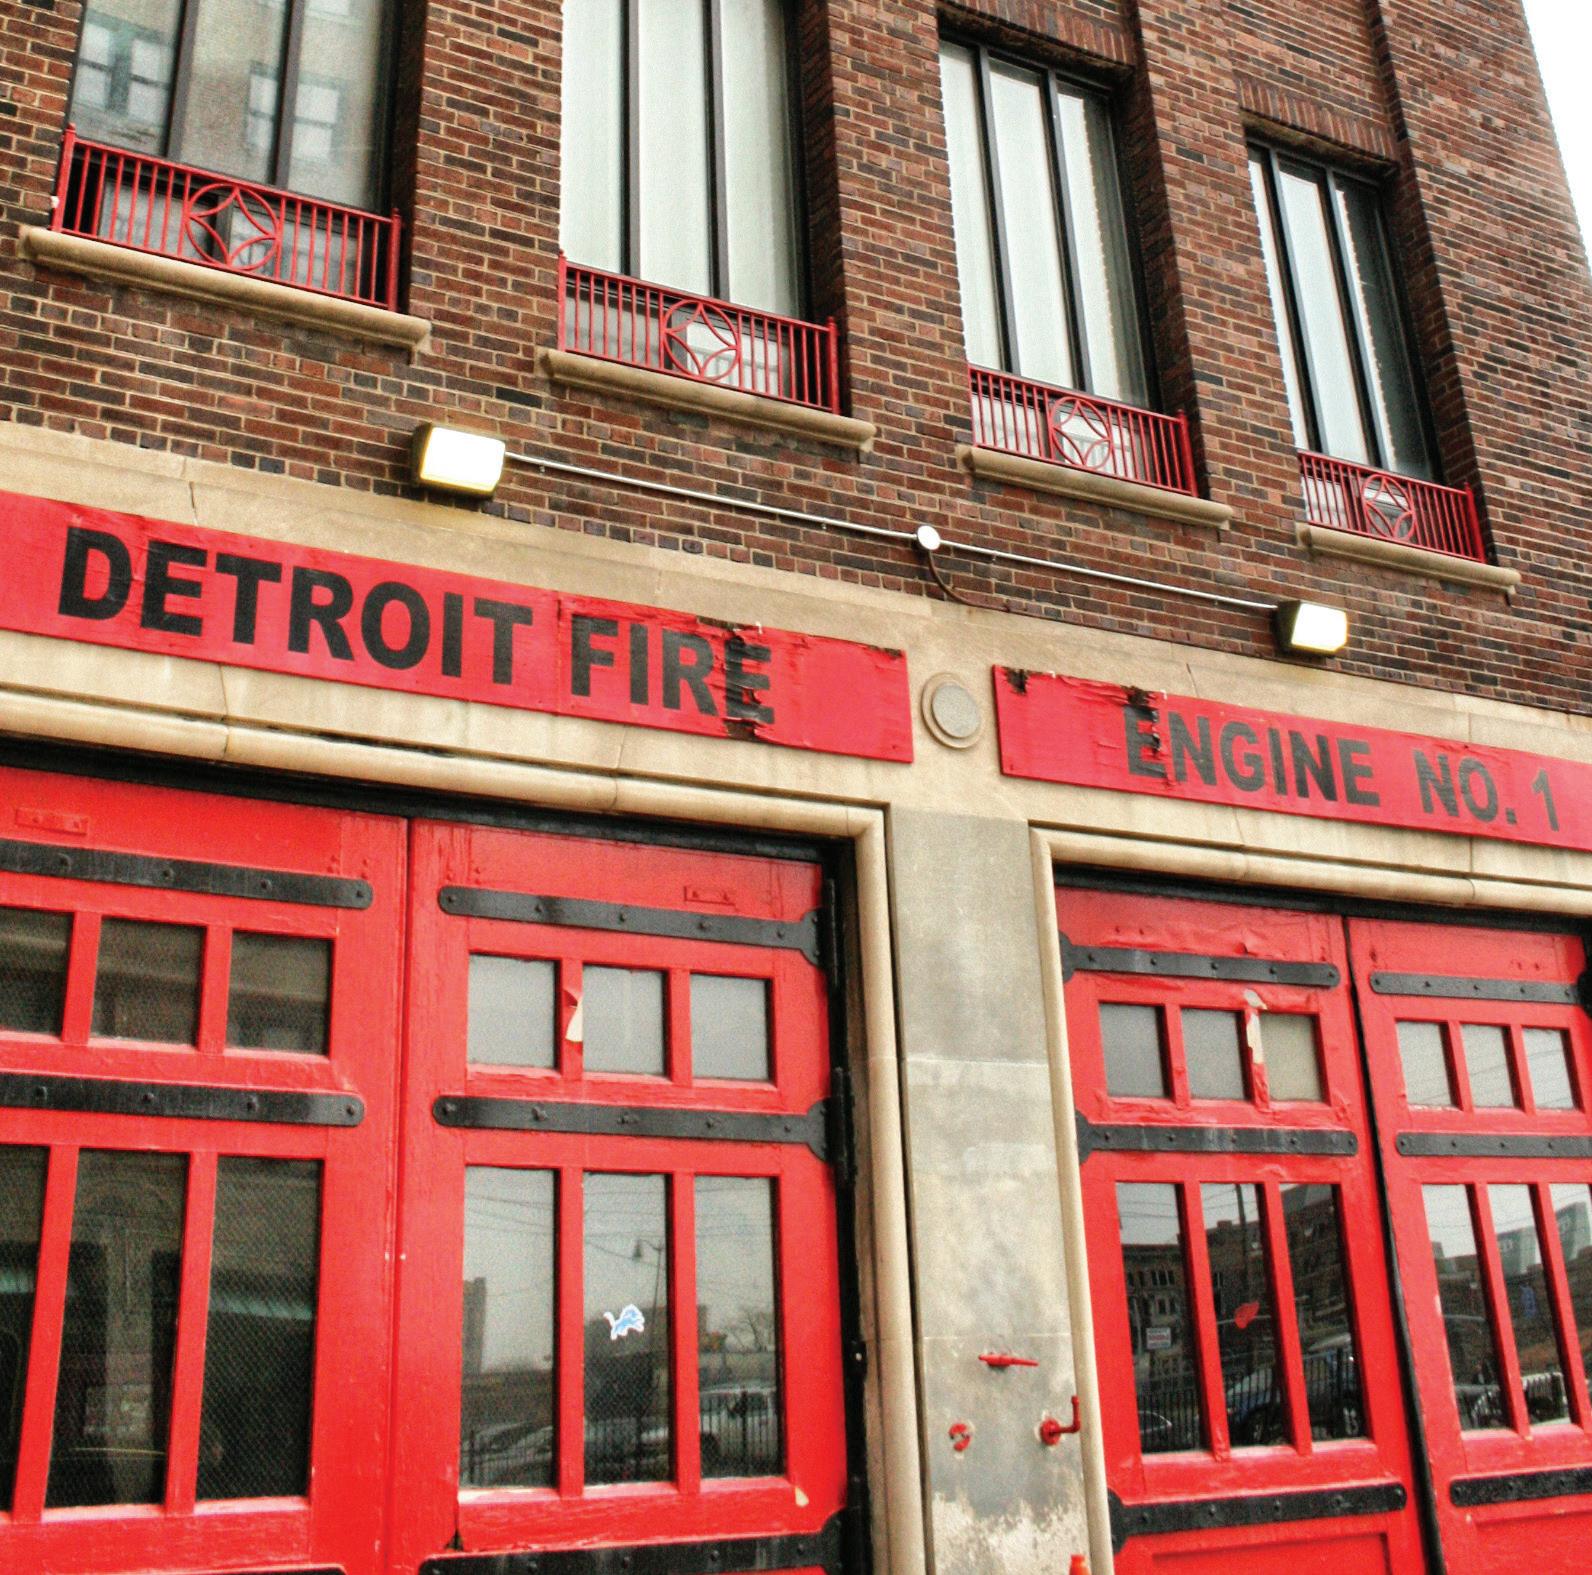
This chapter examines assets and needs around the Lower Cass Brush Park Area (LCBPA) identified from survey and data analysis. Assets are defined as community strengths, tools, or resources and needs are defined as areas of concern that require attention and/or investment. In analyzing the findings presented in the preceding chapters, the project team identified the following assets, needs, and recommendations for community leaders and decisionmakers to consider. The team has highlighted the assets and needs related to housing, jobs and economic development, social services, and transportation that are most pertinent to the future of the LCBPA. Educational resources, land use patterns, and safety conditions require further research.
Over the past two decades, 499 housing units were built in the LCBPA, the majority of which were built in the Brush Park area. This momentum shows that more families are looking to relocate to the area effectively lowering the median age, while increasing housing values and education attainment rates. As discussed in the housing analysis in the preceding chapter, housing costs in the LCBPA are relatively affordable for most households earning more than $35,000. While the median gross rent for the city at large was reportedly $747 in Detroit, it was $464 in the LCBPA. Some of this is due to the 634 income-restricted units in the LCBPA that are rented at affordable rates through various subsidy programs, including the Low-Income Housing Tax Credit (LIHTC) program. Many of these units are owned and managed by local community development corporations (CDCs).
Despite the area’s current and relatively low housing costs, renters are in need of cost-effective housing options. As mentioned earlier in this report, 60 percent of renter households in the LCBPA spent 30 percent or more of their incomes on housing costs as of 2015. This points to the continued need for affordable housing solutions in the LCBPA beyond the LIHTC program which provides subsidies for a significant number of housing units in the area. However, these subsidies are only provided to property owners for fifteen years which creates the risk that the number of affordable units will decrease quickly as a significant portion of LIHTC properties are reaching the end of their fifteen-year terms. As the private market responds to the development of Little Caesars Arena, rental costs and housing values will likely rise. Consequently, more housing subsidy programs and affordable housing solutions will need to be explored to ensure that residents of all economic statuses can live in the LCBPA.
There is also a need for investment in the existing housing stock. According to census data reported on in the housing analysis in Chapter 3, in 2015, over 60 percent of housing units were built before 1955. As discussed in the first section of this report, continued historic preservation efforts will help the LCBPA retain its character while also sustaining the number of housing units in the area.
The LCBPA is located between two of city’s more important economic hubs: Midtown and Downtown Detroit. Businesses in the LCBPA area have direct access to the Lodge Freeway and I-75 and are a short distance from the campus of Wayne State University and the Detroit Medical Center. This easy access to freeways can be an especially attractive amenity for companies that require transit for goods or employees, and for residents of the area traveling to job centers outside the LCBPA. Additionally, there are nearly 15,000 jobs in the LCBPA, many of which are in the healthcare, technology, and service industries.
While employment opportunities exist in the area, the LCBPA needs a strategic workforce development plan for current residents. As discussed in the Economic and Employment Profile, there were 3,336 residents who were sixteen or older in the study area between 2011 and 2015. Of those, 7.8 percent were unemployed and slightly under 49.9 percent were not in the labor force. By definition, this means that these individuals were neither employed nor actively looking for employment. Furthermore, in 2014, only 51 people were both employed and living in the study area. Training and opportunities for continuing education can be an important part of this strategic workforce development plan. This can help connect residents with existing jobs and those that emerge as the LCBPA continues to grow. As of 2015, while 31.5 percent of residents had attended some amount of college, only 13.4 percent earned bachelor’s degrees.
In addition to employing residents, the LCBPA also has a number of businesses that provide direct services to local residents. However, the stakeholder survey results and the analysis of proprietary business data indicated a shortage of grocery stores, pharmacies, and clothing stores in the study area (though residents were generally satisfied with the quality of what is available). This means there are opportunities to expand these retail sectors to meet area needs, which could pair with workforce development programs aimed at current residents.
There are 30 social service providers in and around the study area. As discussed in the Social Services section of the previous chapter, while these social service providers primarily focus on residents who have mental, developmental, financial, or other needs, they also offer community spaces and other resources. Six of these organizations specifically serve individuals experiencing homelessness. Additionally, several organizations build and manage affordable housing units in the area. By being densely located in the LCBPA, there may be opportunities for social service agencies to collaborate and leverage public and private resources to provide more efficient and innovative services to those in need.
Service providers in the LCBPA had an annual program budget of over $128 million and served around 120,000 individuals in 2016. As mentioned in the earlier social services analysis, according to the 2017 Point-in-Time Count conducted by the Homeless Action Network of Detroit, there were 27 more unsheltered individuals in 2017 than there were in 2016 across the city while
there were 284 less sheltered homeless individuals. Increased funding will ensure vulnerable individuals have the support and resources to meet area needs.
Residents and employees in the LCBPA have access to several high-frequency bus routes. Frequency is only one measure of transit quality, but in general, high-frequency transit options reduce the need to rely on a personal vehicle for transportation. Beginning in mid-May 2017, the newly constructed M1 streetcar rail line on Woodward Avenue will also be in operation. Highfrequency service allows residents to conveniently travel to jobs across the region, accommodates a variety of transportation schedules, and gives residents and employees more freedom to make spontaneous trips without a personal vehicle.
The LCBPA also has a large parking supply. According to parking data described in the previous chapter, the LCBPA has roughly 55 acres of parking lots, and 2,883 on-street parking spaces. These figures give city officials the opportunity to create parking regulations that will reserve spaces for LCBPA residents and businesses when the Little Caesars Arena is completed.
Based on this input and further study of the arena’s traffic impacts, policymakers should create a parking management strategy to ensure that incumbent residents and local businesses have adequate parking. Survey results indicated that residents and stakeholders are “somewhat unsatisfied”
or “very unsatisfied” with the availability and quality of current parking options. Furthermore, many are concerned that their access to parking will decrease once the arena opens. Future needs assessments should investigate how additional parking regulations would especially benefit renters and businesses who do not have access to private parking spaces.
High-frequency transit service is an important component of a quality transit system, but only if the service takes residents where they need to go. Future needs assessments should query residents to learn if the existing transit service meets their needs. Transit service connectivity between the LCBPA and employment centers beyond central Detroit should also be evaluated. Pedestrian safety is also an issue that need attention. Damaged sidewalks and bike lanes also need to be repaired to keep pedestrians and bicyclists safe. Area leaders should conduct a follow-up traffic impact study to determine if infrastructure improvements are needed at existing or potential pedestrianvehicle conflict points.
• While the LCBPA has relatively new and cost-efficient housing options, it is necessary to strategically develop and maintain more affordable housing options. Additionally, continued historic preservation efforts are needed to maintain neighborhood assets.
• Though there are almost 15,000 jobs in the LCBPA, these jobs are largely held by people not living in the LCBPA. A strategic workforce development plan is necessary to connect more residents with employment opportunities in the area. Additionally, residents face a shortage of grocery stores, pharmacies, and clothing retailers.
• There are 30 social service providers in and around the LCBPA serving a variety of clients through different services. As the number of unsheltered homeless individuals increases, additional funds will be needed to ensure that social service providers can continue to fully serve LCBPA residents.
• The LCBPA is connected to the rest of the city by several high-frequency public transit routes. However, this preliminary assessment did not investigate if these routes enable people to reach their day-to-day destinations. Additionally, survey respondents were dissatisfied with current parking options and worried that more people will be driving into the area for events at Little Caesars Arena, adding to parking difficulties.
After analyzing stakeholder survey responses, parcel survey data, and other secondary data, the project team identified key community assets and needs related to housing, jobs and economic development, social services, and transportation and parking, in addition to providing a snapshot of educational amenities, land use, and public safety conditions. As the LCBPA continues to rapidly evolve, it is critical that community leaders and elected officials recognize these assets and prioritize addressing the needs of current residents, businesses, and employees.
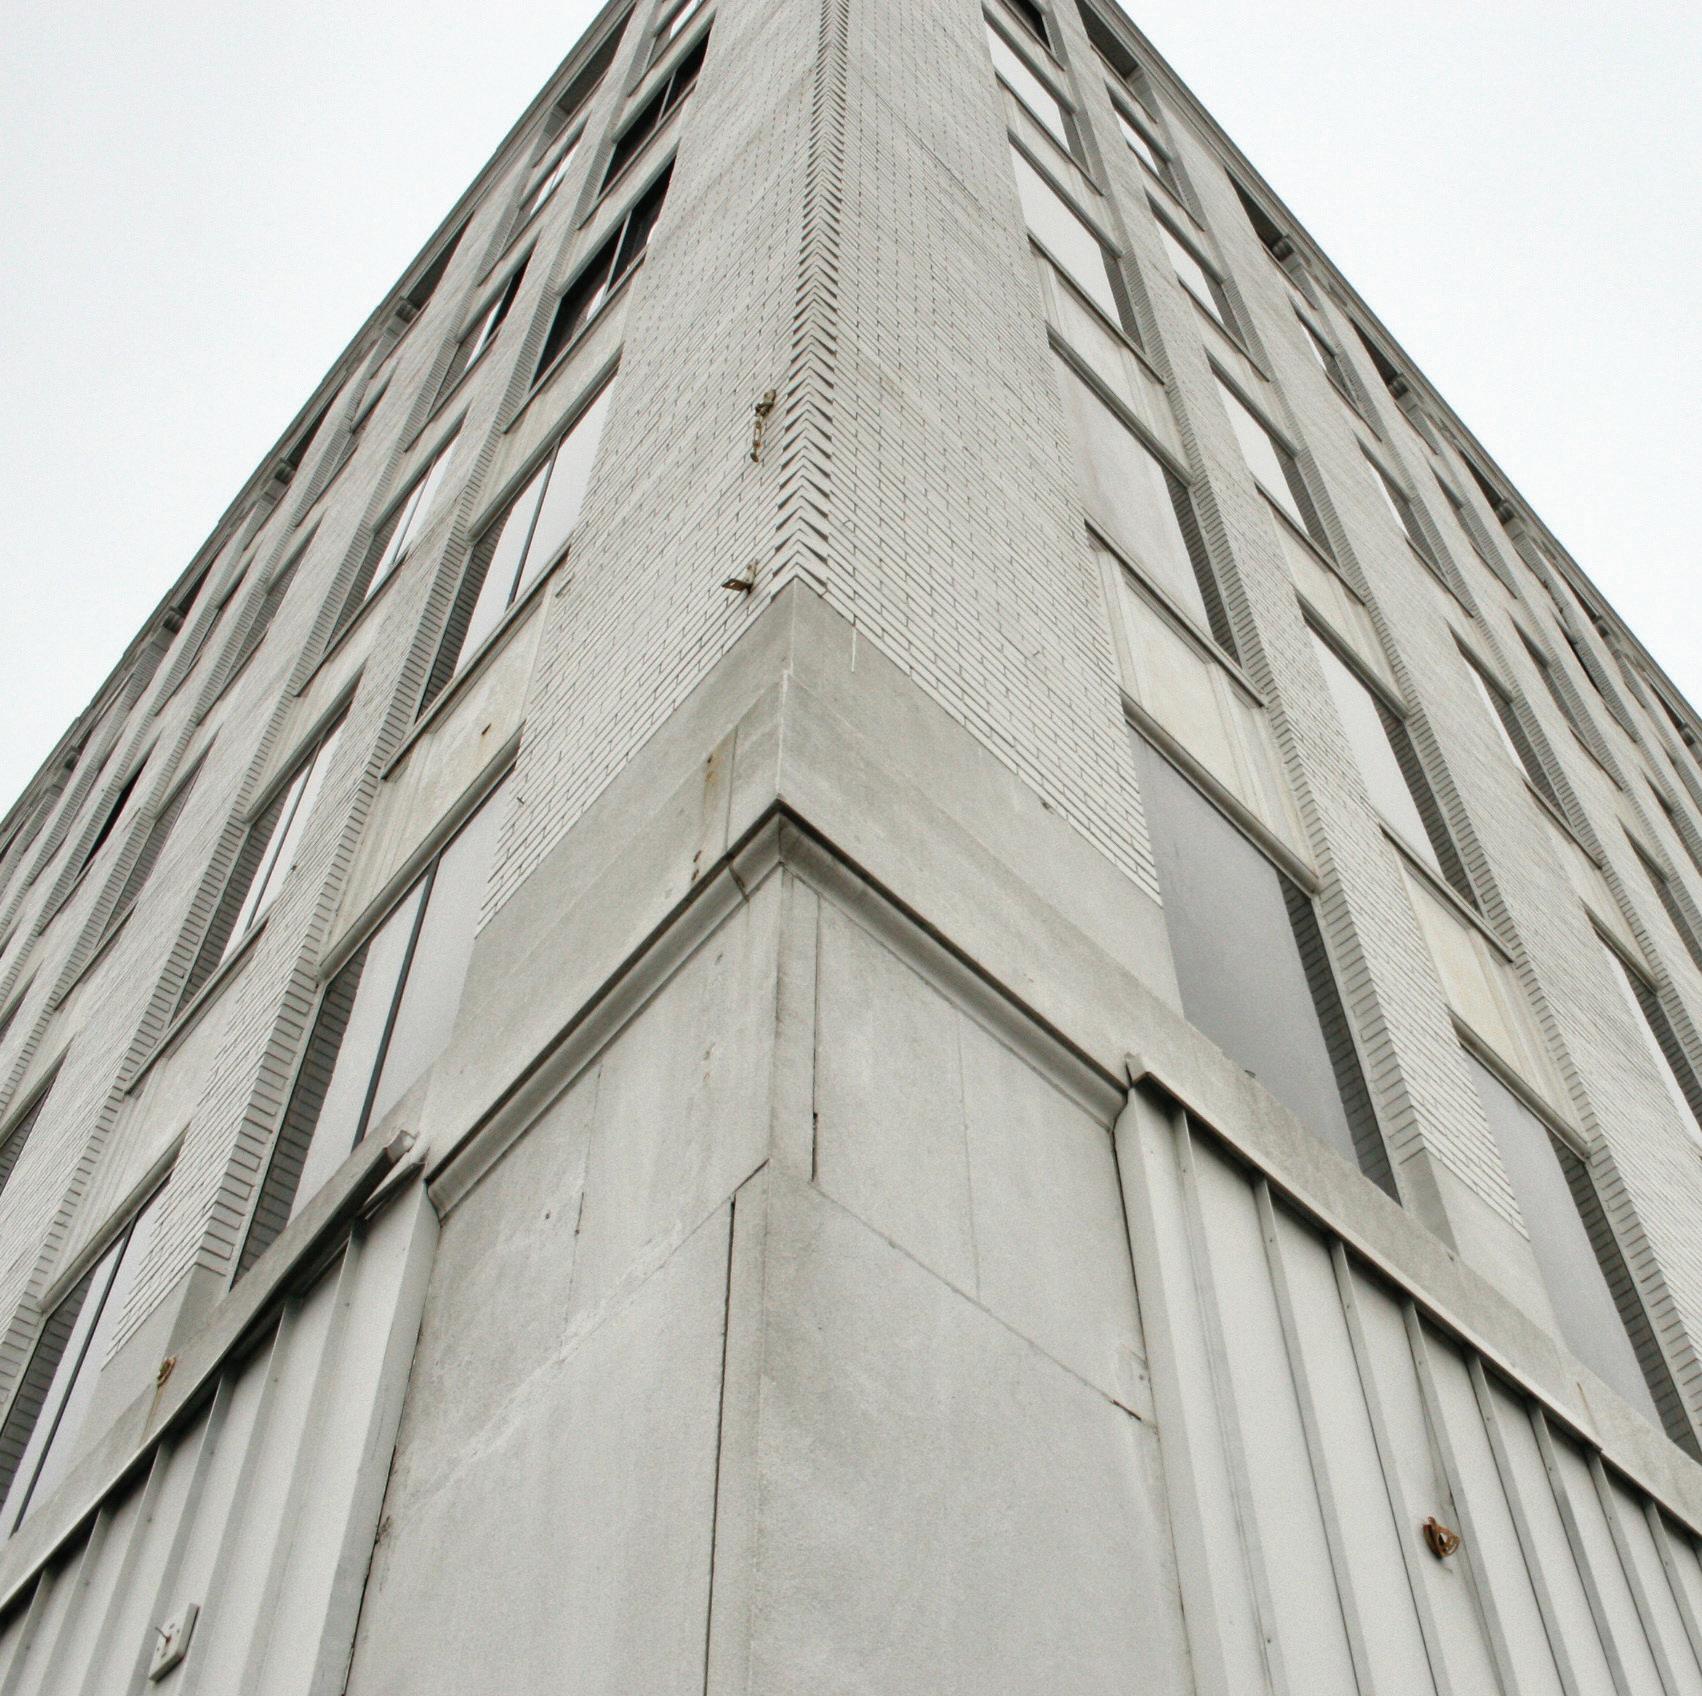
This survey is being conducted by JFM Consulting Group on behalf of the City of Detroit Downtown Development Authority as part of a community needs assessment, and is focused on the area surrounding the new arena currently under development, which, for purposes of this survey only, will be referred to as “the District”, (please refer to the map at the back of the survey). The purpose of this survey is to collect information from stakeholders like you to help the DDA better understand the community’s needs and the potential impact of the arena development on the community. This survey is voluntary and confidential, and no individual responses will be shared. You must be at least 18 years old to complete the survey.
Please return the survey by Wednesday, April 5, 2017. Respondents will receive a $5 gift card for completing the survey. If you have any questions about the community needs assessment, please contact JFM Consulting Group at 313.818.3000 or jfmcg@jfmconsulting.net.
1. Are you at least 18 years old?
o Yes
o No (If No, please do not complete the survey. Respondents must be at least 18 years old.)
2. What is your relationship to the District, the area shown in the map? Do you…(select all that apply)
o Live here
o Work here
o Own residential or commercial property here
o Own a business here
o Work for a service provider
o Other_____________________________
3. How long have you had this relationship to the area? (select only one)
o Less than 3 years
o 3-5 years
o 5-10 years
o More than 10 years
4. How likely is it that you will move away from this neighborhood within 1-2 years?
o Very likely
o Somewhat likely
o Not very likely
o Not likely at all
o Don’t know/unsure
o I don’t currently live in this neighborhood
4.A If you responded Very Likely or Somewhat Likely to move, what might be the primary reason? (select only one)
o Increasing rents
o Want a single family home
o Want a larger home
o Too much congestion
o Don’t want to live near an arena
o I don’t like the way the neighborhood has changed/is changing
o Other _______________________
Section 2: Neighborhood Services and Amenities
5. How satisfied are you with the availability of the following neighborhood amenities and services? Very satisfied Somewhat satisfied Somewhat unsatisfied Very unsatisfied Don’t Know/ Not Sure
a. Health care services
b. Childcare services
c. Retail goods
d. Grocery stores/markets
e. Food service (restaurants/cafes)
f. Home services, such as dry cleaners or hardware stores
g. Housing options
h. Parking spaces
i. Local schools
j. Emergency response
k. Parks and recreation opportunities
l. Public transportation
m. Bike lanes
n. Public art
o. Hospitality/lodging
6. How satisfied are you with the overall quality of the following neighborhood amenities and services?
Not Sure
a. Health care services
b. Childcare services
c. Retail goods
d. Grocery stores/markets
e. Food service (restaurants/cafes)
p. Home services, such as dry cleaners or hardware stores
f. Housing options
g. Parking spaces
h. Local schools
i. Emergency response
j. Parks and recreation opportunities
k. Street lighting
l. Road conditions
m. Garbage/recycling pick-up
n. Public transportation
o. Bike lanes
p. Public art
7. Which of the following services and amenities would you most like to see more of in the neighborhood? (Please choose ONLY your top 4)
o Health care services
o Childcare services
o Retail goods
o Entertainment
o Parking options
o Schools
o Parks and recreation opportunities
o Public transportation
o Other_________________
o Bike lanes
o Food service, such as restaurants and cafes
o Food retail, such as grocery stores or markets
o Hospitality/lodging
o Home services, such as dry cleaners or hardware stores
o Public art
8. How would you prioritize the housing options that are most needed in the area? (Please choose ONLY 3 options)
o Housing for lower-income households
o Housing for middle-income households
o Housing for upper-income households
o Housing for a mix of incomes
o Housing for families (3+ bedrooms)
o Rental housing
o For-sale housing
o Condos
o Other___________________
9. Overall, how often would you say you visit a business in this neighborhood?
o About once a week
o More than once a week
o About once a month
o About once a quarter
o Once a year or less
10. About how much of your shopping for goods or services would you say that you currently do within the neighborhood?
o Less than 25%
o About 25-50%
o About 51-75%
o About 75-100%
10. Overall what do you think are three (3) things you appreciate about the neighborhood? 1. 2. 3.
11. What are up to three (3) things you would like to see change in the neighborhood?
12. Most days, how do you travel to or within the neighborhood?
o Walking
o Biking
o Bus
o Uber/Lyft/taxi/other car service
o Getting a ride with family, friends or neighbors
o Car or personal vehicle
o Other: __________
13. Do you own a car?
o Yes (answer Qs 15-16)
o No (skip to Q17)
14. If you own a car, where do you usually park?
o Private lot, but no designated spaces
o Private parking space, private garage, etc
o Other _________________________________________________________
15. How easy or difficult would you say it is to find parking in the neighborhood?
o Very easy
o Somewhat easy
16. In general, how safe do you feel in this neighborhood…
a. Overall?
b. Inside your home (if you live here)?
c. Walking down the street during the day?
d. Walking down the street at night?
o Somewhat difficult
o Very difficult
Very Safe Somewhat Somewhat Very Don’t safe unsafe unsafe know
17. What are your two top biggest concerns around crime and safety in the neighborhood?
2. ____________________________
18. How would you describe the police presence in the neighborhood?
o More than enough
o Just the right amount
o Not quite enough
o Not enough at all
o Don’t know/not sure
19. Overall, what impact do you believe Little Caesars Arena will have on the neighborhood?
o Very positive
o Somewhat positive
o Somewhat negative
o Very negative
20. When you think about the impact of the Little Caesars Arena, what do you most want to see in the neighborhood? (Please ONLY choose 4 options).
o New job opportunities
o Diversity of new businesses
o More housing opportunities
o Cleaner streets and neighborhood
o More walkability
o Increasing property values
o Increase in safety
o Other_________
21. How concerned are you about the potential impact of the new arena on the following…
Very concerned Somewhat concerned Not very concerned Not concerned at all Don’t Know/ Not Sure
a. Not enough parking spaces
b. More car traffic
c. Pedestrian safety
d. Higher rent and housing costs
e. Displacement of existing residents
f. Increase in crime
g. Pollution
h. Trash and litter
i. Construction-related interruptions
j. Other:
Section 4: Please tell us about yourself
22. What is your age?
o 18 to 24 years
o 25 to 49 years
23. What is your gender?
o Woman
o Man
o Prefer to self-describe:
o 50 to 74 years
o 75 years and over
24. What race(s)/ethnicities do you identify with? Please select all that apply.
o African American or Black
o American Indian and Alaska Native
o Arab/Middle Eastern
o Asian/Native Hawaiian/Pacific Islander
o Hispanic/Latino
o White
o Some other race
o Prefer not to answer
25. Which of the following categories best describes your employment status?
o Employed full-time
o Employed part-time
o Self-employed
o Unemployed
26. What range represents your household income?
o Under $25,000
o $25,001- 50,000
o $50,001-100,000
o Student
o Homemaker
o Retired
o $100,001 - $150,000
o $150,001 or higher
27. If you live in the neighborhood, how many people currently live in your household (including yourself)?
o 1
o 2
o 3
o 4
o 5 or more
28. If you live or have a business in the neighborhood, do you own or rent the property?
o Own
o Rent
29. As a resident, do you plan on making any investments to improve your property?
o Yes
o No
o Don’t know/not sure
o I do not own my home/property.
30. As a business owner, do you plan on making any investments to improve your business?
o Yes
o No
o Don’t Know/Not sure
31. What is the closest intersection to your residence or business? Please share cross-street names. &
Please tell us your name and how you would like to be contacted to receive the survey incentive. Your name and contact information will be kept separate from your completed survey:
Name: ____________________________________________________
Email address: __________________________________
Mailing address: _____________________________________________
Phone number: _____________________________________________
Would you be willing to be interviewed or participate in a focus group to further share your thoughts and concerns about the community? Participants will be offered an incentive for their participation.
o Yes
o No
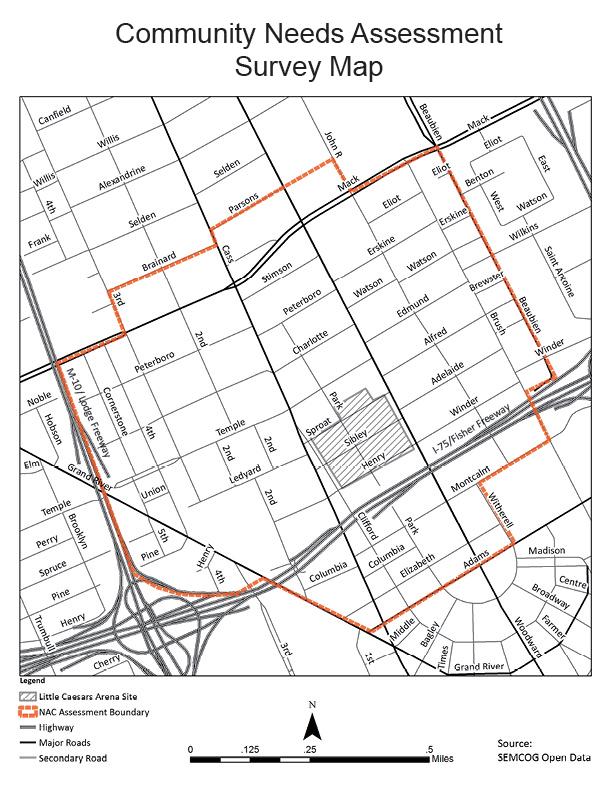
The project team used mobile apps from Loveland Technology and ESRI Collector to gather and map information on physical conditions. Loveland’s tool helped surveyors to assess whether each property was in use or vacant, under development, in need of repairs—along with its main land use (residential, retail, etc.).
ESRI’s Collector mobile application was used to develop a customized survey for the LCBPA, in response to concerns from area stakeholders. Sidewalk conditions and parking availability may become larger neighborhood issues as traffic increases. The following pages detail survey instructions and sample screen shots from Collector and Loveland.
The following instructions were distributed to student surveyors using the ArcGIS Collector mobile application to record street and sidewalk conditions and can used for future data collection:
Use the survey tool Collector for ArcGIS to record the location and condition of sidewalks, sidewalk ramps, and the location of free or metered on-street parking. The following instructions describe how to record this information on the Collector map as point and line features.
Adding Features to the Map

1) Press the icon to add a feature to the map
2) Select the point or line feature you need from the Attributes list.
3) After you’ve made your selection, edit or add to the feature’s attributes per the instructions below, and take a photo.

4) When you’ve finished your edits, press the icon. Once the map appears, specify the feature’s location on the map.
5) To add a point feature, press the feature’s location on the map. If you press and hold, you will be able to zoom in to place the point. Selected points or line vertices appear in red. You can change any point’s location after it is place by selecting it, and pressing on a new location.
6) To add a line feature, specify the line’s starting location in the same way you would add a point. After the first point is placed, repeat the process to add an endpoint. You can keep adding points if you would like to draw line features that continue around corners.
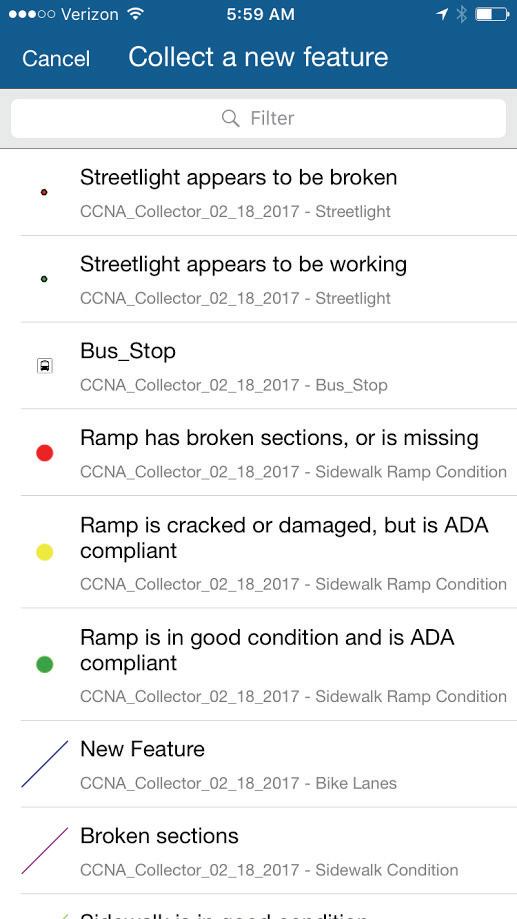
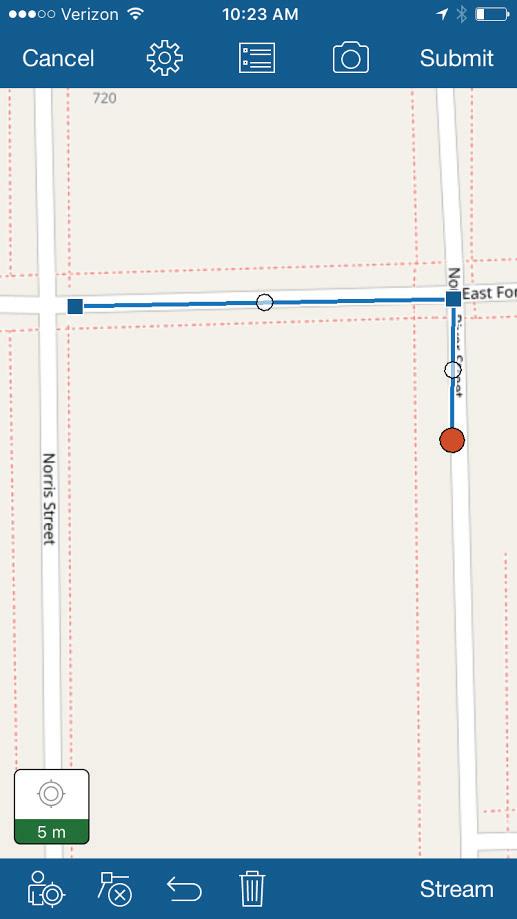
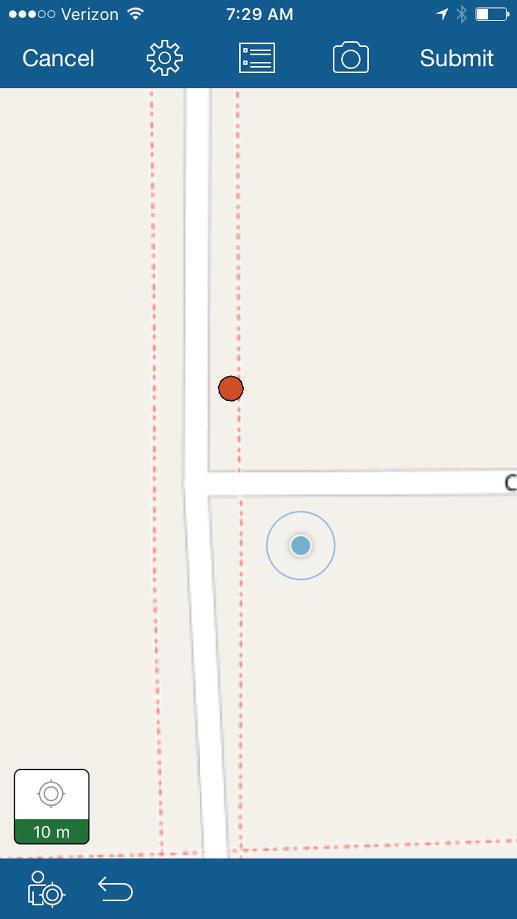
3. Point feature example
Free and Metered Street Parking Definitions
Add line features to mark lengths of street where free or metered street parking appears to be legal.
Sidewalk Ramp Condition Definitions
The sidewalk and sidewalk ramp condition criteria outlined below are based on the Federal Highway Administration’s publication Accessible Sidewalks and Street Crossings – an informational guide.1 The criteria for this survey are meant to capture the central elements of the FDA’s accessibility requirements, but are not as comprehensive or detailed.
Ramp is in good condition, and is ADA Compliant.
Criteria
• Ramp and flare slope generally match grades shown in the diagram to the right.
• Ramp is approximately four feet in width.
• Ramp has a detectable warning surface at the street transition to alert
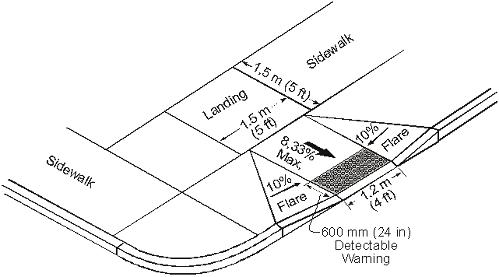
visually-impaired pedestrians.
• Transition points are flush to the street and sidewalk.
• Ramp should be perpendicular to the curb surf
Ramp is cracked or damaged, but is ADA compliant.
Criteria:
• Meets criteria of a “Good Condition” ramp, but has minor surface cracks.
Ramp has broken sections or is not ADA compliant.
Criteria:
• Image: Though it is relatively new, this ramp is not ADA compliant. The curb and pole block the sidewalk and ramp access. 2
• Missing detectable warning surface.
• Cracked or uneven transition surface heights of two inches or greater.
• Exposed ground or crushed concrete that would turn to mud.
Sidewalks Condition Definitions
Sidewalk is in good condition, and is ADA Compliant.
Criteria:
• Sidewalk width of approximately four feet.
• Sidewalk surfaces and elevation are level.
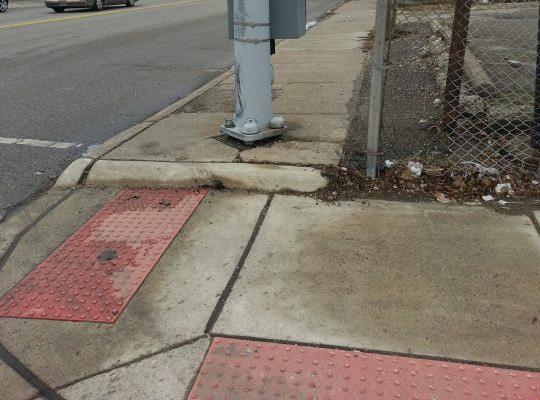
Even, clean and no cracks/grass
• Sidewalk panels are flush and level.
• No gaps or grating on the sidewalk surface greater than one-half inch.
• No wall or post-mounted obstacles.
Ramp is cracked or damaged, but is ADA compliant.
Criteria:
• Meets criteria of a “Good Condition” sidewalk, but has minor surface cracks.
Ramp has broken sections or is not ADA compliant.
Criteria:
• Uneven sidewalk panels or cracks of two inches or greater.
• Exposed ground or crushed concrete that would turn to mud.
• Approximate sidewalk width of less than four feet.
Permanent or temporary obstacles or barriers.
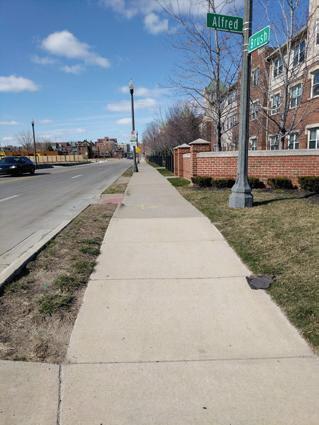
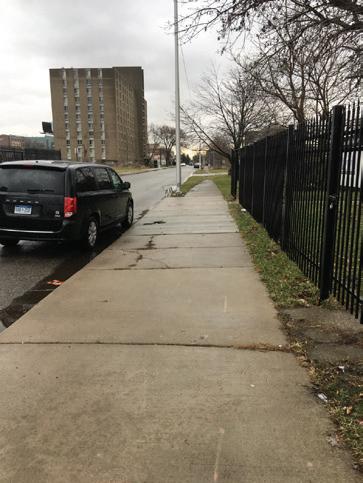
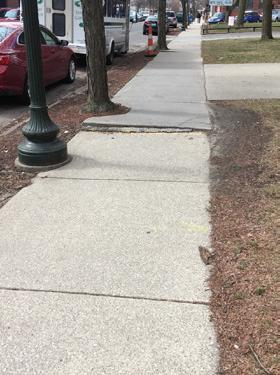
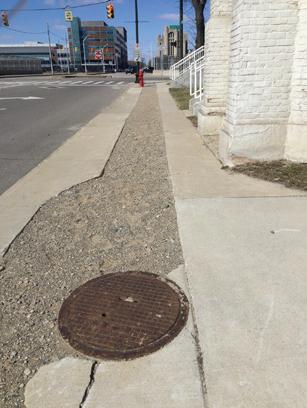
The following instructions were distributed to student surveyors using the ArcGIS Collector mobile application to record parcel uses and building conditions and can be used for future data collection:
Use the Loveland survey tool to record land use conditions. The tool will display your location on a parcel map. To enter survey data, select the parcel you would like to survey, and follow the survey instruction questions. The questions will be different depending on the parcel conditions you specify. Make sure to include a photograph of each parcel you survey. If adjacent parcels have identical conditions, you only need to survey one. In these cases, make sure your photo captures all of the adjacent parcels you intend to survey, and leave a note specifying the parcels you meant to include.
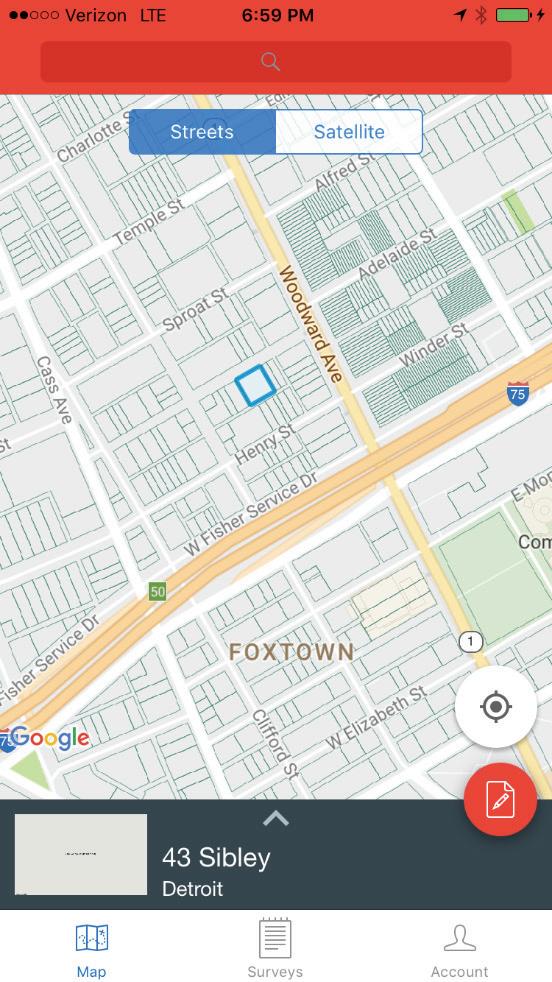
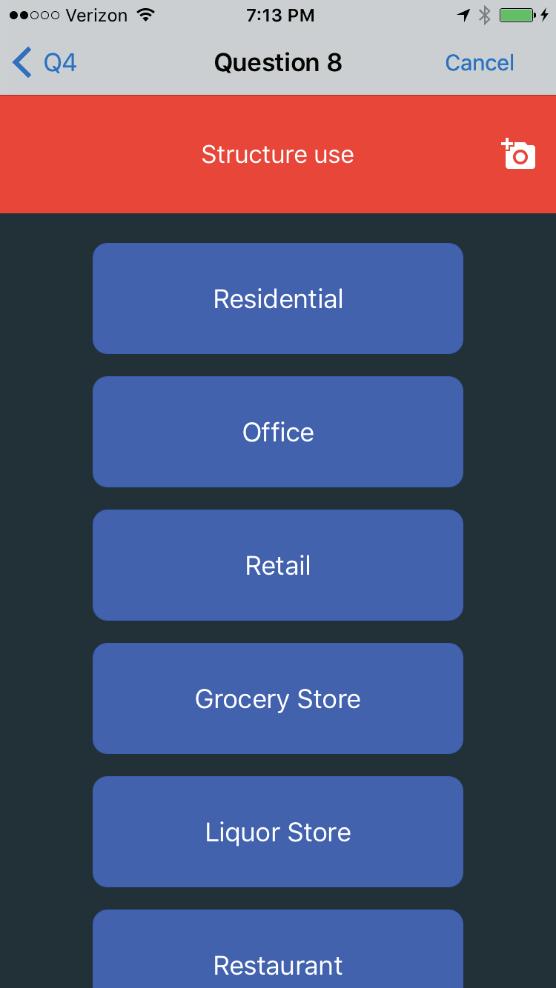
The following table includes parcel survey questions you may be prompted to complete and the instructions or criteria for answering each question.
Location Name
(Text field) The name of the building, business, park, agency, etc. that occupies the property (if none, leave blank)
Name of Developer
(Text field) Enter developer name, if applicable and/or available.
Is the site fenced?
Yes, and secured
Yes, but unsecured
The site is fenced, with or without a structure. The fence is intact, with all gates locked or secured, preventing public access to the property.
The site is fenced, with or without a structure. The fence has broken, missing, or open sections, or open or unlocked gates, that allow public access to the property.
No No fence
Is there a structure on the site?
Yes
No
Permanent structures or buildings, including garages and sheds, that are not moveable. This includes occupied structures, dilapidated structures, and structures currently or recently under construction, but are incomplete
The lot is empty of structures, but it may be paved or have fences, construction materials, excavation, cars, or any other moveable object
Survey will direct to “Questions for sites without structures” or skip to “Questions for structures”
Is the site used for any of the following?
Park Includes traditional parks, playfields, playgrounds, barbeque facilities, or recreational spaces
Garden/farm Includes community gardens or farms
Paved parking lot
Unpaved parking lot
Vacant, no structure
Any paved lot used for parking multiple vehicles temporarily
Any unpaved lot used for parking multiple vehicles temporarily, including grass or gravel lots
Vacant, no structure
Other If you select this option, the “Please list the uses here:” question below will appear
Please list the uses here:
(Text field) Enter any use not listed in the previous question, or any combination of uses including, but not limited to, the options above
Does the site appear to be under development?
Yes Evidence of development including signs, survey stakes, or excavation, but no construction
No No evidence of development
End of non-structure section, survey will direct to “Final questions for all sites.”
Structure use
Residential Includes single-family homes, duplexes, apartment buildings, facilities, condominiums, row houses, and any garages or sheds that exist, alongside them
Office Building that houses employees of a company or organization, primarily for support services
Retail Business that promotes, distributes, or sells products and services
Grocery Store Supermarket, market, or grocery store
Liquor Store Store that sells liquor and day-to-day necessities, not a primary food source
Restaurant A place where people pay to eat food that is prepared on site
Industrial Includes properties used for manufacturing, storage areas, warehousing, junk yards, landfill operations, and waste disposal sites
Educational Public or private school
Public Service Provider
Any private or public non-profit organizations, homeless shelters, food pantries, etc.
Institutional Public institutions, such as government offices or departments, or police and fire
Mixed use/Other
If you select this option, the “Please list the uses here:” question below will appear
Please list the uses here:
(Text field) Enter the different uses for a mixed used structure. This might be a mix of any of the options form the “Structure use” question, or any other use not previously listed.
Is the structure under development?
Under construction Structure is currently under construction or was recently, but is not yet complete.
Under renovation Existing structure that is being repaired or expanded
No
Existing structure not under any visible construction or renovation
Does the structure appear to be occupied?
Yes
No
The structure shows visible activity and consistent use or maintenance. Common characteristics are: porch furniture, a well-kept lawn, good landscaping, fences, cars in the driveway, a maintained garden, play area, and so on.
Common characteristics are: neglected facades, eviction notices, empty interiors, substantial physical or structural damages, extensive security measures, uncut or tall grass, weeds, scrub trees, trash or debris accumulated over time, accumulated flyers on the porch or door, and so on
Maybe The property displays characteristics from both categories above, making it difficult to assess whether there is consistent use or maintenance
Housing Units
0 Garage, shed, or other accessory structure
1 A detached house or single townhome (Cues: one front door or one mailbox)
2-3 Includes duplexes or parcels with two to three townhomes (Cues: two to three doors or mailboxes)
4+ Estimate for when it is not possible to count units. Includes apartment buildings or parcels with four or more townhomes (Cues: a multi-level building, multiple mailboxes or doorbells etc.)
Unit Count
(Enter Count Number)
If it is possible to count the number of units (or doorbells or mailboxes), enter your count here.
What is the condition of the structure?
Standard or minor issues
Standard:
The structure appears structurally sound. It needs no more than two minor repairs. The building is not leaning or tilted and the foundation is in good shape. The building may need some general maintenance such as repainting, repointing (new mortar between bricks), or replacement/repair of windows.
Minor issues:
Minor cracks in foundation may be visible, but no major cracks or holes appear to exist. Structural walls require minor repairs such as residing or repainting but are otherwise in good condition.
Major structural Issues
Dilapidated
Foundation appears to have major cracks and fissures and/or is crumbling. Foundation and/or structural walls need major repairs. Façade is detaching from the structure. Balconies (if structure is multistory) are collapsing and causing damage.
Structural walls are buckling, leaning, or tilting. Significant damage or decay to the point that structure appears to be a safety hazard, including fire damage.
Is the structure in need of boarding?
Yes
No
The structure has a point of entry such as a broken or missing window or door, including windows on the second floor. The structure may be unstable and dangerous.
All entry points are covered.
Is there dumping on the site?
Yes Dumping is purposefully discarded and unwanted items on a property, including tires, furniture, old electronics, construction material, and other large items or piles.
No Small pieces of trash or litter that can be easily picked up by hand do not constitute dumping.
Notes
(Text Field)
1 Federal Highway Administration, “Accessible Sidewalks and Street Crossings - an Informational Guide,” accessed May 2, 2017, https://nacto.org/wpcontent/uploads/2015/04/accessible_sidewalks_and_street_crossings_boodlal.pdf.
2 “Detroit Greenways Coalition | Making Detroit a World-Class City for Biking and Walking,” Detroit Greenways Coalition, accessed May 2, 2017, http://detroitgreenways.org/.