mcCaleb
Dean, The College of Graduate Studies

Dean of Students
Associate Vice President, Student Affairs
Division of Student
Engagement & Success
Dr. Lisa Perez


9,776 9,323 8,483 8,027 7,824 2,153 2,129 2,337 2,735 2,9542,000 4,000 6,000 8,000 10,000 12,000 Fall 2018 Fall 2019 Fall 2020 Fall 2021 Fall 2022
Undergraduate Graduate
$36,362


Over a 50% increase in Graduate Semester Credit Hours

Classification 2021 2022 Difference 2021-2022 Freshmen 2,119 2,358 11.28% Sophomore 1,395 1,440 3.23% Junior (COVID Cohort) 1,914 1,638 (14.42%) Senior (COVID Cohort) 2,405 2,213 (7.98%) Graduate 2,929 3,130 6.86% TOTAL 10,762 10,779 0.16%
Classification 2022 2023 Difference 2022-2023 FTIC 1,909 1,989 4.14% Transfer 514 569 10.70% Graduate/Masters 532 608 14.29% Graduate/Doctoral 32 42 31.25% TOTAL 2,987 3,208 7.40%
Classification 2022 2023 Difference 2022-2023 Freshmen 2,303 2,438 5.86% Sophomore 1,343 1,531 14.00% Junior 1,588 1,651 3.97% Senior (COVID Cohort) 2,131 1,889 (11.36%) Post Bac 180 133 (26.11%) Graduate/Masters 2,591 2,680 3.43% Graduate/Doctoral 229 249 8.73% TOTAL 10,365 10,571 1.99%
Classification 2022 2023 Difference 2022-2023 Remedial 852 730 (112) (14.32%) Low Division 53,293 56,482 3.189 5.98% Upper Division 38,669 38,122 (547) (1.41%) Graduate/Masters 10,717 10,776 59 0.55% Graduate/Doctoral 3,814 4,771 957 25.09% TOTAL 107,345 110,881 3,536 3.29%

12.1% increase in number of degrees awarded over the past 4 years
From 2,484 to 2,785
•
•
Phi Theta Kappa Transfer Honor Roll


MS Data Science
MS Engineering BS Early Childhood Education
BS Special Education
English as a Second Language
Minor
Black Studies
Minor
Photography Minor
Literacy Coaching Certificate
Social Media Certificate
Gulf of Mexico Studies Certificate
Additional formula funding Hazlewood funding (42% of our Hazlewood tuition & fee waivers)
State Appropriations increased by $6.7 million during the legislative session. Comprehensive Regional University funding
(increased by 45%)
Increase in Comprehensive Research funding

(total $3M)
New Arts & Media Building
Undergraduate Students (enrolled in 15 SCH) Freshman/New Transfer Cohort Optional One Year Guaranteed Rate Fall 20&21 Fall 23 Fall 20&21 Fall 23 Undergraduate Resident - ALL Others $5,016 $5,016 $5,266 $5,266 College of Engineering $5,322 $5,322 $5,588 $5,588 College of Nursing & Health Sciences $5,219 $5,219 $5,480 $5,480 College of Business $5,104 $5,104 $5,359 $5,359
Resident
Employee Retention Plans

AMOUNT Faculty: 3% Performance Based Pool 802,600 $ Promotions 543,300 Benefits 241,300 $1,587,200 Staff: 3% Performance Based Pool $1,771,100 Benefits 313,100 $2,084,200 $3,671,400 Faculty Subtotal: Staff Subtotal: Total: FY 2024 EMPLOYEE RETENTION PLAN

FACULTY: $3M STAFF: $2M
● Office of General Counsel, Governmental Relations, and A&M-CC Administration will be sharing updates on legislation that may impact smaller units or very specific groups on campus.
● SB 18:
o Our current Promotion &Tenure policies and processes are compliant.
● SB 17:
o Our hiring practices were already in line with Federal requirements.
o A&M-CC is represented on the TAMUS Taskforce.
o Taskforce is working through questions, developing guidelines & FAQs, and communicating with other university systems.
o Law not in effect until January 1, 2024
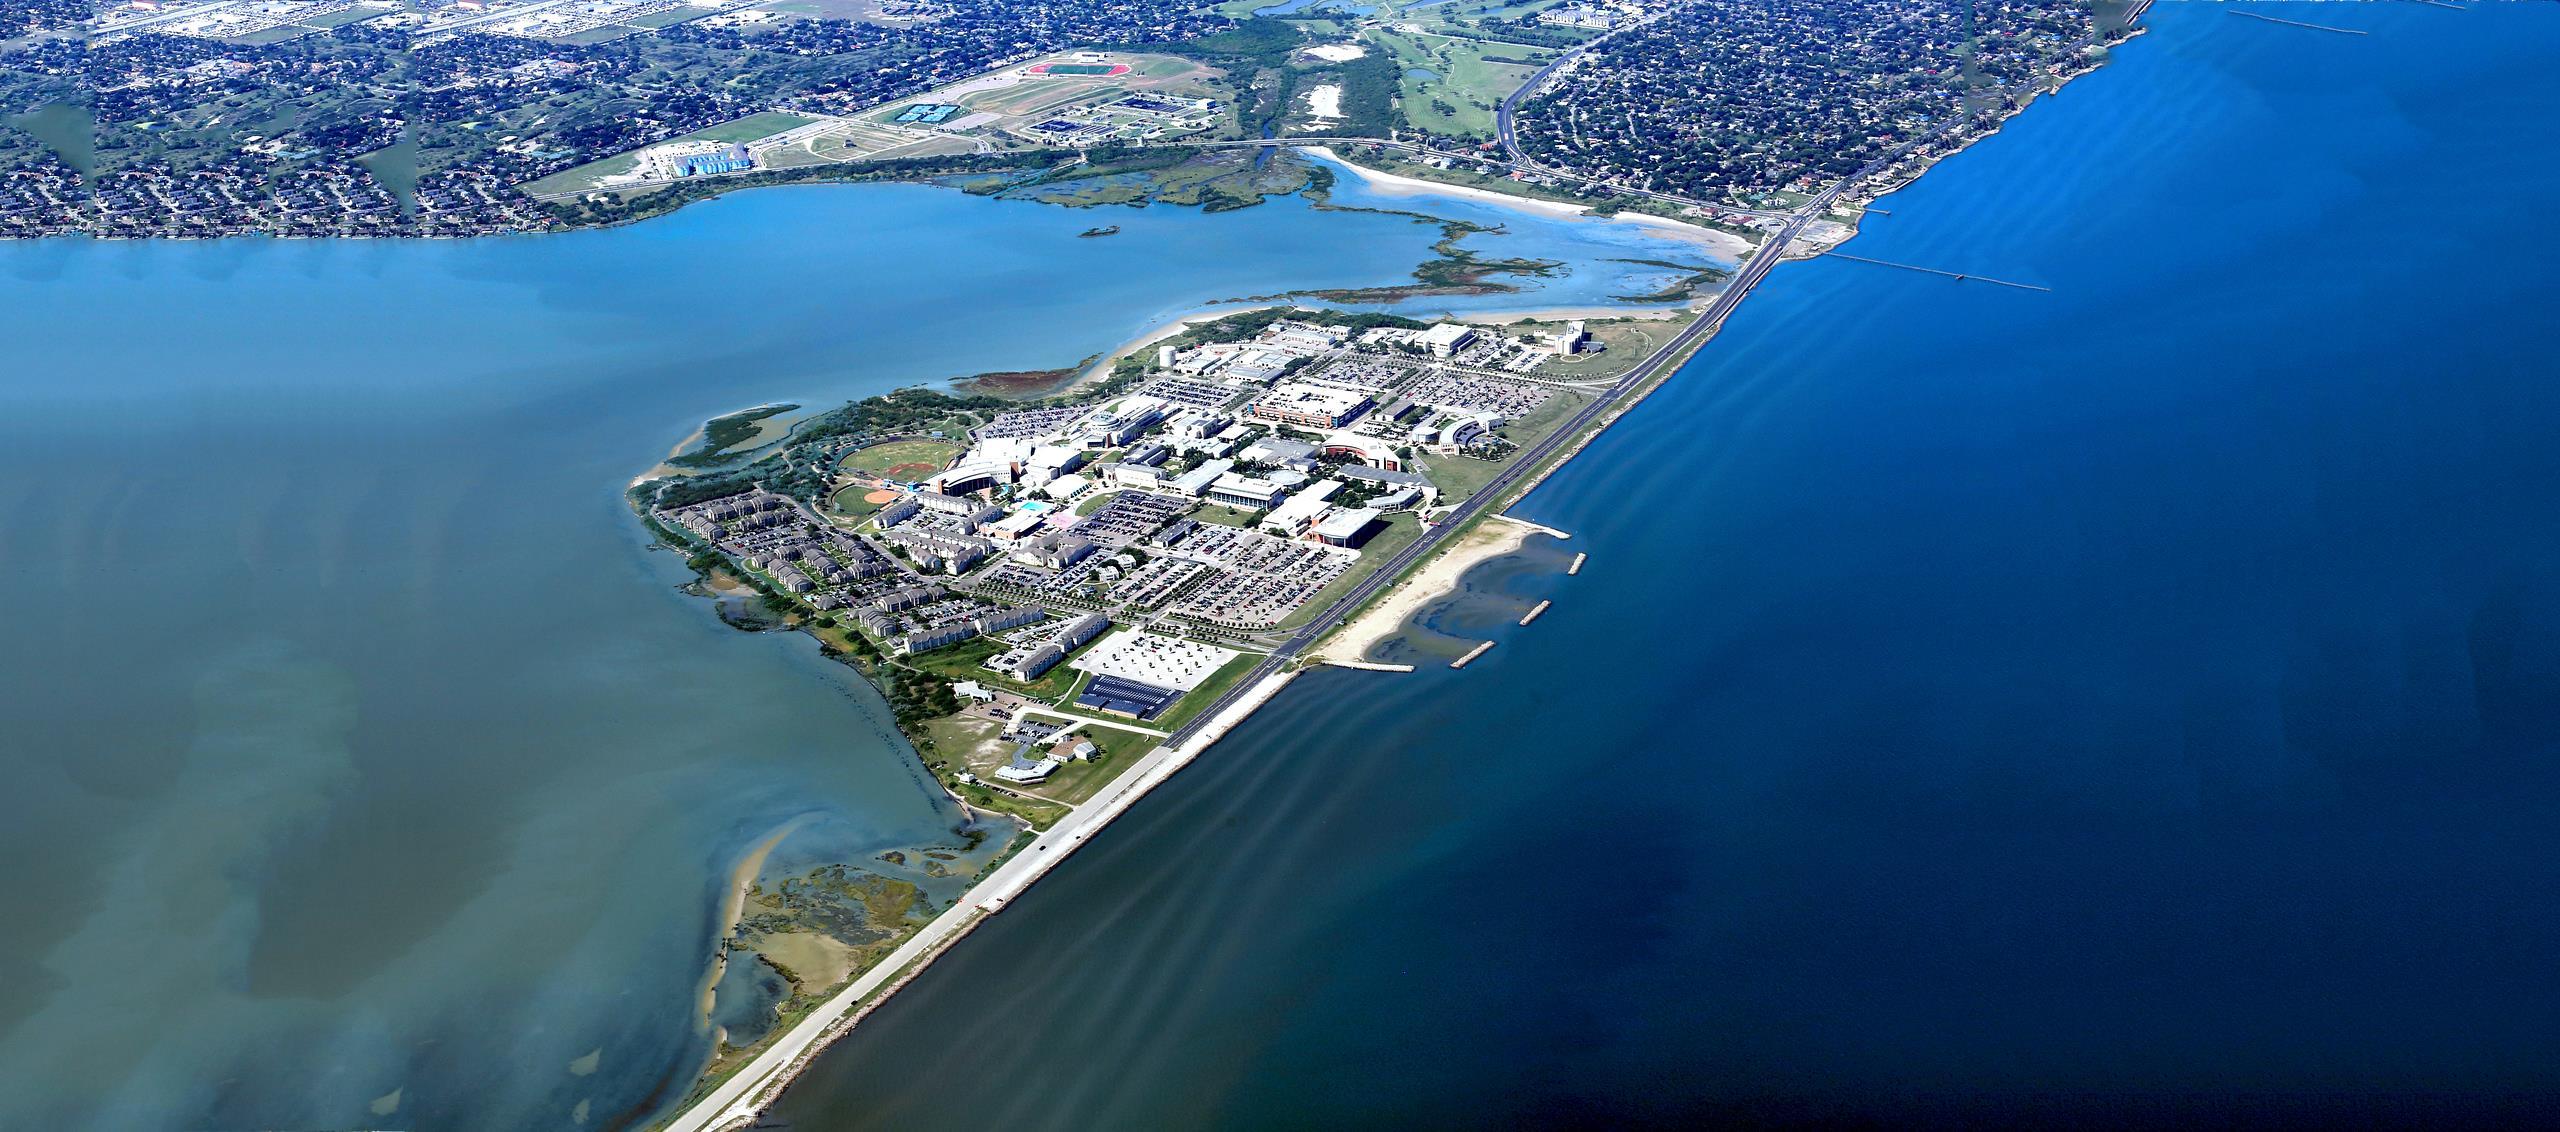
Texas A&M-Corpus Christi is a destination university.
Islanders come from 188 Texas counties, 48 states, and 54 countries, with over two thirds coming from outside the Coastal Bend.
In State 7,467 95% 2,188 74% 9,655 90% Out of State 233 3% 449 15% 682 6% Foreign 124 2% 317 11% 441 4% Total: 7,824 100% 2,954 100% 10,778 100% African American 371 5% 253 9% 624 6% Hispanic 4,043 52% 1,000 34% 5,043 47% Other 671 9% 606 21% 1,277 12% White 2,739 35% 1,095 37% 3,834 36% Total: 7,824 100% 2,954 100% 10,778 100% Undergraduate Graduate Total Undergraduate Graduate Total Residency (Fall 2022) Demographics (Fall 2022) Headcount % Headcount % Headcount % Headcount % Headcount % Headcount %
• Demolition of Classroom East has begun
• Slated for February Board of Regents Meeting
• Ground Breaking in Spring 2024
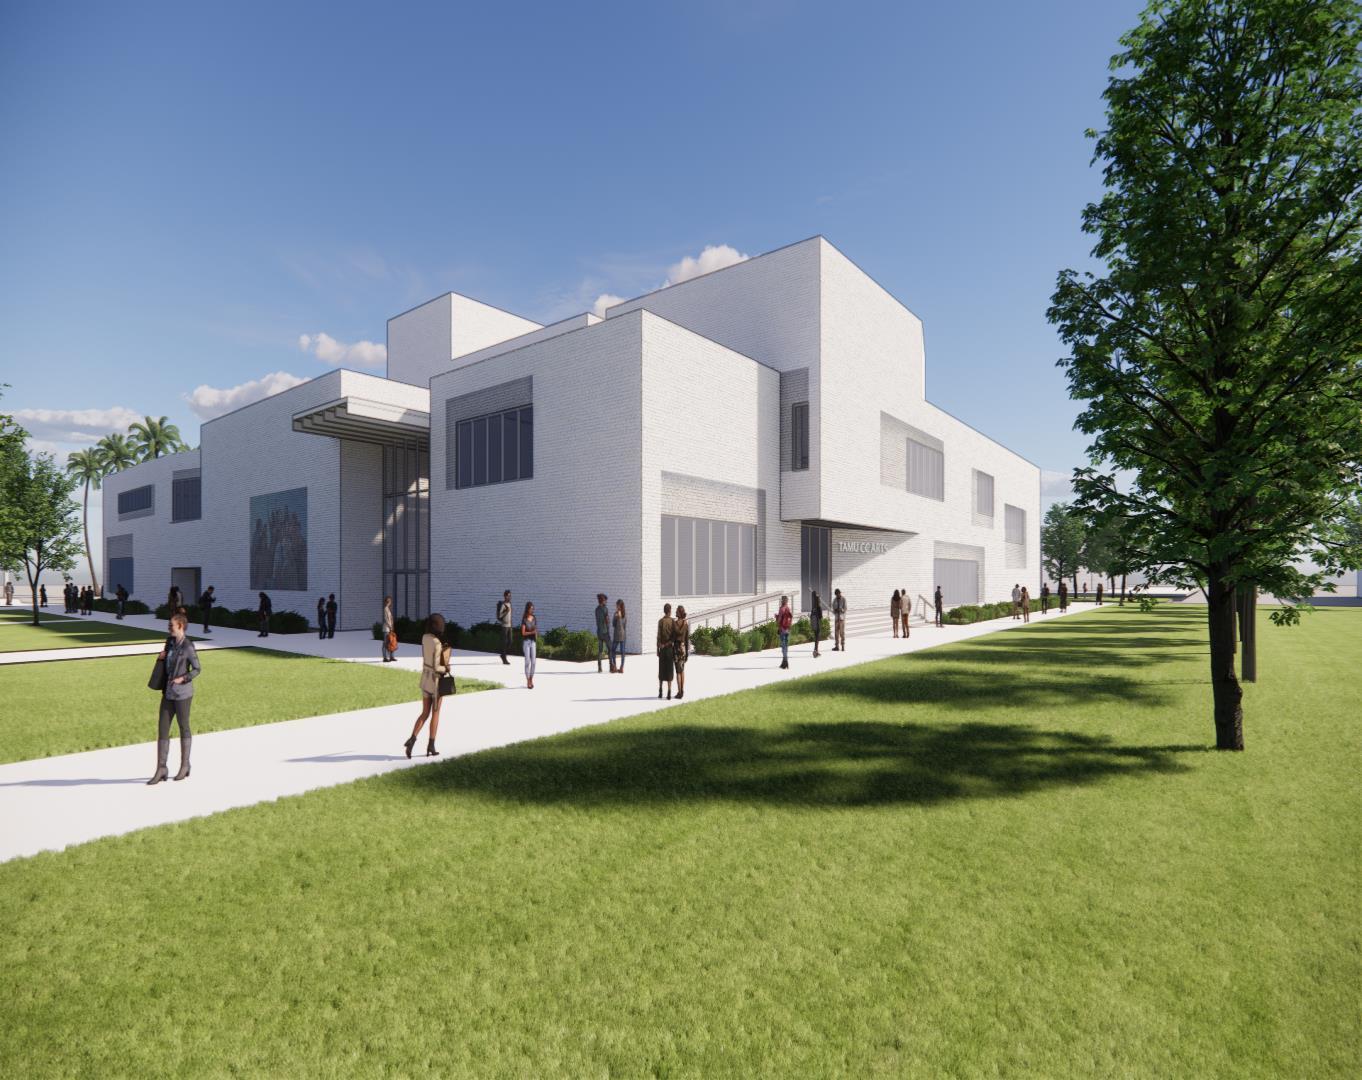
• Phase 1 – Underway
• Mechanical
• Phase Two – In Design
• Art Gallery
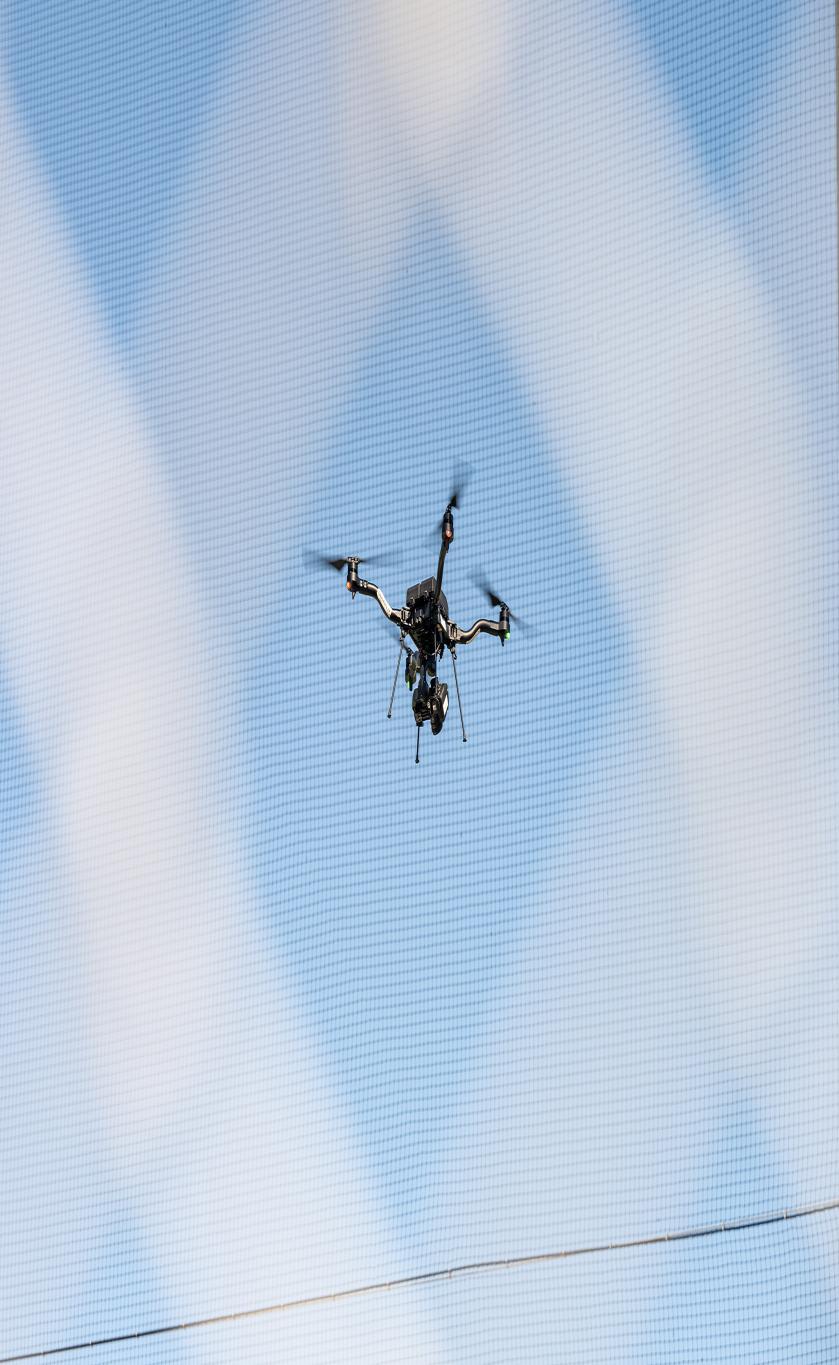
• UAS Command Center
• iPorts
• Office of Economic Development & Industry Partnerships
• Office of Innovation in Emergency Management
• Archival Space
• Move In Starts THIS October
• First Furniture
• Staff immediately following
❑ Performing Arts Center Improvements In Progress
❑ Campus Elevator Updates/Skywalks In Progress
❑ Main Water Line – Additional Secondary Tap Not Started
❑ Natural Resource Center Roof Replacement In Design
❑ Campus Electrical Upgrades – Phase II In Progress
❑ Campus Electrical Upgrades – Phase III In Progress
❑ Miramar Housing Renovations Not Started

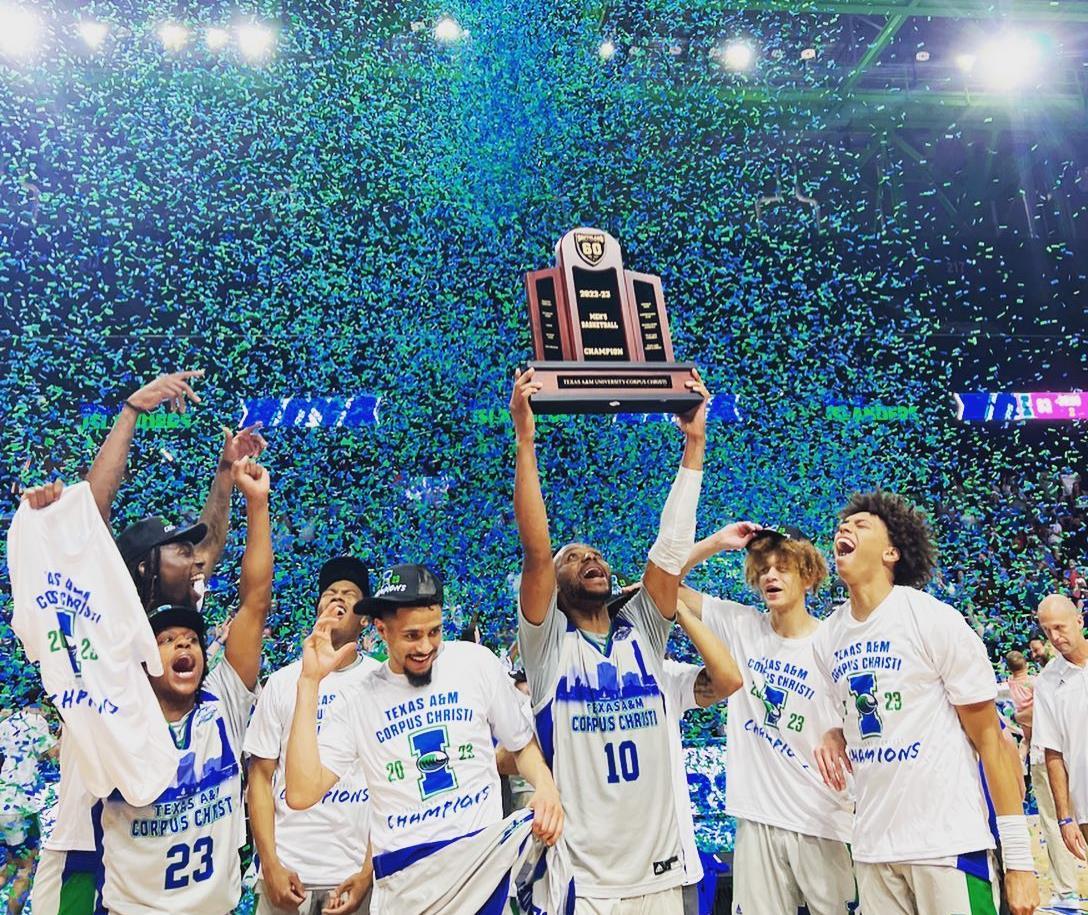


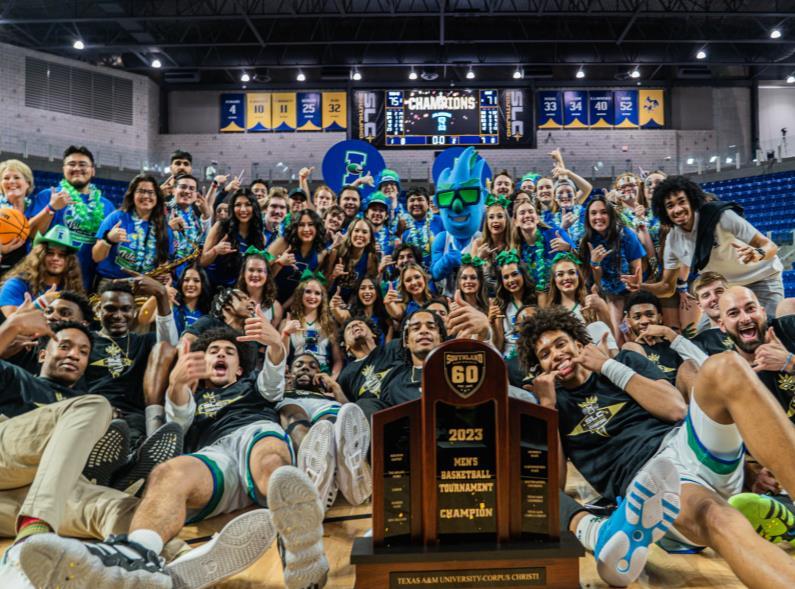
4 SLC Student-Athletes of the Year
3 SLC Players of the Year
5 SLC Tournament MVPs
3 SLC Coaches of the Year
•
•
•
•
Coach Steve Lutz
Coach Gayle Stammer Coach Steve Moore


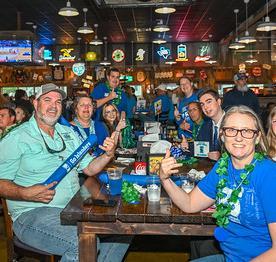


18 straight semesters with a cumulative 3.0+ GPA
57 student-athletes with 4.0 GPA
130 named to Spring 23 SLC Commissioner's Honor Roll
Completed 2,815 hours of community service
•
•
•
•


To be nationally recognized for student success, academic achievement, research, creative activity, innovation, and service excellence.


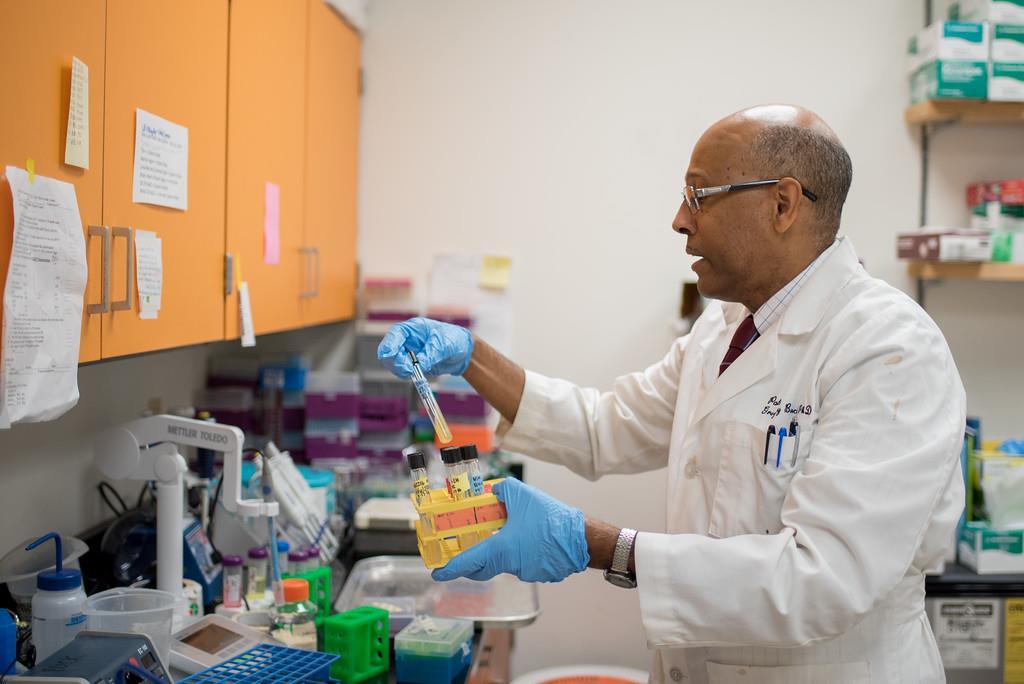
2023 Council on Undergraduate Research Biology Division Mentor Award, Advanced-Career
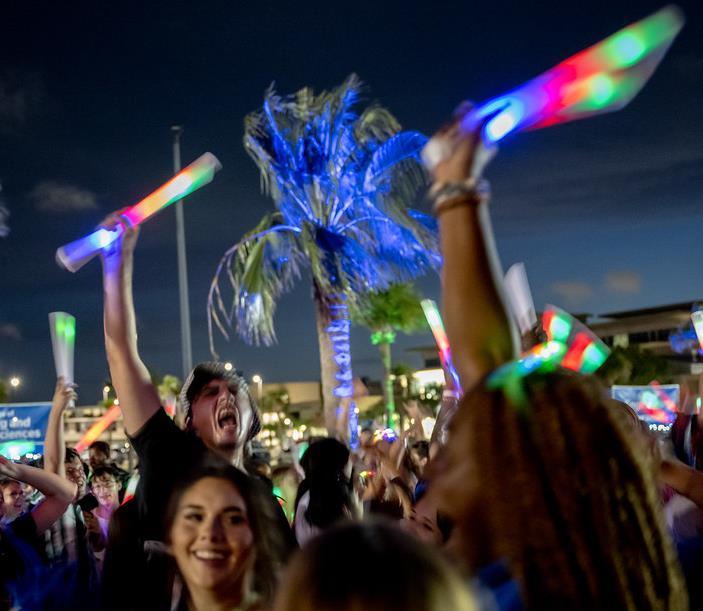


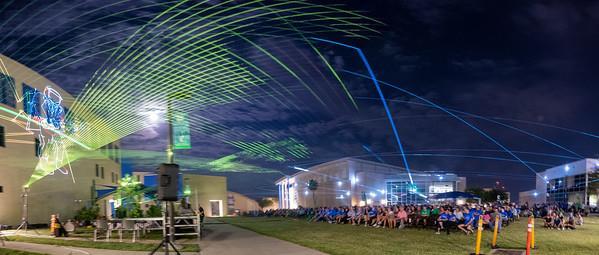

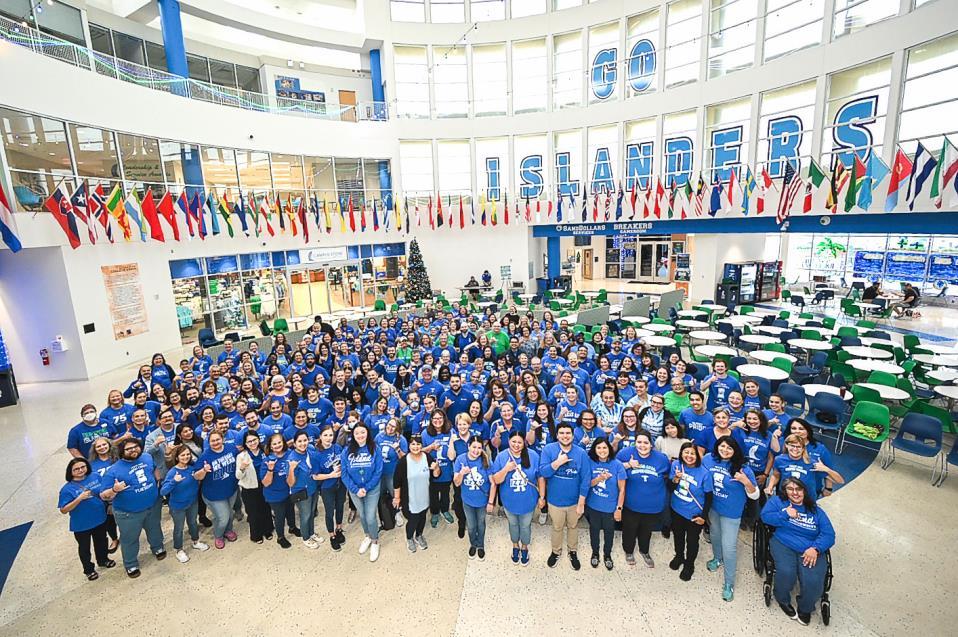
IZzfest Annual Concert

2023
Silver Wave Housing Heroes
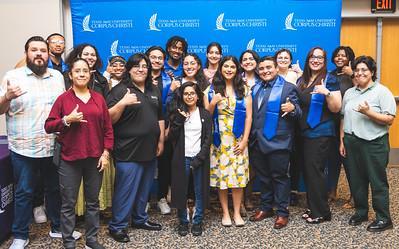
 Islander Housing Transition Team
Julie Shuttlesworth




Intelligent.com

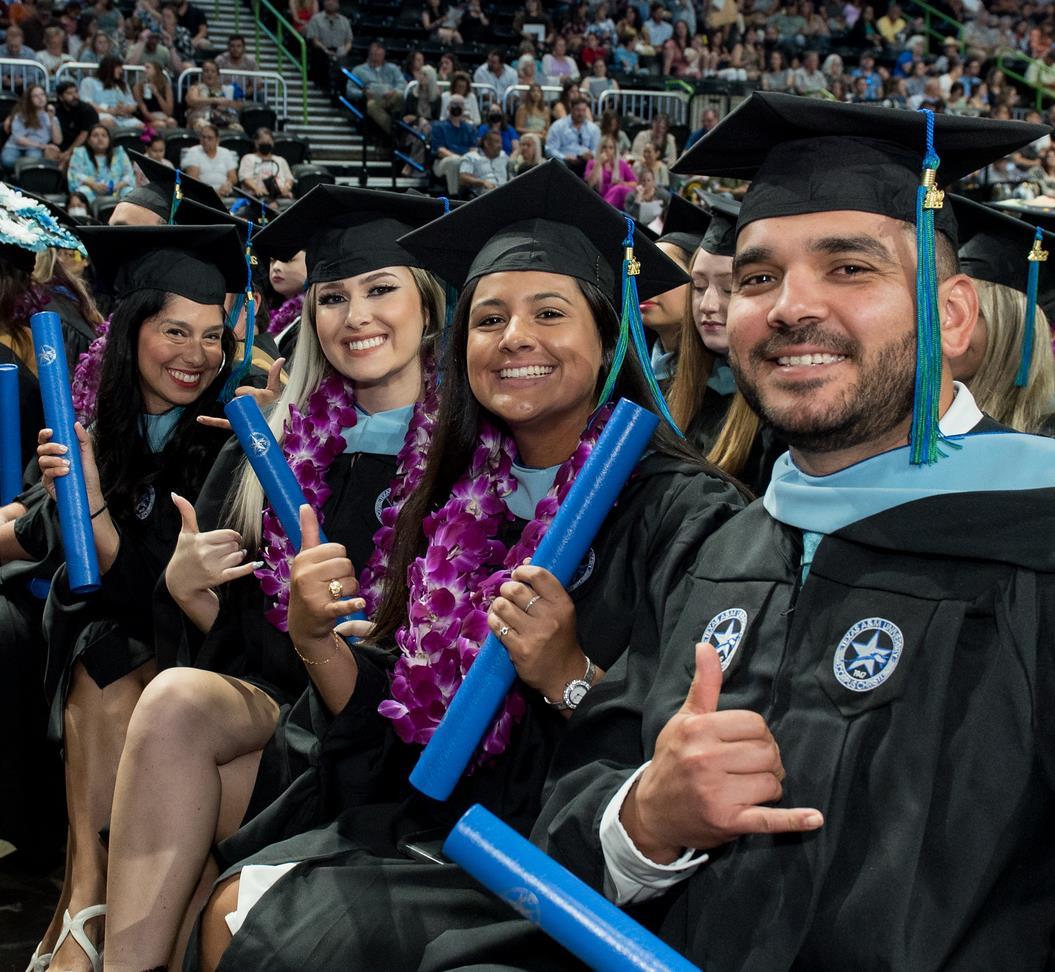
Record-Breaking Degrees Awarded for 3 Consecutive Years

60 Faculty participating in the I-Know Program
COEHD’s Transformative Alliance for Student Success (TASS)
OER Stipend Program saved students
$92K/semester
SAMC’s Art+Design students won 27 Awards
Since 2016, CONHS HRSA Scholarships for Disadvantaged Students ($3.9M for 350 Students)
COB donated $5100 and 206 pounds of food to Izzy’s Food Pantry
CGS launched the Center for the Integration of Research, Teaching, and Learning Associate Certificate

$28,674 $30,253 $32,944 $32,284 $30,500 $36,014 $0 $5,000 $10,000 $15,000 $20,000 $25,000 $30,000 $35,000 $40,000 FY 2017 FY 2018 FY 2019 FY 2020 FY 2021 FY 2022
Sponsored Research State Endowments

$39.55M $42.35M $37.19M $44.94M $56.36M $0M $10M $20M $30M $40M $50M $60M FY2018 FY2019 FY2020 FY2021 FY2022

 Executive Vice President
Vice President
 Vice President
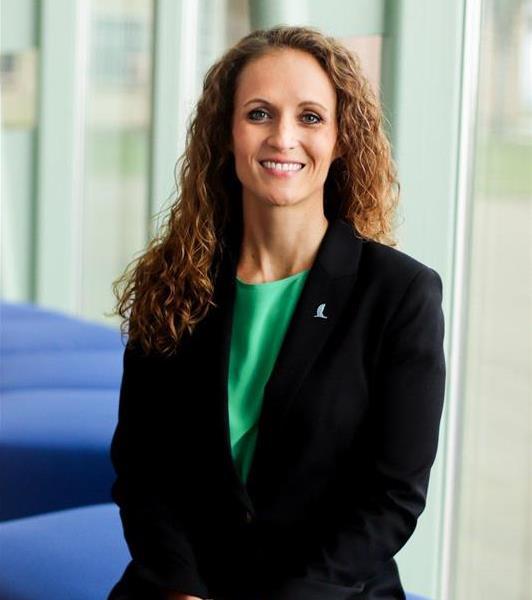
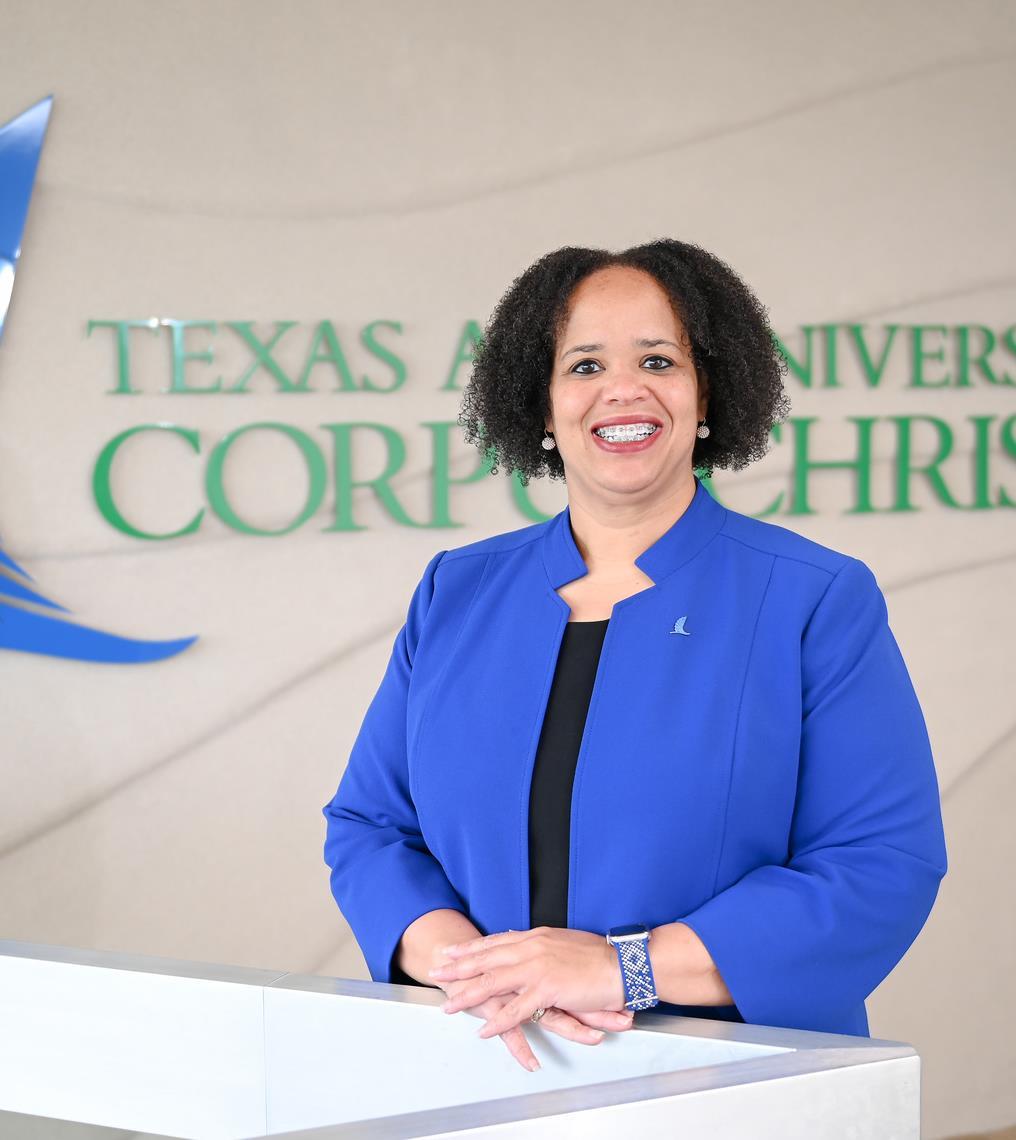 Provost & Vice President
 Vice President


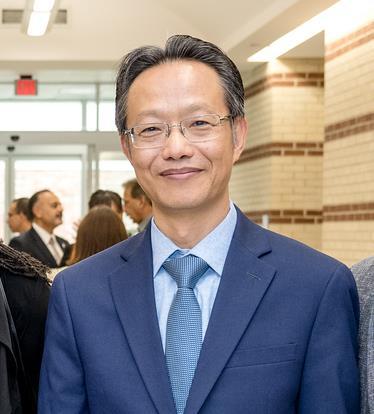

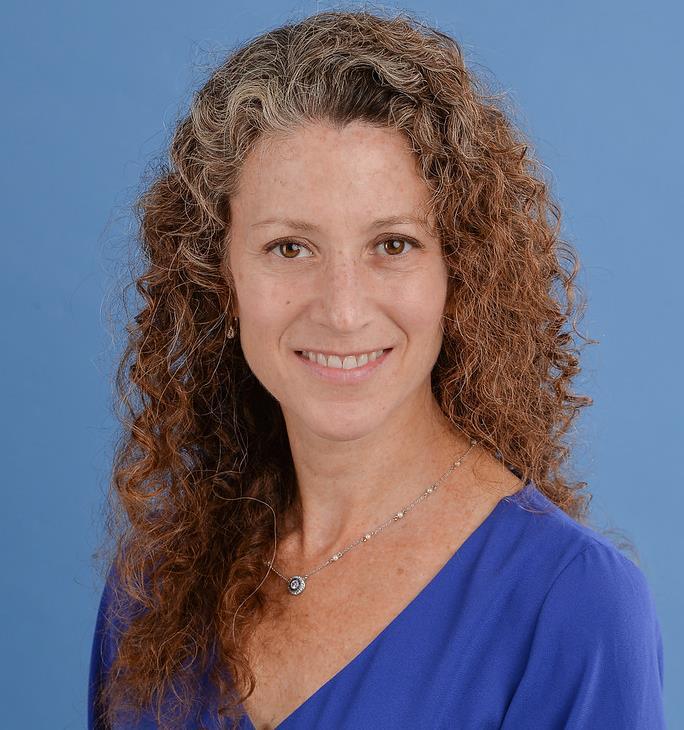







 Islander Housing Transition Team


