

explor a t ions T HE TEXAS A&M UNDERGRADUATE JOURNA L
VOLUME VOLUME
EXPLORATIONS EDITORIAL BOARD
Mack Cleveland (Editor-in-Chief), Venkata Sai Varshitha Dhulipala, Jake Fields, Annaliese Fowler, Gabrielle Hall, Nabila Haque, Thao Ho, Amy Long, Alyssa Low, Ayesha Nagaria, Shivam Pancholy, Nidhi Pawate, Ananya Pillai, Vishay Ram (Managerial Editor), Nushrat Rashid, Suchitaa Sawhney, Ronald Sellers, Aryan Shetty, Miriam Stein, Jeremy Thomas, Abhinav Vadassery, Nikita Valluri, Andrea van Ravenswaay, Lesley Villafuerte
JOURNAL DESIGN
Annabelle G. Aymond
COVER ARTWORK
Olivia Parker
MANUSCRIPT EDITOR
Kelsey I. M. Chapates
FACULTY & STAFF ADVISORY BOARD
Dr. Sumana Datta, Dr. Sarah M. Misemer, Annabelle G. Aymond, A. Nicole Guentzel
FACULTY & STAFF REVIEWERS
Dr. Sankar Chaki, Dr. Sumana Datta, Dr. Rayna Dexter, Dr. Sara Dicaglio, Dr. John Ford, Dr. Paul Gratz, Dr. Balakrishna Haridas, Dr. Stefanie Harris, Dr. Rafael Lara-Alecio, Dr. Duncan MacKenzie, Dr. Robert Mackin, Dr. Eva Magallan, Dr. Sarah Misemer, Dr. Jason Moats, Dr. Khanh Nguyen, Dr. Mary Ann O'Farrell, Dr. Joseph Orr, Ms. Alexandra Pooley, Dr. Elizabeth Robinson, Dr. Judy Sandlin, Dr. Paul Schwab, Dr. Susan Stabile, Dr. Reza Tafreshi, Dr. Galina Tsvetkova, Dr. Victor Ugaz, Dr. Gwendolyn Webb, Dr. Robert Webb, Dr. Mary Wicksten
VOLUME 14 (FALL 2022)
Explorations: The Texas A&M Undergraduate Journal is student-run, faculty/staff-guided, publication dedicat ed to highlighting exceptional undergraduate research, scholarly, and creative work in all fields. Submissions of broad interest should be submitted online at explorations.tamu.edu. Questions about publication, student mem bership, how to become a faculty/staff reviewer, or how to obtain a printed copy of the journal can be directed to explorations@tamu.edu. Explorations’ home is in the LAUNCH: Undergraduate Research office located inside of Henderson Hall at Texas A&M University in College Station, TX 77843-4233.
ISSN 2668-7525 (print)
ISSN 2688-7533 (online)
Copyright © 2022. All rights reserved.
VOLUME 14 FALL 2022 explor a t ions
T HE TEXAS A&M UNDERGRADUATE JOURNA L
THANKS & GIG 'EM!
Explorations would not be possible without the generous contributions of Mr. and Mrs. Ralph & Barbara Cox, as well as continued support from The Association of Former Students, Office of the Provost, and office of Under graduate Studies at Texas A&M University. The Explorations Board and the LAUNCH office sincerely thank you.
SUPPORT US
For more information on how you can help us show case the best and most vibrant undergraduate research by Aggies, contact the Texas A&M Foundation at info@txamfoundation.com. Donations are accepted online at www.txamfoundation.com/give.aspx. Checks may be made payable to:
Texas A&M Foundation


ATTN: UGR Explorations: The Texas A&M Undergraduate Journal Acct. 510025-36000 $25 minimum for online donations
GET INVOLVED
CONTACT US
explorations.tamu.edu
explorations@tamu.edu
instgram.com/TAMU_UGR
twitter.com/TAMU_UGR
Opportunities are open to all undergraduate students. Be part of a leadership and learning community through Explorations as a board member, an author, or an artist! The student board works year-round to meet the journal’s annual publication schedule, and develope skills in areas such as leadership, public speaking, critical thinking, time management, editing, marketing, publishing, and graphic design. Board member applications are accepted in early-fall each year.
Publication in Explorations is a multi-stage, refereed process. The first step to publication in Explorations is the synopsis submission, which is an article pitch. Synopses are reviewed by faculty reviewers and student board members. If invited, prospective authors then submit a full manuscript. Full manuscripts are requested by mid-spring and undergo a second round of faculty and student review. Final articles are chosen from the full man uscript submissions. Provisionally accepted articles undergo further editing and a final review by a team of student editors, LAUNCH staff members, and a third-party professional editor. Final articles are due in late-spring each year.
Faculty at Texas A&M can mentor undergraduate researchers and encourage them to apply to the board and/or to submit synopses. Faculty and staff can also volunteer to review submissions for Explorations. The re view process begins each spring semester.
4
FROM OUR FACULTY
Welcome to Volume Fourteen of Explorations, documenting the impressive research accomplishments of undergraduate students at Texas A&M University. The work presented here represents the achievements of students from a variety of disciplines who have challenged themselves. As we emerge from a period of unprecedented disruption to our research endeavors it is important to acknowledge the resilience of these stu dents. They began their studies at a time when the great est benefits of the undergraduate research experience, personal interactions with mentors and team collabora tions, were constrained. Yet they persevered, recogniz ing that students at this university have a remarkable opportunity not just to learn from some of the world’s most distinguished researchers, but to participate direct ly in the process of discovery. Faculty members will tell you that the most gratifying outcome of a mentoring relationship is when the student takes their own path, developing the skills, knowledge, and independence to ask their own questions and design their own approach es, fueled primarily by their curiosity, talent, and desire for discovery. Particularly valued is the ability to communicate the significance of their research. The students who have published in Explorations have struck out on that path, not only taking responsibility for their own direction of discovery, but enthusiastically communicat ing its importance to a broader audience.
We must acknowledge the faculty, graduate students, and staff who have helped these students every step of the way. By documenting the productive interactions of undergraduate students and researchers Explorations bears impressive witness to the successful achievement of our educational mission. I also con gratulate the Explorations Editorial Board, a dedicated group of student leaders who have worked hard to bring together the articles selected for this excellent issue. Having sat through many editorial board meetings during my time as an Associate Director in LAUNCH, I know that their decisions are not taken lightly. I have been consistently impressed by the thoughtfulness of the Board’s deliberations when choosing articles which represent the breadth of research at Texas A&M, helping authors refine their writing to communicate more effec tively to a general audience, and developing the style of
the final volume.
DR. DUNCAN MACKENZIE

PROFESSOR EMERITUS BIOLOGY, TEXAS A&M UNIVERSITY
Upon my retirement I have had the pleasure of reconnecting with a number of my former undergraduate researchers. They now live in far-flung places, from Berkeley to Burlington, and have pursued a diversity of careers, including re search, teaching, and industry. Yet they all have retained their sense of wonder at discovery, whether it be at a lab bench, in a high school classroom, at a biotech com pany, or in a backyard observatory. They unanimously express their conviction that undergraduate research was a highlight of their Texas A&M career, providing them with unique knowledge, earned self-confidence, and lifelong friendships. I will greatly miss the new faces that appeared in my laboratory each year, but I retire knowing that the undergraduate research enterprise remains robust at Texas A&M. There is still much to accomplish: to welcome more first generation students and those from underrepresented groups to the exciting world of research discovery, to pursue more sources of support to reward these students for their initiative, and to engage more students in international research expe riences such as those offered through the MSC Jordan Institute for International Awareness. To these ends I commend the staff of the LAUNCH office, who oversee the production of Explorations, for their continuing efforts towards these goals. The research described in this volume should inspire future students to seek out the support of the many on this campus who will assist them in attaining similar transformative educational experiences.

5
CONTENTS
THE INFLUENCE OF REWARD HISTORY ON GOAL-DIRECTED VISUAL SEARCH
By Sangji David Lee ‘22
Reward can bias the control of cognitive attention
THE EFFECTS OF LANGUAGE STATUS ON THE EFFICACY OF MAKER EDUCATION PROGRAMS
By Lauren Absher ‘23
A study on how the success of maker education programs is altered by students' language statuses.
HOW STRONGLY DO VIRAL PROTEINS LASSO VIRAL DNA?
By Sarah E. Fross ‘22
An investigation of cancerous proteins’ relative binding energies with potential for inhibitors.
ACCELERATING TRAINING THROUGH PERSONALIZATION IN AUGMENTED REALITY
By Isabella
C. Pedron ‘23, Connor M. Barnes ‘23, Ashley E. Bailly ‘23
Utilizing next-generation technologies and machine learning to advance training environments for emergency responders.
DEVELOPMENT OF A COMPUTATIONAL METHOD TO ANALYZE MITOCHONDRIAL CALCIUM SIGNALS IN ASTROCYTES
By Maray V. Valle
’22
An accurate, relevant, and complete method for the analysis of calcium signals in astrocytes, the most abundant non-neuronal cells in the brain.
PRENATAL ALCOHOL EXPOSURE AND GENETIC SEX IMPACT NFIA EXPRESSION IN THE DEVELOPING CORTEX
By Aubrie Miller
‘22
Prenatal alcohol exposure can cause different developmental differences, Nuclear Factor-1 A may be a way to mitigate these differences.
6
.................................... 8
............... 17
............................................................. 25
............................ 34
......................................................................................................................... 45
................................................................................................................................. 54
CONTROVERSIAL SAINTS: A STUDY OF HOW POPULAR CULTURE CAN RADICALIZE RELIGIOUS ICONS
By Alexandria Babineaux ‘22
A sinner or a saint? The evolution of Joan of Arc’s identity in media.
.. 62
THE WEIRD YEARS: REACTIVE WEIRDING, UPHEAVAL PERIODS, AND THE POST-PANDEMIC ................ 69
By Rain Etheridge ‘22
What causes the emergence of Weird literature?
LAB-GROWN BONE: USING STEM CELLS TO SUCCESSFULLY REPLICATE THE NATIVE BONE HEALING ENVIRONMENT
By Rithika Adavikolanu ‘22
The development of a novel osteogenic implant for bone regeneration using stem cells and click chemistry.
REACHING
.............................................................................................................................. 81
By Olivia G. Parker ‘22
Making cover artwork out of donated homework. BOARD BIOGRAPHIES ............................................................................................................... 84
7
........................................................................................................................ 75
CONTENTS
The Influence of Reward History on Goal-directed

Visual Search
By Sangji David Lee ‘22
8
INTRODUCTION
Daily, people encounter an overwhelming amount of visual information, but our perceptual system can only process a relatively small amount of information at any moment. How do our brains manage this limitation? Attention mechanisms determine which objects or locations in a given moment are represented in the brain.1 By prioritizing items that share visual features (color, shape, etc.) with what you are looking for, attention allows you to find a particular object in your room, like car keys among the pile of things on your desk. To strategically select an item, the attention system compares what you see to a search or target template—a mental representation of what you are looking for—and selectively processes objects that sufficiently match the template.2
Beyond strategic attentional control, what we pay attention to is influenced by two other factors: physical characteristics of objects (how bright and colorful they are)3 and learned associations between ob jects and outcomes (whether they tend to predict good or bad outcomes, like a tasty treat predicts the pleasure of eating it).4 This study investigates the influence of reward learning on attention. Reward-associated stimuli can become attention-grabbing, which remains the case even when such stimuli no longer predict reward nor are relevant to the current task.5 The term value-driven summarizes this biasing effect of reward on our attention,6 which is readily seen in everyday life in the context of addiction7,8 or favor toward items gen erally associated with reward (e.g., why tasty food on the table is difficult to ignore even when dieting). The prospect of reward can also modulate the goal-directed control of attention by enhancing our focus.9,10
Most prior research on attention, including the influence of reward, measures how people process information under conditions in which participants fol low explicit instructions concerning a specific stimulus. The question then becomes whether reward makes a certain object more distracting (e.g. whether people are better at finding something when they are rewarded for doing so quickly and accurately). However, real-life vi sual search does not provide any instruction concerning
THIS STUDY INVESTIGATES THE INFLUENCE OF REWARD
LEARNING ON ATTENTION.
what to find or how to find it. Lack of instruction requires our brain to consider different potential target templates and settle on one to use when searching. In a dynamic environment, the template we use changes to meet current environmental demands. We know reward history can bias attention to specific reward-associated stimuli, but can reward also bias how people choose to strategically search through a display? Given the role reward’s influence on attention plays in addiction,11,12 the answer to this question has implications for our understanding of how drug reward might influence the way in which people direct their attention in the future.
EXPERIMENT ONE
For Experiment One, we used a paradigm called the “Adaptive Choice Visual Search” (ACVS) task.13,14 ACVS manipulates the color distribution between red, blue, and green boxes to create a dynamic search environment. In each trial, one red and one blue target were hidden among red, blue, and green boxes. In this study, red and blue are referred to as task-rele vant colors and one color is less abundant than the oth er in each trial. Participants only needed to report one target and could search for either the red or blue target. Searching through stimuli rendered in the less abundant color is easier, or more “optimal” strategy-wise, since there are fewer items to search through. To examine the effect of reward on the choice of how to search, partic ipants went through an initial training phase in which only one of the two task-relevant colors was presented on each trial (red or blue among green). Participants received monetary reward when they found a target in one but not the other color. In the following test phase, both red and blue boxes were present in the same trial, and rewards were no longer available. Each participant
9
encountered three types of trials:
1. the previously rewarded color was the optimal color to search through,
2. the previously rewarded color was non-optimal to search through, or
3. neither color was optimal to search through (equal number of red and blue items).
We were interested in whether participants would choose to search through the previously reward ed color and how the selected strategy interacts with how optimal it would be to do so.
Methods
Thirty-five participants (25 female) between the ages of 18 and 35 (mean = 20.3 years) were recruit ed from the Texas A&M University community. All participants reported normal or corrected-to-normal visual acuity and normal color vision. Participants were compensated with their earnings in the task.
The experiment was run on a computer in a dimly lit testing room, and participants indicated their responses using a button box (like a gamepad). Each vi sual search array was composed of 54 colored squares arranged in three concentric rings around the center of the screen. The inner, middle, and outer rings consisted of 12, 18, and 24 boxes, respectively. Each box in each ring was positioned equidistant from each other and contained a digit between two and nine.
Following consent, participants completed
three runs of the training phase followed by three runs of the test phase. Before each phase, participants prac ticed the task. Importantly, no instructions were given concerning how to search and participants were free to follow the search strategy of their choice.
Training Phase
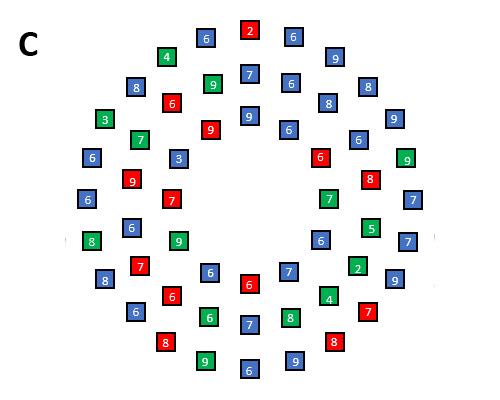
The training phase consisted of a fixation display (1,000 milliseconds), search array (5,500 mil liseconds or until response), feedback display (1,500 milliseconds), and a blank inter-trial-interval (1,000 milliseconds) (Figure 1A). During the training phase, there were two trial types for the search array:
1. red and green color squares, and
2. blue and green color squares.
Participants were instructed to search for a tar get square: a red or blue color square containing a digit between two and five. An equal number of target- and green-color squares were presented on each trial. All red or blue squares besides the target square contained a digit from six to nine. Green-colored squares were neutral to the task and contained digits between two to nine to prevent participants from searching for numer ical digits without respect to color. All digits inside non-target squares were assigned randomly using the aforementioned constraints. One of the two target colors was associated with monetary reward and which color was used as the reward-associated color alter nated across participants. Upon identifying a target in the rewarded color, participants were shown “+$0.15” and their accumulated total earnings. In contrast, upon identifying a target in the unrewarded color, partici pants were shown “+0.00” and their accumulated total earnings. If participants responded with a number other than the target number, they were presented with the word “Missed” with their accumulated total earnings. If participants did not make a manual response within the 5,500 milliseconds time limit, they were presented with the words “Too Slow” and their accumulated total earn ings. For each participant, the training phase consisted of 60 trials (30 trials of each trial type, randomly dis tributed), and participants took a short break between every three trials.
10
WE WERE INTERESTED IN WHETHER PARTICIPANTS WOULD CHOOSE TO SEARCH THROUGH THE PREVIOUSLY REWARDED COLOR...
Figure 1. Sequence of trial events for the (A) the training phase, (B) the test phase of Experiment One and (C) search display for the test phase.
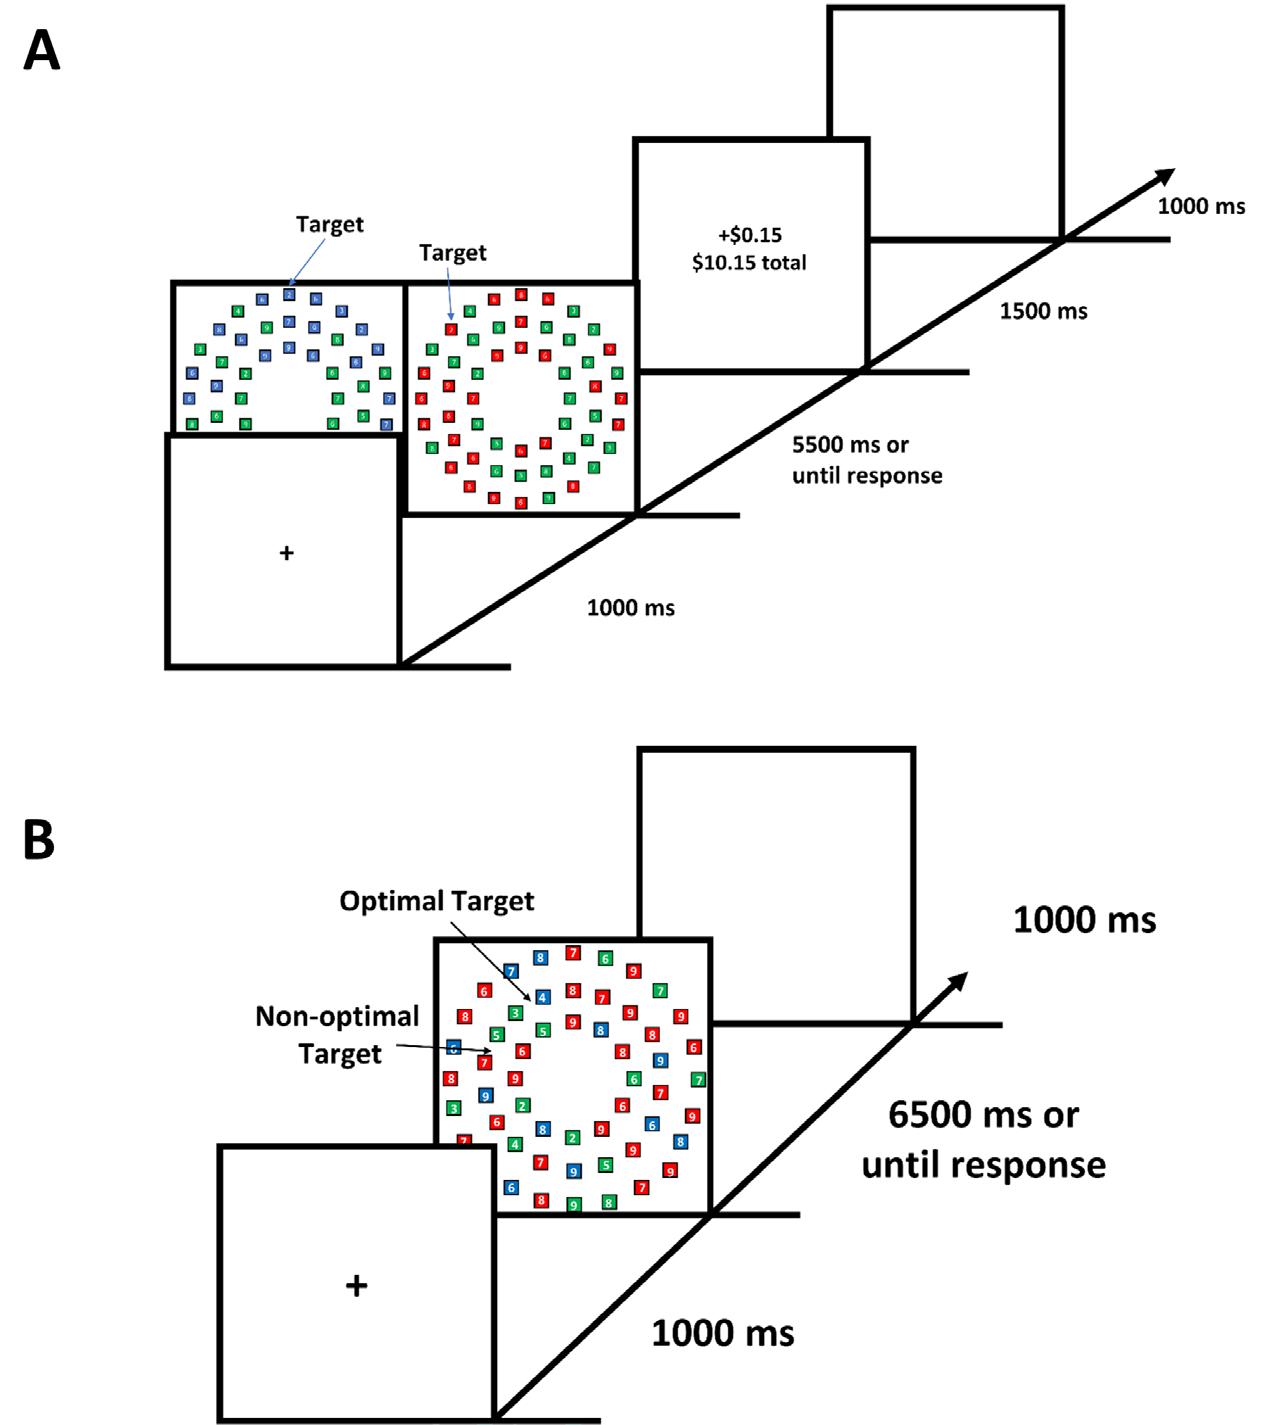
Test Phase
The test phase consisted of a fixation display (1,000 milliseconds), search array (6,500 milliseconds or until response), and a blank inter-trial interval (1,000
milliseconds) (Figure 1B). There were three trial types in the visual search array:
1. previously reward-associated col or optimal (trial displayed 13 re ward-associated color boxes, 27 non-reward-associated color boxes, and 14 green color boxes),
2. previously reward-associated col or non-optimal (trial displayed 27 reward-associated color boxes, 13 non-reward-associated color boxes, and 14 green color boxes), and
3. neutral trial (trial displayed 18 reward-associated color boxes, 18 non-reward-associated color boxes, and 18 green color boxes).
Here, optimality is defined as “optimal for maximizing task perfor mance” in that it would be faster to search through the color with a smaller set-size. Participants were informed that one red and one blue target would be present in each trial (red or blue color square containing a digit from two to five) and they only needed to report one of these targets. Non-target squares were assigned numbers in the same manner as in the training phase. Feedback was inserted after the search array if partici pants responded incorrectly or failed to respond before the time limit.
For each participant, each testing phase consisted of three blocks which required search tasks 90 times each (30 trials of each trial type, randomly distrib uted). A short break was given between each block.
Data Analysis
We excluded data from three participants due to low accuracy in the task (< 3 SD of the group mean)
11
and one participant withdrew before completing the task. Thus, 31 data sets were fully analyzed.
Results and Discussion
Training Phase
Neither response time nor accuracy differed as a function of the reward given by the target color, t(30) = 0.47, p = .641 (reward: mean = 2,809 milliseconds, no-reward: means = 2,829 milliseconds), and t(30) = 0.00, p > .999 (reward: mean = 93.9%, no-reward: M = 93.9%), respectively.
Test Phase
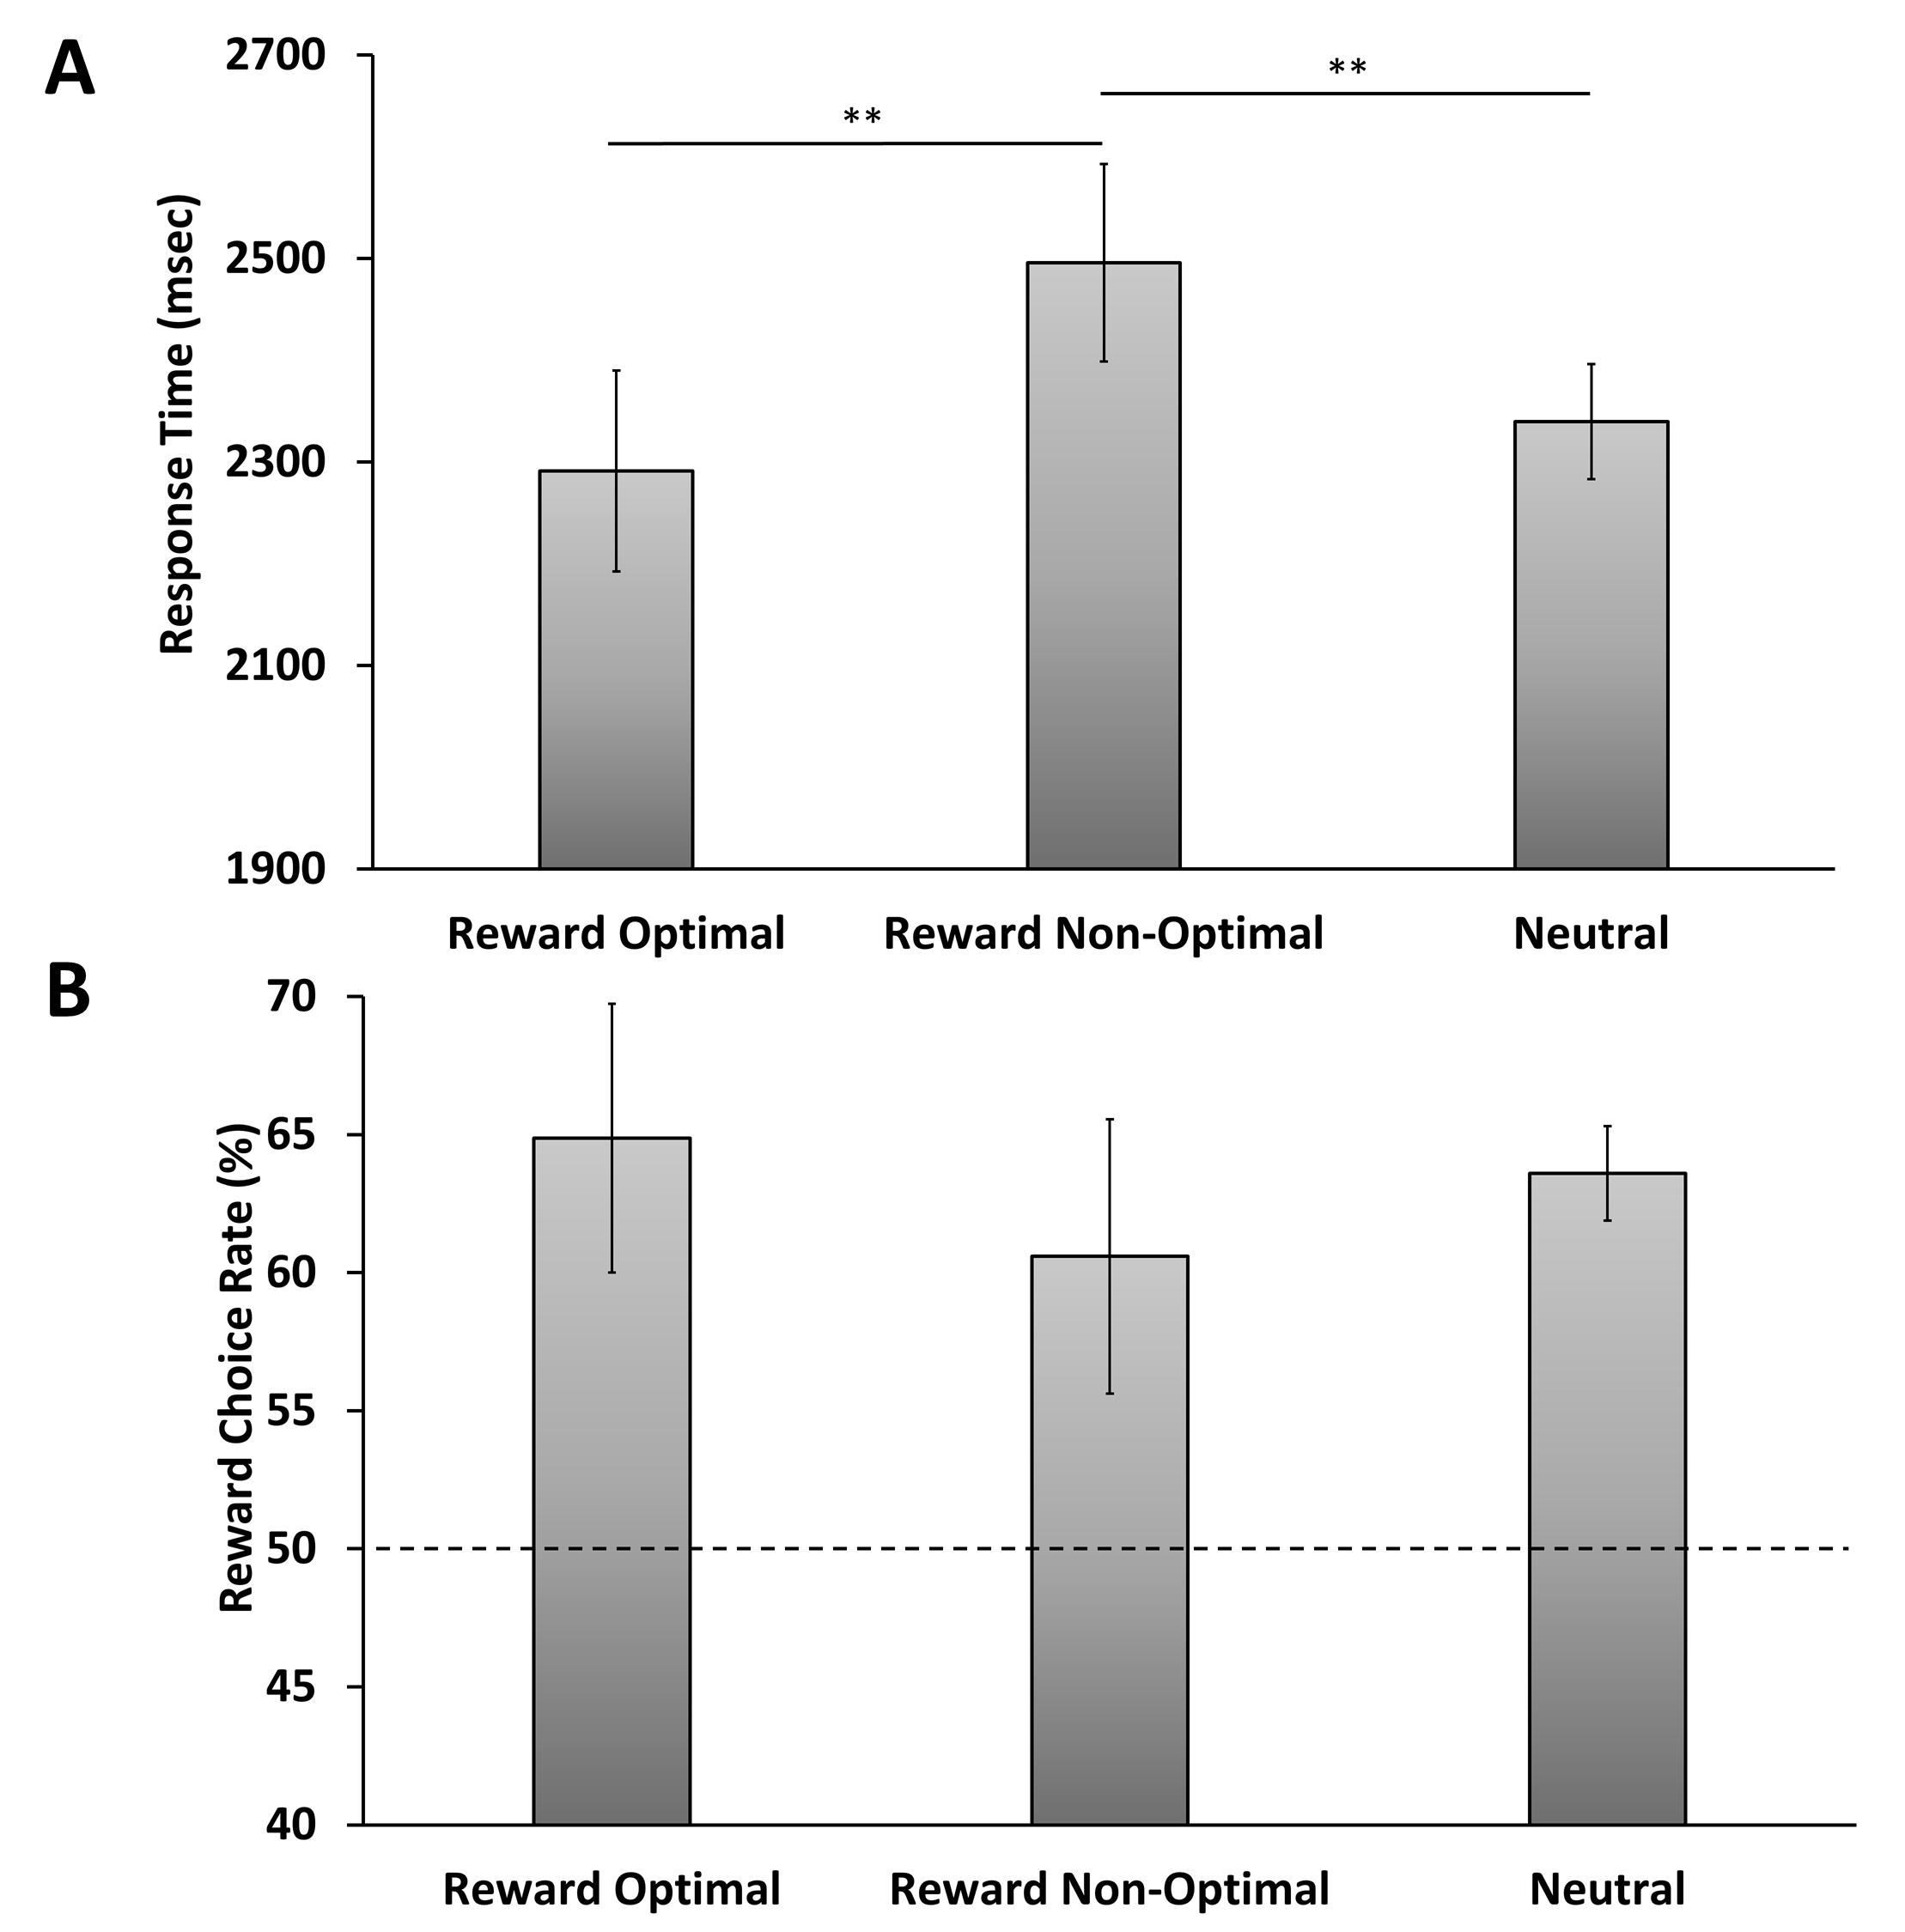
We conducted a one-way repeated-measures analysis of variance (ANO VA) over response time with trial type as a factor (reward optimal, reward non-optimal, neutral), which revealed a significant difference across trial types, F(2,60) = 6.41, p = .003, η2 p = .176 (see Figure 2A). The F(#,#) indicates the score of the significance of the one-way repeated-measures analysis of variance and p measures the validity of the F(#,#) score. Η2 p measures the variance within the dependent measurement. Post-hoc pairwise compari sons identified participants were faster in trials when the reward-associated color was optimal compared to non-optimal, t(30) = 2.73, p = .010, d z = 0.49, slower on trials when the reward-as sociated color was non-op timal compared to neutral trials, t(30) = 3.14, p = .004, d z = 0.56, and no differences comparing trials when the
reward-associated color was optimal and neutral, t(30) = 0.95, p = .352. t(#) indicates the score of the signif icance of the t-test and p measures the validity of the t(#). D z shows the variance in the mean.
To assess whether reward history influenced choice behavior, we compared the percentage of targets found in the previously reward-associated color to chance (50%, which would reflect unbiased search). Participants were significantly biased to report targets rendered in the previously reward-associated color, t(30) = 2.53, p = .017, d z = 0.45. In contrast, excluding neutral trials in which there was no optimal strategy, participants were not more likely to select the opti mal-color target than chance, t(30) = 1.10, p = .278.
Figure 2. Behavioral results in the test phase. (A) Response time and (B) the rate of choosing a previously reward-associated color target when it was the optimal color to search through, the non-optimal color, or when there was no optimal color in a neutral condition. Error bars depict within-subjects confidence intervals calculated using the Cousineau method with a Morey correction. **Statistically significant, p < 0.01.
12
We then ran an ANOVA over the percentage of targets found in the previously reward-associated color over the three trial types and found no significant difference, F(2,60) = 1.18, p = .316 (Figure 2B). This finding means participants were overall biased to report a target in the previously reward-associated color regardless of how optimal this strategy was with respect to the distri bution of color stimuli.
In addition, we found significant differences in accuracy across trial type, F(2,60) = 4.63, p = 0.013, η2 p = 0.134. Post-hoc pairwise comparisons identified that participants were more accurate on neutral trials compared to both reward-optimal, t(30) = 2.49, p = .018, d z = 0.45 (neutral: mean = 96.9% optimal: mean = 95.2%), and reward non-optimal trials, t(30) = 3.65, p < .001, d z = 0.66 (non-optimal: M = 95.1%). Reward-op timal and reward non-optimal trials did not differ from each other, t(30) = 0.23, p = 0.822. These differences may be related to the fact that the varying distribution of color stimuli made it so neutral trials had a slightly higher number of green stimuli (which could not be targets).
Overall, participants were more likely to report a target rendered in the previously rewarded color com pared to a target in the previously unrewarded color in the test phase, suggesting that they preferentially searched through stimuli of the previously rewarded color. The bias was evident even when the previously rewarded color was the more abundant color in the search display, resulting in a performance cost as re flected in slower response time. Reward history influ enced the strategy participants adopted to find a target in a situation in which they were free to choose how to conduct their search.
EXPERIMENT TWO
It remains unclear how “optimal” search would have been in the absence of reward history in Exper iment One, and whether the reward-biased strategy that participants adopted caused them to abandon an otherwise optimal strategy when the previously re ward-associated color was more abundant. Although preferentially searching for the previously reward-as
REWARD HISTORY INFLUENCED
sociated color came at a cost in response time when it was the more abundant color, participants may have otherwise tended toward strategies that do not priori tize the less abundant color, such as searching serially through all red and blue stimuli until a target is found. In prior implementations of the ACVS task, there are typically no neutral trials, and there is always a less abundant task-relevant color on every trial.15,16,17 The neutral trials in Experiment One provided an oppor tunity to assess any reward history-related bias in the absence of a more optimal strategy, and it is possible that the presence of such trials reduced the overall likelihood that participants would realize or come to favor a strategy of preferentially searching through the less abundant color. To characterize performance in the absence of differential reward history as a baseline, we had a separate group of participants complete the test phase from Experiment One without any prior train ing phase. We were interested in the extent to which participants would favor reporting a target in the less abundant color in trials in which the distribution of red to blue stimuli was imbalanced.
Methods
Thirty-five new participants (21 female), be tween the ages of 18 and 35 (mean = 18.3 years), were recruited from the Texas A&M University community. All participants reported normal or corrected-to-normal visual acuity and normal color vision. Participants were
13
THE STRATEGY PARTICIPANTS ADOPTED TO FIND A TARGET IN A SITUATION IN WHICH THEY WERE FREE TO CHOOSE HOW TO CONDUCT THEIR SEARCH.
compensated with course credit.
Experimental set-up was identical to Experi ment One, except participants only performed the test phase of Experiment One.
Data Analysis
We excluded data from two participants due to low accuracy in the task (< 3 standard deviation of the group mean) and one participant withdrew before completing the task. Thus, 32 data sets were fully ana lyzed. Trials were broken down by whether there were more red than blue stimuli or vice versa (imbalanced) or an equal number of red and blue stimuli (neutral). For imbalanced trials, the percentage of optimal targets reported (percentage of targets reported in the less abundant color) was computed and compared against unbiased choice (50%).
Results and Discussion
Neither response time nor accuracy differed between imbalanced and neutral trials, t(31) = 1.51, p = 0.142 (Imbalanced: M = 2,762 milliseconds, Neutral: M = 2,714 milliseconds), and t(31) = -1.67, p = 0.105 (Imbalanced: M = 93.2%, Neutral: M = 94.0%), re spectively. For the imbalanced trials, the percentage of optimal targets reported was not significantly different from chance, t(31) = -0.30, p = 0.770 (M = 49.4%). Overall, we found evidence that, without reward histo ry, participants did not exhibit a tendency towards the optimal search strategy in our task, and by extension, reward history did not cause people to abandon an opti mal strategy in Experiment One.
OVERALL DISCUSSION AND CONCLUSIONS
We discovered reward history biased how par ticipants chose to search. They prioritized the previous ly rewarded color in their search overall, even when it was disadvantageous to do so with respect to task per formance and there were no longer any reward incen tives in place. This bias toward the previously rewarded color was shown in the rewarded color choice rate.
Our findings expand understanding of how
reward history modulates the control of attention, extending its influence from biasing attention to spe cific stimuli18,19,20,21 to influencing the strategic control of attention. More specifically, reward history biases the choice of which target template to use in different situations. From Experiment Two, we learned the bias toward the strategy that has been rewarded in the past does not necessarily occur at the expense of an oth erwise optimal strategy. Rather, at least in our task, reward history biases how people choose to search when they otherwise lack a strong inclination based on the task and hand.
Understanding the effect of reward in goal-di rected attentional control can provide a new approach for viewing addiction. Not only might a pattern of drug abuse result in biased attention to drug-related stimu li,22,23 but it could also influence the method or strategy of visual search in the daily life of drug-dependent individuals.
ACKNOWLEDGEMENTS
I would like to thank Dr. Brian A. Anderson for his mentorship of this research project. This article is adapted from “The influence of reward history on goal-directed visual search” by Lee, Kim and Ander son,24 which should be referenced as the peer-reviewed publication of record in scientific discourse. This study was run on the following protocol: Affective and Motivational Control of Human Attention (IRB20160549D) approved by the Texas A&M University Insti tutional Review Board. This work was made possible in part by the National Institutes of Health (NIH) under Grant Number R01-DA046410. Its contents are solely the responsibility of the authors and do not necessarily represent the official views of the NIH.
REFERENCES
1. Robert Desimone and John Duncan, “Neural mechanisms of selective visual attention,” An nual review of neuroscience 18, no. 1 (1995): 193-222. https://doi.org/10.1146/annurev. ne.18.030195.001205.
14
2. Geoffrey F. Woodman, Nancy B. Carlisle, and Robert M. G. Reinhart, “Where do we store the memory representations that guide attention?” Journal of vision 13, no. 3 (2013): 1-1. https:// doi.org/10.1167/13.3.1
3. Jan Theeuwes and Remca Burger, “Attention al control during visual search: The effect of irrelevant singletons,” Journal of Experimental Psychology: Human perception and perfor mance 24, no. 5 (1998): 1342. https://doi. org/10.1037/0096-1523.24.5.1342
4. Brian A. Anderson, “The attention habit: How reward learning shapes attentional selection,” Annals of the new York Academy of Scienc es 1369, no. 1 (2016): 24-39. https://doi. org/10.1111/nyas.12957
5. Brian A. Anderson, Patryk A. Laurent, and Ste ven Yantis, “Value-driven attentional capture,” Proceedings of the National Academy of Sci ences 108 (June 2011): 10367-10371. https:// doi.org/10.1073/pnas.1104047108
6. Brian A. Anderson, “A value-driven mech anism of attentional selection,” Journal of vision 13, no. 3 (2013): 7-7. https://doi. org/10.1167/13.3.7
7. Brian A. Anderson, “What is abnormal about addiction-related attentional biases? “ Drug and alcohol dependence 167 (2016): 8-14. https://doi.org/10.1016/j.drugalc dep.2016.08.002.
8. Kent C. Berridge and Terry E. Robinson, “Parsing reward,” Trends in neurosciences 26, no. 9 (2003): 507-513. https://doi.org/10.1016/ S0166-2236(03)00233-9.
9. Engelmann, Jan, Eswar Damaraju, Srikanth Padmala, and Luiz Pessoa. “Combined Effects of Attention and Motivation on Visual Task Performance: Transient and Sustained Motiva tional Effects.” Original Research. Frontiers in Human Neuroscience 3, no. 4 (2009). https:// doi.org/10.3389/neuro.09.004.2009.
10. Esterman, Michael, Andrew Reagan, Guanyu Liu, Caroline Turner, and Joseph DeGutis. “Re ward Reveals Dissociable Aspects of Sustained Attention.” Journal of Experimental Psychol ogy: General 143, no. 6 (2014): 2287. https:// doi.org/10.1037/xge0000019
11. Anderson, “What is abnormal about addic tion-related attentional biases?” 8-14.
12. Berridge and Robinson, “Parsing reward,” 507513.
13. Jessica L. Irons and Andrew B. Leber, “Choos ing attentional control settings in a dynamically changing environment,” Attention, Perception, & Psychophysics 78, no. 7 (October 2016): 2031-2048. https://doi.org/10.3758/s13414016-1125-4.
14. Jessica L. Irons and Andrew B. Leber, “Char acterizing individual variation in the strategic use of attentional control,” Journal of Exper imental Psychology: Human Perception and Performance 44, no. 10 (2018): 1637-1654. https://doi.org/10.1037/xhp0000560.
15. Irons and Leber, “Choosing attentional control settings in a dynamically changing environ ment,” 2031-2048.
16. Irons and Leber, “Characterizing individual variation in the strategic use of attentional con trol,” 1637-1654.
17. Andy Jeesu Kim, David S. Lee, and Brian A. Anderson, “The influence of threat on the efficiency of goal-directed attentional control,” Psychological Research 85, no. 3 (April 2021): 980-986. https://doi.org/10.1007/s00426-02001321-4
18. Anderson, “A value-driven mechanism of attentional selection,” 7-7.
19. Anderson, Laurent, and Yantis, “Value-driven attentional capture,” 10367-10371.
20. Botvinick and Braver, “Motivation and cogni tive control: from behavior to neural mecha
15
nism,” 83-113.
21. Engelmann et al., “Attention-motivation inter actions.”
22. Javad Fadardi, “Implicit cognitive processes and attention bias toward addictive behaviors: introduction, development and application of addiction stroop test,” Journal of fundamentals of mental health 12, no. 45 (2010): 89-358.
23. Karin Mogg et al., “Eye movements to smok ing‐related pictures in smokers: relationship between attentional biases and implicit and explicit measures of stimulus valence,” Ad diction 98, no. 6 (2003): 825-836. https://doi. org/10.1046/j.1360-0443.2003.00392.x.
24. D. S. Lee, A. J. Kim, and B. A. Anderson, “The influence of reward history on goal-directed visual search,” Attention, Perception, and Psychophysics 84, (2022): 324–31. https://doi. org/10.3758/s13414-021-02435-6.
SANGJI DAVID LEE ‘22
Sangji (David) Lee ’22 is a biomedical science major from Plano, TX. Sangji went to Plano West Senior Highschool and, through research, plans to enlighten society with novel findings. Sangji is planning to join the public health field as an epidemiologist.

16
The Effects of Language Status on the Efficacy of Maker Education Programs
 By Lauren Absher ‘23
17
Photo by Santi Vedri on Unsplash.
INTRODUCTION
There is a growing trend in education called the “Maker Movement.”1 It aims to enhance students’ science, technology, engineering, and mathematics (STEM) skills, and other important skills, including problem-solving and creativity, by combining technology with education. Mak er programs often include experiments, creative projects, and presentations that require students to utilize technology like circuits, 3-D printers, and coding.2 These programs intend to encourage students to learn about technology, improve their problem-solving skills, and increase their interest in STEM subjects and careers.
One area of particular importance is underrep resented students, as people of color and non-native English speakers are underrepresented in STEM ca reers.3 The hope of many maker programs is to encour age historically disadvantaged students to develop an interest in STEM subjects and careers where they are currently underrepresented.4 It is important to pro vide these opportunities for underrepresented groups because they have historically been excluded from STEM fields. Previous research has found that students from diverse urban areas responded positively to maker programs, showing an increase in career aspirations and technical skills.5
Many maker programs were created as af terschool programs at libraries or other private in stitutions. However, this makes maker programs less accessible to students from families who do not have the means to attend these programs. To increase accessibility to these programs, some research has aimed to incorporate maker programs into standard public-school education. These programs have both reported a positive impact on students overall.6,7
Recent studies have found evidence of maker programs’ effectiveness;8 however, few have studied maker programs’ impact on multilingual students, who also tend to be underrepresented in STEM careers. This research studies the effect of language status as a mod erator for students’ responses to a STEM mentor pro gram. If language status has a negative correlation with
how multilingual students respond to the mentor pro gram, it could necessitate a change in mentor programs to make them more accessible for underserved students. This study builds upon previous research conducted at Texas A&M University that studied the effects of mak er programs on elementary school children’s self-iden tity and future career aspirations.9,10 This study consists of the same program as the previous research, except it focuses specifically on the language status of students. We hypothesize that fluent English-speaking students will show a higher increase in STEM self-efficacy and STEM career interest than students with low English proficiency (LEP) in response to maker programs im plemented in their schools.
BACKGROUND
Self-Efficacy
In psychology, self-efficacy is defined as peo ple’s beliefs in their ability to perform a task.11 A strong STEM self-efficacy indicates that an individual be lieves they are highly capable of succeeding in STEM related tasks and learning STEM concepts. Research shows that there is a positive effect of self-efficacy on students’ academic achievement and aspirations.12
Career Interest
STEM career interest is defined as a student’s desire to pursue STEM-related careers and their beliefs about what career they will have in the future. Stud ies show that children’s experiences and beliefs affect
18
THE HOPE OF MANY MAKER PROGRAMS IS TO ENCOURAGE HISTORICALLY DISADVANTAGED STUDENTS TO DEVELOP AN INTEREST IN STEM SUBJECTS AND CAREERS...
what careers they pursue later in life.13 Therefore, it is important to develop and cultivate interest in STEM subjects in children while they are young so their inter ests continue later in life, increasing the likelihood they will pursue STEM careers.
METHODS Making
The maker program developed for this exper iment consisted of three weeks of making activities. Each week focused on a different science unit. The activities were designed to build on the topics that stu dents encountered in their sciences classes. The lessons were also designed to build upon each other, culminat ing in the students completing one project each week. The later weeks also relied on skills learned in earlier weeks of the program. For example, one week, students learned about circuits and electricity, and then in later weeks they had to build circuits to complete the project for that week.
The lessons were created by a team of pro fessors and educators with knowledge in science, engineering, and educational development. The maker projects differed from standard classroom lessons and experiments because the maker projects required stu dents to use technology to solve problems.
Participants
A total of 212 participants were involved in this study. The participants consisted of 127 (59.9%) thirdgrade students and 85 (40.1%) fourth-grade students ranging from ages eight to twelve. Of the third-grade students, 48 (37.8%) spoke English fluently and 79 (62.2%) had low English proficiency. Of the fourthgrade students, 36 (42.4%) spoke English fluently and 49 (57.6%) had low English proficiency. The number of students in the statistical analysis varies because some of the data were incomplete. The discrepancy between the data sets is due to some students filling out sections of the surveys incorrectly, requiring those sections be omitted from the analysis. Additionally, a few students’ entire pre- or post-surveys were missing. This was like ly caused by students moving out of or into the school
district in the middle of the semester or their surveys being misplaced.
The experiment was conducted at a local elementary school in East Texas. The school chose five classes to participate in the experiment.
Design
This experiment took place over the course of one semester. The intervention was split up into three one-week long sections. The school’s curriculum was set up so they had three academic periods lasting six weeks per semester. The interventions occurred once per six weeks and corresponded with the topic that students were learning at that time. The students were given two identical surveys, one at the beginning and one at the end of the semester.
Measures
The surveys consisted of two portions. In the first portion, students wrote jobs they thought someone who was good at either math or science would have. Students then rated how much they would like to have that job on a 1 to 5 Likert-type scale, with 1 corre sponding to “Not at all” and 5 to “A lot.” The second part of the surveys utilized a “structured alternative format” adapted from The Self-Perception Profile for Children (SPPC).14 This questionnaire has been validat ed to measure children’s self-esteem.15
The structured alternative format section gave two statements that are opposites (e.g., “I like science” and “I don’t like science”). Then the students rated their agreement with the statements on a Likert scale from 1 to 4, with 1 corresponding to “Really not true for me” for the first statement, and 4 corresponding to “Really true for me”. When calculating the variables, statements indicating high self-efficacy and self-esteem were scored as being the highest numbers and the state ments indicating low self-efficacy and self-esteem were scored as the lowest numbers.
STEM Self-Efficacy
The students’ STEM self-efficacy was mea sured using the SPPC questionnaire described earlier. The students chose from statements like “Other kids
19
worry about whether they can do their assigned science work” and “Some kids feel like they are good at science.” A student with high STEM self-efficacy would theoretically choose “Really true for me”, or 4 on the Likert scale, in response to the second statement.
STEM Career Interest
STEM career interest was measured using two variables: the SPPC questionnaire, which in later analysis is referred to as Job Good, and Likert scale questions that asked how much the students would like to have the STEM job that they identified, which is referred to as JobLike. For the SPPC questionnaire items, the students chose from statements including “I probably won’t have a job that uses math” and “Someday I might have a job that uses math.” A student with high STEM career interest would theoretically choose “Really true for me” to the second statement, “Someday I might have a job that uses math,” which would correspond to choosing 4 on the Likert scale.
RESULTS
Figure 1. The effect of language status on variable JobLike. The bars represent a 95% confidence interval.

The results for the STEM Self-Efficacy t-test and mixed measures ANOVA were not significant.
STEM Career Interest
The reliability analysis for JobLike was low (α = 0.482), meaning the questions used to calculate were not well correlated, so this variable might be unreliable.
To determine whether the maker programs influenced the students, three statistical tests were conducted for each variable: 1) Chrombach’s alpha, a reliability analysis, was used to determine how closely related the survey items are as a group, with a score of one being the strongest reliability and zero being weak est, to ascertain how reliable the measure is; 2) an in dependent samples t-test was used to determine if there was a difference in the LEP and non-LEP students’ final scores; and 3) a mixed measures ANOVA was used to determine if there was any interaction between the LEP and non-LEP students’ pre-and post-test scores.
STEM Self-Efficacy
The reliability analysis for STEM Self-Efficacy found that the questions on the survey used to calcu late the variable STEM Self-Efficacy were moderately correlated (α = 0.656), meaning the variable STEM Self-Efficacy is somewhat reliable.
The results of the t-test for the two-level pre dictor variable, Language Status, predicting the STEM Career Interest variable JobLike are shown in Figure 1.
The LEP students scored higher (M = 3.99, SD = 0.988, n = 88) on the variable JobLike at the end of the program than the non-LEP students (M = 3.52, SD = 1.216, n = 60). This difference was statistically significant, t(146) = 2.55, p = 0.012, 95% CI [0.1043, 0.8230], meaning LEP students reported liking the STEM career that they identified more than the nonLEP students at the end of the program.
The results of the mixed measures ANOVA test on Language Status as compared to the STEM Career Interest variable JobLike are shown in Figure 2
Results indicated a significant main effect for language status, such that LEP students rated higher (M
20
Figure 2. Repeated measures ANOVA comparing language status and variable JobLike. The bars represent a 95% confidence interval.
test on Language Status predicting the STEM career interest variable JobGood are shown in Figure 3
Based on the mixed mea sures ANOVA for the variable JobGood, LEP students started lower (M = 2.62, SD = 0.832, n = 96) than non-LEP students (M = 2.83, SD = 0.699, n = 54). The LEP students’ scores increased (M = 3.03, SD = 0.554, n = 71) and surpassed non-LEP students’ scores, which decreased slightly (M = 2.86, SD = 0.810, n = 46). The interaction between these variables was signifi cant, F(1, 93) = 5.40, p = 0.022, η2= 0.028. This shows that LEP students’ desire to have a job that uses STEM subjects increased throughout the program and surpassed non-LEP students, whose reported interest in careers that use STEM subjects decreased slightly.
CONCLUSION Discussion
Figure 3. Repeated measures ANOVA comparing language status and variable JobGood. The bars represent a 95% confidence interval.


= 3.99, SD = 0.988, n = 88) on the JobLike outcome variable when compared to non-LEP students (M = 3.52, SD = 1.216, n = 60), F(1, 140) = 4.51, p = 0.036, η2= 0.017. This shows that LEP students reported lik ing the STEM career that they identified more on aver age than the non-LEP students throughout the program.
The reliability analysis for JobGood showed that the questions used were moderately correlated (α = 0.744), meaning the variable is reliable.
The results of the mixed measures ANOVA
This study focused on the effects of a maker program on stu dents’ STEM career interest, STEM self-efficacy, and the moderation of said effects by the students’ language status. We predicted that low English proficiency would have a negative effect on how much the mentor program affected the students’ reported self-efficacy and career interests. The data showed that LEP students had greater increases on their reported STEM career interest and ended with higher scores than the non-LEP students.
Additionally, LEP students ended with scores significantly higher than non-LEP students for the vari able JobLike, which measured how much the students would like to have a STEM career. This suggests that
21
A MAJOR ISSUE IN STEM IS
IN STEM MAJORS AND CAREERS.
LEP students were more likely to want to have a STEM career after the intervention. Additionally, there was a significant interaction between the LEP and nonLEP students’ scores on the variable JobGood which measured how much the students thought they might like to have jobs that use STEM related skills. For this variable, the LEP students started with lower scores and ended with higher scores than the non-LEP stu dents. The significant interaction suggests that STEM intervention through the form of maker programs potentially affects LEP students to a greater degree than non-LEP students.
One possible explanation for these trends is that LEP students may have less experience with maker programs, so when they were exposed to this program, it had a greater impact because the program was a newer experience for the LEP students. Moreover, the differences could be due to the nature of the program, which encourages students to figure out the answers to problems on their own and then create solutions using technology. This might allow LEP students to think in their native language, because less English is needed to perform these tasks than what might be required for activities in a traditional classroom, like essay writing.
Our results have important implications for maker programs in schools. A major issue in STEM is the lack of diversity and representation of minority groups in STEM majors and careers. These results show that maker programs have a greater impact on LEP students’ career interests than on non-LEP students meaning that maker programs could be an effective way to increase LEP students’ representation in STEM
careers. Additionally, it highlights how important it is to increase LEP students’ access to programs like these. Since these programs are more effective at increasing LEP students’ STEM career interest than non-LEP students, it would be more cost-effective to ensure that these programs are implemented in areas with larger populations of LEP students, where they would have greater impact. More analysis is needed to clarify the full impacts of maker programs on LEP students and the best ways to implement these programs.
Limitations
There were several limitations to this experi ment. First, there was no control group as all students surveyed were in the mentor program. This could result in trends in the general population of students that caused the effects seen.
Second, due to the population studied, most students with low English proficiency spoke Spanish as their native language. This could cause issues when generalizing findings to LEP student populations as a whole because many students with LEP speak languag es other than Spanish as their first language. This might impact the effects of the maker program. Additionally, because there were so many students with low English proficiency in this school, there could be a buffering effect due to the social support of other LEP students that might not have been otherwise present if the LEP students were in classes where they were the only non-native English-speaking student.
Third, the surveys were completed using self-report measures. Self-report measures can have reliability issues due to confounds like demand effects. Students might have felt pressured to choose answer choices indicating a positive effect of the program be cause they felt that the researchers were wanting them to do so.
Finally, the variables had relatively low Chrombach’s alpha scores, meaning the scale items were not well correlated with each other, which could cause some variance, preventing the data from being significant. It is possible that if this experiment were repeated with better corresponding variables, the data might show more significant trends.
22
THE LACK OF DIVERSITY AND REPRESENTATION OF MINORITY GROUPS
ACKNOWLEDGEMENTS
I would like to thank my faculty advisor Dr. Schlegel and Rebecca Ward for their guidance and support throughout the course of this research. The data analyzed for The Effects of Language Status on the Efficacy of Maker Programs were provided by the Texas A&M Existential Psychology Lab. This work was also made possible in part by Bryan Independent School District.
This project required approval from the Texas A&M University Research Compliance & Biosafety office.
TAMU IRB #: 2019-1132D Approval Date: 10/30/2019 Expiration Date: 09/12/2022
REFERENCES
1. L. Martin, “The promise of the Maker Move ment for Education,” Journal of Pre-Col lege Engineering Education Research (J-PEER) 5, no. 1 (2015): 30–9. https://doi. org/10.7771/2157-9288.1099.
2. P. Blikstein, “Maker Movement in education: History and prospects,” Springer Internation al Handbooks of Education (2017):419–37. https://doi.org/10.1007/978-3-319-44687-5_33.
3. M. Estrada, M. Burnett, A. G. Campbell, P. B. Campbell, W. F. Denetclaw, C. G. Gutiérrez, S. Hurtado, G.H. John, J. Matsui, R. McGee, C. M. Okpodu, T. J. Robinson, M. F. Summers, M. Werner-Washburne, and M. E. Zavala, “Improving underrepresented minority student persistence in STEM,” CBE—Life Sciences Education 15, no. 3 (2016): 1–10. https://doi. org/10.1187/cbe.16-01-0038
4. Martin, “The promise of the Maker Movement for Education,” 30-31.
5. F. Hamidi, A. Freeland, S. Grimes, A. Moul ton, and A. Coy, “Expanding informal mak er-based learning programs for urban youth,” 2020 IEEE Frontiers in Education Confer
ence (FIE) (2020). https://doi.org/10.1109/ fie44824.2020.9274006.
6. S. L. Chu, R. Schlegel, F. Quek, A. Christy, and K. Chen, “I make, therefore I am,” Proceedings of the 2017 CHI Conference on Human Fac tors in Computing Systems (2017). https://doi. org/10.1145/3025453.3025458.
7. R. J. Schlegel, S. Chu, K. Chen, E. Deuermey er, A. G. Christy, and F. Quek, “Making in the classroom: Longitudinal evidence of increases in self-efficacy and stem possible selves over time,” Computers & Education 142 (2019): 103637. https://doi.org/10.1016/j.compe du.2019.103637.
8. S. Papavlasopoulou, M. N. Giannakos, and L. Jaccheri, “Empirical studies on the Maker Movement, a promising approach to learning: A literature review,” Entertainment Computing 18 (2017): 57–78. https://doi.org/10.1016/j. entcom.2016.09.002.
9. Chu et al., “I make, therefore I am.”
10. Schlegel et al., “Making in the classroom,” 142.
11. A. Bandura, W. H. Freeman, and R. Light sey, “Self-efficacy: The exercise of Control,” Journal of Cognitive Psychotherapy 13, no. 2 (1999): 158–166. https://doi.org/10.1891/08898391.13.2.158
12. A. Bandura and D. H. Schunk, (1981). “Culti vating competence, self-efficacy, and intrinsic interest through proximal self-motivation,” Journal of Personality and Social Psychol ogy 41, no. 3 (1981): 586–98. https://doi. org/10.1037/0022-3514.41.3.586
13. H. T. Rowan-Kenyon, A. K. Swan, and M. F. Creager, “Social cognitive factors, support, and engagement: Early adolescents’ math interests as precursors to choice of career,” The Career Development Quarterly 60, no. 1 (2012): 2–15. https://doi.org/10.1002/j.21610045.2012.00001.x.
23
14. S. Harter, Manual for the self-perception profile for children: (revision of the perceived compe tence scale for children) (Denver, CO: Univer sity of Denver, 1985), 4-11.
15. J. Granleese and S. Joseph, “Reliability of the Harter self-perception profile for children and predictors of global self-worth,” The Journal of Genetic Psychology 155, no. 4 (1994): 487–92. https://doi.org/10.1080/00221325.1994.99147 96
LAUREN ABSHER ‘23
Lauren Absher '23 is a recent graduate with a psychology major and a neuroscience minor from Plano, Texas. Lauren has been working in the TAMU Existential Psychology Laboratory since the Fall of 2019. She plans to apply to medical schools this year with the ultimate goal of becoming a psychiatrist.

24
How Strongly Do Viral Proteins Lasso Viral DNA?
 By Sarah E. Fross ‘22
25
Photo by Sangharsh Lohakare on Unsplash.
BACKGROUND
Viral replication typically involves a protein binding to a specific region of viral DNA (vDNA) to assist in DNA repli cation and other functions associated with viral infection.1 The Epstein-Barr virus (EBV) and Kaposi’s sarcoma-associated herpesvirus (KSHV) can cause epithelial and lymphatic cancers which are prevalent worldwide.2 Most often, these viruses are not metabolically active and thus hard to detect during “latency phases.”3 However, the EBV Nuclear Antigen (EBNA1) and KSHV Latency-Associated Nuclear Antigen (LANA) are still active throughout the latency phases. Both EBNA1 and LANA cause cancer by binding to vDNA, increasing cell proliferation and vDNA replication, inhibiting cell-programmed death, and making the infected cell undetectable to the immune system.4,5
EBNA1 has a role in all activity of EBV’s latency phases, making it an appealing target for developing a treatment to combat EBV, as LANA is for KSHV. This study compared the EBNA1 relative binding free energy (RBFE) against the LANA RBFE obtained through all-atom molecular dynamics (MD) simulations. RBFE describes the energy required to create binding interactions, and this study focused on those of viral protein-DNA complexes. With the calculation of the RBFE for EBNA1 and LANA, we hoped this could be used for inhibitor development to stop proteins like EBNA1 from binding to vDNAs and provide a preventative treatment for the cancers they cause. Specifically, ligands with RBFE values similar to that of either EBNA1 or LANA upon binding to vDNA could be used as protein-inhibitors.6 Nor mally, these inhibitors would be discovered through high-throughput screening where up to millions of molecules of varying structure are
tested to find the most functional drug.7 By forgoing these trial-and-error binding experiments, binding affinity studies such as MD analyses can streamline drug development to lower material and time costs.8 To perform these analyses, we studied the thermodynamic and structural properties of EBNA1 and LANA.
METHODS
MD simulations were performed using the Texas A&M University High Performance Research Computing (TAMU HPRC) and molecular modeling softwares, namely CHARMM and OpenMM (OMM). The viral protein-DNA complexes were obtained from
Figure 1. Structure of Viral Protein, vDNA, and Protein-vDNA complexes. A) EBNA1. B) EBNA1-vDNAEBV complex. C) vDNAEBV. D) LANA. E) LANA-vD NAKSHV complex. F) vDNAKSHV

26
...WE HOPED THIS COULD BE USED FOR INHIBITOR DEVELOPMENT TO STOP PROTEINS LIKE EBNA1 FROM BINDING TO VDNAS AND PROVIDE A PREVENTATIVE TREATMENT FOR THE CANCERS THEY CAUSE.
the RCSB Protein Database and the respective vDNA strands for EBV and KSHV were constructed using software specific to modeling DNA.9 The structures were then allowed to reach a more stable, lower ener gy conformation. The resultant structures are shown in Figure 1
To simulate physiological conditions, water molecules were added to surround the structure in the same fashion as Hwang et al. to allow for the thermal fluctuations that influence the microscopic movement of all other molecular structures.10 The atomic scale is reported in Angstroms (Å); 1 Å is equal to 0.1 nanometers. Each structure was placed in a cubic box that had faces at least 12 Å away from the structure’s atoms. The 12 Å distance was chosen as the cutoff distance to prevent nonbonded interactions between the molecule and water or another molecule. If the oxygen in a water molecule was within 2.8 Å of a structure’s heavy atoms (like carbon or phosphorus), that water molecule was removed to avoid overlap ping. Sodium and chloride ions were then added to neutralize the structures inside the water boxes to achieve a total concentration of approximately 50 mM of ions. Neutralization is meant to achieve phys iological conditions as molecules can have inherent overall charges, which are balanced to no charge when present in cytoplasm or blood serum. Additionally, ion concentrations within the box were meant to represent the charges within cells and blood serum. An example of a neutralized EBNA1 structure is shown in Figure 2.
The structures were then forced to enter their most stable conformations with energy minimization of the water molecules, ions, and main structures accord ing to Hwang et al.11 This involved adding, then slowly decreasing, constraints following harmonic trends to allow for free motion. The structures were then heated from 30 Kelvin to 300 Kelvin and the structures were allowed to reach equilibrium.
Lastly, the structures were prepared for the simulations with light constraints on the backbone car bon atoms in the proteins and phosphorous atoms in the vDNA for 2 nanoseconds (ns). Initial simulations of the DNA revealed a tendency for DNA denaturing or “fray ing.”12 The hydrogen bonds between the terminal nucle
Figure 2. EBNA1 structure neutralized in a water box. EBNA1 is shown in red and vDNA in purple, light blue lines are water molecules, and orange and blue spheres are Na+ and Cl- ions respectively.

ic acids would break and allow for successive breakage of bonds down the DNA. To combat this, distance restraints were placed on the terminal hydrogen-bind ing atoms involved to keep each atom at a maximum of 2.4 Å away from each other and promote binding. This would also replicate physiological conditions because vDNA is a continuous circular strand as an episome. Restraints followed Hooke’s law to allow the atoms to oscillate given a defined spring constant specific to the atom type. Finally, the covalent bond lengths for hydrogen atoms were set using the SHAKE CHARMM method similar to Hwang et al.13 All structures were then transferred to TAMU HPRC to perform the simu lations with OMM. Positional coordinates throughout the simulations were saved every 20 picoseconds using the domain decomposition CHARMM method and all systems lasted for 200 ns with 10,000 total frames.
RESULTS
The noncovalent interactions between the atoms in the protein-vDNA complexes, including hydrogen bonds and nonpolar contacts, were calculated
27
according to CHARMM HBOND and previous devel opments by Brooks et al.14 The hydrogen and nonpo lar binding events throughout the simulation found EBNA1 created a larger total number of noncovalent contacts compared to LANA. Specifically, EBNA1 had 31 different hydrogen bonds and 32 nonpolar contacts while LANA had 14 hydrogen bonds and 17 nonpolar contacts. In total, EBNA1 had at most 63 bonds while LANA only had 31 bonds, which leads to the hypoth esis that EBNA1 requires more RBFE. Both the hydrogen and nonpolar interac tions are shown in Figure 3 in contrast ing-colored ‘sticks,’ where the difference in bond number is apparent.
The root-mean-square fluctuation (RMSF) calculation was performed to determine which amino and nucleic acids (residues) were the most mobile rela tive to the reference structure. The more mobile structures will have a higher RMSF because they are not bound. The combined RMSF of the proteins and vDNAs from the two complexes can be seen in Figure 4, with peaks at ranges of residues where there is increased mobility and thus fewer bonds.
The root-mean-square deviation (RMSD) was calculated to find the deviation of the entire structure versus the original struc ture over time. Protein residues with a RMSF above 1 Å and vDNA residues with a RMSF above 2 Å were ignored for the RMSD cal culation to avoid excessive noise from highly-mobile regions in the structure. The resultant RMSD plot of all structures excluding the highly mobile residues is shown in Figure 5, comparing the RMSD of the protein and vDNA chains from the EBNA1 and LANA complexes.
On average, the vDNA chains deviated 3.66 ± 0.43 Å whereas the protein chains deviated 0.68 ± 0.06 Å. This difference in movement in space can be attributed to the number of binding interactions present. The binding of the vDNA by the protein can determine if the vDNA has the ability to deviate in position. Al


Figure 3. Noncovalent contacts that lasted for 40% of the simu lation shown as contrasting-colored sticks. A) EBNA1 complex. B) LANA complex.
Figure 4. RMSF of parts of vDNA and protein in EBNA1 and LANA com plexes.
28
though there are more noncovalent bonds for EBNA1 than LANA, the average RMSD of vDNAEBV was higher than that of vDNAKSHV
The buried surface area was computed to find the area of each structure that was used for binding. For each complex, the calculation involved adding the outer area of the protein by itself with the outer area of the vDNA by itself, then subtracting the outer area of the complex from the previous sum (Equation 1); where A1 is the outer area of the protein, A2 is the area of the vDNA, and A12 is the shared area of A1 and A2 complex. The expression is halved because the numer ator results in twice the complex area, resulting in the change in area of the protein-vDNA complex binding interface. This calculation was repeated for each frame
������������������������������������������������ �������������������������������������������������������� �������������������������������� = ��������1 + ��������2 ��������12 2
Equation
1
in the simulation and can be seen in Figure 6.
A direct correlation can be made between an increased buried surface area and increased binding energy.15 The average and standard deviation area for the EBNA1 complex for the most stable last 100 ns is 2616.90 ± 107.73 Å2, whereas the LANA area is 1734.74 ± 91.39 Å2 for the last 100ns. According to these values, it can be inferred that the EBNA1 com plex has a stronger binding free energy compared to that of the LANA complex.
Figure 5. RMSD of whole EBNA1 and LANA structures in space over 200ns.
The conformational entropy was found using the method from Shi et al.16 Their study used infor mation theory to relate the random process, which is sidechain dynam ics, to a probability distribution of how the structure is able to fluctuate in space.17 The entropy was found by first calculating the dihedral angles of the backbone and sidechain atoms of both the protein and vDNA struc tures. This calculation finds how much each structure rotates around a specific axis defined by three con secutive bonds and the four atoms involved. To verify the accuracy of these values, the angles throughout the entire simulation were subsa mpled for five separate entropy calculations. Specifically, every fifth dihedral angle was separated resulting in five 40 ns measurements instead of one 200 ns measurement. From these subsampled trajectories, an average and standard deviation entropy value for each structure was obtained and plotted against the total simulated time, as shown in Figure 7.

29
Figure 6. Buried Surface Area of EBNA1 and LANA protein-vDNA complexes over 200ns.


Figure 7 depicts the conformational chang es that can occur from the studied structures because of the difference in structure size. For example, the EBNA1 protein has 147 amino acids and an entropy of 3184.229 kcal/mol compared to 137 and 3007.464 kcal/ mol for LANA. Similarly, the vDNAKSHV has 20 nu cleic acids and an entropy of 798.504 kcal/mol, while vDNAEBV only has 18 nucleic acids and an entropy of 715.019 kcal/mol. An increase in dihedral rotation around bonds is related to an increase in the number of bonds. This relation can be seen in Figure 3 since the EBNA1 complex creates more bonds between the protein and vDNA.
The energy of each structure as well as the solva tion energy was calculated to find the relative binding free energy. Negative RBFE values correspond to complexes fa voring a bound state. This was done according to the meth ods in Zoete et al. where the binding free energy is the sum
of the energy contributions from the van der Waals and electrostatic energies (∆G0bind), the difference between the sol vation energy of the complex and the sum of the two compo nents (∆Gdesolv), and the differ ence of the entropy (-T∆S).18 The equation of the differences in solvation energy can be seen in Equation 2, while the binding free energy equation can be seen in Equation 3.
The solvation energy used the Generalized Born model for Molecular Volumes (GBMV) and with a Switching function (GBSW) using CHARMM GBMV and GBSW com mands.19 The solvation energy terms for the complex, ∆GD, and the monomers, ∆GM , used the calculated GBMV or GBSW for the complex and protein and vDNA from the complex trajectory, re spectively. Dissimilar to Equation 2, the difference in entropy is calculated using the conformational entropy values from the complex, sole protein, and sole vDNA simulations.
Figure 7. Conformational Entropy of protein-vDNA complexes, sole proteins, and sole vDNAs.
30
CONCLUSION
Equation 3
Table 1. GBSW RBFE values for EBNA1 and LANA complexes.
Energy EBNA1 GBSW (kcal/mol) LANA GBSW (kcal/mol)
∆G0bind 9928.6 ± 225.5 5788.5 ± 136.0
∆GM1solv 6143.9 ± 122.1 4175.3 ± 104.0
∆GM2solv 12278.8 ± 87.3 14299.8 ± 138.5 ∆GDsolv 8756.1 ± 140.0 12823.4 ± 156.0 T∆S 37.5 31.64 ∆Gbind 224.6 ± 33.1 105.2 ± 17.9
The final GBSW RBFE values are tabulated in Table 1, where a more negative value for ∆Gbind can be associated with stronger binding free energy. As shown, the EBNA1 protein-vDNA complex elicited a lower RBFE compared to LANA.
We hope the RBFE values of -224.6 ± 33.1 kcal/mol for EBNA1 and -105.2 ± 17.9 kcal/mol for LANA can be used to further inhibitor development for EBV and KSHV, similar to Ancy et al.20 Explicitly, potential inhibitors exhibiting similar RBFE values to those reported here via MD analyses can be assumed to have a similar binding affinity to the EBNA and LANA proteins.
The EBNA1 and LANA proteins are responsi ble for prolonging the longevity of infected host cells and stimulating cancer development. If the binding of these proteins to vDNA was stopped, the virus would not be able to replicate vDNA and inhibit the immune response and apoptosis. The noncovalent interactions, buried surface area, and RBFE analyses support that the EBNA1 protein binds more strongly to vDNAEBV than LANA to vDNAKSHV. Ac cording to Hellert et al., EBNA1 attaches to vDNA with specific “linking domains” that are sepa rate from the regions specific to DNA-binding.21 This contrasts with how LANA uses the same region for DNA-binding and DNA tethering. With relation to RBFE, this can explain the lower RBFE of LANA because its binding regions are expended for tethering as well as se quence-specific vDNA-binding. Overall, we hope these calcula tions could be used for inhibi tor development to disrupt the binding of these DNA-binding proteins to vDNA. For future studies, we could perform a docking simulation to visualize the sequence-specific binding.
ACKNOWLEDGEMENTS
I would like to thank my faculty advisor, Dr. Hwang, and my graduate student mentors, Sofiya Bet tencourt, James Gonzales, and Jie Shi, for their guid ance and support throughout the course of this research. I would also like to thank my family, friends, and the Hwang lab for believing in me and helping me reach new heights. A majority of the molecular dynamic sim ulations and computations completed herein were made possible from access to Texas A&M High Performance Research Computing.
31
Equation 2 ∆�������������������������������������������������������� = ∆���������������������������������������� �������� (∆���������������������������������������� ��������1 + ∆���������������������������������������� ��������2 ) ∆���������������������������������������� = ⟨∆���������������������������������������� 0 ⟩ + ⟨∆�������������������������������������������������������� ⟩ ⟨��������∆��������⟩
SUPPLEMENTAL INFORMATION
The QR code gives access to a YouTube video of the simulations performed. Each simulation has been sped up to fit within thirty seconds.

6. I. Ancy, M. Sivanandam, and P. Kumaradhas, “Possibility of HIV-1 protease inhibitors-clin ical trial drugs as repurposed drugs for SARSCoV-2 main protease: a molecular docking, molecular dynamics and binding free energy simulation study,” Journal of Biomolecular Structure and Dynamics 39, no. 15 (2021): 5368–75. https://doi.org/10.1080/07391102.20 20.1786459
7. J. Bajorath, “Integration of virtual and high-throughput screening,” Nature Reviews Drug Discovery 1, no. 11 (2002): 882–94. https://doi.org/10.1038/nrd941.
8. Gianti et al., “Computational analysis of EBNA1 ‘druggability’,” 285–303.
9. H. M. Berman et al., “The protein data bank,” Nucleic acids research 28, no. 1 (2000): 235–42. https://doi.org/10.1093/nar/28.1.235.
REFERENCES
1. A. M. Edwards, A. Bochkarev, and L. Frap pier, “Origin DNA-binding proteins,” Cur rent opinion in structural biology 8, no. 1 (1998): 49–53. https://doi.org/10.1016/S0959440X(98)80009-2.
2. T. Uppal, S. Banerjee, Z. Sun, S. C. Verma, and E. S. Robertson, “KSHV LANA—the master regulator of KSHV latency,” Viruses 6, no. 12 (2014): 4961–98. https://doi.org/10.3390/ v6124961
3. C. Shannon-Lowe, A. B. Rickinson, and A. I. Bell, “Epstein–Barr virus-associated lympho mas,” Philosophical Transactions of the Royal Society B: Biological Sciences 372, no. 1732 (2017): 20160271. https://doi.org/10.1098/ rstb.2016.0271
4. Uppal et al., “KSHV LANA,” 4961–98.
5. Shannon-Lowe et al., “Epstein–Barr virus-as sociated lymphomas,” 20160271.
10. W. Hwang, R. J. Mallis, M. J. Lang, and E. L. Reinherz, “The αβTCR mechanosensor ex ploits dynamic ectodomain allostery to opti mize its ligand recognition site,” Proceedings of the National Academy of Sciences 117, no. 35 (2020): 21336–45. https://doi.org/10.1073/ pnas.2005899117
11. Hwang et al., “The αβTCR mechanosensor,” 21336–45.
12. R. Galindo-Murillo et al., “Assessing the cur rent state of amber force field modifications for DNA,” Journal of chemical theory and com putation 12, no. 8 (2016): 4114–27. https://doi. org/10.1021/acs.jctc.6b00186
13. Hwang et al., “The αβTCR mechanosensor,” 21336–45.
14. B. R. Brooks et al., “CHARMM: the biomolec ular simulation program,” Journal of computa tional chemistry 30, no. 10 (2009): 1545–614. https://doi.org/10.1002/jcc.21287
15. W. Hwang, M. J. Lang, and M. Karplus, “Kinesin motility is driven by subdomain dynamics,” Elife 6, (2017): e28948. https://doi.
32
org/10.7554/eLife.28948.001
16. J. Shi, Q. Shen, J.-H. Cho, and W. Hwang, “En tropy hotspots for the binding of intrinsically disordered ligands to a receptor domain,” Bio physical journal 118, no. 10 (2020): 2502–12. https://doi.org/10.1016/j.bpj.2020.03.026
17. B. M. King, N. W. Silver, and B. Tidor, “Effi cient Calculation of Molecular Configurational Entropies Using an Information Theoretic Ap proximation,” The Journal of Physical Chemis try B 116, no. 9 (2012): 2891–904. https://doi. org/10.1021/jp2068123
18. V. Zoete, M. Meuwly, and M. Karplus, “Study of the insulin dimerization: binding free en ergy calculations and per‐residue free energy decomposition,” Proteins: Structure, Function, and Bioinformatics 61, no. 1 (2005): 79–93. https://doi.org/10.1002/jcc.21287.

19. M. S. Lee, F. R. Salsbury Jr, and C. L. Brooks III, “Novel generalized Born methods,” The Journal of chemical physics 116, no. 24 (2002): 10606–14. https://doi.org/10.1063/1.1480013.
20. Ancy et al., “Possibility of HIV-1 protease inhibitors,” 5368–75.
21. J. Hellert et al., “A structural basis for BRD2/4-mediated host chromatin interaction and oligomer assembly of Kaposi sarcoma-as sociated herpesvirus and murine gammaherpes virus LANA proteins,” PLoS pathogens 9, no. 10 (2013): e1003640. https://doi.org/10.1371/ journal.ppat.1003640
Sarah E. Fross ‘22 is a Biomedical Engineering major originally from Magnolia, Texas but currently calls Conroe, Texas home. While living in Western Australia, she visited the Harry Perkins Institute of Medical Research and has since been fascinated with cancer research. She plans on pursuing a Ph.D. degree in Infectious Disease after graduation with the hopes of developing vaccines.
33
SARAH E. FROSS ‘22
Accelerating Training Through Personalization in Augmented Reality
 By Isabella C. Pedron ‘23, Connor M. Barnes ‘23, Ashley E. Bail ly ‘23
34
Photo by Mat Napo on Unsplash.
INTRODUCTION
The U.S. Emergency Medical Services (EMS), composed of first responders, emergency medical technicians (EMTs), paramedics, firefighters, and others, is a vital system that provides urgent pre hospital treatment and transport. These emergency re sponse (ER) workers attend to over 42.5 million calls every year.1 However, career burnout and relatively low salaries have led to a significantly high annual turnover rate of 20–30%, with estimated turnover costs being $6,400 and $7,700 per full-time EMT and paramedic, respectively.2 In recent years, these issues have caused an acute nationwide shortage of ER workers, causing slower response times, a lack of services, and a deficit of supplies in many areas.
The ongoing COVID-19 pandemic has caused the ER worker shortage to reach a crisis level. ER training programs were paused or shut down entirely, the National Registry of EMTs stopped its certifica tion testing, and hospitals short on nursing staff began to hire paramedics at higher wages. These workforce shifts occurred at a time when the nation saw an un precedented increase in EMS call volumes.3 There is a pressing need to expedite the training of ER workers while maintaining high quality of instruction.
To address this need, we collaborated with several other universities and public safety partners to develop an adaptive EMS training platform called LEARNER. LEARNER integrates modern human aug
mentation technologies such as robotics, virtual reality (VR), and augmented reality (AR), to improve work conditions of EMS personnel as well as provide immer sive and accessible modalities of training. Our goal is to accelerate expertise development by implementing an innovative approach for EMS-based curriculums by tailoring training to individual program and trainee needs. Our latest study focuses on using AR as a train ing delivery method.
AR technology superimposes virtual objects on the real world. Blending real and virtual content offers unique benefits over other training methods by creating more immersive and realistic learning experiences. Other benefits of AR include the ability to program a wide variety of customized scenarios for training and its high level of portability, as it only requires a head mounted device or a smartphone with an AR applica tion.4 These features enable greater levels of person alization and allow for situational learning that fits the user’s needs, which have been shown to make the learning process easier and faster. In fact, AR-based training is already used in a variety of medical appli cations, such as surgical training, and has reduced the amount of time needed to practice certain skills.5 Even so, there is little empirical evidence regarding the effec tiveness of this emerging technology.
Scan the QR code to watch the LEARNER project video created by the NeuroErgonomics Lab, or visit https://tx.ag/509LEARNERvideo.
In a previous study conducted by our lab, we compared the efficacy of AR-based training to vid eo-based training, a more conventional training meth od. We analyzed how first-time AR users learned how to interact with the AR interface in different training

35
BLENDING REAL AND VIRTUAL CONTENT OFFERS UNIQUE BENEFITS OVER OTHER TRAINING METHODS BY CREATING MORE IMMERSIVE AND REALISTIC LEARNING EXPERIENCES.
modalities by evaluating parameters that affected performance during training and retention. We found that AR-based training resulted in better immersion and higher user engagement; however, it was associated with greater frustration, lower focused attention, and higher cognitive load.
Building upon the aforementioned research, this current study aims to: 1) evaluate a machine learn ing algorithm designed to advance the development of a personalized training program while taking into con sideration the drawbacks of AR-based training previ ously found; and 2) examine differences in subjective, physiological, and performance metrics between high and low performers.
METHODS
Participants
We recruited 12 participants (50% females) for our study with a mean age of 21±1 years. Recruitment was limited to right-handed individuals with less than one hour of AR/VR experience. These requirements ensured that all participants used the same, dominant hand for the duration of the study and began with the same limited knowledge of immersive, interactive environments. For safety reasons, additional exclusion criteria included an allergy to adhesives, a history of photosensitive epilepsy or seizures, and a metal implant
or other device in the head. Participants were compen sated for their time. This research was approved by the Institutional Review Board (IRB2021-0742DCR).
Study Protocol
Each AR session was completed in one day, lasting about two and a half hours. The study had four phases: setup, AR familiarization, AR adaptation (if needed), and evaluation. Figure 1 summarizes the study protocol.
At the beginning of each session, participants were outfitted with an Actiheart device (Actiheart 4, CamNTech, Inc., UK) to collect heart rate data, an Empatica watch (Empatica E4, Empatica Inc., USA) to collect electrodermal activity data, and an AR headset (Microsoft HoloLens 2). We collected initial subjective surveys and baseline data for three minutes prior to AR training.
During familiarization, participants learned four AR interaction tasks: 1) poking, 2) raycasting, 3) scrolling, and 4) moving. The order of tasks was varied to reduce order bias. Participants trained on the four tasks by completing six trials for each task. After each task, subjective surveys were collected regarding the participant’s experience. Figure 2 showcases these tasks in AR via video.
1. Poking involved pointer finger selection and was utilized when the virtual elements were

36
Figure 1. Study protocol flowchart.
within arm’s reach of the user. The user was instructed to select the numbers one through ten in ascending order.

2. Raycasting was utilized when the virtual ele ments were out of arm’s reach of the user. This selection method required the user to direct a beam of light from their palm and then select elements by pinching their pointer finger and thumb together. The user was again instruct ed to select the numbers one through ten in ascending order.

3. Scrolling involved scrolling through a list, requiring the user to direct a beam of light from their palm, grab elements by pinching their pointer finger and thumb together, and scroll up or down by moving their hand vertically. During this task, the user selected a certain word from a menu.
4. Moving involved moving an object from one location to another. The user performed this by pinching their pointer finger and thumb togeth er, moving their hand horizontally, and then releasing their fingers.
Next, the participant’s AR interaction data was run through our machine learning algorithm to deter mine whether adaptation (extra practice) was need ed. Only poking and raycasting were considered for
adaptation as raycasting was a prerequisite to perform scrolling and moving. If the machine learning algo rithm deemed extra practice was needed for poking and/or raycasting, the participant would undergo addi tional training by completing three more trials for the task(s).
Lastly, the evaluation phase gauged the participant’s success at learning the AR tasks by repeating all four tasks again for three trials each.
Adaptation Model
We analyzed two metrics from twenty-seven participants from our prior study as measures of perfor mance and consistency, respectively: 1) total median time6 and 2) root mean square error (RMSE), a measure of distance from a prediction.7 Total median time was calculated by taking the median of the overall time required for each trial and adding all the median values. RMSE was calculated by fitting a 2-degree polyno mial over the learning curve comprising performance and number of trials, as seen in Figure 3. We used k-means clustering with two clusters of high and low performers, as portrayed in Figure 4. Low performers were designated as those who had a higher median time and RMSE. New participant data points were exclud ed from the original dataset to prevent changes in the cluster centroid coordinates. The new participant data was compared to these high and low performer centroid coordinates to determine if adaptation was needed.
2.
37
Figure
Video of the four augmented reality tasks: poking, raycasting, scrolling, and moving.
Scan the QR code to watch the Figure 2 video, or visit https://tx.ag/509Fig2.
Figure 3. Plot of median time and trials for RMSE of a skill.
affected by the interactivity and complexity of tasks. For these reasons, intrinsic and extra neous loads are useful metrics in this study.9 To assess the cognitive loads of participants, a standard CLT questionnaire was administered after each task. Each measure of CLT is on a one to seven scale, where seven represents a high cognitive load. An additional question asked each participant if they believed they needed more practice to obtain each new skill.
Physiological Measures
Figure 4. Plot of performance vs. consistency of a skill.


Measurements
Subjective Measures
According to Cognitive Load Theory (CLT), an individual’s performance is limited by the capacity of their working memory. CLT subdivides different loads into three categories: intrinsic, germane, and extraneous. Intrinsic is associated with the specific task, germane refers to the construction of long-term mem ories, and extrinsic is based on how the task is present ed.8 Germane cognitive load is independent of materi als presented, but intrinsic and extraneous are directly
Electrocardiogram (ECG) and electrodermal activity (EDA) physiological parameters were measured as part of quantify ing cognitive load. Research has shown ECG signals to be an important cognitive load indi cator by analyzing heart rate (HR)10 and heart rate variability (HRV).11 A higher cognitive load causes the heart to beat faster.12 HRV is a quantitative marker for autonomic nervous system activity by describing the fluctua tion in time between consecutive heartbeats. Two HRV features are commonly extracted to detect variations in cognitive load. The root mean square of successive differences (RMSSD) reflects the beat-to-beat variance in HR, and a higher cognitive load results in a lower difference.13 The low-to-high frequency ratio (LF/HF) is calculated using LF and HF measures which reflect stress and recovery, respectively, and a higher cognitive load results in a higher ratio.14
EDA, the measure of skin electrical conduc tance or sweat gland activity, has also commonly been used as a method for determining cognitive load.15 EDA is divided into two phenomena: 1) a tonic com ponent defined as electrodermal level which represents slow-changing, general characteristics of the signal and 2) a phasic component defined as electrodermal response which represents faster-changing elements, including responses from specific stimuli.16 Due to the nature of the signal, the sampling rate and duration of data collection are vital to consider during experimen tal design; however, both served as limitations during
38
analysis.
Statistical Analysis
Analysis of Variance (ANOVA) is a tool used in statistics to determine if experimental results are sig nificantly different from a control or between groups. The probability value (p-value) represents the proba bility of the occurrence of a value at least as extreme assuming that there is no real difference. The lower the p-value, the more significant a result is. Thus, a series of two-way ANOVA tests were performed to determine the impact of the study phases and need for adaptation on the subjective, physiological, and performance mea sures. The criteria used to find the statistical main effect of the dependent variable on the independent variable was a p-value < 0.05.
RESULTS
Only poking and raycasting were analyzed since these were the only tasks considered for adapta tion. Physiological data was normalized to the partici pant’s baseline data to rule out individual differences. To evaluate the effectiveness of the adaptation model, participants were divided into two groups: low per formers who needed adaptation (n = 7) and high performers who did not need adaptation (n = 5). Analysis was also performed across the phases of familiarization and evaluation.


Subjective Measures
For poking, no significant differences were
found between groups or phases in either extraneous or intrinsic loads. For raycasting, there was no significant difference found between groups in intrinsic or extrane ous load. However, intrinsic load showed a significant difference between phases (p = 0.047) and extraneous load showed a significant difference between the two phases (p = 0.016). In other words, lower cognitive loads were reported between familiarization and evalu ation for the raycasting task.
Furthermore, although extra training for each participant was determined by clustering with high and low performers, each participant was asked if they believed they needed more training to acquire the skill. From the survey, 70% of participants agreed with the model, 20% believed that they had acquired it, but the model determined that they needed more practice, and the remaining 10% answered they needed more prac tice, but the model determined they did not.
Physiological Responses
For poking, we found a statistically significant difference in HR by both the phase (p < 0.001) and group (p < 0.001), though the interaction between these terms was not significant. There were no statistically significant differences in RMSSD or LF/HF by either phase, group, or interaction between these terms; how ever, there was a trend toward significance in RMSSD by phase (p = 0.085).
For raycasting, there were no statistically significant differences in HR, RMSSD, or LF/HF by either phase, group, or interaction between these terms;
39
Figure 5. Box plots for (a) intrinsic load and (b) extrinsic load across tasks, phases, and groups.
Figure 6. Normalized ECG for (a) poking and (b) raycasting tasks.
however, there was a borderline of significance in HR by group (p = 0.059).
While pre-processing the EDA data, initial analysis revealed that the quality of the obtained data was not adequate to determine viable results. For future studies, it should be noted that the sampling rate should be increased due to the temporal sensitivity of the data, and the length of recording time should be increased to obtain enough relevant data due to the slow measure nature of the signal.
Performance
For both poking and raycasting, we found a statistically significant difference in median time by both the phase (p = 0.029; p = 0.008) and group (p = 0.001; p < 0.001), though the interaction between these terms was not significant.
When comparing median time from familiar ization to evaluation, the low performers who required adaptation on poking and/or raycasting were on aver age 17.8% and 37% quicker, respectively. However,
the high performers who did not receive extra practice on poking or raycasting were on average 10.2% and 16.21% quicker, respectively.
DISCUSSION
This study evaluated a machine learning algorithm method to personalize AR training and studied differences between high and low performers. Preliminary results show that intrinsic and extraneous loads are mainly unaffected by a participant’s perfor mance categorization. The only significant difference in subjective cognitive load was in the adaptation group having a decreased load, both intrinsic and extraneous, in the raycasting task. This may mean that the adapta tion protocol is able to reduce cognitive load in certain tasks, but not others. Furthermore, the protocol iden tified 30% of cases where an individual’s subjective judgment did not match the recommendation of the model. If the choice for further training was left up to the participants, 20% would be under-trained on the system and 10% would spend longer than necessary on

40
Figure 7. Performance for (a) poking and (b) raycasting tasks. their training.
The ECG data suggests that low performers consistently sustained a higher cognitive load com pared to high performers. For poking, participants who needed adaptation experienced a higher cognitive load compared to participants who did not need adaptation as seen from the significantly higher HR. This may be a consequence of fatigue from extra practice or the fact that the non-adaptation group consisted of high per formers, as deemed by the machine learning algorithm. The raycasting task revealed unexpected results when analyzed by phases. The adaptation group generally ex perienced an increase in cognitive load between phases as seen from the trending increase in HR and increase in LF/HF.

The overall performance indicates that the ad aptation model was effective at personalizing training. Looking at familiarization, performance showed that the machine learning algorithm successfully predicted whether a user was a high or low performer. Further more, low performers improved their median time more than high performers after undergoing additional training, suggesting the extra practice protocol was productive.
One limitation of this study was the small sample size. Statistical power is limited with small
sample sizes, so unsurprisingly many of the tests failed to show significance due to a high stan dard deviation. Another limitation was the extremely short time duration for the AR tasks due to the reduced number of trials. The reduced number of trials was done to minimize fatigue and optimize performance, but a consequence is that the physiological data may not be reliable to analyze as they are slow changing measures.
The next steps should be to solidify our findings by con ducting more studies, increasing the sampling rate, and analyzing other types of physiological data that also analyze cognitive load for a more multimodal approach. One example of this includes utilizing func tional near-infrared spectroscopy (fNIRS) to map brain activity through light reflectance by oxygenated and de oxygenated hemoglobin. This analysis would showcase which areas of the brain are most active during certain AR training activities, allowing for another approach in quantifying cognitive load.
These findings will be important in the devel opment of future adaptive training programs that will hinge on these foundational AR interactions. If our analysis can discern that user-tailored AR training is effective at reducing cognitive load and maximizing
41
THE ECG DATA SUGGESTS THAT LOW PERFORMERS CONSISTENTLY SUSTAINED A HIGHER COGNITIVE LOAD COMPARED TO HIGH PERFORMERS.
performance, future AR training platforms could prove to decrease costs and increase productivity for emer gency response training. With an improved method of training based in AR, the field of emergency medicine may be better able to curb the shortage of workers and better address the limitations of current training. In the end, this may mean a safer and more productive EMS workforce.
ACKNOWLEDGEMENTS
We would like to thank our professor Dr. Ran jana Mehta, our lab manager Lindsey Brenner, and our graduate student mentors John Hayes and John Kang for their guidance and mentorship. We would also like to thank the other members in the NeuroErgonom ics Lab for the supportive community. The machine learning algorithm was developed by Shivangi Dwivedi and Shantanu Vyas from the NeuroErgonomics Lab. The AR interface application was developed by Dr. Joe Gabbard, Cassidy Nelson, and Kyle Tanous from Virginia Tech University. This study was part of the LEARNER project funded by the National Science Foundation (#2033592) and approved by the Institu tional Review Board (IRB2021-0742DCR).
REFERENCES
1. “National EMS assessment describes current state of EMS in the United States,” ems.gov, 2021, https://www. ems.gov/newsletter/fall2020/national_ems_as sessment_describes_current_state_of_ems_in_ the_united_states.html
2. “AAA/Avesta 2019 Ambulance Industry Employee Turnover Study,” Avesta Systems, Inc. and the American Ambulance Association, July 2019, https://ambulance.org/wp-content/ uploads/2019/07/AAA-Avesta-2019-EMS-Em ployee-Turnover-Study-Final.pdf.
3. Alaa A. Amiry and Brian J. Maguire, “Emer gency Medical Services (EMS) Calls During COVID-19: Early Lessons Learned for Systems Planning (A Narrative Review),”
Dovepress Open Access Emergency Medicine 13, (September 2021): 407–14. http://doi. org/10.2147/OAEM.S324568
4. Jennifer Herron, “Augmented Reality in Medical Education and Training,” Journal of Electronic Resources in Medical Libraries 13, no. 2 (May 2016): 51–55. https://doi.org/10.10 80/15424065.2016.1175987
5. E. Z. Barsom, M. Graafland, and M. P. Schi jven, “Systematic review on the effectiveness of augmented reality applications in medical training,” Surgical Endoscopy 30, (Febru ary 2016): 4174–83. https://doi.org/10.1007/ s00464-016-4800-6.
6. Katherine J. Sullivan, Shailesh S. Kantak, and Patricia A. Burtner, “Motor Learning in Children: Feedback Effects on Skill Acquisi tion,” Physical Therapy 88, no. 6 (June 2008): 720–32. https://doi.org/10.2522/PTJ.20070196.
7. Jiejie Zhao, Bowen Du, Leilei Sun, Fuzhen Zhuang, Weifeng Lv, and Hui Xiong, “Multi ple relational attention network for multi-task learning,” Proceedings of the ACM SIGKDD International Conference on Knowledge Dis covery and Data Mining, (July 2019): 1123–31. https://doi.org/10.1145/3292500.3330861
8. Paul A. Kirschner, “Cognitive Load Theory: Implications of Cognitive Load Theory on the Design of Learning,” Learning and Instruction 12, no. 1 (2002): 1–10. https://doi.org/10.1016/ s0959-4752(01)00014-7
9. John Sweller, “Element Interactivity and Intrinsic, Extraneous, and Germane Cognitive Load,” Educational Psychology Review 22, no. 2 (2010): 123–38. https://doi.org/10.1007/ s10648-010-9128-5.
10. Burcu Cinaz, Roberto La Marca, Bert Arnrich, and Gerhard Tröster, “Monitoring of mental workload levels,” International Association for Development of the Information Soc. Proceed ings of the IADIS International Conference on e-Health, (University of Zurich, 2010), 189–
42
93. https://doi.org/10.5167/uzh-66793
11. Ashley M. Hughes, Gabriella M. Hancock, Shannon L. Marlow, Kimberly Stowers, and Eduardo Salas, “Cardiac Measures of Cognitive Workload: A Meta-Analysis,” Human Factors: The Journal of Human Factors and Ergonom ics Society 60, no. 3, (March 2019): 393–414. https://doi.org/10.1177/0018720819830553
12. Kristen N. Cranford, Jessica M. Tiettmeyer, Bryan C. Chuprinko, Sophia Jordan, and Na thaniel P. Grove, “Measuring Load on Working Memory: The Use of Heart Rate as a Means of Measuring Chemistry Students’ Cognitive Load,” Journal of Chemical Education 91, no. 5 (April 2014): 641–7. https://doi.org/10.1021/ ed400576n.
13. Xiaoli Fan, Chaoyi Zhao, Xin Zhang, Hong Luo, and Wei Zhang, “Assessment of mental workload based on multi-physiological sig nals,” Technol Health Care 28, no. 1 (2020): 67–80. http://doi.org/10.3233/THC-209008.
14. Fan et al., “Assessment of mental workload,” 67–80.
15. William L. Romine, Noah L. Schroeder, Jose phine Graft, Fan Yang, Reza Sadeghi, Mahdieh Zabihimayvan, Dipesh Kadariya, and Tanvi Banerjee, “Using Machine Learning to Train a Wearable Device for Measuring Students’ Cognitive Load during Problem-Solving Activities Based on Electrodermal Activity, Body Temperature, and Heart Rate: Develop ment of a Cognitive Load Tracker for Both Personal and Classroom Use.” Sensors (Basel) 20, no. 17 (September 2020): 4833. http://doi. org/10.3390/s20174833.
16. Braithwaite, Jason J., Derrick G. Watson, Robert Jones, and Mickey Rowe. “A guide for analysing electrodermal activity (EDA) & skin conductance responses (SCRs) for psycholog ical experiments.” Psychophysiology 49, no. 1 (2013): 1017-34.
43
ISABELLA C. PEDRON ‘23
Isabella Christina Pedron ‘23 is a chemical engineering major from Plano, Texas. Isabella has been a leader for the Texas A&M Emergency Care Team since Fall 2020 where she has gained extensive knowledge regarding emergency medicine. This inspired her involvement with LEARNER as she could envision the potential this project had to offer. Following graduation, Isabella aspires to become a physicianeer by pursuing an M.D. and M.S. in engineering.


CONNOR M. BARNES ‘23
Connor Barnes '23 is an interdisciplinary engineering major with minors in math and the design and simulation of mechanical systems. Connor is from Dripping Springs, Texas and went to Lake Travis High School. Through research, Connor aims to advance the use of interactive technology in learning environments. After college, Connor plans to work on the utilization and improvement of rapid prototyping for manufacturing.
ASHLEY E. BAILLY ‘23
Ashley Bailly '23 is a biomedical engineering major from Houston, Texas. Ashley has been with the NeuroErgonomics research lab for two semesters as a member of the LEARNER team. She is in the Brown Engineering Honors program with plans to write an undergraduate thesis for LAUNCH. Following graduation, Ashley plans to pursue a M.S. in biomedical engineering and later join industry working in research and development.
44
Development of a Computational Method to Analyze Mitochondrial Calcium Signals in Astrocytes
 By Maray V. Valle ’22
45
Photo by Milad Fakurian on Unsplash.
INTRODUCTION
Astrocytes are the most abundant non-neuronal cells in the brain. Morphologically, they are composed of a cell body with thick and thin processes protruding into their astrocytic ter ritories. Through their processes, astrocytes form connections that allow them to communicate with and regulate the functions of neurons. Until recently, astrocytes were thought to merely serve as supporting cells. However, research shows that astrocytes serve important roles in energy storage and synapse modulation, among other functions.1
Unlike neurons, astrocytes do not propagate electrical impulses called action potentials. Instead, as trocytic communication occurs through calcium (Ca2+) signals which travel to neighboring astrocytes and neu rons via gap junctions, allowing ion transfer between cells.2 Some of these Ca2+ events are almost as rapid as the firing rate of some neurons, which indicates that astrocytes sense and respond to a diverse range of neu ronal signals.3 Studying calcium signals is therefore of utmost importance to analyze astrocytic behavior and function, as well as to comprehend the effect astrocytes have on neurons.
Among the diverse calcium signaling events, mitochondrial Ca2+ signals account for a significant proportion of the total number of Ca2+ signals in as trocytes. Our work shows that astrocytic mitochondria have spontaneous Ca2+ influxes that may influence critical aspects of neuronal function. A 2018 study found that mitochondria encountered in the processes of astrocytes contribute to the local Ca2+ signaling and likely play a role in local ATP production and metabo lism.4 The influx and efflux of Ca2+ from mitochondria is crucial for processes like cellular necrosis and trig gering neuronal firing. Mitochondrial dysfunction has been identified as a common central pathway leading to sporadic and genetic Parkinson’s Disease, as well as to an increase of neuronal death and a reduction of astro cytic generation.5,6 Hence, healthy mitochondria play a vital role in the overall function of astrocytes regarding successful astrocyte-astrocyte and neuron-astrocyte communication.
MITOCHONDRIAL DYSFUNCTION HAS
BEEN IDENTIFIED AS A COMMON CENTRAL PATHWAY LEADING TO SPORADIC AND GENETIC PARKINSON’S DISEASE
As crucial as the study of these mitochondri al Ca2+ signals are, their analysis is extremely time consuming and inefficient. Current programs that enable semi-automated analysis are functional only for certain parts of the data processing.7 These programs focus on neuronal firing patterns, which tend to be less sporadic and more rhythmic. To solve this problem, we generated Measurement of Astrocytic Related Signals (M.A.R.S.), a MATLAB based computational pro gram that automates the process of baseline correction, event detection, calculation of duration, amplitude, and frequency of each astrocytic calcium signaling event. This program allows us to look at the kinetics, location, influx, and efflux of Ca2+ in astrocytic mitochondria. Further generation of a spatiotemporal map will allow for identification of a relationship of the location and timing of Ca2+ signals. Automatization of this analysis will impact the way we study and understand astro cytes, their functions, and the role they play in the overall brain’s health.
METHODS
Data for analysis was previously generated using the mouse strain C57BL/6 WT, as described by Huntington and Srinivasan.8 Eight-week-old female and male mice were housed on a 12-hour light/dark schedule and given free access to food and water. Mice were injected with an adeno associated virus 2/5 GfaABC1D-mito7-GCaMP6f to tag the areas express ing calcium, and Ca2+ imaged three weeks later. All experimental procedures with mice were conducted in accordance with Texas A&M University IACUC guidelines.
46
An Olympus FV1200 upright laser-scanning confocal microscope with 40x water immersion objec tive lens, a numerical aperture (NA) of 0.8, 488 nm, and 633 nm laser lines was used for slice imaging. For visualization of GCaMP6f fluorescence, the 488 nm line intensity was set at 10% maximum output, and for visualization of MitoTracker Deep Red, the 633 nm laser line intensity was set at 1-5% maximum. Other parameters, including high voltage, gain, offset, laser power, and aperture diameter, were maintained for all GCaMP6f imaging and optimized for MTDR during each session. Videos of Ca2+ events were acquired at either 800 msec/frame or 1 frame/sec (FPS).
The GECIQuant program acts as an extension of the image processor, ImageJ. 9 GECIQuant allows the user to detect regions of interest (ROIs) that con tain fluorescence based Ca2+ signals.10 The program subjects each stack of images to three modules. The first module is responsible for background subtraction to improve background noise. The second module sets up a threshold by identifying the maximum intensity image using already established methods in ImageJ The third is responsible for measuring signal intensity, area, and spatial criteria of each ROI. Once the stack of images is imported into the program, the user has the option of selecting the area within the stack that represents background noise. GECIQuant then propa gates the area of the demarcated section and averages the pixel intensity which is subtracted from the total number of pixels in the frame. The resulting image with the corrected background is ready for the next step, ROI detection.
ROI detection compresses the stack of images into a maximum intensity z-projection image. Using existing features in ImageJ, useful signal intensities were extracted from the background and classified as objects. An area criterion was applied to the image to determine the relevant Ca2+ signals that met the criteria and to trace their borders. The selected signals were then subjected to further analysis.
The final step of analysis was the ROI fea ture extraction. First, the Ca2+ signal intensities were calculated for each frame and added to the result section of the program. Then the area of each ROI
was calculated by a summation of the pixels times the pixel calibrations. The centroid distance was calculated as the average of the pixel coordinates. The data was then exported and ready for any further evaluation by MiniAnalysis.
MiniAnalysis identifies peaks of any type and size with a detection algorithm. The data acquired through GECIQuant was imported into the MiniAnal ysis software which generates graphs of each ROI with a corrected baseline. The user then manually selected peaks that were considered events, those two standard deviations higher than the baseline, within each graph. After peak selection was completed, the program then calculated amplitude, frequency, and duration of each event and exported the data to an excel spreadsheet, where the data was divided into spontaneous and drug-induced calcium signals.
Once astrocyte images with GCaMP6f fluores cence were processed with MiniAnalysis, data of the GCaMP6f intensity (a.u.) across each ROI were export ed to an excel spreadsheet. Each column of the spread sheet represents one ROI, and each row represents the frame number. We input the spreadsheet into M.A.R.S which, as illustrated in Figure 1, processes the data by ROIs and generates a graph for each column. The x-ax is of the graph shows the frame number, and the y-axis represents the GCaMP6f intensity of each ROI. Due to the randomness of astrocytic signaling, as well as drift while imaging, some of the graphs require baseline correction.
The frame corresponding to the minimum value of each ROI was identified and set apart with the next 10 frames in the column as a new array, or collec tion of values. This array was then subtracted from the original baseline to form a new baseline, denominated Baselinei. The mean of Baselinei was calculated, and the resulting value was used to calculate the final base line (Baselinef), as shown in Equations 1 and 2.
After the Baselinef calculation, a window dis plays the original graph and a graph with the corrected baseline plotted side by side (Figure 1A). A semi-auto mated checkpoint allows the user to determine whether another baseline correction iteration is needed. If so,
47
Figure 1. M.A.R.S. features. Panels in the figure above illustrate M.A.R.S. compo nents. (A) The automated generation of dF/F graphs and user-approved baseline corrected graph. (B) The process of calci um event detection on the approved dF/F graph. (C) The automated calculation of determined kinetic measurements, ampli tude, frequency, and duration. (D) Shows the spatiotemporal and heat map genera tion of activity within an astrocyte.


48
the process is repeated with the next minimum value in the pool of frames.
After baseline correction approval, the code then proceeded to classify calcium events (Figure 1B). We set the parameters for events as those peaks that had two times higher standard deviation than those peaks set as a threshold. Following event detection, we processed the data for the final step in the analysis, frequency, amplitude, and duration calculation (Figure 1C). Amplitude was defined as the maximum extent of a Ca2+ event, measured from the baseline. Frequency refers to the rate at which the Ca2+ events were repeated over the frame period. Finally, duration refers to the ex tent of time each Ca2+ event took to reach completion.
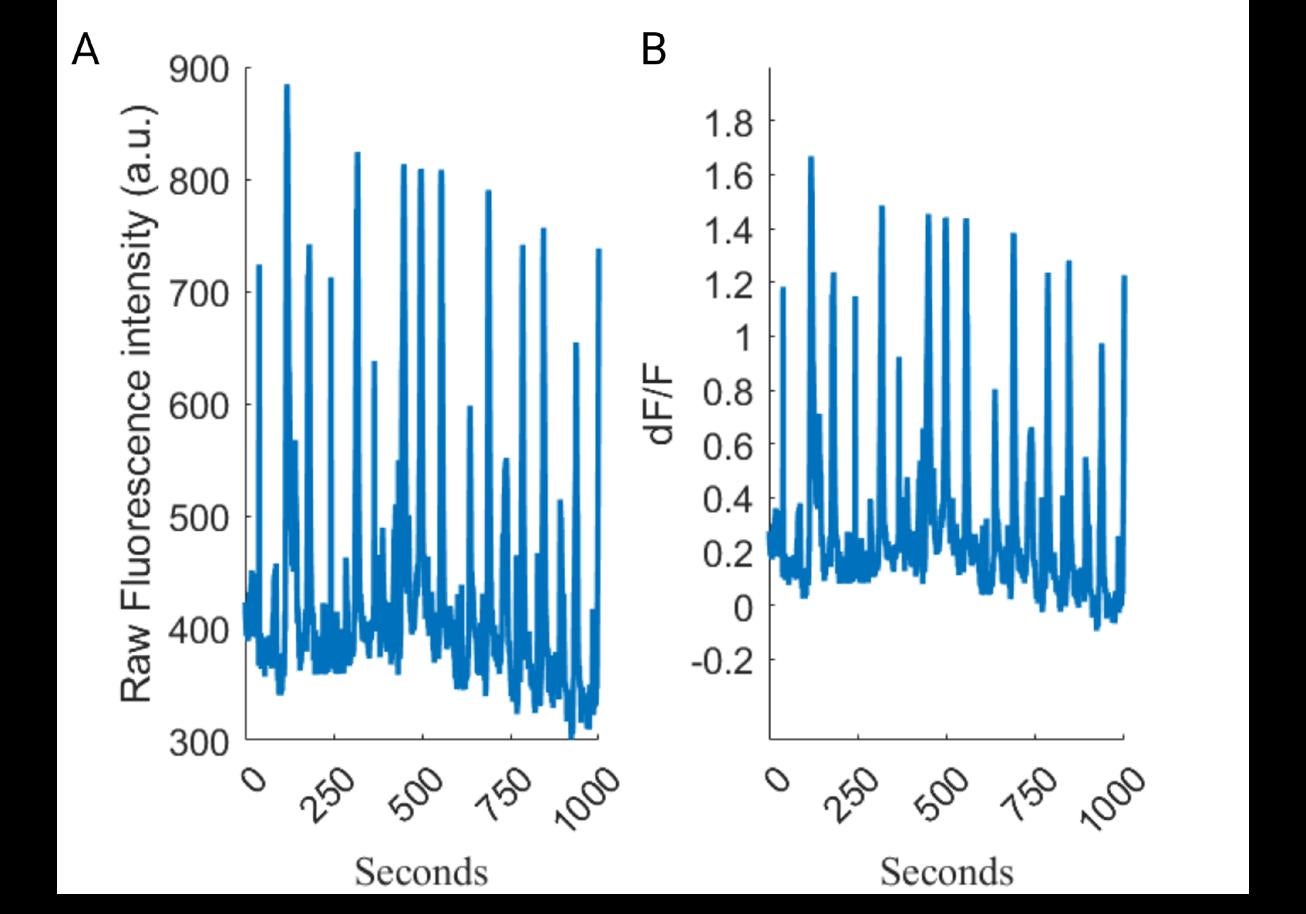
To quantify amplitude, frequency, and duration using MATLAB., version R2021a (Massachusetts: The MathWorks Inc.), we utilized three functions that are available as part of the MATLAB package. Those functions are findpeaks, MinPeakProminence, and half height. Data obtained using these func tions was then saved as spreadsheets compatible with Microsoft Excel.
RESULTS
Measurement of amplitude of calcium signals is dependent on accurate measurement of baseline fluorescence. M.A.R.S. makes baseline correction a manual checkpoint where the original graph and a baseline-cor rected dF/F graph are displayed side by side and the user is prompted to select whether another iteration of baseline correction is necessary or not, as shown in Figure 3. If an additional iteration is needed, the code proceeds to take the next minimum value en
Equation
countered in the original data and employ Equations 1 and 2 to calculate a new baseline and display the new graph next to the first dF/F graph, as illustrated in Fig ure 2. Once the baseline is user-approved, the program classifies events and obtains their corresponding kinetic measurements, amplitude, duration, and frequency.
Introducing this manual checkpoint allowed for more accurate detection of events since with each iteration a new minimum value was chosen and a new threshold was set. We observed a difference of +/- 10 events with different iterations of baseline-corrections from the same graphs. This makes the M.A.R.S. a more sensitive method for event detection.
Measurement of Spontaneous Calcium Dynamics using M.A.R.S.
The measurement of calcium dynamics in vivo and in astrocytes is an important way to understand cal cium biology. We first sought to determine if M.A.R.S.
Figure 2. Baseline correction. (A) Graph A illustrates the original raw data from the spreadsheet. (B) Graph B plots the dF/F graph with a corrected baseline calculated with Equations 1 and 2 described in the Methods section.
49 ������������������������������������������������������������������������ = ������������������������������������������������������������������������ �������������������������������������������������������������������������������� ��������������������������������������������������������������������������������
������������������������������������������������������������������������ = ������������������������������������������������������������������������ ������������������������������������������������
2 Equation 1
Figure 3. Manual checkpoint window. Message depict ed in the picture allows the user to determine whether another baseline correction iteration is needed. The numerical value provided represents the frame number at which minimum value used for baseline-calculation is encountered in the original data.

provides reliable measurements of amplitude, fre quency, and duration of Ca2+ signals. To determine the validity of calcium signals analysis obtained from our M.A.R.S, we compared it with data previously obtained using MiniAnalysis. For the first parameter of com parison, we looked at spontaneous peaks, which were classified as those events that would occur before the 300 frames. Figure 4 illustrates the kinetic measure ments of two astrocytes obtained with both M.A.R.S. and MiniAnalysis. When the average values for am
plitude, duration, and frequencies were compared between MiniAnalysis and M.A.R.S., we observed a small variation of +/- 0.03 units. This suggests that M.A.R.S. is comparable to measurements obtained through MiniAnalysis.
Several drugs have been used in research to emulate the function of neurotransmitters in astrocytic calcium signal modulation.11 Drugs can alter calcium biology in different ways by modifying frequency, amplitude, and duration in different regions of the brain. Mitochondrial calcium signals in striatal as trocytes exposed to three different drugs, glutamate, quinpirole, and SKF, were measured with M.A.R.S.
Despite the large changes in amplitude, dura tion, and frequency of induced activity by drugs in as trocyte calcium, the extent of these changes was main tained from MiniAnalysis and M.A.R.S. As illustrated in Figure 5, there is a small variation of +/- 0.05 units between values obtained through manual and automat ed analysis. Combined, the effectiveness of analysis of the kinetics of both spontaneous and drug-induced events makes this custom-made MATLAB-based code an important and innovative anal ysis tool for the study of astrocytic calcium signaling. Furthermore, an important and original feature is the generation of spatiotemporal maps to detect any patterns of both intensity and location of calcium events.
MiniAnalysis M.A.R.S. Amplitude Duration Frequency Amplitude Duration Frequency Cell 1 n=8
Soma 0.19 2.43 2.75 0.19 2.66 2.10
Semi-automated Gener ation of Spatiotemporal Maps using M.A.R.S
Soma 0.49 3.32 2.50 0.48 3.58 2.30
Large Territory 0.06 3.32 1.50 0.07 3.26 1.90
Small Territory 0.23 1.88 2.25 0.24 1.80 2.35
Large Territory 0.11 2.49 1.75 0.12 2.30 1.27 Small Territory 0.36 2.28 3.25 0.31 2.66 3.90 Cell 2 n=4
Figure 4. The data represents average values of each of the kinetic pa rameters, amplitude, duration, and frequency, for two astrocytes. When analyzing the data, we can observe an average of a +/- 0.03 units difference between the manual analysis through MiniAnalysis and automated analysis through M.A.R.S. The n value next to the cell number is the number of ROIs in that astrocyte.
The shape and surround ing of each individual astrocyte help determine its function. In some brain regions, astrocytes are surrounded by dendrites and not neuronal cell bodies, while in others they are surrounded by neuronal cell bodies. Due to this, the function of astrocytes may vary. At the same time, within one
50
Cell 1 n = 26
MiniAnalysis M.A.R.S.
Amplitude Duration Frequency Amplitude Duration Frequency
Soma 1.11 4.34 1.93 1.11 4.32 1.93
Large Territory 0.67 3.29 1.60 0.65 3.29 1.60
Small Territory 0.73 3.75 1.50 0.71 3.77 1.58
Soma 0.30 2.56 2.14 0.30 2.56 2.14
Large Territory 0.23 2.29 0.53 0.22 2.29 0.54
Cell 2 n=9
Small Territory 0.33 1.75 0.75 0.33 1.76 0.76
Figure 5. Amplitude, duration, and frequency measurements of two different astrocytes obtained with MiniAnalysis and M.A.R.S.. Cell 1 had an n = 26 meaning that 26 ROIs were detected for that astrocyte and Glutamate was used to induce activity. Cell 2 had a n of 9, meaning there were a total of nine ROIs in that astrocyte and the Quinpirole was used to induce activity.
astrocyte one may also observe differences in different locations throughout the morphology of the astrocyte. To assess the dif ferences in function, we asked if M.A.R.S. could also generate spatiotemporal maps of where these calcium signals are in astrocytes. Because of the exquisite relation ship of astrocytic synapses with neighboring neuron synapses, the spatial location of these astrocytic mitochondria likely plays a role in synaptic modulation. To detect any potential firing patterns within different regions of an astrocyte, we implemented the generation of spatiotemporal maps that compare signaling intensity. These maps plot ROIs side by side, display increasing brightness by a change in color, and location of that change in brightness by correlating it to the frame number where it occurs.
Figure 6. Automated generation of spatiotemporal maps with M.A.R.S. After kinetic measurements, M.A.R.S. takes all the ROIs of the astrocyte being analyzed and generates a heat map (Figure 6A), that illustrates the increasing fluorescence intensity as the color changes from blue to red. Figure 6B shows the spatiotemporal representation of the heat map.

51
Figure 6A illustrates M.A.R.S. automated generation of heat maps, and the localization of the color-coded increasing intensities on the morphology of the astrocyte on Figure 6B. The tallest peaks plotted on the baseline corrected dF/F of each ROI of the astro cyte from which the map was generated, correspond to those red areas shown in Figure 6, both A and B. The correlation between the graphs and the maps further strengthens the claim that M.A.R.S. serves as an accu rate and reliable method for mitochondrial astrocytic calcium analysis.
CONCLUSION
Astrocyte calcium signals are thought to play important roles in behavior, as well as pathology of neurological diseases. Mitochondrial calcium signals in astrocytes have emerged as an important facet of the whole repertoire of calcium signals in astrocytes. Therefore, the accurate measurement of the kinetics of said calcium signals is of utmost importance.
Most existing programs for analysis of Ca2+ signals kinetics in astrocytes require manual interven tion and are therefore time-consuming and inefficient. In this study we developed and tested our MAT LAB-based program, M.A.R.S., that enables automated detection and analysis of astrocytic calcium signals. In addition, we described a semi-automated method in which M.A.R.S. can be used to develop spatiotemporal maps of spontaneous or drug induced mitochondrial calcium signals. Combined with the automated fea tures and the astrocytic spatiotemporal map generation, M.A.R.S. is an accurate, relevant, and complete method for analysis and will likely impact the way we study and understand astrocytic biology.
ACKNOWLEDGEMENTS
I would like to thank my faculty advisor, Dr. Rahul Srinivasan, and my graduate student mentor, Taylor Huntington, for their guidance and support throughout the course of this research. Thanks also go to Kushal Bakshi and Edith Valle for their guidance and help with the development of the MATLAB based code.
REFERENCES
1. Huntington, Taylor E., and Rahul Srinivasan. “Astrocytic Mitochondria in Adult Mouse Brain Slices Show Spontaneous Calcium Influx Events with Unique Properties.” Cell Cal cium 96 (June 1, 2021): 102383. https://doi. org/10.1016/j.ceca.2021.102383
2. Allen, Nicola J., and Cagla Eroglu. “Cell Biol ogy of Astrocyte-Synapse Interactions.” Neu ron 96, no. 3 (November 1, 2017): 697–708. https://doi.org/10.1016/j.neuron.2017.09.056
3. Kim, Yonghee, Jinhong Park, and Yoon Kyung Choi. “The Role of Astrocytes in the Central Nervous System Focused on BK Channel and Heme Oxygenase Metabolites: A Review.” An tioxidants 8, no. 5 (May 5, 2019): 121. https:// doi.org/10.3390/antiox8050121
4. Guerra-Gomes, Sónia, Nuno Sousa, Luísa Pin to, and João F. Oliveira. “Functional Roles of Astrocyte Calcium Elevations: From Synapses to Behavior.” Frontiers in Cellular Neurosci ence 11 (January 17, 2018): 427. https://doi. org/10.3389/fncel.2017.00427
5. Semyanov, Alexey. “Spatiotemporal Pattern of Calcium Activity in Astrocytic Network.” Cell Calcium 78 (March 1, 2019): 15–25. https:// doi.org/10.1016/j.ceca.2018.12.007
6. Jackson, Joshua G., and Michael B. Robinson. “Regulation of Mitochondrial Dynamics in As trocytes: Mechanisms, Consequences, and Un knowns.” Glia 66, no. 6 (June 2018): 1213–34. https://doi.org/10.1002/glia.23252
7. Bantle, Collin M., Warren D. Hirst, Andreas Weihofen, and Evgeny Shlevkov. “Mito chondrial Dysfunction in Astrocytes: A Role in Parkinson’s Disease?” Frontiers in Cell and Developmental Biology 8 (2021). https://www.frontiersin.org/article/10.3389/ fcell.2020.608026
8. Sofroniew, Michael V., and Harry V. Vinters. “Astrocytes: Biology and Pathology.” Acta
52
Neuropathologica 119, no. 1 (2010): 7–35. https://doi.org/10.1007/s00401-009-0619-8
9. “Fiji: An Open-Source Platform for Biologi cal-Image Analysis | Nature Methods.” Ac cessed May 9, 2022. https://www.nature.com/ articles/nmeth.2019.
10. Fiebig, Christian, Silke Keiner, Birgit Ebert, Iris Schäffner, Ravi Jagasia, D. Chichung Lie, and Ruth Beckervordersandforth. “Mitochon drial Dysfunction in Astrocytes Impairs the Generation of Reactive Astrocytes and Enhanc es Neuronal Cell Death in the Cortex Upon Photothrombotic Lesion.” Frontiers in Molec ular Neuroscience 12 (February 22, 2019): 40. https://doi.org/10.3389/fnmol.2019.00040
11. Perea, Gertrudis, and Alfonso Araque. “Proper ties of Synaptically Evoked Astrocyte Calcium Signal Reveal Synaptic Information Processing by Astrocytes.” Journal of Neuroscience 25, no. 9 (March 2, 2005): 2192–203. https://doi. org/10.1523/JNEUROSCI.3965-04.2005
MARAY V. VALLE ’22
Maray Valle ‘22 is a Neuroscience - Molecular and Cellular track major from Odessa, Texas. Maray attended Bryan High School and transferred to Texas A&M from Blinn College in 2020. Maray served as an Undergraduate Research Assistant at the Srinivasan Laboratory in the Neuroscience & Experimental Therapeutics department from 20192022. Following her introduction to the scientific research experience, Maray plans to pursue an M.D.-Ph.D. with a research focus in Neuroscience.

53
Prenatal Alcohol Exposure and Genetic Sex Impact Nfia Expression in the Developing Cortex
 By Aubrie Miller ‘22
54
Photo by Louis Reed on Unsplash.
INTRODUCTION
Prenatal alcohol exposure (PAE) can occur during pregnancy and result in fetal alcohol spectrum disorders (FASDs). PAE can cause physical abnormal ities, including alterations to facial structure, growth deficits, and neurodevelopmental deficits caused by abnormal brain growth and development.1,2 PAE is the leading non-genomic cause of learning disabilities.3 Alcohol exposure during pregnancy and PAE can cause lifelong stigma for both the birth mother and the af fected individual. This stigma contributes to additional hardships for individuals with FASDs including ag gravating behavioral differences, mental illnesses, and substance use disorders as well as increasing barriers to achieving independence and life goals.4 Women who consume alcohol during pregnancy are often labeled as bad mothers or child abusers, and therefore deserving of harsh judgment.5 The stigma around alcohol expo sure during pregnancy, combined with societal judg ment, can make women reluctant to disclose alcohol use during pregnancy to their healthcare provider.6
Common binge drinking behaviors among men and women of childbearing age and lack of family planning combined with stigma against alcohol expo sure during pregnancy means there is a low chance of eradicating PAE. Therefore, it is important to reduce harm both through social policies and by understanding the effects of PAE on brain development so that targets for intervention can be identified and the impact of PAE can be ameliorated.
Here, we investigated a potential mechanism of PAE’s impact on brain development. Previously,
we showed that PAE causes the premature maturation of neural stem cells (NSCs).7 In the developing brain, NSCs proliferate to make additional NSCs (self-renew al) and differentiate to produce the cellular complement of the brain. NSC differentiation occurs sequentially. First, neurogenesis produces neurons. Then, astroglio genesis produces astrocytes that maintain the chemical environment for neurons. Finally, oligodendrogenesis produces oligodendrocytes which create myelin around axons to provide electrical insulation. For astroglio genesis, increased expression of transcription factor Nuclear Factor-1 A (NFIA) is necessary and sufficient to induce astrocyte production.8 We hypothesized that PAE increases NFIA expression in NSCs, thereby inducing premature maturation through the premature activation of astrogliogenesis.
To determine if PAE results in premature activation of astrogliogenesis in NSCs, we examined if PAE increased the expression of Nfia mRNA during neurogenesis in the cerebral cortex using single-cell RNA sequencing (scRNAseq). scRNAseq allows analysis of transcriptional profiles within individual cells.9,10 We performed scRNAseq on two mouse mod els of cerebral cortical NSC development: 1) in cortical tissue on gestational day (GD) 14.5 following exposure to ethanol vapor or room air on GD 12.5; 2) in neu rosphere cultures grown from GD 12.5 mouse NSCs that were not exposed (naïve) to ethanol. Experiment 1 showed the impact of ethanol exposure on NSCs and their subsequent cycles of neurogenesis. Experiment 2 allowed us to compare the effects of ethanol from experiment 1 to isolated GD 12.5 NSCs grown as neu rosphere cultures. For both of these models, cells from male and female fetuses were included, allowing for the assessment of impact of genetic sex on Nfia expres sion. GD 12.5–14.5 is the time of cortical NSC prolif eration and the beginning of neurogenesis.11 We chose to use two different models to better grasp the impact of ethanol exposure over time and examined cells at the age of exposure as well as the cells that differentiated following exposure. Furthermore, comparing these models provides insight on how the heterogeneity of the developing cortex may modulate the impact of PAE on NSCs.
We found that both genetic sex and ethanol ex
55
IT IS IMPORTANT TO REDUCE HARM BOTH THROUGH SOCIAL POLICIES AND BY UNDERSTANDING THE EFFECTS OF PAE ON BRAIN DEVELOPMENT...
posure affect Nfia expression. In GD 14.5 cortical cells, Nfia expression was higher in female stem cells, but in GD 12.5 neurosphere cultures, male NSCs have higher Nfia expression, suggesting that male NSCs may have higher levels of Nfia before female NSCs. In addition, in the GD 14.5 developing cortex, PAE increased Nfia expression in stem cells and early developing neurons.
Targeted interventions to restore normal Nfia expression may slow premature maturation of NSCs

and reduce the detrimental changes to brain develop ment following PAE. But these interventions may need to be genetic sex-specific, which impacts the timeline of Nfia expression. These interventions may be one effective way to reduce the harm of PAE and improve long-term quality of life for individuals with FASDs.
Figure 1. Paradigm for sample collection. Cortical scRNAseq (experiment 1, top) used tissues from gestational day 14.5 (GD 14.5) fetuses following the exposure to ethanol or room air vapor on GD 12.5. Following microdissection of the dorsal neocortex, tissue was dissociated into single cells which was then further analyzed using the 10x Ge nomics platform. Neurosphere scRNAseq (experiment 2, bottom) used cortical tissues from GD 12.5 fetuses which underwent the same dissection; however, they were then propagated as neurosphere cultures then analyzed by scRNAseq. Created with biorender.com using a premium license made available through the Texas A&M Institute for Genome Sciences and Society.
56
METHODS
Cortical scRNAseq
For experiment 1, pregnant C57BL/6 mouse dams were exposed to vaporized 95% ethanol or room air on GD 12.5 (Fig ure 1). Ethanol exposure resulted in blood ethanol concentrations rang ing from 210–260 mg/ dL (equivalent to blood alcohol concentrations, or BACs, of 0.21–0.26%).
Two days following exposure, on GD 14.5, the fetuses were removed and underwent microdissec tions to obtain the dorsal neocortex. The collected tissues were then broken down into single cell suspensions by manual trituration and enzymatic disaggregation. Cells were collected by centrifugation, briefly fixed in methanol, and underwent scRNAseq using the 10x Genomics pipeline (Figure 2). Initial characterization of these data has been previously published.12
Figure 2. Exposure paradigm. In experiment 1, pregnant dams were exposed to either 95% ethanol or room air via a vapor chamber on GD 12.5. Subsequently, on GD 14.5, tissue from the exposed fetuses were then segregated by genetic sex. In ex periment 2, GD 12.5 NSCs were propagated as sex-segregated neurosphere cultures in mitogenic media. Created with biorender.com using a premium license made available through the Texas A&M Institute for Genome Sciences and Society.

iments, additional fetal tissue was taken to determine fetal sex. DNA was extracted from these tissues by alkaline lysis. This DNA suspension was then neu tralized, diluted, and underwent quantitative real-time polymerase chain reaction (qPCR) for repetitive se quences present on the X and Y chromosomes.
Neurosphere scRNAseq
In experiment 2, similar microdissections occurred as in experiment 1. However, dorsal neuroep ithelium was collected from GD 12.5 fetuses. Tissues were broken into single cell suspensions and propagat ed in vitro as neurosphere cultures in mitogenic media. These cells, following 5 days of growth in mitogenic media, were separated into single cell suspensions, briefly fixed with methanol, and underwent scRNAseq using the 10x Genomics pipeline. Initial characteriza tion of these data has been published.13
Segregation of Tissues by Genetic Sex
At the time of tissue collection for both exper
RESULTS
Data obtained from scRNAseq is complex and multi-dimensional. These data can be visualized in low-dimensional space by using the t-distributed Stochastic Neighbor Embedding (t-SNE) algorithm to construct t-SNE plots. In these plots, each data point represents a single cell, and cells are clustered by similarity and separated from dissimilar cells. For both the cortical scRNAseq (Figure 3A) and the neuro sphere scRNAseq (Figure 4A), a number of discrete cellular clusters were identified by the t-SNE algo rithm, although 33 clusters in total were identified for
57
Figure 3. T-SNE plots of experiment 1, cortical scRNAseq. A.) LEFT: color coded t-SNE plot of the 33 identified cell clusters in the cortex. MIDDLE: clusters of the VZ and VZ/SVZ regions. RIGHT: non-neural clusters. B. and C.) Nfia expression in cortices stratified by genetic sex, regardless of treatment (B) or exposure, re gardless of genetic sex (C). TOP: Nfia expression in all cells as indicated by color coding with log2 scale of expression in which higher expression is colored red while low rates of expression are colored yellow. BOTTOM: the bottom 10% of Nfia expression was excluded to show a clear picture of sex differences in num ber of cells with Nfia expression. B.) The green circle and arrow highlight cell populations with higher Nfia expression in female-derived cells while the black circle and arrow and brown arrow highlight cell populations with decreased Nfia expression in female-derived cells. The green region contains NSCs in an VZ cluster, black region contains neurons of lateral layer V/VI neurons, and the brown region contains neurons of rostral layer V/VI .VI. C.) The black circle and arrow highlights layer V/VI cells with greater Nfia expression in the alcohol group and the green circle and arrows highlight VZ cells with higher expression in the alcohol group.
the cortical scRNAseq and 10 were identified for the neurosphere cultures.

Cortical scRNAseq
In previous work,14 cellular clusters were iden tified based on gene expression to correspond to cellu lar populations in the developing cortex. Here we fo cused the regions of the developing cortex that contain NSCs: the ventricular zone (VZ), which contains the earliest, most multipotent neural stem cells and the sub
ventricular zone (SVZ), which contains another population of stem cells that divide more rapidly to expand the cortex (Figure 3A). In cell clusters that contained cells identified as belonging to the VZ, SVZ, or both (VZ/SVZ), we first compared Nfia expression by genetic sex (Figure 3B). We found in the central VZ cluster that female-derived cells have higher expression of Nfia than male-derived cells. We further examined the number of cells that have Nfia expression, excluding those cells in the bottom tenth percentile of ex pression. More female-derived cells express Nfia in this VZ cell cluster than male-derived cells. While examining the Nfia expression in the devel oping cortex, we noticed that sex difference in Nfia expres sion seen in NSCs was not similarly seen across all cell types in the GD 14.5 cortex. Contrastingly, clusters that correspond to early neurons (layers V/VI) have higher Nfia expression in male-derived cells compared to female-de rived cells. We then compared Nfia in the cortical cell cluster stratified by exposure (Figure 3C). In this comparison, we found that ethanol expo sure increased Nfia expression in the stem cells of the central VZ cluster and in the early layer V/VI neurons of layer V/VI. These data suggest that sex differences in Nfia expression in the developing cortex are celltype specific while ethanol may similarly regulate Nfia across cell types.
For the construction of t-SNE plots for the neurosphere scRNAseq, when the data from the male-
58
and female-derived neurospheres was combined, the cell clusters largely segregated by sex.15 Therefore, we constructed two independent t-SNE plots, one for each sex, and used gene expression data to determine closely related clusters across plots (Figure 4A).

Corresponding clusters are color-coded the same even though they may not be in the same lo cation. For the neurospheres, almost all clusters had markers for neural stem/progenitor cells with the exception of cluster 4, which had higher expression of differentiation lineage markers. We found that Nfia is expressed similarly across NSC populations in both male and female neurospheres. However, when we
examined individual cells, only a few female cells had considerable Nfia expression (>10th percentile of expression seen in both male and female neurospheres). A small group of cells expressed Nfia in female-derived neurospheres but this group had widespread expression in male-derived neurospheres. Other cell populations had almost no cells with Nfia expression in the females, while the males had widespread expression.
CONCLUSION
Here, we showed that neural stem cells in the developing cortex are not a homogenous population. Cortical scRNAseq defined 11 VZ cell clusters while the neurosphere scRNAseq had 10 clusters. We found sex-differences in the expression of Nfia in NSCs, with females showing higher expression at GD 14.5 in the cen tral VZ NSC cluster and males showing higher expression in the GD 12.5 NSC cultures. Ethanol generally increased Nfia expression, although this effect was NSC subpop ulation specific, as we did not see similar increases in expression across all the VZ/SVZ clusters. We found that Nfia expression level was wide spread in NSCs but also varied by NSC subpopulation. Sur prisingly, even in NSC clusters with
Figure 4. Experiment 2, neurosphere scRNAseq. A.) Both-SNE plots of cell clusters in male- and female-derived neurosphere clusters. Similar clusters were present in each plot with the exclusion of cluster 3 from the female plot. B.) Nfia expression in all cells as indi cated by color coding with log2 scale of expression in which higher expression is colored red while low rates of expression are colored yellow. C.) Cells expressing Nfia, with cells in the bottom 10% of Nfia expression excluded. Orange circles highlight cluster 10 which contained radial glia-like neural progenitors in S phase. Yellow circles highlight cluster 6 which contained the neuronal lineage marker-expressing progenitor cells.
59
TARGETED INTERVENTIONS
OF LIFE FOR INDIVIDUALS WITH FASDS
high Nfia expression, there was not a corresponding ex pression of astrocytic cell markers. These data indicate that Nfia is expressed in NSCs prior to astrogliogenesis and may define NSC subpopulations.
These data indicate that PAE can induce Nfia expression in NSCs and this increased expression may be targetable for intervention. However, any interven tion will likely need to be tailored to each genetic sex, as we found sex differences in the expression timeline of Nfia. By decreasing Nfia expression following PAE, we may encourage NSC self-renewal, reducing harm to the developing cortex caused by PAE. Targeted inter ventions to NSCs have the potential to improve neu rodevelopment, and therefore quality of life for indi viduals with FASDs. Further investigation is needed to discover the best methods of intervention of NSCs and other targets that could work alongside Nfia-targeted therapeutics to reduce harm following PAE and amelio rate more negative outcomes associated with FASDs.
ACKNOWLEDGEMENTS
Thank you to the laboratory of Dr. Rajesh Miranda for their guided support through this research and manuscript. Thank you to Dr. Nihal Salem, Dr. Alex Tseng, and Dr. Amanda Mahnke for the analysis done on the t-SNE plots. Thank you to family for their continued support throughout my journey as an under graduate researcher.
REFERENCES
1. Lebel, C., F. Roussotte, and E. R. Sowell. “Imaging the Impact of Prenatal Alcohol Exposure on the Structure of the Developing Human Brain.” Neuropsychol Rev 21, no. 2 (June 2011): 102–18. https://doi.org/10.1007/ s11065-011-9163-0 https://www.ncbi.nlm.nih. gov/pubmed/21369875
2. Blackburn, C., and T. Whitehurst. “Foetal Alcohol Spectrum Disorders (Fasd): Raising Awareness in Early Years Settings.” [In En glish]. British Journal of Special Education 37, no. 3 (September 2010): 122–9. https://doi. org/10.1111/j.1467-8578.2010.00471.x
3. Blackburn et al., “Foetal Alcohol,” 122–9
4. Corrigan, P. W., J. L. Lara, B. B. Shah, K. T. Mitchell, D. Simmes, and K. L. Jones. “The Public Stigma of Birth Mothers of Children with Fetal Alcohol Spectrum Disorders.” Alco hol Clin Exp Res 41, no. 6 (June 2017): 1166–73. https://doi.org/10.1111/acer.13381 https:// www.ncbi.nlm.nih.gov/pubmed/28370022
5. Roozen, Sylvia, Sarah E. Stutterheim, Arjan E. R. Bos, Gerjo Kok, and Leopold M. G. Curfs. “Understanding the Social Stigma of Fetal Alcohol Spectrum Disorders: From Theory to Interventions.” Foundations of Science (2020). https://doi.org/10.1007/s10699-020-09676-y
6. Roozen et al., “Understanding the Social,” 1166–73
7. Mahnke, Amanda H., Nihal A. Salem, Alex ander M. Tseng, Annette S. Fincher, Andrew Klopfer, and Rajesh C. Miranda. “Fetal Alco hol Spectrum Disorders: A Stem-Cellopathy?” Stem Cells in Birth Defects Research and De velopmental Toxicology (May 2018): 223–59. https://doi.org/10.1002/9781119283249.ch9
8. Deneen, B., R. Ho, A. Lukaszewicz, C. J. Hochstim, R. M. Gronostajski, and D. J. Anderson. “The Transcription Factor Nfia
60
TO NSCS HAVE THE POTENTIAL TO IMPROVE NEURODEVELOPMENT, AND THEREFORE QUALITY
Controls the Onset of Gliogenesis in the Devel oping Spinal Cord.” Neuron 52, no. 6 (Decem ber 2006): 953–68. https://doi.org/10.1016/j. neuron.2006.11.019
9. Tseng, A. M., D. D. Chung, M. R. Pinson, N. A. Salem, S. E. Eaves, and R. C. Miranda. “Ethanol Exposure Increases Mir-140 in Extra cellular Vesicles: Implications for Fetal Neu ral Stem Cell Proliferation and Maturation.” Alcohol Clin Exp Res 43, no. 7 (July 2019): 1414–26. https://doi.org/10.1111/acer.14066
10. Salem, N. A., A. H. Mahnke, K. Konganti, A. E. Hillhouse, and R. C. Miranda. “Cell-Type and Fetal Sex-Specific Targets of Prenatal Alcohol Exposure in Developing Mouse Cerebral Cortex.” [In English]. iScience 24, no. 5 (May 2021). https://doi.org/10.1016/j. isci.2021.102439
11. Miranda, R. C. “Micrornas and Fetal Brain De velopment: Implications for Ethanol Teratology During the Second Trimester Period of Neuro genesis.” Front Genet 3 (2012): 77. https://doi. org/10.3389/fgene.2012.00077
12. Salem et al., “Cell-Type.”
13. Tseng et al., “Ethanol Exposure,” 1414–26.
14. Salem et al., “Cell-Type.”
15. Tseng et al., “Ethanol Exposure,” 1414–26.
AUBRIE MILLER ‘22
Aubrie Miller ‘22 is a biochemistry and genetics major from Fort Worth, Texas. Aubrie is passionate about women’s health and prenatal care. She hopes to go to Medical School to pursue a career in meeting women’s needs.

61
Controversial Saints: A Study of How Popular Culture Can Radicalize Religious Icons
 By Alexandria Babineaux ‘22
62
INTRODUCTION
“Queer,” “lesbian,” and “gender nonconform ing” are not terms one often relates to the Catholic Saint Joan of Arc. Depictions of Joan of Arc in media have transformed dramatically over time, often being impacted by popular culture, and many modern inter pretations of her include themes of queer identities. As an artist and a member of the LGBT community, I became fascinated with the dichotomy between the identities of Joan of Arc and was inspired to create my own take on this “controversial” saint.
While intrigued by figures in the Bible and motifs in religious art, Christianity and Catholicism’s stance towards LGBT people like myself began to push me away from religion. However, I have never been able to shake my love of religious iconography. Through my studies, I discovered that the worlds of Christianity and the LGBT community often collide in the realm of art. This realization, along with my own personal history, led me to further study the intersec tionality between the LGBT community and the Chris tian and Catholic religions with an emphasis on depictions in digital media. This research has resulted in the creation of a piece of art centered on Joan of Arc and her controversial stance as both a saint and gay icon.
BACKGROUND
Born in 1412 during the Hundred Years War of France versus Britain, teenage Joan of Arc dressed as a man and fought for France under the guidance of God and the Archangel Michael.1 She was eventual ly captured by the British and burned at the stake for witchcraft and heresy at only 19 years old. In 1920, 500 years after her death, Joan of Arc was anointed as the patron saint of France and assumed the identity most know her by today.2
The subject of Joan of Arc’s identity has been a turbulent one, both during her life and after death. In modern times she is known not only as “The Maid of Orleans” and the patron saint of France, but also as a feminist symbol, a queer icon, and even as a charac ter in multiple massive media franchises. These many
faces of Joan of Arc are often contradictory, especially her stance as both a Catholic saint and a “queer icon.” However, her status as a “gay saint” and Catholic saint shows that there is a desire for representation of indi viduals who exist in the intersection of these communi ties.
My interest in the transformation of saints into gay icons was sparked in an art history class with Dr. Stoenescu of Texas A&M University’s Visualization department. One of the subjects was Saint Sebastian who, like Joan of Arc, was transformed from a Cath olic saint into a gay icon. Saint Sebastian’s transfor mation came about via influences of the Renaissance art world.3 Artists of the Renaissance were in pursuit of creating the perfect male nude as a showcase of their artistic skill. Saint Sebastian became the subject of these paintings, and as time went on, depictions of him became less religious and more erotic. During the height of the Renaissance, creating a painting of Saint Sebastian or owning paintings of him symbolized male homosexuality.4 For example, Leonardo Da Vinci, who was a very outspoken gay man, owned eight paintings of Saint Sebastian.
In modern times, people often assume that queer people did not exist in the past or were not open about their identities, but the opposite is true. There is a long history of using art as a means for queer people to express themselves that continues to this day.
Of the many who can be classified as a “gay saint,” Joan of Arc stood out to me most as I related to her struggles of being a woman persecuted for how she presents herself. I was also inspired by her steadfast dedication to her beliefs, even in the face of death.
63
I DISCOVERED THAT THE WORLDS OF CHRISTIANITY AND THE LGBT COMMUNITY OFTEN COLLIDE IN THE REALM OF ART.
Joan of Arc’s journey from peasant girl to na tionalist icon, then to queer icon and subject in modern media is lengthy and complicated. It can, however, be traced to three major events that sparked a shift in the perception of Joan of Arc in media.
The first shift is attributed to the Action Française movement, which was an anti-republican and pro-monarchist movement active in France during the early 1900s.5 Its members found themselves in a pro paganda war with the pro-republican movement. Their opponents had claimed many popular symbols such as The Marianne, a female personification of the French spirit. To compete with their rivals, Action Française made Joan of Arc the figurehead of their campaigns. During this period of po litical turmoil, Joan of Arc was venerated as a saint and became the official patron saint of France.6 The overlap of these events led to the overwhelming suc cess of Joan of Arc’s status as a symbol of French Nationalism.
Joan of Arc was also a cross dressing queer woman.9
Since the publication of this novel, there has been much speculation about the “true” identity of Joan of Arc. Alongside the theory that she was a cross dress ing lesbian, others believe she was asexual, a transgen der man, or even genetically male but suffering from a hormonal illness.10 A peasant girl alive in the 1400s may have identified as any of the above but would not have had the language to say so in her trials. Alterna tively, she could have simply been dressing as God told her, as Joan states very clearly during her trials. Whatever her “true” identity may be, in modern times, Joan of Arc has become a symbol for people who face similar persecution, and many find solace and inspira tion in her perseverance.
JOAN OF ARC HAS BECOME
The next shift in Joan of Arc’s identity came as a result of her renewed popularity with the gen eral public. Many new creative works were sparked after Joan of Arc obtained sainthood, one of the most influential being Vita Sackville-West’s biography of her published in 1936.7 This novel is widely attributed as the first instance of speculation on Joan of Arc’s gender and sexual identity. Vita Sackville-West was a popular English poet and novelist with dozens of publications and several awards. Sackville-West also led an eventful love life, with both male and female lovers. She would often cross dress as a man when out in public with her female lovers to avoid hostility and discrimination. These details of her personal life were published after her death by her son in “Portrait of a Marriage” in 1973.8 In her essay “Cross Dressing for (Imaginary) Battle,” author Kathryn Z. Sproles states that Sack ville-West may have projected her own identity and struggles onto Joan of Arc in her novel, insinuating that
The last shift in the perception of Joan of Arc can be attributed to a Japanese media franchise. To fully grasp this shift, it is imperative to search “Joan of Arc” and then “Jeanne d’Arc” in an image search engine. “Joan of Arc” results in historical paintings and images from modern movies. “Jeanne d’Arc” however, shows a woman with a long blonde braid, an ornate headpiece, and purple armor. This is Joan of Arc, renamed Jeanne d’Arc, as she is depicted in the Japanese Fate Apoc rypha and Fate Grand Order franchises. This version of Joan of Arc made her debut in the first volume of the novel Fate Apocrypha in 2012.11 The series was a massive success, generating an animated TV show and a comic adaptation of the story. When the mobile game Fate Grand Order was released in 2015, Jeanne d’Arc became the subject of its first major story section and a poster girl for the series.12 The personality of Fate’s version of Jeanne may not be historically accurate, but that has done nothing to discourage fans from loving her, as she is massively popular across the world. The Japanese image hosting website Pixiv has over 22,000 images tagged “Jeanne d’Arc,” and the fanfiction website Archive of Our Own, or AO3, has over 600
64
A SYMBOL FOR PEOPLE WHO FACE SIMILAR PERSECUTION, AND MANY FIND SOLACE AND INSPIRATION IN HER PERSEVERANCE.
entries for her name.13 Many of these fan works feature queer and gender nonconforming depictions. Some of the most popular include hypothetical pairings, such as a romantic relationship between Jeanne d’Arc and Marie Antoinette. The creation of these fan works and their popularity shows how well accepted Joan of Arc’s status as a queer icon has become. Fate’s version of Joan of Arc is so popular that it overwhelms search engine results for her French name, and often appears before historically accurate depictions of Joan of Arc in search listings. Her existence in this series has created a gateway for non-Christian individuals to discover her and become invested in the legacy of Joan of Arc. Through the internet, social media, and popular cul ture, a simple peasant girl who lived 500 years ago has become an international media sensation with millions of fans worldwide.
CREATIVE ARTIFACT
For my artifact, I wanted to create art that pays homage to art history and acknowledges the impor tance of modern media on the identity of Joan of Arc. I created a digital painting in the program Clip Studio Paint that combines digital rendering and traditional painting methods and compositions. I then animated it in the program Live2D. The choice of digital mediums is in reference to how much digital media and internet culture contributes to the discussion of homophobia and LGBT acceptance. The result is a dynamic digital painting that critiques Christian churches’ homophobic rhetoric and aims to raise awareness of the negative effects it has on LGBT people.
Through my creative process, I was drawn to the motif of fire and the subject of identity and agency. After reading the transcripts of Joan of Arc’s trial, I was struck by how proud and confident she was until the moment of her death. Joan of Arc may have been the victim of cruelty, but she always retained her own dignity and agency. I was also captivated by the idea of fire as a symbol of strength and rebirth, and of Joan’s tragic death.
I found myself unsure of how to visualize my intentions and research motivations for some time. As
much as I love modern representations of a butch les bian Joan of Arc, or depictions of her wearing a binder as a symbol for transgender people, those images were not aligned with my intentions. I did not want to make a statement on what I personally think the true identity of Joan of Arc was, because I believe that each person’s unique interpretation of her is valid. Instead, I wanted to focus on her martyrdom and how I could use that to convey a message.
I went through many variations and my stron gest ones always containing the motif of fire and Joan’s three heavenly messengers. Joan speaks of her visits from Saints Catherine and Margaret, as well as the Archangel Michael positively. Her enduring faith in their words led her to glory, but also to her death. I wanted to take this event that is often hailed as a great act of God and the epitome of a “good Christian” and subvert it.
My final composition depicts Joan of Arc flanked by her three heavenly messengers. Joan holds a flaming sword near her neck, with the hands of the two female saints supporting it upwards. The angel Michael stands behind the three and is represented according to descriptions of Seraphim in the Bible. As the animation plays, Joan looks between the viewer and her sword as the saints and the angel force her to move the blade to wards her neck. Fire roars around them, and Michael’s wings move to surround Joan and the two saints. The animation loops continuously (Figure 1).
DISCUSSION
Through my research into the history of Joan of Arc, I found myself contemplating her unique existence
65
I WAS STRUCK BY HOW PROUD AND CONFIDENT SHE WAS UNTIL THE MOMENT OF HER DEATH.
as both a gay saint and a Catholic saint. The intersec tion between these two communities is often ignored but does exist. According to a 2020 survey conducted by The Williams Institute UCLA School of Law, nearly half of LGBT adults are religious and approximately 25% of them are Catholic.14 This is no small denomina tion; this is a large minority group that is often over looked if not intentionally ignored.
As someone who exists in the intersection of these two groups, I often find myself at odds with both. I have not felt acceptance from the Catholic Church or other Christian churches due to their belief that homo sexuality is a sin. Many LGBT people have religious trauma from abuse and discrimination and under standably, they shy away from subject of Christianity as a whole. However, the people who do exist in this intersection are drowned out by the fighting between the two.
These struggles are what led to my research question and the concept behind my creative arti fact. I wanted to create a piece of art that serves as a springboard for discussion of the effects growing up in
Scan the QR code to watch the Figure 1 animation, or visit https://tx.ag/522Fig1.

religious communities can have on LGBT people, as well as to bring awareness to the discrimination LGBT people face by these same religious groups. To convey this message, I chose to subvert Joan of Arc’s great act of obedience to the word of God. I transformed it into a metaphor for how Christian churches often use the Bi ble and word of God as justification for their hatred and bigotry. My choice to have Joan of Arc as the subject

66
Figure 1. Controversial Saints: Joan of Arc. Animated digital painting. Alexandria Babineaux.
of this act is to literally turn Saint Joan of Arc into a sinner. By depicting a beloved saint as a sinner and the victim of God’s wrath, I aim to draw attention to our common humanity and the idea that no one deserves the cruelty and abuse that is often perpetuated in the name of God.
CONCLUSION
While conducting this research, I could not help but think about how much good it would do if the Catholic Church would accept Joan of Arc’s identity as a “gay saint.” It would bring solace to ostracized queer Catholics and Christians and would help undermine the Catholic Church’s hatred of specific groups. Instead, the Vatican authority’s official dogma continues to in sist that all members of the LGBT community, regard less of gender identity or sexuality, are sinners.15
The subject of historical accuracy versus modern interpretations often comes up in discussions of Joan of Arc. But in terms of her status as a modern saint, does historical accuracy even matter? Catholic saints exist to be beacons of hope and inspiration for the masses. Many saints have dedications that have nothing to do with their original lives. If a saint brings solace and hope to any group of people, that should be accepted and celebrated. I hope that the discussion created by this creative artifact can help foster a better understanding between these two groups and promote acceptance regardless of religion or personal identity.
ACKNOWLEDGEMENTS
I would like to thank my faculty advisor Samu el Woodfin for his guidance and support throughout this project, and Dr. Stoenescu for introducing me to this subject and sparking my love for research and writing. I would also like to thank my fellow members of the Aggie Creative Collective for their support and feed back, and my family for listening to my ramblings on Joan of Arc in the past year.
REFERENCES
1. Mark Vale, “St. Joan of Arc,” Encyclopædia Britannica. Encyclopædia Britannica, inc. Ac cessed March 23, 2022. https://www.britannica. com/biography/Saint-Joan-of-Arc
2. Vale, “St. Joan of Arc.”
3. Bette Talvacchia, “The Double Life of St. Sebastian in Renaissance Art” in The Body in Early Modern Italy, (Maryland: Baltimore, 2010), 233.
4. Talvacchia, “The Double Life,” [236].
5. Martha Hanna, “Iconology and Ideology: Images of Joan of Arc in the Idiom of the Ac tion Francaise, 1908-1931” French Historical Studies 14, no. 2 (1985): 215–39. https://doi. org/10.2307/286583
6. Hanna, “Iconology and Ideology,” 215–39.
7. Vita Sackville-West, Joan of Arc, (Doubleday, Doran & company, Inc, 1936).
8. Harold Nicolson and Vita Sackville-West, Portrait of a Marriage, (University of Chicago Press, 1973).
9. Karyn Z. Sproles, “Cross-Dressing for (Imag inary) Battle: Vita Sackville-West’s Biography of Joan of Arc.” Biography 19, no. 2 (1996): 158–77. https://doi.org/10.1353/bio.2010.0242.
10. Cerankowski, Karli June, and Megan Milks. “New Orientations: Asexuality and Its Impli cations for Theory and Practice.” Feminist Studies 36, no. 3 (2010). https://doi.org/https:// www.jstor.org/stable/27919126.; Sanginetti, E. P. Joan of Arc: Her Trial Transcripts. Little Flower Publishing, 2015.; Warren, Patricia Nell. “Was Joan of Arc Genetically Male?” The Gay and Lesbian Review, September 3, 2015. https://glreview.org/article/article 577/.
11. Higashide Yuichiro and Ototsugu Konoe. Fate Apocrypha, (Type-Moon, 2012).
67
12. Fate Grand Order, Mobile forApple and Android devices, (Type-Moon and Lasengle, 2015).
13. “‘「ジャンヌ・ダルク」の人気イラス トやマンガ・画像. https://www.pixiv.net/en/ tags/ジャンヌ・ダルク. ‘Jeanne D’Arc’ Works.’,” Pixiv, n.d., Organization for Trans formative Works. “Archive of our Own’Jeanne d’Arc | Ruler’Works.”Archive of Our Own. https://archiveofourown.org/tags/Jeanne%20 d’Arc%20%7C%20Ruler/works.
14. Kerith J. Conron, Shoshana K Goldberg, and Kathryn K O’Neill, “ReligiosityAmong LGBT Adults in the US,” UCLASchool of Law Williams Institute, October 2020. https://williamsinstitute.law.ucla.edu/publications/lgbt-religiosity-us/.

15. “Stances of Faiths on LGBTQ Issues: Roman Catholic Church,” Human Rights Campaign, Accessed March 23, 2022. https://www.hrc. org/resources/stances-of-faiths-on-lgbt-issuesroman-catholic-church.
ALEXANDRIA BABINEAUX '22
Alexandria Babineaux '22 is a visualization major from College Station, Texas. Her research is motivated by her love of art history and desire to explore modern digital artistic technology. She participated in the Aggie Creative Collective to produce a creative artifact to accompany her research. After graduation, Alexandria plans on pursuing a master's degree in fine art and a career in research and artistic education at the college level.
68
The Weird Years: Reactive Weirding, Upheaval Periods, and the

Post-Pandemic
By Rain Etheridge ‘22
69
Photo by Zach Plank on Unsplash.
“Yet, I also began to have the sense… that around the world enclaves that never knew one anoth er—writers who could not have read each other… had stared up at the same shared unfamiliar constellations in the night sky, heard the same unearthly music: a gorgeous choir of unique yet interlocking imaginations and visions and phantoms. At such times, you won der as both a writer and an editor if you are creating narrative or merely serving as a conduit for what was already there.”
-Jeff Vandermeer, The Weird
MOTIVATION
When examining the fringes of genre literature, a set of terms keep appearing: “bizarre,” “uncanny,” “surreal,” and “unnatural.” Taken together, these con cepts can be called the Weird—the domain of unnamed monsters, cryptic revenants, and horrifying mutations.
The Weird as a discipline is widely underes timated. It retains a stigma in the publishing world, its role in pop culture is heavily understated, and it remains chronically understudied in academia, despite some sporadic interest in the last two decades.1 But what if the Weird represents something more funda mental about literature? What if there is something em bedded in history, politics, even ecology, that beckons the Weird out of the background like a chthonic siren? And how, if at all, is this strange force shaping new literature as the pandemic fades?
Before we can answer these questions, allow us to consider two distinct (but non-exclusive) possible definitions of what we might mean by the Weird:
1. A subgenre of popular fiction combining elements of fantasy, horror, pulp, and science fiction that is primarily distinguished by a distorted, transformed, or corrupted perception of reality. Stock characters and tropes from the parent genres often appear but are significantly altered to the point of strangeness.2
2. A mode of storytelling, represented occasion ally in most, if not all, categories of genre and literary fiction. It is characterized by the
interrogation and subversion of established reality narratives. By calling into question said narratives, the Weird mode typically seeks to convey the points of view of those individuals and ideas that lie outside the bounds of polite, mainstream culture.3
Definition one treats the Weird as most do. It examines only the literary tradition of popular hor ror that evolved with those such as Edgar Allan Poe, Mary Shelly, and H. P. Lovecraft from the Gothic. It is specific, unassuming, and precise. It also misses much that is fundamental about what makes us as a culture return perennially to the Weird. For that, we must look to definition two: the Weird as a mode.
Mode refers to a collection of methods, moods, and impetuses. This is different from genre as we typically discuss it, as genres imply a common histo ry and lineage. They are primarily ad hoc categories used to manage audience expectations and to study the evolution of literary ideas. If we think of genres as trees in a forest, each with their branches of influ ence, then modes are the terrain, or the geology. They support and underlie many genres simultaneously. For example, fantasy proper utilizes what might be called the Fantastic mode, which deals with playfulness and self-reflectiveness of language. However, this mode is by no means exclusive to fantasy, also appearing in genres such as science fiction and horror. Unlike genres, modes are unbound by history and time—they are different ways of answering the question: “Why tell these stories at all?”4
When viewed as a mode, the Weird appears in unexpected places outside of the genre that bears its name. Magical realism, a subgenre developed in Latin America in the early twentieth century and later iterated upon globally, draws from the Weird as much or more than Lovecraftian horror does. It blends extraordinary and mundane elements in such a way that the two be come inseparable, thus deconstructing reality narratives in the exact manner we described in definition two. Postmodernism, the primary advancement of Western postwar literature, was saturated with the Weird in a similar way to magical realism. Authors sought to de
70
construct the narratives of the past, and tore down real ity itself to do so. Metamodernism, the recent evolution of postmodernism into the twenty-first century, pushed popular literature further into Weird territories. Modern science fiction is Weirder than ever. The list goes on.
Across history, the Weird appears in “clusters,” explosions of genre and subgenre that become popular in specific places at specific times. This phenomenon alone is an indication that something fundamental is at work in the various emergences of Weird fiction beyond genre trappings. Mode can begin to explain this clustering.
All Weird fiction, whatever the genre, is born of alienation, dislocation, depersonalization, depression, and/or delirium. The feeling, in whatever form, that something has changed, that while one was not looking, some thing impossible slipped in and replaced what one thought they knew to be real. Weird fiction in all its forms is dedicated to the expression and exploration of this sensation.5
What drives read ers and authors to interro gate the often-uncomfort able nature of change? For that, we must look to cognitive linguistics.
Linguists Ostergaard and Bundgaard have proposed that new forms of literature emerge out of the contact between two forces: the texts that came before, and the “exigencies” of the current historical context.6 Exigencies are forces external to the writing process, and they come in two forms, Constrictions and Affordances. Constrictions are things like scarcities, taboos, unknowns, and repression—they disincentivize certain topics from being emphasized. Affordances are the opposite: fads, abundances, new information—they encourage certain traits to be played up. The tension between positive and negative exigencies creates a set of incentives that are unique to that time and place. An
author responds to these incentives by iterating on the works that have come before her to create something new, and a novel form of literature is born. This process goes on to influence history, changing the exigencies further. Ostergaard and Bundagaard call this phenome non the “Dual Feedback Loop,” and it helps to explain why Weird musings tend to cluster.7
The exigencies, or external circumstances, that produce Weird works are those which produce alien ation. Exigencies arise when culture, politics, ecology, economics, and/or technology shift to the point that previous ways of life become unrecognizable. These disturbances may be the reason why the Weird seems to cluster so heavily—it is written in response to periods of extreme change—thus earning the term “reactive weirding.” “Reactive weirding” is the property of literature to transform itself, to weird itself, as a reaction to systemic upheaval. These extreme shifts may be the common ality behind explosions of the Weird.
This link is made relevant by the current transformational moment. Since the beginning of the COVID-19 pandemic (and arguably before), most aspects of American life and society are in flux. By un derstanding the response of historical societies to such changes, we may be able to predict the coming literary moment.
To investigate the potential association be tween change and the Weird, it will be necessary to review several Weird movements of the twentieth and twenty-first centuries.
HISTORY
Two useful examples of Weird explosions are the development of magical realism in Latin America as a reaction to chronic instability, and the development
71
WHATEVER
GENRE,
ALIENATION, DISLOCATION, DEPERSONALIZATION, DEPRESSION,
DELIRIUM.
ALL WEIRD FICTION,
THE
IS BORN OF
AND/OR
of metamodernist maximalism in response to the rise of mass media.
While its precursor movements can be traced back to 1920s Germany, the subgenre known today as magical realism found its footing in Latin America beginning in 1955. Authors like Arturo Uslar-Pietri, Jorge Luis Borges, and Gabriel Garcia Marquez all pushed the form forward with their bold insistence on fantasy-as-fact, which would become the hallmark of the genre. Magical realism distinguished itself with its colorful and often near-psychedelic approach to reality, in which fantastic and impossible elements mingle seamlessly with real-life until the two are inseparable. This disregard for the “realistic” is a classic example of Weirding. By making reality strange and often incom prehensible, writers like Marquez were able to call attention more easily to aspects of reality they found mentionable.8
And what aspects were mentionable were, invariably, political. Latin America’s postcolonial relationship with Europe bred a kind of marginality— Latin America was often seen as being at the periphery of European culture. The violence wrought by colo nialism had still not been adequately recognized, and the impacts of rapid decolonization had plunged many nations, such as Colombia, into cyclical periods of intense revolutionary and dictatorial violence. When Marquez was growing up, events such as the Thousand Days’ War and the banana massacres, bloody clashes over politics and labor, were intimately entwined with his childhood and family history. The influence on his work is far from subtle. Books such as Autumn of the Patriarch and One Hundred Years of Solitude openly comment on the upheaval and precarity of his time.9 The violence and surreality of his work are reflections of the environment it was created in. It could be said that without the upheaval of the period, the subgenre of magical realism would have been unable to form the way it did. The weirding inherent in stories such as A Very Old Man with Enormous Wings allowed Mar quez’s writing to speak so eloquently and succinctly to the attitudes of the time.
Marquez and his contemporaries inspired sim ilar traits in authors overseas as magical realism spread
from Latin America. Jose Saramago began to use mag ical realism to describe pandemics, social unrest, and the evolution of religion in his home country of Por tugal in the 1970s, ‘80s, and ‘90s. Saramago’s quietly dark writing evokes Marquez, but in a uniquely Portu guese context. His works reflect pointedly on the issues of his day and locale. Novels such as Blindness tackle the decay of authority in the late stages of capitalism, and the failure of Portuguese society to reckon with the massive changes of the late twentieth century.10
Concurrently, authors in the United States and elsewhere were exploring evolutions of postmodern ism to achieve a similar effect with slightly different techniques.
While mass media had already been asserting an effect, the latter half of the twentieth century brought about a paradigm shift in the way Americans consumed and thought about media. The John F. Kennedy presi dency and assassination, Vietnam, and Watergate were all culturally consequential events that were mediated primarily through the television screen. By the 1980s, TV had entrenched itself as an organ of power and ide ology, embodied by Reagan, the former host of General Electric Theater. Soon after, the 24-hour news cycle would ascend, popularized by the OJ Simpson trial. In part, the societal changes brought about by television and the nascent World Wide Web instigated an evolu tion beyond postmodernism in the late 1980s, 1990s, and early 2000s.11
Pop culture was first made aware of this evolu tion in 1996, with the release of David Foster Wallace’s 1,000+ page novel Infinite Jest. 12 The book was a best seller and received praise from critics for its originality, humor, and intellectual depth.
What often goes unmentioned is the degree to which Wallace’s distinctive style leans on the Weird. The world of Infinite Jest is subtly but pervasively magical realist. New England and Quebec have been reduced to a smoldering trash heap. Herds of giant hamsters and overgrown, malformed fetuses occa sionally make an appearance. Absurdity of all kinds overflows from the most basic of human interactions, seeming to spill out of the social and into the actual.
72
And of course, the central plot device, the fictional film from which the title is taken, is a movie so entertaining that once one has seen it, they cannot resist watching it until they die.
Speculation on the motivations of Wallace’s excursion into the Weird is largely unnecessary. The use of magical realist imagery, and more broadly the Weird tone, is repeatedly cast within the novel itself as a byproduct of the sensationalism and entertain ment addiction that had rapidly overtaken America. To Wallace, television seems less an evil in and of itself and more so a symptom of some greater emptiness in America’s center. It is this emptiness, this alienation, and the struggle to alleviate it, with which Infinite Jest is concerned.13
Other books utilizing similar techniques followed, and in some cases preceded Infinite Jest. Mark Z. Danielewski’s linguistic puzzle box House of Leaves14 and Reza Negarestani’s work of fiction al horror philosophy Cyclonopedia15 are two nota ble examples of Wallace’s successors. Both of these works draw on academia to induce Weird horror. In Danielewski’s case, the spiraling authorship of the early internet provides a venue for the exploration of cognitive linguistics by way of the Weird mode. In Negarestani’s, the fallout of the war on terror has laid bare material and existential horrors buried within the very soul of the Middle East. In both books, academic language and dizzying complexity are employed to systematically assault the narratives being constructed by states and systems in the early 2000s. Both authors utilize a maximalist, deconstructive style, linking them with Wallace. Together with many others, their writing represents a stylistically and modally cohesive reaction to the instability, uncertainty, and mutability of the two decades.
There are several other examples of upheaval periods and authors who have weirded their writing styles in response to the turbulence of their times, and the works discussed previously are just a few. When one studies the history of catastrophe, of cultural change, and of collapse, one finds artists turning to the Weird to express the strangeness of their times.
REFLECTION
With the basis for reactive Weirding estab lished, what can we conclude about the future of American literature in response to more recent social, political, and medical changes? In some ways, the next Weird renaissance has already begun. America and the Cult of the Cactus Boots: A Diagnostic by Phillip Freedenberg revived the Wallacian maximalist format to comment on the bizarre psychosis of the Trump era. Ling Ma’s Severance used a magical realist approach to elucidate the Chinese American experience of alienation and discrimination during the course of a pandemic two years before COVID-19. Science fiction authors like Ted Chiang have begun to Weird that subgenre, seemingly inspired by phenomena such as climate change and posthumanism.
The response to the COVID-19 pandemic is still incubating. It is too early to survey how extensive the reactive weirding of the American literary form might become. The creative artifact I produced in conjunction with this research, The Weird Year: Things Made in Quarantine, is a collection of reactively weird stories intended to capture my own experience of living through a pandemic. It also serves as a possible fore cast of what may be to come for American literature if the process of reactive weirding takes hold of the mainstream.
In any case, literature will need to turn to new modes and new methods to make sense of what has
73
ABSURDITY OF ALL KINDS OVERFLOWS FROM THE MOST BASIC OF HUMAN INTERACTIONS, SEEMING TO SPILL OUT OF THE SOCIAL AND INTO THE ACTUAL.
occurred. Old genre methods, developed in compara tive stability, do not resonate as they once did. Trans formation, mutation, and weirding are in some sense inevitable; what form American literature will take in the future remains to be seen.
ACKNOWLEDGEMENTS
I would like to thank Dr. Jason Harris, Profes sor Nandini Bhattacharya, and Sebastian Tourella for their contributions to this discussion.
REFERENCES
1. Ann VanderMeer and Jeff VanderMeer, The Weird: A Compendium of Strange and Dark Stories, (New York: Tor Books, 2012).
2. H. P. Lovecraft and E F. Bleiler. Supernatural Horror in Literature, (New York: Dover Publi cations, 1973), [3].
3. VanderMeer and VanderMeer, The Weird

4. Brian Attebery, Strategies of Fantasy, (India napolis: Indiana University Press, 1992), [5].
5. Lovecraft and Bleiler, Supernatural Horror.
6. Svend Østergaard and Peer Bundgaard, The emergence and nature of genres: A so cial-dynamic account (Cognitive Semiotics, 2015). https://www.researchgate.net/publica tion/284104532_The_emergence_and_nature_ of_genres_A_social-dynamic_account.
7. Østergaard and Bundgaard, Emergence and nature of genres.
8. Maggie Ann Bowers, Magic(al) Realism: The New Critical Idiom, (Routledge, 2004), [56].
9. Gabriel García Márquez, One Hundred Years of Solitude (London: Pan Books, 1978).
10. Jose Saramago, Blindness, (Caminho, 1995).
11. Mitchel Stevens, History of Television, Grolier Encyclopedia. https://stephens.hosting.nyu.edu/ History%20of%20Television%20page.html.
12. David Foster Wallace, Infinite Jest, (New York: Black Bay Books, 1996).
13. David Foster Wallace, “E Unibus Pluram: Television and U.S. Fiction,” Review of Con temporary Fiction 13, no. 2, (Summer 1993): 151–94. http://jsomers.net/DFW_TV.pdf
14. Mark Z. Danielewski, House of Leaves (Toron to: Pantheon Books, 2000).
15. Reza Negarestani, Cyclonopedia: Complic ity with Anonymous Materials, (Melbourne: Re.press, 2008).
RAIN ETHERIDGE '22
Rain Etheridge '22 is an English major from San Antonio, Texas. In 2022, Rain won the Texas A&M Science Fiction and Fantasy Contest. Their experiences living around the world as a military brat have inspired an obsession with experimental and fringe literature. They plan to continue publishing their creative and critical work, while pursuing a teaching position.
74
Lab-Grown Bone: Using Stem Cells to Successfully Replicate the Native Bone Healing Environment
 By Rithika Adavikolanu ‘22
75
Photo by Mehmet Turgut Kirkgoz on Unsplash.
INTRODUCTION
An estimated 2.2 million bone graft proce dures are performed annually worldwide due to bone diseases, osteoporosis-related fractures, trauma, bone malformations, and tumor resections.1 Autografts, where a patient’s own bone is harvested from another site, are considered the golden standard for bone defect treatment; however, the limited supply and potential complications at the donor site remain a significant problem. Allografts, bone from cadavers, are a widely used alternative, but these pose a serious risk of disease transmission.1 Bone tissue engineering seeks to develop better treatment alternatives for the large population with conditions that negatively impact bone healing.
The goal of bone tissue engineering is to fabri cate scaffolds with the healing potential of autografts. A common strategy employs three-dimensional scaffolds, typically seeded with cells and other biological mole cules, that promote desirable cellular interactions with their host to create an osteogenic environment. This technique is used to promote the formation of new bone to replace the scaffold.2 Bone heals best when it is in an environment that closely resembles the native tissue. One way bone engineers replicate the native tissue environment is by coating scaffolds or implants with a cell-derived extracellular matrix (ECM), a complex mixture of proteins secreted by cells. The ECM resem bles a bone that is developing or healing as opposed to an adult bone. For example, there are certain types of collagens (e.g., collagen VI and XII) found in develop ing bone that contribute to bone formation, but these are absent in adult bones.
Human mesenchymal stem cells (hMSCs) are one of the most common types of cells implanted on
these scaffolds. hMSCs have the ability to differentiate into multiple connective tissues (mainly bone, fat, and cartilage) and are found in high quantities within bone marrow, which is widely used for healing difficult bone defects. In addition, there is emerging evidence that the immuno-suppressive nature of hMSCs, along with their differentiation abilities, makes them highly attractive for regenerative techniques, as transplant rejections are a huge limiting factor for cell-based therapies.3
One way to coat scaffolds with ECM is to seed stem cells directly onto the scaffold, allow them to deposit a protein matrix, then remove the cells from the scaffold leaving behind just the matrix. However, this decellularization process can negatively affect the mechanical properties of the scaffold and the bioactiv ity of the ECM. This project investigates a method to covalently tether the ECM to scaffolds without compro mising the integrity of either the ECM or the scaffold. We aim to achieve this through a process called click chemistry, which is a highly selective covalent reac tion that occurs between two chemical groups (in our case, azide groups and alkyne groups) to “click” them together.
METHODS
We used human mesenchymal stem cells (hMSCs), which have promising regeneration potential and are traditionally isolated from the bone marrow. However, hMSCs have limited proliferation abilities and high variation in potency depending on what donor or tissue they are sourced from. To bypass this, we derived our hMSCs from induced pluripotent stem cells (iPSCs) to produce induced pluripotent human mesen chymal stem cells (ihMSCs), allowing them to produce a plethora of cells originating from only one donor or cell source. We then introduced the small molecule GW9662 (GW) to our stem cells, which encouraged our cells to differentiate into bone cells. Importantly, the addition of GW also induces the secretion of ECM.
We utilized a process called metabolic labeling to incorporate an azide group, which is not naturally occurring in cells, into the ECM. We introduced our cells to L-azidohomoalanine (AHA), an amino acid
76
BONE HEALS BEST WHEN IT IS IN AN ENVIRONMENT THAT CLOSELY RESEMBLES THE NATIVE TISSUE.
Figure 1. A) A normal methionine amino acid with a typical sulfur group B) L-Azidohomoalanine containing an azide group (opposed to the typical sulfur group) shown binding to an alkyne group tagged with a fluo rescent dye.

containing an important azide group (Figure 1B). Cells recognized AHA as an alternative to a methi onine amino acid (Figure 1A) and thus incorporated it into protein synthesis, meaning that every new pro tein produced is labeled with AHA. Azides react very specifically with alkynes such as dibenzocyclooctyne (DBCO), thus we can track the deposition of proteins by adding fluorescently labelled DBCO. We are using this same chemistry to bind our azide-containing ECM to a scaffold labeled with DBCO.
We prepared our scaffolds using a hydrogel polymer, gelatin methacrylate (GelMA), creating it in a two-step process to produce a hydrogel scaffold labeled with DBCO (Figure 2, top row). ECM was
produced by introducing GW and AHA to our ihMSCs, which allowed the cells to differentiate into bone cells, encouraged the secretion of the ECM, and labeled our cell proteins with azide groups (Figure 2, middle row). The cells were allowed to grow for ten days to deposit an ECM made up of these newly synthesized, AHA-containing proteins. After the cells deposited the ECM, it was then extracted and the ihMSCs were removed. The decellularized matrix was consequent ly solubilized, leaving a protein stock to tether to the hydrogel scaffolds. Finally, we tethered the ECM to the DBCO-hydrogel scaffold by allowing the alkynes to react with the solubilized ECM containing AHA azides. The potency of the scaffold was tested by adding bone marrow derived hMSCs (BM-hMSCs) and measuring biomarkers for bone formation.
RESULTS
Verification testing was performed to ensure the successful binding of DBCO alkynes to the hy drogel scaffold. Since alkynes have a high reaction rate to azide groups, we used a fluorescent dye linked to an azide group to visualize the presence of DBCO alkynes. We placed DBCO functionalized GelMA in TAMU molds with a plain GelMA outer circle. The
Figure 2. A visual depiction of the overall methods, with the first row illustrating the hydrogel preparation, second row illustrating the ECM production, and the third row illustrating the ECM tethering. Figure created using BioRender.

77
Figure 3. Plain GelMA and DBCO functionalized GelMA both placed inside a TAMU mold, treated with azide dye for two hours, and allowed to wash for up to eight days.

entire gel was dyed with an azide dye for two hours and allowed to wash for up to eight days to allow the unbound dye to completely wash away. After the con clusion of eight days, the DBCO functionalized GelMA was still fluorescent, indicating a stable reaction had occurred.
The ECM consists of high levels of collagen VI and XII, which play an important role in endowing osteogenic properties to the ECM. Therefore, when testing the properties of the ECM it is important to probe for the presence of collagen VI and collagen XII proteins to verify that the ECM is accurately replicating the healing bone environment. Furthermore, a major concern with click chemistry is that the composition and the function of the labeled proteins will be com promised. To ensure that feeding cells with AHA would
not alter the composition of the ECM, we analyzed the ECM monolayers grown in an increasing range of AHA concentrations from 0 to 300 micromolar. After ECM deposition, we performed fluorescence microscopy to stain for the presence of AHA. As shown in Figure 4, we found a direct relationship between AHA concentra tion and resulting fluorescence, proving that AHA was effectively incorporated into the ECM. Furthermore, the expression of both collagens VI and XII was unaf fected by increased AHA concentration, indicating that AHA does not alter the composition of these important collagens.
Additionally, to determine the effect of AHA on the expression of collagen XI and XII, a western blot was performed (Figure 5); which is a common labora tory technique used to separate and probe for specific proteins in a sample of several different proteins. The same experimental groups described above were used for the western blot in duplicates. Results showed that the addition of AHA had no effect on the presence of collagens VI and XII within the ECM. This further demonstrated that the osteogenic properties of the ECM remained intact even after the metabolism of AHA.
Finally, to determine if the GW and AHA added to the cells affected the protein yield in the ECM, we
Figure 4. Fluorescence microscopy done on ECM monolayer in increasing AHA concentrations from 0 to 300 mi cromolar for both collagens VI and XII proteins.

78
Figure 5. Western blot protein quantification bands for proteins of interest: Collagen VI, Collagen XII and GAPDH (housekeeping protein, loading control).


CONCLUSION
Figure 6. Quantification of protein concentration to observe the effect of GW and AHA on protein expression in the ECM. Four experimental groups were used: DMSO (control), DMSO and AHA, GW, and GW and AHA. performed a bicinchoninic acid assay which quantifies the amount of protein present in each sample. We eval uated four groups: DMSO (control), DMSO and AHA, GW, GW and AHA for total protein expression pres ent in each sample. Results showed that GW treated samples produced three-fold more ECM proteins than DMSO controls. This is a desirable outcome as GW was added to promote the secretion of the ECM and is therefore expected to yield a greater output of protein. Results also showed that the incorporation of AHA did not affect the ECM protein deposition, which is also de sirable as the addition of a new metabolic group should not alter the inherent properties of the ECM proteins.
Unlike current bone treatments, such as autografts and allografts, our method aims to replicate the natural process of healing bone rather than simply replacing damaged tissue with fully formed bone. Furthermore, by using actual ihMSC-derived ECM, we are able to preserve the richness of the natural bone healing environment and enhance the osteogenic properties of biomaterials. The goal of this research is to covalently tether the osteogenic ECM to a hydrogel scaffold without negatively affecting its osteoinduc tive properties. In this work, we have begun to apply metabolic labeling and click chemistry techniques to develop a novel biomaterial ECM-scaffold. A simple interpretation of these results leads to the conclusion that GW treatment provides an avenue to stimulate ihMSCs to deposit higher levels of ECM than DMSO controls. More importantly, our AHA (methionine substitute) can effectively be incorporated into the osteogenic ECM and we confirmed that AHA does not affect the number of proteins our ihMSCs produce or its composition (collagen VI and collagen XII). Our results show that ihMSCs seeded onto the decellu larized, AHA-containing ECM experience the same osteoinductive effects observed from a standard osteo genic ECM. Our work thus far provides the founda tion for an ECM labeled biomaterial decorated with DBCO, which we hope to achieve in the near future.
ACKNOWLEDGEMENTS
I would like to thank Dr. Roland Kaunas for encouraging me to pursue various research opportu nities and allowing me to take part in his research lab for the past four years. I would also like to thank my graduate mentors, Eli Mondragon and Berkley White, for their continued guidance and support throughout the course of this research project.
REFERENCES
1. A. R. Amini, C. T. Laurencin, and S. P. Nu kavarapu, “Bone tissue engineering: recent advances and challenges,” Critical Reviews
79
in Biomedical Engineering 40, no. 5 (2012): 363–408. 10.1615/critrevbiomedeng.v40.i5.10.
2. V. Campana et al. “Bone substitutes in ortho pedic surgery: from basic science to clinical practice,” J Mater Sci Mater Med 25, no. 10 (2014): 2445–61. https://doi.org/10.1007/ s10856-014-5240-2.
3. Amini, Laurencin, and Nukavarapu, “Bone tissue Engineering,” 363–408.
4. R. A. Hortensius and B. A. C. Harley, “Nat urally derived biomaterials for address ing inflammation in tissue regeneration,” Experimental Biology and Medicine 241, no. 10 (May 2016): 1015–24. https://doi. org/10.1177%2F1535370216648022.
5. C. M. McLeod and R. L. Mauck, “High fidelity visualization of cell-to-cell variation and tem poral dynamics in nascent extracellular matrix formation,” Scientific Reports 6, (2016): 38852. 10.1038/srep38852
6. S. Viswanathan et al., “Soliciting strategies for developing cell-based reference materials to advance MSC research and clinical trans lation,” Stem Cells and Development 23, no. 11 (2014): 1157–67. 10.1146/annurev-cell bio-100913-013132.
7. B. H. Clough et al., “Bone regeneration with osteogenically enhanced mesenchymal stem cells and their extracellular matrix proteins,” Bone and Mineral Research 30, no. 1 (2015): 83–94. https://doi.org/10.1002/jbmr.2320.
8. E. P. McNeill et al., “Characterization of a pluripotent stem cell-derived matrix with pow erful osteoregenerative capabilities,” Nature Communications 11, (2020): 3025. https://doi. org/10.1038/s41467-020-16646-2.
9. S. Zeitouni, “Human Mesenchymal Stem Cell–Derived Matrices for Enhanced Osteore generation,” Science Translational Medicine 4, no. 132 (May 2012): 132ra55. 10.1123/sci translmed.3003396.
RITHIKA ADAVIKOLANU '22
Rithika Adavikolanu '22 is a biomedical engineering major from San Francisco, California. She has been involved in undergraduate research from 20182022, where she has studied various topics within the field of regenerative medicine. After graduation, Rithika will be researching host-virus interactions at UCSF before pursuing her Ph.D. in genetic engineering.

80
Reaching
By Olivia G. Parker ‘22
INTRODUCTION
My collage is a visual represen tation of perseverance and a celebration of what can be achieved by persisting regardless of difficulties. Collage is both a noun and verb that describes ways of gluing fragments of paper to various surfaces.1 Collage was popularized in the early 1910s by modernist artists like Kurt Schwitters, Georges Braque, and Pablo Picasso. While there are different tech niques that fall under the term collage, they are united by rejecting aestheticism and elevating everyday objects. Contem porary collage often explores humanity’s relationship with time, nature, or the past through images or text.2
Similar in medium to the work of Kurt Schwitters, the collage is made from discarded paper material. His modernist, post-World War I collages used trash, broken objects, and other detritus ar ranged in careful harmony.3 Some of his collages feature papers with no thematic connection to one another. Others, use the same types of paper. Untitled (Quality Street)4 is made entirely from colorful candy wrappers and inspired my choice of materials. While Schwitters used found materials in his art to free them from the constraints of narrative and symbolism, my found materials are arranged into a specific symbol ic image. Schwitters used abstraction to communicate that beauty and balance can be made from the rubble and debris of war. I turned away from abstraction and arranged my materials into a storytelling image.
81
UP MY HOMEWORK AND TURNING IT INTO AN ART PIECE
INCREDIBLY CATHARTIC.
RIPPING
WAS
METHODS
Reaching is a collage made of discarded homework. To source my materials, I asked my friends, co-workers, the people who lived in my dorm, and anyone I may have met in the last four years to donate a piece of homework from the most difficult class that they have finished at Texas A&M University. Hand writing in multiple colors of ink, highlighted sections, and feedback in red pen sprawls across hundreds of pieces of paper from lab notebooks, exams, notes, and final essays.
The inspiration for using homework in this piece came from a previous project completed in 2019, where I needed to finish a papier mâché mask by midnight and had run out of paper. I went through my bookshelf and found a previous semester’s MATH 140 notebook. The spring of my freshman year was a difficult time and waking up for an 8 a.m. math class was especially challenging. I received a thirty-eight on the first exam, and a fifty on the second…but I could not drop the class because I needed to stay a full-time student. My friends tutored me, and I passed the class with a hard-fought grade of sixty-eight. Ripping up my homework and turning it into an art piece was incredi bly cathartic.
While collecting papers from friends and acquaintances, I never asked for their backstories. Asking why a particular class was difficult felt too personal. However, everyone who donated homework shared their stories while handing me their papers. Some people just did not work well with a particular professor, or they found the course work overwhelm ing. One class was such a disparate match to a student’s skills that they changed majors. Another student shared that the first assignment they turned in for a class was falsely flagged for plagiarism, and they had to fight the charge for the remainder of the semester. But everyone finished their class. They pushed through, did the work, and moved on to the next challenge. When I look at the jagged torn-paper mountain range in my artwork, I do not see a pile of struggles. I see a mosaic of triumph.
Initially, I was viewing these students as resilient. Academic resilience has been defined as “the
BOTH RESILIENCE AND BUOYANCY ARE MAJOR FACTORS IN DETERMINING A COLLEGE STUDENT’S SUCCESS.
heightened likelihood of success in school and other life accomplishments, despite environmental adver sities brought about by early traits, conditions, and experiences.”5 Students who find a class overwhelming for environmental or internal reasons and are successful despite them are demonstrating academic resilience. Academic buoyancy refers to everyday setbacks instead of challenging circumstances like low socioeconomic status.6 Students who bounce back from failing a test, sleeping through a class, or surviving a plagiarism allegation demonstrate academic buoyancy. Both resil ience and buoyancy are major factors in determining a college student’s success. Most of the homework pages I collected are from students who demonstrated aca demic buoyancy.
RESULTS
The source materials for this piece and their arrangement into a specific image can be read as a saying: Climbing the mountain is hard, but what you are reaching for is worth it. One of the most encourag ing things that I heard in college was from a LAUNCH staff member. My thesis reviewer said, “What you are doing is hard.” Just the acknowledgment that the various tasks my fellow researchers and I were under taking were difficult but still worth doing made all the difference and pushed me to keep climbing towards the answer to my research question.
Looking at my finished collage, I find comfort in knowing that MATH 140 was hard for me, but other people struggled in classes like PHYS 206, CHEM 120, or POSC 429. Each student who donated homework for the art piece passed their class, half of them have
82
graduated and several are going on to earn a higher degree. Sometimes it is encouraging to see that every one has had ‘that class’ but are still successful. I hope that everyone who interacts with Reaching is inspired by these students’ academic resilience and buoyancy to push through whatever challenge they are facing.
CONCLUSION
I see my artwork as a reflection of the goals of the Explorations journal and the concept of research. The figure reaching for the sky represents the curiosity of a single individual, who has pursued their academic interest through the highs and lows of a challeng ing journey. They have developed and demonstrated academic resilience and buoyancy to reach the high est point they can climb. Not satisfied by the plateau they have arrived at, the answer they found, or edge of knowledge, the researcher reaches out to discover more.
REFERENCES
1. “Collage,” Tate, accessed June 21, 2022, https://www.tate.org.uk/art/art-terms/c/collage.
2. Patrizia C. McBride, “The Game of Meaning: Collage, Montage, and Parody in Kurt Schwit ters’ Merz,” Modernism/modernity 14, no. 2 (2007): 249–72.
3. “A Guide to Collage,” Rise Art, last modi fied June 25, 2020, https://www.riseart.com/ guide/2371/a-guide-to-collage.
4. Schwitters, Kurt, “Untitled (Quality Street)” Collage, 1943, (Sprengel Museum), https:// www.tate.org.uk/tate-etc/issue-27-spring-2013/ modernists-dont-die-ambleside
5. Margaret C. Wang and Edmund W. Gordon, Educational resilience in inner-city America: Challenges and prospects (Routledge, 1994), 3.
6. Georgia Rudd, Kane Meissel, and Frauke Meyer, “Measuring academic resilience in quantitative research: A systematic review of
the literature,” Educational Research Review 34 (2021): 100402.
OLIVIA GRACE PARKER '22
Olivia Grace Parker '22 graduated with her Bachelor of Arts in performance studies and minors in English and film studies. She grew up as an Air Force kid, living in the Azores, Germany, Virgina, Alabama, Colorado, Pennsylvania, England, and Texas. Completing the LAUNCH Undergraduate Research Scholars program twice helped her define her artistic and academic research to focus on wonder, perseverance, performance phenomena, and transporting viewers to new worlds. This fall, she will start her Master's of Fine Arts program in acting and contemporary performance at Columbia College Chicago and Arthaus Berlin International School.

83
BOARD BIOGRAPHIES
MACK WESLEY CLEVELAND '23
Mack is a materials science and engineering major from Bedford, Texas. After graduation, he plans to go to graduate school to earn a Ph.D. in Materials Science to pursue a career in research.

VENKATA SAI VARSHITHA DHULIPALA '25
Varshitha is a molecular and cell biology major from Frisco, Texas. After graduation, she plans to go to medical school and pursue an M.D./Ph.D.


JAKE GARRETT FIELDS '25


Jake is a biochemistry and genetics double major from Dripping Springs, Texas. After graduation, he plans to get a master’s degree and conduct lab work.
ANNALIESE C. FOWLER '23
Annaliese is a biomedical engineering major from Houston, Texas. After graduation, they plan to attend graduate school for a Ph.D. in biostatistics or bioinformatics to pursue a career in cancer research.
GABRIELLE "ELLIE" HALL '25
Ellie is a sociology major from Arlington, Texas. She hopes to pursue a future career path that allows her to combine all her interests and skills in a way that sustains meaning in her everyday life.
NABILA HAQUE '24
Nabila is an economics major from Sugar Land, Texas. After graduation, she plans to go into the workforce and find a job that utilizes her economics and data science knowledge.
84
BOARD BIOGRAPHIES
THAO B. HO '22

Thao is a bioinformatics major from Houston, Texas. After graduation, she plans to go to graduate school to earn a master’s in economics and finance to pursue a career in business consulting in healthcare.


AMY LONG '24
Amy is a computer science major from Houston, Texas. After graduation, she plans on working for a few years before going back to get a master’s degree.
ALYSSA LOW '22
Alyssa is a biochemistry and genetics double major from McKinney, Texas. She plans to pursue a career in medicine.

AYESHA NAGARIA '23


Ayesha is a public health major from Katy, Texas. After graduation, she plans to pursue a career in healthcare that works to address local or global healthcare disparities.
SHIVAM A. PANCHOLY '25
Shivam is a biomedical sciences major from Sugar Land, Texas. After graduation, he plans to attend medical school.
NIDHI PAWATE '24
Nidhi is a nutrition major from Allen, Texas. After graduation, she plans to attend medical school in order to become a physician and help the health needs of others.
85
BOARD BIOGRAPHIES
ANANYA PILLAI '24
Ananya is a biomedical sciences major from Frisco, Texas. After graduation, she plans to go to medical school to minimize healthcare disparities in Texas.
VISHAY RAM '24
Vishay is a molecular and cell biology major from Katy, Texas. After graduation, he plans to go to medical school to pursue a career as a physician.
NUSHRAT JAHAN RASHID '24
Nushrat is a biochemistry and genetics double major from Plano, Texas. After graduation, she plans to go to graduate school to earn a Ph.D in genetics and genomics to pursue a career in research.


SUCHITAA SAWHNEY '24


Suchitaa is a biomedical engineering major from Flower Mound, Texas. After graduation, she plans to attend medical school to earn a M.D. to pursue a career in healthcare.
RONALD "RON" SELLERS '22

Ron is an industrial and systems engineering major from Dallas, Texas. After graduation, he plans on pursuing a master's in biomedical engineering with a focus in biomaterials and bioprinting for medical devices.
ARYAN SHETTY '22
Aryan is a computer science major from Dubai, United Arab Emirates. He plans to pursue a master’s in machine learning.

86
BOARD BIOGRAPHIES
MIRIAM C. STEIN '24
Miriam is a molecular and cell biology major from San Antonio, Texas. After graduation, she plans to pursue a Ph.D. and career in medical research.
NIKITA VALLURI '22


Nikita is a biomedical sciences major from Houston, Texas. She plans to go to medical school after a gap year where she will continue research, work in EMS, or pursue a master’s degree.
JEREMY THOMAS '23
Jeremy is a biomedical engineering major from Highland Village, Texas. After graduation, he plans to attend graduate school to earn a Ph.D. in biomedical engineering and pursue a career in research.
ABHINAV VADASSERY '25
Abhinav is a biology major from Sugar Land, Texas. He plans to collaborate with the Texas A&M research community and promote scientific knowledge on campus.

ANDREA "ANDIE" CELESTE VAN RAVENSWAAY '23
Andie is an applied mathematics - actuarial science major from Houston, Texas. After graduation, she plans to go on to graduate school to earn a M.S. in actuarial science and data analytics.

LESLEY VILLAFUERTE '24
Lesley is an English major from Crosby, Texas. After graduation, she plans to further her knowledge of health humanities and go to law school to pursue a career in medical law.
87
UNDERGRADUATE RESEARCH LAUNCH
Explorations: The Texas A&M Undergraduate Journal 114 Henderson Hall, 4233 TAMU College Station, Texas, 77843-4233 United States of America
ISSN 2668-7525 (print) ISSN 2688-7533 (online)
Copyright © 2022 All rights reserved.
explorations.tamu.edu
