
15 minute read
HOW STRONGLY DO VIRAL PROTEINS LASSO VIRAL DNA?


By Sarah E. Fross ‘22
BACKGROUND
Advertisement
Viral replication typically involves a protein binding to a specific region of viral DNA (vDNA) to assist in DNA replication and other functions associated with viral infection.1 The Epstein-Barr virus (EBV) and Kaposi’s sarcoma-associated herpesvirus (KSHV) can cause epithelial and lymphatic cancers which are prevalent worldwide.2 Most often, these viruses are not metabolically active and thus hard to detect during “latency phases.”3 However, the EBV Nuclear Antigen (EBNA1) and KSHV Latency-Associated Nuclear Antigen (LANA) are still active throughout the latency phases. Both EBNA1 and LANA cause cancer by binding to vDNA, increasing cell proliferation and vDNA replication, inhibiting cell-programmed death, and making the infected cell undetectable to the immune system.4,5
EBNA1 has a role in all activity of EBV’s latency phases, making it an appealing target for developing a treatment to combat EBV, as LANA is for KSHV. This study compared the EBNA1 relative binding free energy (RBFE) against the LANA RBFE obtained through all-atom molecular dynamics (MD) simulations. RBFE describes the energy required to create binding interactions, and this study focused on those of viral protein-DNA complexes. With the calculation of the RBFE for EBNA1 and LANA, we hoped this could be used for inhibitor development to stop proteins like EBNA1 from binding to vDNAs and provide a preventative treatment for the cancers they cause. Specifically, ligands with RBFE values similar to that of either EBNA1 or LANA upon binding to vDNA could be used as protein-inhibitors.6 Normally, these inhibitors would be discovered through high-throughput screening where up to millions of molecules of varying structure are ...WE HOPED THIS COULD
BE USED FOR INHIBITOR
DEVELOPMENT TO STOP
PROTEINS LIKE EBNA1 FROM
BINDING TO VDNAS AND
PROVIDE A PREVENTATIVE TREATMENT FOR THE CANCERS THEY CAUSE. tested to find the most functional drug.7 By forgoing these trial-and-error binding experiments, binding affinity studies such as MD analyses can streamline drug development to lower material and time costs.8 To perform these analyses, we studied the thermodynamic and structural properties of EBNA1 and LANA.
METHODS
MD simulations were performed using the Texas A&M University High Performance Research Computing (TAMU HPRC) and molecular modeling softwares, namely CHARMM and OpenMM (OMM). The viral protein-DNA complexes were obtained from Figure 1. Structure of Viral Protein, vDNA, and Protein-vDNA complexes. A) EBNA1. B) EBNA1-vDNAEBV complex. C) vDNAEBV . D) LANA. E) LANA-vDNAKSHV complex. F) vDNAKSHV .
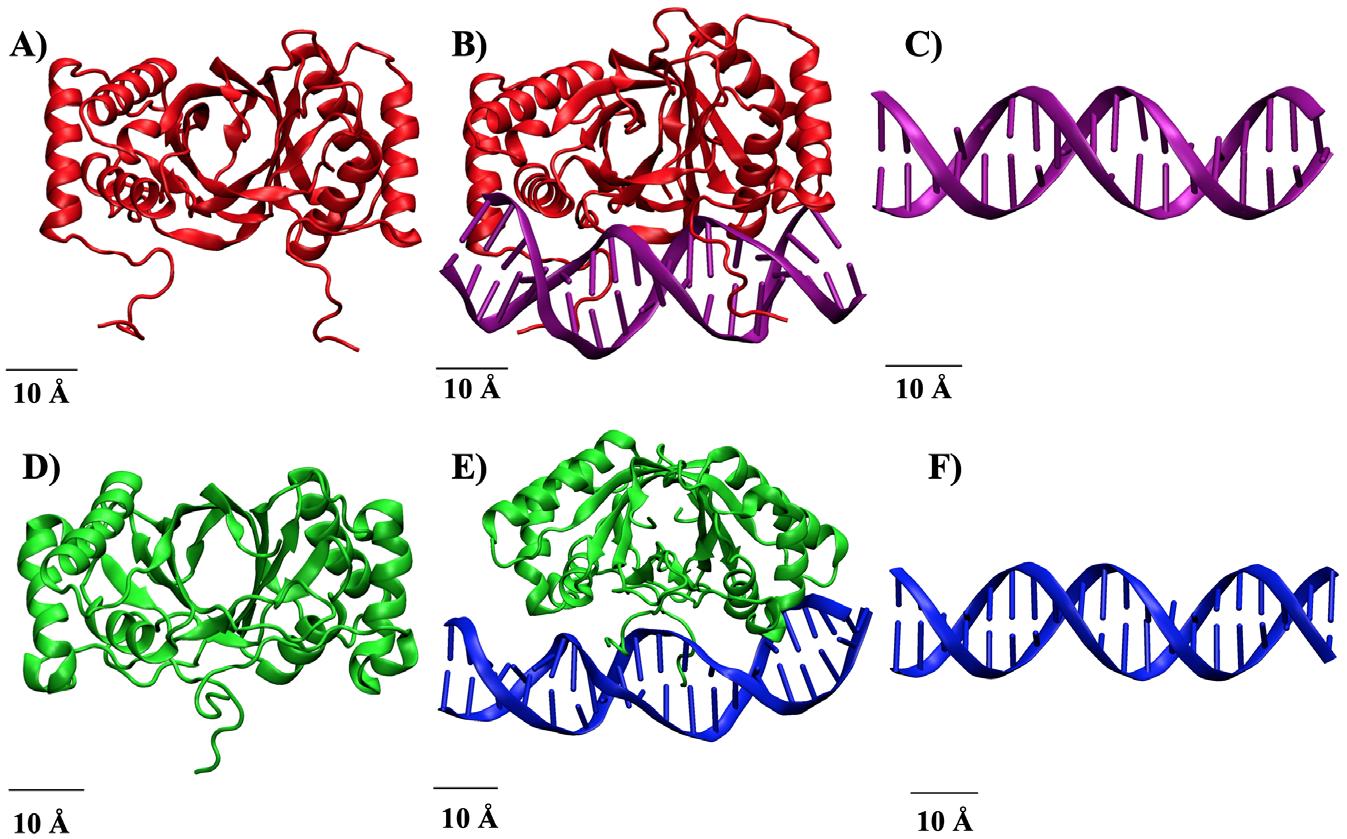
the RCSB Protein Database and the respective vDNA strands for EBV and KSHV were constructed using software specific to modeling DNA.9 The structures were then allowed to reach a more stable, lower energy conformation. The resultant structures are shown in Figure 1.
To simulate physiological conditions, water molecules were added to surround the structure in the same fashion as Hwang et al. to allow for the thermal fluctuations that influence the microscopic movement of all other molecular structures.10 The atomic scale is reported in Angstroms (Å); 1 Å is equal to 0.1 nanometers. Each structure was placed in a cubic box that had faces at least 12 Å away from the structure’s atoms. The 12 Å distance was chosen as the cutoff distance to prevent nonbonded interactions between the molecule and water or another molecule. If the oxygen in a water molecule was within 2.8 Å of a structure’s heavy atoms (like carbon or phosphorus), that water molecule was removed to avoid overlapping. Sodium and chloride ions were then added to neutralize the structures inside the water boxes to achieve a total concentration of approximately 50 mM of ions. Neutralization is meant to achieve physiological conditions as molecules can have inherent overall charges, which are balanced to no charge when present in cytoplasm or blood serum. Additionally, ion concentrations within the box were meant to represent the charges within cells and blood serum. An example of a neutralized EBNA1 structure is shown in Figure 2.
The structures were then forced to enter their most stable conformations with energy minimization of the water molecules, ions, and main structures according to Hwang et al.11 This involved adding, then slowly decreasing, constraints following harmonic trends to allow for free motion. The structures were then heated from 30 Kelvin to 300 Kelvin and the structures were allowed to reach equilibrium.
Lastly, the structures were prepared for the simulations with light constraints on the backbone carbon atoms in the proteins and phosphorous atoms in the vDNA for 2 nanoseconds (ns). Initial simulations of the DNA revealed a tendency for DNA denaturing or “fraying.”12 The hydrogen bonds between the terminal nucleic acids would break and allow for successive breakage of bonds down the DNA. To combat this, distance restraints were placed on the terminal hydrogen-binding atoms involved to keep each atom at a maximum of 2.4 Å away from each other and promote binding. This would also replicate physiological conditions because vDNA is a continuous circular strand as an episome. Restraints followed Hooke’s law to allow the atoms to oscillate given a defined spring constant specific to the atom type. Finally, the covalent bond lengths for hydrogen atoms were set using the SHAKE CHARMM method similar to Hwang et al.13 All structures were then transferred to TAMU HPRC to perform the simulations with OMM. Positional coordinates throughout the simulations were saved every 20 picoseconds using the domain decomposition CHARMM method and all systems lasted for 200 ns with 10,000 total frames.
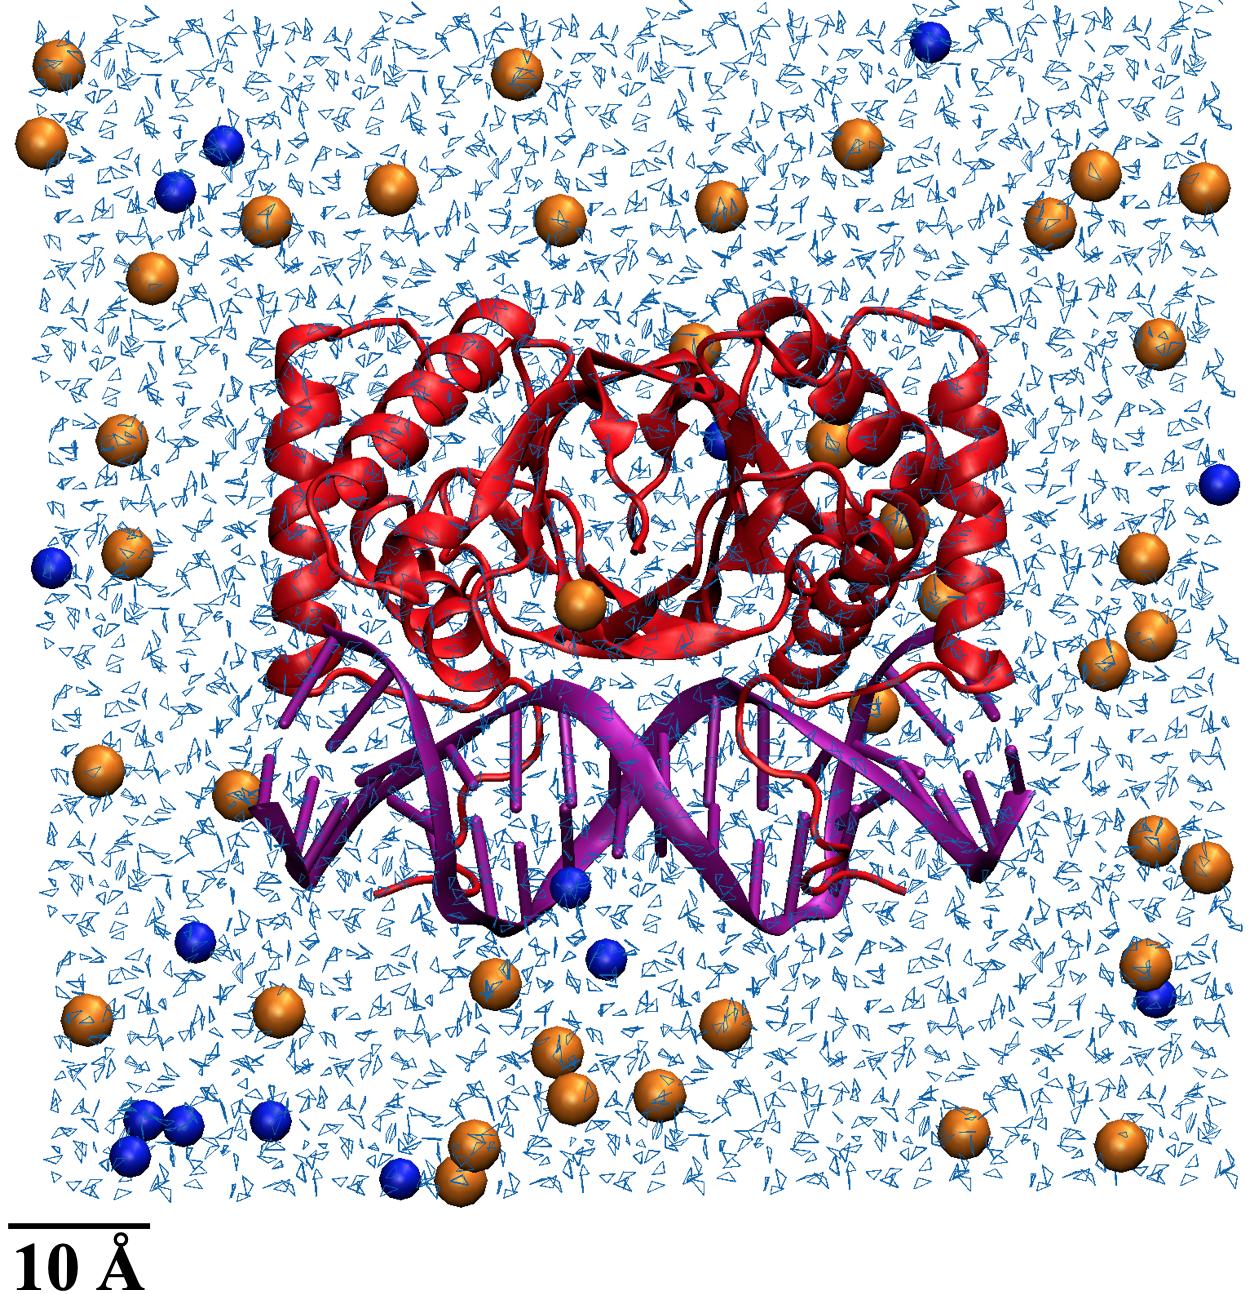
Figure 2. EBNA1 structure neutralized in a water box. EBNA1 is shown in red and vDNA in purple, light blue lines are water molecules, and orange and blue spheres are Na+ and Cl- ions respectively.
RESULTS
The noncovalent interactions between the atoms in the protein-vDNA complexes, including hydrogen bonds and nonpolar contacts, were calculated
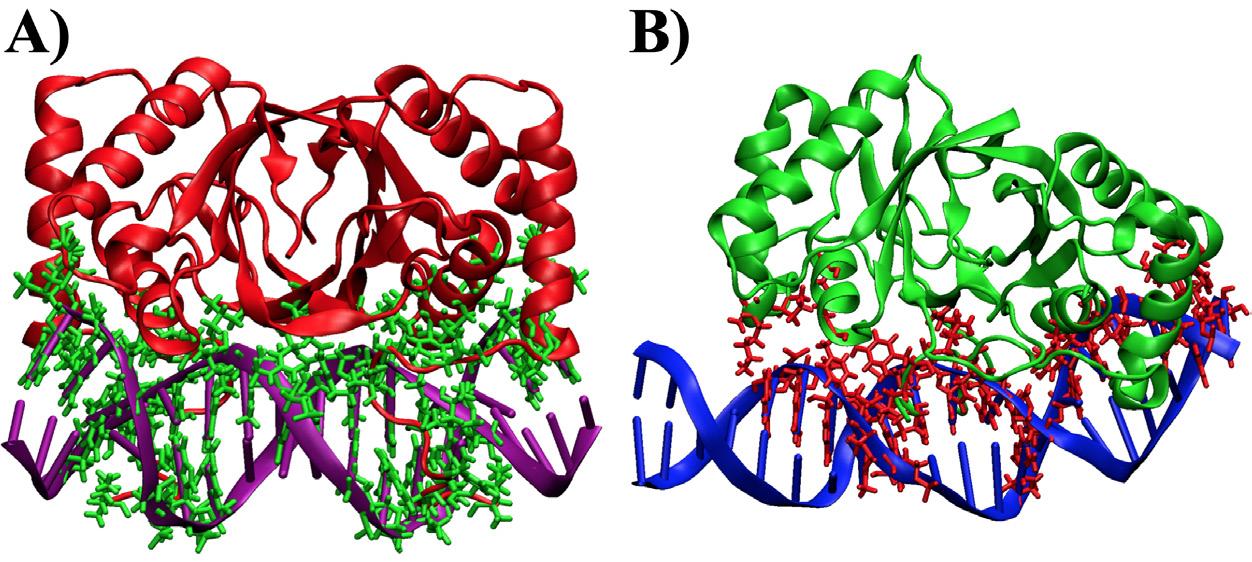
according to CHARMM HBOND and previous developments by Brooks et al.14 The hydrogen and nonpolar binding events throughout the simulation found EBNA1 created a larger total number of noncovalent contacts compared to LANA. Specifically, EBNA1 had 31 different hydrogen bonds and 32 nonpolar contacts while LANA had 14 hydrogen bonds and 17 nonpolar contacts. In total, EBNA1 had at most 63 bonds while LANA only had 31 bonds, which leads to the hypothesis that EBNA1 requires more RBFE. Both the hydrogen and nonpolar interactions are shown in Figure 3 in contrasting-colored ‘sticks,’ where the difference in bond number is apparent.
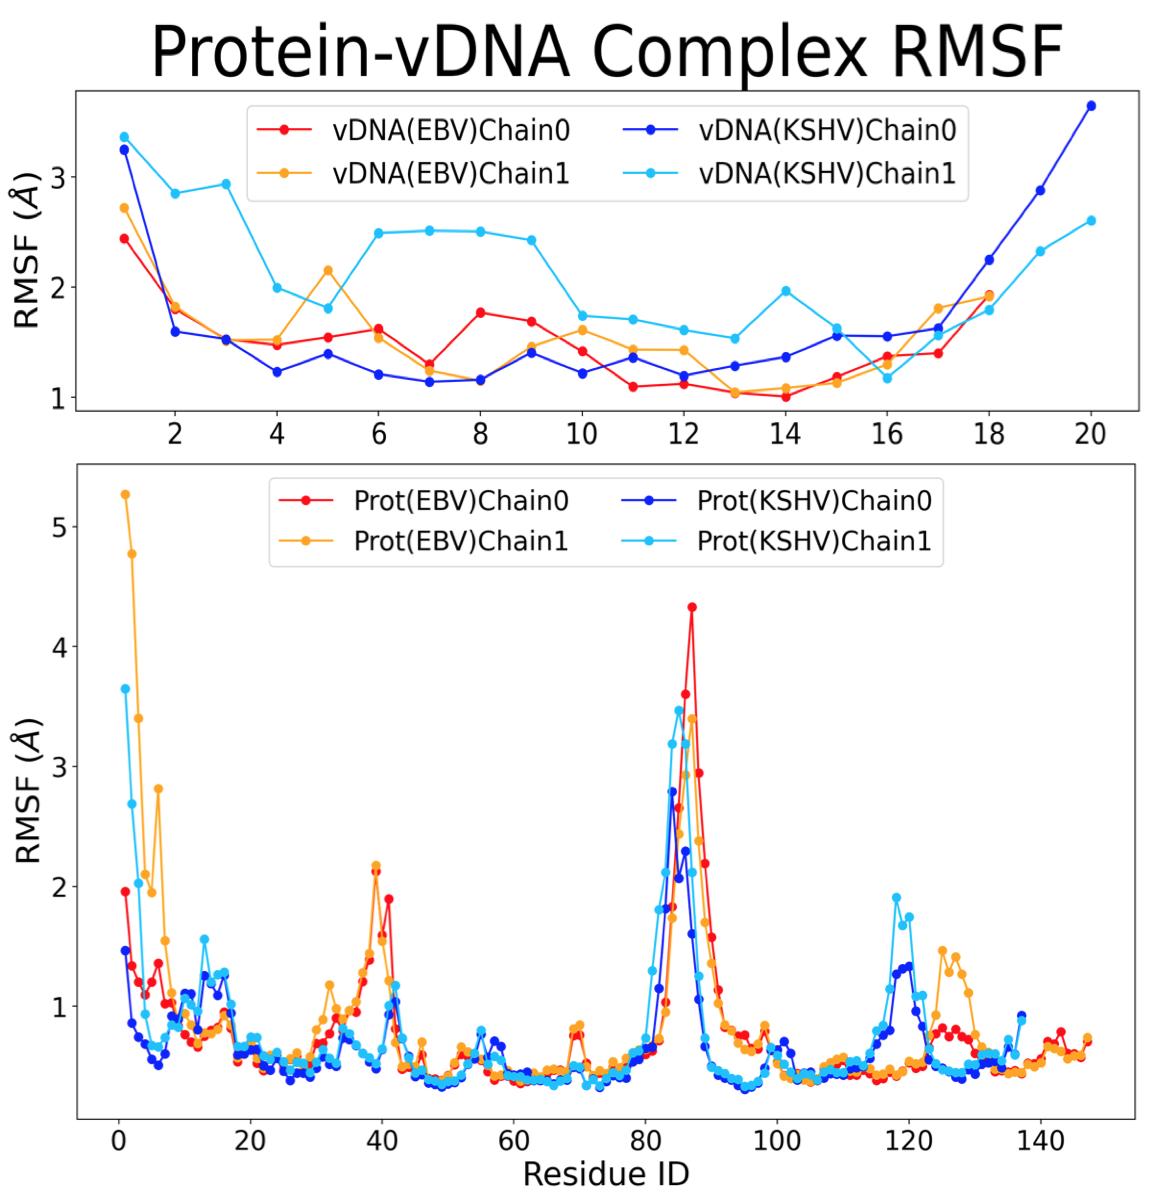
The root-mean-square fluctuation (RMSF) calculation was performed to determine which amino and nucleic acids (residues) were the most mobile relative to the reference structure. The more mobile structures will have a higher RMSF because they are not bound. The combined RMSF of the proteins and vDNAs from the two complexes can be seen in Figure 4, with peaks at ranges of residues where there is increased mobility and thus fewer bonds.
The root-mean-square deviation (RMSD) was calculated to find the deviation of the entire structure versus the original structure over time. Protein residues with a RMSF above 1 Å and vDNA residues with a RMSF above 2 Å were ignored for the RMSD calculation to avoid excessive noise from highly-mobile regions in the structure. The resultant RMSD plot of all structures excluding the highly mobile residues is shown in Figure 5, comparing the RMSD of the protein and vDNA chains from the EBNA1 and LANA complexes. On average, the vDNA chains deviated 3.66 ± 0.43 Å whereas the protein chains deviated 0.68 ± 0.06 Å. This difference in movement in space can be attributed to the number of binding interactions present. The binding of the vDNA by the protein can determine if the vDNA has the ability to deviate in position. Al-
Figure 3. Noncovalent contacts that lasted for 40% of the simulation shown as contrasting-colored sticks. A) EBNA1 complex. B) LANA complex.
Figure 4. RMSF of parts of vDNA and protein in EBNA1 and LANA complexes.
though there are more noncovalent bonds for EBNA1 than LANA, the average RMSD of vDNAEBV was higher than that of vDNAKSHV .
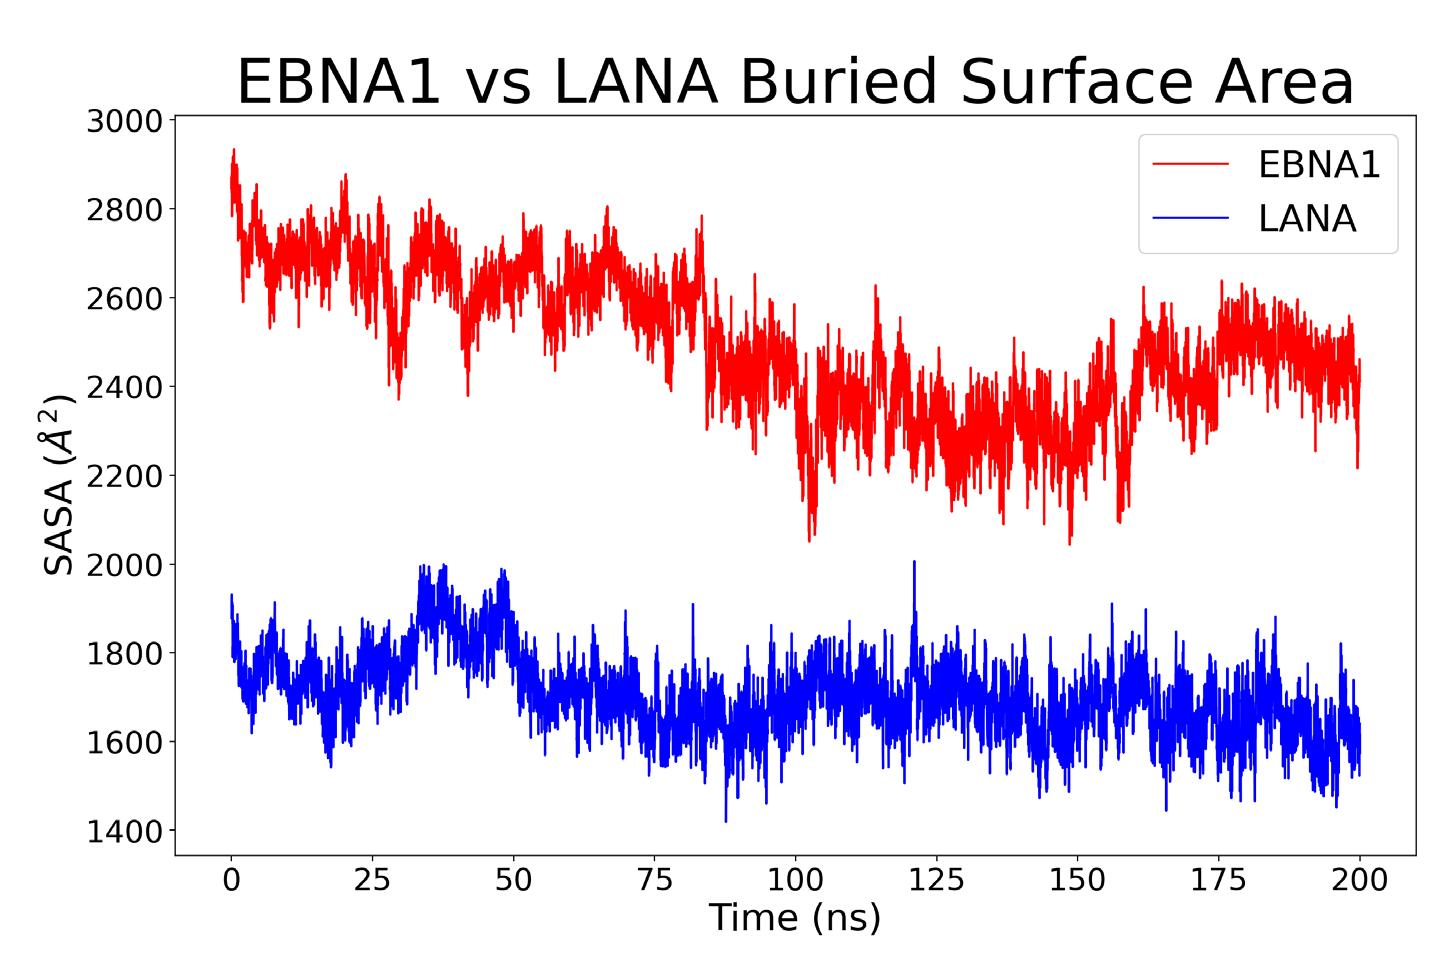
The buried surface area was computed to find the area of each structure that was used for binding. For each complex, the calculation involved adding the outer area of the protein by itself with the outer area of the vDNA by itself, then subtracting the outer area of the complex from the previous sum (Equation 1); where A1 is the outer area of the protein, A2 is the area of the vDNA, and A12 is the shared area of A1 and A2 complex. The expression is halved because the numerator results in twice the complex area, resulting in the change in area of the protein-vDNA complex binding interface. This calculation was repeated for each frame in the simulation and can be seen in Figure 6.
A direct correlation can be made between an increased buried surface area and increased binding energy.15 The average and standard deviation area for the EBNA1 complex for the most stable last 100 ns is 2616.90 ± 107.73 Å2, whereas the LANA area is 1734.74 ± 91.39 Å2 for the last 100ns. According to these values, it can be inferred that the EBNA1 complex has a stronger binding free energy compared to that of the LANA complex.
��������1 +��������2 −��������12 2
Equation 1
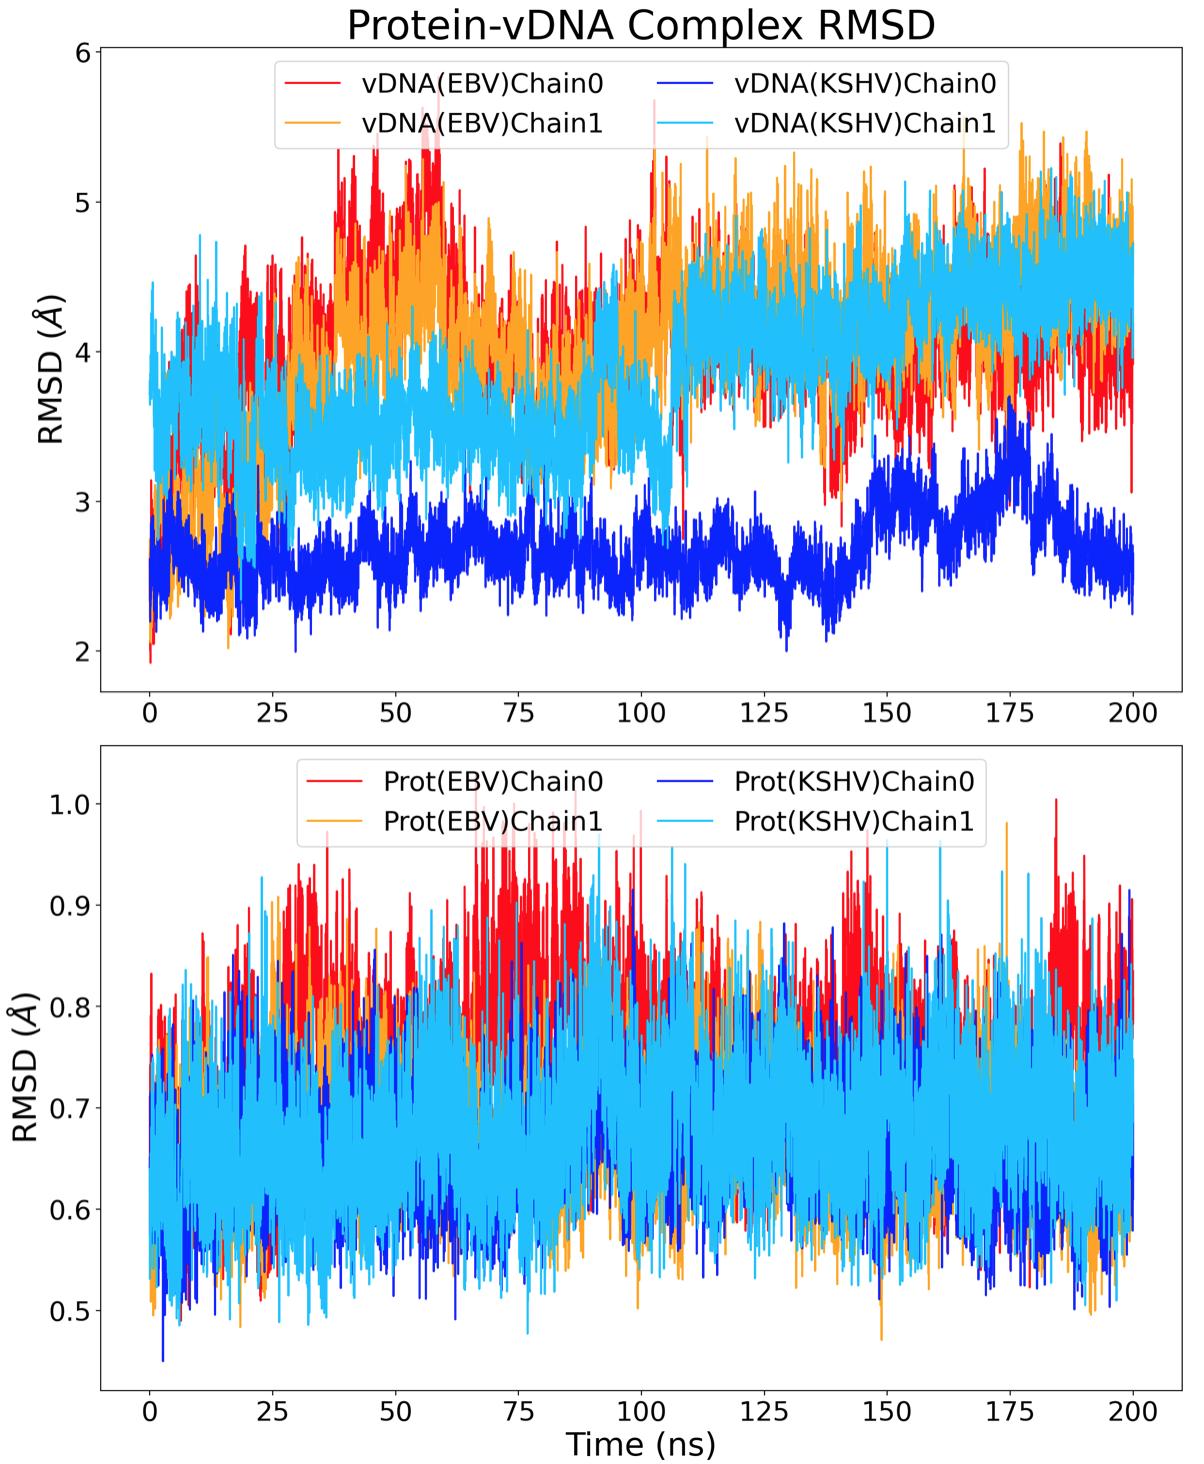
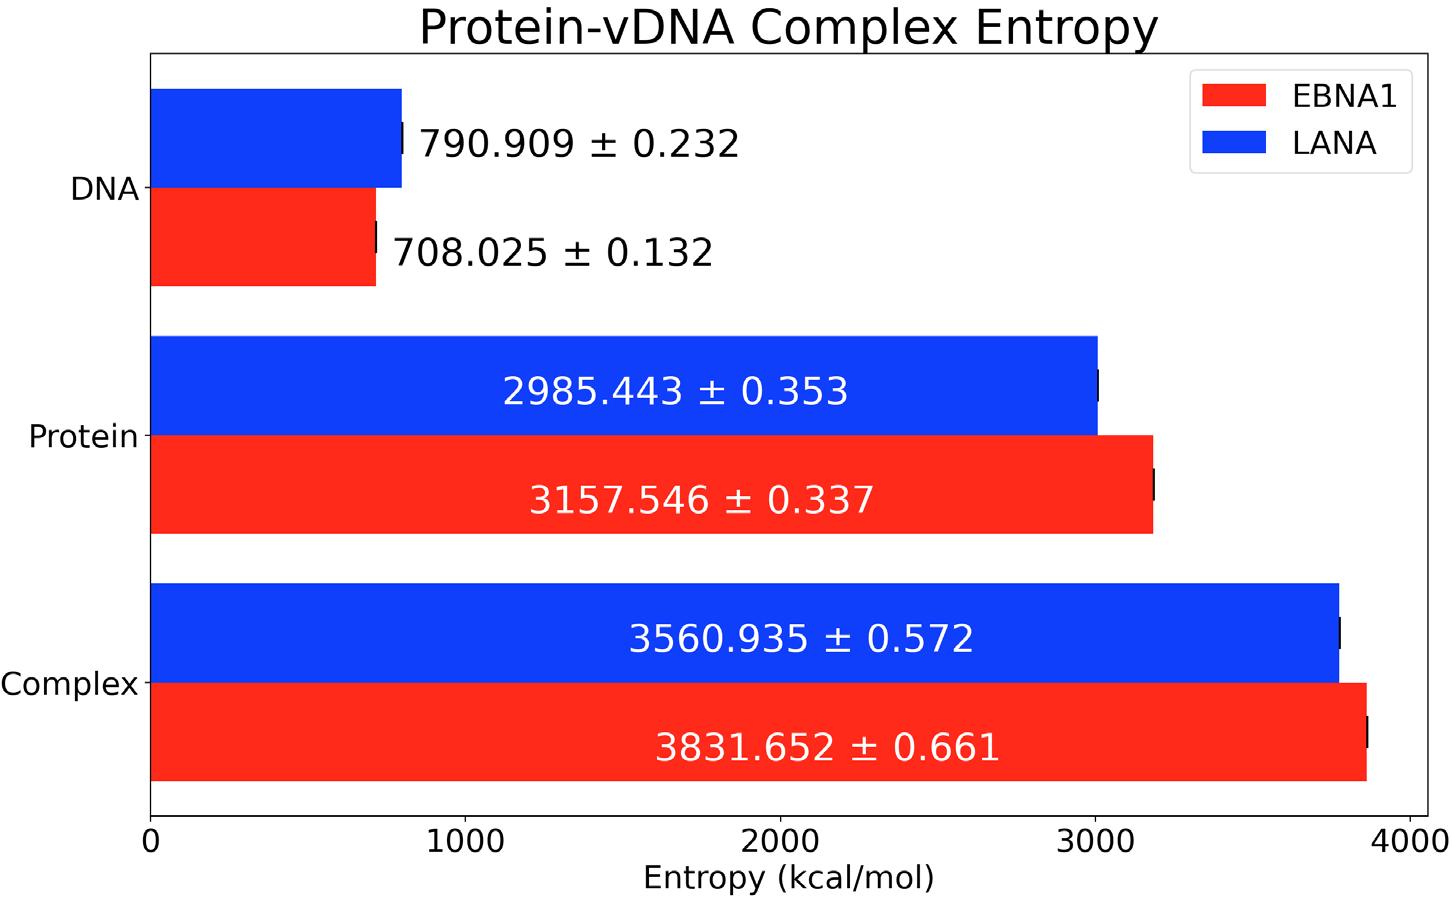
Figure 5. RMSD of whole EBNA1 and LANA structures in space over 200ns. The conformational entropy was found using the method from Shi et al.16 Their study used information theory to relate the random process, which is sidechain dynamics, to a probability distribution of how the structure is able to fluctuate in space.17 The entropy was found by first calculating the dihedral angles of the backbone and sidechain atoms of both the protein and vDNA structures. This calculation finds how much each structure rotates around a specific axis defined by three consecutive bonds and the four atoms involved. To verify the accuracy of these values, the angles throughout the entire simulation were subsampled for five separate entropy calculations. Specifically, every fifth dihedral angle was separated resulting in five 40 ns measurements instead of one 200 ns measurement. From these subsampled trajectories, an average and standard deviation entropy value for each structure was obtained and plotted against the total simulated time, as shown in Figure
7.
of the energy contributions from the van der Waals and electrostatic energies (∆G0 bind),
Figure 6. Buried Surface Area of EBNA1 and LANA protein-vDNA complexes over 200ns. Figure 7 depicts the conformational changes that can occur from the studied structures because of the difference in structure size. For example, the EBNA1 protein has 147 amino acids and an entropy of 3184.229 kcal/mol compared to 137 and 3007.464 kcal/ mol for LANA. Similarly, the vDNAKSHV has 20 nucleic acids and an entropy of 798.504 kcal/mol, while vDNAEBV only has 18 nucleic acids and an entropy of 715.019 kcal/mol. An increase in dihedral rotation around bonds is related to an increase in the number of bonds. This relation can be seen in Figure 3 since the EBNA1 complex creates more bonds between the protein and vDNA. The energy of each structure as well as the solvation energy was calculated to find the relative binding free energy. Negative RBFE values correspond to complexes favoring a bound state. This was done according to the methods in Zoete et al. where the binding free energy is the sum
the difference between the solvation energy of the complex and the sum of the two components (∆Gdesolv), and the difference of the entropy (-T∆S).18 The equation of the differences in solvation energy can be seen in Equation 2, while the binding free energy equation can be seen in Equation 3. The solvation energy used the Generalized Born model for Molecular Volumes (GBMV) and with a Switching function (GBSW) using CHARMM GBMV and GBSW commands.19 The solvation energy terms for the complex, ∆GD, and the monomers, ∆GM , used the calculated GBMV or GBSW for the complex and protein and vDNA from the complex trajectory, respectively. Dissimilar to Equation 2, the difference in entropy is calculated using the conformational entropy values from the complex, sole protein, and sole vDNA simulations.
Figure 7. Conformational Entropy of protein-vDNA complexes, sole proteins, and sole vDNAs.
∆�������������������������������������������������������� =∆���������������������������������������� �������� −(∆���������������������������������������� ��������1 +∆���������������������������������������� ��������2 )
CONCLUSION
Equation 2
∆���������������������������������������� =⟨∆���������������������������������������� 0 ⟩+⟨∆��������������������������������������������������������⟩−⟨��������∆��������⟩
Equation 3
Table 1. GBSW RBFE values for EBNA1 and LANA complexes.
Energy EBNA1 GBSW (kcal/mol) LANA GBSW (kcal/mol) ∆G0 bind -9928.6 ± 225.5 -5788.5 ± 136.0 ∆GM1 solv -6143.9 ± 122.1 -4175.3 ± 104.0 ∆GM2 solv -12278.8 ± 87.3 -14299.8 ± 138.5 ∆GD solv -8756.1 ± 140.0 -12823.4 ± 156.0 -T∆S 37.5 31.64 ∆Gbind -224.6 ± 33.1 -105.2 ± 17.9
The final GBSW RBFE values are tabulated in Table 1, where a more negative value for ∆Gbind can be associated with stronger binding free energy. As shown, the EBNA1 protein-vDNA complex elicited a lower RBFE compared to LANA. The EBNA1 and LANA proteins are responsible for prolonging the longevity of infected host cells and stimulating cancer development. If the binding of these proteins to vDNA was stopped, the virus would not be able to replicate vDNA and inhibit the immune response and apoptosis. The noncovalent interactions, buried surface area, and RBFE analyses support that the EBNA1 protein binds more strongly to vDNAEBV than LANA to vDNAKSHV. According to Hellert et al., EBNA1 attaches to vDNA with specific “linking domains” that are separate from the regions specific to DNA-binding.21 This contrasts with how LANA uses the same region for DNA-binding and DNA tethering. With relation to RBFE, this can explain the lower RBFE of LANA because its binding regions are expended for tethering as well as sequence-specific vDNA-binding. Overall, we hope these calculations could be used for inhibitor development to disrupt the binding of these DNA-binding proteins to vDNA. For future studies, we could perform a docking simulation to visualize the sequence-specific binding.
ACKNOWLEDGEMENTS
We hope the RBFE values of -224.6 ± 33.1 kcal/mol for EBNA1 and -105.2 ± 17.9 kcal/mol for LANA can be used to further inhibitor development for EBV and KSHV, similar to Ancy et al.20 Explicitly, potential inhibitors exhibiting similar RBFE values to those reported here via MD analyses can be assumed to have a similar binding affinity to the EBNA and LANA proteins. I would like to thank my faculty advisor, Dr. Hwang, and my graduate student mentors, Sofiya Bettencourt, James Gonzales, and Jie Shi, for their guidance and support throughout the course of this research. I would also like to thank my family, friends, and the Hwang lab for believing in me and helping me reach new heights. A majority of the molecular dynamic simulations and computations completed herein were made possible from access to Texas A&M High Performance Research Computing.
SUPPLEMENTAL INFORMATION
The QR code gives access to a YouTube video of the simulations performed. Each simulation has been sped up to fit within thirty seconds.
REFERENCES
1. A. M. Edwards, A. Bochkarev, and L. Frappier, “Origin DNA-binding proteins,” Current opinion in structural biology 8, no. 1 (1998): 49–53. https://doi.org/10.1016/S0959440X(98)80009-2.
2. T. Uppal, S. Banerjee, Z. Sun, S. C. Verma, and
E. S. Robertson, “KSHV LANA—the master regulator of KSHV latency,” Viruses 6, no. 12 (2014): 4961–98. https://doi.org/10.3390/ v6124961.
3. C. Shannon-Lowe, A. B. Rickinson, and A. I.
Bell, “Epstein–Barr virus-associated lymphomas,” Philosophical Transactions of the Royal
Society B: Biological Sciences 372, no. 1732 (2017): 20160271. https://doi.org/10.1098/ rstb.2016.0271.
4. Uppal et al., “KSHV LANA,” 4961–98.
5. Shannon-Lowe et al., “Epstein–Barr virus-associated lymphomas,” 20160271. 6. I. Ancy, M. Sivanandam, and P. Kumaradhas,
“Possibility of HIV-1 protease inhibitors-clinical trial drugs as repurposed drugs for SARS-
CoV-2 main protease: a molecular docking, molecular dynamics and binding free energy simulation study,” Journal of Biomolecular
Structure and Dynamics 39, no. 15 (2021): 5368–75. https://doi.org/10.1080/07391102.20 20.1786459.
7. J. Bajorath, “Integration of virtual and high-throughput screening,” Nature Reviews
Drug Discovery 1, no. 11 (2002): 882–94. https://doi.org/10.1038/nrd941.
8. Gianti et al., “Computational analysis of
EBNA1 ‘druggability’,” 285–303. 9. H. M. Berman et al., “The protein data bank,”
Nucleic acids research 28, no. 1 (2000): 235–42. https://doi.org/10.1093/nar/28.1.235.
10. W. Hwang, R. J. Mallis, M. J. Lang, and E. L.
Reinherz, “The αβTCR mechanosensor exploits dynamic ectodomain allostery to optimize its ligand recognition site,” Proceedings of the National Academy of Sciences 117, no. 35 (2020): 21336–45. https://doi.org/10.1073/ pnas.2005899117.
11. Hwang et al., “The αβTCR mechanosensor,” 21336–45.
12. R. Galindo-Murillo et al., “Assessing the current state of amber force field modifications for
DNA,” Journal of chemical theory and computation 12, no. 8 (2016): 4114–27. https://doi. org/10.1021/acs.jctc.6b00186.
13. Hwang et al., “The αβTCR mechanosensor,” 21336–45.
14. B. R. Brooks et al., “CHARMM: the biomolecular simulation program,” Journal of computational chemistry 30, no. 10 (2009): 1545–614. https://doi.org/10.1002/jcc.21287.
15. W. Hwang, M. J. Lang, and M. Karplus,
“Kinesin motility is driven by subdomain dynamics,” Elife 6, (2017): e28948. https://doi.
org/10.7554/eLife.28948.001 .
16. J. Shi, Q. Shen, J.-H. Cho, and W. Hwang, “Entropy hotspots for the binding of intrinsically disordered ligands to a receptor domain,” Biophysical journal 118, no. 10 (2020): 2502–12. https://doi.org/10.1016/j.bpj.2020.03.026.
17. B. M. King, N. W. Silver, and B. Tidor, “Efficient Calculation of Molecular Configurational
Entropies Using an Information Theoretic Approximation,” The Journal of Physical Chemistry B 116, no. 9 (2012): 2891–904. https://doi. org/10.1021/jp2068123.
18. V. Zoete, M. Meuwly, and M. Karplus, “Study of the insulin dimerization: binding free energy calculations and per‐residue free energy decomposition,” Proteins: Structure, Function, and Bioinformatics 61, no. 1 (2005): 79–93. https://doi.org/10.1002/jcc.21287.
19. M. S. Lee, F. R. Salsbury Jr, and C. L. Brooks
III, “Novel generalized Born methods,” The
Journal of chemical physics 116, no. 24 (2002): 10606–14. https://doi.org/10.1063/1.1480013.
20. Ancy et al., “Possibility of HIV-1 protease inhibitors,” 5368–75.
21. J. Hellert et al., “A structural basis for
BRD2/4-mediated host chromatin interaction and oligomer assembly of Kaposi sarcoma-associated herpesvirus and murine gammaherpesvirus LANA proteins,” PLoS pathogens 9, no. 10 (2013): e1003640. https://doi.org/10.1371/ journal.ppat.1003640.

SARAH E. FROSS ‘22
Sarah E. Fross ‘22 is a Biomedical Engineering major originally from Magnolia, Texas but currently calls Conroe, Texas home. While living in Western Australia, she visited the Harry Perkins Institute of Medical Research and has since been fascinated with cancer research. She plans on pursuing a Ph.D. degree in Infectious Disease after graduation with the hopes of developing vaccines.