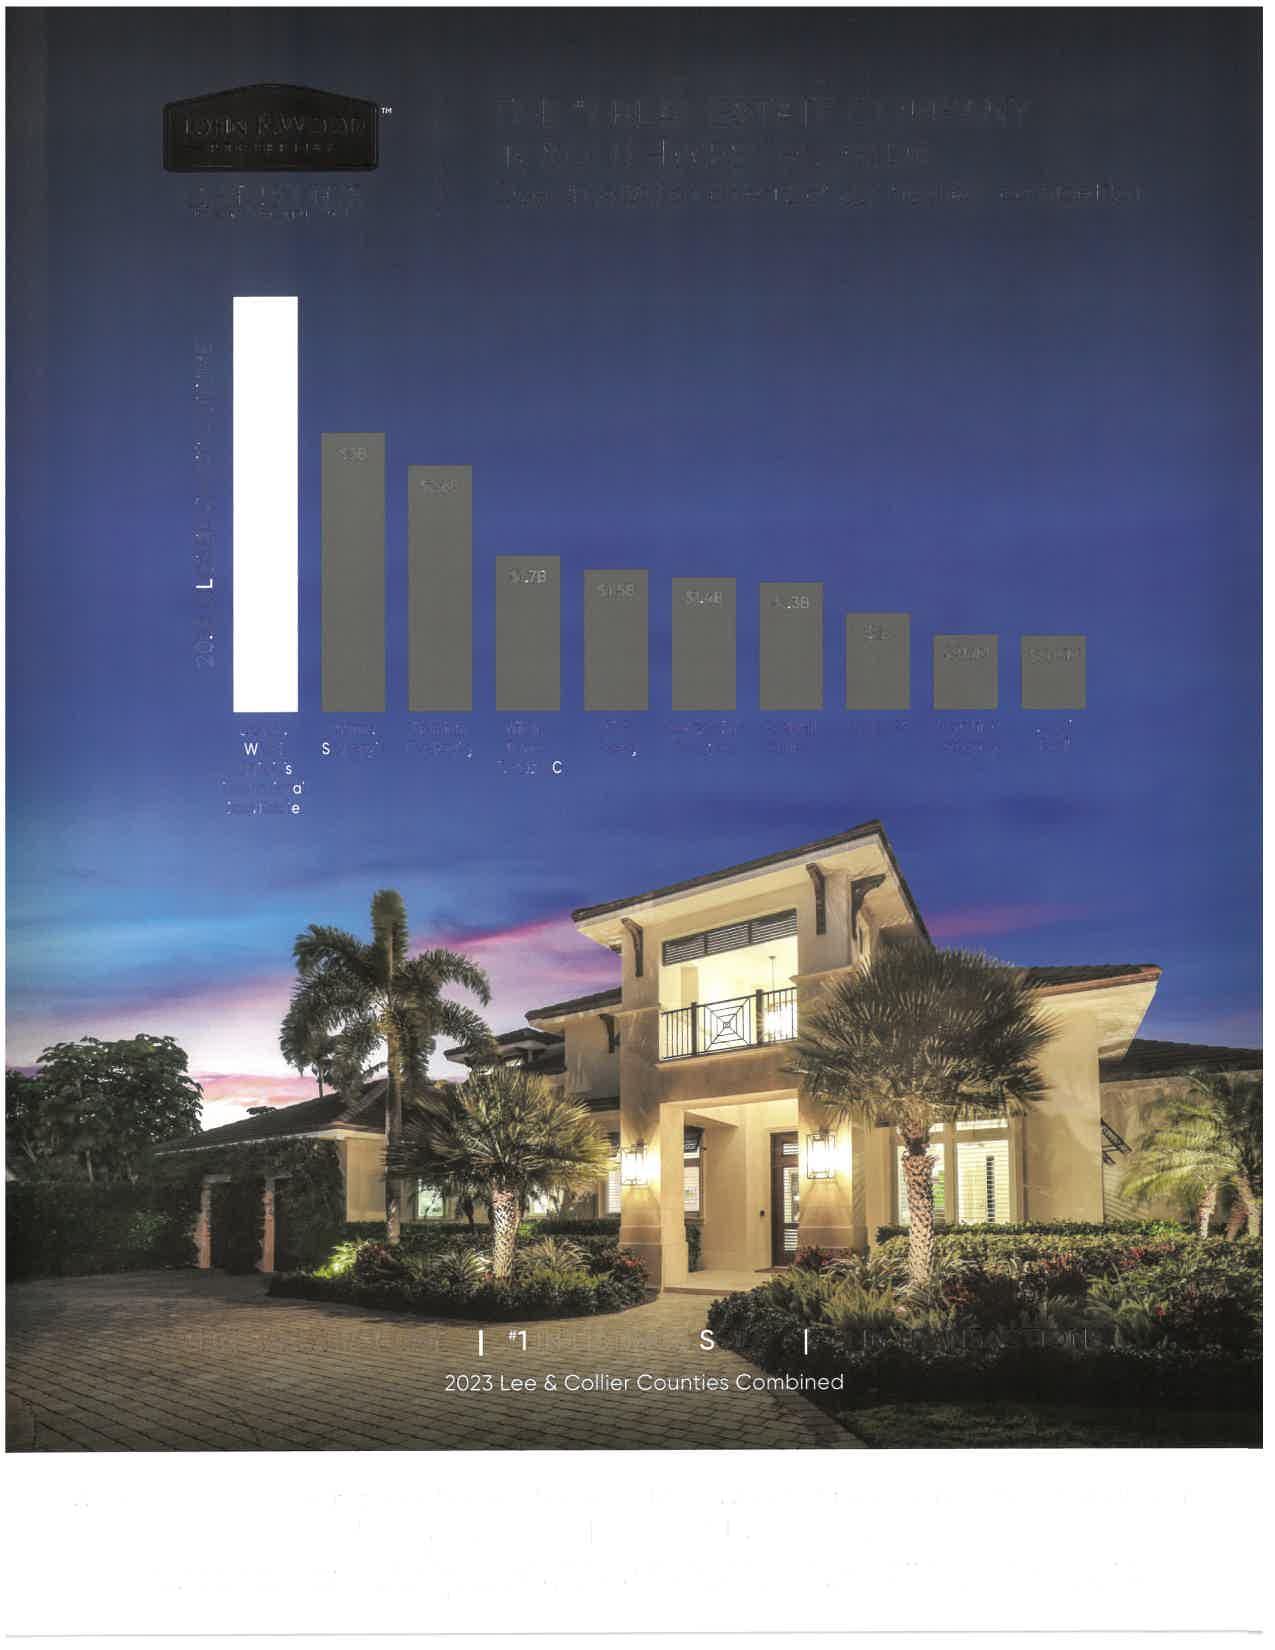
What is the value of my home?
That is an interesting question. It cannot be answered by any computer model. It takes knowledge.
This is what our realtors have and can share with you. Each case is different. We look at a combination of the following:
• What is the lot worth?
• What was the value before the fact appreciation of the COVID years (2019)
• What was the value before Hurricane Ian struck Southwest Florida (2022)
• What are the current supply and demand market trends? (More info on the next few pages)
We look at all these factors to triangulate…

04
Tania Agathos, PA - Broker Associate 239.292.2131 https://www.livinglifeinswfl.com/
Do I need flood insurance?
HOW DO I FIND A PROPERTY WHERE I DON’T NEED FLOOD INSURANCE?
They used to say east of 41 was a good bet. But if you look at the map, you will see flood areas east of 41. You can find the flood zone of properties you are interested in. If you are buying, use an As-Is contract, get a quote for insurance within your Due Diligence Period. If it is too high, you can cancel or renegotiate.
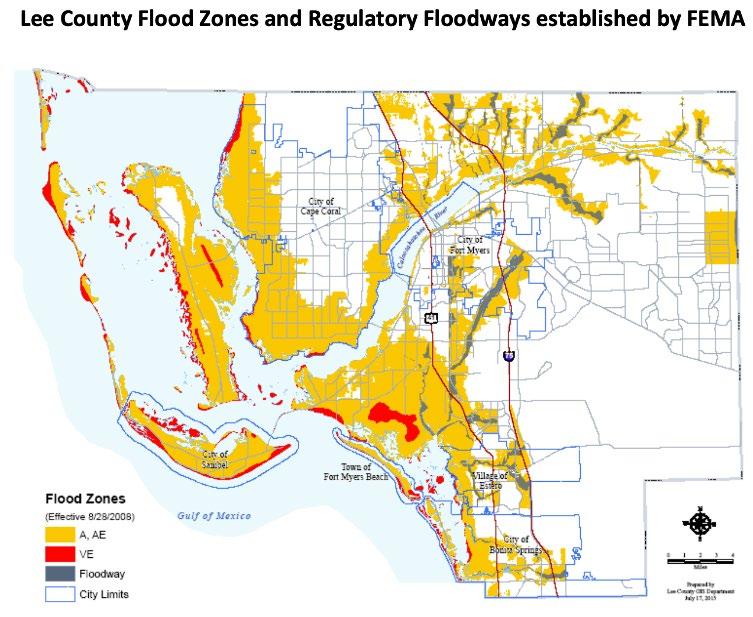
ZONES:
High risk zones
Mandatory flood insurance purchase requirements.
You can find your flood zone by visiting:
www.msc.fema.gov/portal/home
Find on the map what your zone is, then determine if you are in a flood zone and will need insurance.
A, AE, A1-30, AH, AO, AR, A99, V, VE, V1-30 Areas subject to inundation by the 1-percent-annual-chance flood event generally determined using approximate methodologies.
Moderate risk zones
Non-mandatory flood insurance purchase requirements
X (SHADED), B
An area of minimal flood hazard that is determined to be outside the Special Flood Hazard Area and higher than the elevation of the 0.2-percent-annualchance (or 500-year) flood.
Low-risk zones
Non-mandatory flood insurance purchase requirements.
X (UNSHADED), C
An area of minimal flood hazard that is determined to be outside the Special Flood Hazard Area and higher than the elevation of the 0.2-percent-annualchance (or 500-year) flood.
05
Tania Agathos, PA - Broker Associate 239.292.2131 https://www.livinglifeinswfl.com/

Fort Myers Cape Coral FMB Sanibel Captiva Pine Island Total Units 2024 1089 1330 68 68 7 66 2628 2023 1230 1333 106 129 8 49 2855 % Difference -11 5% -+0% -35 8% -47 3% + - 0% +26% -8% Total Unit Difference (Condo & Homes ) March 2024 vs 2023 Fort Myers Cape Coral FMB Sanibel Captiva Pine Island Total Volume 2024 $565,040,504 $655,558,776 $53,910,620 $91,689,900 $15,130,000 $43,651,379 $1,424,981,179 2023 $595,760,237 $646,197,482 $86,524,880 $135,956,300 $20,524,000 $26,104,200 $1,511,067,099 % Difference -5 2% +1 4% -37 7% -32 6%% -26 3% +40 2% -5 7% Total Volume Difference (Condo & Homes ) March 2024 vs 2023 06
City 2020 2021 2022 2023 2024 Sanibel 191 35 17 134 186 Cap�va 47 16 6 8 22 Fort Myers 932 194 187 542 999 Ft Myers Beach 102 26 44 97 101 Cape Coral 1068 267 360 873 1604 Pine Island 33 88 180 RESIDENTIAL INVENTORY LAST 5 YEARS IN APRIL City 2020 2021 2022 2023 2024 Sanibel 31 59 27 40 39 Cap�va 1 13 4 2 1 Fort Myers 268 537 398 300 321 Ft Myers Beach 11 32 33 37 13 Cape Coral 408 734 572 476 410 Pine Island 44 38 20 RESIDENTIAL PENDING LAST 5 YEARS IN APRIL 07
City 2020 2021 2022 2023 2024 Sanibel 121 47 18 65 105 Cap�va 44 9 2 5 30 Fort Myers 1084 195 166 667 1497 Ft Myers Beach 169 55 40 107 190 Cape Coral 230 64 52 164 328 Pine Island 3 8 16
INVENTORY LAST 5 YEARS IN APRIL City 2020 2021 2022 2023 2024 Sanibel 17 51 18 10 16 Captiva 5 9 2 2 3 Fort Myers 282 668 443 396 327 Ft Myers Beach 27 72 59 29 27 Cape Coral 50 106 93 64 62 Pine Island 5 3 2
5 YEARS IN APRIL 08
CONDO
CONDO PENDING LAST
CURRENT AND PAST CLOSED SALES BY COMPARATIVE YTD MARKET.
Here are the cities’ closed data with units and volume. Look at the growth and decrease in year-to-year price ranges. One thing is quite evident, the increase in over million-dollar sales compared to the last normal year (2019).
Fort Myers Sales 2024 vs 2023
January 1 to March 31 , Matrix FM 01 -FM 22
Residential and Condo
2024 0-99 100- 199 200- 299 300 -399 400 -599 600- 799 800 - 1M 1M + Total Units 5 92 202 262 278 124 54 72 1089 Volume $443, 500 $15, 121, 663 $50, 734, 099 $90, 874, 540 $134, 873, 693 $84, 592, 500 $48, 451, 100 $139, 949, 409 $565, 040, 504
2023 0-99 100- 199 200- 299 300 -399 400 -599 600 -799 800- 1M 1M + Total Units 5 115 256 305 298 110 57 83 1230 Volume $376, 000 $18, 655, 500 $63, 454, 053 $105, 952, 556 $143, 983, 568 $75, 928, 413 $49, 958, 621 $132, 186, 171 $595, 760, 237 2024 0-99 100-199 200- 299 300 -399 400 -599 600- 799 800- 1M 1M + Total Units 0 0 3 3 21 13 13 15 68 Volume $0 $0 $790, 000 $1, 040, 000 $10, 154, 120 $9, 405, 000 $11, 465, 000 $21, 056, 500 $53, 910, 620
Fort Myers Beach Sales (homes & condos ) 2024 vs 2023
2023 0-99 100-199 200- 299 300-399 400- 599 600- 799 800- 1M 1M + Total Units 0 0 1 7 30 28 18 22 106 Volume 0 $0 $259, 000 $2, 544, 900 $15, 074, 000 $18, 893, 000 $15, 758, 500 $33, 995, 480 $86, 524, 880 09
January 1 to March 31 , Matrix FB 01 – FB 05 Volume & Units
Cape Coral Sales 2024 vs 2023
(homes and condos
2024 0-99 100-199 200- 299 300- 399 400 -599 600 -799 800- 1M 1M + Total Units 0 35 137 496 385 136 67 74 1330 Volume $0 $6, 116, 968 $35, 630, 389 $172, 326, 630 $181, 733, 076 $91, 588, 313 $59, 408, 000 $108, 755, 400 $655, 558, 776
January 1
Volume & Units 2023 0-99 100 -199 200- 299 300-399 400 -599 600 -799 800- 1M 1M + Total Units 0 21 136 510 420 128 52 66 1333 Volume $0 $3, 617, 899 $35, 048, 444 $178, 041, 792 $202, 084, 162 $86, 305, 409 $45, 223, 999 $95, 875, 777 $646, 197, 482 NW 33991 – 163 sales totaling $ 78 , 604 , 524● NE 33990 – 116 sales totaling $ 49 , 384 , 778 SE 33904 – 217 sales totaling $ 115 , 033 , 945● SW 33914 – 268 sales totaling $ 184 , 386 , 948 NW 33991 – 153 sales totaling $ 74 , 025 , 738● NE 33990 – 141 sales totaling $ 61 , 507 , 958 SE 33904 – 229 sales totaling $ 119 , 926 , 354● SW 33914 – 253 sales totaling $ 170 , 292 , 476 2024 0-99 100 -199 200- 299 300-399 400 -599 600-799 800- 1M 1M + Total Units 0 4 3 14 17 11 8 9 66 Volume $0 $656, 194 $790, 000 $5, 076, 000 $8, 875, 000 $7, 298, 560 $6, 830, 625 $14, 125, 000 $43, 651, 379
2023 0-99 100- 199 200- 299 300-399 400-599 600-799 800- 1M 1M + Total Units 0 2 5 8 19 10 4 1 49 Volume $0 $322, 500 $1, 202, 500 $2, 802, 000 $9, 508, 200 $7, 019, 000 $3, 375, 000 $1, 875, 000 $26, 104, 200 10
to March 31 , CC11 –CC45 Matrix
)
Pine Island 2024 vs 2023 sales / volume January 1 to March 31 , Matrix PI01 , PI02 , PI03 Residential and Condo
Sanibel Sales 2024 vs 2023
Captiva Sales 2024 vs 2023
1 to March 31 , Residential - Matrix Volume & Units 2024 0-399 400- 599 600- 799 800- 999 1M – 2M 2M + Total Units 2 4 4 4 25 7 46 Volume $769, 000 $2, 031, 000 $2, 964, 000 $3, 559, 000 $35, 392, 500 $28, 892, 500 $73, 608, 000 2023 0-399 400 -599 600-799 800-999 1M – 2M 2M + Total Units 2 7 30 23 26 5 93 Volume $740, 000 $3, 649, 000 $21, 083, 300 $20, 194, 500 $36, 153, 000 $18, 400, 000 $100, 219, 800
January
1 to March 31 , Residential - Matrix Volume & Units 2024 0-399 400 -599 600-799 800-999 1M – 2M 2M + Total Units 0 0 0 0 0 2 2 Volume $0 $0 0 $0 $0 $8, 125, 000 $8, 125, 000 2023 0-399 400- 599 600- 799 800- 999 1M – 2M 2M + Total Units 0 0 0 0 3 3 6 Volume $0 $0 0 $0 $4, 250, 000 $13, 799, 000 $18, 049, 000 11
January
1 to March 31 ,
-
Volume & Units 2024 0-399 400- 599 600-799 800-999 1M – 2M 2M + Total Units 2 5 5 5 5 0 22 Volume $699, 000 $2, 560, 000 $3, 489, 900 $4, 135, 000 $7, 200, 000 $0 $18, 083, 900 2023 0-399 400 -599 600-799 800- 999 1M – 2M 2M + Total Units 4 7 5 4 13 3 36 Volume $1, 319, 000 $3, 836, 000 $3, 437, 500 $3, 568, 000 $16, 081, 000 $7, 495, 000 $35, 736, 500
1
March 31
Volume & Units 2024 0-399 400 -599 600-799 800- 999 1M – 2M 2M + Total Units 0 1 0 2 1 1 5 Volume $0 $595, 000 $0 $1, 885, 000 $1, 250, 000 $3, 275, 000 $7, 005, 000 2023 0-399 400 -599 600-799 800- 999 1M – 2M 2M + Total Units 0 0 1 0 1 0 2 Volume $0 $0 $675, 000 $0 $1, 800, 000 $0 $2, 475, 000 12
Sanibel Sales 2024 vs 2023 January
Condo
Matrix
Captiva Sales 2024 vs 2023 January
to
, Condos - Matrix
13
14
15
16
Thank you for considering me as your trusted partner in your real estate journey through Southwest Florida. It has been my pleasure to provide you with valuable insights into this diverse and thriving market. Whether you’re ready to embark on your search for the perfect property or simply exploring your options, remember that I am here to offer guidance, support, and expertise every step of the way. Your satisfaction and success are my top priorities, and I am committed to exceeding your expectations as we navigate the exciting world of real estate together. Please don’t hesitate to reach out with any questions or to schedule a consultation. Here’s to finding your slice of paradise in Southwest Florida! Stay Safe, Stay Kind & Stay Connected!
Tania Agathos, PA - Broker Associate 239.292.2131 https://www.livinglifeinswfl.com/ 17