insight LUXURY REPORT Q 2 2023
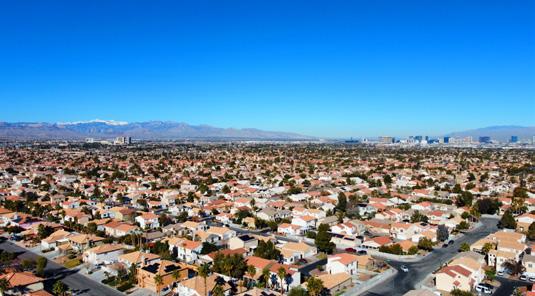
Welcome to Las Vegas Sotheby's International Realty, where we are delighted to share the latest insights on luxury communities in Las Vegas, Henderson, and beyond. Our report combines local real estate expertise with comprehensive market analysis to provide you with valuable trends as they unfold in the region.
In addition to providing general market statistics, we are proud to highlight the significant growth in our city. With new developments and expansions, there are abundant opportunities for our clients to make profitable investments in the future.
As an esteemed international luxury brand with a presence in 81 countries, 1,100 offices, and a network of over 26,000 associates, Sotheby's International Realty offers unparalleled talent and marketing expertise. At Las Vegas Sotheby's International Realty, our priority is to deliver exceptional service, equipping you with the information needed to make well-informed decisions regarding your real estate needs, while ensuring an outstanding client experience.
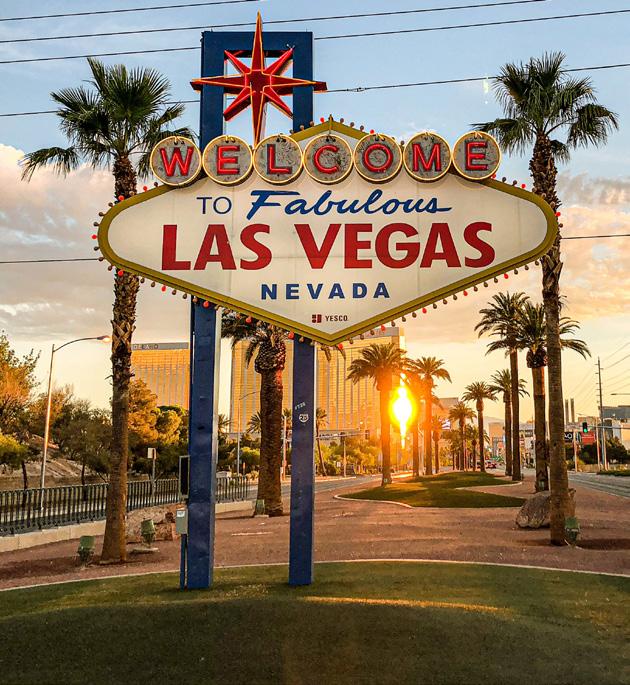
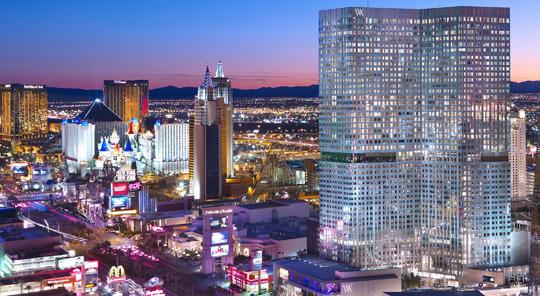
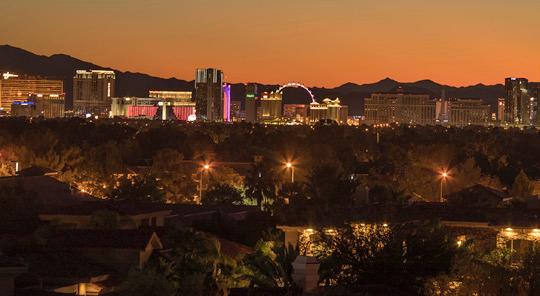
Las Vegas is becoming an absolute powerhouse in the world of sports. Celebrating a triumphant victory, the Las Vegas Golden Knights clinched the Stanley Cup this year. Adding to our Las Vegas pride, we are home to the Raiders and The Aces, both making their mark in their respective leagues. Moreover, the honor of hosting the highly anticipated Super Bowl in 2024 has been entrusted to our vibrant city. Exciting developments lie ahead, including the F1 Las Vegas Grand Prix, the opening of the MSG Sphere, and Fontainebleau Las Vegas luxury hotel and casino. These events will undoubtedly fortify our city's position as a premier destination for luxury living and investment opportunities.
Whether you are interested in learning more about the current market conditions or require representation for selling your home, Las Vegas Sotheby's International Realty is here to assist you. We encourage you to explore this report and reach out to us for a more personalized analysis.
PRESIDENT & BROKER
Randy Char
MANAGING BROKERS
Thomas Marsaw
Robyn Yates-Gajjar
ART DIRECTION
Samantha Krerowicz
Angela Welch
PRESIDENT & BROKER
Las
8548 Rozita Lee Ave, 100, Las Vegas, NV 89113 | 702.360.1414 | insight@lasvegassir.com | lasvegassir.com ABOUT INSIGHT LUXURY REPORT
Las Vegas Sotheby’s International Realty publishes Insight, a luxury market report magazine each quarter. All materials are copyrighted and can not be reprinted or duplicated without permission, including photographs, artwork, designs and text. The publication is distributed without charge to readership throughout Southern Nevada. Additional copies and advertising information can be requested by contacting
Vegas Sotheby’s International Realty.
®,™ and SM are licensed trademarks to Sotheby’s International Realty Affiliates, Inc. An Equal Opportunity Company. Equal Housing Opportunity. Each Office Is Independently Owned And Operated, Except Offices Owned And Operated By NRT Incorporated. If your property is listed with a real estate broker, please disregard. It is not our intention to solicit the offerings of other real estate brokers. We are happy to work with them and cooperate fully. * All information from sources deemed to be reliable although not warranted or guaranteed by or Sotheby’s International Realty® All information from sources deemed to be reliable although not warranted or guaranteed by or Sotheby’s International Realty® Data pulled from MLS as of July 5, 2023. Randy Char

4 SUMMERLIN 10 LAS VEGAS 14 HENDERSON 20 BOULDER CITY 22 VERTICAL VEGAS
SUMMERLIN OVERVIEW: OVER $1 MILLION LAST 13 MONTHS AVERAGE DAYS ON MARKET

4 | LASVEGASSIR.COM
JUN 2022 JUL 2022 AUG 2022 21 29 26 SEP 2022 OCT 2022 NOV 2022 44 59 48 DEC 2022 JAN 2023 FEB 2023 52 68 78 MAR 2023 49 68 49 43 APR 2023 MAY 2023 JUN 2023 $2.5M
$2M $1.5M $1M $500K JUN 2022 JUL 2022 AUG 2022 $2.73M $1.78M $1.70M SEP 2022 OCT 2022 NOV 2022 $1.71M $1.82M $2.46M DEC 2022 JAN 2023 FEB 2023 $2.29M $2.23M $1.67M MAR 2023 $1.77M $2.23M $2.24M $2.13M APR 2023 MAY 2023 JUN 2023 43 20 20 24 22 31 25 27 52 25 60 PROPERTIES SOLD 30 0 JUN 2022 JUL 2022 AUG 2022 SEP 2022 OCT 2022 NOV 2022 DEC 2022 JAN 2023 FEB 2023 MAR 2023 43 40 24 APR 2023 MAY 2023 JUN 2023
AVERAGE SALES PRICE
OVERVIEW: UNDER $1 MILLION LAST 13 MONTHS
Q2 2023 | 5
AVERAGE DAYS ON MARKET JUN 2022 JUL 2022 AUG 2022 18 18 29 SEP 2022 OCT 2022 NOV 2022 36 38 58 DEC 2022 JAN 2023 FEB 2023 55 57 57 MAR 2023 47 57 51 51 APR 2023 MAY 2023 JUN 2023 $650K AVERAGE SALES PRICE $600K $550K $500K $450K JUN 2022 JUL 2022 AUG 2022 $640K $613K $605K SEP 2022 OCT 2022 NOV 2022 $589K $606K $572K DEC 2022 JAN 2023 FEB 2023 $595K $595K $541K MAR 2023 $591K $595K $582K $580K APR 2023 MAY 2023 JUN 2023 144 108 93 93 90 124 95 107 164 115 200 PROPERTIES SOLD 100 0 JUN 2022 JUL 2022 AUG 2022 SEP 2022 OCT 2022 NOV 2022 DEC 2022 JAN 2023 FEB 2023 MAR 2023 177 163 93 APR 2023 MAY 2023 JUN 2023
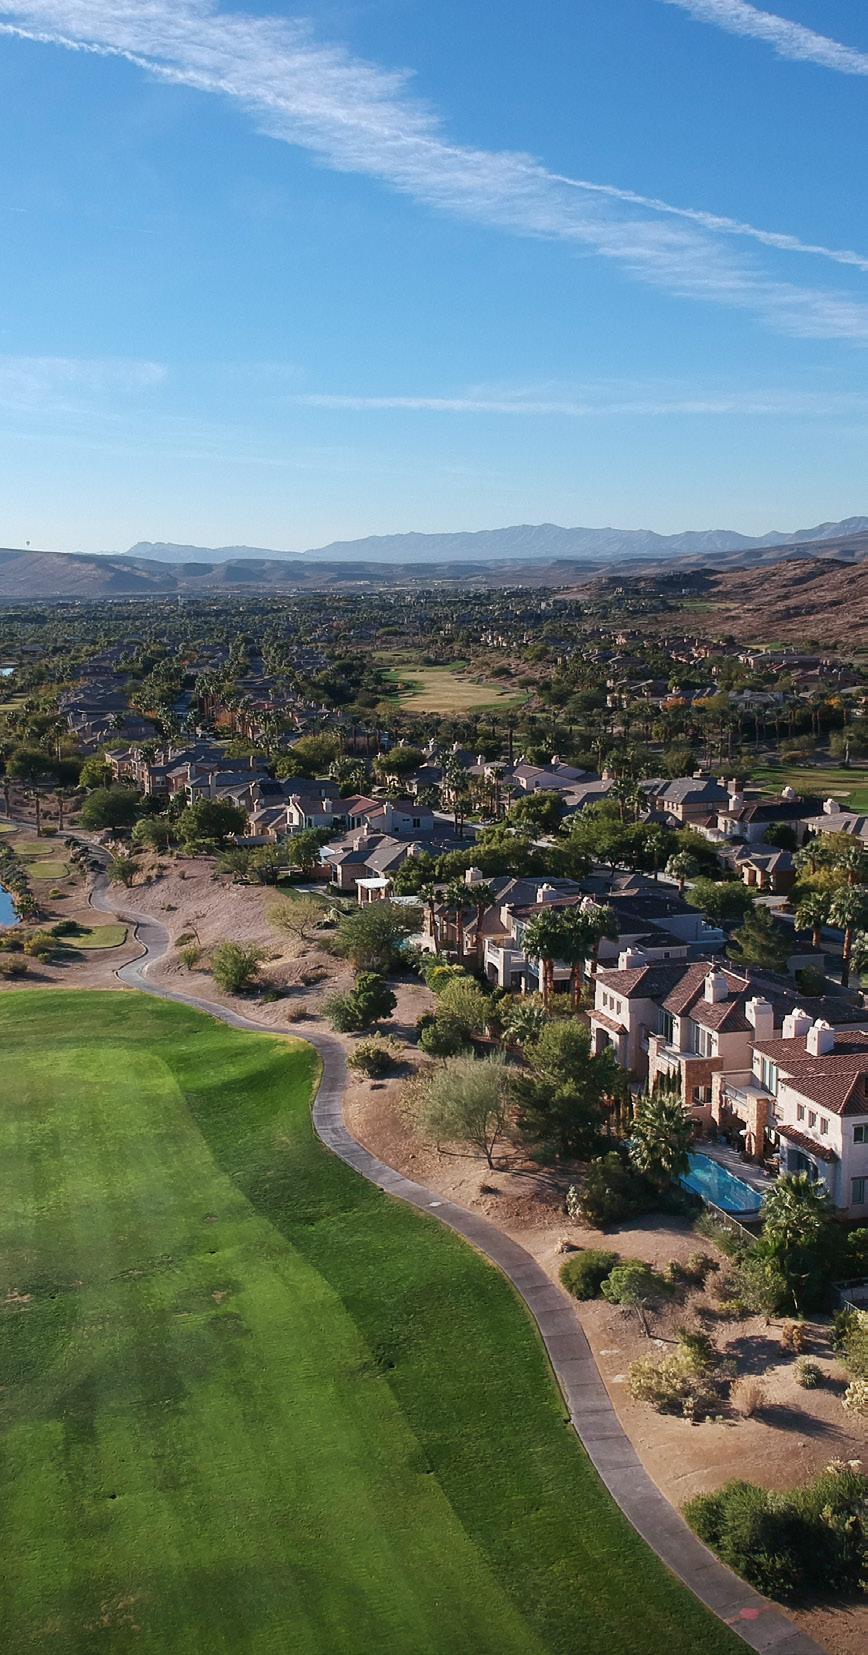
SUMMERLIN
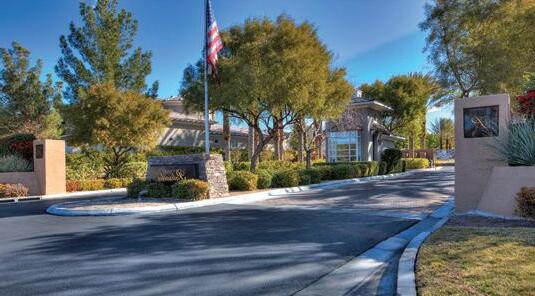
PALISADES
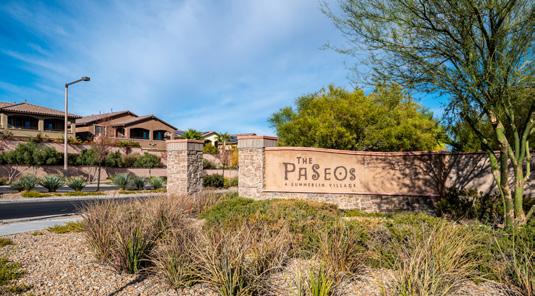
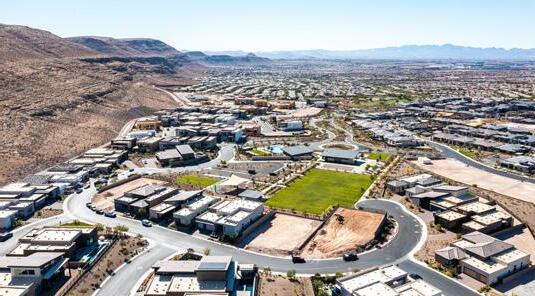

PASEOS
6 | LASVEGASSIR.COM SUMMERLIN COMMUNITIES
# of Transactions Average Sales Price Average Price per SF Average Days on Market 2 4 +100.00% $2,700,000 $2,416,250 -10.51% $476 $482 +1.32% 17 44 +158.82% 2022 2023 CHANGE
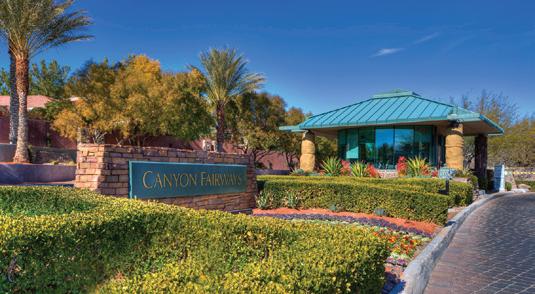
CANYON FAIRWAYS
EAGLE HILLS
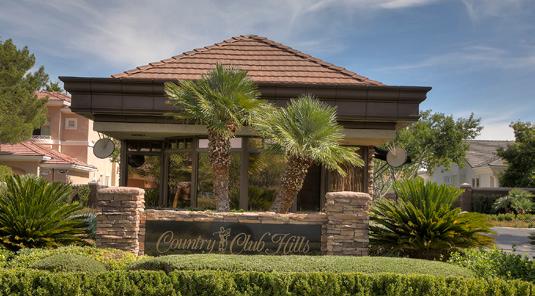
COUNTRY CLUB HILLS
# of Transactions Average Sales Price Average Price per SF Average Days on Market 3 1 -66.67% $2,250,000 $4,800,000 +113.33% $478 $391 -18.19% 3 134 +4,366.67% 2022 2023 CHANGE # of Transactions Average Sales Price Average Price per SF Average Days on Market 1 2 +100.00% $17,500,000 $1,658,075 +90.53% $1,352 $395 -70.75% 144 16 -88.89% 2022 2023 CHANGE # of Transactions Average Sales Price Average Price per SF Average Days on Market 1 6 +500.00% $2,509,185 $2,427,582 -3.25% $569 $581 +2.18% 21 32 +52.38% 2022 2023 CHANGE
MESA RIDGE
# of Transactions Average Sales Price Average Price per SF Average Days on Market 33 25 -24.24% $1,342,633 $1,273,320 -5.16% $399 $373 -6.57% 15 30 +100.00% 2022 2023 CHANGE # of Transactions Average Sales Price Average Price per SF Average Days on Market 2 1 -50.00% $1,950,000 $1,695,000 -13.08% $435 $323 -25.83% 17 94 +452.94% 2022 2023 CHANGE
RED ROCK COUNTRY CLUB
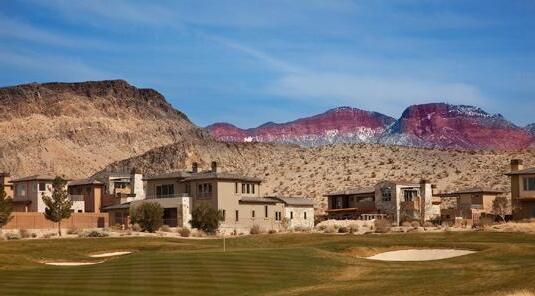
THE RIDGES

Q2 2023 | 7
SIENA # of Transactions Average Sales Price Average Price per SF Average Days on Market 3 3 +-0.00% $1,176,667 $1,235,500 +5.00% $412 $479 +16.31% 4 69 +1,625.00% 2022 2023 CHANGE # of Transactions Average Sales Price Average Price per SF Average Days on Market 6 1 -83.33% $1,422,667 $1,100,000 -22.68% $462 $342 -25.97% 8 95 +1,087.50% 2022 2023 CHANGE # of Transactions Average Sales Price Average Price per SF Average Days on Market 24 10 -58.33% $2,193,125 $1,693,800 -22.77% $531 $472 -11.06% 32 43 +34.38% 2022 2023 CHANGE # of Transactions Average Sales Price Average Price per SF Average Days on Market 3 4 +33.33% $1,483,333 $1,225,000 -17.42% $483 $404 -16.43% 11 55 +400.00% 2022 2023 CHANGE
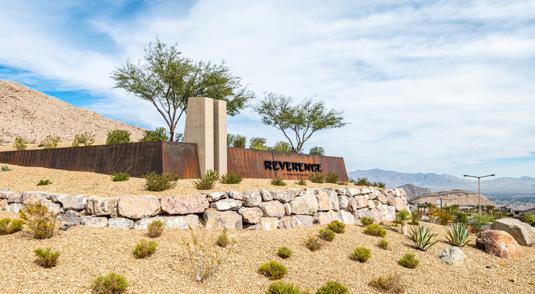
# of Transactions Average Sales Price Average Price per SF Average Days on Market 10 10 +-0.00% $1,683,999 $1,597,580 -5.13% $377 $357 -5.28% 46 35 -23.91% 2022 2023 CHANGE
REVERENCE SUN CITY SUMMERLIN
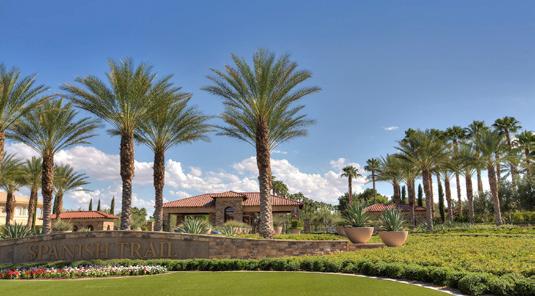
SPANISH TRAILS
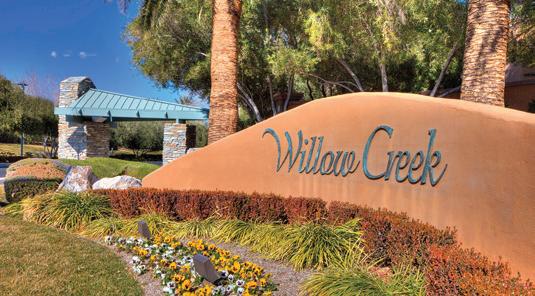
# of Transactions Average Sales Price Average Price per SF Average Days on Market 16 18 +12.50% $4,709,875 $4,678,361 -0.67% $839 $764 -8.91% 23 59 +156.52% 2022 2023 CHANGE
WILLOW CREEK
8 | LASVEGASSIR.COM
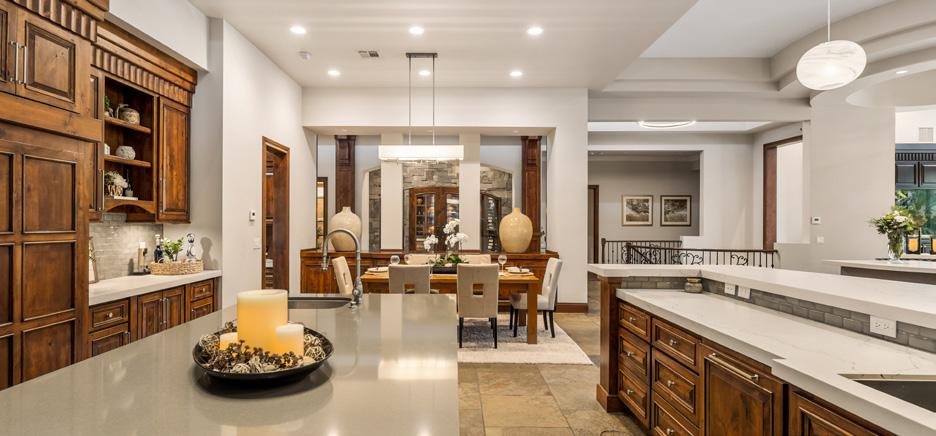
"Sotheby's International Realty is a very clear brand.
I think even as a consumer when you see the sign and you're driving by, you're like 'oh, that must be a nice house'."
SUMMERLIN COMMUNITIES
— Gwyneth Paltrow
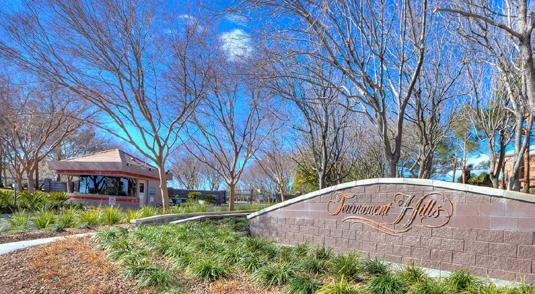
TOURNAMENT
# of Transactions Average Sales Price Average Price per SF Average Days on Market 5 5 +-0.00% $2,092,400 $1,661,000 -20.62% $463 $412 -11.15% 12 53 +341.67% 2022 2023 CHANGE # of Transactions Average Sales Price Average Price per SF Average Days on Market 3 1 -66.67% $4,550,000 $2,050,000 -54.95% $566 $456 -19.36% 140 178 +27.14% 2022 2023 CHANGE
HILLS
$167 Billion USD IN GLOBAL SALES VOLUME IN 2022
48M VISITS TO SOTHEBYSREALTY.COM
#1
MOST PROFILED LUXURY REAL ESTATE BRAND IN THE NEWS WITH OVER 60,000 PRESS PLACEMENTS

Source: Meltwater January 1, 2022 - December 31, 2022
26,000 SALES ASSOCIATES
1,100 OFFICES IN 81 COUNTRIES & TERRITORIES
OVER 1M SOCIAL MEDIA FOLLOWERS 75M VIDEOS PLAYED IN 2022
LAS VEGAS OVERVIEW: OVER $1 MILLION LAST 13 MONTHS
AVERAGE DAYS ON MARKET

10 | LASVEGASSIR.COM
JUN 2022 JUL 2022 AUG 2022 25 35 44 SEP 2022 OCT 2022 NOV 2022 41 53 44 DEC 2022 JAN 2023 FEB 2023 50 60 85 MAR 2023 54 60 54 52 APR 2023 MAY 2023 JUN 2023 $2M AVERAGE SALES PRICE $1.75M $1.5M $1.25M $1M JUN 2022 JUL 2022 AUG 2022 $2.13M $1.53M $1.66M SEP 2022 OCT 2022 NOV 2022 $1.78M $1.85M $1.98M DEC 2022 JAN 2023 FEB 2023 $2.01M $2.01M $1.59M MAR 2023 $1.62M $2.01M $1.87M $1.94M APR 2023 MAY 2023 JUN 2023 100
SOLD 50 0 JUN 2022 JUL 2022 AUG 2022 SEP 2022 OCT 2022 NOV 2022 DEC 2022 JAN 2023 FEB 2023 MAR 2023 92 53 46 50 40 56 69 80 108 58 78 87 50 APR 2023 MAY 2023 JUN 2023
PROPERTIES
LAS VEGAS
OVERVIEW: UNDER $1 MILLION LAST 13 MONTHS
Q2 2023 | 11
AVERAGE DAYS ON MARKET JUN 2022 JUL 2022 AUG 2022 16 17 23 SEP 2022 OCT 2022 NOV 2022 34 36 43 DEC 2022 JAN 2023 FEB 2023 51 54 57 MAR 2023 55 54 41 37 APR 2023 MAY 2023 JUN 2023 $500K AVERAGE SALES PRICE $475K $450K $425K $400K JUN 2022 JUL 2022 AUG 2022 $506K $492K $479K SEP 2022 OCT 2022 NOV 2022 $479K $470K $455K DEC 2022 JAN 2023 FEB 2023 $458K $455K $449K MAR 2023 $460K $455K $474K $477K APR 2023 MAY 2023 JUN 2023 1,451 1,087 923 805 928 1,247 1,037 1,218 1,642 1,236 2,000 PROPERTIES SOLD 1,000 0 JUN 2022 JUL 2022 AUG 2022 SEP 2022 OCT 2022 NOV 2022 DEC 2022 JAN 2023 FEB 2023 MAR 2023 1,356 1,396 805 APR 2023 MAY 2023 JUN 2023
DESERT SHORES
QUEENSRIDGE
SCOTCH 80S
12 | LASVEGASSIR.COM LAS VEGAS COMMUNITIES
# of Transactions Average Sales Price Average Price per SF Average Days on Market 1 1 +-0.00% $1,700,000 $1,550,000 -8.82% $361 $317 -12.16% 72 22 -69.44% 2022 2023 CHANGE # of Transactions Average Sales Price Average Price per SF Average Days on Market 4 4 +-0.00% $1,691,250 $1,736,000 +2.65% $374 $357 -4.45% 17 27 +58.82% 2022 2023 CHANGE
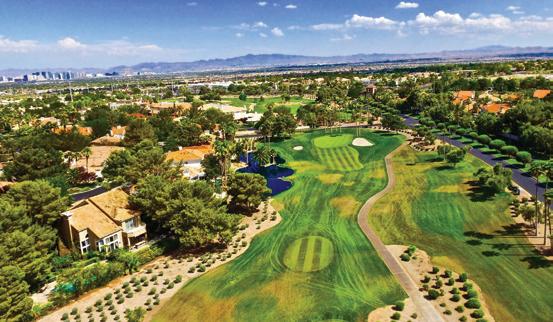
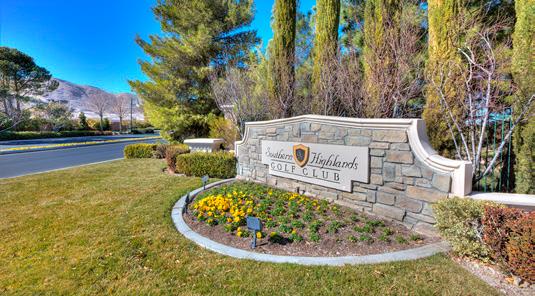
SECTION 10 # of Transactions Average Sales Price Average Price per SF Average Days on Market 6 4 -33.33% $2,545,833 $1,156,250 -54.58% $490 $278 -43.36% 62 25 -59.68% 2022 2023 CHANGE # of Transactions Average Sales Price Average Price per SF Average Days on Market 9 2 -77.78% $1,186,265 $1,735,000 +46.26% $315 $339 +7.68% 32 86 +168.75% 2022 2023 CHANGE # of Transactions Average Sales Price Average Price per SF Average Days on Market 0 1 +100.00% $0 $2,037,500 +100.00% $0 $462 +100.00% 0 138 +100.00% 2022 2023 CHANGE SOUTHERN HIGHLANDS COUNTRY CLUB # of Transactions Average Sales Price Average Price per SF Average Days on Market 24 17 -29.17% $2,012,708 $2,227,647 +10.68% $402 $442 +9.95% 35 48 +37.14% 2022 2023 CHANGE
SPANISH HILLS
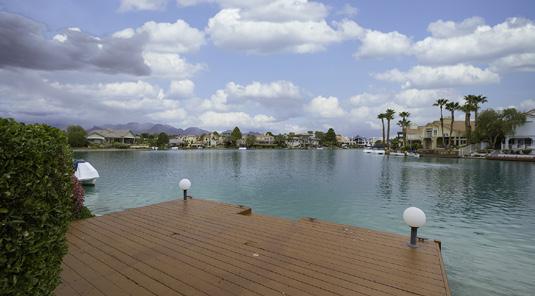
THE LAKES
# of Transactions Average Sales Price Average Price per SF Average Days on Market 3 2 -33.33% $1,325,000 $1,852,500 +39.81% $303 $354 +16.78% 18 147 +716.67% 2022 2023 CHANGE # of Transactions Average Sales Price Average Price per SF Average Days on Market 3 1 -66.67% $3,433,000 $6,250,000 +82.06% $404 $826 +104.20% 33 46 +39.39% 2022 2023 CHANGE
HENDERSON OVERVIEW: OVER $1 MILLION LAST 13 MONTHS AVERAGE DAYS ON MARKET
14 | LASVEGASSIR.COM
JUN 2022 JUL 2022 AUG 2022 38 32 45 SEP 2022 OCT 2022 NOV 2022 58 48 59 DEC 2022 JAN 2023 FEB 2023 24 79 28 MAR 2023 80 79 61 62 APR 2023 MAY 2023 JUN 2023 $2.5M
PRICE $2M $1.5M $1M $500K JUN 2022 JUL 2022 AUG 2022 $2.23M $1.99M $1.70M SEP 2022 OCT 2022 NOV 2022 $1.60M $1.92M $2.52M DEC 2022 JAN 2023 FEB 2023 $2.25M $1.98M $1.68M MAR 2023 $2.32M $1.98M $2.50M $1.60M APR 2023 MAY 2023 JUN 2023 22 29 12 16 22 30 27 26 38 28 50 PROPERTIES SOLD 25 0 JUN 2022 JUL 2022 AUG 2022 SEP 2022 OCT 2022 NOV 2022 DEC 2022 JAN 2023 FEB 2023 MAR 2023 32 43 16 APR 2023 MAY 2023 JUN 2023
AVERAGE SALES
OVERVIEW: UNDER $1 MILLION LAST 13 MONTHS
Q2 2023 | 15
AVERAGE DAYS ON MARKET JUN 2022 JUL 2022 AUG 2022 16 18 23 SEP 2022 OCT 2022 NOV 2022 33 37 41 DEC 2022 JAN 2023 FEB 2023 53 61 59 MAR 2023 55 61 40 36 APR 2023 MAY 2023 JUN 2023 $550K AVERAGE SALES PRICE $500K $450K $400K $350K JUN 2022 JUL 2022 AUG 2022 $547K $536K $511K SEP 2022 OCT 2022 NOV 2022 $535K $529K $530K DEC 2022 JAN 2023 FEB 2023 $496K $502K $505K MAR 2023 $501K $502K $527K $518K APR 2023 MAY 2023 JUN 2023 379 277 264 238 261 346 305 334 399 357 600 PROPERTIES SOLD 400 200 JUN 2022 JUL 2022 AUG 2022 SEP 2022 OCT 2022 NOV 2022 DEC 2022 JAN 2023 FEB 2023 MAR 2023 404 415 238 APR 2023 MAY 2023 JUN 2023
HENDERSON

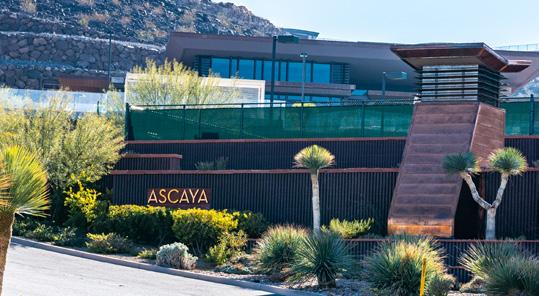
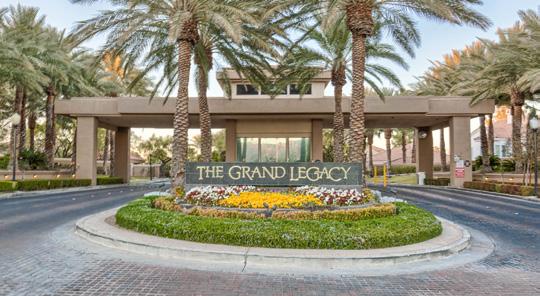
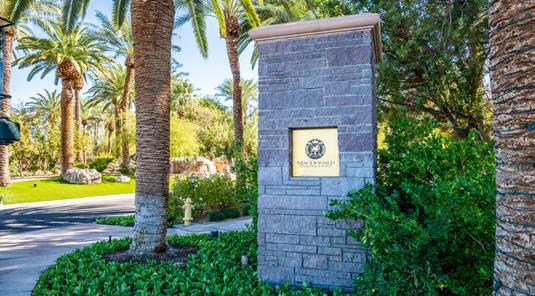

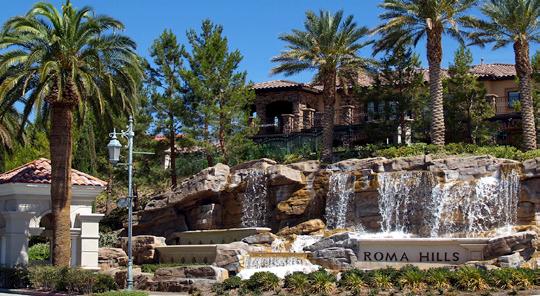
16 | LASVEGASSIR.COM HENDERSON COMMUNITIES ANTHEM COUNTRY CLUB ASCAYA # of Transactions Average Sales Price Average Price per SF Average Days on Market 1 1 +-0.00% $9,125,000 $14,250,000 +56.16% $1,040 $1,486 +42.83% 1 338 +33,700% 2022 2023 CHANGE # of Transactions Average Sales Price Average Price per SF Average Days on Market 19 13 -31.58% $2,177,647 $1,930,769 -11.34% $517 $404 -21.81% 17 29 +70.59% 2022 2023 CHANGE GRAND LEGACY MACDONALD HIGHLANDS LAKE LAS VEGAS # of Transactions Average Sales Price Average Price per SF Average Days on Market 21 22 +4.76% $2,093,048 $1,661,495 -20.62% $490 $438 -10.61% 63 87 +39.10% 2022 2023 CHANGE # of Transactions Average Sales Price Average Price per SF Average Days on Market 1 1 +-0.00% $1,200,000 $1,600,000 -33.33% $379 $359 -5.09% 5 5 +-0.00% 2022 2023 CHANGE # of Transactions Average Sales Price Average Price per SF Average Days on Market 11 9 -18.18% $4,591,889 $3,304,916 -28.03% $716 $657 -8.24% 23 91 +295.65% 2022 2023 CHANGE ROMA HILLS # of Transactions Average Sales Price Average Price per SF Average Days on Market 3 4 +33.33% $2,919,667 $2,037,500 -30.21% $517 $333 -35.60% 34 106 +211.76% 2022 2023 CHANGE

Q2 2023 | 17
# of Transactions Average Sales Price Average Price per SF Average Days on Market 14 10 -28.57% $2,137,786 $2,338,200 +9.37% $398 $444 +11.66% 32 86 +168.75% 2022 2023 CHANGE
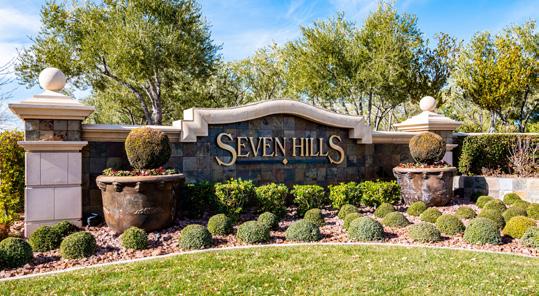
SEVEN HILLS
# of Transactions Average Sales Price Average Price per SF Average Days on Market 7 5 -28.57% $1,653,571 $1,340,000 -18.96% $347 $316 -8.81% 6 24 +300.00% 2022 2023 CHANGE # of Transactions Average Sales Price Average Price per SF Average Days on Market 7 3 -57.14% $1,215,000 $1,127,000 -7.24% $339 $352 +3.75% 12 54 +350.00% 2022 2023 CHANGE
THE CLUB AT MADERIA CANYON
THE FOUNTAINS


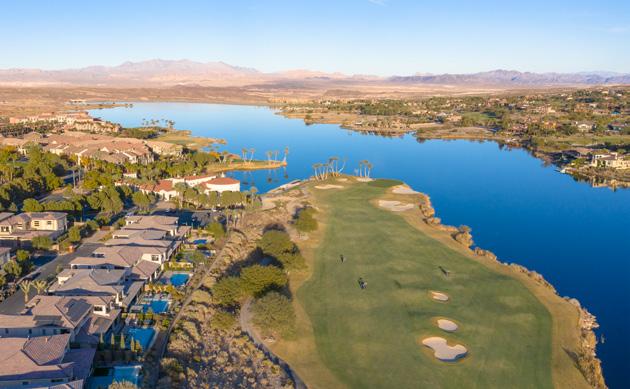
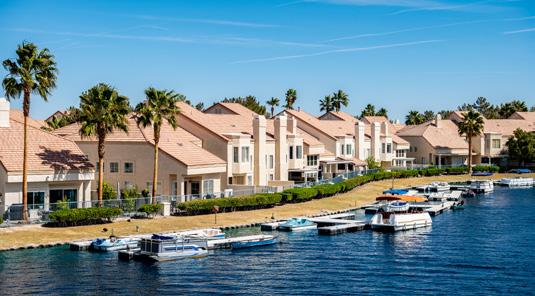
®,™ and SM are licensed trademarks to Sotheby’s International Realty Affiliates, Inc. An Equal Opportunity Company. Equal Housing Opportunity. Each Office Is Independently Owned And Operated, Except Offices Owned And Operated By NRT Incorporated. If your property is listed with a real estate broker, please disregard. It is not our intention to solicit the offerings of other real estate brokers. We are happy to work with them and cooperate fully. * All information from sources deemed to be reliable although not warranted or guaranteed by Sotheby’s International Realty® S.0074661 2030 Lake Las Vegas Pkwy | Open Daily 10am to 5pm | 702.497.0300 | lasvegassir.com Unparalleled Lake Access. Ultra Modern Architecture. Lake Las Vegas Lifestyle. This is The Island, the ultimate in lakeside living at Lake Las Vegas. All custom lots feature lakefront access and breathtaking views. Get away from it all and start your life on The Island at Lake Las Vegas. TO LEARN MORE ABOUT THIS ONCE IN A LIFETIME OPPORTUNITY, VISIT THE LAKE LAS VEGAS REAL ESTATE INFORMATION OFFICE LUXURY LAKESIDE LIVING REDEFINED AT LAKE LAS VEGAS