Pandemic-era social trends and their impact on the built environment


3 CONTENTS Preface ....................................................................................................................................................................................................................... Page 4 Executive Summary ........................................................................................................................................................................................... Page 5 Key Trends in the Way We Live and Work Page 6 Key Post-Pandemic Housing Profiles................................................................................................................................................. Page 8 Part I: 2015 - 2019 Update Page 11 Part II: 2020 and Future Projections ...................................................................................................................................................... Page 23 Key Highlights ................................................................................................................................................................................................... Page 39 Conclusion ........................................................................................................................................................................................................... Page 40 References............................................................................................................................................................................................................. Page 41
TOMORROW’S HOMES:
Pandemic-era social trends and their impact on the built environment
PREFACE
This new research underpins that, across the UK, ‘quality of place’ is absolutely vital in all new development. Most development is undertaken by national housebuilding companies who only want to build houses: this report demonstrates that just building yet more housing estates in the way they have been done for decades, no matter how low-carbon the buildings are, is not good enough.
Tomorrow’s Homes: Pandemic-era social trends and their impact on the built environment shows people want to:
Spend less time travelling to and from the office. Live a low-carbon lifestyle. Be able to work more flexibly. Spend more times in towns and cities.
To respond to this need, designers and developers need to deliver new places which are mixed use; with good physical and digital connectivity; with attractive low-carbon buildings laid out in ways to enable low-carbon patterns of living; and with a good mix of house sizes and tenure types that are tailored to the emerging needs highlighted in this report.
Blenheim Estate Homes and ADAM Architecture are pioneering new approaches to conceiving, designing, and delivering new developments which respond to these needs. The findings of Tomorrow’s Homes underpin our work, and we are making it available to the wider construction community to help raise standards more generally at this time of critical demand.
4
EXECUTIVE SUMMARY
While 2022 ushered in some light at the end of the pandemic tunnel, COVID-19 has undeniably changed society and the ways we live and work. We have undertaken this research to paint a broader picture of how these emerging trends will shape the future of our homes, workspaces, and cities.
This research also builds upon our 2014 publication, ‘Tomorrow’s Home: Emerging social trends & their impact on the built environment ’, updating our projections for housing and lifestyle trends in light of the pandemic and other social changes of the past eight years. We place these changes in the context of long-term demographic shifts, focusing especially again on the Millennial generation, with increased insight into the rising influence of Generation Zers behind them, and the still significant force of the Baby Boomers. In understanding the needs of these rising generations—situated alongside long-term and post-pandemic social trends—we aim to chart a vision for better, healthier homes and communities for tomorrow. We have continued our geographical focus on England and Wales as much as possible, but various statistics may apply to England alone, Great Britain, or the entire United Kingdom, as noted. Having conducted the majority of our analyses hot on the heels of the pandemic in 2021, some of the trends identified may still be burgeoning, but promise to set the stage for the post-pandemic era.
What follows is an Executive Summary comprising the key trends we have identified in the way we live and work, and the key demographic segments or “housing profiles” that will be most important to consider in building homes for the future. The report is then structured into two parts: Part I, covering the pre-pandemic period of 2015-2019; and Part II, covering how these social trends have evolved since the pandemic began in 2020, and projecting future implications for our homes and communities.
5
KEY TRENDS IN THE WAY WE LIVE AND WORK
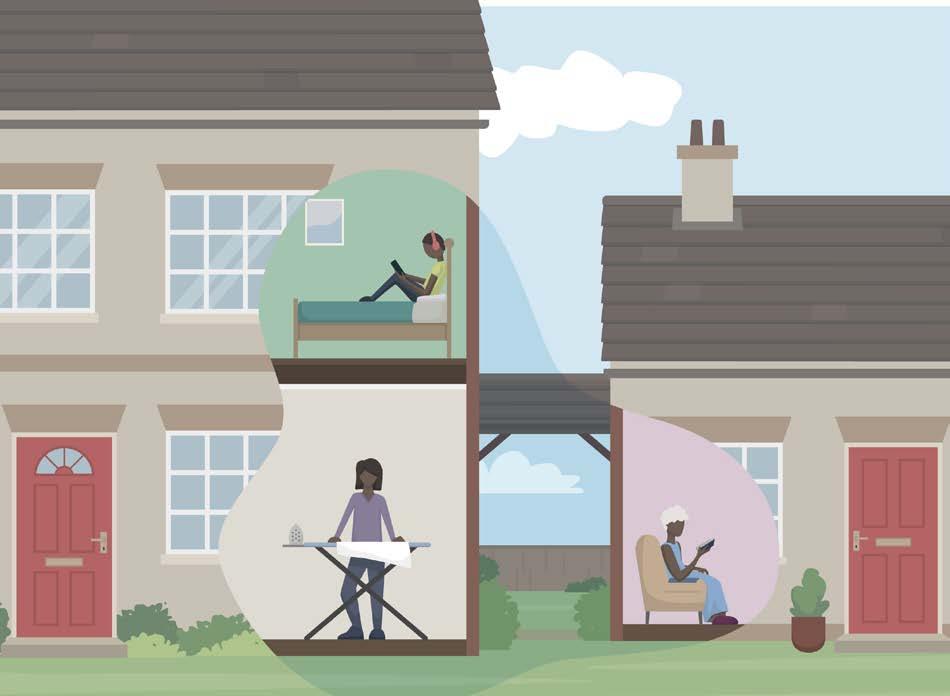
Hybrid Work & Intermittent Commuting


Made possible by broadband and accelerated by the pandemic, previously patchy patterns of working from home (WFH) have blossomed into a hybrid model of remote/office working and intermittent commuting, now led by London, followed by the South East, South West, East of England, and East Midlands. The trend across the UK since the turn of the century has been steadily moving towards fewer hours taken up by commuting — especially by car—indicating that the decline of daily commuting was already underway and is more than a pandemic blip.
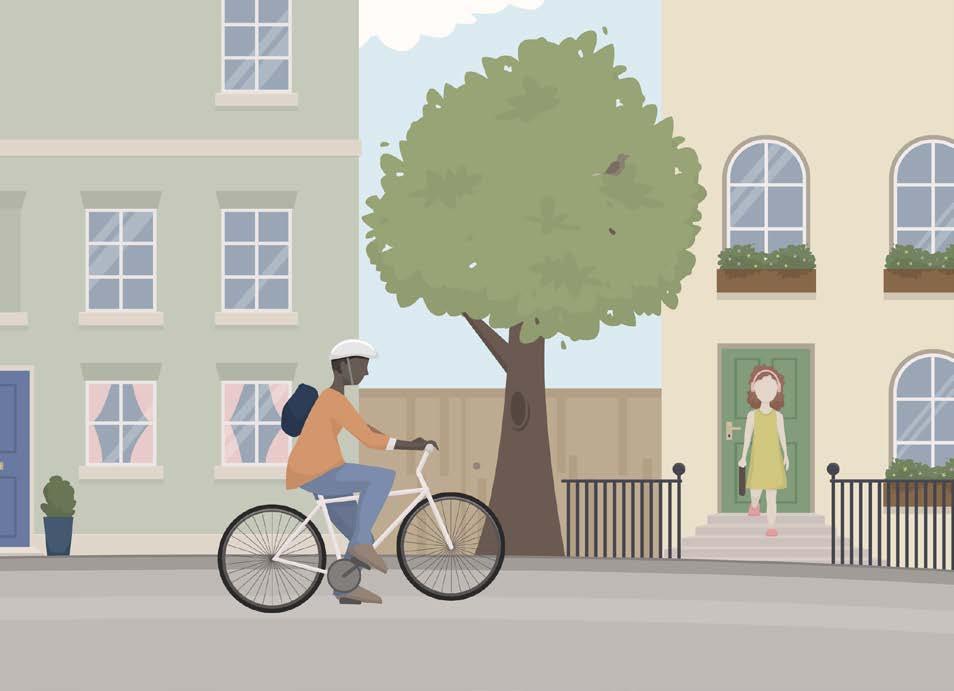
Bringing the Country Into the City: Urban Exodus Overhyped
Rather than simply leaving the city for the country, people want to see more of the country in the city. Months of confinement in cramped flats has highlighted the importance of good quality outdoor space, driving demand for leafier neighbourhoods, proximity to parks, and residential developments with a mix of private and communal outdoor amenities.
The 15-Minute Neighbourhood: End of the Dormitory Suburb
With home-based people looking to local neighbourhoods to meet pentup demand for socializing, coworking, entertainment, exercise, childcare, and boutique independent shops, we are witnessing an integration of living, working, and social functions across towns and cities. If we are serious about creating liveable places, we must embrace the need to deliver a diverse mix of the non-residential amenities required to ‘live, work, and thrive’ within an easy distance of home.
6
Distanced Interdependence
In the post-social-distancing era, people are striving to balance independence and interdependence in their social networks and residential situations. In planning for tomorrow’s home, we must consider deep-rooted demographic shifts and housing trends such as the aging Baby Boomer population, growth of solo living, rise of multi-generational households, and more families having fewer or no children.
Open-Plan Backlash


Challenged by competing demands for learning, exercising, and working—most keenly for acoustically insulated and ergonomically appropriate WFH spaces— the ever-popular open-plan home layout is facing a backlash. Alternatively, many families (especially those with school-age children) may still value a larger open living space paired with a greater number of smaller bedroom/studies, or floorplans in which open kitchen/dining/living areas can be closed off via sliding doors.
Green Intentions

Activated by the climate-change agenda and pandemic-driven health concerns, consumers are increasingly prioritising ethical values, sustainable patterns of living, well-being, and biophilic design —especially Gen Zers (Generation Zers) and Millennials. Architects and developers must consider rising demand for energy-efficient designs and technology, new interest in biodiversity net gain, facilities for electric vehicles, and ethically sourced materials in creating homes for people to live happier, healthier lifestyles.
Future-Proofing
As supply chains broke down and local places became the centre of our lives during the pandemic, people became progressively more invested in community- and self-sufficiency— strengthening resilience through shorter supply chains, a resurgence of allotments, and mutual aid. As of February 2022, 45% of adults reported avoiding close contact with those outside their home, with much higher rates for vulnerable groups like the disabled (57%). Beyond fortifying our own dwellings with temperature and environmental moderation controls, developments structured to allow social distancing while bringing neighbours together in shared outdoor space will increase quality of life and well-being, and can bolster community resilience when the next environmental or social disaster strikes.
7
KEY POSTPANDEMIC HOUSING PROFILES
Downsizers or Grandsizers?: Aging Baby Boomers
As the legion of Baby Boomers age, over-65s are increasingly accounting for a larger piece of the housing pie. Despite much hype around the potential for this relatively wealthy, largely home-owning generation to downsize, Baby Boomers seem more inclined to be ‘grandsizers’ than downsizers, wanting to maintain space for existing lifestyles, entertaining, outdoor socialising for the COVID-conscious, and additional bedrooms to host visiting family.
8
Bachelor, Bachelorette, & Bachelor Dad Pads: The Rise of Solo Dwelling
With single-person households leading projected growth across all English regions outside of London, we are seeing a growing market for bachelor and bachelorette pads. While women over 70 are still the largest block of solo-dwellers, men aged 45-65 have driven 72% of this growth over the past two decades—especially in areas like London, the South East, and North West. With divorce and separation rates believed to contribute to the upsurge of single-living men in mid-life, we may also see increased need for ‘bachelor-dad pads’ with multiple bedrooms for visiting or part-time resident children.
Nesting Mortgagors: Homebuyers With Dependent Children
Despite the outsize proportion of Baby Boomers and singletons, couples and families are still the major force in the market for mortgaged homes, and the vast majority (nearly 80%) of mortgagors are under 55. WFH rates are highest among those in their 30s and 40s, so homeworking accommodation will be critical for these households. We are also seeing a trend towards lone-parent and single-child families, but the growing group of double-earner parents may still desire a similar number of smaller bedrooms for flexible use as home offices and study spaces.
9
Interwoven Living: Multi-Generational Households
As many as 34% of British adults are now estimated to be living intergenerationally—whether ‘boomerang’ young adults, elders in granny annexes, or three generations sharing one roof. Twentyeight percent of 20-34 year-olds now live with their parents, while only 21% did in 1996. Boomerang households (especially sons) are the biggest block of interwoven dwellers, but three-generation households are growing as well, with higher rates in BAME communities. This multigenerational dwelling phenomenon may foretell demand for multiple kitchens and front doors, increased interest in co-living developments, semi-private extensions, additional bedrooms with en-suite bathrooms, and studios over garages to afford greater privacy for family members at different life stages.
Eco Pragmatist Gen Zers
Gen Zers (Generation Zers) appear to be largely following in their Millennial older siblings’ footsteps by continuing to live in cities, declining to drive, and renting in the private sector in larger numbers (rising from 43% in 2005 to 66.8% in 2020) than previous generations at their age. But in a notable departure, a considerably higher proportion of 16-24 year-olds are now homeowners than in 2015, aligning with popular perception of Gen Z as eco-conscious pragmatists who are more oriented towards stable career and money-saving goals than Millennials were in their 20s. These young workers are also keen to get out of cramped WFH conditions and back to offices, where they benefit from social interaction and mentorship opportunities.
10
PART I: 2015 -2019 UPDATE
Much has changed since the publication of our 2014 report, from Brexit and the COVID-19 pandemic, to the rise and decline of sharing economy services like WeWork. To better understand the potential long-term impact of the short-term changes wrought by the COVID-19 pandemic, we will first consider how the trends and projections laid out in our earlier work played out over the pre-pandemic period of 2015-2019.
Following on our 2014 work, we continue to give special consideration to the Millennial generation cohort, with additional focus on their Baby Boomer parents and younger Gen Z siblings. For the purposes of this analysis, we consider the Millennial generation to be roughly those born 1980-1996, constituting a significant bulge in the population pyramid as the ‘Baby Boomer echo generation’.
Aged 18-34 in 2014, this cohort had grown up to be 25-40 by 2020, crossing new developmental thresholds in relation to many of the family formation, housing pathways, and lifestyle patterns we identified previously. People aged 35-54 currently account for 60% of all English households buying homes with a mortgage. Thus, in continuing to track the Millennial generation, we are also giving special attention to the generation rising through these prime home-buying years over the next fifteen years. We have also continued our geographical focus on England and Wales as much as possible, but various statistics may apply to England alone, Great Britain, or the United Kingdom, as noted.
11
500k 500k 400k 400k 300k 300k 200k 200k 100k 100k 0 0 10 0 50 90 30 70 110 20 60 100 40 80
2018 Men 2018 Women 2043 Men 2043 Women Age
Population Projections: mid-2018 and mid-2043 (by thousands)
Source: Office for National Statistics, 2019d
Homemaking: Tenure, Household Type, and Family Formation Trends
Household trends can be complex to translate to lived experience, but generally represent increasing numbers of people living in household formations other than the traditional nuclear family with dependent children. The slowing decline of household size has plateaued, averaging around 2.4 over the past two decades.1 While the number of single-person households have continued to grow, the consistency of average household size reflects people increasingly cohabitating with extended family or friends.
In terms of tenure trends, the dramatic shifts of the early 21st century have generally plateaued over the past five years. In 2014, owner occupation was declining and the private rental sector (PRS) had surpassed the social rented sector (SRS) for the first time
Trends in Tenure (proportions), 1980 - 2019-20, England
in recent history. Owner occupation has hovered around 63.5% since then (climbing up to 64.6% in 2020 after falling to 62.6% in 2017). The PRS has declined slightly to 18.7% after a peak of 20.3% in 2017, bringing this tenure type closer to the SRS share (at 16.7% as of 2020), rather than continuing to soar upwards.2
Unsurprisingly, outright ownership tended to be skewed towards the older age bands, and mortgagors were concentrated in the middle age groups as of 2020. In 2019-20 63% of outright owners had a household reference person (HRP) aged 65 or older, while 59% of households with a mortgage had an HRP aged 35-54.3
12
Owner occupied Private renters Social renters Source: MHCLG, 2020a. 10 1980 1990 2000 2010 2020 50 30 70 20 60 40 80% Source: MHCLG, 2020b. 16-24 25-34 35-44 45-54 55-64 65+ 100% Owned outright Buying with mortgage All owner occupiers Private renters All social renters All households 0%
Tenure proportions by Age of HRP: 2019-20 (England)
Tenure by Household Type 2019-20, England
Couple no dependent child(ren)
Couple with dependent child(ren)
Couple with dependent and independent child(ren)
Couple with independent child(ren)
Lone parent with dependent child(ren)
Lone parent with dependent and independent child(ren)
Lone parent with independent child(ren)
Two or more families
Lone person sharing with other lone person
One male
One female
Baby Boomers
With lifespans extending and people having fewer children, many people now spend much more of their adult lives as empty nesters than they did raising children—a fairly recent development within human history. The growing proportion of older couples living longer is thus shifting the makeup of the household landscape, as more years living with only a partner may bring about different dwelling and neighbourhood needs from those experienced during child-rearing years.
Own outright Owner occupiers
Private renters
Buying with a mortgage
Social renters
13
All households All social renters Private renters All owner occupiers Buying with a mortgage Own outright 0 10 40 70 20 50 80 30 60 90 100%
Source: MHCLG, 2020b.
Source: MHCLG, 2020b.
0 10 20 30 40 50 60 70 80 Tenure Trends for Over-65s: 2003-2020, England 2008 2004 2005 2006 2007 2009 2010 2011 2012 2013 2015 2016 2017 2018 2019 2020 2014 90%
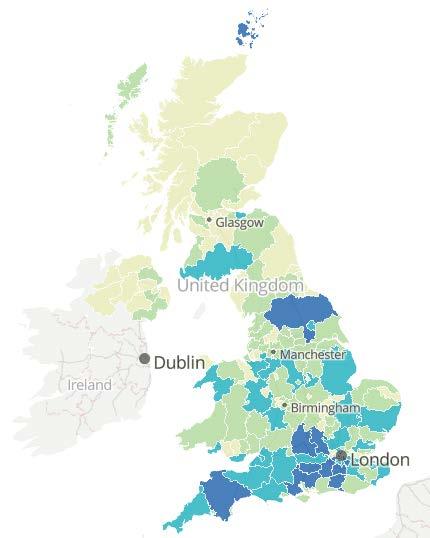
Over 65s by Region in the UK
As a major force in the population pyramid, Baby Boomers exert an outsize influence in current tenure trends. The over-65 population (including Boomers and the ‘Silent Generation’ before them) increased by 2.3 million, from 16.2% of the total population in mid-2009, to 18.5% in mid-2019.4 Nearly 80% of over-65s are now owner occupiers—representing growing numbers of outright owners over the past 20 years. Fewer over-65s (only 5%) live in the PRS than other age groups, though a significant portion are still housed in the SRS (15%).5 Areas with the greatest proportions of people aged 65 years or over were predominantly located in the South West, around the south and east coasts of England, around the west coast of Scotland or in central and western areas of Wales.6
Solo Dwelling
While our 2014 report suggested that the growth of solo living had slowed, the number of people living alone has continued to outpace overall population growth.7 Nearly 27% of households are now occupied by a sole person (single-person households), though this is of course distinct from the proportion of the population who live alone. Only around 12% of people currently live alone, but this percentage has been growing steadily since the 1990s.8
The majority of this growth has been driven by an increase in the number of men living alone, and a 53% increase of 45-64 year-olds living alone.9 It is believed this is due to the combined factors of men forming partnerships later in life (often with younger women), being more likely to never marry, and returning to living alone after divorce or separation (while women are more likely to continue living with children from the partnership).10 The growth of solo living from 2009 - 2019 appears to have been driven by even older men (65+ and 75+). Nearly half of those living alone (49%) were aged 65 and over in 2019, and more than one in four (29%) were aged 75 and over.11
Those who live alone are generally less likely to own their own homes than childless couples of the same age,12 although singlefemale households account for the second largest block of outright
14
25.6% 33.2% 18% 13.9% 6.4%
Source: ONS, 2020a.
owners (22% as of 2019-2020), after couples without dependent children (45%).13 As women tend to outlive men, and single-female households are more strongly concentrated among the oldest age groups, many lone-female outright owners are likely to be former members of couples who have outlived their partners. It is also important to note that the social rented sector has a particularly high proportion of single-person households—41% is made up of lone households, with a slightly higher proportion of women.14
own outright, so there will likely be growing demand for mortgaged ‘bachelor pads’ as well. A third of middle-aged solo-dwellers have never married, while over half are divorced or separated.16
Solo-dwelling men are also more likely to live in the private rental sector (22%) than solo-dwelling women (13%), suggesting there is a strong market for private rental units for single men in this age range.15 While 54% of lone males are owner occupiers, only 34%
15
3.0 1.5 2.5 1.0 2.0 0.5 2017 1997 2003 2009 1999 2005 2011 2001 2007 2013 2015
People Living Alone by Age Group, 1996 to 2017 (in millions), England
65-74 16-24 25-44 45-64 75+
Source: MHCLG, 2020b.
Number of Men in One-Person Households, 2006 North East North West East Midlands West Midlands Eastern London South East South West Wales Merseyside Yorkshire & Humberside 0 50k 100k 150k 200k 250k 300k Number of Men in One-Person Households, 2018 70+ 60-69 50-59 40-49 30-39 20-29 North East North West East Midlands West Midlands Eastern London South East South West Wales Merseyside Yorkshire & Humberside
0 50k 100k 150k 200k 250k 300k
Source: Office for National Statistics, 2020h.
With the upsurge in divorce rates, single fathers may require accommodations such as additional bedrooms for visiting children: ‘bachelor dad pads’.
Multi-Generational Living
The growth of living alone is not a trend that applies to Millennials, however, because the number of solo-living 25-44 year-olds has declined in real and proportional terms from 1.83 million in 2002 to 1.34 million in 2017.17 Unable to afford living alone, people under 45 are increasingly living with family and sharing flats until they form partnerships or buy homes at later ages. For households categorised as ‘lone persons sharing with other lone persons’, likely to capture many younger flat-sharers, 60% are in the private rental sector—a far higher proportion than any other household type.18
Household Type by Tenure 2020, England
1. Couple no dependent child(ren)
2. Couple with dependent child(ren)
3. Couple with dependent and independent child(ren)
4. Couple with independent child(ren)
5. Lone parent with dependent child(ren)
6. Lone parent with dependent and independent child(ren)
7. Lone parent with independent child(ren)
8. Two or more families
9. Lone person sharing with other lone person
10. One male
11. One female Social renters Private renters Buying
Source: MHLCG, 2020b.
16
Number of Women in One-Person Households, 2006 North East North West East Midlands West Midlands Eastern London South East South West Wales Merseyside Yorkshire & Humberside 0 50k 100k 150k 200k 250k 300k Number of Women in One-Person Households, 2018 70+ 60-69 50-59 40-49 30-39 20-29 North East North West East Midlands West Midlands Eastern London South East South West Wales Merseyside Yorkshire & Humberside
0 500k 100k 150k 200k 250k 300k
Source: Office for National Statistics, 2020h.
1 4 7 2 5 8 10 3 6 9 11
with a mortgage
outright
Own
Long before the pandemic-era hype around multi-generational cohabitation, the ‘boomerang’ generation trend continued to expand in the latter 2010s, with notably higher rates for men. The percentage of young adults (20-34 year-olds) living with parents has increased from 32% to 34% for men and 19% to 22% for women over the period of 2013 to 2020, with much greater gains since 1996.19 Younger men are thus more likely to live with parents longer and more likely to live alone than young women, probably related to their tendency to delay forming partnerships till slightly older ages. Households containing multiple families currently represent the smallest share of all households (1%), but have been the fastest growing type of household over the last two decades.20
Gen Z
Like Millennials, Gen Zers saw an increase in home ownership after mid-2016—a trend line which seems likely to be based in some policy or supply-and-demand factors coming into play around the time of the initial Brexit vote in 2016. As of 2020, 14.3% of 16-24
year-olds were homeowners—a considerable increase from 8.5% in 2015, though still far below 2005 levels, when 27.2% of people in this age range were mortgagors.21 Gen Zers are renting in the private sector in higher numbers (66.8%) than under-25s were in 2005, but this is no longer a sky-rocketing trend. Regardless of whether they can take any responsibility for climbing the home-ownership ladder faster than Millennials, this shift aligns with the stereotype of Gen Zers as eco-conscious pragmatists, who are more oriented towards stable career and financial goals than Millennials were in their 20s.
Tenure Change for 16-24s: 2003 - 2020, England
Millennials
Across leading trends in housing, work, and transportation, Millennials seem largely to have continued the shift towards individual collectivism during the period of 2015 -2019. Compared with their Baby Boomer parents at a similar age, Millennial lifestyles appear
17
0 10 50 40 80 20 60 30 70 Buying with a mortgage Own outright Owner occupiers Social renters Private renters 2008 2005 2004 2006 2007 2009 2010 2011 2012 2013 2015 2016 2017 2019 2018 2020 2014
Source: MHLCG, 2020b.
Percentage of Young Adults (20-34) Living With Parents, UK 0 10 40 20 50% 30 27% 2006 2013 2020 15% 32% 19% 34% 22% Women Men
Source: Office for National Statistics, 2022a
to be reorganised around interwoven and technologically enabled networks, continuing to drive less, populate cities more, and live longer in household formations other than the ‘traditional’ nuclear family.
Live Births per Thousand Women From Ages 15 to 45 Years,, Selected Cohorts Born Between 1925 and 1995, England and Wales
do not yet know what the average number of children for Millennial mothers will be. But the drastic decline in birth rate from 2012 to 2020 (decreasing 15.3% since the most recent peak in 2012) suggests that Millennial mothers will tend toward smaller family sizes.23
Estimated Family Size Distribution on Completion of Childbearing, 1920 to 1973 Cohorts, England and Wales
Millennial families have continued moving away from the single-earner model. In 2019, three-quarters of mothers with dependent children were working—a major increase from two-thirds of mothers at the start of the century, though the proportion of fathers in work (over 9 in 10) was still considerably higher. Women have accordingly continued to postpone childbearing, but two-children families continue to be the most common (including in comparison with families that never have children).22 As the total number of children per woman cannot be assessed until that generation’s childbearing years have concluded, we
Millennials are still overrepresented in the PRS and underrepresented in owner occupation. That said, PRS trends appear to be playing out somewhat differently for the younger (25-34) and older (35-40) segments of the Millennial cohort. For those aged 25-34 in 2020, the declining owner occupation and growing PRS trend lines have converged from respective high and low points in 2014 to meet back squarely around 41 – 42% in 2020. But the long-term trend of the increasing proportion of 25-34 year-olds in the PRS (growing from 21% in 2004 to 48% in 2014) has reversed, decreasing to 42% by mid-2020.24
For those aged 35-44 in 2020 (including the older segment of 3540 year-old Millennials), there has been a net decline in owner
18
0 15 Woman’s Age 20 25 30 35 40 45 50 150 100 200 Per 1000 women 1925 Birth Year 1985 1946 1995 1955 1973 1935 1965
Source: ONS, 2019c.
0 1920 1930 1940 1950 1960 25 75 50 100% 0 (childless) 4/more 1 2 3
Source: ONS, 2019c.
1970
occupation from 59% in 2014 to 56% in 2020, continuing the long-term decrease from 74% in 2004.25 Hence, while a higher share of 35-44 year-olds are owner occupiers than 25-34 yearolds (as we would expect for this older age range), the trend lines for 35-44 year-olds more closely follow our 2014 projections.
Tenure Change for 25-34s: 2003 - 2020, England
indeed increased over the past decade from 31% in 2009-10 to 36% in 2019-20.26 The PRS has also continued to be the dominant tenure in London since 2014, in contrast to the rest of England.27
Tenure Change for 35-44s: 2003 - 2020, England
The proportional decline in owner occupation for 35-44 year-olds during this time span was due to a decline in mortgaged households from 60% to 49%. The proportion of this age group in the PRS, meanwhile, continued to increase from 24% in 2014 to 27% in 2019-20. Thus, while the trends observed in 2014 have been tempered or plateaued, the road to owning a home is still clearly much more challenging for younger age groups than it was in the early 2000s.
In 2014, we also projected that the PRS would increasingly be the only housing pathway available to many young families, especially in London. The proportion of PRS households with children has
Mortgaged ownership continues to be the dominant housing pathway for couples with dependent children, however, at 58% in 2019-2020.28 Couples with dependent children also account for the largest block of mortgaged owners at 36%, followed by couples with no children (27%)—some of whom will of course go on to have children.29 Combining other household types with children, such as couples who have both dependent and independent children (4%), lone parents with dependents (4%), and two or more families (2%), 46% of mortgagors have dependent children.30 So while the growth of single-person households is important to plan for, the vast majority of housebuying is still currently dominated by a variety of family types with some dependent children.
19
0 10 50 40 20 60 30 70 Buying with a mortgage Own outright Owner occupiers Social renters Private renters 2008 2005 2004 2006 2007 2009 2010 2011 2012 2013 2015 2016 2017 2019 2018 2020 2014
Source: MHLCG, 2020b.
0 10 50 40 20 60 30 70 80 Buying with a mortgage Own outright Owner occupiers Social renters Private renters 2008 2005 2004 2006 2007 2009 2010 2011 2012 2013 2015 2016 2017 2019 2018 2020 2014
Source: MHLCG, 2020b.
Downloadable Lifestyles; Uploadable Cities
The resurgence of city living observed in 2014 - especially for young adults - appears to have continued in the years leading up to the pandemic. Between 1996 and 2016, for instance, the proportion of people aged 18-34 living in cities rose from 58% to 62%, while the proportion of those 65+ in cities fell from 51% to 46%.31 With both suburbs and major cities becoming more expensive, we projected that second- and third-tier cities would become increasingly appealing places to live. The growth rates of many third-tier cities like Coventry (20.9%) and Southampton (9.6%) and second-tier cites like Exeter (14.8%) and Milton Keynes (12.2%) surpassed or kept pace with the growth of first-tier cities like London (12.2%) and Edinburgh (13.3%). Looking at the cities with the top twenty fastest growth rates, we see a healthy mix of municipalities from across the first, second, and third tiers.32
In 2014 we projected that extending the success and popularity of the sharing economy model would be an innovative area of growth to fulfil Millennials’ unmet needs for green space, social space, and storage space. Sharing economy activity appears to have continued growing through 2019, especially for younger groups. A Warwick Business School study found that sharing economy usage in the UK had grown by 60% in a mere 18 months. Usage rates are highest for the youngest generations, with 70% of those aged 25-34 participating in sharing economy services like Uber, Airbnb, Gumtree, Taskrabbit, Mealsharing, and Crowdcube.33
Mega/Micro Commuting, Transportation, & Work
Age-Based Driving Trends
Cars continue to play a smaller role in Millennials’ lives, compared with earlier generations at the same age. While the 30-39 yearolds of 2002 made 69% of journeys by car, the same segment made only 61% of trips by car in 2019. Average miles travelled by 3039 year-olds by car in relation to other modes (e.g., walking and public transport) similarly decreased from 83% in 2002 to 75% in 2019. Gen Zers appear to be following a similar path, with proportionally fewer 17-25 year-olds holding driving licences than in the mid-1990s, though more than in the early 2000s.34
It is important to note that we are still seeing an age effect whereby rates of car use increase along with age group (from 17 up to 49) in any given year, which we would expect to see as many people move to more car-dependent areas and take on new driving responsibilities during the key child-rearing decades of their 30s and 40s. That said, there is a very clear trend from 2002 to 2019 of each age cohort from 17 to 49 driving successively less than previous cohorts did at the same age.35
20
Coventry Slough Luton Nottingham Bournemouth Norwich Leeds Preston Stoke Ediburgh Southampton Cardiff Gloucester Worthing Chatham Huddersfield Derby Swansea Middlesborough London Leicester Reading Barnsley National Sheffield Newport Aberdeen Aldershot Birkenhead Warrington Dundee Blackpool Population Change: 2009 - 2019 0 25% 20 15 10 5
Source: Centre for Cities, 2021.
Average Number of Trips by Car/Van As Proportion of All Trips: By Age, England
Transport and Commuting Declining Travel Trends, England
Average Miles by Car per Person per Year As Percentage of All Travel
By
People are traveling less for shopping, commuting, and leisure, due likely to demographic changes, shifting trip patterns, and new technology influencing travel demand such as social media/networking and increasing ability to work and shop from home.36 Among transport trends overall, the average number of trips, average total distance travelled, and average time travelled per year all decreased between 2002 and 2019.37 The lion’s share of this decline can be attributed to a 13% reduction in trips made by car. The average length of trips in miles has remained relatively constant during this time span, however, tempering the previously observed trend of journeys lengthening along with becoming less frequent.38
21
7,193 390 6,500 370 Average Distance per Person per Year Average Time Travelled per Year 2002 2002 2002 2019 2019 2019 1,074 953 Down 11% since 2002 Down 10% since 2002 Down 5% since 2002 Average Trips per Person per Year
Source: Department for Transport, 2020a.
All ages 0 10 20 30 40 50 60 70 80 17-20 21-29 30-39 40-49 2002 2008 2014 2019 Source: Department for Transport, 2020a. All ages 17-20 21-29 30-39 40-49
England, 2002 2008 2014 2019 Source: Department for Transport, 2020a. 0 10 20 30 40 50 60 70 80 90
Modes:
Age,
Commuting patterns tell a similar story to transport trends as a whole. The number of commuting trips full-time workers make per year has decreased steadily over the past two decades. Trips made as a car or van driver can be observed declining along with this overall trend, and also decreased from 59% to 54% of modal proportion.39 In keeping with top-level transport trends, average commuting trip length shows a long-term upward trend from 2002, but has hovered around 9 miles since 2011, showing no major increase since our 2014 report.40
away from daily commuting will not simply result in net gain of vehicle miles travelled for other purposes such as shopping and leisure. The ultimate impact of intensifying the geographic dispersion and periodic mega-commuting that many expect to result from the COVID-19 pandemic remains to be seen.
Flexible Working
By pre-pandemic metrics, we did not perhaps see as much growth in working from home during 2015-2019 as anticipated. That said, restricting the classification of working from home to those who ‘mainly work from home’ now seems an anachronism of the prepandemic era, as we move into a period where major companies like Salesforce and Microsoft are adopting models in which employees WFH two to three days a week, as well as other flexible combinations of home-, office-, and third-space-based work.41
As of 2019, 26.7% of the UK working population said they had ever worked from home —around 8.7 million people.42 The proportion of people categorised as ‘mainly working from home’ was still fairly modest at 5.1% pre-pandemic, though continued to show strong growth, increasing from 3.9% to 5.1% from 2012 to 2019.43 The traditionally defined WFH total (including those who work from the ‘same grounds or building’ such as farmers, and home as base workers such as ‘those who are self-employed and work on site at varying locations’) also increased modestly from 13.6% to 14.2% of workforce over this period.44
We also saw shifts in the geographic pattern of working from home over the latter 2010s. In 2014, London was far from being a WFH leader, coming in at only 13.6% of workers using their home for work, behind the South West, South East, East of England, and Wales.45 By 2019, homeworking rates were strongest in the South East, followed by London, the South West, and East Midlands.46
This provides a point in favour of the potential positive knock-on environmental effects we projected for Mega/Micro Commuting (at least up through 2019), in terms of the hope that the move
Our 2014 research also identified a connection between WFH and self-employment, which largely continued in the pre-pandemic period of 2015-2019. As of 2019, 91.9% of ‘separate from home’ workers
22
0 50 100 150 200 250 300 350 400 2002 2004 2008 2006 2012 2010 2014 2016 2018 2019 Number of Commuting Trips per Year for Full-Time Workers (England) All modes Bicycle Car/van (driver) London underground Car/van (passenger) Bus in London Walk Motorcycle Other local bus Nonlocal bus Surface rail Other public transport Source: Department for Transport, 2020a.
were employees and 60.3% of homeworkers were self-employed. Both figures decreased very slightly from 2013, and the proportion of homeworkers who are self-employed decreased a bit more considerably from a high of 63% in 2016. But we did not see major shifts over this six-year span before the pandemic. Homeworkers were more likely to be female and work part-time before 2020.
PART II: 2020 AND FUTURE PROJECTIONS
Hybrid Working and Intermittent Commuting
Our 2014 forecast that the feasibility of daily commuting to the nearest city would diminish as a factor influencing residential choice couldn’t feel more prescient than it does in today’s postpandemic WFH climate. The dramatic shifts of 2020 have definitively furthered the de-coupling of office work from the spaces it was once connected to, paving the way for a hybrid model in which an intermittent pattern of ‘micro’ commutes to workspaces within our own homes or local co-working facilities, and sporadic full-length commutes to central offices are likely to be more common. As of March 2022, 21% of the British workforce reported engaging in hybrid work, increasing from 15% at the start of the year.47
While the 2014 stereotype of WFH might have looked like a selfemployed person based in Devon or Wales, the 2020 image came to look more like London office worker trapped in their flat—when the highest rates of working from home were indeed found in London during the heights of the pandemic.48 We saw some of these geographic
shifts creeping up in the later 2010s, and the homeworking trend now seems to be led by and radiating out from London, followed by the South East, East of England, and South West, and East Midlands.
After modest growth over the later 2010s, WFH rates exploded with the early 2020 pandemic lockdowns—reaching a high of 46% in April 2020.49 Much higher rates were found for those with degrees, and among desk-based workers in fields such as professional and scientific activities, financial services, and information and communication— where as many as 80% reported WFH in spring of 2021.50 The proportion of working adults who did any work from home gradually declined as restrictions lifted, averaging 37% over the course of 2020.51 As of January 2022, 36% of working adults still reported WFH at least once in the previous week due to COVID-19 related factors.52
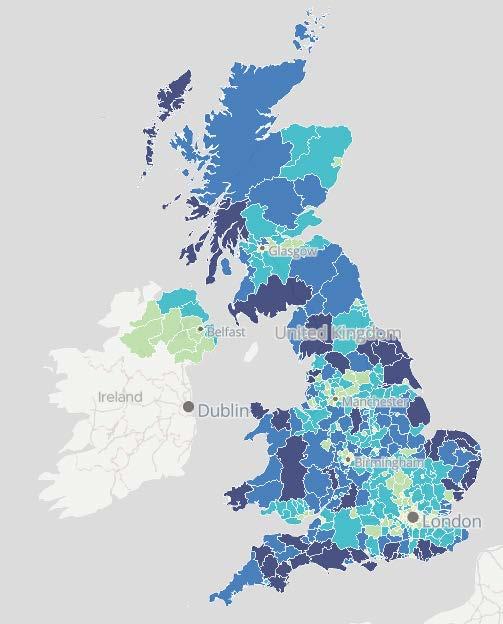
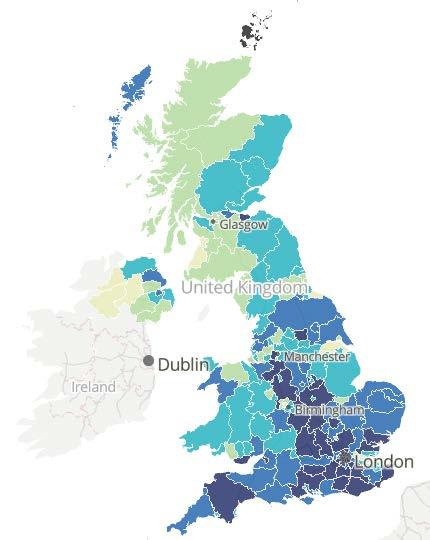
Proportion of Working Adults Working From Home, 2018 vs 2020

23
2018 2020 20-26% 4-19% 27-33% 34-41% 42-57%
Source: ONS, 2021f
While this may be lower than some would expect from the tremendous homeworking hype, it is important to remember that nearly 55% of the working population are employed in largely non-office-based occupations like wholesale/retail and health/social work—the largest two workforce segments—comprising nearly 27% of those employed. The considerably lower WFH rates of sectors such as manufacturing, construction, and food services pulls down the overall average.53 That said, nearly 30% of manufacturing workers and 28% of healthcare and socialcare workers reported engaging in at least some WFH during 2020, contributing to a bigger picture in which many types of workers participate in some degree of hybrid work.54 With 26% of workers furloughed at some point during the pandemic, a fully re-engaged workforce may also increase the proportion of workers ultimately able to work away from the offices, schools, and other non-residential buildings in which work was traditionally performed.55
Research shows that both workers and businesses prefer a hybrid approach—mixing office and homeworking— going forward. For office workers, over two-thirds prefer hybrid to full-time office- or home-based work. Working 1-4 days at home per week seems to provide the best of both worlds, with hybrid workers more likely to feel creative, empowered, and satisfied in their occupations.56 Workers earning higher incomes also expect more hybrid working than those with lower incomes, while those in their 30s and 40s anticipate continuing to WFH at higher rates than other age groups.57 The proportion of workers both working from home and travelling to work remained relatively stable between May 2020 and May 2021, but evidence from the Business Insights and Conditions Survey suggests both individuals and workplaces anticipate increased levels of hybrid models of working as loosening pandemic restrictions allow.58
Businesses have cited the ability to recruit from a wider geographic pool as an incentive to increase WFH—pointing towards an expectation for the growth of occasional mega-commuting.59 While average commuting distances have plateaued since the 2000s, we may see a trend towards sporadic longer work journeys driven by hiring and recruitment processes, rather than by residential choices in relation to traditional urban centres of employment. An increasing number of jobs will also be permanently remote. Since the first lockdown of 2020, the proportion of online job adverts mentioning homeworking has increased dramatically faster than the total proportion of job adverts.60 It is important to note that there is considerable variation in homeworking rates between different regions, however, not all of which can be explained by differences in regional industry profiles.61 Most urban areas saw high rates of homeworking, with notable exceptions such as Birmingham.62
There Is a Strong Market for Hybrid/WFH Accommodation For:
• 30-49 year-olds
• London, South East, East of England, South West, East Midlands
• Most urban areas (with notable exceptions like Birmingham)
• Those working in information and communication, professional and scientific activities, financial services, and real estate
• Higher earners
24
16-29 55% 40% 52% 85% 21% 22% 20% 7% 23% 38% 27% 8% 30-49 70+ 50-69 0 25 50 75 100% Proportion of Workforce WFH Due to COVID-19 in February 2022, England Yes Not able to No
2022f.
Source: Office for National Statistics,
WFH Amenities in Demand:
All Regions
• Acoustically insulated spaces
• High-quality task lighting, ergonomic set-up, good natural light and views
Urban
• Flexible WFH accommodation
such as adjustable partitions and desks
tucked under staircases
• Access to local coworking facilities
Rural
• Higher demand for fully defined home offices
Workers expect the benefits of increased and continued WFH to include enhanced work-life balance, greater speed at completing work, and improved well-being.63 But along with this comes fear of reduced ability to work with others, suggesting that these shifts will be accompanied by continued need for intermittent face time with co-workers, and enhanced need for social stimulation from local neighbourhoods. WFH may also be more appealing for older workers with spacious homes and spare bedrooms, while younger workers suffer in cramped flats and miss out on mentorship and career advancement opportunities afforded by face-to-face contact.64
Working From Home, by Industry in 2021
All industries
Accommodation & Food Service Activities
Transportation & Storage
Human health & social work activities
Accommodation & /Food Service Activities
Arts, entertainment & recreation
Water supply, sewerage waste management & remediation activities
Manufacturing
Administrative & support service activities
Other service activities
Wholesale & retail trade, repair of motor vehicles/motorcycles
Construction
Education
Real estate activities
Professional scientific & technical activities
The expansion of intermittent commuting in this new era of hybrid working is likely to lead to increased demand for in-home working accommodations, and continued demand for co-working and shared work facilities within residential developments or close to home. A 2020 survey by the Royal Institute of British Architects (RIBA) found 17% of British homeowners wanting to create a home office in response to WFH, while the American Institute of Architects (AIA) reported a 68% increase in client requests for home offices that year.65 WFH is also creating growing demand for amenities like high-quality task lighting.66
Working remotely instead of at their normal place of work
Working at their normal place of work
On partial or furlough leave
25
0 60 40 20 80 100%
Source: Office for National Statistics, 2021e.
Net Sentiment Towards Advantages/Disadvantages of Working From Home 2021, England
While many can point to anecdotal examples of colleagues or celebrities who relocated to rural retreats during the height of the pandemic, evidence for an urban exodus en masse appears to be limited. Research conducted by Reallymoving demonstrated that the median distance for moves made by British homebuyers in 2020 was 10 miles, representing a mere one-mile increase from the 2019 average.69 Further analysis from the Office for National Statistics (ONS) found fewer residential moves were made by all age groups in England and Wales in the 12 months prior to mid-2020 as compared to the preceding 12 months.70 Zoopla’s UK Rental Market report identified a ‘halo effect’ with commuting zones on the outskirts of cities experiencing strong rental demand.71 With Millennials and Gen Zers driving less and favouring city-dwelling before the pandemic, we are less likely to see a sudden change of residential preferences and transportation values for these younger generations.
Source: Office for National Statistics, 2021e.
We may also see trends and needs in hybrid working accommodation differing for those in urban versus rural areas. With urban dwellings smaller but closer to other workspaces, we may see greater desire for flexible WFH accommodation such as adjustable partitions and desks tucked under staircases. There is likely to be a stronger market for fully defined home offices for those with more residential space living further from other workplaces—such as areas of the South East, East of England, South West, East Midlands, and Yorkshire and the Humber, where WFH is at its highest outside of London.
Bringing the Country into the City: City Exodus Overhyped
As we have seen with other catastrophic events like the 2008 economic crisis, urban critics were quick to pronounce that the COVID-19 pandemic foretold the ‘end of the city’ once again. An August 2020 survey from London Assembly found that 14% of Londoners wanted to leave the capital as a result of the pandemic,67 and Savills reported a dramatic increase in luxury market rural sales.68
While moving to the countryside may still be out of reach for many, the pandemic does appear to have increased the desire for cities to provide more of the biophilic benefits associated with non-urban living. The London Assembly study found that having one’s own private outdoor space—a garden or balcony—and proximity to parks had become more important factors for Londoners in thinking about their living situation as a result of the pandemic. Research has long shown that both adults and children have a psychological need for outdoor space within their ‘ownership’, which can be fulfilled by a small balcony or access to a communal garden.72 With these needs made salient by the pandemic, we are likely to see heightened demand for housing with access to outdoor amenities large and small, communal and private.
The 15-Minute Neighbourhood: End of the Dormitory Suburb

Our 2014 forecast for an end to the functional and geographic segregation of living and working spaces appears to be well underway. The growth of hybrid working and intermittent commuting will bring

26 50-69 16-29 30-49
Reduced wellbeing Improved wellbeing More distraction Harder to think of new ideas Fewer distractions Easier to think of new ideas Fewer job opportunities More job opportunities Harder to work with others Easier to work with others Slower work completion Quicker work completion Reduced work life balance DISADVANTAGE Improved work life balance ADVANTAGE -50 -40 -30 -20 -10 0 10 20 30 40 50 -50 -40 -30 -20 -10 0 10 20 30 40 50
The 15-minute Neighbourhood:
Will require
• Ability to “live, work, and thrive” in a 15-minute walking, cycling, or public transport radius
• Strong pedestrian, cycling, and public transport infrastructure
• Local coworking hub conversions: shopfronts, hotels, community centres
• Public space conversion/openings
• More social housing in high-income areas
• Investment in the public realm
• Equitable and coherent implementation
Will enable
• Further move away from daily, long commuting
• Reworking of high streets and city centres to meet new needs
• Growth opportunities towards the end of regional rail lines for sporadic commuting access
about new demands from within our dwellings and the broader residential areas they are situated in.
The pandemic, meanwhile, has magnified pre-existing declines in our movement patterns for shopping and commuting, carving out space in central business districts and high streets, which will increasingly be repurposed in innovative and economically dynamic ways.
Months of lockdown and travel restriction have made people appreciate hidden gems around the corner, but also made us keenly aware of what our local areas are missing. Many urbanists believe that the ‘15-minute city’ or neighbourhood model proposed by Carlos Moreno at COP21 in 2015 is key to post-pandemic city planning and residential development. Moreno envisions settlements whose residents are able to ‘live, work, and thrive’ (access food, health, education, culture, and leisure) within a 15-minute walk, cycle ride, or public transport trip radius. Others, like architectural theorist Leon Krier, have long proposed ‘cities within cities’ as the foundation of urban well-being.
In many ways, this transformation has been underway throughout the past two decades. While the changing work and commuting trends we observed in 2014 and have now charted through 2019 were breaking down traditional office/home distinctions, pandemictime WFH and the new era of hybrid work have ruptured our previous patterns and assumptions for good. Paris mayor Anne Hidalgo, who ran on a 15-minute-city re-election platform in 2020, has cited selling employers on remote work as a previous obstacle. The pandemic has neatly resolved this.73
Research from IWG (Regus’s parent company), shows that 77% of employees feel a workspace closer to home
is essential for the next job they will choose. Only one in five workers are now willing to commute longer than 30 minutes.74 With retail shopfronts shutting down and major reductions in demand for central business district office space projected, hybrid working will see former retail and other spaces converted into a more distributed model of local coworking locations. A 2019 study from the British Council of Offices found that coworking space usage was on the rise in the corporate sector before the pandemic, and this trend is likely to continue, as large and small companies shift to a hybrid model, enabling smaller central offices.75
John Lewis are in the process of transforming floors of their flagship Oxford Street store into office space, and venues ranging from community centres to hotels are now being converted into local coworking hubs around the UK.76 Meanwhile a former Debenhams store in Northampton is to be redeveloped as student flats.77
The decline of in-person shopping—another trend predating yet exacerbated by the pandemic—is the other key driver in this transformation. While the average annual number of shopping trips per person had already declined by 15% from 2002 to 2019, lockdown restrictions further pushed consumers towards ordering clothes, groceries, and other goods online.78 The pandemic accelerated pre-existing shifts to online shopping and to spending on digital services and technology rather than clothing. As of late August 2021, overall retail footfall remained at 80% of the level seen in the equivalent week of 2019.79 That said, research released by Deloitte in June 2021 found that British consumers were eager to resume in-person leisure activities such as going to shops (63%), frequenting pubs and coffee shops (33%), and eating out (27%) within a month of COVID restrictions being lifted.80
27
Average Number of Trips by Purpose: 2002-2019, England
Average Yearly Shopping Trips per Person by Mode of Tansport 2002–2019, England
Source: Department for Transport, 2020a.
Deloitte’s research also found that the pandemic has refocused people’s everyday priorities in terms of what they Are looking for their local environment to provide—with increased emphasis on activities such as frequenting shops other than supermarkets, as well as gardening, home cooking, and remote working that have all grown in popularity since lockdowns began.81 Interestingly, journeys for ‘other’ purposes including ‘just walking’ have increased by approximately 50% since 2002.82 This increase in walking stands in opposition to other declining transport trends, pointing to an increasing demand for appealing local neighbourhood environments to engage with, which predated the pandemic.
Source: Department for Transport, 2020a.
While consumers may be losing interest in visiting major supermarkets, recent data suggests that they do want to engage with local shops—especially independent businesses—whereby a visit to the neighbourhood baker or newsagent functions almost as a bespoke leisure activity. The Guardian reported a net total of over 800 new independently run British shops in the first half of 2021, including cafes, convenience stores, bakeries, hairdressers, and fastfood establishments. This stands in stark contrast to the closure of 5,251 chain stores, and leisure and hospitality businesses during the same period.83 Cutting out commuting time gives us more time to engage with our own neighbourhoods, and drives demand for unique and authentic spatial breaks from the WFH grind.
28
100 50 2002 2010 2006 2014 2018 2004 2012 2017 2008 2016 2019 0 150 250 200 300 Leisure Other incl. just walk Personal business Business Other escort Education/escort education Shopping
Commuting
100 50 2002 2010 2019 0 150 250 200 All modes Taxi/minicab Public transport Bicycle Walking Car/van
Source: Department for Transport, 2020a.
The pent-up demand for in-person socializing and visiting independent shops, restaurants, and pubs suggests increasing need for appealing local environments to engage with. In Paris, which we might consider the flagship 15-minute city, Mayor Hidalgo has piloted initiatives such as turning schoolyards into gardens open to the public outside of school hours, introducing more cycle highways, and building more social housing in wealthy neighbourhoods. The 15-minute city began with Moreno’s observation that modern cities have become unacceptably inefficient in requiring us to waste hours of our days commuting from home to work and accessing other basic needs like shopping and healthcare. Cities like Edinburgh, Madrid, Milan, and Seattle are all now attempting to remedy this by fostering polycentric systems, where working and healthcare facilities, grocery stores and farmers markets, green space and cultural activities will be more locally distributed.
Extending our ‘End of The Dormitory Suburb’ trend for the postpandemic era, the 15-minute neighbourhood model has implications at many geographic scales. As office workers continue to disconnect from long, daily commutes, we may see growth opportunities towards the end of regional rail lines—up to two hours away from city centres of employment. This is a shift we were already seeing with the huge influx of Londoners moving to places like Bristol, making the 1 hour 40-minute train ride periodically, which would have been untenable on a daily basis. Shuttered high street shopfronts in provincial towns present another place where we may see major demand and opportunity for distributed workspace accommodations.84 And there is increasing interest in what the 15-minute neighbourhood model can mean for rural communities as well. The 15-minute neighbourhood anticipates continued decline of the 20th century dormitory suburb model, in that central business districts, urban neighbourhoods, suburbs, town centres, and high streets, will all continue to host a greater mix of living and working activities.
Critically, Moreno has warned that the concept could result in intensified inequality if not implemented with equity and coherence in mind. Concerns of equity and solidarity (fostering links between people) are just as central to implementation as proximity and ecology. Different communities will need different interventions to make the vision a reality, and to ensure more deprived communities are not left isolated and under-resourced. So, while lower income neighbourhoods may require green space transformations and employment opportunities, social housing may be added to higher income neighbourhoods to share resources and ensure that lower wage and essential workers can also live near where they work.
29 Average Leisure Trips per Person per Year 2002 – 2019, England 100 50 2002 2011 2006 2015 2019 0 150 250 300 200 All modes Public transport Bicycle Walking Car/van/private
Projected Change in Number of Households Type and Age of Head of Household Between 2016 -2041 (England)
Distanced Interdependence
If the early 21st century was marked by spatial and social reorganization around individual collectivism, the post-pandemic era seems to be characterised by a need to balance increased desires for both independence and interdependence. While the pandemic isolated us in our homes and heightened the drive towards self-reliance, lockdowns and travel restrictions also made us keenly aware of the need for social contact and community. Seeing our lives unravel as we lost access to everything from toilet roll and tinned beans to childcare and haircuts in the early months of lockdown, people came to realise just how interdependent our lives are, and to reconsider how we might strengthen and simplify our social networks.
We see this tension between independence and interdependence in changing household formation trends—the basic organisation of our lives in terms of who we share a house with. In planning for tomorrow’s homes, we must consider the long-term demographic shifts underway, such as the aging Baby Boomer population, growth of solo living, and the rise of multi-generational households.
With birth rates on the decline, the vast majority (95%) of English household growth projected in the decade up to 2028 is accounted for by households without dependent children—including both singleperson and multiple-adult households.85 Nearly two thirds of growth is accounted for by households where the head of household is 75 or over, both because the Baby Boomer generation accounts for a major bump in the population pyramid, and because older cohorts are living increasingly longer lives. Looking ahead to 2041, oneperson households lead projected growth across England, followed closely by multiple-adult households (without dependent children)— except in London where multiple-adult households take the lead.86

30 Households
dependent children Households
children Households
Other households with two or more adults 16-19 25-29 45-49 65-69 35-39 55-59 75-79 75-89 1m 800k 600k 400k 200k -200k 0 One person households
with three/more
with two dependent
with one dependent child
Change in households
Source: Office for National Statistics, 2018.
Nesting Mortgagers
• Demand for mortgaged home ownership still dominated by couples with and without dependent children, and under-55s
• Strong demand for WFH amenities for those aged 30-49
• Two-children families are still most common, but declining birth rates and increase of one-child families may impact desired number of bedrooms
• Increasing proportion of families with both parents working may alternatively drive desire for a greater number of smaller bedrooms for flexible use as home offices and study spaces

Projected Change in Number of Households by Type and Region of England, 2016 – 2041
and without dependent children still account for the vast majority (63%) of those buying with a mortgage, and 79% of mortgagors were under 55 as of 2020.87
Other households with two or more adults
One person households
Households with three/more dependent children
Households with two dependent children
Households with one dependent child
Source: Office for National Statistics, 2018.
Nesting Mortgagors: Homebuyers with Dependent Children
While this might seem to suggest that we should gear the homes of tomorrow towards Baby Boomers and singletons, it is important to remember that household growth does not necessarily align with those who are buying homes. Couples with
As any parent can attest to, families with young children faced some of the most arduous and at times hilarious combinations of quarantine pressures on space, time, and nerves. WFH rates are highest among those aged 30-49, so homeworking accommodations will be critical for these households, who report a penchant for open-plan layouts despite their pandemic challenges. As of February 2022, 38% of 30-49 year-olds reported having worked from home in the past 7 days.88 In 2014, we forecast an end to the single-earner model, with mothers sequestered in dormitory suburbs. As of 2020, the employment rate gap between women and men was 6.3%—the lowest figure since comparable record keeping began in 1971. This gap was 10.4% merely a decade ago, (though some recent increase is partly due to changes in state pension age for women).89 With three-quarters of mothers now working, homes designed to accommodate multiple family members working and learning from home—in terms of layout and acoustics—will be desirable for nesting mortgagors. Family units appear to be getting smaller on average (with birth rates on the decline and single-parenting on the rise), but with both parents working, many may still desire a similar number of smaller bedrooms for flexible use as home offices and study spaces.
Households with dependent children increasingly take many forms beyond the ‘traditional’ nuclear family, with lone-parent households, same-sex couple parents, ‘blended families’, households with a mix of dependent and independent children, and a small but swiftly growing contingent of multi-family households all on the rise.90
31
South
South
London East of England East Midlands Yorkshire & The Humber North West North East West Midlands -10 10 20 30 0 -5 5 15 25 35%
West
East
Combining these groups, 46% of households buying with mortgages have dependent children, so designing with a range of family types in mind will be essential.91
Projections for household growth also vary considerably by region, painting a somewhat less grim and childless picture than simple age-based forecasts. While most families still tend to have two children, singlechild families will become increasingly common. Moderate growth is projected for families with one to two children (especially one child) in London, the East of England, East and West Midlands, and the South West and East. While statisticians expect most families to tend towards having fewer children, London and the Midlands stand out as the only regions where growth is expected for households with three or more children, which may certainly have implications for desired number of bedrooms.92
Interwoven Living: MultiGenerational Households

These trends towards smaller families and solo-dwelling are contrasted with a purported rise of multi-generational households. While pandemictime factors like young adults studying remotely and elders forming support bubbles with extended family may have played a small part, evidence suggests that intergenerational living was already on the rise.93
Multigenerational households can take many forms: young adults boomeranging back to live with parents, ‘granny annex’ elders moving in with their adult children, or three generations sharing one roof. A 2020 study from Aviva reported that 34% of 4,000 adults surveyed in the UK were living in multi-generational homes.94
The proportion of boomerang young adults alone— those aged 20-34 who have either returned to the family home, or not yet left—has increased from approximately 21% in 1996 to 28% in 2021.95 The boomerang trend accounts for the largest block of intergenerational dwellers, and is considerably higher with young men. Analysis compiled by the Cambridge Centre for Housing and Planning Research has also suggested that rates of intergenerational living are higher among families from Black, Asian and Minority Ethnic (BAME) communities—particularly household formations including a grandparent.96 We also include the growing segment of multi-family households in this trend, which, while small, is the fastest growing household type.
While this multi-faceted phenomenon is not currently tracked by the Office for National Statistics, it appears clear that families with at least two generations of adults cohabitating are becoming an important force to consider in the British housing market. The long-term growth we see forecast for households of two or more adults, for instance, includes multi-generational households without children.97 The rise of interwoven living may bring about demand for a greater number of bedrooms and bathrooms; semi-private extensions, annexes, and studios over garages to afford greater privacy for family members at different life stages; or increased interest in co-living developments providing flexible arrangements as aging children or elders require more or less independence from middle-aged family members. Interwoven homes may require amenities such as multiple kitchens, separate entrances, and en-suite bathrooms.
Interwoven Living May Increase
Demand For:
• Housing to accommodate multi-generational dwellers—now accounting for one third of all households
• Multiple kitchens and front doors, greater number of bedrooms and bathrooms
• Semi-private extensions, annexes, and studios over garages to afford greater privacy for family members at different life stages
• Co-living developments
32
Bachelor, Bachelorette, & Bachelor Dad Pads
• Strong market for private rental and owneroccupied dwellings for single men in 40s-60s
• Particularly in regions such as London, the South East, and North West
• Divorced fathers may require ‘bachelordad pads’ with multiple bedrooms for visiting children
Downsizers or Grandsizers: 57-75
• More inclined to be ‘grandsizers’ than downsizers, desiring additional bedrooms to host visiting family and sufficient living space for entertaining
• Most own homes outright so more likely to be renovators than buyers
• Increasingly requiring accessible, single-level homes with good natural lighting and low maintenance outdoor space as they become more home-bound
• More likely to live in rural and coastal areas
Bachelor, Bachelorette, & Bachelor Dad Pads: The Rise of SoloDwelling

With one-person households leading projected growth across all English regions outside of London, solo dwellers are an important force to consider in designing tomorrow’s homes. With young adults increasingly living longer with their parents or flatmates, 45-65 year-old men have driven 72% of solo-dwelling growth over the past two decades
Women over 70 are still the largest block of singletons, so a higher proportion of households are single-female (15.2%) than single-male (12.7%). But lone-male households were more broadly spread among different age groups, and had considerably higher proportions of private renters and mortgagors than their female counterparts. Taken together, these trends suggest a market for private rental and owner-occupied bachelor pads and for single men in their 40s to 60s (peaking in the 50s), particularly in regions such as London, the South East, and North West. But with divorcees seeming to contribute to the upsurge of single-living men in midlife, many may require ‘bachelor-dad pads’ with multiple bedrooms for visiting or part-time resident children.
While the majority of female single-person households are owner-occupiers in older age groups who may simply remain in the homes they once shared with partners and/or children, there is certainly a market for bachelorette pads as well, especially in London and the South East. 2020 did see a slight decline in solo-dwelling, which could signal a turning tide for this trend. This post-pandemic decrease in living alone appears to be driven by those 65 and over, which may align with the growth of multi-generational households.98
Downsizers or Grandsizers? Aging Baby Boomers
While older couples are also projected to make up a growing segment of all households and hold an outsize proportion of wealth, data suggests the market for downsizing properties may not be that substantial. Research conducted by the Department of Communities and Local Government (DCLG) in 2013 found that only 3% of retired households had moved in the preceding year, compared to 10% of households overall.99 Despite much excitement about older households downsizing as the missing piece in solving the housing crisis puzzle, many have argued that most older owner-occupiers do not stand to realise a significant financial gain from downsizing after disruption and moving cost have been considered, perhaps especially in light of increasing stamp duties.100
The RIBA’s mid-pandemic research identified desire for homes to accommodate grown-up children or grandchildren as the strongest driver in domestic redesign aspirations during lockdown—especially among those over 55.101 Grandparents seem more inclined to be ‘grandsizers’ than downsizers, wanting additional bedrooms to host visiting family if they can afford them, and sufficient living space for entertaining. The vast majority of over-65s (74%) own their homes outright, so while this generation holds considerable wealth, they are more likely to be renovators than homebuyers.
Further deterrents to downsizing may include loss of emotional connection and perceived social status attached to home, desire to maintain existing social networks (especially with neighbours), loss of spare bedrooms to host family (especially grandchildren), and a lack of

33
affordable and attractive options in desirable areas.102 These factors may help account for what seems like a mismatch between the percentage of over-65s who express interest in downsizing with actual moving rates in these age bands. And, after pandemic-time isolation from families and neighbours, older people may now be even less likely to make moves that hamper their ability to host family members or disconnect them from placebased social networks. Moving closer to family does become a stronger motivation for downsizing as people age from their 50s to 90s, increasingly requiring accessible, single-level homes with good natural lighting and lowmaintenance outdoor space as they become more homebound. Enduring desire for social distancing also appears to increase with age, with 63% of 50-69 year-olds, and over 70% of over-70s reporting that they still avoid crowded places two years into the pandemic.103 Increasingly home-based due to retirement and well-being needs, good quality residential design and space for outdoor socialising will be especially important to Grandsizers.
Eco Pragmatist Gen Zers
Gen Zers appear to be largely following in their Millennial older siblings’ footsteps by continuing to live in cities, declining to drive, and renting in the private sector in larger numbers (rising from 43% in 2005 to 66.8% in 2020) than previous generations did at the same age. WFH rates are currently lowest among 16-29 year-olds, most likely reflecting their budding professional progression rather than a generational preference. But Gen Zers are currently keener than other age groups to get out of cramped WFH conditions and back to physical workspaces, where they benefit from social interaction and mentorship
opportunities. Ethical and sustainable values will be especially critical to the housing decisions of today’s 16-24 year-olds as the older members of this cohort age into key family forming and home-buying life stages over the next 15 years. Increasing numbers of Gen Zers are likely to live longer with their parents and share housing with unrelated flatmates. We have seen a continuing trend of households headed by the youngest adults being over-represented in the private rental sector (PRS), though 14.3% of 1624 year-olds were homeowners in 2020—a considerable increase from 8.5% in 2015. While policy and economic changes have likely played a role, these trends align with the stereotype of Gen Zers as eco-conscious pragmatists who are more geared towards stable career and financial goals than the Millennial cohort were at a similar age.
The growth of single-person, multi-generational, and older households illustrates competing societal desires to balance independence and interconnection, accentuated by the pandemic. But it is important to reiterate that families with dependent children, couples (some of whom will go on to have children), and those under 55 are still the major forces to consider in the market for mortgaged homes.
Eco Pragmatist
Gen Zers: 16-24
• Notable uptick in home-ownership for this age group since 2015
• But generally more likely to rent in cities & drive less than older generations at the same age

• Less demand for WFH space, stronger desire to return to offices
• Strong demand for ethical and sustainable design
34
Employment Rates
60 40 0 20 100% 80 Men Women Source: Irvine
al., 2022. 1981 2001 1991 2011 2021 1971 1976 1986 2006 1996 2016
for Men and Women 1971-2020
et
Open-Plan Backlash
• Diverging demands for more enclosed spaces for some, and more open-plan space for others
• Increased demand for high acoustic privacy / isolation via layout, materials, & furnishing

• High demand for semi-open or flexible layouts with some form of sliding, pocket, French, accordion, or barn doors to segment spaces for different needs
• Continued demand for more domestic space per person
• Extensions, sheds, and other distinct spaces for working, exercising, or learning from home
• Greater number of smaller bedroom/ studies to separate sleep and work functions
Open-Plan Backlash
The popularity of open-plan layouts—perhaps one of the most notable interior design trends of the last century—may finally be at a turning point. While open-plan homes promised to fulfil a modern dream of light and spaciousness, they delivered an acoustic and spatial disaster for many families who suddenly found parents and children sharing a single common space to work, learn, and socialise remotely from during the pandemic.
Our 2014 research reported estimates that at least 67% of homes built since 2003 had open-plan layouts, and research conducted by RESI in 2019 suggested that at least 6.25 million British households were configured in this style.104 RESI’s research found that families with dependent children over four reported open-plan layouts to be three times as important to home satisfaction before the pandemic. 105
Come 2020, however, the tide began to turn with a RIBA survey finding that nearly a quarter of homeowners wanted to reconfigure the layout of their homes. RIBA reported that 9% of homeowners wanted more enclosed rooms as a result of lockdown, though 14% still wanted more open-plan spaces.106 Meanwhile in the US, the AIA published research finding double-digit year-on-year declining interest levels in open-plan home layouts—a net decrease from 56% of firms reporting popularity of open-plan home layout with clients in 2018, to 33% in 2020.107 Interest in residential reconfiguration is highest among older Millennials and ‘Xennials’ (born around the Millennial and Gen X divide), while younger Millennials are especially keen on extending their homes and crafting home office spaces.108 As RESI have pointed out, the total floor area of open-plan living/dining/kitchen spaces often ends up being smaller than the total area of these spaces when constructed separately—particularly in new-build accommodation.109 The downsides of openplan designs are potentially far more dire in smaller homes, which younger adults are more likely to live in.
With WFH and hybrid work projected to continue, people may increasingly favour more defined living areas in which at least one of the kitchen, living room, or dining room is a distinct space. The increasing popularity of home cooking and meal-prep kits means that we are unlikely to see desire for smaller kitchens, or a relegation of this room to the ‘backstage’ functional zone it historically occupied. Alternatively, many may still value a larger open living space accompanied by a greater number of smaller bedroom/studies in order to separate sleep and work functions—often now impractically housed together in larger bedrooms containing desks we once rarely used. WFH is also likely to drive demand for highly acoustically insulated space via materials, layout, and furnishing. Irrelevant but intelligible speech—such
35
16-24 25-34 35-44 45-54 55-64 65+ Percentage Owning With Mortgage by Age (England) 0 10 40 70 20 2004 2005 2006 2007 2008 2009 2010 2011 2012 2013 2015 2016 2017 2018 2019 2020 2014 50 80% 30 60
Source: MHCLG, 2020b.
as family members on Zoom calls or children playing close by—is highly disruptive. A mere three-second interruption can double the number of mistakes one makes, so the acoustic quality of our homes will be a major determinant of WFH productivity potential.
Still, RESI’s 2019 survey found that private gardens, balconies, and open-plan living areas were the spaces that mattered most on average to happiness with one’s home, begging the question of whether semi-open layouts with some form of flexible or sliding doors may provide a happy medium to the open-plan conundrum. Floorplans in which kitchen/dining/living areas open onto each other, but can also be closed off via sliding
pocket, French, accordion, or barn doors to segment spaces for different needs are likely to be highly in demand. RIBA’s survey found 8% of homeowners wanting more flexible living layouts. While such partitions are unlikely to provide full acoustic privacy, visual privacy and the sense of having one’s own, enclosed space are also key to happiness with our workspace.110
The trend towards increasing desire for more domestic space per person we noted in the 2014 research is also likely to keep growing in the age of working, exercising, and socialising from home—though research shows that Britons are keen to get back to socialising in person and continue exercising outside. Yet, with a
Questionnaire: What Specific Things Would You Change in the Design of Your Home as a Consequence of Having Spent More Time There During Lockdown?
Reconfigure existing spaces
None
Create more space by extending my home
Create an office space so that I can more easily work from home
Improve the amount of natural daylight
Improve its energy efficiency and impact on the planet
Make it more open plan
Create more space just for me
Improve access from inside my home to private outdoor space
Improve the sound-proofing between spaces
Sacrifice the open-plan design in favour of creating more separate rooms
Make it more flexible by having rooms that can easily be divided
Create better space for my children to study at home
Accommodate my older relatives Other
Accommodate my grown-up children or grandchildren
Source: Chart adapted from RibaJ.com (Young, 2020).
Green Intentions Increasing Interest
in:
• Sustainable, biophilic, ethical, and healthy spaces, places, experiences, and brands in the built environment
• Transparency, sustainable practices, and accountability across supply chains
• Energy-efficient homes and electric vehicle facilities
• Amenities merging indoors and outdoors such as solariums, skylights, decks, patios, and rear extensions
• Natural materials, biodiversity net gain, integrated planting features, biomimetic patterns & textures, sustainable and VOCfree finishing materials
• These drivers are especially strong for Millennials and Gen Zers
36
0 5 15 25 35% 10 20 30 24-34 Age range 35-44 45-54 55-64
Future Proofing
• Technology responding to future threats such as temperature moderation for increased variation, flood defences, health monitoring systems
• Interest in amenities supporting self- and community-sufficiency such as allotments and local supply chains
• Common outdoor spaces supporting increased interest in local community and outdoor socializing
• Developments without shared indoor entryways, lifts, etc. for continued social distancing (especially for vulnerable populations)
greater variety of activities happening inside the home, desire for distinct spaces such as extensions, sheds, annexes, over-garage studios, and loft conversions is likely to be high. Architecture firms have also reported increasing demand for defined and flexible spaces for special functions such as exercise and yoga, homeschooling, and meditation since the pandemic.111
Green Intentions: Rising Desire for Biophilic, Ethical, Sustainable, & Healthy Spaces

The pandemic also appears to have accelerated a pre-existing trend towards Britons making lifestyle and purchasing choices in line with environmentally sustainable, ethical, and health-oriented values. Thirty-two per cent of consumers reported adopting more sustainable lifestyles, while another 28% reported that they have discontinued buying specific products based on environmental or ethical concerns during the pandemic.112 These motivations are especially prevalent for those in younger age groups— strongest for Gen Zers and followed by Millennials.113
At the home level, 27% of British homeowners now want to see evidence that architects will minimize environmental impact in the design of their home, and 31% are prioritising architecture firms which commit to fighting climate change.114 Demand for energy efficient designs and technology, products aimed at improving indoor air quality, and ‘decontamination’ zones such as utility rooms has risen since 2020.115 Electric vehicle sales doubled in the year to January 2022, indicated increased demand for residential and neighbourhood charging facilities.116 Rising awareness of the well-being benefits of biophilic design is likely
to drive interest in natural materials like wood, wool, and stone; integrated planting features; biomimetic patterns and textures; and sustainable flooring, paints, and other finishing materials free from volatile organic compounds. We are likely to see more requests for residential amenities merging indoors and outdoors, including solariums, skylights, decks, pergolas, patios, fire and water features, ‘outdoor rooms’, and rear extensions which flow seamlessly into garden spaces.
The 15-minute neighbourhood vision neatly complements circular economy principles of local production, fabrication, re-use, and waste reduction. These shifting values and lifestyles will drive growing desire for sustainable practices, transparency, and accountability across supply chains in the home-building and interior design domains.

Future-Proofing
Looking forward to the next potential catastrophe, interest in self- and community sufficiency is growing. This may take the form of residential technologies designed to protect our homes and health, such as smart building systems responding to extreme temperature variation and health monitoring technology integrated into toilets. With new and frightening COVID-19 variants still on the horizon, many may still prefer housing without shared indoor corridors and elevators, minimising the potential virus transmission vectors of surfaces and airspace used by many families.
As supply chains broke down and local lanes became the centre of our lives during the pandemic, people became increasingly interested in self-sufficiency—
37
planting new vegetable gardens, baking their own bread, and brewing their own beer. Beyond our own homes, developments designed to balance our desires for both independence and interdependence—promoting pro-social bonds between neighbours— will enhance quality of life and bolster community resilience when the next environmental or social challenge strikes.
As of February 2022, 28% of British adults reported always or often maintaining social distancing outside their own homes and 45% said they avoid close contact with those outside their homes, suggesting continued need for outdoor social spaces in residential developments.117 These rates are considerably higher for vulnerable groups like the immunocompromised and disabled, with 57% of disabled people still avoiding close contact with those outside their homes, and 63% saying they still spend more time at home because of COVID-19.118 But, as many discovered during quarantine, having strong interpersonal connections is also critical to well-being. Research
conducted on natural disasters like the 1995 earthquake in Kobe, Japan, has found that neighbours are often responsible for saving more lives than fire trucks and ambulances in crisis situations.119
Research from the University of Cambridge’s Well-Being Institute found that people living in neighbourhoods with central, common greenspaces were more connected with their neighbours. Comparing two Cambridge neighbourhoods of terraced homes—one laid out traditionally with private back gardens, and another where the majority of outdoor space was held communally in central courtyards and gardens—the study found residents with more common space were more likely to connect socially.120 Such ‘courtyard communities’ may be a post-pandemic housing ideal, balancing the desire to maintain some degree of social distance with increased interest in local community and outdoor socialising.
Proportion of Adults Adopting Behaviours Because of the Coronavirus (COVID-19) Pandemic, by Disability Status, Great Britain, (16 to 27 February 2022)
Frequent hand washing or use of hand gel
Wear face coverings
Avoid crowded places
Spend more time at home
Open windows or doors in indoor spaces
Avoid close contact with people I do not live with Shop online more
Avoid public transport
Use digital technology more for socialising,hobbies and activities
Work from home
No longer go into work or school whenexperiencing cold or flu symptoms
Walk or cycle more
Spend more time outdoors
None of the above
Source: Office for National Statistics, 2022e.
38
0 20 40 60 80 10 30 50 70 90 100% Disabled people
Non-disabled people
KEY HIGHLIGHTS
• Well-being - Pandemic life has made us more motivated to find homes that support our well-being and meet competing requirements on residential space.
• Decreased car-based travel - With car-based travel declining 13% since 2002, the pandemic has accelerated a pre-existing shift toward more local and sustainable ways of living and working, which are likely to propel continued growth of eco-conscious trends and values.
• Increased hybrid working - New patterns of hybrid work and intermittent commuting are driving demand for WFH amenities in London, the South West, South East, East of England, and East Midlands in particular, and especially for 30-49 year-olds.
• Open plan backlash - Working and learning from home has spurred an “open-plan” backlash, with flexible / sliding-door layouts and defined workspaces likely to be highly desirable.
• Over one third of adults now live in multi-generational households - 34% of British adults are now estimated to be living intergenerationally, which may increase demand for multiple kitchens and front doors, semiprivate extensions, and studios over garages.
• Increase in bachelor & bachelor dad pads - There is a strong market for bachelor and ‘bachelor dad’ pads: private rental and mortgaged dwellings for single men in their 40s-60s.
• Importance of green spaces - The pandemic has increased desire for proximity to green spaces and biophilic design —from balconies and indoor/outdoor living features to communal greens and neighbourhood parks.
• Environmental sustainability - We are seeing increasing demand for ethical, resilient, and health-promoting features such as electric vehicle charging, indoor air quality moderation, biodiversity net gain, and transparent supply chains, especially in the young generations.
• 15-minute neighbourhood - Hybrid workers spending more time at home will necessitate delivery of non-residential amenities needed to ‘live, work, and thrive’ within an easy distance of home, such as coworking spaces, childcare and healthcare facilities, recreational areas, and independent shops.
• Tenure shift - The early 21st century saw a dramatic decline in owner occupation and increase in private rentals, which has levelled off since 2014, while the social rental sector has remained constant throughout the period.
39
CONCLUSION
As the pandemic becomes endemic, it is almost hard to remember how strange things like wearing masks in shops and on buses would have seemed at the start of 2020. While life may seem to have ‘returned to normal’ in some ways, it is surely a new version of normal. While more people are going back to offices and pubs, many are still dining outdoors in cold weather, attending job interviews or exercise classes on Zoom, and staying home at the slightest hint of a cold.
Placing COVID-19-era societal transformation in the context of the long-term demographic changes we previously charted to 2014, we have seen that many pandemicaccentuated shifts such as working from home, multi-generational living, intermittent commuting, and single-living were already well underway by 2019. Probably the single greatest change from our 2014 report has been the slowing growth of the private rental market and plateauing decline of the owner-occupied and social rented sectors.
Pandemic life has clearly made us more focused on our homes—whether they meet our old and new needs, reflect our personalities and aesthetics, and support our health and well-being. Spending more time at home has made many more people motivated to modify their homes to better suit their families, or to find a home that will better match their new lifestyles.
The lasting impact on our homes may be even greater for groups like the elderly, vulnerable, disabled, and those with young children, who may continue to be more cautious and home-based for years to come. We sincerely hope that the trends we have identified here will inform residential design and community planning better suited to the specific and evolving needs of various family and household types— not just a singular roadmap for tomorrow’s home, but a multifaceted vision for tomorrow’s homes.
40
REFERENCES
1. Office for National Statistics. (2021a). Families and households in the UK: 2020.
https://www.ons.gov.uk/peoplepopulationandcommunity/birthsdeathsandmarriages/families/bulletins/familiesandhouseholds/2020
2. Ministry of Housing, Communities, & Local Government. (2020a). English Housing Survey: Headline Report, 2019-20.
https://assets.publishing.service.gov.uk/government/uploads/system/uploads/attachment_data/file/945013/2019-20_EHS_Headline_Report.pdf
3. Ministry of Housing, Communities, & Local Government, 2020a.
4. Office for National Statistics. (2020a). Population estimates for the UK, England and Wales, Scotland and Northern Ireland: mid-2019.
https://www.ons.gov.uk/peoplepopulationandcommunity/populationandmigration/populationestimates/bulletins/annualmidyearpopulationestimates/mid2019estimates
5. Ministry of Housing, Communities, & Local Government. (2020b). Data derived from: English Housing Survey 2019 to 2020: Section 1 household tables.
https://www.gov.uk/government/statistics/english-housing-survey-2019-to-2020-headline-report
6. Office for National Statistics, 2020a.
7. Office for National Statistics. (2019a). The Cost of Living Alone. https://www.ons.gov.uk/peoplepopulationandcommunity/birthsdeathsandmarriages/families/articles/ thecostoflivingalone/2019-04-04
8. Office for National Statistics. (2021b). Data derived from: United Kingdom population mid-year estimate. https://www.ons.gov.uk/peoplepopulationandcommunity/populationandmigration/populationestimates/timeseries/ukpop/pop
9. Office for National Statistics. (2019a).
10. Office for National Statistics, 2019a.
11. Office for National Statistics. (2019b). Families and households in the UK: 2019.
https://www.ons.gov.uk/peoplepopulationandcommunity/birthsdeathsandmarriages/families/bulletins/familiesandhouseholds/2019
12. Office for National Statistics. (2021c). Overview of the UK population: January 2021.
https://www.ons.gov.uk/peoplepopulationandcommunity/populationandmigration/populationestimates/articles/overviewoftheukpopulation/january2021
13. Office for National Statistics, 2019a.
14. Ministry of Housing, Communities, & Local Government, 2020b.
15. Ministry of Housing, Communities, & Local Government, 2020b.
16. Ministry of Housing, Communities, & Local Government, 2020b.
17. Office for National Statistics, 2019a. Office for National Statistics. (2017). Families and households in the UK: 2017.
https://www.ons.gov.uk/peoplepopulationandcommunity/birthsdeathsandmarriages/families/bulletins/familiesandhouseholds/2017
18. Ministry of Housing, Communities, & Local Government, 2020b.
19. Office for National Statistics. (2022a). Young adults living with their parents.
https://www.ons.gov.uk/peoplepopulationandcommunity/birthsdeathsandmarriages/families/datasets/youngadultslivingwiththeirparents
20. Office for National Statistics, 2019b.
21. Ministry of Housing, Communities, & Local Government, 2020a.
22. Office for National Statistics. (2019c). Childbearing for women born in different years, England and Wales: 2018.
https://www.ons.gov.uk/peoplepopulationandcommunity/birthsdeathsandmarriages/conceptionandfertilityrates/bulletins/childbearingforwomenbornindifferentyearsenglandandwales/2018
23. Office for National Statistics. (2020b). Provisional births in England and Wales: 2020. https://www.ons.gov.uk/peoplepopulationandcommunity/birthsdeathsandmarriages/livebirths/articles/ provisionalbirthsinenglandandwales/2020
24. Ministry of Housing, Communities, & Local Government, 2020b.
41
25. Ministry of Housing, Communities, & Local Government, 2020b. Please note: Apparent increase in proportion of 35-44 mortgagors from low point of 46% in 2016-17 is not statistically significant.
26. Ministry of Housing, Communities, & Local Government, 2020b.
27. Ministry of Housing, Communities, & Local Government, 2020b.
28. Ministry of Housing, Communities, & Local Government, 2020b.
29. Ministry of Housing, Communities, & Local Government, 2020b.
30. Ministry of Housing, Communities, & Local Government, 2020b.
31. Carter, A., & Swinney, P. (2018, March 19). Where are the UK’s youngest and oldest city populations? BBC News.
https://www.bbc.com/news/uk-43316697
32. Centre for Cities. (2021). Data derived from: City Monitor.
https://www.centreforcities.org/city-monitor/?path=table&themes=population,housing&topics=covid-impact
33. Ozcan, P., Mohlmann, M., & Krishnamoorthy, C. (2017). Who shares and who doesn’t: Results of the UK sharing economy survey 2017. Warwick Business School.
https://www.wbs.ac.uk/wbs2012/assets/PDF/downloads/press/ResultsofUKSharingEconomyConsumerSurvery2017.pdf
34. Department for Transport. (2020a). Data derived from: National Travel Survey: 2019 Travel Tables.
https://www.gov.uk/government/statistics/national-travel-survey-2019
35. Department for Transport, 2020a.
36. Department for Transport. (2020b). National Travel Survey: England 2019.
https://assets.publishing.service.gov.uk/government/uploads/system/uploads/attachment_data/file/906276/national-travel-survey-2019.pdf
37. Department for Transport, 2020b.
38. Department for Transport, 2020b.
39. Department for Transport, 2020a.
40. Department for Transport, 2020a.
41. Clayton, J. (2021, April 6). Remote working: Is Big Tech going off work from home? BBC News.
https://www.bbc.com/news/technology-56614285
42. Office for National Statistics. (2020c). Coronavirus and homeworking in the UK labour market: 2019.
https://www.ons.gov.uk/employmentandlabourmarket/peopleinwork/employmentandemployeetypes/articles/coronavirusandhomeworkingintheuklabourmarket/2019
43. Office for National Statistics, 2020c.
44. Office for National Statistics. (2020d). Homeworkers against various measures and demographics, triennially: 2013 to 2019.
https://www.ons.gov.uk/employmentandlabourmarket/peopleinwork/employmentandemployeetypes/adhocs/11513homeworkersagainstvariousmeasuresanddemographicstriennially2013to2019
45. Graphic from 2014 report
46. Office for National Statistics, 2020c.
47. Office for National Statistics. (2022c, March 29). Coronavirus (COVID-19) latest insights.
https://www.ons.gov.uk/peoplepopulationandcommunity/healthandsocialcare/conditionsanddiseases/articles/coronaviruscovid19/latestinsights
48. Office for National Statistics. (2020e). Coronavirus and homeworking in the UK: April 2020.
https://www.ons.gov.uk/employmentandlabourmarket/peopleinwork/employmentandemployeetypes/bulletins/coronavirusandhomeworkingintheuk/april2020
49. Office for National Statistics, 2020e.
50. Office for National Statistics, 2021e.
51. Office for National Statistics. (2021d). Coronavirus (COVID-19) latest insights: Work.
https://www.ons.gov.uk/peoplepopulationandcommunity/healthandsocialcare/conditionsanddiseases/articles/coronaviruscovid19latestinsights/work
42
52. Office for National Statistics. (2022b). Homeworking and spending during the coronavirus (COVID-19) pandemic, Great Britain: April 2020 to January 2022. https://www.ons.gov.uk/employmentandlabourmarket/peopleinwork/employmentandemployeetypes/articles/ homeworkingandspendingduringthecoronaviruscovid19pandemicgreatbritain/april2020tojanuary2022
53. Office for National Statistics. (2020f). Data derived from: Labour market profile – Great Britain. https://www.nomisweb.co.uk/reports/lmp/gor/2092957698/report.aspx
54. Office for National Statistics. (2021f). Homeworking hours, rewards and opportunities in the UK: 2011 to 2020. https://www.ons.gov.uk/employmentandlabourmarket/peopleinwork/labourproductivity/articles/homeworkinghoursrewardsandopportunitiesintheuk2011to2020/2021-04-19
55. Office for National Statistics. (2021e). Business and individual attitudes towards the future of homeworking, UK: April to May 2021. https://www.ons.gov.uk/employmentandlabourmarket/peopleinwork/employmentandemployeetypes/articles/businessandindividualattitudestowardsthefutureofhomeworkinguk/ apriltomay2021
56. Gensler. (2020). UK Workplace Survey 2020: The Benefits of a Hybrid Work Model. Gensler Research Institute. https://www.gensler.com/gri/uk-workplace-survey-2020
57. Office for National Statistics, 2021d.
58. Office for National Statistics, 2021e.
59. Office for National Statistics, 2021e.
60. Office for National Statistics, 2021e.
61. Office for National Statistics, 2021f.
62. Office for National Statistics, 2021f.
63. Office for National Statistics, 2021e.
64. Office for National Statistics, 2021e.
65. Young, E. (2020, October 9). Homes’ influence on mental health boosts architects’ value. RIBAJ. https://www.ribaj.com/intelligence/riba-homeowners-survey-home-design-affects-mental-health
66. American Institute of Architects. (2020). AIA Home Trends Design Survey. http://info.aia.org/AIArchitect/2020/0911/aia-interactive/index.html#
67. London Assembly Housing Committee. (2020). Half of Londoners wanting to move home want out of London. https://www.london.gov.uk/press-releases/assembly/escaping-the-city-post-covid
68. Fitch, H. F. (2021, January 1). How coronavirus has shaped the home of tomorrow. Financial Times. https://www.ft.com/content/546716b8-bdec-48fd-9f5b-32304de7fcee
69. Reallymoving. (2021). 10 statistics that tell the story of 2020 for UK home movers. https://www.reallymoving.com/blog/january-2021/10-statistics-that-tell-the-story-of-2020-for-uk-home-movers
70. Office for National Statistics. (2021g). Population estimates for the UK, England and Wales, Scotland and Northern Ireland: mid-2020. https://www.ons.gov.uk/peoplepopulationandcommunity/populationandmigration/populationestimates/bulletins/annualmidyearpopulationestimates/mid2020
71. Zoopla. (2021). UK house price index. https://advantage.zpg.co.uk/wp-content/uploads/2021/07/UK-House-Price-June-final-1.pdf
72. Mulholland Research & Consulting. (2003). Perceptions of Privacy and Density in Housing. Popular Housing Group. https://docplayer.net/21097990-Perceptions-of-privacy-and-density-in-housing.html
73. Epstein, S. (2021, August 31). It’s finally time for the 15-minute neighborhood. Wired UK. https://www.wired.co.uk/article/15-minute-neighbourhood-covid
74. Epstein, 2021.
43
75. British Council of Offices. (2019). The Rise of Flexible Workspace in the Corporate Sector.
https://www.bco.org.uk/Research/Publications/The_Rise_of_Flexible_Workspace_in_the_Corporate_Sector.aspx
76. Butler, S. (2020, September 16). John Lewis could convert almost half its Oxford Street store into offices. The Guardian. https://www.theguardian.com/business/2020/sep/16/john-lewis-convert-oxford-street-store-into-offices
77. Nazir, S. (2021, September 30). Former Northampton Debenhams store to be turned into student flats. Retail Gazette.
https://www.retailgazette.co.uk/blog/2021/09/former-northampton-debenhams-store-to-be-turned-into-student-flats/
78. Department for Transport, 2020a.
79. Office for National Statistics. (2022d). Coronavirus (COVID-19) latest insights: Lifestyle.
https://www.ons.gov.uk/peoplepopulationandcommunity/healthandsocialcare/conditionsanddiseases/articles/coronaviruscovid19latestinsights/lifestyle
80. Deloitte. (2021). The Leisure Consumer 2021: Emerging from the pandemic.
https://www2.deloitte.com/content/dam/Deloitte/uk/Documents/consumer-business/deloitte-uk-the-leisure-consumer-2021.pdf
81. Deloitte, 2021.
82. Department for Transport, 2020a.
83. Butler, S. (2021, September 15). UK’s independent shops record first rise in four years as chains suffer. The Guardian.
https://www.theguardian.com/business/2021/sep/16/uks-independent-shops-record-first-rise-in-four-years-as-chains-suffer
84. Nazir, 2021.
85. Office for National Statistics. (2020g). Household projections for England: 2018-based.
https://www.ons.gov.uk/peoplepopulationandcommunity/populationandmigration/populationprojections/bulletins/householdprojectionsforengland/2018based
86. Office for National Statistics. (2018). Household projections for England – household type projections: 2016-based.
https://www.ons.gov.uk/peoplepopulationandcommunity/populationandmigration/populationprojections/bulletins/2016basedhouseholdprojectionsinengland/2016based
87. Ministry of Housing, Communities, & Local Government, 2020.
88. Office for National Statistics. (2022f). Coronavirus and the social impacts on Great Britain.
https://www.ons.gov.uk/peoplepopulationandcommunity/healthandsocialcare/healthandwellbeing/datasets/coronavirusandthesocialimpactsongreatbritaindata
89. Irvine, S., Clark, H., ward, M., Francis-Devine, B. (2022). Women and the UK Economy: Research Briefing. House of Commons Library. https://researchbriefings.files.parliament.uk/documents/SN06838/SN06838.pdf
90. Office for National Statistics, 2019b.
91. Ministry of Housing, Communities, & Local Government, 2020.
92. Office for National Statistics, 2018.
93. Aviva. (2020). How We Live: Executive Report, September 2020. https://www.aviva.com/newsroom/news-releases/2020/09/1-in-3-homes-are-multi-generational/
94. Aviva, 2020.
95. ONS. 2022a. Families and households in the UK: 2021, 9 March, 2022 Release. Office for National Statistics. (Data tables: https://www.ons.gov.uk/peoplepopulationandcommunity/birthsdeathsandmarriages/families/datasets/youngadultslivingwiththeirparents)
96. Burgess, G., Hamilton, C., Jones, M., & Muir, K. (2017). Multigenerational Living: An Opportunity for UK House Builders? Final report to the NHBC Foundation-source document. Cambridge Centre for Housing & Planning Research. https://www.cchpr.landecon.cam.ac.uk/system/files/documents/multigenerational_living_final_report.pdf
97. Office for National Statistics, 2018.
98. Office for National Statistics, 2021a.
99. Department for Communities & Local Government. (2014). English Housing Survey 2012 to 2013: Household Report. https://assets.publishing.service.gov.uk/government/uploads/system/uploads/attachment_data/file/335751/EHS_Households_Report_2012-13.pdf
44
100. Pannell, J., Aldridge, H., & Kenway, P. (2012). Housing Options for Older People. New Policy Institute. https://www.npi.org.uk/files/5213/7485/1289/Market_Assessment_of_Housing_Options_for_Older_People.pdf
101. Young, 2020.
102. Park, A., Ziegler, F. A Home for Life? A Critical Perspective on Housing Choice for “Downsizers” in the UK. Architecture_MPS, 9(1): 2. DOI: https://doi.org/10.14324/111.444.amps.2016v9i2.001.
103. Office for National Statistics. (2022e). Coronavirus (COVID-19): disabled people are more likely to feel life will never return to normal. https://www.ons.gov.uk/peoplepopulationandcommunity/wellbeing/articles/coronaviruscovid19disabledpeoplearemorelikelytofeellifewillneverreturntonormal/2022-03-16
104. RESI. (2020). The Science of a Happy Home. https://resi.co.uk/happy_homes
105. RESI, 2020.
106. Young, 2020.
107. American Institute of Architects, 2020.
108. Young, 2020.
109. RESI, 2020.
110. Kim, J., & de Dear, R. (2013). Workspace satisfaction: The privacy-communication trade-off in open-plan offices. Journal of Environmental Psychology, 36, 18–26. DOI: 10.1016/j.jenvp.2013.06.007
111. Kolomatsky, M. (2020, October 22). How is the pandemic shaping home design? The New York Times.
https://www.nytimes.com/2020/10/22/realestate/pandemic-shaping-home-design.html?auth=login-email&login=email
112. Deloitte, 2021.
113. Deloitte, 2021.
114. Young, 2020.
115. Kolomatsky, 2020.
116. Philip, V. (2022, February 3). U.K. Car Sales Jump 28% in January on Electric Demand. Bloomberg. https://www.bloomberg.com/news/articles/2022-02-04/u-k-car-sales-jump-25-in-january-on-electric-vehicle-demand#:~:text=One%20in%20five%20buyers %20opted,to%20Covid%2D19%20lockdown%20measures.
117. Office for National Statistics, 2022e.
118. Office for National Statistics, 2022e.
119. Vedantam, S. (2011, July 4). The key to disaster survival? Friends and neighbors. NPR. https://www.npr.org/2011/07/04/137526401/the-key-to-disaster-survival-friends-and-neighbors
120. Anderson, J. (2015). “Living in a communal garden” associated with well-being while reducing urban sprawl by 40%: a mixed-methods cross-sectional study. Frontiers in Public Health, 3(173). https://doi.org/10.3389/fpubh.2015.00173
Additional References for Charts
Office for National Statistics. (2019d). National population projections: 2018-based. https://www.ons.gov.uk/peoplepopulationandcommunity/populationandmigration/populationprojections/bulletins/nationalpopulationprojections/2018based
Office for National Statistics. (2020h). Data derived from: Single-person households by English and Welsh local authorities, and Scottish council areas, 2012 to 2018. https://www.ons.gov.uk/peoplepopulationandcommunity/birthsdeathsandmarriages/families/ adhocs/11415singlepersonhouseholdsbyenglishandwelshlocalauthoritiesandscottishcouncilareas2012to2018
45
ACKNOWLEDGEMENTS
Author and Researcher - Lily Bernheimer, Space Works Consulting
Consultants and Editors - Roger File - Blenheim Estate Homes, Graham Flint – Pye Homes
Hugh Petter, Robbie Kerr, George Saumarez Smith, Nigel Anderson– ADAM Architecture
With thanks to Jeremy Wakeham and the Partners of Withers LLP for hosting the launch event in November 2022
If you would like to download the reports, please scan one the following QR codes or use the web links provided:
www.adamarchitecture.com/tomorrows-homes www.blenheimestate.com/tomorrowshomes
46
DOWNLOAD THE
REPORTS
ADAM Architecture Website Blemheim Estate Homes Website
World Copyright Reserved
© Lily Bernheimer, Blenheim Estate Homes and ADAM Architecture Limited
November 2022
All rights reserved. No part of this publication may be reproduced, stored in a retrieval system, or transmitted in any form or by any means electrical mechanical, photocopying, recording or otherwise, without permission of the author or editor.
Printed
on recycled paper.
www.adamarchitecture.com www.blenheimestate.com
