Property Development


Subject Parcels
17647 SE TROGE RD DAMASCUS, OR. 97089 CLACKAMAS COUNTY PARCEL NO. 00139193
Prepared by: Stewart Title 1000 SW Broadway, Ste Portland, OR 97205
© 2021 Stewart. All rights reserved. |
750606290
PROPERTYINFORMATION
PROPERTY INFORMATION


GIS MAPS
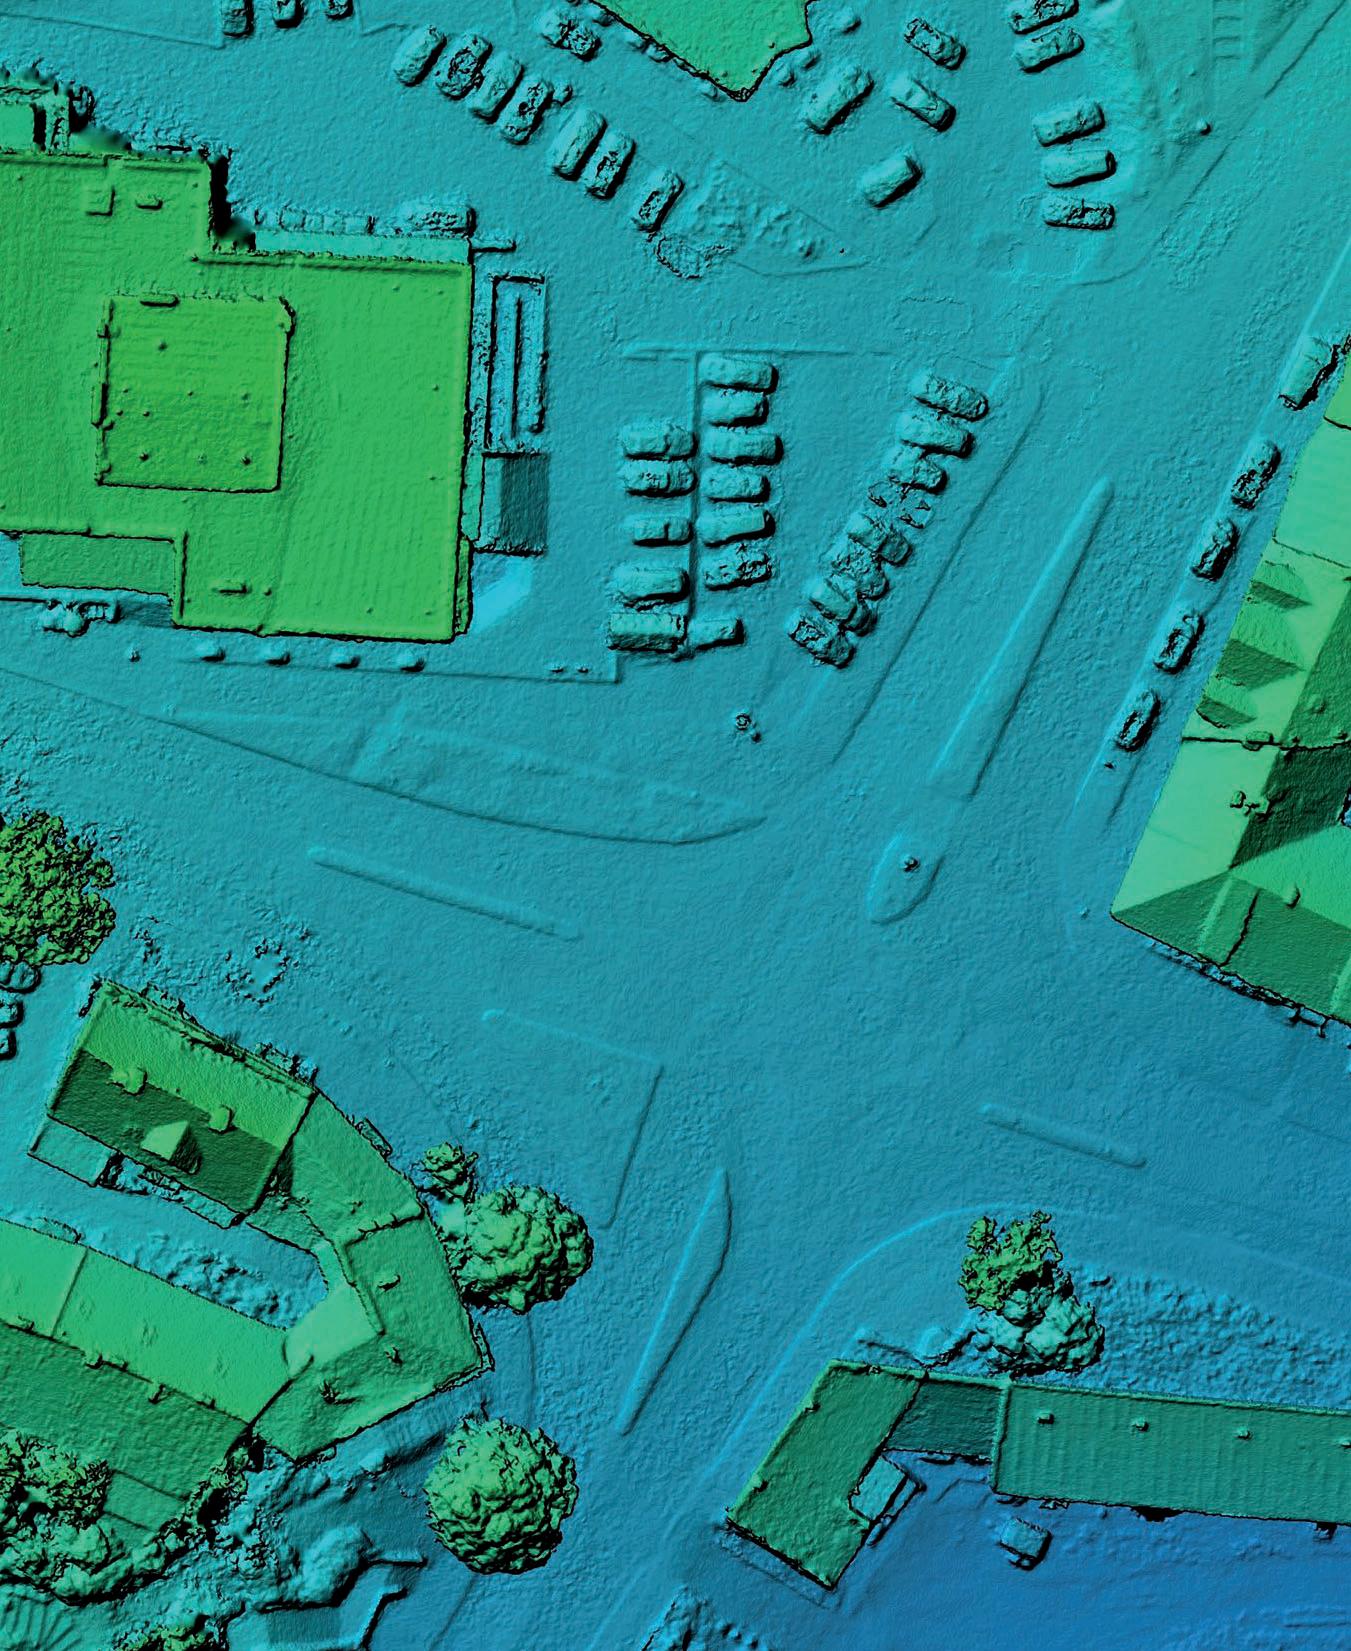
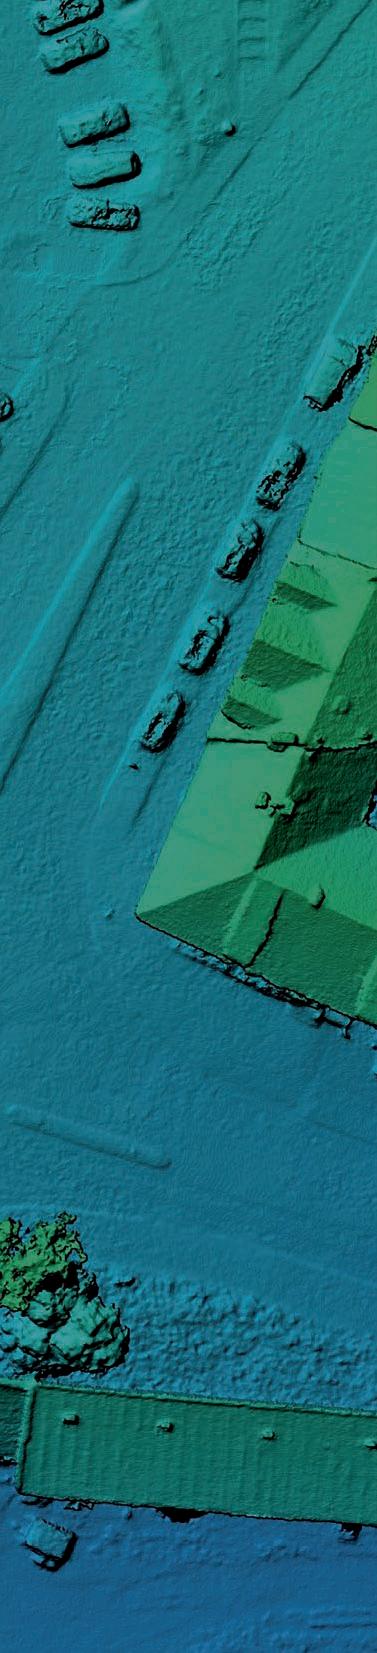 GIS MAPS

S E O L Y M P I C S T
Esri, D g ta G obe, GeoEye, Ear ths ar Geographics, CN ES/A irbus DS , US DA, USGS, AeroGRID, GN, and the G S User Commun ty . 17647 SE Troge Rd 0 250 Fee Leg en d Su bject Parcel Ta xl ots
SE TROGE RD
Source
360 330 370 340 350 360 320 340 330 350 320 320 340 320 330 S E O L Y M P I C S T SE TROGE RD SE AC ADIA ST . 17647 SE Troge Rd 0 340 Fee Leg en d Su bject Parcel Contours sl ope 25 Ta xl ots
UTILITIES


UTILITIES


UTILITIES ELECTRICITY NATURAL GAS NWNatural 800-422-4012http://nwnatural.com/ Comcast/Xfinity 800-934-6489http://www.xfinity.com Verizon 800-483-4100http://www.verizon.com DirectTVProgramming 877-952-6072https://www.directv.com/ TV/INTERNET/PHONE BUNDLES General 800-ASK-USPShttps://www.usps.com Change-of-Address 800-ASK-USPShttps://moversguide.usps.com/ mgo/move-info UNITED STATES POSTAL SERVICE GARBAGE/RECYCLING WATER SERVICE SEWER SERVICE Informa on deemed reliable but is not guaranteed COUNTY RESOURCES https://sos.oregon.gov/blue-book/ Pages/localcounty.aspx CITY RESOURCES http://www.oregoncities.us/ Clackamas County 503-742-4567Clackamas County 503-742-4567 Hood View Garbage and Recycling 503-668-8300 17647 SE Troge Rd, Damascus, OR. 97089 Portland General Electric 800-542-8818 https://portlandgeneral.com

LOCAL BUSINESSES


LOCALBUSINESSES
Business Summary
17647 SE Troge Rd, Damascus, Oregon, 97089
Prepared by Esri Rings: 1, 3, 5 mile radii
Latitude: 45.43619 Longitude: 122.48139
Data for all businesses in area 1 mile 3 miles 5 miles
Total Businesses: 73 972 4,884
Total Employees: 628 8,030 59,875
Total Residential Population: 3,163 54,059 170,011 Employee/Residential Population Ratio (per 100 Residents) 20 15 35
by
Agriculture & Mining 3 4.1% 18 2.9% 28 2.9% 157 2.0% 104 2.1% 807 1.3% Construction 9 12 3% 39 6 2% 140 14 4% 610 7.6% 507 10.4% 13,091 21.9%
Manufacturing 1 1.4% 5 0.8% 20 2.1% 149 1.9% 183 3.7% 4,968 8.3% Transportation 0 0.0% 1 0.2% 27 2.8% 101 1.3% 155 3.2% 1,702 2.8% Communication 1 1 4% 35 5 6% 7 0.7% 113 1.4% 35 0.7% 285 0.5% Utility 0 0.0% 1 0.2% 6 0.6% 37 0.5% 17 0.3% 100 0.2%
Wholesale Trade
Retail Trade Summary
Home Improvement
General Merchandise Stores
Food Stores
Auto Dealers, Gas Stations, Auto Aftermarket
Apparel & Accessory Stores
Furniture & Home Furnishings
Eating & Drinking Places
2 2.7% 34 5.4% 24 2.5% 262 3.3% 188 3.8% 3,382 5.6%
18 24 7% 243 38.7% 188 19 3% 1,837 22.9% 1,023 20.9% 13,642 22.8%
1 1.4% 5 0.8% 20 2.1% 93 1.2% 88 1.8% 964 1.6%
1 1.4% 1 0.2% 6 0.6% 61 0.8% 43 0.9% 1,870 3.1%
1 1 4% 84 13.4% 15 1.5% 461 5.7% 117 2.4% 2,345 3.9%
1 1.4% 4 0.6% 13 1.3% 85 1.1% 100 2.0% 785 1.3%
0 0.0% 1 0.2% 4 0.4% 27 0.3% 69 1.4% 819 1.4%
1 1 4% 2 0 3% 13 1 3% 32 0.4% 71 1.5% 561 0.9%
9 12.3% 133 21.2% 77 7.9% 957 11.9% 311 6.4% 4,735 7.9%
Miscellaneous Retail 4 5.5% 13 2.1% 39 4.0% 122 1.5% 224 4.6% 1,563 2.6%
Finance, Insurance, Real Estate Summary
7 9.6% 33 5.3% 85 8.7% 373 4.6% 504 10.3% 2,934 4.9%
Banks, Savings & Lending Institutions 2 2.7% 9 1 4% 15 1.5% 95 1.2% 81 1.7% 543 0.9%
Securities Brokers

1 1.4% 2 0.3% 9 0.9% 24 0.3% 53 1.1% 172 0.3%
Insurance Carriers & Agents 1 1.4% 2 0.3% 8 0.8% 22 0.3% 67 1.4% 267 0.4%
Real Estate, Holding, Other Investment Offices 3 4 1% 19 3 0% 53 5 5% 232 2.9% 303 6.2% 1,952 3.3%
Services Summary
28 38.4% 202 32.2% 372 38.3% 4,271 53.2% 1,713 35.1% 16,804 28.1%
Hotels & Lodging 0 0.0% 0 0.0% 3 0.3% 19 0.2% 16 0.3% 310 0.5%
Automotive Services 1 1 4% 2 0 3% 16 1 6% 47 0.6% 139 2.8% 618 1.0% Motion Pictures & Amusements 3 4.1% 8 1.3% 26 2.7% 108 1.3% 111 2.3% 813 1.4%
Health Services 5 6.8% 45 7.2% 64 6.6% 2,154 26.8% 309 6.3% 5,645 9.4% Legal Services 0 0 0% 1 0 2% 6 0.6% 19 0.2% 39 0.8% 121 0.2% Education Institutions & Libraries 2 2.7% 65 10.4% 28 2.9% 863 10.7% 82 1.7% 2,708 4.5% Other Services 17 23.3% 80 12.7% 229 23.6% 1,061 13.2% 1,017 20.8% 6,589 11.0%
Government 1 1.4% 17 2.7% 6 0.6% 98 1.2% 42 0.9% 1,973 3.3%
Unclassified Establishments 3 4 1% 1 0 2% 70 7.2% 20 0.2% 414 8.5% 189 0.3%
Totals 73 100.0% 628 100 0% 972 100.0% 8,030 100.0% 4,884 100.0% 59,875 100.0% Source: Copyright 2022 Data Axle, Inc. All rights reserved. Esri Total Residential Population forecasts for 2022 Date Note: Data on the Business Summary report is calculated using Esri’s Data allocation method which uses census block groups to allocate business summary data to custom areas.
Businesses Employees Businesses Employees Businesses Employees
SIC Codes Number Percent Number Percent Number Percent Number Percent Number Percent Number Percent
August 23, 2022 ©2022 Esri Page 1 of 2
by NAICS Codes
Agriculture, Forestry, Fishing & Hunting
Business Summary
17647 SE Troge Rd, Damascus, Oregon, 97089
Rings: 1, 3, 5 mile radii
Prepared by Esri
Latitude: 45.43619 Longitude: 122.48139
Businesses Employees Businesses Employees Businesses Employees
Number Percent Number Percent Number Percent Number Percent Number Percent Number Percent
1 1.4% 7 1.1% 9 0.9% 49 0.6% 27 0.6% 122 0.2%
Mining 0 0.0% 1 0.2% 1 0.1% 3 0.0% 2 0.0% 9 0.0%
Utilities 0 0 0% 0 0.0% 2 0 2% 15 0.2% 3 0.1% 22 0.0%
Construction 9 12.3% 35 5.6% 143 14.7% 609 7.6% 524 10.7% 13,200 22.0%
Manufacturing
1 1.4% 5 0.8% 20 2.1% 154 1.9% 208 4.3% 5,343 8.9%
Wholesale Trade 2 2 7% 34 5.4% 23 2.4% 259 3.2% 174 3.6% 3,309 5.5%
Retail Trade 9 12.3% 108 17.2% 103 10.6% 854 10.6% 687 14.1% 8,530 14.2%
Motor Vehicle & Parts Dealers
Furniture & Home Furnishings Stores
Electronics & Appliance Stores
Bldg Material & Garden Equipment & Supplies Dealers
Food & Beverage Stores
Health & Personal Care Stores
Gasoline Stations
Clothing & Clothing Accessories Stores
Sport Goods, Hobby, Book, & Music Stores
General Merchandise Stores
Miscellaneous Store Retailers
1 1.4% 4 0.6% 9 0.9% 61 0.8% 71 1.5% 566 0.9%
1 1 4% 1 0.2% 7 0 7% 14 0.2% 37 0.8% 245 0.4%
0 0.0% 0 0.0% 3 0.3% 10 0.1% 24 0.5% 219 0.4%
1 1.4% 5 0.8% 20 2.1% 92 1.1% 87 1.8% 947 1.6%
1 1 4% 84 13 4% 13 1.3% 444 5.5% 93 1.9% 1,948 3.3%
1 1.4% 6 1.0% 10 1.0% 70 0.9% 58 1.2% 461 0.8%
0 0.0% 0 0.0% 4 0.4% 24 0.3% 29 0.6% 219 0.4%
1 1 4% 3 0.5% 5 0 5% 33 0.4% 85 1.7% 901 1.5%
1 1.4% 2 0.3% 7 0.7% 23 0.3% 43 0.9% 517 0.9%
1 1.4% 1 0.2% 6 0.6% 61 0.8% 43 0.9% 1,870 3.1%
2 2 7% 2 0.3% 13 1.3% 21 0.3% 85 1.7% 618 1.0%
Nonstore Retailers 0 0.0% 0 0.0% 5 0.5% 0 0.0% 32 0.7% 19 0.0%
Transportation & Warehousing 0 0.0% 1 0.2% 21 2.2% 83 1.0% 129 2.6% 1,428 2.4%
Information 1 1 4% 35 5.6% 12 1.2% 129 1.6% 74 1.5% 657 1.1%
Finance & Insurance 4 5.5% 14 2.2% 32 3.3% 141 1.8% 204 4.2% 1,002 1.7%
Central Bank/Credit Intermediation & Related Activities 2 2.7% 9 1.4% 15 1.5% 95 1.2% 81 1.7% 549 0.9%
Securities, Commodity Contracts & Other Financial Investments & Other Related Activities
1 1 4% 2 0.3% 9 0.9% 24 0.3% 56 1.1% 186 0.3%
Insurance Carriers & Related Activities; Funds, Trusts & Other Financial Vehicles 1 1.4% 2 0.3% 8 0.8% 22 0.3% 67 1.4% 267 0.4%
Real Estate, Rental & Leasing 4 5.5% 19 3.0% 61 6.3% 203 2.5% 348 7.1% 2,014 3.4%
Professional, Scientific & Tech Services 9 12 3% 26 4.1% 114 11 7% 362 4.5% 461 9.4% 2,567 4.3% Legal Services 0 0.0% 1 0.2% 6 0.6% 19 0.2% 47 1.0% 188 0.3%
Management of Companies & Enterprises 0 0.0% 0 0.0% 1 0.1% 3 0.0% 7 0.1% 41 0.1%
Educational Services
Administrative & Support & Waste Management & Remediation Services
3 4 1% 12 1.9% 40 4.1% 188 2.3% 184 3.8% 1,342 2.2%
2 2.7% 66 10.5% 32 3.3% 870 10.8% 108 2.2% 2,776 4.6%
6 8.2% 48 7.6% 86 8.8% 2,377 29.6% 418 8.6% 7,243 12.1% Arts, Entertainment & Recreation 2 2 7% 9 1.4% 23 2.4% 107 1.3% 75 1.5% 694 1.2%
Health Care & Social Assistance
Accommodation & Food Services 9 12.3% 134 21.3% 84 8.6% 988 12.3% 337 6.9% 5,117 8.5% Accommodation 0 0.0% 0 0.0% 3 0.3% 19 0.2% 16 0.3% 310 0.5% Food Services & Drinking Places 9 12 3% 134 21 3% 81 8.3% 970 12.1% 321 6.6% 4,807 8.0% Other Services (except Public Administration) 7 9.6% 57 9.1% 89 9.2% 515 6.4% 460 9.4% 2,305 3.8%
Automotive Repair & Maintenance 1 1.4% 2 0.3% 13 1.3% 42 0.5% 115 2.4% 501 0.8% Public Administration 1 1.4% 17 2.7% 6 0 6% 98 1.2% 42 0.9% 1,973 3.3%
Unclassified Establishments 3 4 1% 1 0.2% 70 7.2% 20 0.2% 413 8.5% 180 0.3%
Total 73 100.0% 628 100.0% 972 100.0% 8,030 100.0% 4,884 100.0% 59,875 100.0% Source: Copyright 2022 Data Axle, Inc. All rights reserved. Esri Total Residential Population forecasts for 2022 Date Note: Data on the Business Summary report is calculated using Esri’s Data allocation method which uses census block groups to allocate business summary data to custom areas.
August 23, 2022 ©2022 Esri Page 2 of 2
DEMOGRAPHICS


DEMOGRAPHICS
Population Summary
Market Profile
17647 SE Troge Rd, Damascus, Oregon, 97089
Prepared by Esri
Rings: 1, 3, 5 mile radii Latitude: 45.43619 Longitude: 122.48139
1 mile 3 miles 5 miles
2010 Total Population 1,906 39,410 144,398
2020 Total Population 2,505 50,804 165,312
2020 Group Quarters 7 158 1,922
2022 Total Population 3,163 54,059 170,011 2022 Group Quarters 8 158 1,922 2027 Total Population 3,241 54,779 170,843
2022 2027 Annual Rate 0.49% 0.26% 0.10%
2022 Total Daytime Population 2,576 36,008 148,265 Workers 1,052 10,890 65,792 Residents 1,524 25,118 82,473
Household Summary
2010 Households 607 13,061 51,678
2010 Average Household Size 3.13 3.01 2.76
2020 Total Households 805 16,463 57,777
2020 Average Household Size 3.10 3.08 2.83
2022 Households 1,031 17,489 59,261
2022 Average Household Size 3.06 3.08 2.84
2027 Households 1,056 17,689 59,369
2027 Average Household Size 3.06 3.09 2.85
2022 2027 Annual Rate 0.48% 0.23% 0.04%
2010 Families 507 10,599 36,593
2010 Average Family Size 3.36 3.30 3.22
2022 Families 854 13,973 41,395
2022 Average Family Size 3.29 3.42 3.33 2027 Families 872 14,088 41,348 2027 Average Family Size 3.29 3.42 3.34 2022 2027 Annual Rate 0.42% 0.16% 0.02%
Housing Unit Summary
2000 Housing Units 531 9,484 44,768
Owner Occupied Housing Units 87.4% 84.9% 63.5% Renter Occupied Housing Units 7.2% 10.9% 31.2%
Vacant Housing Units 5.5% 4.2% 5.2%
2010 Housing Units 669 13,710 54,716
Owner Occupied Housing Units 80.4% 81.4% 61.1%
Renter Occupied Housing Units 10.5% 13.9% 33.3%
Vacant Housing Units 9.3% 4.7% 5.6%
2020 Housing Units 866 16,940 60,086
Vacant Housing Units 7.0% 2.8% 3.8%
2022 Housing Units 1,086 18,041 61,490
Owner Occupied Housing Units 82.6% 81.9% 65.4%
Renter Occupied Housing Units 12.4% 15.1% 31.0%
Vacant Housing Units 5.1% 3.1% 3.6%
2027 Housing Units 1,111 18,344 62,544
Owner Occupied Housing Units 83.2% 82.0% 65.1%
Renter Occupied Housing Units 11.9% 14.5% 29.8%
Housing Units 5.0% 3.6% 5.1%
Capita Income
August 23, 2022 ©2022 Esri Page 1 of 7
Vacant
Median Household Income 2022 $122,660 $117,187 $85,028 2027 $136,615 $131,444 $102,848 Median Home Value 2022 $535,880 $494,894 $437,803 2027 $598,986 $571,227 $495,272 Per
2022 $50,860 $49,041 $39,564 2027 $55,985 $55,456 $46,117 Median Age 2010 43.1 38.7 36.4 2022 40.1 39.1 37.9 2027 39.1 39.6 38.6 Data Note: Household population includes persons not residing in group quarters. Average Household Size is the household population divided by total households. Persons in families include the householder and persons related to the householder by birth, marriage, or adoption. Per Capita Income represents the income received by all persons aged 15 years and over divided by the total population Source: Esri forecasts for 2022 and 2027 U.S. Census Bureau 2000 and 2010 decennial Census data converted by Esri into 2020 geography.
2022 Households by Income
Household Income Base
Market Profile
17647 SE Troge Rd, Damascus, Oregon, 97089
Prepared by Esri Rings: 1, 3, 5 mile radii Latitude: 45.43619 Longitude: 122.48139 1 mile 3 miles 5 miles
1,031 17,489 59,261
<$15,000 3.0% 2.7% 6.0% $15,000 $24,999 4.2% 2.3% 4.8% $25,000 $34,999 1.3% 3.2% 6.1% $35,000 $49,999 5.9% 6.1% 10.3%
$50,000 $74,999 12.5% 12.3% 16.5% $75,000 $99,999 11.3% 12.2% 13.4% $100,000 $149,999 21.4% 24.8% 20.7% $150,000 $199,999 18.7% 17.5% 11.7% $200,000+ 21.8% 18.9% 10.4%
Average Household Income $156,674 $150,243 $113,146
2027 Households by Income
Household Income Base
1,056 17,689 59,369
<$15,000 1.9% 1.7% 4.2% $15,000 $24,999 2.3% 1.3% 2.8% $25,000 $34,999 0.6% 1.6% 3.9% $35,000 $49,999 2.2% 2.9% 7.9% $50,000 $74,999 6.8% 9.2% 14.9%
$75,000 $99,999 10.5% 12.5% 14.0%
$100,000 $149,999 31.7% 28.5% 24.6% $150,000 $199,999 24.4% 21.7% 15.7% $200,000+ 19.8% 20.5% 12.0%
Average Household Income $171,778 $170,195 $132,275
2022 Owner Occupied Housing Units by Value
Total 897 14,767 40,194
<$50,000 1.2% 1.9% 2.8% $50,000 $99,999 0.2% 0.3% 0.8% $100,000 $149,999 0.1% 0.1% 0.4% $150,000 $199,999 0.1% 0.0% 0.7% $200,000 $249,999 0.2% 0.3% 1.0% $250,000 $299,999 1.3% 1.3% 4.9% $300,000 $399,999 16.3% 19.3% 29.3% $400,000 $499,999 23.6% 28.2% 26.7% $500,000 $749,999 48.2% 41.0% 26.7% $750,000 $999,999 6.1% 5.5% 4.8% $1,000,000 $1,499,999 2.1% 1.6% 1.3% $1,500,000 $1,999,999 0.4% 0.2% 0.4% $2,000,000 + 0.1% 0.3% 0.3%
Total 924 15,034 40,729
<$50,000 0.0% 0.9% 1.0%
$50,000 $99,999 0.0% 0.2% 0.3% $100,000 $149,999 0.0% 0.0% 0.1% $150,000 $199,999 0.0% 0.0% 0.1% $200,000 $249,999 0.0% 0.0% 0.0% $250,000 $299,999 0.0% 0.0% 0.9%
$300,000 $399,999 6.4% 8.3% 19.5%
$400,000 $499,999 19.4% 25.3% 29.5% $500,000 $749,999 61.4% 53.6% 37.5%
$750,000 $999,999 7.5% 7.7% 7.3%
$1,000,000 $1,499,999 4.1% 3.1% 2.4%
$1,500,000 $1,999,999 1.3% 0.4% 1.0%
$2,000,000 + 0.1% 0.4% 0.4%
Average Home Value $634,270 $601,838 $559,904
Data Note: Income represents the preceding year, expressed in current dollars. Household income includes wage and salary earnings, interest dividends, net rents, pensions, SSI and welfare payments, child support, and alimony.
Source: Esri forecasts for 2022 and 2027 U.S. Census Bureau 2000 and 2010 decennial Census data converted by Esri into 2020 geography.
Average Home Value $559,131 $533,935 $478,972 2027 Owner Occupied Housing Units by Value
August 23, 2022 ©2022 Esri Page 2 of 7
Market Profile
17647 SE Troge Rd, Damascus, Oregon, 97089
2010 Population by Age
Total
Prepared by Esri
Rings: 1, 3, 5 mile radii Latitude: 45.43619 Longitude: 122.48139 1 mile 3 miles 5 miles
1,906 39,412 144,398
0 4 5.5% 6.2% 6.9%
5 9 6.8% 7.6% 7.1%
10 14 8.0% 8.4% 7.3%
15 24 11.8% 12.4% 13.6% 25 34 8.2% 10.1% 13.3% 35 44 12.2% 14.8% 13.5% 45 54 17.7% 16.5% 14.9% 55 64 16.1% 13.6% 12.4% 65 74 9.0% 6.4% 6.2% 75 84 3.6% 2.8% 3.3% 85 + 1.3% 1.1% 1.5% 18 + 74.8% 72.7% 74.3%
2022 Population by Age
Total
3,164 54,058 170,010
0 4 6.0% 5.9% 6.3%
5 9 6.9% 6.8% 6.5%
10 14 7.2% 7.2% 6.6% 15 24 10.9% 11.4% 12.0% 25 34 12.7% 13.3% 14.7% 35 44 12.5% 13.4% 13.3% 45 54 12.6% 13.2% 12.0% 55 64 13.8% 13.6% 12.7% 65 74 11.3% 10.0% 9.9% 75 84 4.9% 4.0% 4.4% 85 + 1.2% 1.2% 1.6% 18 + 75.7% 75.8% 76.8%
2027 Population by Age
Total 3,241 54,779 170,841
0 4 6.4% 6.0% 6.3% 5 9 6.8% 6.5% 6.3% 10 14 6.9% 7.1% 6.6% 15 24 9.5% 9.9% 11.3% 25 34 13.4% 12.6% 13.9% 35 44 15.0% 15.6% 14.5% 45 54 11.1% 12.5% 11.9% 55 64 11.3% 11.9% 11.2% 65 74 11.6% 10.9% 10.4% 75 84 6.5% 5.5% 5.8% 85 + 1.4% 1.3% 1.8% 18 + 75.8% 76.4% 77.1%
2010 Population by Sex
Males 959 19,610 70,881 Females 947 19,800 73,516
2022 Population by Sex
Males 1,580 26,727 83,672
Females 1,583 27,332 86,340
2027 Population by Sex
Males 1,616 27,029 84,101 Females 1,625 27,750 86,742
forecasts for
Bureau
data converted by
August 23, 2022 ©2022 Esri Page 3 of 7
Source: Esri
2022 and 2027 U.S. Census
2000 and 2010 decennial Census
Esri into 2020 geography.
Market Profile
17647 SE Troge Rd, Damascus, Oregon, 97089
Prepared by Esri
Rings: 1, 3, 5 mile radii Latitude: 45.43619 Longitude: 122.48139
2010 Population by Race/Ethnicity
Total
1 mile 3 miles 5 miles
1,907 39,409 144,397
White Alone 88.2% 80.6% 77.3%
Black Alone 0.8% 1.2% 2.8%
American Indian Alone 0.6% 0.6% 1.0% Asian Alone 6.8% 12.6% 9.3%
Pacific Islander Alone 0.2% 0.2% 0.5%
Some Other Race Alone 0.8% 1.4% 4.9%
Two or More Races 2.6% 3.4% 4.2% Hispanic Origin 3.1% 4.8% 10.9% Diversity Index 26.4 39.3 50.6
2020 Population by Race/Ethnicity
Total 2,505 50,804 165,312
White Alone 73.6% 69.1% 65.4%
Black Alone 1.5% 1.7% 3.8%
American Indian Alone 0.7% 0.6% 1.1%
Asian Alone 12.8% 16.3% 12.2%
Pacific Islander Alone 0.2% 0.3% 0.7%
Some Other Race Alone 1.9% 2.9% 6.4% Two or More Races 9.2% 9.2% 10.3% Hispanic Origin 7.1% 8.1% 13.6% Diversity Index 50.8 56.3 64.9 2022 Population by Race/Ethnicity
Total 3,163 54,059 170,011
White Alone 71.5% 68.4% 64.9%
Black Alone 1.6% 1.7% 3.8%
American Indian Alone 0.7% 0.6% 1.1% Asian Alone 14.2% 16.6% 12.4%
Pacific Islander Alone 0.2% 0.3% 0.7%
Some Other Race Alone 2.0% 2.9% 6.5% Two or More Races 9.7% 9.5% 10.6% Hispanic Origin 7.1% 8.1% 13.6% Diversity Index 52.9 57.0 65.3 2027 Population by Race/Ethnicity
Total 3,242 54,779 170,842
White Alone 69.8% 66.6% 63.2% Black Alone 1.7% 1.7% 3.8%
American Indian Alone 0.6% 0.5% 1.2% Asian Alone 15.1% 17.5% 13.1%
Pacific Islander Alone 0.2% 0.3% 0.8%
Some Other Race Alone 2.1% 3.1% 6.6% Two or More Races 10.5% 10.2% 11.4% Hispanic Origin 7.2% 8.2% 13.7% Diversity Index 54.8 58.7 66.7
2010 Population by Relationship and Household Type
Total 1,906 39,411 144,397
In Households 99.8% 99.6% 98.9%
In Family Households 91.6% 91.0% 84.8%
Householder 27.7% 27.2% 25.4%
Spouse 24.7% 23.2% 19.0%
Child 33.5% 34.6% 32.5%
Other relative 3.4% 3.9% 4.7%
Nonrelative 2.3% 2.2% 3.3%
In Nonfamily Households 8.2% 8.6% 14.1%
In Group Quarters 0.2% 0.4% 1.1%
Institutionalized Population 0.0% 0.1% 0.4%
Noninstitutionalized Population 0.2% 0.3% 0.7%
The
measures
August 23, 2022 ©2022 Esri Page 4 of 7
Data Note: Persons of Hispanic Origin may be of any race
Diversity Index
the probability that two people from the same area will be from different race/ ethnic groups Source: Esri forecasts for 2022 and 2027 U.S. Census Bureau 2000 and 2010 decennial Census data converted by Esri into 2020 geography.
Market Profile
17647 SE Troge Rd, Damascus, Oregon, 97089
Prepared by Esri Rings: 1, 3, 5 mile radii Latitude: 45.43619 Longitude: 122.48139 1 mile 3 miles 5 miles
2022 Population 25+ by Educational Attainment
Total 2,181 37,146 116,630
Less than 9th Grade 0.6% 1.7% 3.3% 9th 12th Grade, No Diploma 1.8% 2.4% 4.8% High School Graduate 19.9% 16.9% 20.4%
GED/Alternative Credential 3.4% 3.0% 4.2%
Some College, No Degree 19.3% 20.5% 23.0% Associate Degree 11.3% 10.7% 10.5% Bachelor's Degree 26.0% 27.3% 21.6%
Graduate/Professional Degree 17.6% 17.4% 12.2%
2022 Population 15+ by Marital Status
Total 2,526 43,290 137,083
Never Married 24.4% 29.7% 33.9% Married 64.9% 58.4% 50.7% Widowed 3.5% 3.6% 4.6% Divorced 7.2% 8.3% 10.7%
2022 Civilian Population 16+ in Labor Force
Civilian Population 16+ 1,735 30,302 93,091
Population 16+ Employed 95.4% 96.7% 95.5%
Population 16+ Unemployment rate 4.6% 3.3% 4.5% Population 16 24 Employed 11.4% 10.8% 12.1% Population 16 24 Unemployment rate 6.9% 7.7% 10.1% Population 25 54 Employed 60.2% 62.7% 64.0% Population 25 54 Unemployment rate 5.0% 3.1% 4.2%
Population 55 64 Employed 20.1% 19.5% 17.5% Population 55 64 Unemployment rate 3.8% 1.5% 2.3% Population 65+ Employed 8.3% 7.0% 6.4% Population 65+ Unemployment rate 0.0% 2.1% 3.1%
2022 Employed Population 16+ by Industry
Total 1,655 29,308 88,868 Agriculture/Mining 0.6% 0.4% 0.7% Construction 10.5% 6.7% 7.9% Manufacturing 9.4% 10.9% 10.8% Wholesale Trade 4.7% 4.3% 4.0% Retail Trade 9.8% 9.9% 11.2% Transportation/Utilities 3.7% 5.9% 6.9% Information 2.5% 1.7% 1.5% Finance/Insurance/Real Estate 7.6% 8.7% 7.1% Services 45.0% 46.1% 45.6% Public Administration 6.2% 5.5% 4.2%
2022 Employed Population 16+ by Occupation
Total 1,656 29,306 88,867 White Collar 70.8% 70.0% 58.5% Management/Business/Financial 24.5% 22.5% 16.6% Professional 23.8% 26.3% 20.4% Sales 9.7% 10.1% 9.6% Administrative Support 12.7% 11.1% 11.9% Services 11.7% 13.1% 18.4% Blue Collar 17.6% 17.0% 23.1%
Farming/Forestry/Fishing 0.0% 0.0% 0.4% Construction/Extraction 7.1% 4.0% 5.2%
Installation/Maintenance/Repair 2.0% 1.8% 2.4% Production 2.3% 4.1% 6.4% Transportation/Material Moving 6.2% 7.0% 8.8% Source: Esri forecasts for 2022 and 2027 U.S. Census Bureau 2000 and 2010 decennial Census data converted by Esri into 2020 geography.
August 23, 2022 ©2022 Esri Page 5 of 7
2010 Households by Type
Market Profile
17647 SE Troge Rd, Damascus, Oregon, 97089
Rings: 1, 3, 5 mile radii
Prepared by Esri
Latitude: 45.43619 Longitude: 122.48139
1 mile 3 miles 5 miles
Total 607 13,061 51,679
Households with 1 Person 10.4% 13.8% 21.8%
Households with 2+ People 89.6% 86.2% 78.2%
Family Households 83.5% 81.1% 70.8%
Husband wife Families 74.5% 69.1% 53.0%
With Related Children 32.1% 34.3% 24.8%
Other Family (No Spouse Present) 9.1% 12.0% 17.8%
Other Family with Male Householder 3.8% 4.2% 5.5%
With Related Children 2.1% 2.6% 3.4%
Other Family with Female Householder 5.3% 7.8% 12.3%
With Related Children 3.0% 4.9% 8.3%
Nonfamily Households 6.1% 5.1% 7.4%
All Households with Children 37.7% 42.3% 37.1%
Multigenerational Households 5.8% 4.7% 4.7%
Unmarried Partner Households 5.3% 5.2% 7.7%
Male female 4.1% 4.4% 6.8%
Same sex 1.2% 0.8% 0.9%
2010 Households by Size
Total 609 13,060 51,679
1 Person Household 10.3% 13.8% 21.8%
2 Person Household 38.9% 33.5% 32.9%
3 Person Household 17.6% 19.0% 17.4%
4 Person Household 18.2% 19.5% 15.0%
5 Person Household 8.0% 8.5% 7.1%
6 Person Household 3.8% 3.3% 3.2%
7 + Person Household 3.1% 2.4% 2.6%
2010 Households by Tenure and Mortgage Status
Total 608 13,061 51,677
Owner Occupied 88.5% 85.4% 64.7%
Owned with a Mortgage/Loan 69.2% 70.5% 51.1%
Owned Free and Clear 19.1% 14.9% 13.6%
Renter Occupied 11.5% 14.6% 35.3%
2022 Affordability, Mortgage and Wealth
Housing Affordability Index 102 104 86
Percent of Income for Mortgage 23.0% 22.3% 27.1% Wealth Index 162 166 110
2010 Housing Units By Urban/ Rural Status
Total Housing Units 669 13,710 54,716
Housing Units Inside Urbanized Area 84.8% 94.1% 96.7%
Housing Units Inside Urbanized Cluster 0.0% 0.0% 0.0%
Rural Housing Units 15.4% 5.9% 3.3%
2010 Population By Urban/ Rural Status
Total Population 1,906 39,410 144,398
Population Inside Urbanized Area 82.8% 94.5% 96.7%
Population Inside Urbanized Cluster 0.0% 0.0% 0.0%
Rural Population 17.2% 5.5% 3.3%
Data Note: Households with children include any households with people under age 18, related or not. Multigenerational households are families with 3 or more parent child relationships. Unmarried partner households are usually classified as nonfamily households unless there is another member of the household related to the householder. Multigenerational and unmarried partner households are reported only to the tract level. Esri estimated block group data, which is used to estimate polygons or non standard geography.
Source: Esri forecasts for 2022 and 2027 U.S. Census Bureau 2000 and 2010 decennial Census data converted by Esri into 2020 geography.
August 23, 2022 ©2022 Esri Page 6 of 7
Top 3 Tapestry Segments
Market Profile
17647 SE Troge Rd, Damascus, Oregon, 97089
Prepared by Esri Rings: 1, 3, 5 mile radii Latitude: 45.43619 Longitude: 122.48139
1 mile 3 miles 5 miles
1. Boomburbs (1C) Workday Drive (4A) Front Porches (8E) 2. Green Acres (6A) Green Acres (6A) Workday Drive (4A)
3. Savvy Suburbanites (1D) Professional Pride (1B) Green Acres (6A)
2022 Consumer Spending
Apparel & Services: Total $ $3,599,805 $58,780,815 $153,796,172
Average Spent $3,491.57 $3,361.02 $2,595.23
Spending Potential Index 145 140 108
Education: Total $ $2,898,537 $48,634,201 $128,664,091 Average Spent $2,811.38 $2,780.85 $2,171.14 Spending Potential Index 143 142 111
Entertainment/Recreation: Total $ $5,566,033 $90,674,548 $231,928,558 Average Spent $5,398.67 $5,184.66 $3,913.68 Spending Potential Index 147 141 107
Food at Home: Total $ $8,900,213 $145,725,773 $389,415,340 Average Spent $8,632.60 $8,332.42 $6,571.19 Spending Potential Index 139 135 106
Food Away from Home: Total $ $6,459,064 $104,599,015 $274,585,672
Average Spent $6,264.85 $5,980.85 $4,633.50
Spending Potential Index 145 139 107
Health Care: Total $ $10,552,181 $172,516,615 $442,484,332 Average Spent $10,234.90 $9,864.29 $7,466.70 Spending Potential Index 144 139 105
HH Furnishings & Equipment: Total $ $3,985,509 $65,312,231 $164,341,363 Average Spent $3,865.67 $3,734.47 $2,773.18 Spending Potential Index 151 146 108
Personal Care Products & Services: Total $ $1,541,307 $25,095,952 $65,207,666 Average Spent $1,494.96 $1,434.96 $1,100.35
Spending Potential Index 147 141 108
Shelter: Total $ $33,995,608 $551,461,720 $1,466,960,115 Average Spent $32,973.43 $31,531.92 $24,754.22 Spending Potential Index 144 138 108
Support Payments/Cash Contributions/Gifts in Kind: Total $ $4,413,827 $70,949,022 $172,868,993 Average Spent $4,281.11 $4,056.78 $2,917.08
Spending Potential Index 158 149 107
Travel: Total $ $4,603,543 $75,093,458 $185,392,030 Average Spent $4,465.12 $4,293.75 $3,128.40 Spending Potential Index 155 149 109
Vehicle Maintenance & Repairs: Total $ $1,873,911 $30,547,771 $79,825,510 Average Spent $1,817.57 $1,746.68 $1,347.02 Spending Potential Index 144 139 107
Data Note: Consumer spending shows the amount spent on a variety of goods and services by households that reside in the area Expenditures are shown by broad budget categories that are not mutually exclusive. Consumer spending does not equal business revenue. Total and Average Amount Spent Per Household represent annual figures The Spending Potential Index represents the amount spent in the area relative to a national average of 100 Source: Consumer Spending data are derived from the 2018 and 2019 Consumer Expenditure Surveys, Bureau of Labor Statistics. Esri. Source: Esri forecasts for 2022 and 2027 U.S. Census Bureau 2000 and 2010 decennial Census data converted by Esri into 2020 geography.
August 23, 2022 ©2022 Esri Page 7 of 7
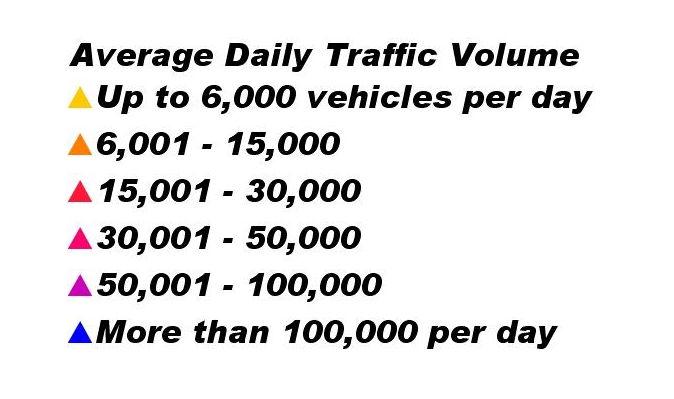
TRAFFIC COUNTS

TRAFFICCOUNTS


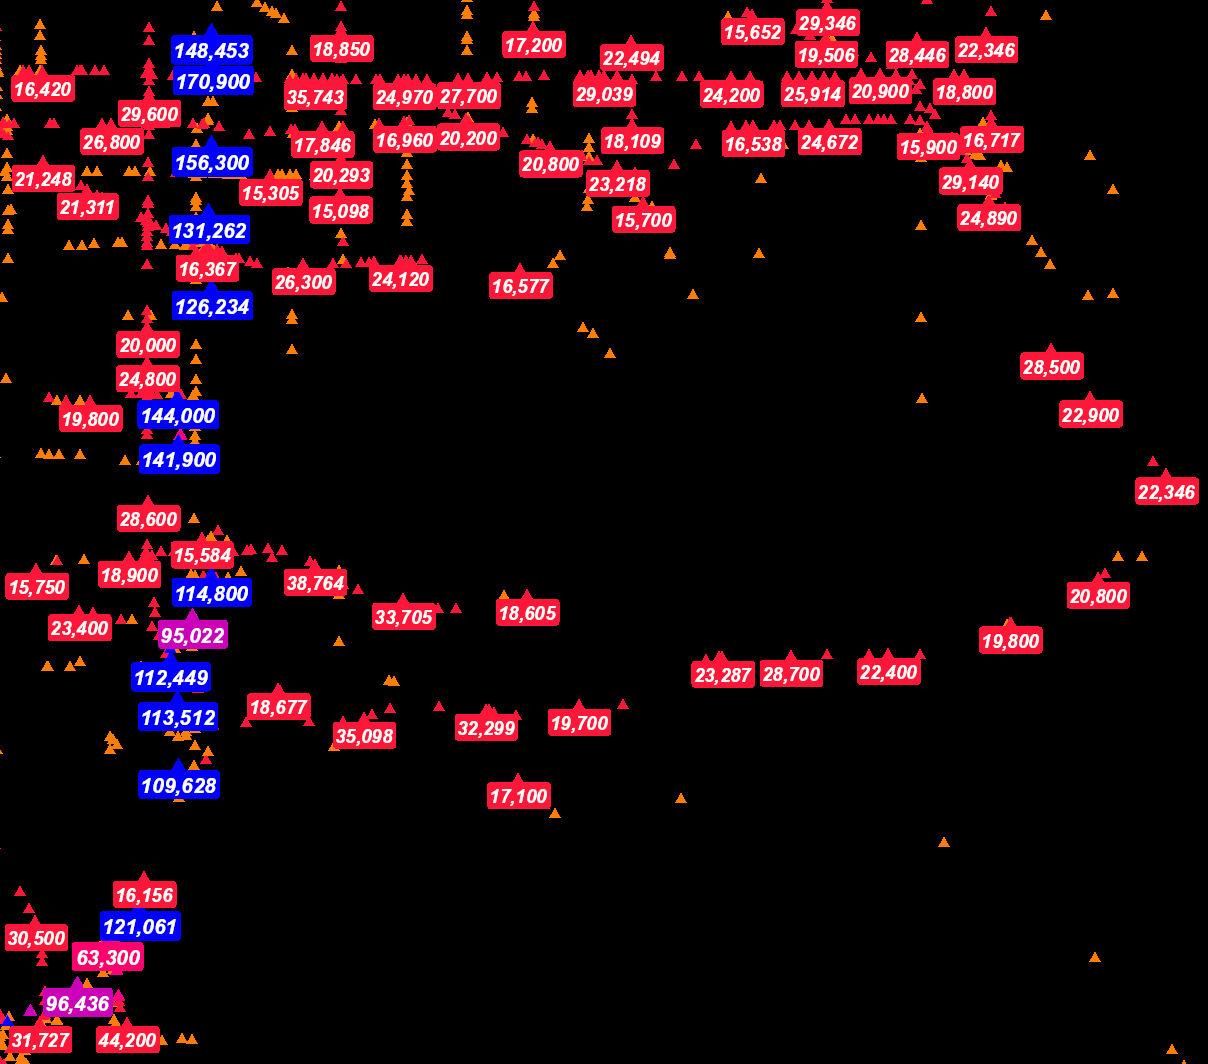


Divi owel s M e m o r i a l H w y Montavilla Hazelwood S S SRedlandRde H w y S ckama S T r o u t d a l e R vd e Dabney St R ation k Plea Oregon Metro, State of Oregon GEO, Esri, HERE, Garmin, SafeGraph, GeoTechnologies, Inc, METI/NASA, USGS, Bureau of Land Management, EPA, NPS, USDA 0 0.8 1.6 mi SE Troge Rd S E 1 7 2 n d A v e 4212 3 Gresham Beaverton Portland Traffic Count Map 17647 SE Troge Rd, Damascus, Oregon, 97089 Prepared by Esri Rings: 1, 3, 5 mile radii Latitude: 45.43619 Longitude: -122.48139 Source: ©2022 Kalibrate Technologies (Q1 2022). August 23, 2022 ©2022 Esri Page 1 of 1
Distance: Street:
0 07 SE Troge Rd
Traffic Count Profile
17647 SE Troge Rd, Damascus, Oregon, 97089
Prepared by Esri
Rings: 1, 3, 5 mile radii Latitude: 45.43619 Longitude: 122.48139
Closest Cross street:
Year of Count: Count:
SE 172nd Ave (0.14 miles W) 2011 600
0.38 SE Hagen Rd (0.0 miles ) 2011 1,150
0.42 SE Foster Road SE Winston Rd (0.09 miles N) 2020 3,044
0.54 SE Vogel Rd SE Rachella Ct (0.07 miles E) 2015 1,495
0.68 SE 172nd Avenue SE Vogel Rd (0.07 miles N) 2020 5,098
0.72 SE Sunnyside Rd SE 172nd Ave (0.05 miles W) 2015 7,920
0.72 SE Sunnyside Road SE 172nd Ave (0.07 miles E) 2020 6,668
0.72 SE Hemrich Road SE Foster Rd (0.13 miles E) 2020 2,114
0 73 SE Hemrick Rd
SE 172nd Ave (0.08 miles W) 2015 2,515
0 74 SE 172nd Avenue SE Stonybrook Ct (0.02 miles S) 2020 2,333
0 75 Southeast 162nd Avenue SE Monner Rd (0.11 miles S) 2018 3,800
0 82 SE Foster Rd SE Vogel Rd (0.08 miles NW) 2000 4,650
0 83 SE Sunnyside Rd SE 172nd Ave (0.18000001 miles NW) 2011 6,135
0 95 SE 162nd Avenue Happy Valley (0.03 miles N) 2020 3,431
1 03 SE Sunnyside Rd SE 162nd Ave (0.05 miles E) 2015 18,605
1 07 SE Foster Road SE Tillstrom Rd (0.16 miles N) 2020 5,240
1 09 Southeast Foster Road SE Tillstrom Rd (0.16 miles N) 2018 6,000
1 15 Southeast Sunnyside Road SE Youngs Ln (0.06 miles W) 2018 4,500
1 23 SE Sunnyside Rd SE 157th Ave (0.05 miles E) 2015 10,900
1 23 SE Sunnyside Road SE 152nd Dr (0.06 miles SW) 2020 9,974
1 24 Southeast 172nd Avenue SE Maple Hill Ln (0.01 miles N) 2018 6,500
1 26 SE Monner Rd SE 154th Ave (0.11 miles SE) 2000 920
1 29 SE 172nd Ave Obrist Ln (0.03 miles S) 2015 7,070
1.30 SE Tillstrom Rd SE 190th Dr (0.25 miles SE) 2015 3,100
1.31 SE Tillstrom Road SE Caleb Ln (0.08 miles NW) 2020 2,963
1.32 SE Borges Road SE Tillstrom Rd (0.08 miles W) 2020 946
1.38 SE 190th Drive SE Tillstrom Rd (0.06 miles S) 2020 2,114
1.47 SE 152nd Drive SE Dougie Rd (0.02 miles S) 2020 3,277
1.50 SE Foster Rd High Ridge Ct (0.08 miles N) 2000 5,000
1.50 SE Foster Rd SE Tillstrom Rd (0.11 miles S) 2015 7,780
Data Note:The Traffic Profile displays up to 30 of the closest available traffic counts within the largest radius around your site. The years of the counts in the database range from 2020 to 2000. Esri removes counts that are older than 2000 from the Kalibrate provided database. Traffic counts are identified by the street on which they were recorded, along with the distance and direction to the closest cross street. Distances displayed as 0.00 miles (due to rounding), are closest to the site. A traffic count is defined as the two way Average Daily Traffic (ADT) that passes that location.
Source: ©2022 Kalibrate Technologies (Q1 2022).
August 23, 2022 ©2022 Esri Page 1 of 1
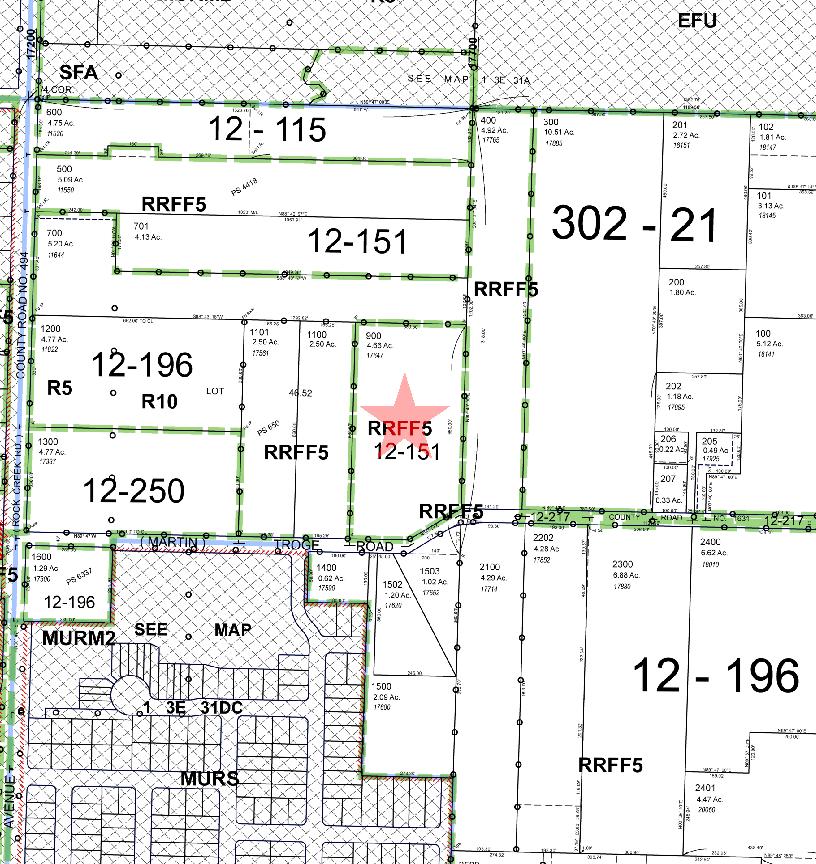
ZONING
ZONING
SE TROGE RD
RRFF5
MUR M2 MUR S R10
S E O L Y M P I C S T
. 17647 SE Troge Rd 0 250 Fee Leg en d Su bject Parcel Ta xl ots