


Supported by


Supported by

I am thrilled to present to you the eagerly awaited 2023 Sports ETA State of the Industry Report. This year's report represents a significant milestone in our ongoing commitment to delivering invaluable insights and support to you, our valued members.
First and foremost, I want to extend my heartfelt gratitude to our partners at Northstar Meetings Group for their support in bringing this report to fruition. Their dedication to industry research has been instrumental in shaping the success of this initiative from its inception.
The 2023 State of the Industry Report, meticulously crafted in collaboration with Tourism Economics with support from Longwoods International, is a testament to our collective pursuit of excellence. It is with great pride that I share with you the groundbreaking strides we have made in enriching the content and relevance of this year's edition.
For the first time ever, we have incorporated invaluable insights from Rights Holders and Sports Venues, amplifying the depth and breadth of our analysis. I am thrilled to report that this year's survey engagement shattered previous records, underscoring the unwavering dedication of our members to contributing to the wealth of knowledge within our industry.
Within the pages of this report, you will discover a wealth of detailed information, including traveler data, room nights, spending data, economic impact analysis, destination profiles, rights holder profiles, sports venue profiles, and more. The year-over-year growth is astonishing, proving once again that the sports events and tourism industry is one of the most impactful sectors in tourism both economically and socially beneficial.
Among the highlights of this year's report is the staggering $52.2 billion in direct spending on sport-related travel in 2023, resulting in over $128 billion in economic impact and the creation of 757,600 total jobs. Additionally, the report reveals that 63% of markets reported that sports was the leading generator of room nights.
Our objectives for this pivotal initiative are multifaceted, aiming to provide the most comprehensive industry report available, empower our members with essential resources to excel in their roles, and serve as a vital tool for advocacy across all segments of the industry.
I extend my deepest gratitude to each and every one of you for your unwavering support and commitment to the sports events and tourism industry. Your dedication and passion are the driving forces behind our collective success, and I am honored to stand alongside you as we continue to push the boundaries of excellence.
Yours in Sport,
 John David President and CEO Sports Events & Tourism Association


Sports tourism* is an integral part of local and national economies across the US. Travelers attending sports tournaments, races, and other events – either as a participant or spectator – generate significant economic benefits to households, businesses, and governments alike and represent a critical driver of the overall economy.
By monitoring the sports tourism economy, policymakers can inform decisions regarding the funding and prioritization of the sector’s development. They can also carefully monitor its successes and future needs. A baseline of economic impacts was established for 2019 (State of the Industry Report: 2019), and this update allows the industry to continue to track progress over time.
To quantify the economic significance of the sports tourism sector in the U.S., Tourism Economics prepared a comprehensive model using multiple primary and secondary data sources.
Impact modeling is based on an IMPLAN Input-Output
(I-O) model for the U.S. The results of this study show the scope of the sports tourism sector in terms of direct sports-related travel spending, as well as total economic impacts, including employment, household income, and tax impacts in the broader economy.
In addition to estimating the economic benefits generated by sports tourism in 2023, the State of the Industry (“SOTI”) Report also provides an overview of the key characteristics for the Sports Events & Tourism Association’s (“Sports ETA”) destination members (i.e. local sports commission, convention and visitors bureau, chamber of commerce), venue members, and rights holders members.
2023

*For purposes of this report, “sports tourism” includes adult and youth amateur events and collegiate tournaments. The economic impact analyses conducted within the report exclude professional sports and collegiate regular season games.


The analysis draws on the following data sources:
• Sports ETA: destination, venue, and rights holder membership survey data
• Longwoods International: traveler survey data, including spending and visitor profile characteristics for sports tourism nationwide
• Bureau of Economic Analysis and Bureau of Labor Statistics: employment and wage data, by industry
• Bureau of Transportation Statistics: U.S. domestic average itinerary fares
• U.S. Travel Association: domestic travel data
• STR: lodging data
• Sports attendance data


The sports tourism sector generated significant economic impacts in the U.S. as event organizers and venues spent money to sustain operations, including spending on payroll, marketing, and general and administrative expenses.
In addition, sports travelers that attended a sports tournament, race, or other event – either as a participant or spectator – spent money while at the sporting event and at off-site establishments during their stay, including at local restaurants, hotels, retailers, and recreation/entertainment venues.
Total direct spending associated with the sports tourism sector amounted to $52.2 billion in 2023.
SUMMARY DIRECT IMPACTS
$4.7B Tournament Operations +
$47.5B Sports Traveler Visitor Spending =
$52.2B
Total Direct Spending Impact of the Sports Tourism Sector


TOTAL ECONOMIC IMPACTS
The sports tourism sector’s direct spending impact of $52.2 billion generated a total economic impact of $128.0 billion in the local economy, which supported 757,600 full-time and part-time jobs and generated $20.1 billion in taxes.
Total Economic Impact of the Sports Tourism Sector

The sports tourism sector generated $52.2 billion in direct spending in 2023, including spending by sports travelers and tournament operators. This spending generated a total economic impact of $128.0 billion which supported 757,600 total jobs and generated $20.1 billion in total tax revenues.
$128.0B Total Economic Impact $52.2B Direct Spending Impact
757,600 Total Jobs Generated
$20.1B Total Tax Revenues


The number of travelers attending sports events in the U.S. surpassed 2019 levels in 2022 and continued to grow in 2023.
After the COVID-19 pandemic cancelled or delayed sports events across the country in 2020, the number of sports travelers rebounded quickly and surpassed 2019 levels in 2022, with a total of 191.5 million.
The sector continued to grow in 2023, increasing 7.0% over sports traveler volume in 2022. The number of sports travelers established a new high-water mark of 204.9 million in 2023.
Sports traveler levels and annual growth (millions of travelers and year-over-year percentage change)
The number of sports travelers established a new high-water mark of 204.9 million in 2023.

Source: Sports

 ETA, Longwoods International, U.S. Travel Association, NBA, NCAA, NFL, NHL, MLB, MLS, Tourism Economics
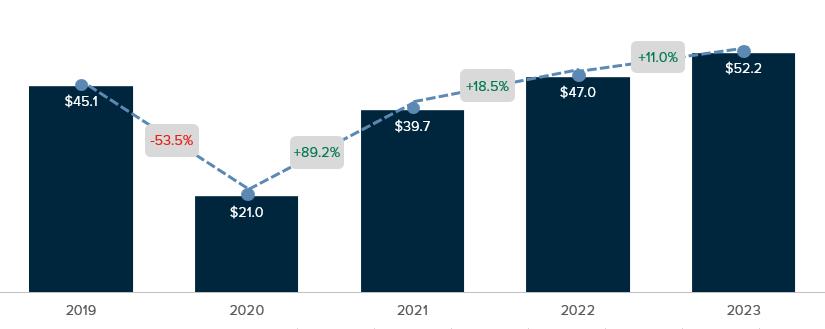
Spending by sports travelers, event organizers, and venues amounted to $52.2 billion in 2023.
Spending by sports travelers increased at a faster pace than the volume of sports travelers in 2022, increasing 18.5% year-overyear to $47.0 billion. In addition to spending more (on average per sports traveler) on food & beverage, retail, and entertainment, the percentage of overall sports travelers that stayed the night increased, which indicates that sports travelers are participating in tournaments further from home.
In 2023, spending by sports travelers increased 11.0% year-over-year to $52.2 billion.
In 2023, spending by sports travelers increased 11.0% year-over-year to $52.2 billion.
Sports-related travel spending and annual growth ($ billions and year-over-year percentage change)

 Source: Sports ETA, Longwoods International, U.S. Travel Association, Tourism Economics

Sports travelers, event organizers, and venues spent $52.5 billion across a wide range of sectors in 2023.
Sports travelers, event organizers, and venues spent $13.5 billion on transportation, $10.9 billion on lodging, and $9.7 billion on food and beverages. Recreation, retail, and tournament operations rounded out spending, registering $6.9 billion, $6.5 billion, and $4.7 billion, respectively.
The lodging sector accounted for 21% of all sports-related travel spending. In 2023, sports-related travel generated 73.5 million room nights, which is an important factor given that hotel taxes are a primary funding source for many entities (refer to pages 32 and 41 for additional information).
$52.2 BILLION
Sports-related traveler spending in 2023
$13.5B TRANSPORTATION
Airfare, rental cars, taxis, buses, parking, public transportation, ride share
$10.9B LODGING
Hotels, motels, private home rentals, RVs
$9.7B FOOD & BEVERAGE
Full-serivce restaurants, fast food, convenience stores, alcohol
$6.9B RECREATION
Amusements, theaters, entertainment, and other recreation
$6.5B RETAIL
Souvenirs, general merchandise, malls, local retailers
$4.7B TOURNAMENT OPERATIONS
Event organizer and venue spending

Overall tourism growth in 2023 was supported by sports travelers that stayed overnight and sports travelers that visited for the day.
The number of sports travelers suprassed 2019 levels in 2022, however, it took a year longer (2023) for the average spending per sports traveler to surpass 2019 levels.
The number of individual sports travelers that stayed overnight increased 9.4% year-over-year in 2022 and an additional 6.8% yearover-year in 2023 to 110.7 million.
An estimated 54% of all sports travelers spent the night in the event destination, which generated 73.5 million room nights in 2023.
Sports travelers that stayed overnight spent $360 per person trip and day trippers spent $81 per person trip in 2023, both of which exceed 2019 levels.
Overall tourism growth in 2023 was supported by an increase in sports travelers that stayed overnight and sports travelers that visited for the day, generating 73.5 million room nights.
Total sports travelers and sports-related travel spending (millions of sports travelers, $ millions – total traveler spending, $ – per traveler spending)

Note: event organizer and venue spending on tournament operations is excluded from above table. In 2023, this amounted to $4.7 billion.
Source: Tourism Economics


The analysis of spending attributable to sports tourism in the U.S. begins with actual sports-related travel spending by sports travelers, event organizers, and venues, but also considers the downstream effects of this injection of spending into the local and national economy. To determine the total economic impact of sports tourism, sports-related travel spending was input into a model of the national U.S. economy in IMPLAN. This approach calculates three distinct types of impact: direct, indirect, and induced.
The impacts on business sales, jobs, wages, and taxes are calculated for all three levels of impact
1. Direct impacts: Sports-related travel creates direct economic value within a discreet group of sectors (e.g. entertainment, transportation). This supports a relative proportion of jobs, wages, taxes, and GDP within each sector.
2. Indirect impacts: Each directly affected sector also purchases goods and services as inputs (e.g. food wholesalers, utilities) into production. These impacts are called indirect impacts.
3. Induced impacts: Lastly, the induced impact is generated when employees whose wages are generated either directly or indirectly by sports tourism, spend those wages in the local economy.
IMPLAN calculates three levels of impact - direct, indirect and induced - for a broad set of indicators. These include the following:
• Business sales (also called output)
• Household income (including wages and benefits)
• Employment
• Federal taxes
• State and local taxes
To determine the total economic impact of sports tourism, sportsrelated travel spending was input into a model of the national U.S. economy in IMPLAN.


Tournament operational spending and sports-related travel spending on items such as lodging, food and beverage, retail, and transportation
Businesses purchase goods and services from other providers creating supply chain effects and engaging B2B goods and services
Employees spend wages throughout the wider economy, generating GDP, jobs and tax revenue
Direct, indirect and induced impacts combine to equal the total economic impact

The sports tourism sector supported $128.0 billion of total output (business sales) in 2023.
The $52.2 billion in sports tourism sector’s direct spending generated $33.8 billion in indirect expenditures and $42.0 billion in induced expenditures, resulting in a total economic impact of $128.0 billion.
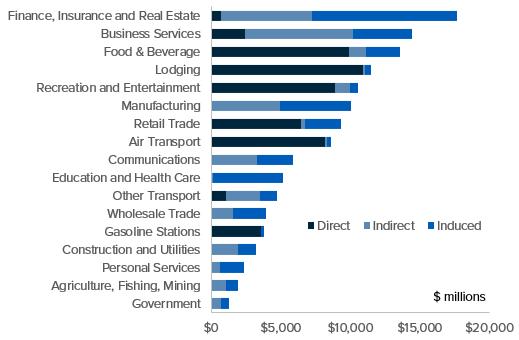
While most sales are in industries directly serving travelers (as presented on the following page), $17.7 billion in business sales accrued to the finance, insurance, and real estate (“FIRE”) industry as a result of selling to tourism businesses.
For example, tourism businesses such as hotels, restaurants, and attractions purchased goods and services (i.e. financial services, insurance) from businesses in the FIRE industry (“indirect sales”). Further, the FIRE employees whose wages were generated indirectly by sports tourism, spent those wages in the local economy (“induced sales”).
Similarly, significant benefits accrued to sectors such as business services ($14.4 billion) and manufacturing ($10.1 billion).
($ billions)

Source: Tourism Economics


Business sales impacts by industry – 2023 ($ millions)
Source: Tourism Economics
Source: Tourism Economics


The sports tourism sector supported 757,595 total jobs in 2023. The sports tourism sector supported 757,595 full-time and part-time jobs in 2023, which includes 144,414 indirect jobs and 199,539 induced jobs.
Summary employment impacts - 2023 (number of jobs)

Source: Tourism Economics
The sports tourism sector supported 757,595 total jobs in 2023.


Employment impacts by industry – 2023
Source: Tourism Economics

Source: Tourism Economics


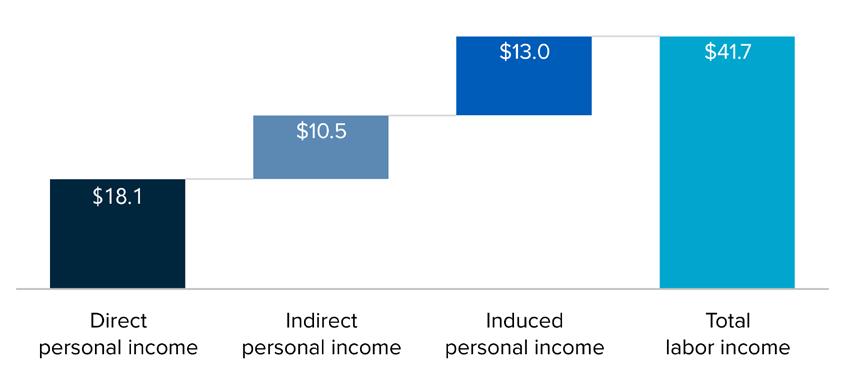
The sports tourism sector generated $41.7 billion in total personal income in 2023.
The sports tourism sector generated $18.1 billion in direct income and $41.7 billion in total income, including indirect and induced income in 2023.
Summary labor income impacts - 2023 ($ billions)
Source: Tourism Economics


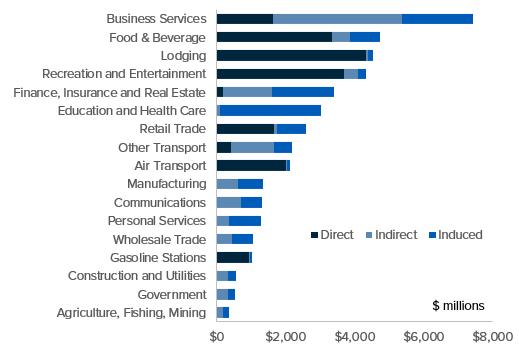
Labor income impacts by industry – 2023 ($ millions)
Source: Tourism Economics
Source: Tourism Economics


The sports tourism sector generated $20.1 billion in governmental tax revenue in 2023.
The sports tourism sector generated a total fiscal (tax) impact of $20.1 billion in 2023.
State governments collected $5.0 billion and local governments collected $4.8 billion in 2023.
State and local tax revenue – 2023 ($ millions)
The sports tourism sector generated $20.1 billion in governmental tax revenue in 2023.
Source: Tourism Economics
Source: Tourism Economics

The sports tourism sector supported more direct jobs than many large sectors in 2023.
The sports tourism sector supported more direct jobs than many large sectors in 2023 including barber shops and beatuty salons; highway, street, and bridge construction; pharmaceuticals; and oil and gas extraction.
Note: numbers indicate three- to five-digit North American Industry Classification System (NAICS) code corresponding to such industry sector. Source:


The 2023 State of the Industry survey was completed by 182 Sports ETA destination members. In February 2024, Sports ETA electronically distributed the State of the Industry survey to its Destination members. The survey remained in the field for approximately six weeks and garnered responses from 182 destinations.
The objective of the survey was to develop an understanding of the key characteristics for Sports ETA destination members, including convention & visitors bureaus (CVBs), destination marketing organizations (DMOs), sports commissions, and chambers of commerce.
Participation by destination type – 2023
(percentage of destinations by destination type)

*sample included in destination profiles varies between the 2019 State of the Industry Report, the 2021 State of the Industry Report, and the 2023 State of the Industry Report and therefore cannot be compared across each edition.


The survey participants were distributed across a range of budgets.
Half of all destination organizations operated with a budget of $500,000 or less and 20% of destinations operated with a budget exceeding $2 million.
Approximately 58% of destinations increased their budget between 2022 and 2023 with an average increase of 17%.
Moving forward, 53% of destinations expect their budget to increase next year, while only 6% expect their budget to decrease next year.
Participation by budget – 2023 (percentage
Budget change – 2022 to 2023


49% of Destinations had decreased budgets from 2019-2021, however, 58% increased 2022 to 2023
Hotel taxes funded the majority of destination organizations in 2023.
Destinations with a budget of $1 million or less had a larger percentage of their budget (75%) funded by hotel taxes, compared to those destinations with a budget over $1 million (59%).
Destinations with a budget over $1 million had a larger percentage of their budget funded by owned events (7%), BID/TID (6%), grants (5%), private funding (4%), membership (3%), sponsorship (3%), event management fees (2%), and other sources (3%). Other funding sources included partnership co-ops and private funding.
The general fund (8%) and operations/rentals (1%) funded the same percentage of budgets for destinations with a budget of $1 million or less and destinations with a budget over $1 million.
$1M budget or less
Greater than $1M budget
Owned events have become a significant form of funding compared to 2019
There was a notable increase of Destination Revenue from BID /TID


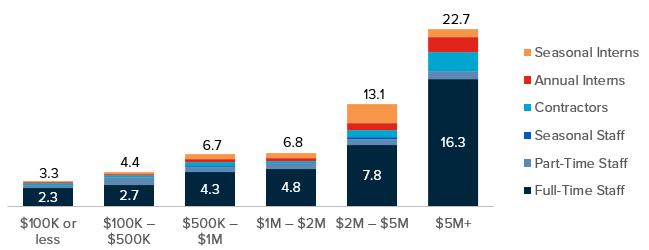
The number of sports-related staff employed by a destination directly relates to the overall budget.
The number of full-time sports-related staff at destinations ranged from 2.3 at smaller budget destinations to 16.3 at larger budget destinations. When part-time staff and interns are considered, the total number of sports-related employees ranged from 3.3 to 22.7 depending on budget.
The average destination, regardless of budget, employed 4.8 full-time sports-related staff and 7.3 total sports-related staff when including part-time staff and interns.


Destinations, regardless of budget, hosted an average of 69 events in 2023. These events welcomed an average of 2,950 participants and spectators per event.
Destinations hosted an average of 69 events in 2023 ranging from 36 at destinations with a budget of $100,000 or less to 83 at destinations with a budget of $500,000 to $1 million.
The average number of participants and spectators per event correlated to the destination budget – ranging from 2,290 participants per event at destinations with the smallest budget to 3,860 participants per event at destinations with the largest budget.
The average number of events increased each year from 2021 through 2023 for all destinations, regardless of budget.
Moving forward, 69% of destinations expect the number of events to increase in 2024, with only 6% of destinations anticipating the number of events to decrease.
Event and participants / spectators – 2023 (number
Event trends – 2021 to 2023 (number


Destinations, regardless of budget, hosted an average of 69 events in 2023, a significant increase from 52 in 2021.


Nearly all destinations hosted youth events and adult / amateur events in 2023.
Nearly all destinations hosted youth events (98%) – either competitive or recreational – and adult amateur events (95%) in 2023. Less than half of the destinations hosted international, United States Olympic & Paralympic Committee (USOPC), professional, or senior events.
On average, 32% of all destinations surveyed owned an event in 2023 – 52% of destinations with budgets over $1 million and 21% of destinations with budgets less than $1 million. Destinations with budgets over $1 million owned an average of 4.8 events compared to 3.1 events for destinations with budgets less than $1 million.
Of those destinations that owned an event, approximately 17% owned a team event only, 15% owned an individual event only, and 44% owned both team and individual events. The remaining destinations owned other types of events, such as award shows.
Approximately 11% of destinations owned and / or operated the facility where they hosted their owned events - ranging from 8% for destinations with budgets less than $1 million to 16% for destinations with budgets over $1 million.
Event types – 2023
(percentage of destinations)
Owned events – 2023
(percentage of destinations by budget)


More than 80% of destinations paid bid fees in 2023.
More than 80% of destinations paid bid fees in 2023, ranging from 69% at destinations with a budget less than $100,000 to 88% at destinations with a budget over $1 million.
The average bid fee funding pool, regardless of budget, was $402,200 – ranging from $61,300 at smaller budget destinations to $992,500 at larger budget destinations.
The bid fee pool increased for 45% of destinations, decreased for 3% of destinations, and remained the same for 52% of destinations between 2022 and 2023.
Data throughout the remainder of the report present the results of the destination survey. Paid
The average bid fee funding pool showed a massive increase from $200,000 in 2021 to $402,200 in 2023.
Bid fee funding pool – 2023 ($ by budget)


29% of bid fees were sourced from State funds.


The internal budget was the most common source of funding for the bid fee pool.
The internal budget was the most common source of funding for the bid fee pool – 79% of destinations, regardless of budget, funded a portion of the bid fee pool using internal funds, 36% used city or county funds, 29% used state funds, and 20% used other funding, such as sponsorships, partnerships, or corporate support.
Room nights and economic impact were the two most common factors considered when evaluating bid fee requests in 2023, which were utilized by 94% and 92% of destinations, respectively.
Bid fees funding source – 2023 (percentage of destinations by budget)
Bid fee evaluation factors – 2023


Approximately 57% of destinations, regardless of budget, offered local event grants in 2023.
Approximately 57% of destinations, regardless of budget, offered local event grants in 2023 – ranging from 31% at destinations with budgets less than $100,000 to 69% at destinations with budgets greater than $1 million.
The average local grant funding pool, regardless of budget, was $573,800, ranging from $56,300 at smaller budget destinations to $1.2 million at larger budget destinations.
The internal budget was the most common source of funding for the local grants – 74% of destinations funded a portion of the local grants pool using internal funds, 38% used city or state funds, and 18% used other funding.
Offered local grants – 2023
(percentage of destinations by budget)


Destinations ranked economic impact and room nights as the two most important factors for success in 2023.
Destinations were asked to rank eleven factors for success in order of importance, with one being the most important. The top two success factors in 2023, regardless of budget, were economic impact and room nights.
The average rank for economic impact across all destinations was 1.8 with a range of 1.5 to 2.2 depending on destination budget.
Other important factors for success included the number of participants, exposure / brand awareness, earned media, repeat business, and revenue – which all had an average ranking across all destinations between 4.7 and 6.3, regardless of budget.
Quality of life, social media, community legacy, and green initiatives were ranked as less important factors for success.
(rank with 1 being the most important and 11 being the least important)
Note: The survey question asked “how does your organization measure success (please rank the following measures of success with 1 being the most important)”? The light blue diamond represents the average rank of importance for all destinations, regardless of budget. The dark blue circles present the low and high ranks based on the following destination budget segmentations: $100K or less, $100K - $500K, $500K - $1M, $1M - $2M, and $2M+.


Each state played an integral role in sports tourism in 2023. Some states naturally generate a larger share of the impact given the size (population and land mass), seasonality, location within the U.S., and destination infrastructure (i.e., airports, sports venues, and hotel supply). However, sports tourism marketing funds and other initiatives, such as bid fees and local grants, also influence how states perform.
Below is a list of the top 10 states in terms of the economic impact generated by sports tourism in 2023. Data provided by sports tourism industry stakeholders and economic data were utilized in the ranking analysis.

 1. Florida
2. Texas
3. California
4. Pennsylvania
5. Illinois
6. Ohio
7. New York
8. Tennessee
9. Georgia
10. Virginia
63% of destinations reported that sports were the top room night generator in their destination.

The following are other insights derived from the State of the Industry survey.
• 63% of destinations, regardless of budget, indicated that sports was the top room night generator in their destination.
• The Event Impact Calculator offered by Sports ETA in partnership with Destinations International and Tourism Economics was the most utilized tool for estimating visitor spend in 2023 – used by 62% of destinations.
• Half of destinations (50%) participated in community-based health and wellness activities in 2023.
• Parks and recreation were the most popular partner for bids and event delivery (80% of destinations partnered) followed by colleges / universities (79%), independent facilities (70%), city (69%), local sport-related groups (69%), high schools (59%), county (51%), CVB / DMO (45%), local hotel / motel association (44%), sports commission (23%), and local port authorities (9%).
Parks and Recreation were the most popular partner for bids and event delivery (80% of destinations partnered)


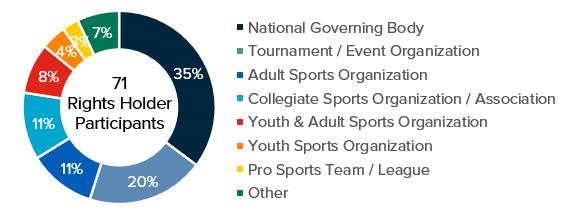
The 2023 State of the Industry survey was completed by 71 Sports ETA event rights holder members.
In February 2024, Sports ETA electronically distributed the State of the Industry survey to its Event Rights Holder members. The survey remained in the field for approximately six weeks and garnered responses from 71 event rights holders. This is the first time that event rights holder members were surveyed as part of the State of the Industry.
The objective of the survey was to develop an understanding of the key characteristics for Sports ETA event rights holder members, including national governing bodies, tournament / event organizations, adult sports organizations, collegiate sports organizations / associations, youth & adult sports organizations, youth sports organizations, and pro sports teams / leagues.
Participation by rights holder type – 2023 (percentage of rights holders by rights holder type)


The survey participants were distributed across a range of budgets.
Event rights holders with a budget greater than $10 million accounted for the largest share of respondents (30%), followed by rights holders with a budget of $100,000 to $500,000 (24%).
Approximately 72% of event rights holders increased their budget between 2022 and 2023 with an average increase of 14%.
Moving forward, 81% of events rights holders expect their budget to increase next year, while only 6% expect their budget to decrease next year.
Participation by budget – 2023
(percentage of rights holder by budget)
Budget change – 2022 to 2023


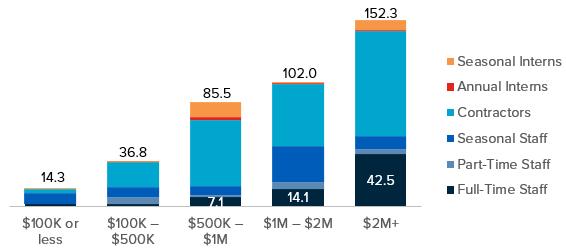
The number of staff employed by an event rights holder directly relates to the overall budget.
The number of full-time staff at event rights holders ranged from 1.7 at smaller budget event rights holders to 42.5 at larger budget event rights holders. When part-time staff and interns are considered, the total number of employees ranged from 14.3 to 152.3 depending on budget.
The average event rights holders, regardless of budget, employed 21.6 full-time staff and 100.3 total staff when including part-time staff and interns.
Staffing – 2023
(number of staff by budget)


Event rights holders, regardless of budget, hosted an average of 32 events in 2023. These events welcomed an average of 1,710 participants and spectators per event.
Event rights holders hosted an average of 32 events in 2023 ranging from 4 by event rights holders with a budget of $100,000 or less to 49 by event rights holders with a budget greater than $1 million.
The average number of participants and spectators per event correlated to the destination budget – ranging from 650 participants per event by event rights holders with the smallest budget to 1,880 participants per event by event rights holders with the largest budget.
The average number of events increased each year from 2021 through 2023 for all event rights holders with budgets greater than $100,000 and remained relatively consistent for event rights holders with a budget of $100,000 or less.
Moving forward, 60% of event rights holders expect the number of events to increase in 2024, with only 5% of event rights holders anticipating the number of events to decrease.


Host bids and financial incentives were the most important factors when choosing an event location, followed by venue cost and destination location.


Host bids / financial incentives and venue costs were the most important factors for rights holders when determining where to host an event in 2023.
Event rights holders indicated that host destination bids and financial incentives were the most important factors when determining where to host an event, followed by venue costs.
Nearly 1/3rd of rights holders (31%) host their events in a different destination each year, while 11% host their events in the same destination each year. The remaining 57% have a mix of events.
Host destination criteria – 2023 (rank with 1 being the most important and 6 being the least important)
Host destination rotation – 2023 (percentage of rights holders)


The majority of event rights holders hosted youth events and adult / amateur events in 2023.
More than half of the rights holders hosted youth events (66%) – either competitive or recreational – and adult amateur events (66%) in 2023. Less than half of the destinations hosted international, collegiate, senior, professional, and United States Olympic & Paralympic Committee (USOPC) events.
Nearly 40% of rights holders owned a team event only, 22% owned an individual event only, and 31% owned both team and individual events. The remaining destinations owned other types of events, such as conferences and meetings.
Only 5% of rights holders, regardless of budget, owned and / or operated the facility where they hosted their events.
Event types – 2023 (percentage of rights holders)
Owned events by type – 2023 (percentage of rights holders)


Event rights holders ranked participant count and revenue as the two most important factors for success in 2023.
Event rights holders were asked to rank eleven factors for success in order of importance, with one being the most important. The top two success factors in 2023, regardless of budget, were the number of participants and revenue.
The average rank for the number of participants across all event rights holders was 2.9 with a range of 2.1 to 3.5 depending on event rights holders budget.
Other important factors for success included the exposure / brand awareness, economic impact, room nights, and earned media – which all had an average ranking across all event rights holders between 4.0 and 5.9, regardless of budget.
Social media, repeat business, community legacy, quality of life, and green initiatves were ranked as less important factors for success.
(rank with 1 being the most important and 11 being the least important)
Note: The survey question asked “how does your organization measure success (please rank the following measures of success with 1 being the most important)”? The light blue diamond represents the average rank of importance for all rights holders, regardless of budget. The dark blue circles present the low and high ranks based on the following rights holders budget segmentations: $100K or less, $100K - $500K, $500K - $1M, $1M - $2M, and $2M+.


The following are other insights derived from the State of the Industry survey.
• Nearly half (48%) of events rights holders utilized a third-party housing company for facilitating room blocks.
• 38% of event rights holders, regardless of budget, required “stay to play” in 2023.
• More than half of event rights holders (53%) participated in community-based health and wellness activities in 2023.


Only 48% of rights holders utilized a third-party housing company.


The 2023 State of the Industry survey was completed by 53 Sports ETA venue members. In February 2024, Sports ETA electronically distributed the State of the Industry survey to its Venue members. The survey remained in the field for approximately six weeks and garnered responses from 53 venues. This is the first time that venue members were surveyed as part of the State of the Industry. The objective of the survey was to develop an understanding of the key characteristics for Sports ETA venue members, including arenas, ballparks, both indoor and outdoor multi-purpose sports campuses, indoor multi-purpose sports campuses, outdoor multi-purpose sports campus or fields, parks and recreation department with all or some of the above, stadiums, and other venues.
Participation by venue type – 2023
(percentage of venues by venue type)

Participation by destination population – 2023 (percentage


The survey participants were distributed across a range of budgets.
Approximately 43% of venues operated with a budget exceeding $2 million.
Approximately 77% of venues increased their budget between 2022 and 2023 with an average increase of 21%.
Moving forward, 80% of venues expect their budget to increase next year, while none expect their budget to decrease next year.
Participation by budget – 2023 (percentage
Budget change – 2022 to 2023


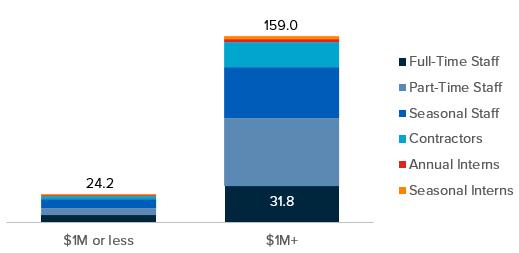
The number of staff employed by a venue ranges from 24 to 159 depending on budget.
Venues with a budget less than $1 million employed an average of 24.2 staff in 2023 compared to 159.0 staff at venues with a budget greater than $1 million.
The average venue, regardless of budget, employed 21.6 full-time staff and 105.7 total staff when including part-time staff and interns.
(number of staff by budget)


Nearly all venues hosted youth events and adult / amateur events in 2023.
Nearly all venues hosted youth events (98%) – either competitive or recreational – and adult amateur events (88%) in 2023. Less than half of the destinations hosted international, professional, senior, and United States Olympic & Paralympic Committee (USOPC) events.
On average, 52% of all venues surveyed owned an event in 2023 – 57% of destinations with budgets over $1 million and 45% of destinations with budgets less than $1 million. Venues with budgets over $1 million owned an average of 10.3 events compared to 3.0 events for destinations with budgets less than $1 million.
Of those venues that owned an event, approximately 57% owned a team event only, 4% owned an individual event only, and 39% owned both team and individual events.
Event types – 2023 (percentage of venues)
Owned events by type – 2023 (percentage of venues by budget)


On average, 52% of all venues surveyed owned an event in 2023
Venues, regardless of budget, hosted an average of 52 events in 2023. These events welcomed an average of 5,130 participants and spectators per event.
Venues hosted an average of 52 events in 2023 ranging from 33 by venues with a budget of $1 million or less to 64 by venues with a budget greater than $1 million.
Venues averaged 5,130 attendees per event.
The average number of participants and spectators per event correlated to the destination budget – ranging from 1,680 participants per event by venues with a budget less than $1 million to 6,240 participants per event by venus with a budget greater than $1 million.
The average number of events increased each year from 2021 through 2023 for all venues, regardless of budget.
Moving forward, 64% of venues expect the number of events to increase in 2024, with none of the venues anticipating the number of events to decrease.
Event and participants / spectators – 2023
Event trends – 2021 to 2023


Venue operations and rentals were the largest source of venue organizational funding in 2023.
Approximately 40% of venue organization funding was generated by venue operations and rentals in 2023. City / county / state general funds accounted for the second largest share of funding.
Over 40% of sports venues were constructed primarily with public funding, 28% were constructed primarily with private funding, and 26% were constructed with a mix of public and private funding. The remaining venues included other sources of funding.
The general fund was the most common source of public funding, utilized by 48% of venues that were constructed with public funding.
Nearly 1/3rd of rights holders (31%) host their events in a different destination each year, while 11% host their events in the same destination each year. The remaining 57% have a mix of events.


Venues ranked revenue and economic impact as the two most important factors for success in 2023.
Venues were asked to rank eleven factors for success in order of importance, with one being the most important. The top two success factors in 2023, regardless of budget, were revenue and economic impact.
The average rank for revenue across all venues was 2.5 with a range of 2.2 to 3.3 depending on venue budget.
Other important factors for success included the number of participants, exposure / brand awareness, repeat business, and room nights – which all had an average ranking across all venues between 3.7 and 6.5, regardless of budget.
Community legacy, quality of life, earned media, social media, and green initiatives were ranked as less important factors for success.
Factors for success – 2023
(rank with 1 being the most important and 11 being the least important)
Note: The survey question asked “how does your organization measure success (please rank the following measures of success with 1 being the most important)”? The light blue diamond represents the average rank of importance for all venues, regardless of budget. The dark blue circles present the low and high ranks based on the following venue budget segmentations: $100K or less, $100K - $500K, $500K - $1M, $1M - $2M, and $2M+.


The following are other insights derived from the State of the Industry survey.
• 63% of venues participated in community-based health and wellness activities in 2023.
• CVBs / DMOs were the most popular partner for bids and event delivery (44% of venues partnered) followed by sports commissions (38%), high schools (38%), local sports-related groups (38%), colleges / universities (33%), and parks and recreation (31%).


63% of venues participated in community-based health and wellness activities in 2023.

As the only trade association for the sports events & tourism industry, Sports ETA is the most trusted resource for sports commissions, destination marketing organizations (DMOs), and sports event owners. Sports ETA is committed to the success of more than 850 member organizations and 2,400 sports event professionals. Our promise is to deliver quality education, ample networking opportunities and exceptional event management and marketing know-how to our members, and to protect the integrity of the sports events & tourism industry. For more information, visit sportseta.org.
Northstar Meetings Group is the leading B-to-B information and marketing solutions company serving all segments of the sports, business meetings, events and incentives market. The company’s audience includes full- and part-time event organizers, as well as sports, corporate, association and not-for-profit decision-makers, and incentive professionals, facilitating their professional development and achievement of business goals. The company's influential brands – SportsTravel, Meetings & Conventions, Successful Meetings, Associations Meetings International, Meetings & Incentive Travel, Meeting News, Incentive and M&C Asia – currently serve nearly 500,000 active meeting planners, event organizers and incentive professionals across an integrated suite of data, digital, events and print products. In addition to publishing SportsTravel, the Sports Division organizes several industry-leading conferences, including the TEAMS Conference, TEAMS Europe and the EsportsTravel Summit. For more information, please visit NorthstarMeetingsGroup.com.


Tourism Economics is an Oxford Economics company with a singular objective: combine an understanding of the travel sector with proven economic tools to answer the most important questions facing our clients. More than 500 companies, associations, and destination work with Tourism Economics every year as a research partner. We bring decades of experience to every engagement to help our clients make better marketing, investment, and policy decisions. Our team of highly-specialized economists deliver:
• Global travel data-sets with the broadest set of country, city, and state coverage available
• Travel forecasts that are directly linked to the economic and demographic outlook for origins and destinations
• Economic impact analysis that highlights the value of visitors, events, developments, and industry segments
• Policy analysis that informs critical funding, taxation, and travel facilitation decisions
• Market assessments that define market allocation and investment decisions
Tourism Economics operates out of regional headquarters in Philadelphia and Oxford, with offices in Belfast, Buenos Aires, Dubai, Frankfurt, and Ontario.
Oxford Economics is one of the world’s foremost independent global advisory firms, providing reports, forecasts and analytical tools on 200 countries, 100 industrial sectors and over 3,000 cities. Our bestof-class global economic and industry models and analytical tools give us an unparalleled ability to forecast external market trends and assess their economic, social and business impact. Headquartered in Oxford, England, with regional centers in London, New York, and Singapore, Oxford Economics has offices across the globe in Belfast, Chicago, Dubai, Miami, Milan, Paris, Philadelphia, San Francisco, and Washington DC, we employ over 250 full-time staff, including 150 professional economists, industry experts and business editors—one of the largest teams of macroeconomists and thought leadership specialists.

