INDUSTRY THRESHOLD
Thin-Bed Tuning-Frequency: Thickness Estimation Victor Aarre - Geophysics Advisor - schlumberger Introduction It is well known in the industry that seismic reflections from geological interfaces in the earth’s interior interfere with each other. This interference may either be constructive or destructive. The seismic wavelet is, according to the Fourier theorem, the sum of a number of individual frequencies, where each frequency has its own amplitude and phase. When a seismic wavelet is reflected from two neighboring reflectors (defined as the top and bottom of a thin bed), the amplitude spectrum of the reflected wavelet will hence be different from the spectrum of the original wavelet. This is because each frequency in the wavelet will have different amplitude, due to the interference between the reflectors ( I.e. the two reflectors act as a filter). By examining the spectrum of the reflected wavelet, it is hence, in some cases, possible to infer the presence and thickness of thin beds in the underground. These thin beds are often of great commercial interest for the energy industry, because the most common scenario is a sand body embedded in a shale host rock. A sand body is often porous and permeable, making it a perfect reservoir rock for hydrocarbons. Shale rocks are most often not permeable (unless the rock is fractured), and are hence excellent reservoir cap (and source) rocks, keeping the hydrocarbons in place in the embedded sand body. Prior Art There are a lot of prior arts in this domain. The most famous approach was discovered, and patented, by BP. The commercial name of their approach is “The Tuning Cube”. That invention was further elaborated on in a paper, written by K. Marfurt and R. Kirlin, in the Geophysics journal in 2001. That paper is an excellent introduction to the general scientific topic. What’s common for all existing methods I know of (for thin-bed detection through spectral decomposition) is that those methods attempt to infer the presence of thin beds through studies of the amplitude spectrum of the reflected waveform. This is a challenge; because the amplitude of the individual frequencies in the source wavelet is not equal (i.e. the amplitude spectrum of the wavelet is not “white” or “flat”). This means that the reflected seismic must become spectrally balanced before the tuning analysis begins. This spectral balancing step is complicated, at least when we do not have any wells available for joint log/seismic wavelet estimation, and we hence need to use blind/statistical methods for the spectral balancing step.
components one want to analyze. This number is in general dependent on the sample rate (which determines the maximum frequency, called Nyquist frequency) and the number of samples in the trace (which determines the number of spectral components which are required to fully represent the input trace).
Description of the Invention Including Examples and Drawings
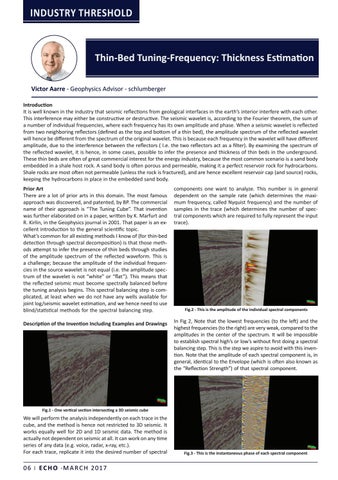
In Fig 2, Note that the lowest frequencies (to the left) and the highest frequencies (to the right) are very weak, compared to the amplitudes in the center of the spectrum. It will be impossible to establish spectral high’s or low’s without first doing a spectral balancing step. This is the step we aspire to avoid with this invention. Note that the amplitude of each spectral component is, in general, identical to the Envelope (which is often also known as the “Reflection Strength”) of that spectral component.
Fig.2 - This is the amplitude of the individual spectral components
Fig.1 - One vertical section intersecting a 3D seismic cube
We will perform the analysis independently on each trace in the cube, and the method is hence not restricted to 3D seismic. It works equally well for 2D and 1D seismic data. The method is actually not dependent on seismic at all. It can work on any time series of any data (e.g. voice, radar, x-ray, etc.). For each trace, replicate it into the desired number of spectral
06 | E C H O • M A R C H 2017
Fig.3 - This is the instantaneous phase of each spectral component
