
6 minute read
Young Researchers

Methodology for Constructing Stochastic Decision Trees for Decision Making Under Uncertainty and Risk
Paola Pastor - Reservoir Charactherization - University of Calgary Ivan Plata - Leader of Technical Information Management - Ecopetro
Advertisement
Abstract The purpose of the proposed methodology is the generation of predictive models based on stochastic decision trees for effective decision making, covering the spectrum of risk and uncertainty; this way the uncertainty and decision variables are modeled integrally to solve a given objective function. The methodology can be described in three general steps: 1- Data exploration and analysis. 2- Stochastic predictive model construction. 3- Results visualization and analysis; through these steps knowledge is acquired from the data as well as information for the decision making process.
Introduction The high levels of uncertainty and risk present in the oil and gas industry, demand detailed studies and utilization of tools that support the decision making process. Through history different theories and tools have been developed that partially answer the need to optimize and strengthen the decision making process. The decision trees technique, for instance, was used initially in the probabilities theory but it has a great impact in decision theory. Most decision trees have associated, by its nature, probability values that generally are assigned by expert’s judgment or the researcher’s subjective values, declaring in such way the decision trees as a deterministic tool with static variables that do not allow covering the uncertainty spectrum much less to represent the reality dynamics. The methodology proposed in this paper was developed taking into consideration three main phases: 1. Data exploration and analysis 2. Predictive stochastic model construction 3. Results visualization
Data Exploration and Analysis a. Problem formulation (Logical Framework Method). The aim is to understand the central problem that the stochastic decision tree model wants to solve (objective function). By understanding the central problem, its causes and effects, the problem is delimited. It is necessary to elaborate the problem tree to focus the efforts on eliminating and/or mitigating the causes and reduce the impact of the consequences. It is important to formulate the problem through an investigation question that allows confirmation of the hypothesis. The following kind of questions can be considered: • What is the value in terms of NPV, IRR, EFI or earned value of petro technical information in oil assets? • What is the contribution of petro technical information in the asset´s development? • Is it viable to acquire and/or reprocess seismic data in the assets? b. Search, analysis and preparation of data for the model At this stage, all information allowing identification and under
standing of uncertainty, decision and performance variables must be looked for. This information must be analyzed with the involved persons to define the scope, logics, limitations, correlations etc. of the decision tree and the data model feeding such a tree.
Stochastic Predictive Model a. Variables identification and objective function In this stage, the researcher aims to define the uncertainty, decision and performance variables as well as the objective functions of the model with the purpose of characterize them and subsequently associate them to the nodes of the decision tree; in this way a collection of typified variables are generated to build the stochastic model that provide a solution to the objective function. b. Model conceptualization (decision tree + data model). By a brainstorm and understanding the identified variables, a first draft of the decision tree is structured with the purpose of generating the input for structuring the data model allowing solving the objective function. c. Data model and decision tree building i. Model’s logic definition. Upon the brainstorming exercise, organize logically the model with the defined software, perform logic tests and when required, depending on the degree of difficulty and number of variables, perform a sensitivity analysis (tornado and dispersion diagrams) on the uncertainty variables, with the purpose of identifying those variables with the greatest impact on the model’s objective function. ii. Identification of probability functions for each uncertainty variable. Define the probability function that better correlates with the variable data, which can be defined by means of historical data and experts’ judgment. iii. Data model construction and shaping of the decision tree. It consists of constructing a model that contains the formulation of different equations, parameters, functions and probability distributions and Bayesian inferences, etc. Once the data model is constructed a simulation is carried out choosing the sampling type to work (i.e.: latin hypercube and Montecarlo) on the earned value; from this simulation the resulting parameters of the data model are obtained with which the stochastic decision tree is shaped. iv. Model calibration. It is the revision of the variables characterization, the model´s logic and the answers obtained. d. Stochastic decision tree simulation and model optimization. It focuses on analyzing the scenarios and resulting distributions of the simulation carried on the objective function within the stochastic decision tree for solving the formulated problem. Optimization is the search for an optimal decisions scenario for solving the objective function
information is achieved by means of specialized software to analyze the decision making (i.e: Decision grafo). Example Following a practical exercise illustrating the methodology proposed in this paper.
1- Data exploration and analysis
Fig.1 - Problem formulation. The figure shows the problem approach to be developed as example
2. Stochastic predictive model
Fig.4 - Earned value (EV) distribution of seismic acquisition (Y)
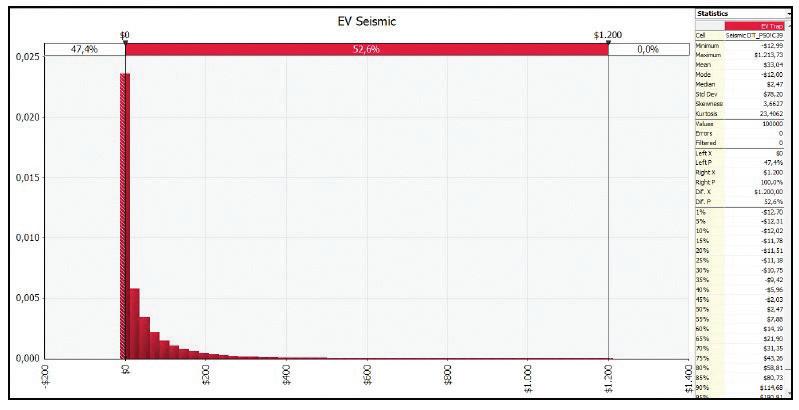
Fig.4 shows that %47,4 of the occurrences take place within an earned value of acquiring seismic (Y) negative range of 14- to 0 MUS$. It is concluded that VOI is equal to 0. For %52,6 of the iterations the positive earned value of acquiring seismic (Y) is in a range between 0 and 1200 MUS$, therefore Y=VOI which means that the probability of having VOI>0 is %52,6. According to this, the probability of destroying value with the seismic acquisition and drilling of an exploratory well is %47,4.
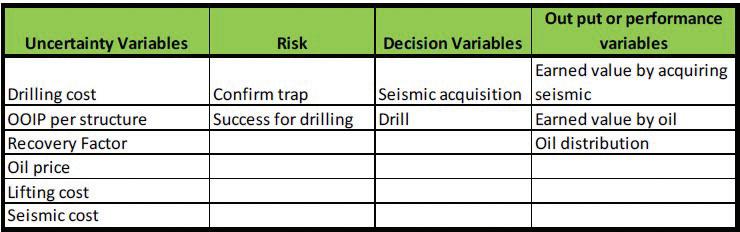
Table 1 Model variables. The table resumes identified variables for the decision tree and data model (Risking matrix).
Once the data model is worked out an the parameters and basic input for the simulation runs are generated, the stochastic decision tree in configured; in this stage the probability functions for uncertainty variables are included, seeking coherence in logics and exercise results. The configured decision tree is shown in Fig.3 Fig.2 - Probability functions identification
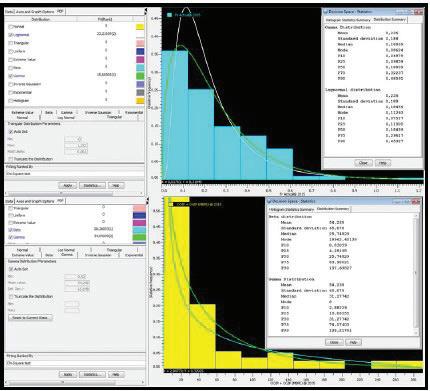

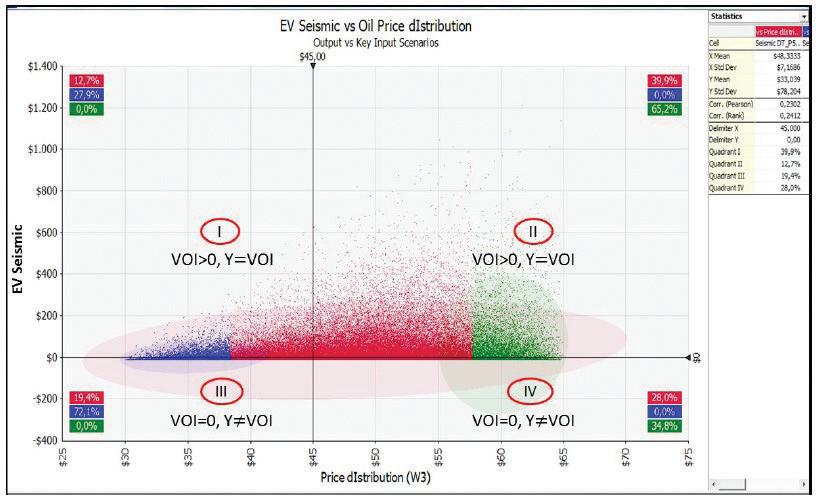
Fig.5 - Dispersion plot. Blue dots are Y scenarios between P1 and P10. Red dots represent all iterations and green dots Y values in the P80 - P90 range. Quadrants I and II show VOI >0 scenarios.
Conclusions 1. The methodology allows building stochastic predictive tools that support the process of decision making, by solving an objective function through the use of different mathematical, statistical and computational techniques. 2. With the example a solution was obtained for the objective function (Y) to be solved, which was determined by the earned value of acquiring seismic information. 3. Along the investigation and development of the proposed method a high degree of impact and application in other fields as medicine, precise agriculture, financial, etc, was identified. 4. This work permits generating inputs and new windows of investigation about decision trees in the scientific context for development in the machine learning and artificial intelligence areas, where a large part of the logics in these models of automatic learning are based on decision tree algorithms. 5. The method does not differ nor disagree from the BI, BA, Big data tools among others; it was inspired as a complement for the other tools looking for logic, mathematical, statistical and computational coherence in the analysis and decision making process in an organization. 6. The main contribution to knowledge offered by the method is provided in two large complementary areas: data science and decision theory. What the authors search for is to create scientific culture in the decision making process based on data science with different levels of complexity for any organization.
