INDUSTRY THRESHOLD
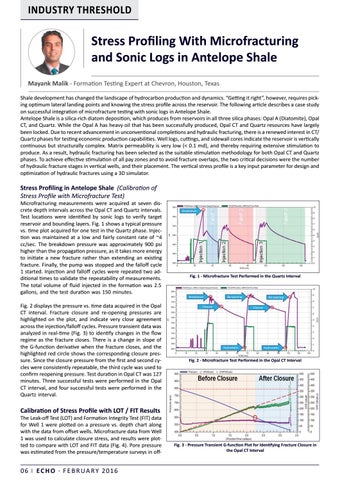
Stress Profiling With Microfracturing and Sonic Logs in Antelope Shale Mayank Malik - Formation Testing Expert at Chevron, Houston, Texas Shale development has changed the landscape of hydrocarbon production and dynamics. “Getting it right”, however, requires picking optimum lateral landing points and knowing the stress profile across the reservoir. The following article describes a case study on successful integration of microfracture testing with sonic logs in Antelope Shale. Antelope Shale is a silica-rich diatom deposition, which produces from reservoirs in all three silica phases: Opal A (Diatomite), Opal CT, and Quartz. While the Opal A has heavy oil that has been successfully produced, Opal CT and Quartz resources have largely been locked. Due to recent advancement in unconventional completions and hydraulic fracturing, there is a renewed interest in CT/ Quartz phases for testing economic production capabilities. Well logs, cuttings, and sidewall cores indicate the reservoir is vertically continuous but structurally complex. Matrix permeability is very low (< 0.1 md), and thereby requiring extensive stimulation to produce. As a result, hydraulic fracturing has been selected as the suitable stimulation methodology for both Opal CT and Quartz phases. To achieve effective stimulation of all pay zones and to avoid fracture overlaps, the two critical decisions were the number of hydraulic fracture stages in vertical wells, and their placement. The vertical stress profile is a key input parameter for design and optimization of hydraulic fractures using a 3D simulator.
Stress Profiling in Antelope Shale (Calibration of Stress Profile with Microfracture Test)
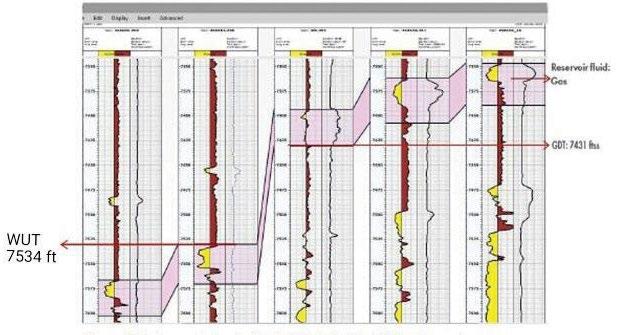
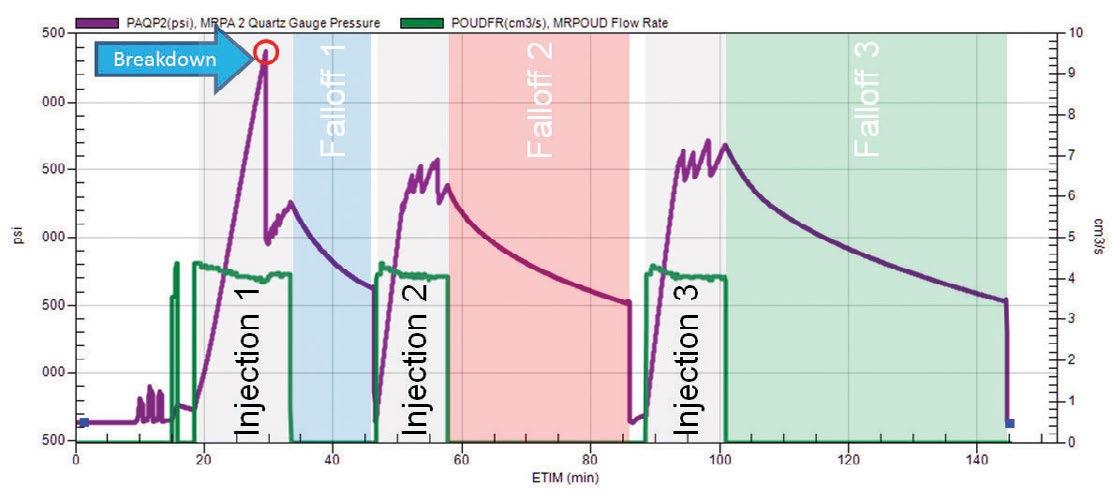
Microfracturing measurements were acquired at seven discrete depth intervals across the Opal CT and Quartz intervals. Test locations were identified by sonic logs to verify target reservoir and bounding layers. Fig. 1 shows a typical pressure vs. time plot acquired for one test in the Quartz phase. Injection was maintained at a low and fairly constant rate of ~4 cc/sec. The breakdown pressure was approximately 900 psi higher than the propagation pressure, as it takes more energy to initiate a new fracture rather than extending an existing fracture. Finally, the pump was stopped and the falloff cycle 1 started. Injection and falloff cycles were repeated two additional times to validate the repeatability of measurements. The total volume of fluid injected in the formation was 2.5 gallons, and the test duration was 150 minutes. Fig. 2 displays the pressure vs. time data acquired in the Opal CT interval. Fracture closure and re-opening pressures are highlighted on the plot, and indicate very close agreement across the injection/falloff cycles. Pressure transient data was analyzed in real-time (Fig. 3) to identify changes in the flow regime as the fracture closes. There is a change in slope of the G-function derivative when the fracture closes, and the highlighted red circle shows the corresponding closure pressure. Since the closure pressure from the first and second cycles were consistently repeatable, the third cycle was used to confirm reopening pressure. Test duration in Opal CT was 127 minutes. Three successful tests were performed in the Opal CT interval, and four successful tests were performed in the Quartz interval.
Fig. 1 - Microfracture Test Performed in the Quartz Interval
Fig. 2 - Microfracture Test Performed in the Opal CT Interval
Calibration of Stress Profile with LOT / FIT Results
The Leak-off Test (LOT) and Formation Integrity Test (FIT) data for Well 1 were plotted on a pressure vs. depth chart along with the data from offset wells. Microfracture data from Well 1 was used to calculate closure stress, and results were plotted to compare with LOT and FIT data (Fig. 4). Pore pressure was estimated from the pressure/temperature surveys in off-
06 | E C H O
•
F E B R U A R Y 2016
Fig. 3 - Pressure Transient G-function Plot for Identifying Fracture Closure in the Opal CT Interval