
Briefing book

CONTENTS TABLE OF 4 PROJECT EXECUTIVE SUMMARY SOY APP 2 USAID MOTIVATION TO ADOPT THE PRODUCT LIFECYCLE FRAMEWORK 6 STAGE GATE PANELIST BIOS 7 AGENDA 3 THE PRODUCT LIFE CYCLE FRAMEWORK 8 GATE MEETING GUIDANCE 12 PROJECT TEAM PRESENTATION PROJECT I2I PRINT PLAN 13 BLANK RUBRIC TECHNOLOGY MANAGEMENT PLAN* STATION 1 STATION 2 STATION 3 STATION 4 PURPOSE OF I2I 14 9 19 5 PURPOSE OF THE STAGE GATE PROCESS *TECHNOLOGY MANAGEMENT PLAN ONLY AVAILABLE FOR THE PROJECT TEAM THAT COMPLETED STATION 1 TO 4.
USAID MOTIVATION TO ADOPT THE PRODUCT LIFE CYCLE FRAMEWORK
In 2021, USAID’s Bureau for XXXX adopted the product lifecycle framework. The Bureau sought to better align its research investments with the objectives of the 2018 Global Food Security Strategy. “For science, technology, and Innovation (STI) to drive economic development, improve food security and nutrition, and increase resilience, technologies must be relevant and adopted at scale ” (U S Government Global Food Security Strategy, FY 2022-2026, p 77 )
Internal analysis of a sample of self-reported Phase 4 (adopted) Center for Agriculture technologies in their Research Rack Up database found, “(l)imited evidence of adoption…. Specifically, of 53 non-repeat entries of RRU Phase 4 innovations, just four appear to have evidence of uptake at scale This is corroborated, as one example, by the African Seed Access Index (TASAI) data where the average age of seed varieties continues to languish as many common varieties are 15-20 years old, or older.”
The Global Food Security Strategy invokes the product life cycle framework to remediate the low adoption at scale problem It states, “(u)nfortunately, new technologies and innovations are often not taken up as readily as would be beneficial for positive economic outcomes To address adoption and scaling challenges, research must be demand-driven and focus on the specific preferences of producers, processors, and consumers. Such focused research investments begin with identifying target profiles for products, processes, or methodologies that are researched, developed, and advanced using a product life cycle framework ”
2
TABLE OF CONTENT
THE PRODUCT LIFE CYCLE FRAMEWORK
The product life cycle framework was formalized by Dr. Raymond Vernon at Harvard University in the 1960s as he applied it to competition and the dynamics of global trade and then applied by Theordore Levitt, also at Harvard[1][2] The PLC links the late stages where adoption takes place with the early formative stages of discovery and testing. The implication being twofold for innovators: 1) the explicit importance to USAID of adoption as well as discovery, and 2) the explicit relationship between discovery and adoption. The Global Food Security Strategy brings to the fore that USAID research should not take place in isolation but instead be demand-driven or connected to serve the specific needs of local actors

A second theme of applied PLC management entails transparency. PLC does not take place in isolation but involves the activity of stage gating[3]. Stage gating allows an early and continual assessment of the likelihood of sustainable adoption at scale. Technology managers stage gate, either internally, or more formally in response to a review panel, the progress of the research, their vision of adoption at scale, and the expected timeframe for adoption The periodic assessment early on, and then throughout the life cycle allow technology managers and key stakeholders to formally evaluate the progress along the lifecycle using key performance indicators (KPI).
The use of return on investment as a KPI when stage gating presents a third theme. Stage gating Part of the stage gating process invokes a third theme of the product lifecycle, return on investment Periodic internal or external review estimates the ratio of the costs to develop and take a technology to scale with the scope and scale of benefits from adoption. Stage gating seeks to avoid early on, for example, the last mile problem, where the cost of actual adoption if incurred might dramatically reduce the ROI and thus require a project reevaluation.
[1] Vernon, R. (1966). "International Investment and International Trade in the Product Cycle," The Quarterly Journal of Economics, Oxford University Press, vol. 80(2), pages 190-207.
[2] Levitt, T. (1965). EXPLOIT the Product Life Cycle. Harvard Business Review, 43(6), 81-94
[3] Cooper, R. G. (1990). Stage-gate systems: a new tool for managing new products. Business horizons, 33(3), 44-54.
3
TABLE OF CONTENT BRIEFING BOOK
PURPOSE OF I2I
USAID built i2i as a platform to support the transition to the product life cycle framework for its R4D portfolio.
Firstly, i2i serves as a learning platform that utilizes a “learning by doing” instructional design approach. Thus, project teams build their technology management plans while learning about technology management The learning platform and its design allow researchers and stakeholders to better understand the process of moving an innovation from discovery to sustainable adoption at scale.
Secondly, i2i consists of a management system to house, organize, and present the data involved in managing a technology through the product life cycle.
Finally, i2i entails a data portal whereby teams collaborate using i2i as a “whiteboard ” Fiduciaries such as AORs and other key administrators may access project cites for realtime review, discussion, and analysis. The data portal design also includes features that support the stage gating process allowing reviewers access to projects and associated data.
Researchers use i2i to plan and manage their innovations through the product lifecycle to adoption at scale. I2i has also been applied to support the research procurement process associated with formal notices of opportunities and requests for proposals. For example, one innovation currently uses i2i to improve the process of assessing applicants for funding. Applicants complete stations 1 and 2, and if successful are asked to move to the next stage of the process and complete stations 3 and 4 Evaluators, in turn, have access to actual technology management data that allows a more comprehensive analysis of a project’s potential to achieve sustainable impact at scale.
4
4 TABLE OF CONTENT
PURPOSE OF THE STAGE GATE PROCESS
Stage gating is a strategic process used to ensure that product development initiatives proceed in a structured and efficient manner, mitigating risks and maximizing chances of success[1]. Stage gating breaks down a project into distinct phases or stages, each with its own set of deliverables and checkpoints. At the end of each stage, a gate review involves an evaluation of the project's progress, viability, and alignment with strategic goals. For USAID, of particular interest is understanding at each stage of the R4D process the likelihood of achieving sustainable impact at scale, and if yes, when
These gate reviews serve several crucial purposes. First, they provide an opportunity to assess whether the project is on track and meeting its objectives. Second, they enable stakeholders to review and approve the continuation of the project into the next stage, based on the current state of affairs and the anticipated outcomes Third, they allow stakeholders to assess whether adequate resources are in place to achieve the desired outcome. Fourth, they allow for the identification and mitigation of potential risks and issues early on, reducing the likelihood of costly delays or failures later in the project lifecycle. For USAID, this helps avoid the accumulation of R4D investments that fail to move beyond PLC stages 2 & 3 (Discovery and Proof (Pilot)).
i2i, as a management system, brings into application the product life cycle framework and the stage gating activity. I2i provides a structured set of a project’s technology management data and process by which reviewers can conduct their evaluation. These data anchor the analysis by generating a common language, set of forms, and criteria, which in turn makes the analysis and guidance to the project team more focused and pragmatic
In sum, structured stage gating brings USAID greater transparency, timeliness, control, and returns from their R4D investments.
5
BRIEFING BOOK TABLE OF CONTENT
[1] Phillips, R , Neailey, K , & Broughton, T (1999) A comparative study of six stage‐gate approaches to product development. Integrated manufacturing systems, 10(5), 289-297.
AGENDA
Wednesday, May 1
Project team: Eric Sedivy
Interviewers: xxxx,xxx, xx,xx
Other Attendees: xx, xx,xx
Location: meeting link


Regina USAID
Background introduction
9:00 am - 9:10 am
Presentation by technology manager
Technology team
Stage Gate Review
Q &A
9:10 am - 9:25 am
Expert panel questions
9:25 am - 10:05 am
Additional questions
10:05 am - 10:10 am
Conclusion
10:10
6
and Feedback
10:30
am -
am
TABLE OF CONTENT
STAGE GATE PANELIST BIOS

NAME AND TITLE HERE NAME AND TITLE HERE NAME AND TITLE HERE NAME AND TITLE HERE NAME AND TITLE HERE 7 BRIEFING BOOK TABLE OF CONTENT
PROJECT EXECUTIVE SUMMARY SOY APP
For most small-holder farmers in Sub-Saharan Africa commercial soybean production is new. While public information on growing soybeans exists, it often falls to over-burdened field extension agents unfamiliar with the crop to educate farmers on proper growing practices It is common for a single field extension agent to manage between dozens and hundreds of farmers, making even a single farmer visit difficult, let alone several visits during a growing season. This general lack of direction leads farmers to grow soybean as they would other familiar crops such as maize or tobacco This typically results in low seed germination, reduced planting populations, more weeds, no in-season disease management, and grain-loss during harvest


For companies interested in scaling-up soybean production, the timely training of field technicians on good agronomic practices is critical for standardizing production methods, arming field staff with the knowledge to make informed in-field decisions and achieving a high return as a result of well managed fields. To this end, SIL is developing the SMART Soy app.
SIL’s SMART Soy v2 application supports technician training and education efforts by providing:
A summarized guide containing much of the guidance that SIL communicates to our partners participating in soybean variety or agronomic trials.
A scheduling tool to help extension agents keep track of key developmental phases and corresponding interventions.
A content framework to jump-start building a soybean training program.
A pocket reference for field technicians working with farmers growing soybeans
A labor-saving resource that allows extension agents to communicate key management interventions when in-person visitations are not possible.
The app covers topics ranging from pre-planting field considerations, planting methods, guidance on soybean developmental stages and diseases, tips on fertilizer application, and seed storage. The app will include easy to share technical infographics on key soybean practices to help extension agents communicate with famers when visitation is not possible
 Eric Sedivy
SMART Farm & Pan African Variety Trial Program Manager
Eric Sedivy
SMART Farm & Pan African Variety Trial Program Manager
8 TABLE OF CONTENT
PROJECT TEAM PRESENTATION


9 BRIEFING BOOK
TABLE OF CONTENT
SOY APP
PROJECT TEAM PRESENTATION SOY APP


10 TABLE OF CONTENT
PROJECT TEAM PRESENTATION


11 BRIEFING BOOK
TABLE OF CONTENT
SOY APP
PROJECT PRINT PLAN
What is a Project Print Plan?
The i2i Print Plan is a comprehensive PDF document extracted from the i2i platform. This document presents a tangible record of the project team's inputs and activities throughout the product life cycle (PLC). i2i operates as a management system involving six stations that support project teams to advance their technologies along the product life cycle. The management system consists of a dataset organized in a series of forms the project team completes as they build a sound plan to achieve success These data-rich forms comprise the Print Plan document.
The Print Plan serves as a data collection device to organize the large quantity of data project teams enter when figuring out how to move a product through to scale. It serves as a “whiteboard” for project teams to analyze and improve the management of their innovation The Print Plan and the matched rubric allow for internal and external evaluation of a project’s progress. In this way, reviewers in the stage gate exercise utilize the Print Plan as a second data source that complements the project team’s formal stage gate presentation.
Eventually, the Print Plan becomes a Technology Management Plan, a strategic document guiding the team through the product life cycle, when teams have completed i2i stations 1-4
How to use the Project Print Plan?
The i2i Print Plan serves as a practical guide and reference for project teams navigating the intricate process of introducing a new product to the market. Each section of the Print Plan outlines key information, providing a holistic view of the project's evolution and strategic direction The Project Print Plan supports the stage gating activity by helping reviewers understand both the strategy and details of a project's plan to move from discovery through to impact at scale
How to access the Project Print Plan?
Access the Print Plan using the following link: Stage-Gate Document
You may also access the Print Plan by logging in the i2i platform use your username and password. https://usaid s4prod com/
12 TABLE OF CONTENT
TECHNOLOGY MANAGEMENT PLAN*
What is a Technology Management Plan?
The i2i Technology Management Plan is a plan laid out
How to use the Technology Management Plan?
The Technology Management Plan helps
How to access the Technology Management Plan?
Access the Technology Management plan using the following link: Stage-Gate Document
You may also access the Technology Management plan by logging in to the i2i platform using your username and password. https://usaid s4prod com/
*TECHNOLOGY MANAGEMENT PLAN ONLY AVAILABLE FOR THE PROJECT TEAM THAT COMPLETED STATION 1 TO 4 13 BRIEFING BOOK
TABLE OF CONTENT
1
Stage Gate Rubric and Scoring Worksheet
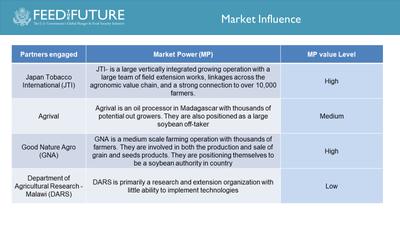
1 2 1 2 1 3 1 3 1 4 1 5 1 5 1 6 1 6 1 6 1 6 1 6 1 7 1 7 1 8 1 8 1 8 1 10 1 10 1 10 1 10 1 11 1 11 1 12 1 13 1 13 1 13 1 13 1 13 1 1 b 1 1 b 1 1 b Form 1 1 a 1 1 a Needs Needs Needs Needs Needs Modification Modification Modification Innovation Idea Innovation Idea Customer Rat ng Customer Rat ng Customer Rat ng Customer Rat ng Question Innovation Idea Market Influence Market Influence Market Influence Market Influence Perfect Customer Perfect Customer Customer Contact Customer Contact Value Proposition Value Proposition Customer Ranking Enabling Resources Enabling Resources Resource Endowment Situation Customer Rat ng Customer Identification Customer Identification Innovation Characteristics Innovation Characteristics Innovation Characteristics Clear? Clear? Concise? Box checked? Succinct and clear? Rate all customers? Consistent with 1 1? Specific with details? Specific with details? A l customer ranked? Identified acute need Identified alternatives Clear and Compelling? Name each customer? 3 characteristics entered? Each customer identified? Identified a principal reason At least 4 contacts entered? Completed for each customer? At least 4 customers identified? Data entered for all customers? Detailed and clear descriptions? Evaluation Criteria Data entered? Comprehensive resources clearly identified? Resource Endowment Situation properly classified? A l customers are scored? Enabling Resources scored consistent w th previous classification? Market Influence scored consistent with previous classification? Modification scored consistent with previous classification? Level of Connectedness properly scored? Classification aligns between value and need? Reasonably classified? A clear market power description for each customer? A clear market dominance description for each customer? Reasonably classified? Max = 4 Max = 4 Max = 3 Score 1 or 2 Score 1 or 2 Score 1 or 2 Score 1 or 2 Max score 4 If yes 1, if no 0 If yes 1, if no 0 If yes 1 if no 0 If yes 1 if no 0 If yes, 1, if no 0 If yes 1 if not 0 If yes, 1, if no then 0 If yes score 1 if no then 0 If yes, then 1, if no, then 0 If yes, then 1, if no, then 0 If yes then 1 if no then 0 If yes then 1 if no then 0 If yes then 1 if no then 0 Score 3, if no then 0,1 or 2 If yes, score 1, if no score 0 If yes score 1 if no score 0 If yes score 1 if no score 0 Score 1, if less than all score 0 If yes, score 2, if no score 0 or 1 If yes score 2 if no score 0 or 1 if yes score 1 point, if not then 0 Very detailed 2 less detailed 0 or 1 Criteria Description If yes, 1 point, if no 0, and move to 1 2 If yes, 1, if no 0 and move to the next form If yes, 3 points, f no 0 ,1 or 2 Very specific = 2 (includes information such as private sector dealers in the seed industry) More than 4 = 3, 1-3 = 1, no data = 0 Completion % Total score Score % 0% 0 0% Score Evaluation Date: Evaluator: Comments Project Name: Total Possible 60
Station 1 1 1 a STATION
14 TABLE OF CONTENT
CustomerGrouping
CustomerGrouping
CongruentCustomerneeds
CongruentCustomerneeds
LimitingResources
LimitingResources
CustomerGroupSolution Solution
STATION 2
Stage Gate Rubric and Scoring Worksheet
Meets
TechnicalFeasibility
Doesthesolutionexistanywhere?
Canwe,intellectually,conceiveofawayto technicallydevelopthesolution?
Dowehavethephysicalresourcestodevelopa solution?
Giventhehumanandintellectualresourceswe havecurrently,canweproduceasolutionina reasonableamountoftime?
OperationalFeasibility
Clear?
Clear?
Solutionreasonablyaddressesthe needsconsideringtheresources limitation?
Dataenteredforallgroups
Scored?
Scored?
Scored?
Scored?
Completeforallsolutions?
Boxticked?
Boxticked?
Boxticked?
Boxticked?
Dataenteredforallcustomergroups(if morethanone)?
2 4e Form 2 2c 2.3a 2.3b 2.3c 2.3d 2.3e 2.4a 2.4b 2.4c 2.4d 2.5a 2.5b 2.5c 2.5d 2.5e 2.5f 2.5g 2.5h 2.5i
Description
Solution
Question
Title
Description Assessing
GroupMarketDominance
Capacity
Solution
Solutions RedesignDifficulty
Adoption
identified
need
Location Inputs(Equipment/RawMaterials)
(KeyTalent) ProductionMethods(Storage) ProductionMethods(Staffing) ProductionMethods(Land/ Infrastructure) DeliveryApproach(ProcessingandLogistics) Marketing&Sales EvaluationCriteria Dataentered? Allcustomerassigned? Dataentered? Specific Dataentered? Specific Solutionaddressedforallcustomer groups?
Inputs
Clear? Clear? Clear? Clear? Clear? Clear? Clear? Clear? Maximum 3 Ifyes,1point,ifno0 Ifyes,1point,ifno0 Ifyes,1point,ifno0 Ifyes,1point,ifno0 Ifyes,1point,ifno0 Ifyes,1point,ifno0 Ifyes,1point,ifno0 Ifyes,1point,ifno0 Ifyes,1point,ifno0 If yes, 1 point, if no 0 Ifyes,1point,ifno0 Maximum2 Maximum2 Maximum2 Maximum2 Maximum2 Maximum2 Maximum2 Maximum2 CriteriaDescription Ifyes,1point,ifno0 Ifyes,1point,ifno0 Ifyes,1point,ifno0 Maximum3 Ifyes,1point,ifno0 Maximum3 Ifyes,1point,ifno0 Maximum2 Maximum2 Score Comments Evaluation Date: Evaluator: Project Name:
Station 2
2 1a 2 1a 2 1b 2 1b 2 1c 2 1c 2 2a 2 2b 2 2c BRIEFING BOOK 15 TABLE OF CONTENT
Form 2.6a 2.6b 2.6c 2.6d 2.6e 2.6f 2.6g 2.6h 2.6i 2.7a 2.7b 2.7c 2.7d 2.7e 2.8 2.9a 2.9b 2.9c 2.9d 2.10a 2.10b 2.10c 2.10d 2.10e 2.10f Question OperationalFeasibilityGap Location(Gaps) Equipment/RawMaterials(Gaps) KeyTalent(Gaps) Storage(Gaps) Staffing(Gaps) Land/Infrastructure(Gaps) Processing&Logistics(Gaps) Marketing&Sales(Gaps) MarketSize MarketSize(units) MarketSize(outputgrowth%without) MarketSize(outputgrowth%with) MarketSize(capacity) DerivedDemand AdoptionCosts AdoptionCosts AdoptionCosts(RecognizedPreviously) AdoptionCosts(Action) EstimatingReturnonInvestment EstimatingReturnonInvestment(Organization) EstimatingReturnonInvestment(Metric) EstimatingReturnonInvestment(Value) EstimatingReturnonInvestment(Means) EstimatingReturnonInvestment(Ends) EvaluationCriteria Dataenteredforalloperational feasibilitycategory? Clear? Clear? Clear? Clear? Clear? Clear? Clear? Clear? Dataenteredforallmajorcustomers. Dataentered Dataentered Dataentered Dataentered Datacompletedforallcustomers Dataenteredforallcustomers? Clear? Boxticked? Actionaddressestheadoptioncost? Datacompletedforallcustomers? Correctlyclassifytheorganization? Themetricismeasurable? Identifiedvalueisinalignmentwiththe valueofthestakeholder? Boxticked? Clear? CriteriaDescription Ifyes,1point,ifno0 Maximum2 Maximum2 Maximum2 Maximum2 Maximum2 Maximum2 Maximum2 Maximum2 Ifyes,1point,ifno0 Ifyes,1point,ifno0 Ifyes,1point,ifno0 Ifyes,1point,ifno0 Ifyes,1point,ifno0 Maximum5accordingtothe percentageofcompletion. Ifyes,1point,ifno0 Maximum2 Ifyes,1point,ifno0 Maximum3 Ifyes,1point,ifno0 Maximum3 Maximum3 Maximum3 Ifyes,1point,ifno0 Maximum2 Completion % Total score Score % 0% 0 0% Score Comments Total Possible 92
16 TABLE OF CONTENT
STATION 2
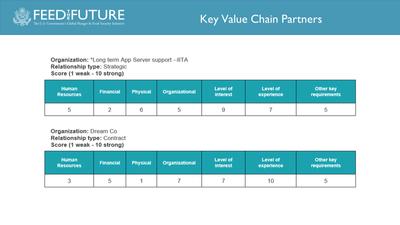
Form 3 1 3.1 3.1 3.2a 3.2a 3.2a 3.2a 3.2b Question Solution Design Alternative Solution Design Alternative Solution Design Alternative Scoring Value Chain Partner Candidates 1 Scoring Value Chain Partner Candidates 1 Scoring Value Chain Partner Candidates 1 Scoring Value Chain Partner Candidates 1 Scoring Value Chain Partner Candidates 2 Evaluation Criteria Data entered? Description concise? Description Clear? Data entered? Partner Candidates listed? All partner candidates scored? Relationship type chosen? All partners scored? Criteria Description If yes, 1 point, if no 0, and move to 1.2 Maximum 2 Maximum 2 If yes score 1 point, if no 0 > 3 Partners, score 2, if no 0 ,1 If yes score 1 point, if no 0 If yes score 1 point, if no 0 Maximum 3 Completion % Total score Score % 8 0% 0 0% Score Comments Evaluation Date: Evaluator: _____________________________________ Project Name: Total Possible Stage Gate Rubric and Scoring Worksheet Station 3
13 BRIEFING BOOK 17 TABLE OF CONTENT
STATION 3
4
Stage Gate Rubric and Scoring Worksheet
Form Question Evaluation Criteria Criteria Description Completion % Total score Score % 0% 0 0% Sc ore Comments Evaluation Date: Evaluator: Project Name: 4 1 4 1 4 1 4 2 4 2 4 2 4 3 4 3 4 3 4 4 4 4 4 5 4 5 4 5 4 5 4 5 4 5 Future Story Future Story Future Story Pathway scoring Pathway Identification Pathway Identification Pathway Identification Pathway scoring Planning with Milestones& Stage Gates Planning with Milestones& Stage Gates Planning with Milestones& Stage Gates Planning with Milestones& Stage Gates Planning with Milestones& Stage Gates Planning with Milestones& Stage Gates Identify Product Lifecycle Activities Identify Product Lifecycle Activities Identify Product Lifecycle Activities Score Values Data Entered? Data entered? Description Clear? Description Clear? Description Logical? Partners are selected? Relationship type chosen? Deadline set for all stages? Milestones set for all stages? Pathway Logically Identified? Status entered for all stages? Activities Logically Identified? Deadline aligned with the proposal? Description Clear? Description consistent and aligned with USAID’s mission? All pathway partners scored? If yes, 1, otherwise 0 If yes 1 otherwise 0 If yes, 1, otherwise 0 If yes, 1, otherwise 0 If yes, 5, otherwise 0 - 4 If yes, 2, otherwise 0 or 1 If yes, 2, otherwise 0 or 1 If yes, 2, otherwise 0 or 1 If yes 2 otherwise 0 or 1 If yes, 3, otherwise, 0,1 or 2 If yes 3 otherwise 0 1 or 2 If yes, 3, otherwise, 0,1 or 2 If yes, 3, otherwise, 0,1 or 2 If yes, 3, otherwise, 0,1 or 2 If yes, 1, otherwise, 0 If 100% > =4, score 4, 75-99% > = 4, score 3, 50 -74% >= 4, score 2 and 25-49% >=4, score 1 and less than 25% >= 4, score 0 If yes 3 otherwise 0 1 or 2 Total Possible 17
Station 4 STATION
18 TABLE OF CONTENT
G A T E M E E T I N G G U I D A N C E
BRIEFING BOOK 19 TABLE OF CONTENT
STAGE GATE GUIDE:
1. Introduction
2.
Review of the Previous Stage if applicable
3. Stage Classification Alignment
4. Project Presentation
5. Stakeholder Feedback
6. Decision Making
7. Action Items
TABLE OF CONTENT 20
8. Closing
SUGGESTED QUESTIONS:
PROCESS:
STAGE GATE CRITERIA:
17 BRIEFING BOOK 21 TABLE OF CONTENT