As we start a new year, we always hope that our lives and those of others will be better than they were in the past. Sometimes it is hard to be optimistic when we read about global events as well as domestic unrest and the multiple threats to natural habitats virtually everywhere. Nonetheless, we wetlanders will continue to try to help conserve and restore our Earth’s wetlands and educate the public on the values of these wet habitats as best as we can.
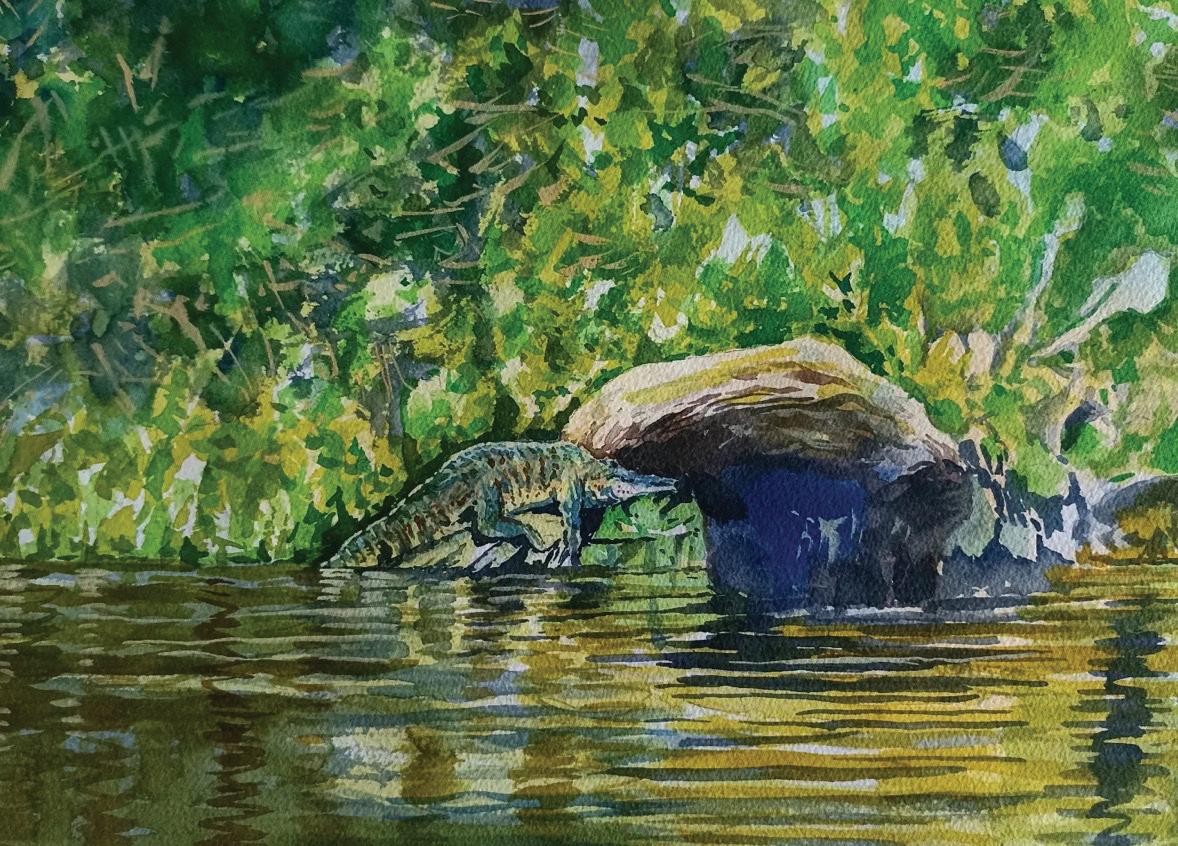
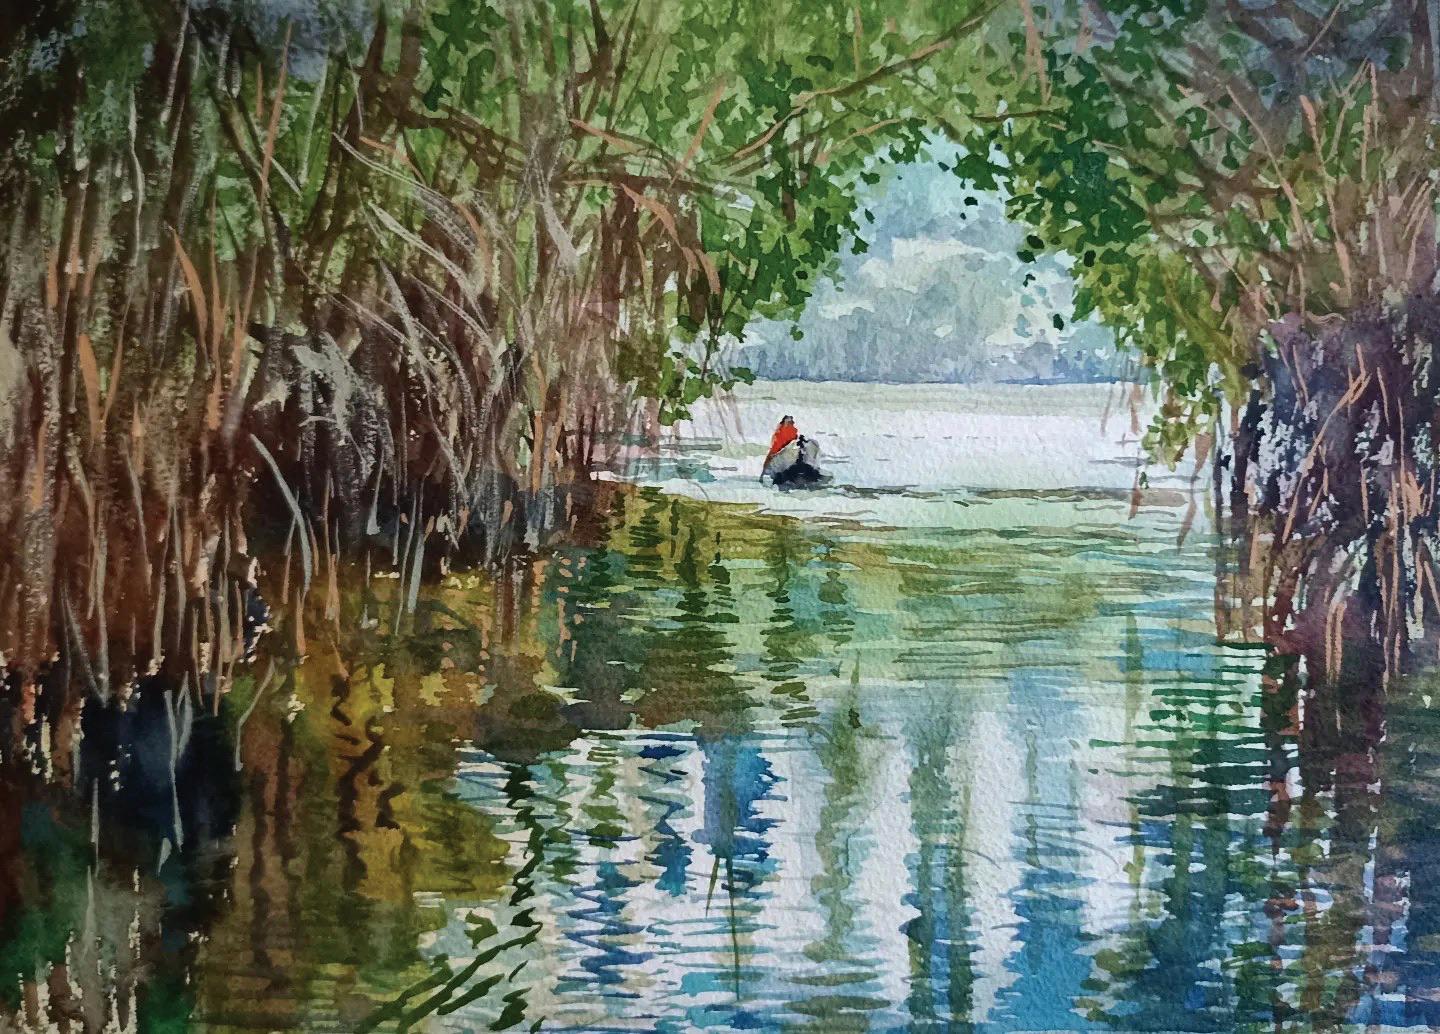
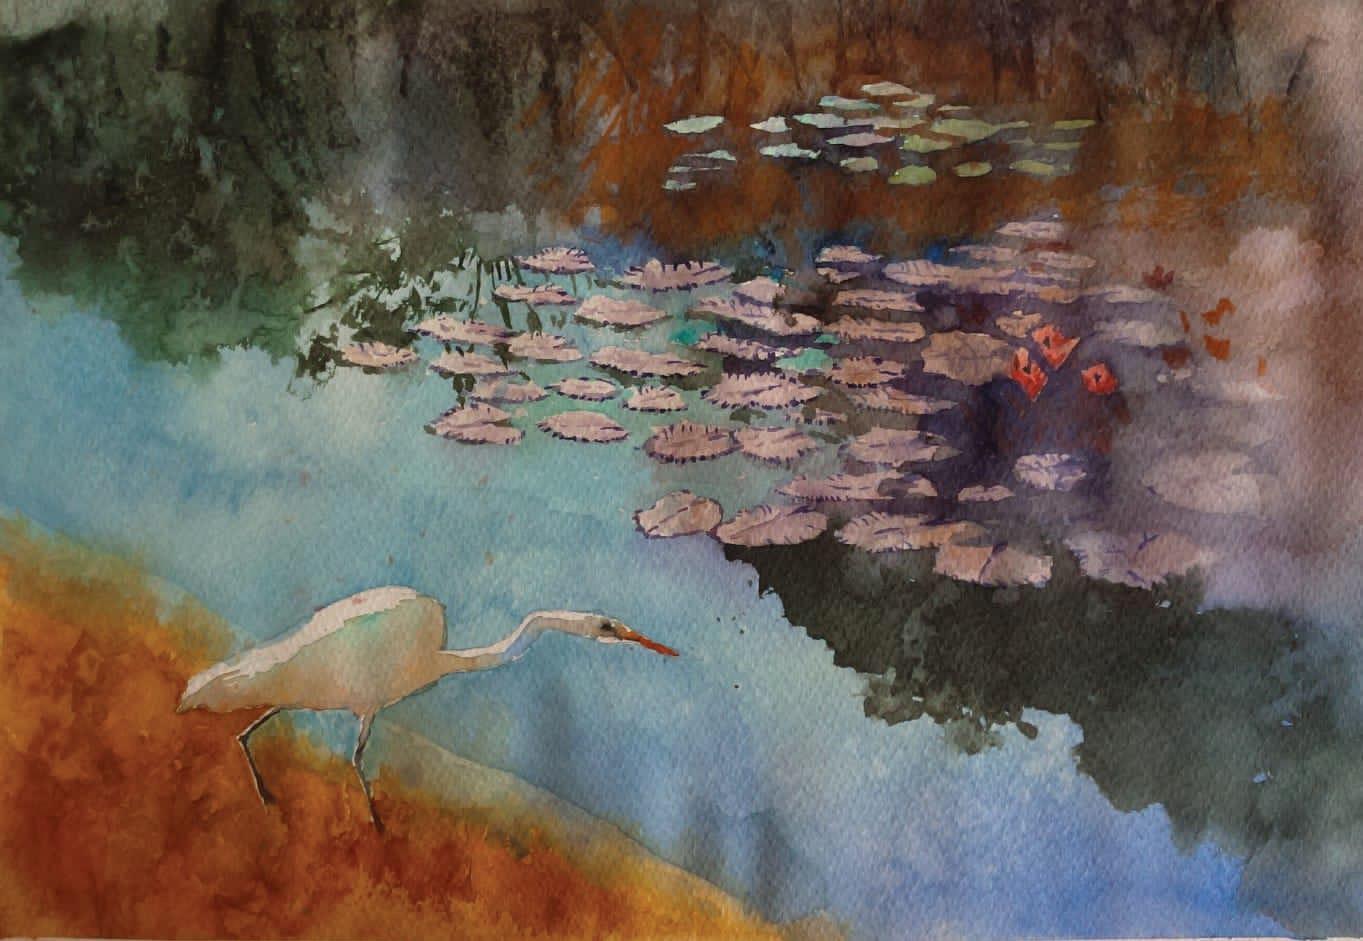
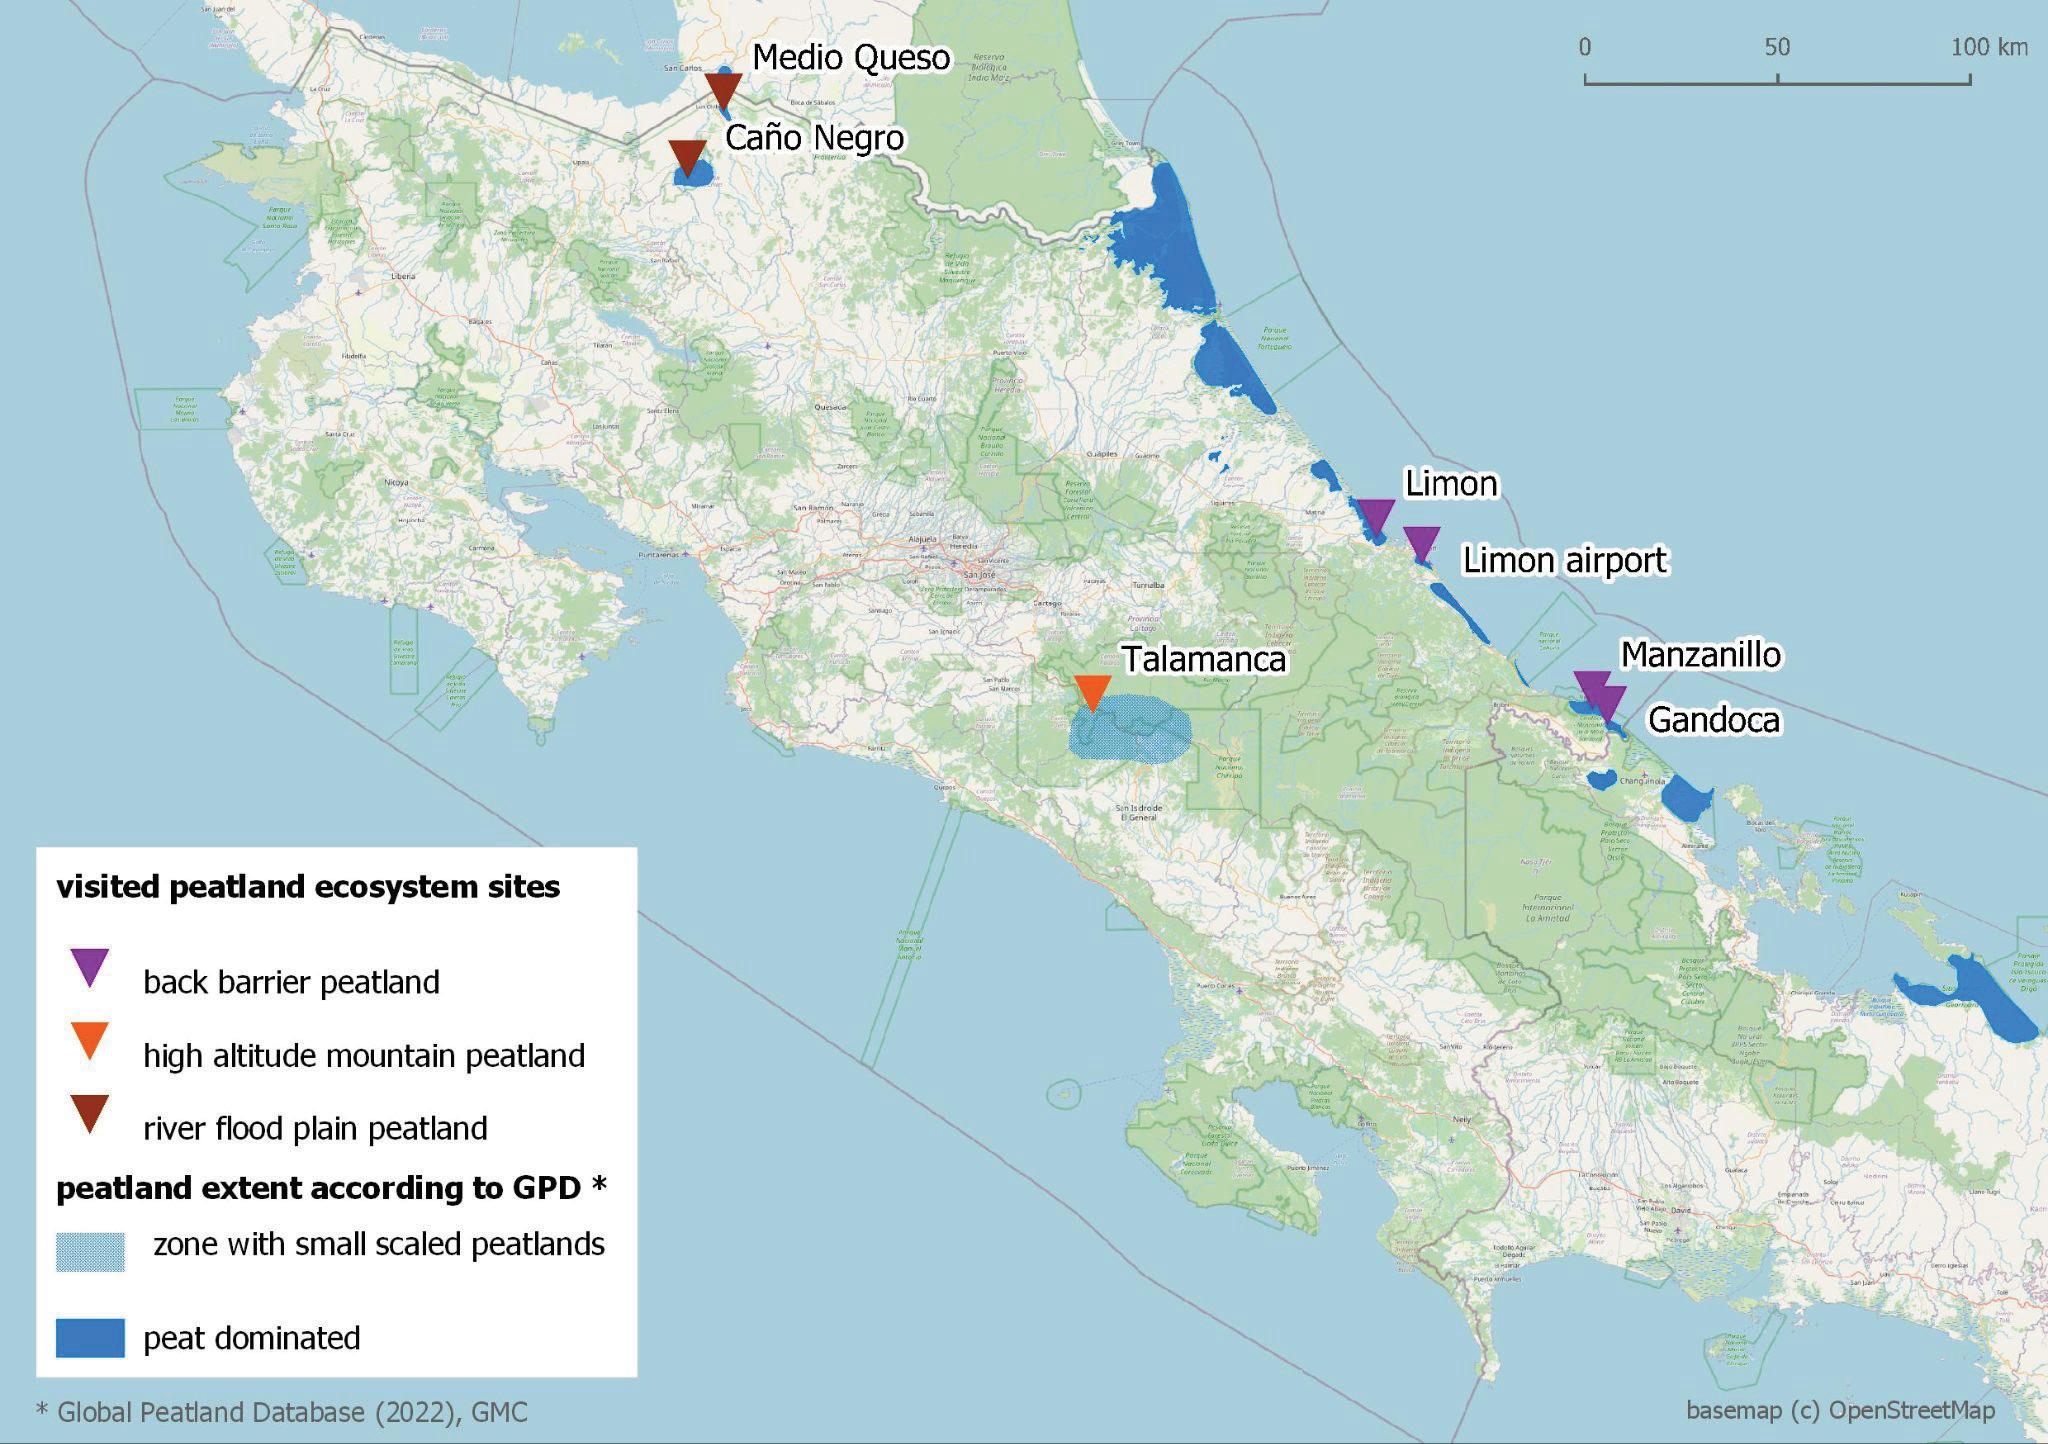
This issue is devoted largely to informing SWS members and our other readers about Latin American and Caribbean wetlands. It contains 14 articles covering a range of topics focused on mangroves, tropical peatlands, cushion plant wetlands, and karst wetlands. Thanks to all the contributors who have helped broaden our knowledge of these wetlands and the challenges they face. The material also include a self-portrait by Mexican watercolorist – José Herrera Gallegos who donated one of his artwork as a prize for the winner of our photo contest. A few examples of his work are included in the piece. Notes from the Field for this issue presents observations from a field trip to Costa Rican
peatlands. This issue would not have been possible without the assistance of Tatiana Lobato-de Magalhães, Co-chair of the Society’s International Chapter. She coordinated this issue, worked with authors to get their manuscripts in on time, and organized the photo contest. Regarding the latter, the winning photo by Julio César Chávez Barrera is on the cover of this issue and a number of other submissions are highlighted in Select Images from the Photo Contest section.
As this issue was in the final production stage, I was saddened to hear of the passing of one of our eminent wetland scholars. Dr. Paul Keddy passed away on December 26, 2023. Most of you are familiar with his contributions, especially his book: Wetland Ecology: Principles and Conservation. Dr. Arnold van der Valk graciously prepared a tribute to Dr. Keddy for this issue.
It’s been an especially successful year for Wetland Science & Practice. We are now assigning doi codes to all our articles and have also done so for most, if not all, of our past articles. This process therefore expands access to the WSP contributions. Thanks to past president Bill Kleindl for his support on this. We look forward to more contributions in 2024.
Best wishes to all for 2024 and Happy Swamping!
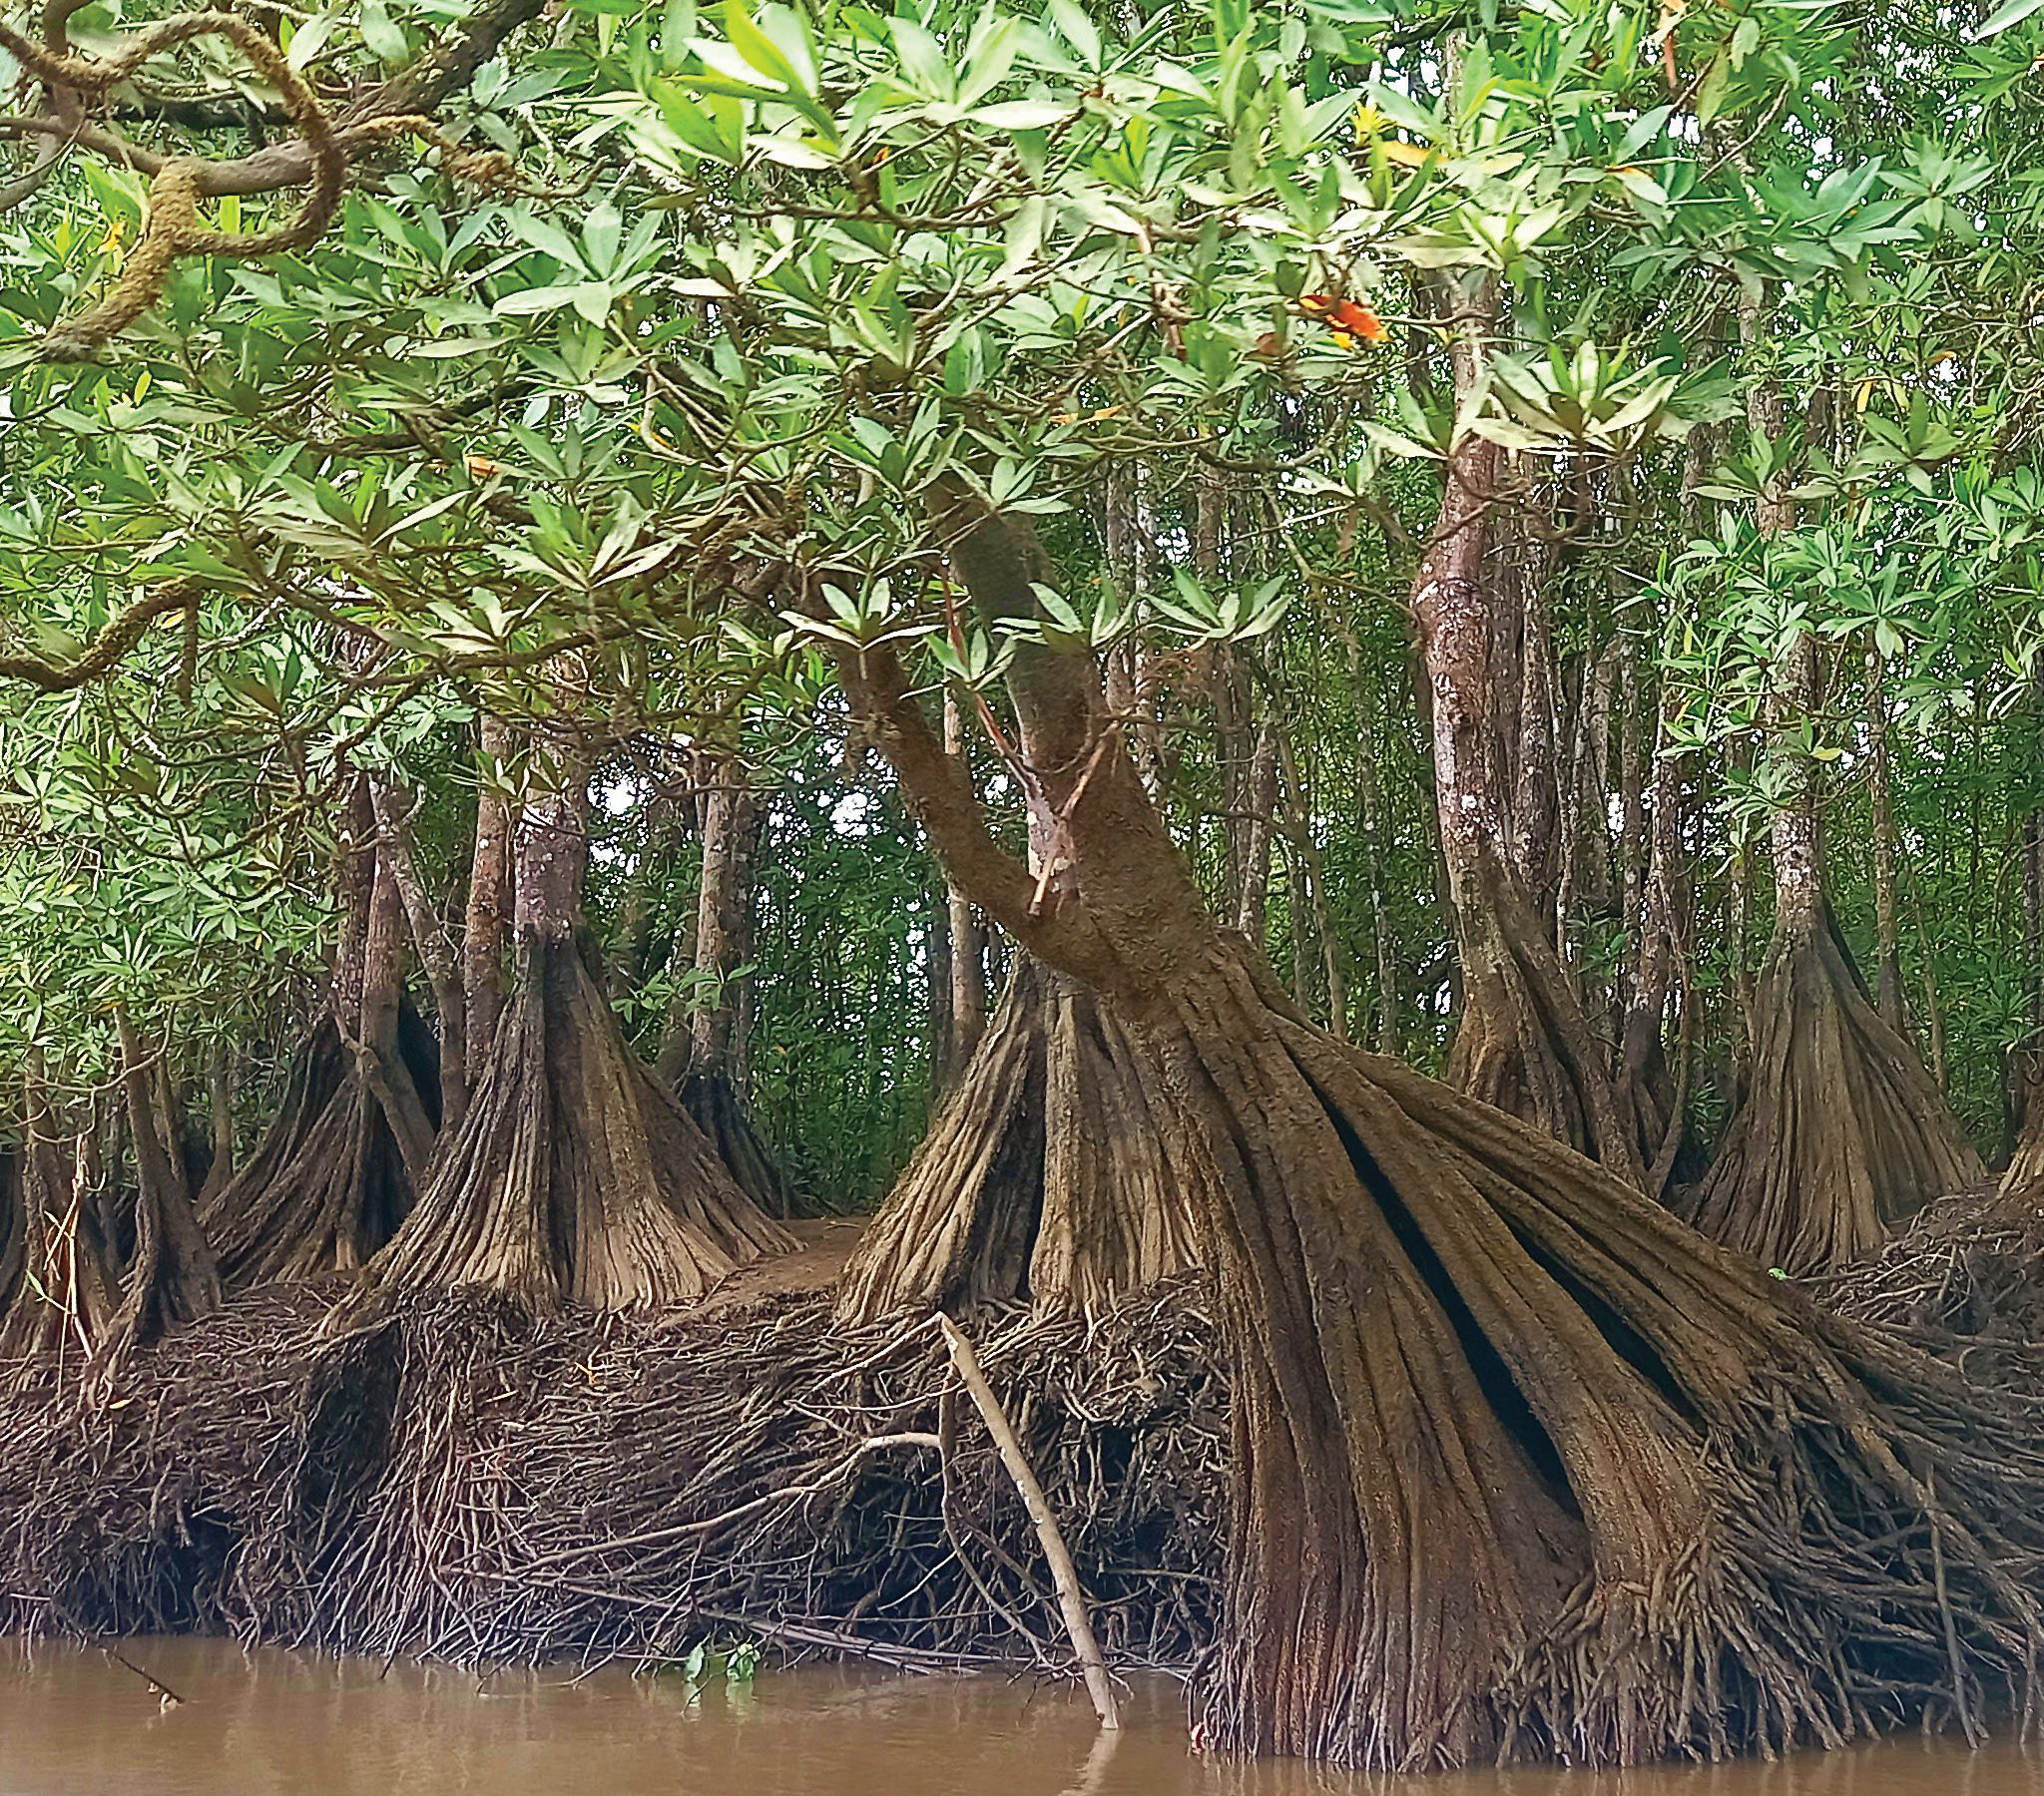
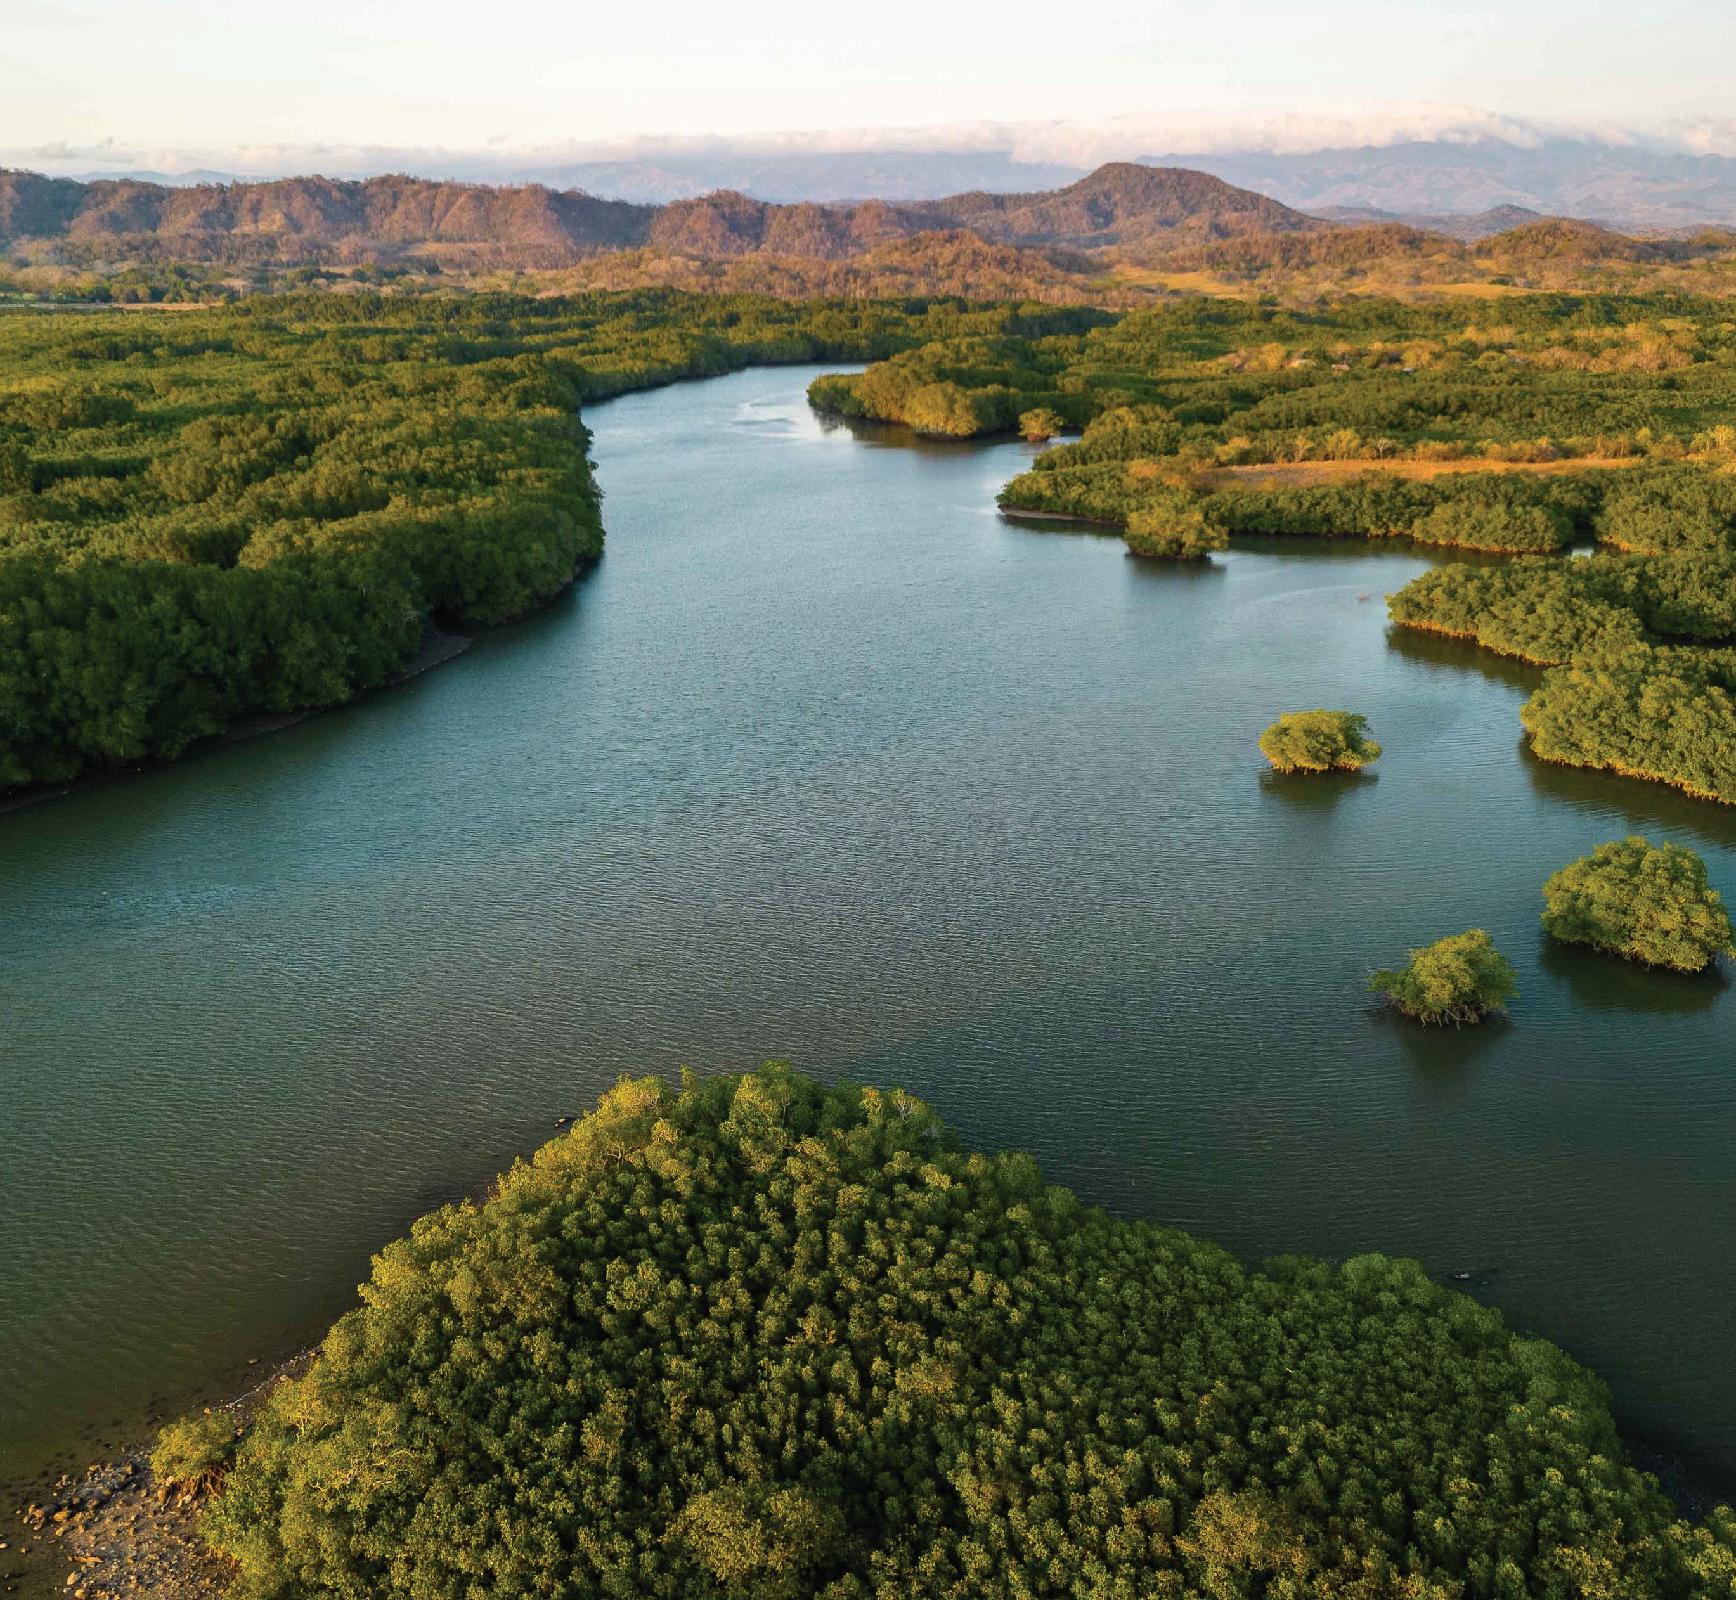
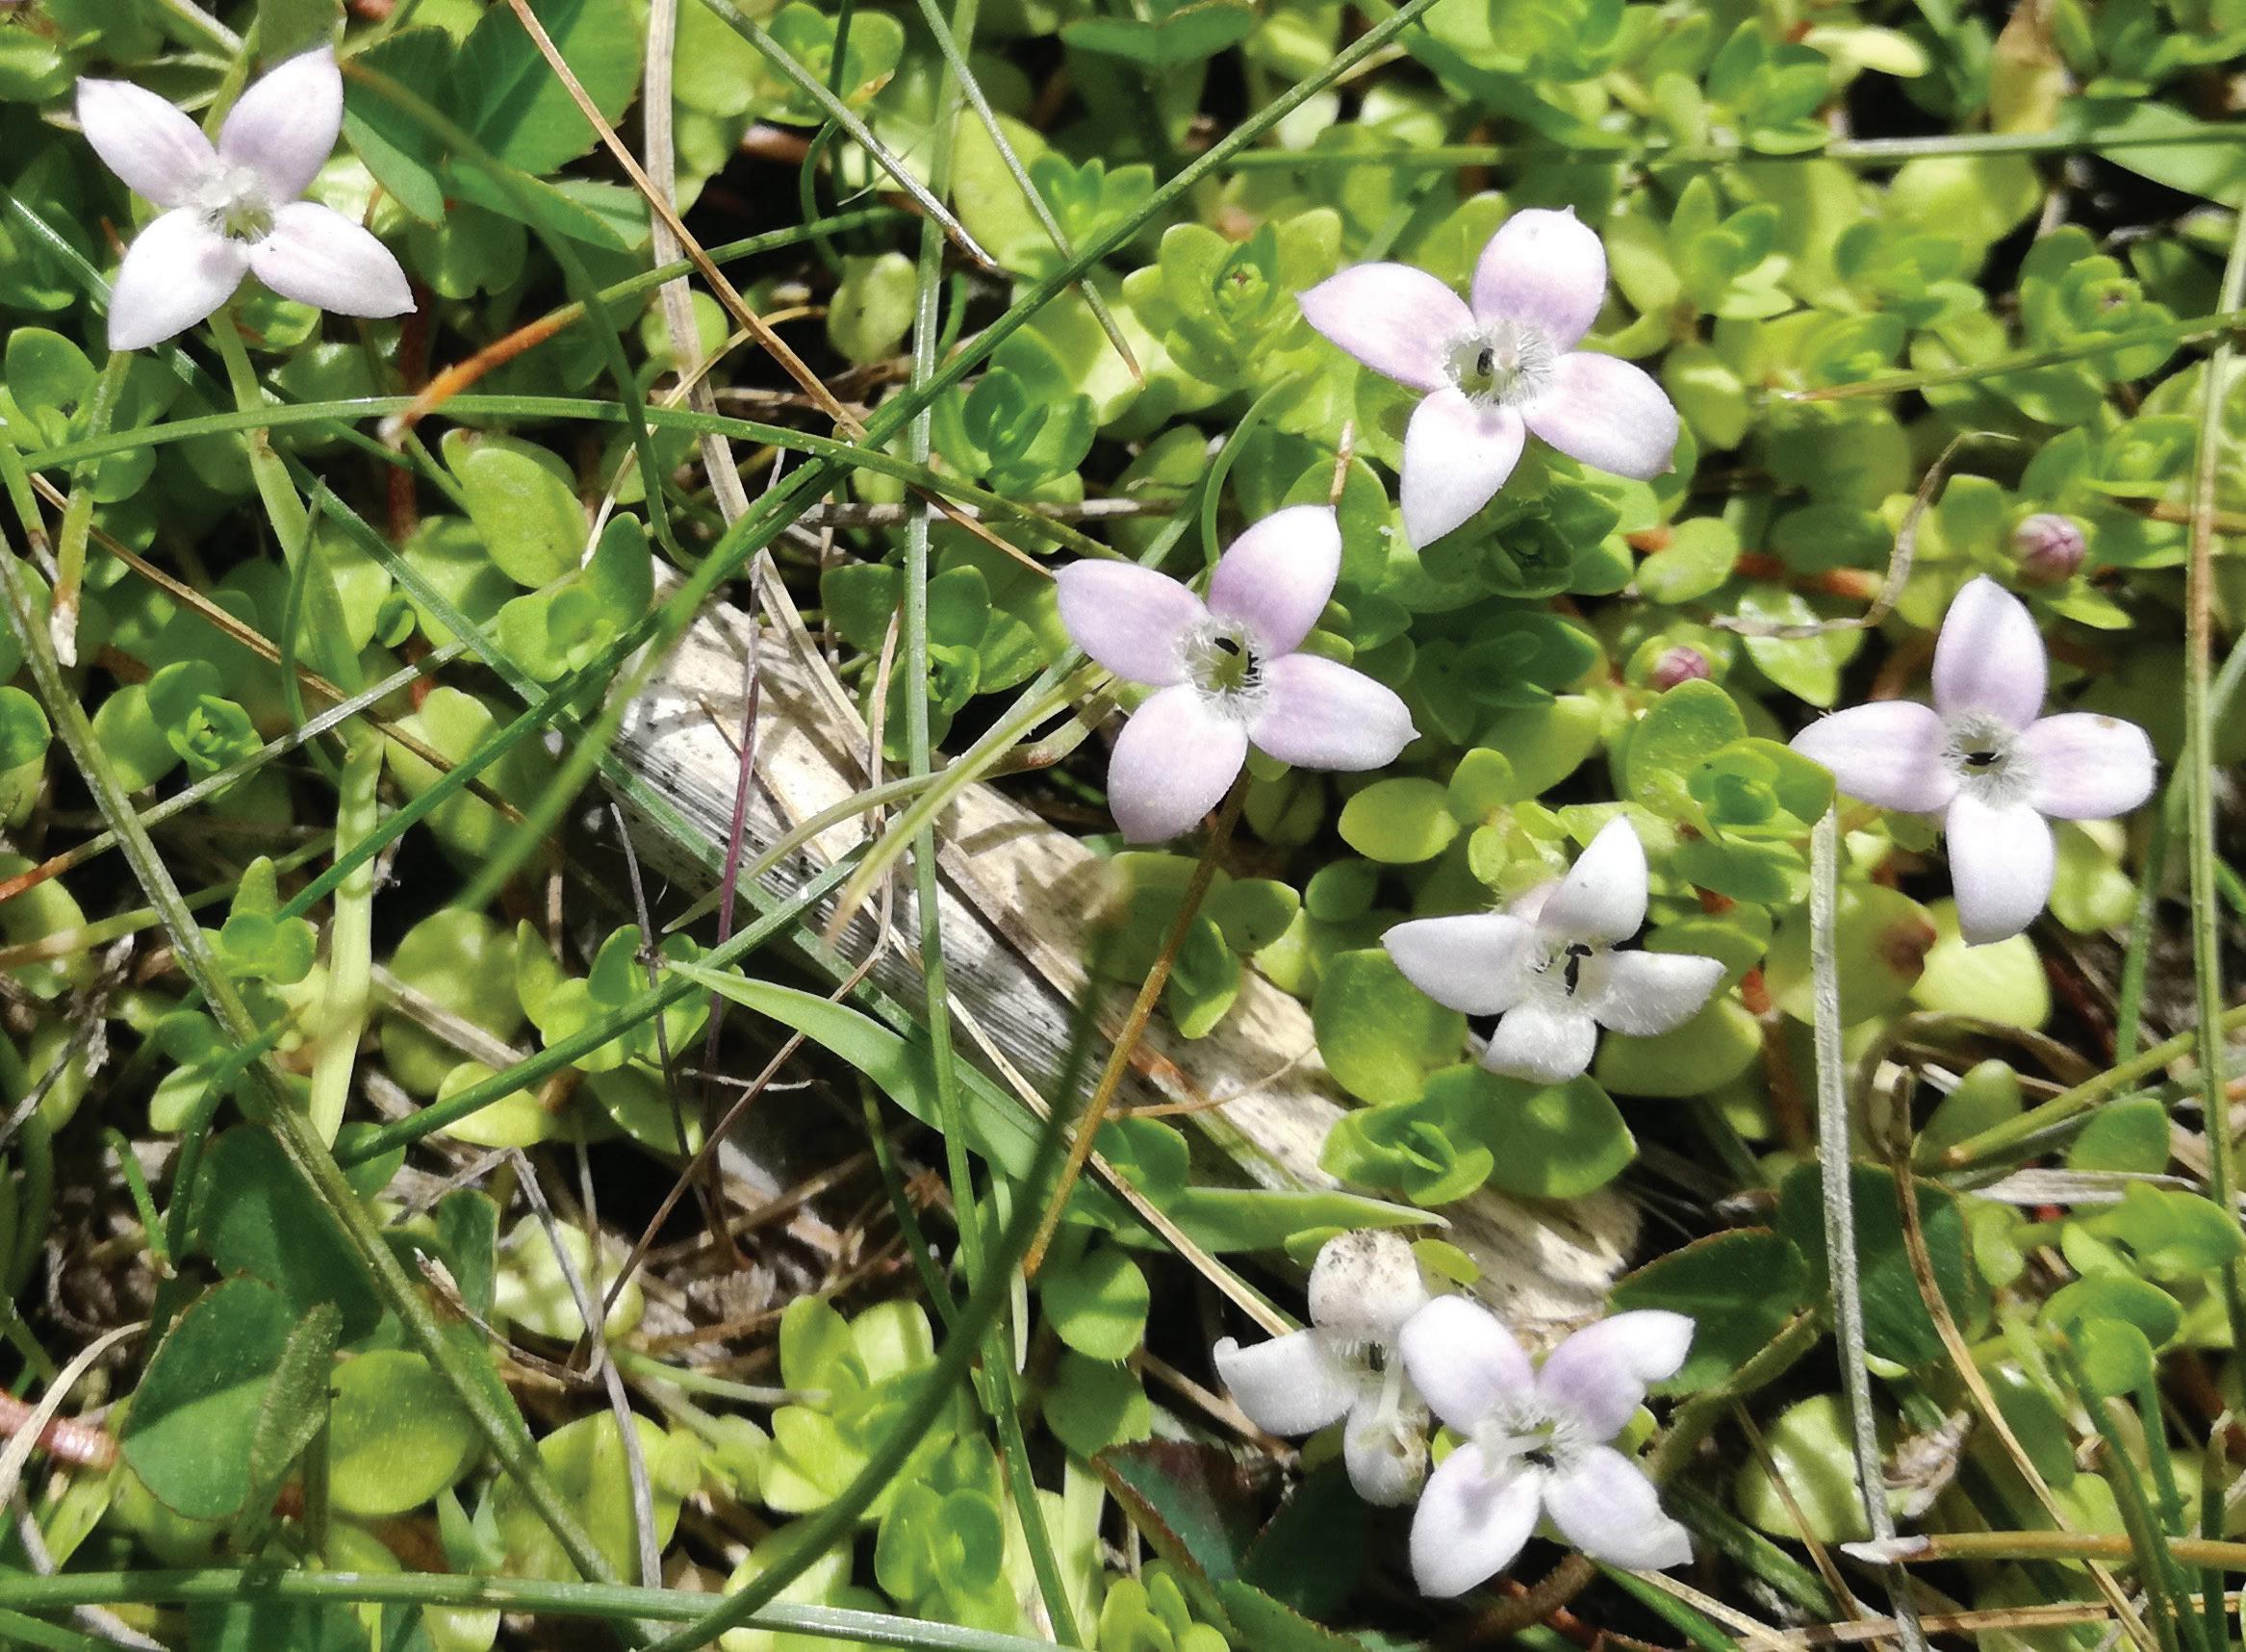
The Tea Mangrove (Pelliciera rhizophorea) is one of the rarest mangroves on Earth. This group occurred along the Pacific Coast in Costa Rica’s Térraba-Sierpe National Wetlands and is also found along the Caribbean coast. The nectar from its white flowers is a favorite of the endangered Mangrove Hummingbird (Amazilia boucardi) and as such it may be the only mangrove pollinated by a vertebrate. (Photo by Julio César Chávez Barrera)
COVER PHOTO:
CONTENTS
Vol. 42, No. 1 January 2024
ISSN: 1943-6254
2 / From the Editor’s Desk
4 / President’s Address
5 / SWS Webinars
6 / SWS Conference and Other News
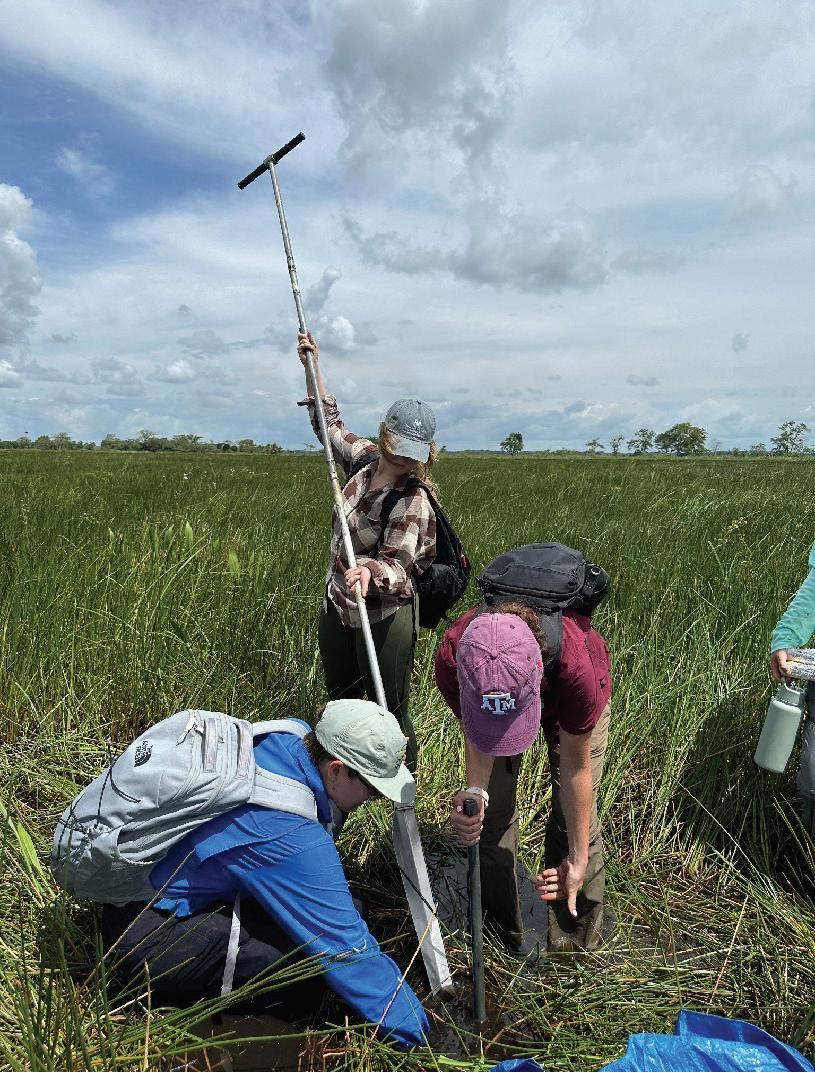
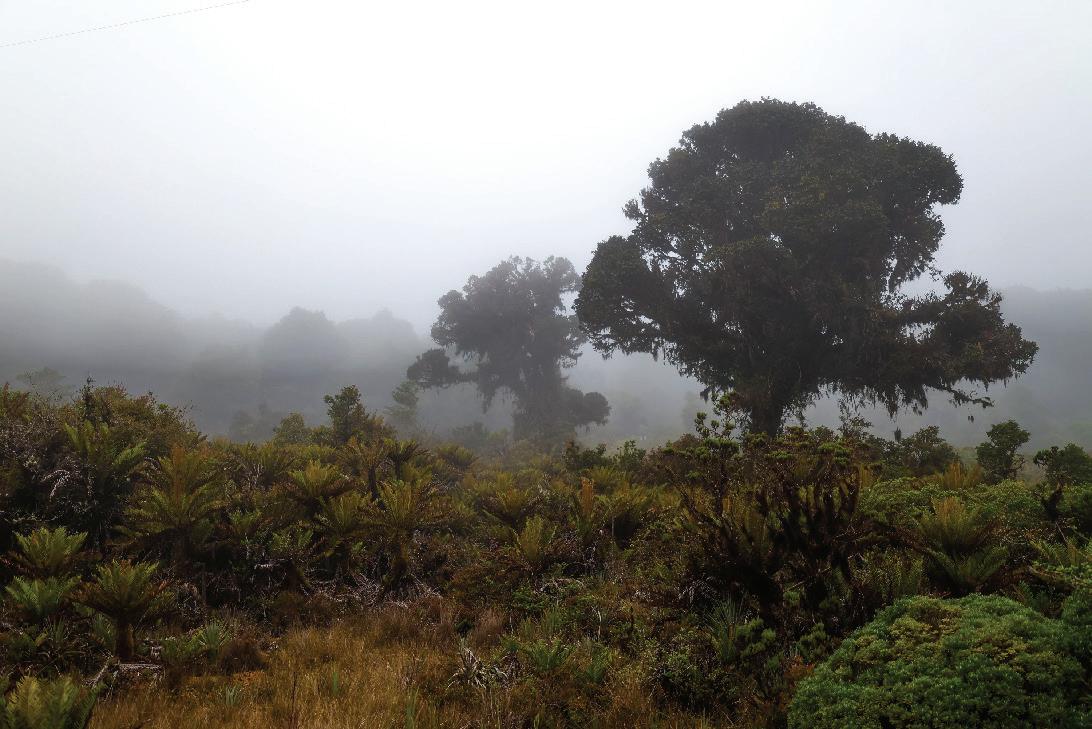
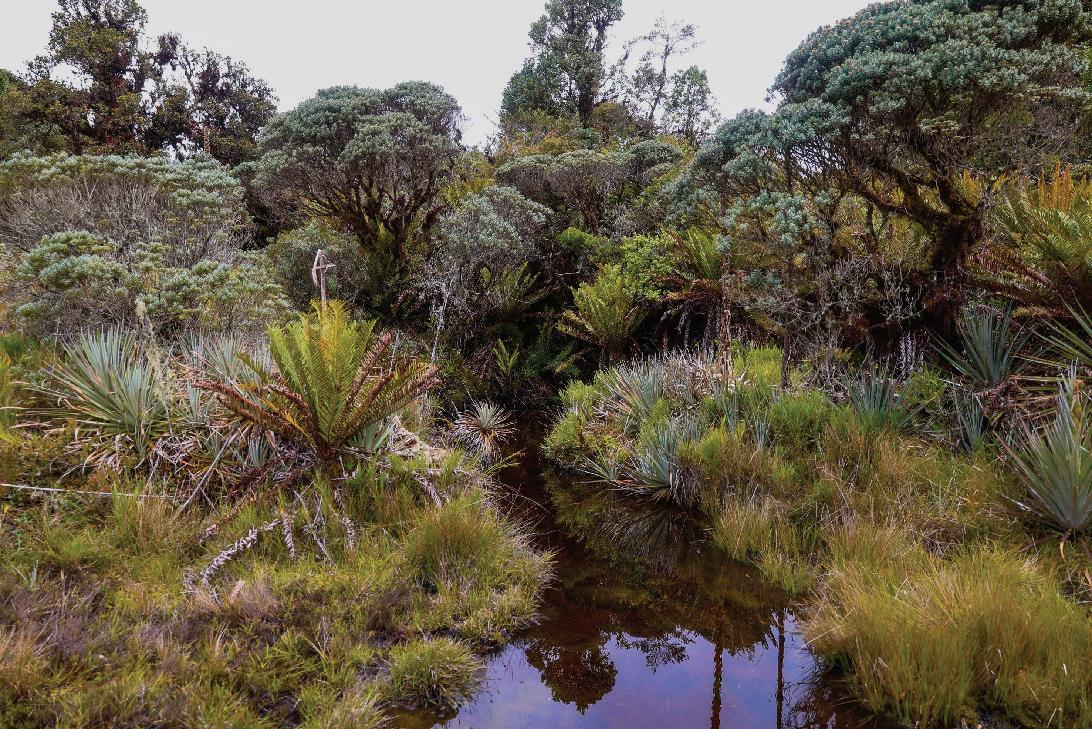
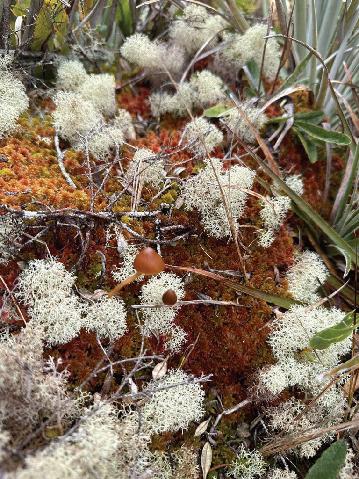
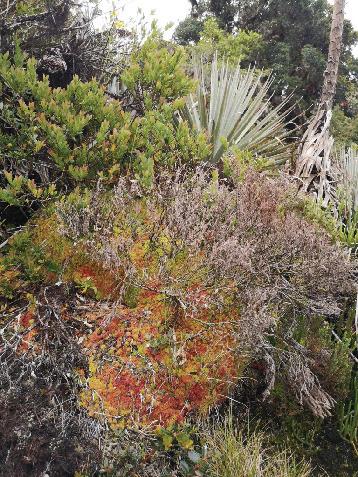
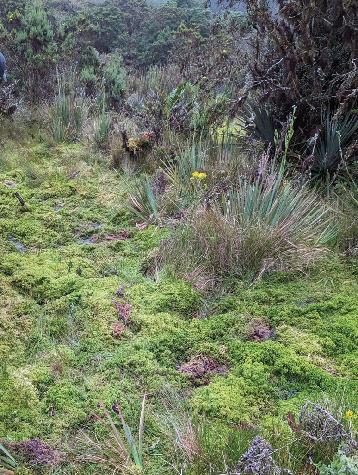
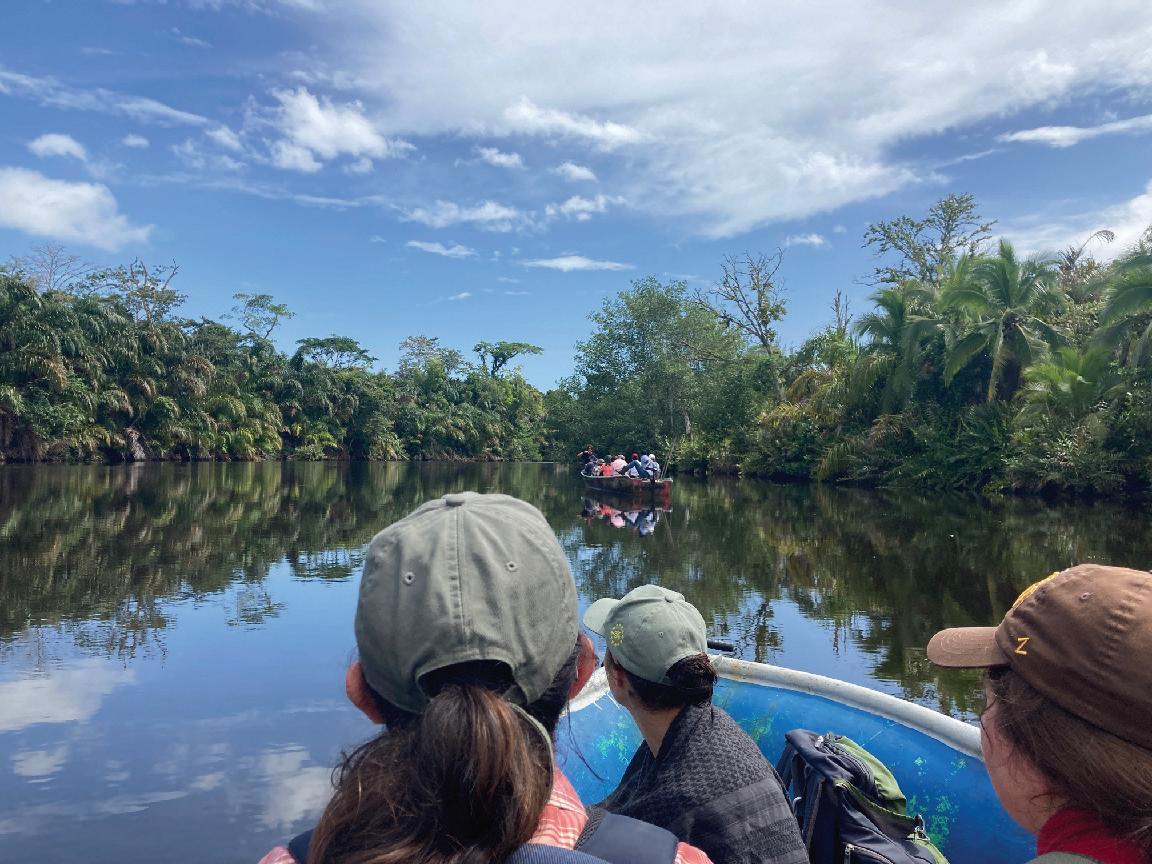
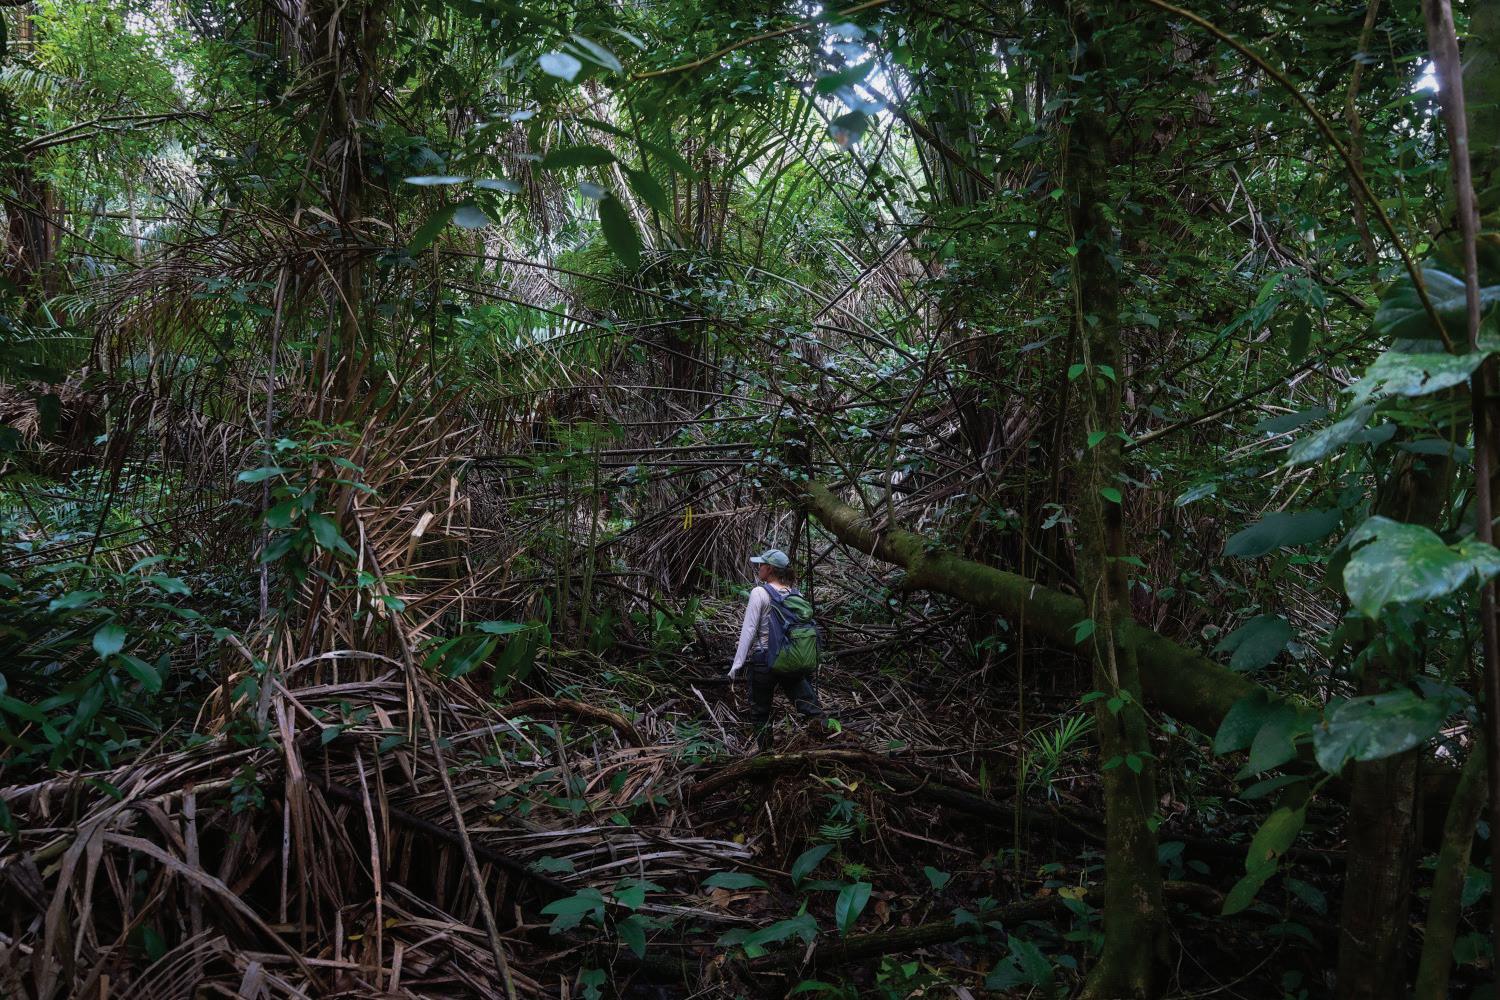
143 / Notes From the Field
148 / Select images from the Photo Contest
161 / Wetlands in the News
162 / Wetland Bookshelf
163 / SWS Submission Guidelines
164 / 2023 Advertising Prospectus
ARTICLES:
10 / Conserving Caribbean Mangroves with Blue Carbon Munguia and Bhat
20 / Article rescinded
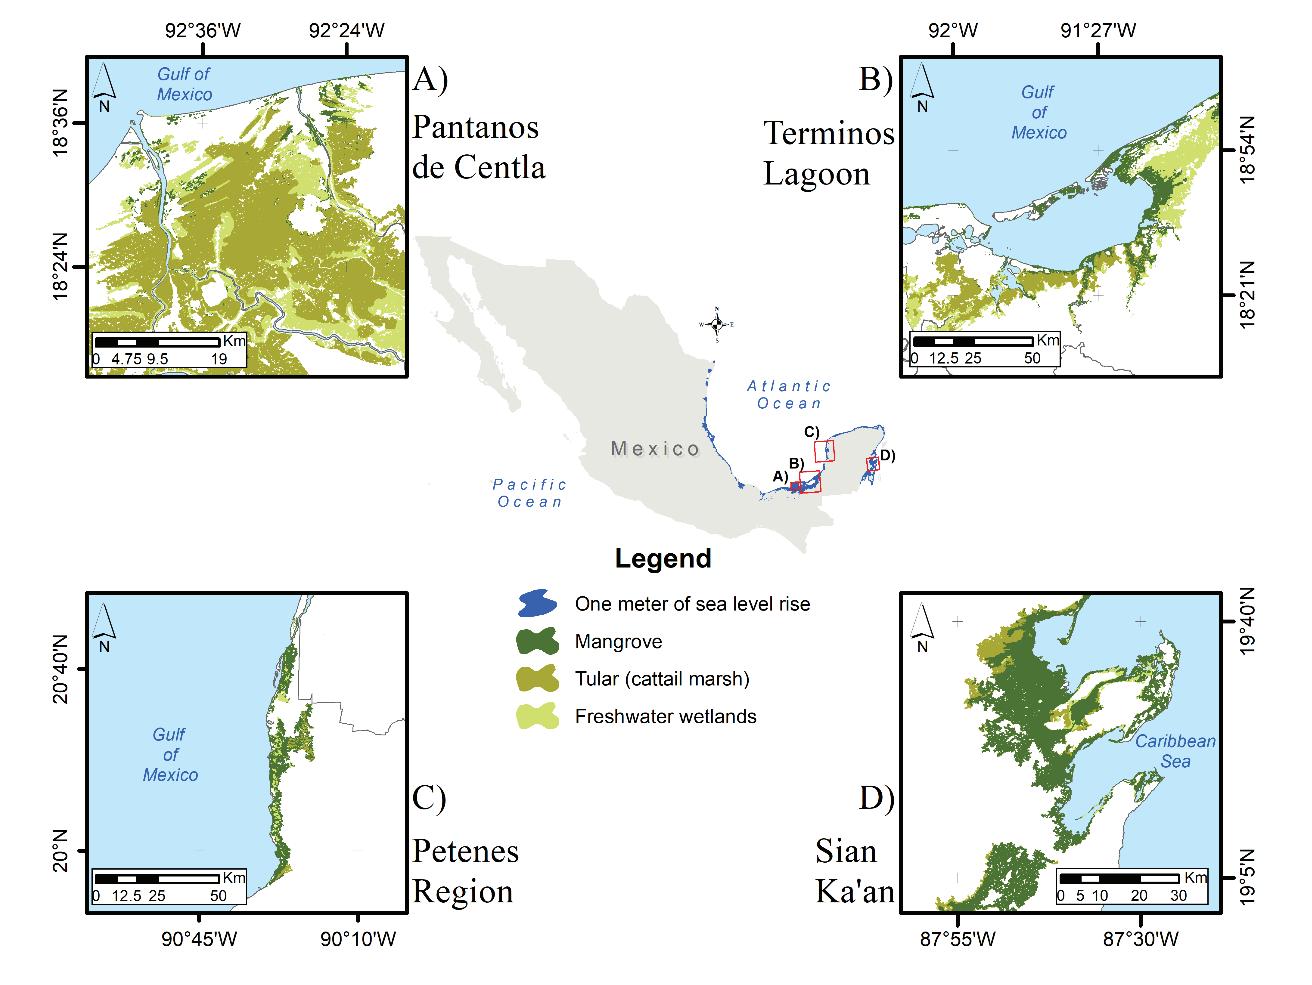
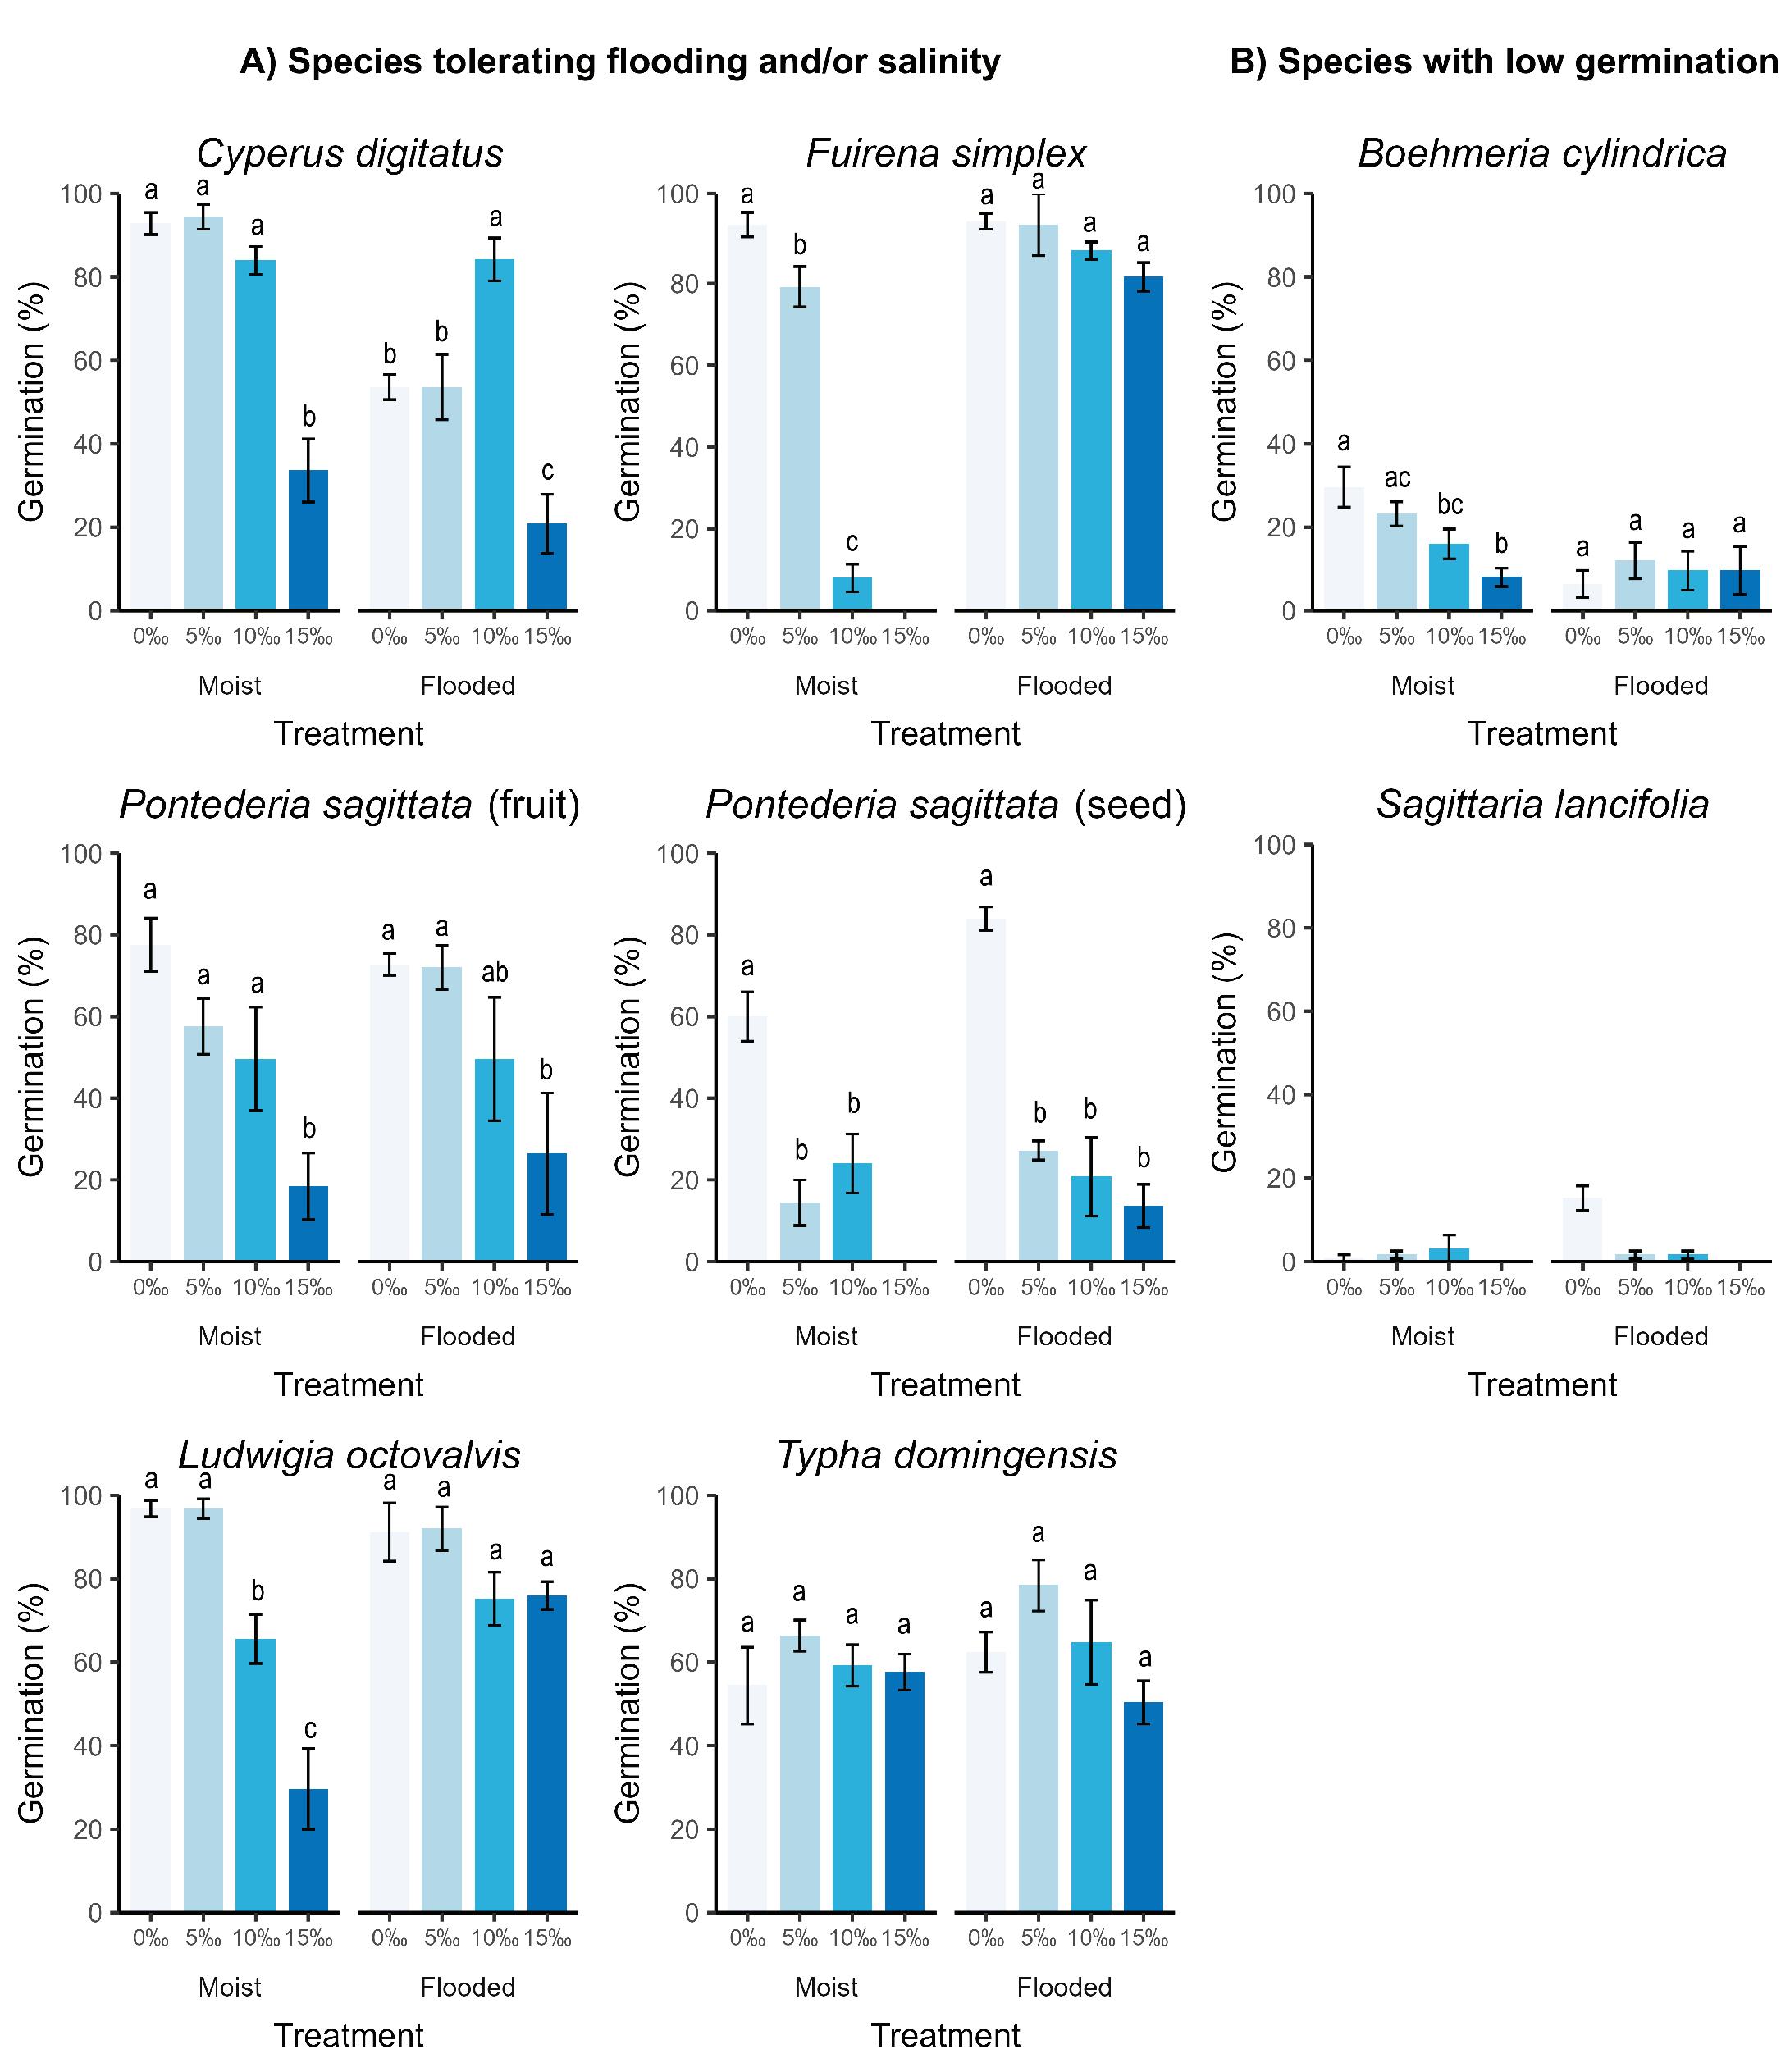
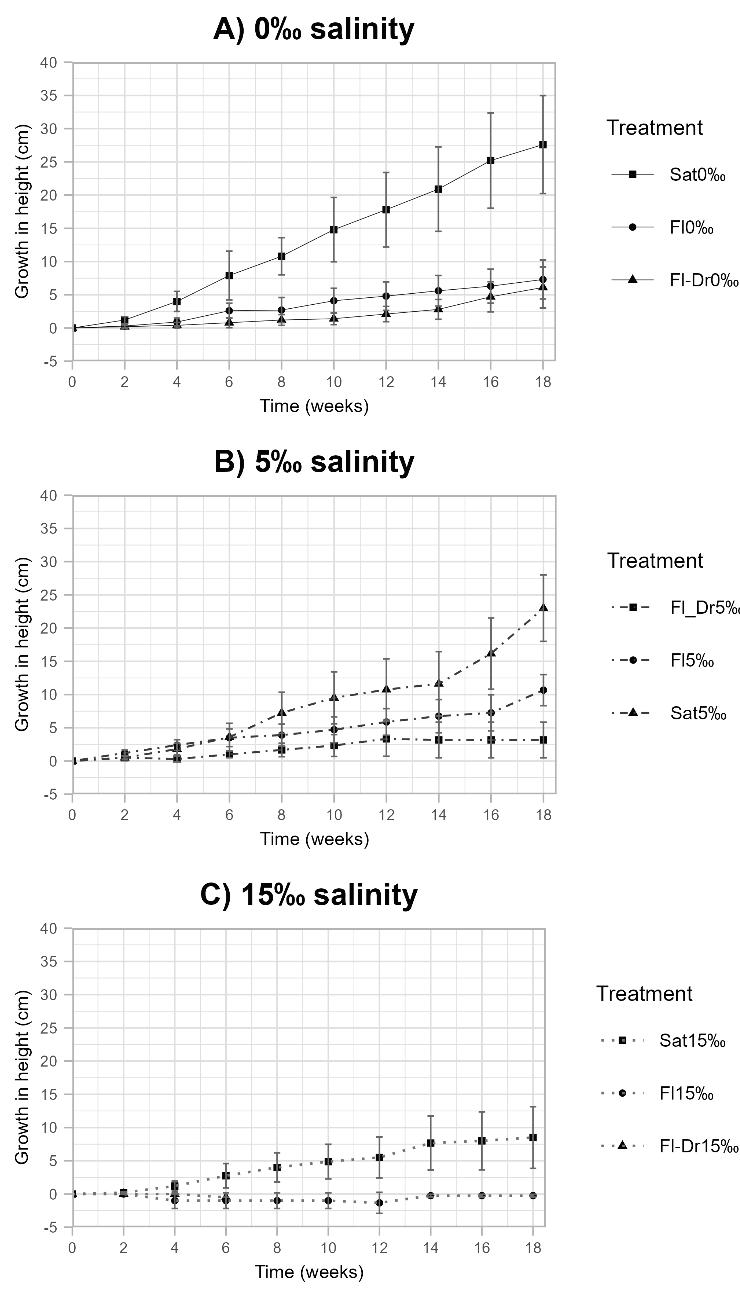
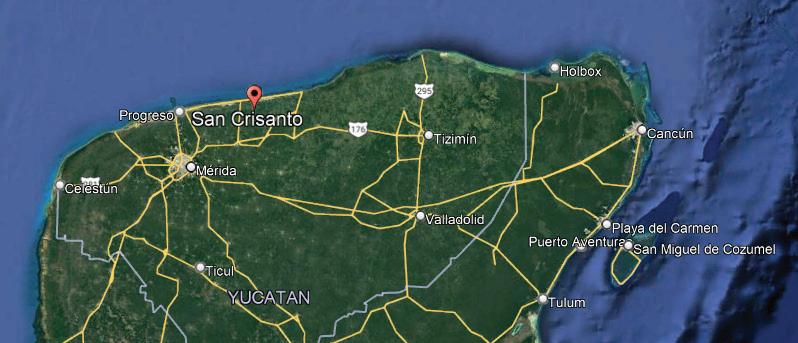
30 / Sea level Rise Impact on Mexico’s Atlantic Coast Sánchez-Garcia et al.
40 / Mangrove Threats on Yucatan Gonzalez et. al.
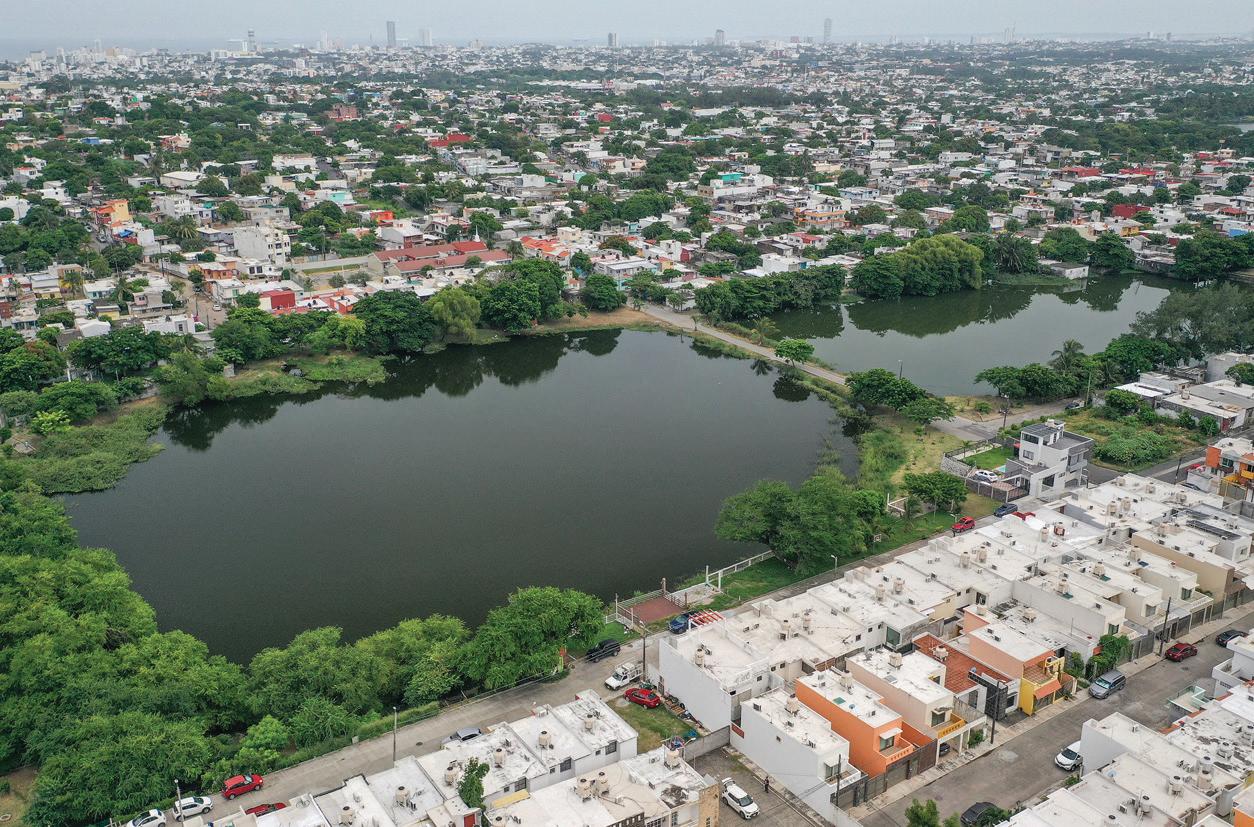
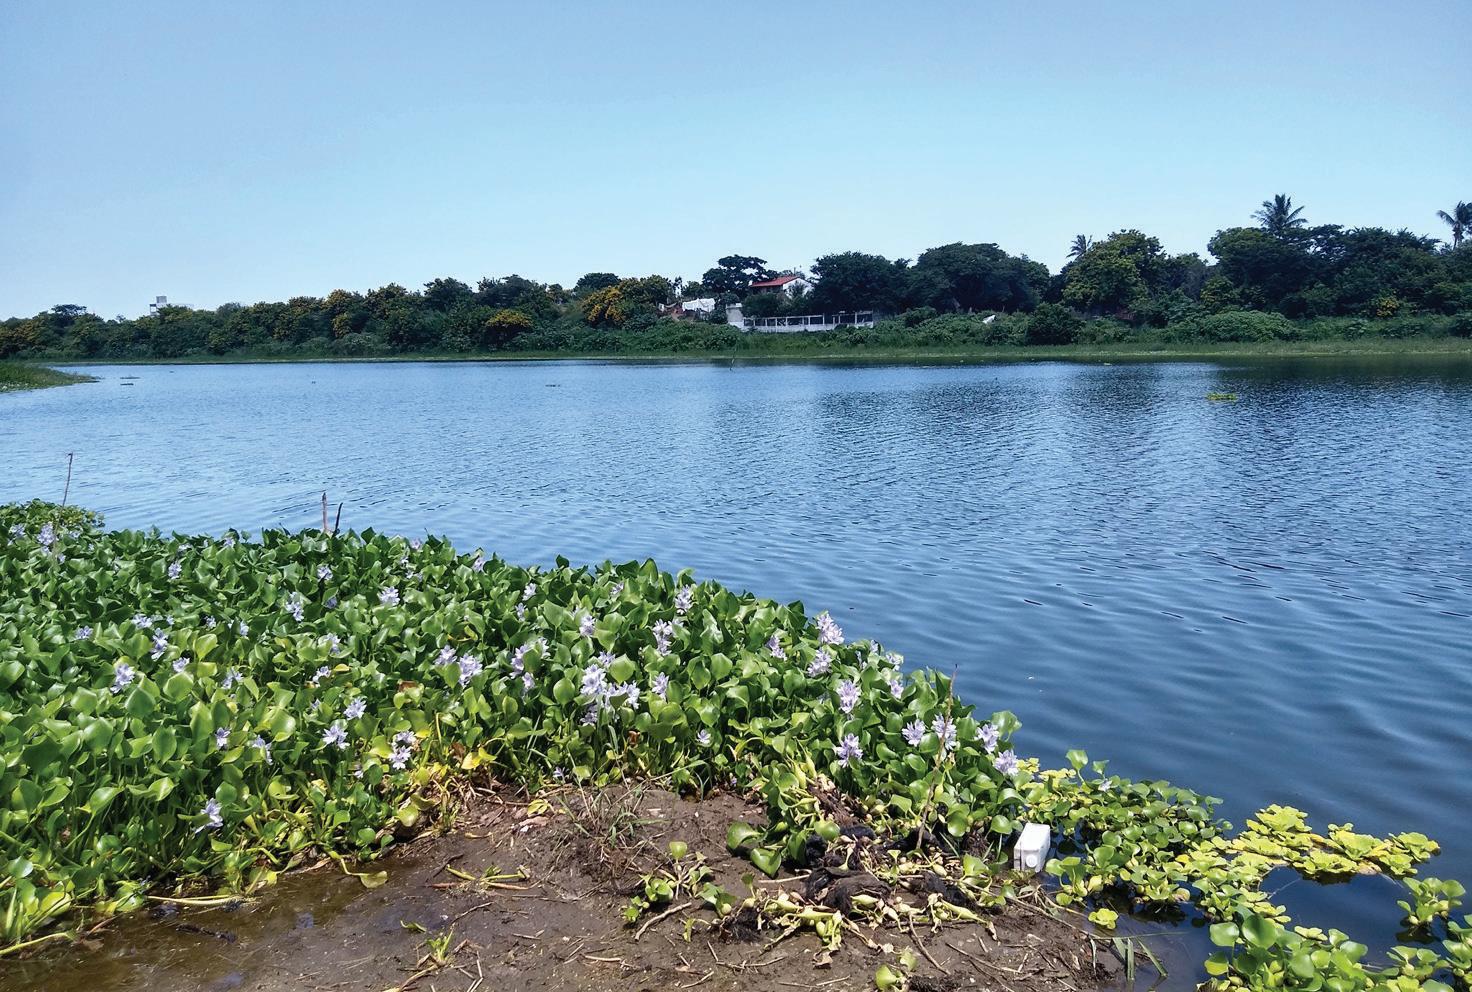
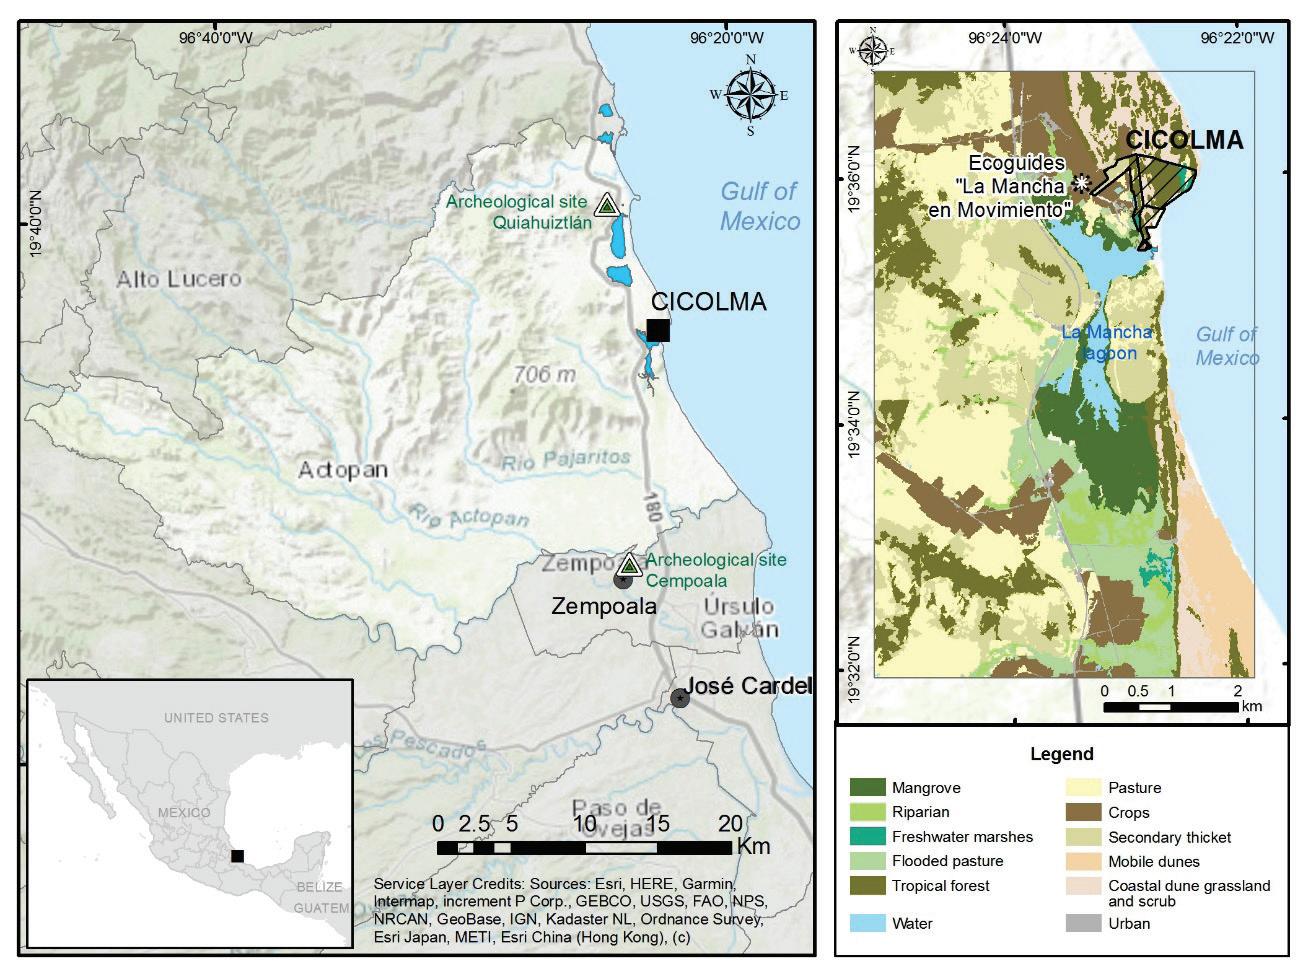
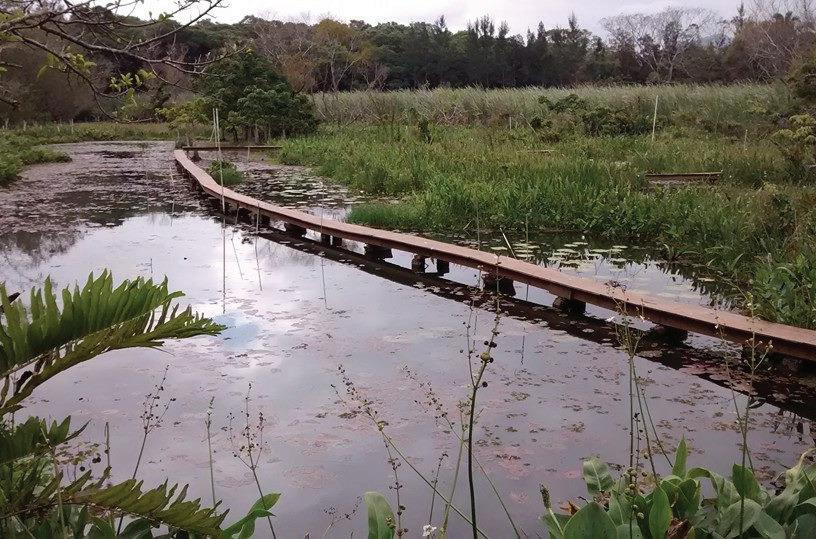
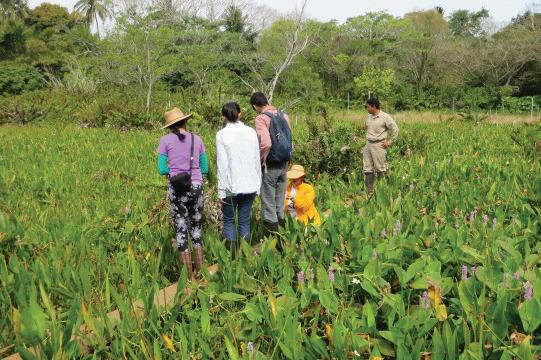
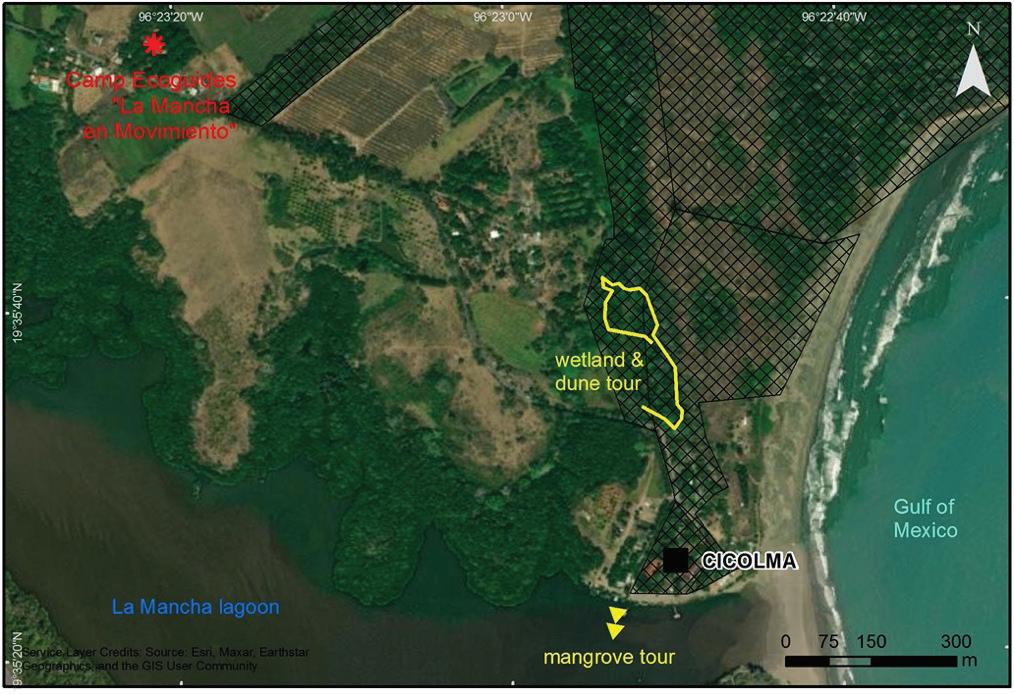
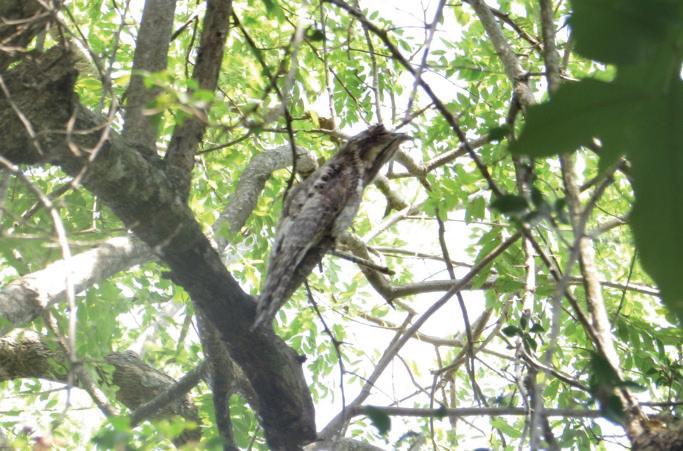
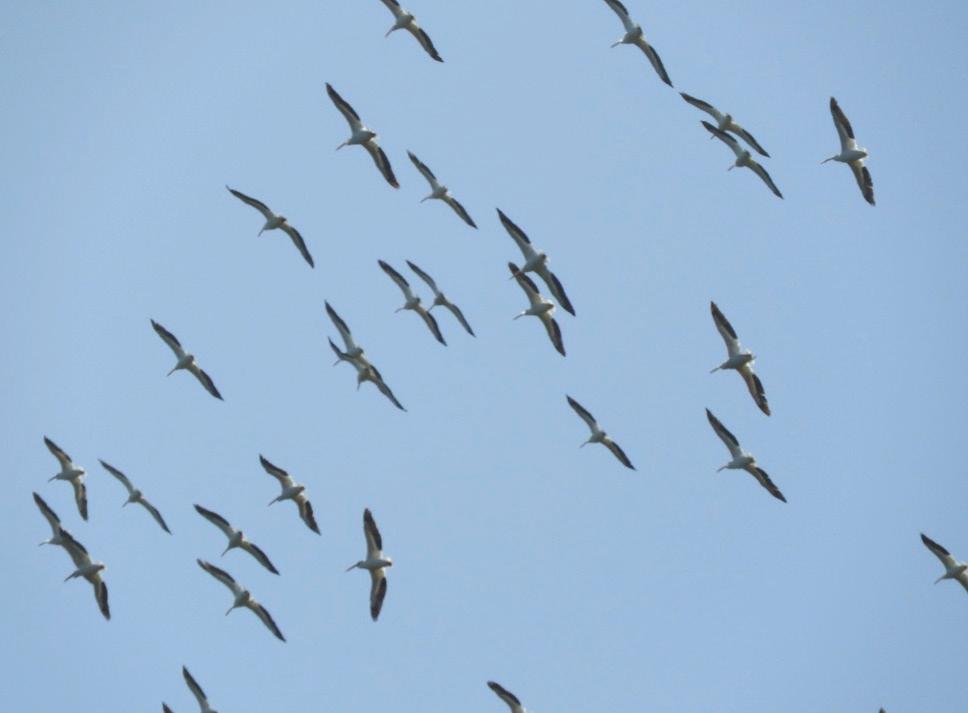
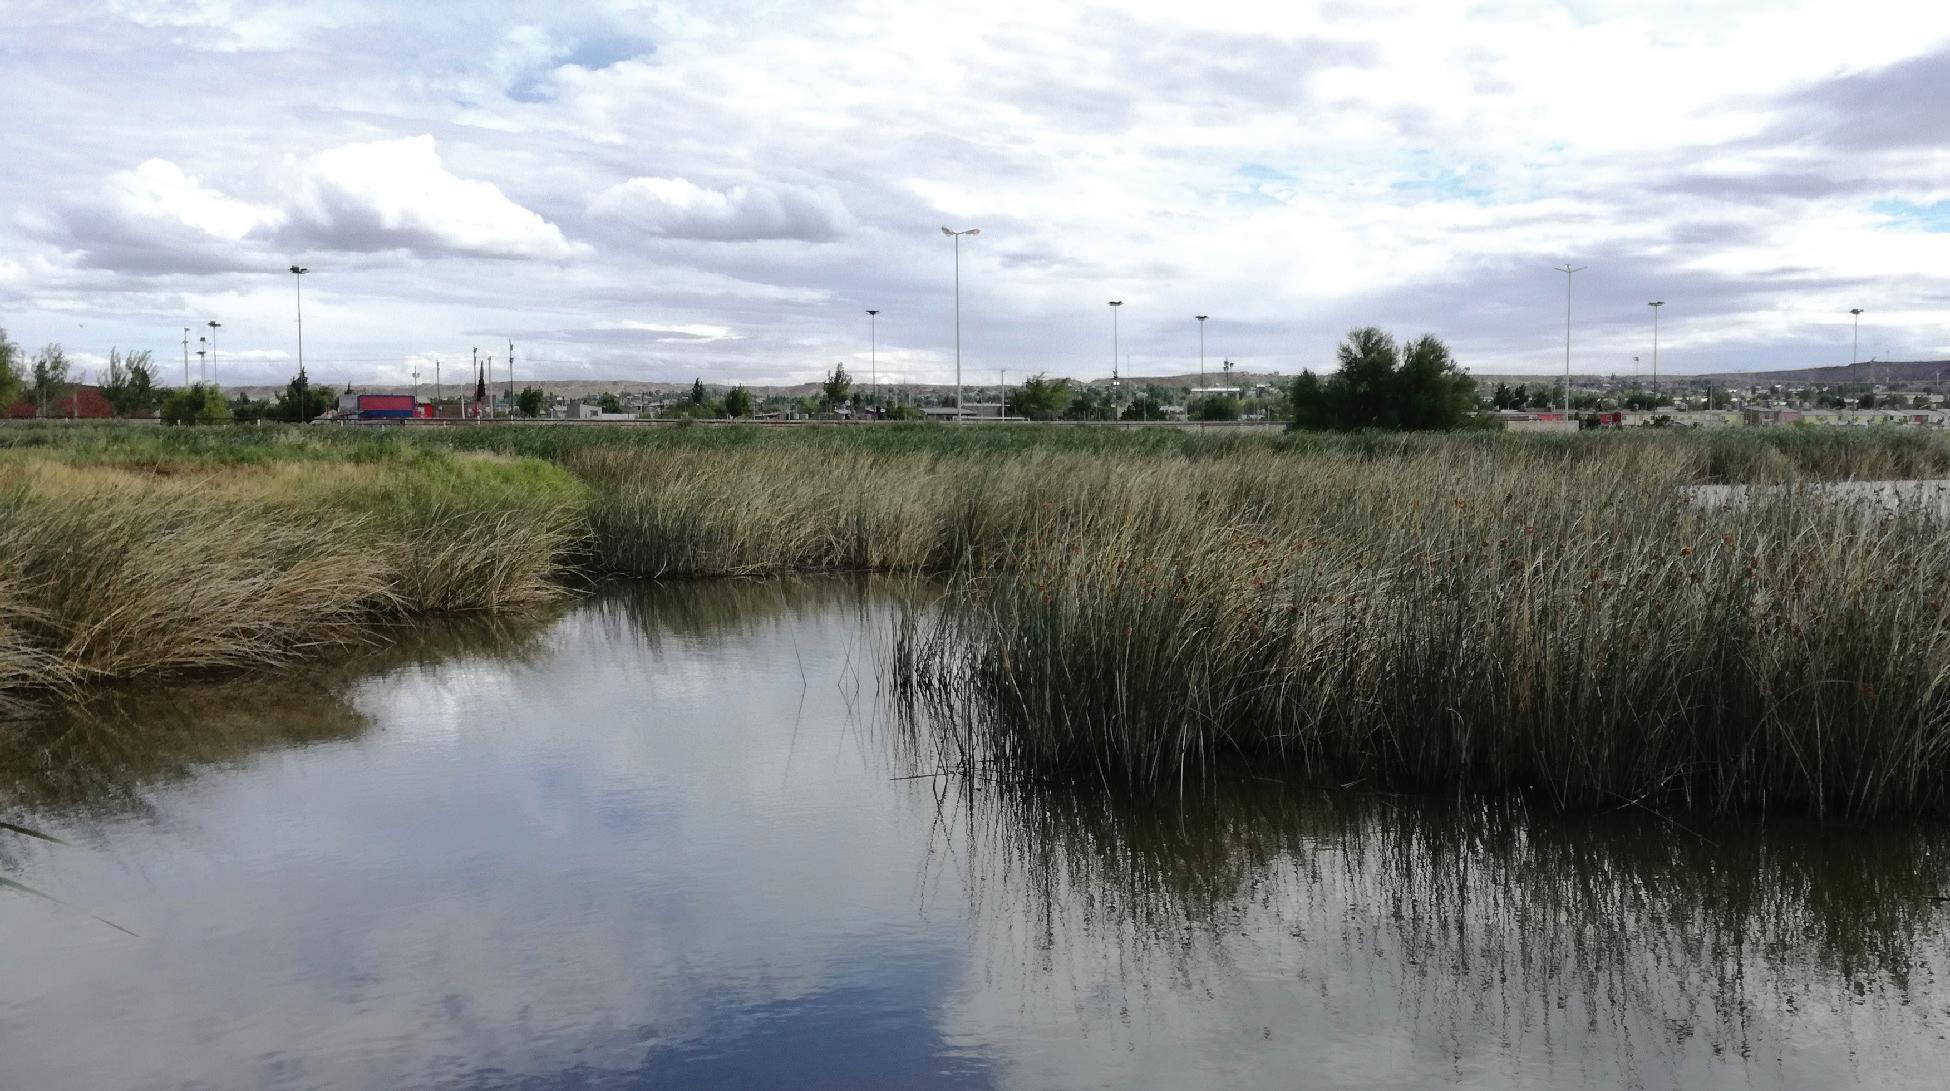
48 / Value of Coastal Urban Wetlands, Veracruz, Mexico Moreno-Casasola et al.
57 / Bird Monitoring Initiative, Veracruz, Mexico Carpinterio-Diaz et al
66 / San Franciso Marsh, Córdoba, Colombia Diaz-Mesa et al.
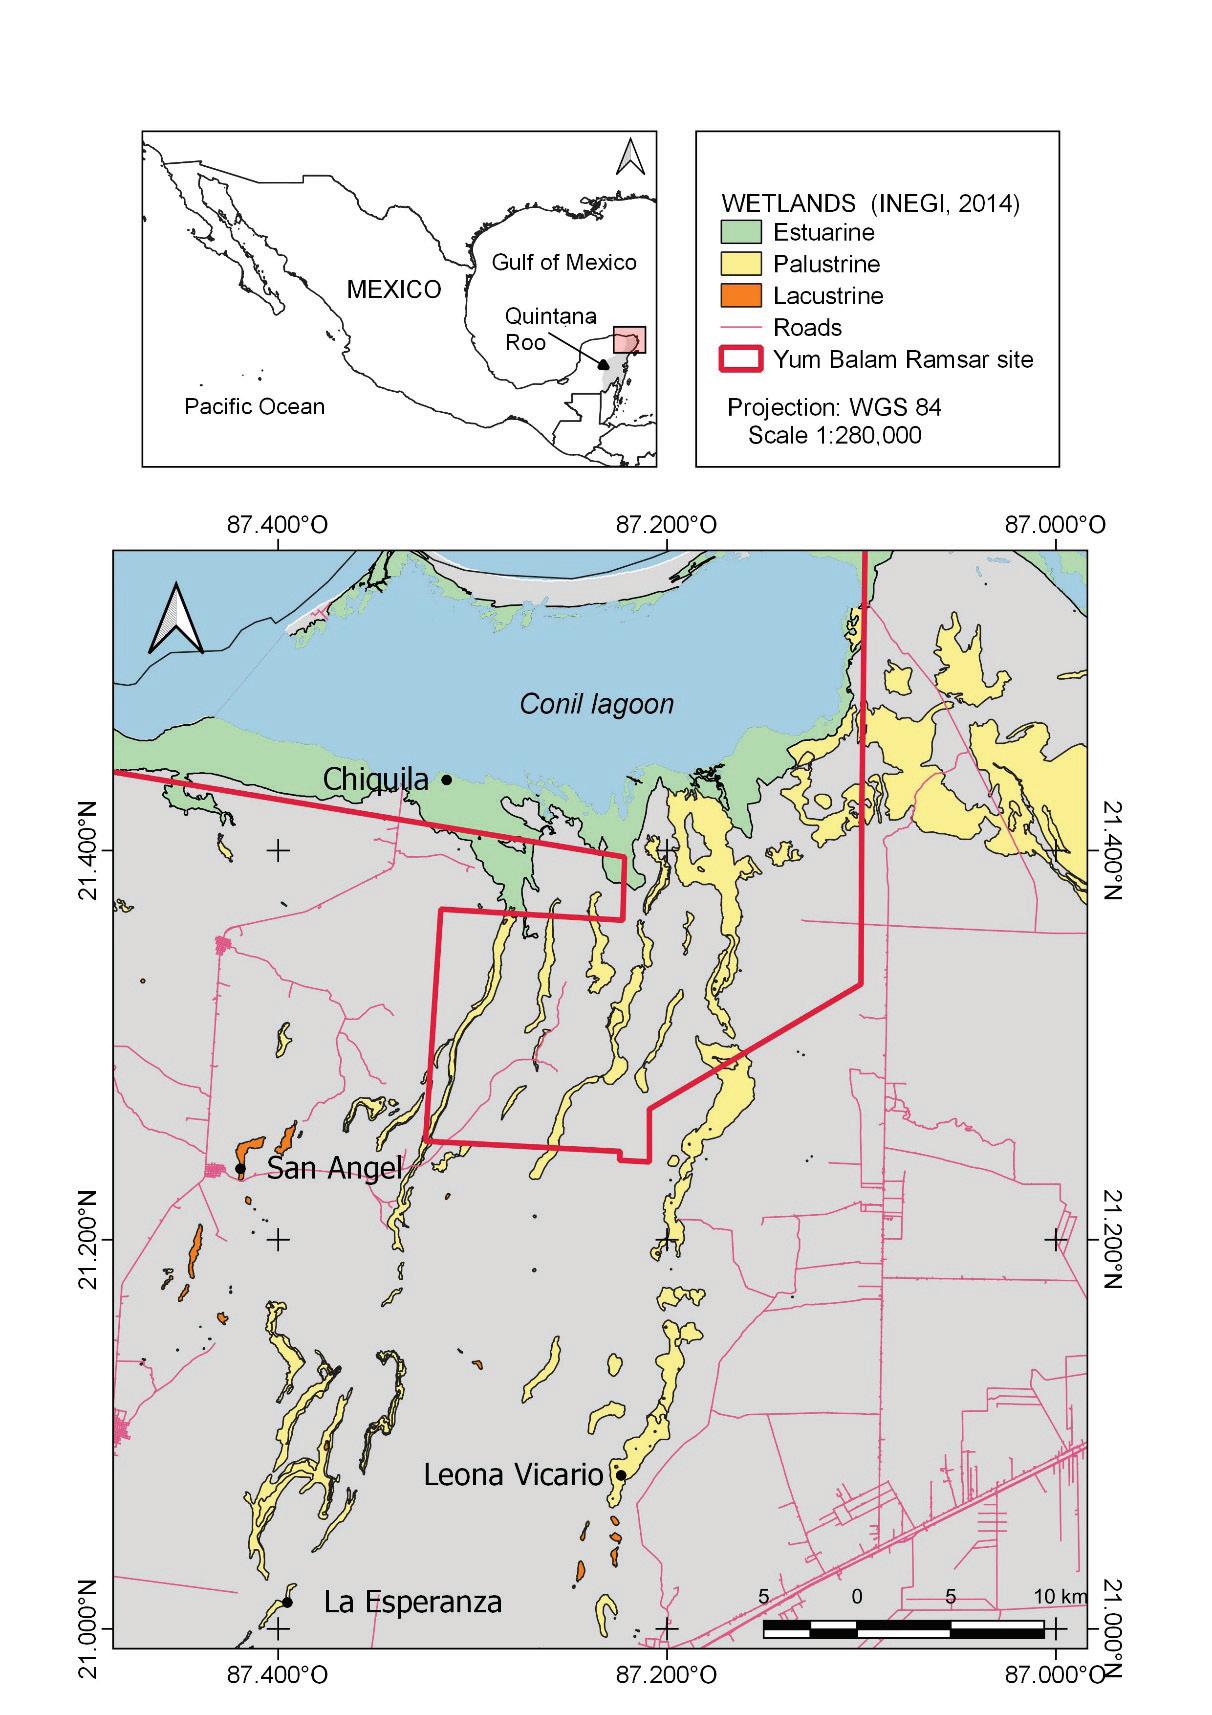
78 / Sabana Wetland, Quintana Roo, Mexico Cejudo et al.
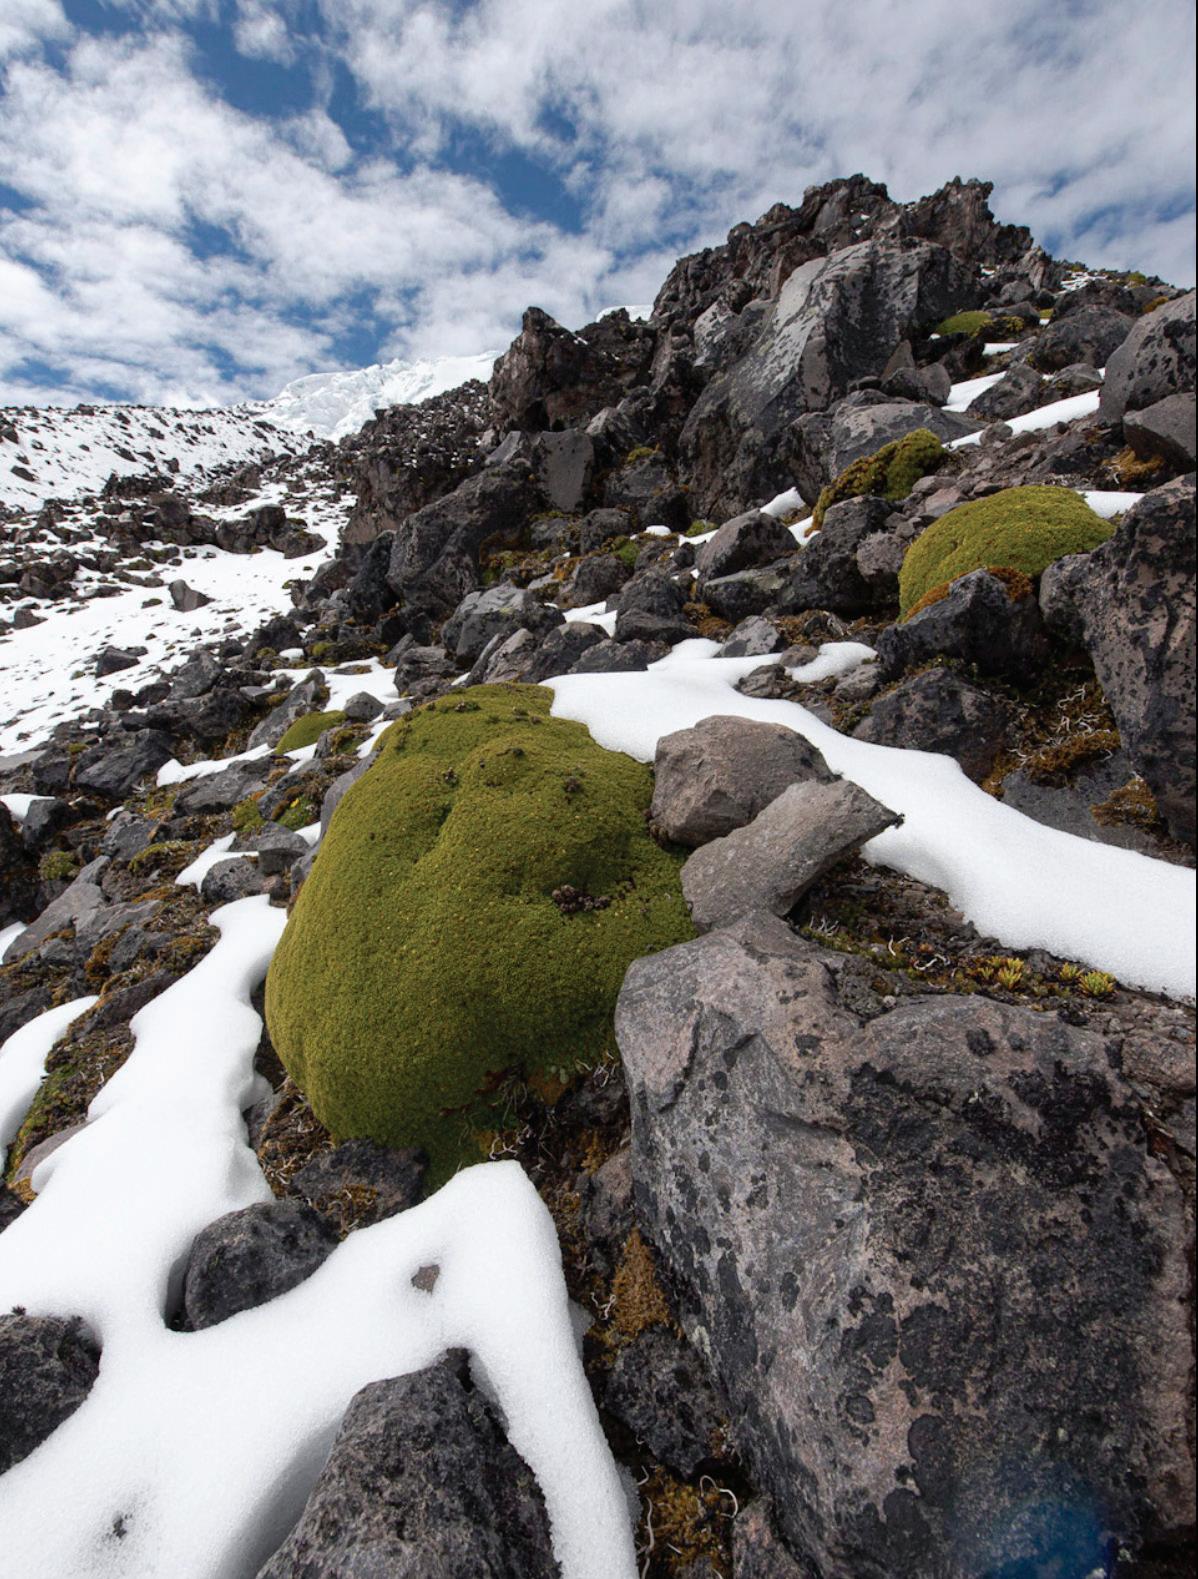
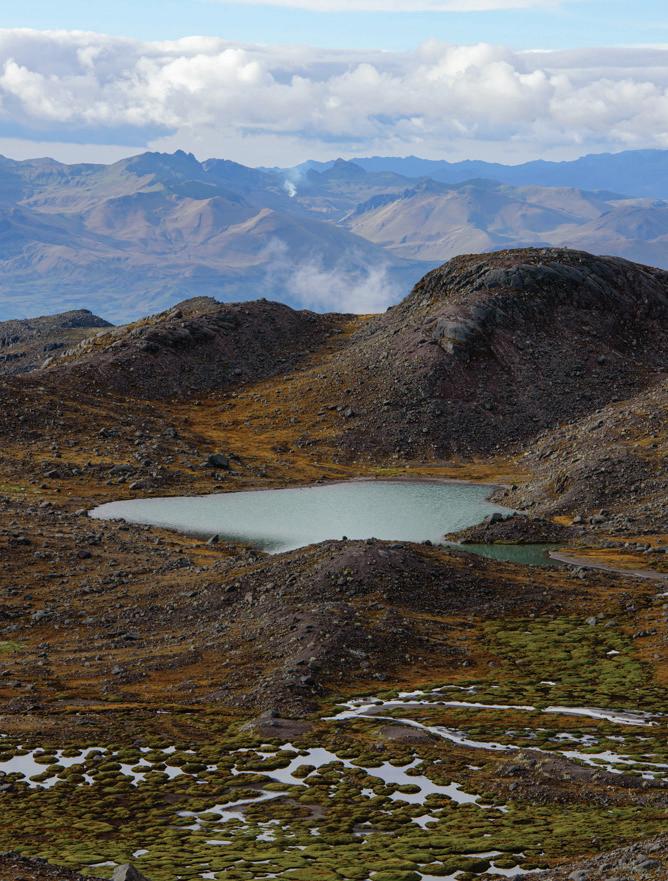
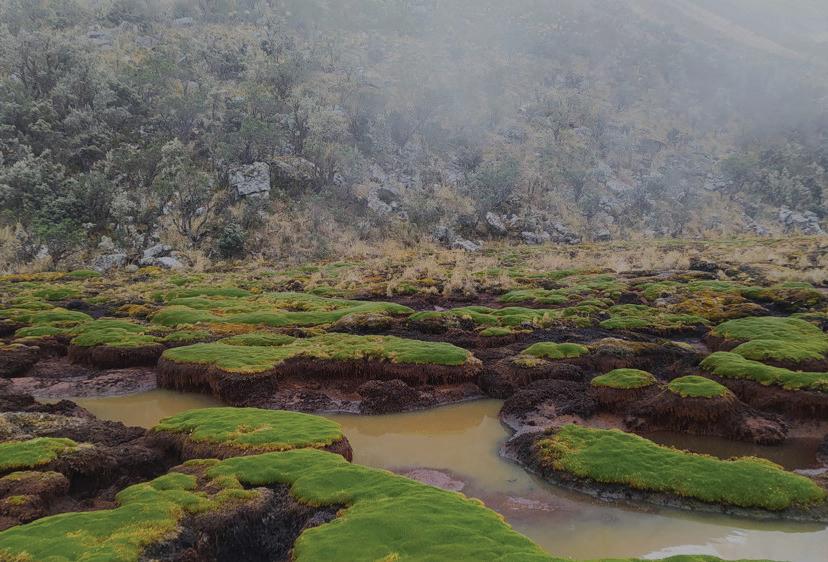
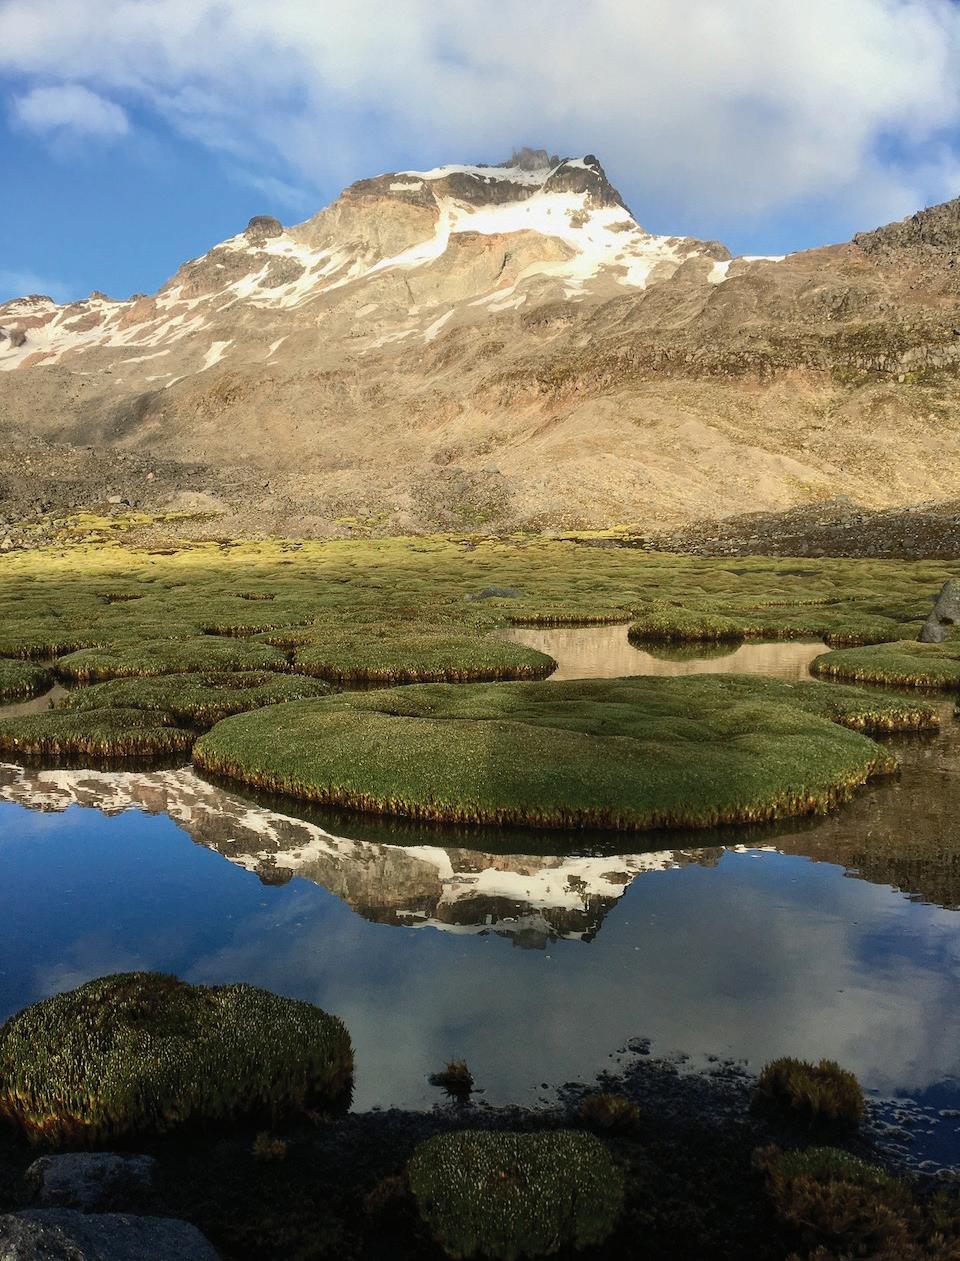
97 / Cushion Plants from the Andes: Current Knowledge and Research Martinez-Amigo and Jaramillo
104 / Tropical Mountain Peatlands, Southern Espinhaco Range, Brazil Silva and Tassinari
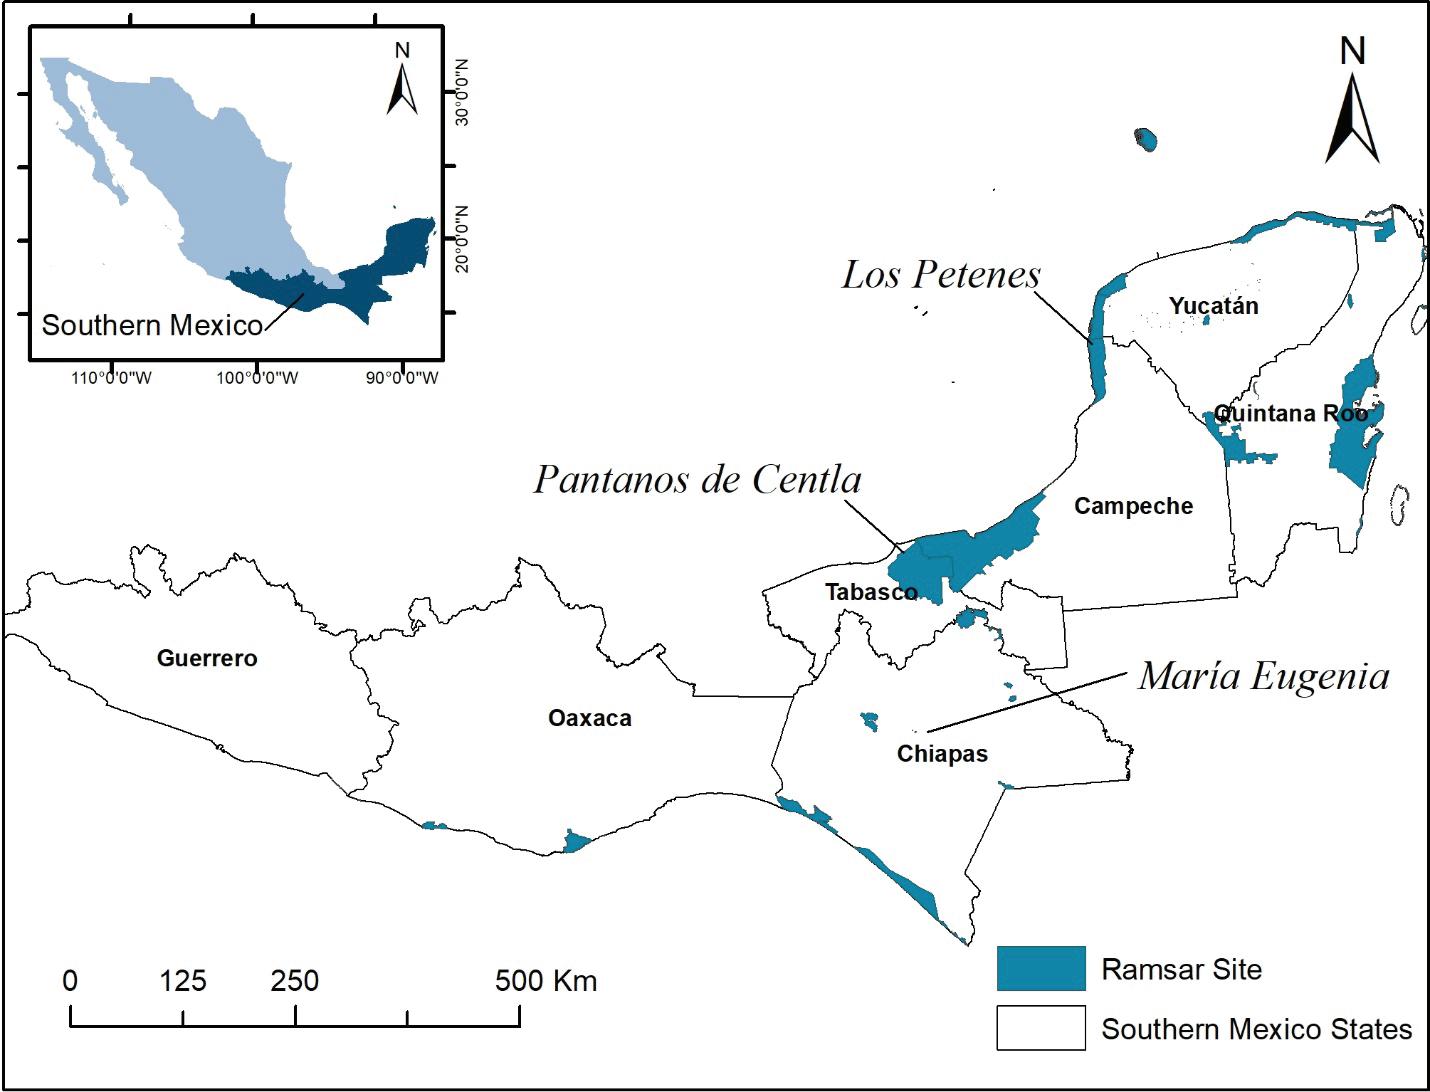
116 / Risk Assessment for Three Ramsar Sites, Southern Mexico Lobato-de Magalhães et al.
127 / Using Pistiastratiotes for Phytoremediation, Guyana Reuben et al.
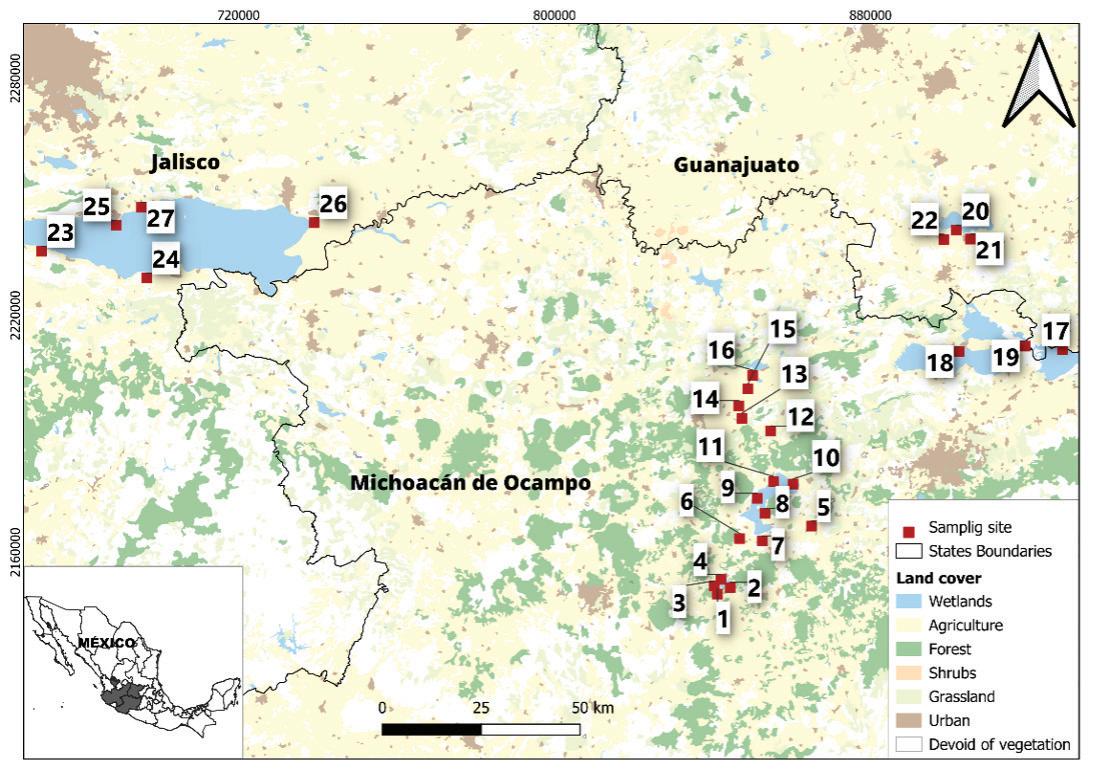
137 / Functional Connectivity of California Bulrush in Central-Western Mexico Noriega-Rico et al.
141 / Wetlands on the Paintbrush: Self Portrait José Herrera Gallegos
Wetland&Science Practice
PRESIDENT / Susan Galatowitsch, Ph.D.
PRESIDENT-ELECT / Eric Stein, Ph.D.
IMMEDIATE PAST PRESIDENT / William Kleindl, Ph.D.
SECRETARY GENERAL / Kai Rains, Ph.D.
TREASURER / Lori Sutter, Ph.D.
TREASURER-ELECT/ Yvonne Vallet, SPWS, SWSPCP
EXECUTIVE DIRECTOR / Erin Berggren, CAE
MARKETING MANAGER / Moriah Meeks
WETLAND SCIENCE & PRACTICE EDITOR / Ralph Tiner, PWS Emeritus
CHAPTERS
ASIA / Wei-Ta Fang, Ph.D.
CANADA / Susan Glasauer, Ph.D.
CENTRAL / Lindsey Postaski
CHINA / Ming Jiang
EUROPE / Matthew Simpson, PWS
INTERNATIONAL / Alanna Rebelo, Ph.D. and Tatiana Lobato de Magalhães, Ph.D., PWS
MID-ATLANTIC / Adam Gailey
NEW ENGLAND / April Doroski
NORTH CENTRAL / Casey Judge, WPIT
OCEANIA / Maria Vandergragt
PACIFIC NORTHWEST / Josh Wozniak, PWS
ROCKY MOUNTAIN / Rebecca Pierce
SOUTH ATLANTIC / Richard Chinn
SOUTH CENTRAL / Jessica Brumley
WESTERN / Richard Beck, PWS, CPESC, CEP
SECTIONS
BIOGEOCHEMISTRY / Katie Bowes
EDUCATION / Darold Batzer, Ph.D.
GLOBAL CHANGE ECOLOGY / Melinda Martinez, Ph.D.
PEATLANDS / Bin Xu, Ph.D.
PUBLIC POLICY AND REGULATION / John Lowenthal, PWS
RAMSAR / Nicholas Davidson, Ph.D.
STUDENT / Deja Newton
WETLAND RESTORATION / Luke Eggering
WILDLIFE / Rachel Fern
WOMEN IN WETLANDS / Mo Wise
COMMITTEES
AWARDS / Amanda Nahlik, Ph.D.
EDUCATION AND OUTREACH / Jeffrey Matthews, Ph.D.
GLOBAL REACH / Rebecca Woodward
HUMAN DIVERSITY / Kwanza Johnson
MEETINGS / Yvonne Vallette, PWS
MEMBERSHIP / Kai Rains, Ph.D.
PUBLICATIONS / Keith Edwards
WAYS & MEANS / Lori Sutter, Ph.D.
WETLANDS OF DISTINCTION / Roy Messaros, Ph.D., Steffanie Munguia and Jason Smith, PWS
REPRESENTATIVES
PCP / Christine VanZomeren
WETLANDS / Marinus Otte, Ph.D.
WETLAND SCIENCE & PRACTICE / Ralph Tiner, PWS Emeritus
NAWM / Samantha Vogeler
AIBS / Dennis Whigham, Ph.D.
Galatowitsch, Ph.D. University of Minnesota
SWS President
Dear Colleagues,
As I reflect back on 2023, it’s difficult to look past global events that have precipitated both humanitarian and environmental crises and wonder what the future holds in these war-torn regions. Across human history, armed conflicts have often taken an extreme toll of human lives and precipitated long-lasting environmental damage, followed by episodes where we extoll our resilience to recover. But all losses can’t be regained–especially in an era of climate change. Case in point: the Mespotamian Marshes of Southern Iraq. After one regime drained marshes for military advantage, the marshes were reflooded and restored after the conflict ended. Now, transboundary water conflicts are causing the irrevocable loss of this internationally significant wetland and the local communities who rely on it. Another I think about is the Azraq Oasis in Jordan–despite groundwater withdrawals for the past 60 years that have greatly diminished it, this Ramsar Wetland of International Importance somehow continued to support endangered fish and migratory birds, as well as a local ecotourism economy. Is the new military escalation in the Middle East the “last call” for a remarkable wetland that existed since at least 250,000 BC? Perhaps–but the odds that this wetland could survive and has survived at all to this point seems very likely to have been elevated by its international status as a Ramsar Wetland.
Worldwide, nearly 2500 wetlands are recognized for their international significance under the Ramsar Convention on Wetlands, the intergovernmental treaty, signed by 172 governments, that provides a framework for the conservation and wise use of all wetlands and their resources. We shouldn’t lose wetlands like the Azraq Oasis simply because too few know about them and those that do are too isolated (socially and politically) to devise locally sustainable solutions for their conservation. SWS members have been among the global leaders supporting the Convention on Wetlands’ work for over 30 years, and SWS has been a formal partner of the Ramsar Convention for 24 years
(since 1999). This past October, I had the privilege of signing the renewal of our Memorandum of Cooperation with the Secretariat of the Convention on Wetlands, which continues the Society’s role as science and technical advisors to the Convention. Dr Musonda Mumba, Secretary General, who signed on behalf of the Convention, expressed how important support from SWS was and how scientific knowledge underpins the Convention.
How we accomplish this support is spearheaded by the Ramsar Section of SWS. Members of this section attend Ramsar’s Scientific, Technical and Review Panel (STRP) meetings and facilitate the development of joint scientific and educational activities and programs. At each SWS Annual Meeting the section holds a symposium as well as a meeting and/or roundtable discussion of emerging issues of concern.
These SWS Annual meeting events are open to all SWS members but I’ve found it useful to be a member of the Ramsar Section to increase my awareness of international wetland conservation. While my research isn’t tied to Ramsar Wetlands of International Importance and the Convention itself, the awareness I’ve gained about Ramsar wetlands and the Convention through SWS has made it possible for me to do a couple of things. One is to develop some teaching cases based on Ramsar Site wetlands for my undergraduate wetlands class (e.g., Azraq OasisJordan). Another is to visit Ramsar Site wetlands when I travel with my family and to make a point of talking with local staff and guides about my appreciation for their wetland stewardship (most recently, Khao Sam Roi Yot Wetland-Thailand).
As you renew your SWS membership for the coming year, I encourage you to consider joining the Ramsar Section –and other sections. SWS has ten sections, each that offer us ways to broaden our understanding of specific wetland issues. You do not need to be an expert to join a section! Adding a section to a membership – at any time of the year – is easy. Just email info@sws.org and staff will help you make those changes to your account. And the price is good, too–for most, less per year than you pay for a couple of coffees.
Hoping for peace in the new year, Sue Galatowitsch
Susan
English:
February 15 | 1:00 PM ET
Ecology & Response of Sphagnum-dominated Peatlands in Western Washington to Landscape Stressors
Speaker: Joe Rocchio, M.Sc.
March 21 | 1:00 PM ET
An Integrated Framework for Evaluating Wetland and Stream Compensatory Mitigation
Speaker: Eric Stein, Ph.D.
April 18 | 1:00 PM ET
Vanishing Ice: Wetland Rehabilitation for Infrastructure Installations in Permafrost
Speaker: Lorene Lynn, CPSS, CERP
Spanish:
March 14 | 1:00 PM ET
Topic TBD
Speakers: TBD
NOTE: Webinar Topics and Speakers are subject to change. Visit the SWS Event Calendar for the most recent details and for future webinar dates.
THANK YOU TO OUR 2024 WEBINAR SERIES SPONSOR
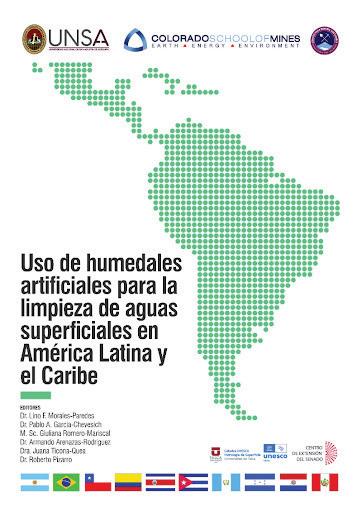
New Spanish-Language Book on the Use of Constructed Wetlands in Latin America
Now Available
A book on Latin American constructed wetlands — Uso de humedales artificiales para la limpieza de aguas superficiales en América Latina y el Caribe — is now available at http://www.cuhs.utalca.cl/wp-content/uploads/2023/11/ LIBRO_USO_DE_HUMEDAD_portada.pdf. Written in Spanish, the book focuses on Latin American experiences with the use of constructed wetlands to treat various pollutants in 10 countries. The effort was led by the National University of San Agustin de Arequipa and the Colorado School of Mines with support from UNESCO. Ten chapters address experiences in different countries in the application of this technology for wastewater and surface water treatment: Argentina, Brazil, Chile, Colombia, Costa Rica, Cuba, Guatemala, Honduras, Paraguay, and Peru.
In Memoriam
Paul Anthony Keddy (May 28, 1953–December 26, 2023)
Paul Keddy died at the age of 70 in December 2023. Over the last 40 years, he has been a significant contributor to the development of wetland science as a researcher, teacher, lecturer, author, editor, and conservationist. He received two of the Society of Wetland Scientists’ highest awards, its Merit Award in 2007 and its Lifetime Achievement Award in 2017. In 2007, Paul Keddy also received the Environmental Law Institute’s National Wetlands Award for Scientific Research. Paul Keddy was the author of Wetland Ecology: Principles and Conservation, now in its third edition, as well as more than 100 scientific papers, book chapters, and other books.
Paul Keddy was born in 1953 in London, Ontario, Canada. His family moved frequently because his father was in the Royal Canadian Air Force. His first years were spent in France. When his family returned to Canada, they settled in Edmonton, Alberta, then Portage La Prairie, Manitoba, and finally in Ottawa, Ontario. Unlike many Canadian children of his generation, his interest in the outdoors was not fostered by fishing or hunting with his family or friends. He developed an interest in the natural world (especially its frogs, salamanders, and turtles) and its conservation by exploring local fields, ponds, and even window wells at his school in Portage La Prairie. In high school, he won science fair prizes with projects on turtles.
Paul Keddy skipped his final year of high school and began university studies at York University (1969-1974) in Toronto. After graduating from York, he went to graduate school at Dalhousie University in Halifax, Nova Scotia. Although he did not get along with his major professor, Dr. Evelyn C. Pielou, whom he considered to be a rude bully, Paul completed his Ph.D. dissertation in 1978. It was on the population ecology of sand dune plants. While in Nova Scotia, he discovered the floristically diverse wetland vegetation and its striking zonation patterns. After graduating from Dalhousie, he took a position at the University of Guelph (1978-1982) and then at the University of Ottawa (1982-1999). During the early years of his scientific career, he worked on wetlands in the Great Lakes region, the Ottawa River Valley, and Nova Scotia, much of it focused on elucidating the mechanisms responsible for zonation patterns.
In the early 1990s, Paul Keddy became seriously ill. Its cause was never definitively established. A bacterium or amoeba may have been acquired through an insect bite or cut that infected his central nervous system. During this period of incapacitation, he continued to write personal and professional books. The former, written for his two young children, was If I Should Die Before You Wake: Instructions on the Art of Life. Among the latter was the first edition of his textbook, Wetland Ecology: Principles and Conservation (2000)
Paul Keddy moved to Southeastern Louisiana University in 1999 to become its first Schlieder Endowed Chair for Environmental Studies. This endowed chair allowed him to continue to do research and to teach despite his chronic illness. Much of his research in Louisiana dealt with the theory and practice of coastal wetland restoration. Because of his environmental activism, he was never a good fit at a conservative Louisiana university, and he decided in 2007 to resign his endowed professorship and go back to Canada. He returned to the Ottawa area to live on a large forested property he had acquired. Here, he lived out the rest of his life as an independent scholar who wrote books and papers and gave lectures. He published his last two books on wetlands in 2023: the third edition of Wetland Ecology and Causal Factors for Wetland Management and Restoration: A Concise Guide.
What set Paul Keddy apart was his lifelong search for “general principles” in ecology (see Keddy 1992, 2005a, 2005b, and 2023a). He was not content to describe ecological patterns, like zonation, but strove to find the underlying causes of such patterns. It is his unrelenting search for these principles that defined his career. However, he was more than a theorist. He also applied these principles to the management and conservation of natural vegetation.
Paul Keddy’s contributions to wetland science were succinctly summarized by the Environmental Law Institute when they awarded him its National Wetland Award: “Dr. Keddy has repeatedly carried his work beyond reporting of results to address conservation and management implications in wetlands and to further the theoretical understanding of how wetland plant communities function.”
For more information about Paul Keddy’s life and career, see Keddy (2020) and his website (www.drpaulkeddy.com).
REFERENCES
Keddy, P. A. 1992. Assembly and response rules: two goals for predictive community ecology. Journal of Vegetation Science 3: 157-164.
Keddy, P. A. 2005a. Milestones in ecological thought − A canon for plant ecology. Journal of Vegetation Science 16: 145-150.
Keddy, P. A. 2005b. Putting the plants back into plant ecology: six pragmatic models for understanding and conserving plant diversity. Annals of Botany 95: 1-13.
Keddy, P. A. 2020. Growing up to become a wetland ecologist: chance, choice or destiny? in D. A. Wilcox (ed.). History of Wetland Science: A Perspective from Wetland Leaders. Amazon, USA. pp. 129-133.
Keddy, P. A. 2023a. Causal Factors for Wetland Management and Restoration: A Concise Guide. Springer, Cham, Switzerland.
Keddy, P. A. 2023b. Wetland Ecology: Principles and Conservation. Third Edition. Cambridge University Press, Cambridge, UK.
Respectfully Submitted
Arnold van der Valk, Fort Collins, CO. January 2024
Society of Wetland Scientists 2023 Colombia: First-ever In-person SWS Meeting in Latin America
Tatiana
Lobato-de Magalhães1
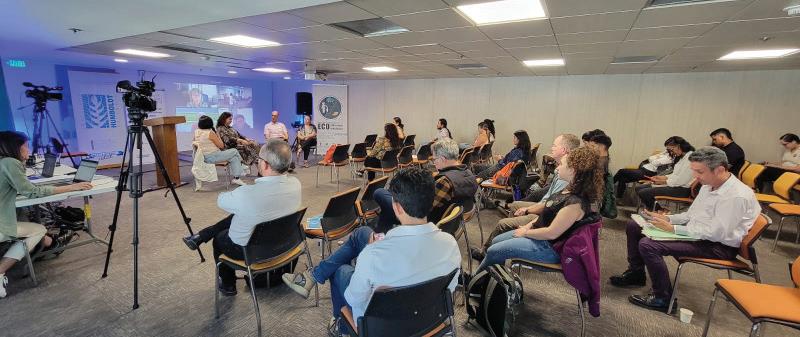
The “Society of Wetland Scientists 2023 Colombia” (4-day event) was the first-ever SWS meeting in Latin American countries. The event occurred on 7-10 November in Medellín, Antioquia, Colombia (Figures 1-4). It was hosted by the International Chapter of the Society of Wetland Scientists in collaboration with local partners: Investigación de Recursos Biológicos, Alexander von Humboldt, Universidad de Antioquia, Red de Investigadores en Ecohidrología y Ecohidráulica, Pontificia Universidad Javeriana, Instituto Javeriano del Agua, Universidad del Norte, Área Metropolitana del Valle de Aburrá, Universidad Católica de Oriente, and Cátedra UNESCO. This initiative had three primary objectives: (1) To establish a dialogue on wetlands, their importance, and the role of the wetland scientist; (2) To exchange knowledge about wetland ecosystems and their conservation and to promote opportunities for collaboration between individuals/countries/ institutions; and (3) To promote the SWS in Latin America, to encourage publication in Wetlands as well as Wetland Science and Practice, and to discuss the many SWS activities, such as Professional Wetland Scientist certification, Wetlands of Distinction, Wetland Interviews, Webinar Series, and mentorship program HumMentor. In total, 160 people registered to participate. The event invited over 48 speakers, panelists, moderators, and instructors from eight countries - Argentina, Brazil, Canada, Chile, Colombia, Mexico, United Kingdom, United States. It encompassed 18 talks on wetland subject matters, three panels of experts about wetland publication, wetland education, and wetland classification, six worktable sessions about ‘interaction with sectors’ and ‘living on wetlands’ subject matters, and one session about international collaboration. Also, participants had the opportunity to join a field day in the Guadalcai (La Amalita) wetland and attended five wetland courses certified by SWSPCP. It was a tremendous academic and professional development opportunity for individuals and institutions. Also, during the award session, the International Chapter offered SWS 1-year free memberships, hats, buttons, and T-shirts to remarkable participants. We recognized the 2022 SWS HumMentor students Judith Lacava and Azul Denaro with a $500 travel award each, sponsored by the 2021 Section Development Award (HumMentor program, joint application of Education Section and International Chapter). We thank the Society of Wetland Scientists Professional Certification Program (SWSPCP) and the 2022 Chapter Development Award (International Chapter, SWSLAC, Latin America and the Caribbean) for the financial support and certification of courses, as well as all organizer institutions and individuals (special thanks to Ana Carolina Santos Rocha, Esnedy Hernández Atilano, Angela Moncaleano) who make this event possible!
SPANISH TRANSLATION
El evento “Sociedad de Científicos de Humedales 2023 Colombia” fue la primera reunión de SWS en países de América Latina, del 7 al 10 de noviembre en Medellín, Antioquia, Colombia (Figuras 1-4), organizado por el Capítulo Internacional de la Society of Wetland Scientists en colaboración con: Investigación de Recursos Biológicos, Alexander von Humboldt, Universidad de Antioquia, Red de Investigadores en Ecohidrología y Ecohidráulica, Pontificia Universidad Javeriana, Instituto Javeriano del Agua, Universidad del Norte, Área Metropolitana del Valle de Aburrá, Universidad Católica de Oriente y Cátedra UNESCO. Esta iniciativa tuvo tres objetivos principales: (1) Establecer un diálogo sobre los humedales, su importancia y el papel de los científicos de los humedales; (2) Intercambiar conocimientos sobre los ecosistemas de humedales y su conservación para promover oportunidades de colaboración entre individuos/países/instituciones; y (3) Promover la Sociedad de Científicos de Humedales en América Latina, fomentar la publicación en las revistas Wetlands y Wetland Science and Practice, discutir las numerosas actividades de SWS, como la certificación Professional Wetland Scientist, Wetlands of Distinction, Wetland Interviews, Webinar Series, programa HumMentor. En total, se inscribieron 160 personas para participar. El evento invitó a más de 48 oradores, panelistas, moderadores e instructores de ocho países – Argentina, Brasil, Canadá, Chile, Colombia, Estados Unidos, México, Reino Unido. Incluyó 18 charlas sobre temas de humedales, tres paneles de expertos sobre publicación de humedales, educación en Ciencia de humedales y clasificación de humedales, seis mesas de trabajo en temas relacionados con ‘interacción con sectores’ y ‘vida en humedales’, y una
1 SWS International Chapter Co-Chair (2019-2025); Faculty of Natural Sciences, Universidad Autónoma de Querétaro, Querétaro, QRO, Mexico. Biological Sciences Department, North Dakota State University, Fargo, US. Corresponding author email’s: tatilobato@gmail.com; tatiana.lobato@uaq.mx
sesión sobre colaboración internacional. Además, los participantes tuvieron la oportunidad de sumarse a una visita técnica de campo en el humedal Guadalcai (La Amalita) y asistieron a cinco cursos de humedales certificados por SWSPCP. Fue una excelente oportunidad de desarrollo académico y profesional para individuos e instituciones. Además, durante la sesión de premiación, el Capítulo Internacional ofreció membresías, gorras, botones y camisetas de la SWS a participantes destacados. Se reconoció a las estudiantes de SWS HumMentor 2022, Judith Lacava y Azul Denaro, con un premio de viaje de $500 cada, patrocinado por el Premio al Desarrollo de Sección 2021 (programa HumMentor, solicitud conjunta de la Sección de Educación y el Capítulo Internacional). Agradecemos al Programa de Certificación Profesional de la Sociedad de Científicos de Humedales (SWSPCP) y al Premio al Desarrollo del Capítulo 2022 (Capítulo Internacional, SWSLAC, Latinoamérica y el Caribe) por el apoyo financiero y la certificación de los cursos, así como a todas las instituciones organizadoras e individuos (en especial Ana Carolina Santos Rocha, Esnedy Hernández Atilano, Angela Moncaleano) que hicieron este evento posible
LIST OF SPEAKERS, PANELISTS, MODERATORS, INSTRUCTORS2
Adriana Camelo, Ana Carolina Santos Rocha, Ana Maria Roldán, Ana Zabala, Andres Eduardo Torres Abello, Angela Moncaleano, Camilo Torres, Carlos Lasso, Carlos Pérez, Carolina Rojas, Carolina Soto, Cesar Tamaris, Daniel Campbell, Daniela Cardona, Daniela Salazar Suaza, David Zamora, Diana Isabel Quevedo Tejada, Elisabet V. Wehncke, Ellen Hartig, Esnedy Hernández Atilano, Gary Ervin, Germán Rivillas, Gisele Didier, Hernán Hadad, Jaime Antonio Almeida, Jhoana Reyes Herrera, Juanita Aldana, Judith Lacava, Lina Maria Berrouet Cadavid, Luz Fernanda Jiménez, Luz Patricia Vásquez Baena, María Alejandra Pimiento, María Azul Denaro, María Paula Rey Baquero, Marinus Otte, Mario Alberto Quijano Abril, Mateo Parra Cuadros, Monica Hernández, Oscar Manrique, Rob McInnes, Ronald Ayazo, Rubén David, Sandra Vilardy, Sebastian Palomino, Silvia Villabona González, Sylvina Casco, Tatiana Lobato de Magalhães, Veronica Duque, and Victor Vélez.
More pictures and videos: https://www.facebook.com/media/set/?set=a.880166750302189&type=3
Figure 1. Panel of Experts on the Advances of Wetland Education in Latin America.
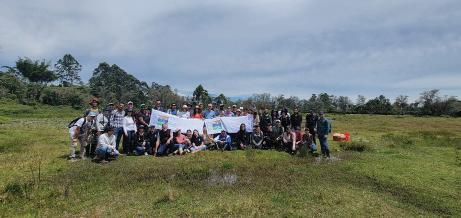
Figure 3. Group picture on the Field trip to Guadalcai (La Amalita) wetland, Antioquia, Colombia.
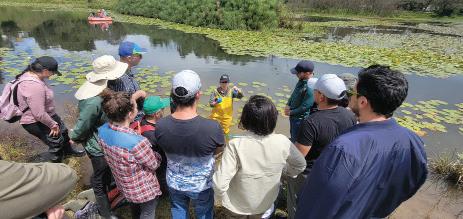
Figure 4. Esnedy Hernández Atilano teaching participants during the Field trip to Guadalcai (La Amalita) wetland, Antioquia, Colombia.
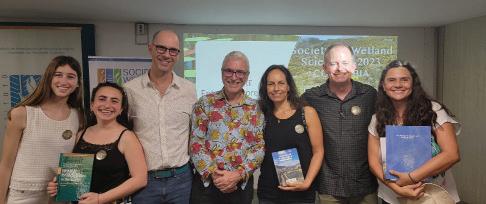
Figure 2. Meeting speakers and instructors at the final of day 2, from the left to right: Azul Denaro, Judith Lacava (both 2022 HumMentor students), Daniel Campbell, Marinus Otte, Diana Isabel Quevedo Tejada, Gary Ervin, and Juanita Aldana.
Conserving Mangrove Wetlands with Coastal Blue Carbon in the Caribbean
Steffanie Munguía and Mahadev. Bhat1
ABSTRACT
The growing conservation finance gap presents a critical challenge to wetlands protection. However, the growing interest in nature-based solutions may help close this gap. In this paper, we review the various factors that might impact the viability of blue carbon as a market mechanism for supporting implementation of wetland protection programs, such as the Ramsar Convention, financially in the Caribbean. We conduct a literature review to ascertain the compatibility of the existing program mechanisms with different valuation methods, including an overview of requirements for accessing markets, a summary of market values that might be considered, and a broad overview of the potential value of mangrove carbon stocks in the Caribbean. We find that the existing coastal wetland carbon stocks of the Caribbean hold enormous monetizable potential, as the region boasts large expanses of some of the most productive carbon sequestering ecosystems, especially mangroves. However, there are still substantial gaps in our understanding of these stocks, including the exact extent of different ecosystem types and estimates of their carbon stocks under different geological, hydrological, and environmental conditions. Blue carbon financing could be a viable funding source to promote the wise use of coastal wetlands by supporting ongoing as well as future restoration efforts.
RESUMEN
La creciente brecha financiera para la conservación presenta un desafío crítico para la protección de los humedales. Sin embargo, el creciente interés en las soluciones basadas en la naturaleza puede ayudar a cerrar esta brecha. En este artículo, revisamos los diversos factores que podrían afectar la viabilidad del carbono azul como mecanismo de mercado para apoyar la implementación de programas de protección de humedales, como la Convención Ramsar, en el Caribe. Llevamos a cabo una revisión de la literatura para determinar la compatibilidad de los mecanismos del programa existente con diferentes métodos de valoración, incluyendo una descripción general de los requisitos para acceder a los mercados, un resumen de los valores de mercado que podrían considerarse y una descripción amplia del valor potencial de las reservas de carbono de los manglares en el
Caribe. Encontramos que las reservas de carbono existentes en los humedales costeros del Caribe tienen un enorme potencial financiero, ya que la región cuenta con grandes extensiones de algunos de los ecosistemas secuestradores de carbono más productivos, especialmente los manglares. Sin embargo, todavía existen déficits en nuestra comprensión de estas reservas, incluida la extensión exacta de los diferentes tipos de ecosistemas y las estimaciones de sus reservas de carbono en diferentes condiciones geológicas, hidrológicas y ambientales. El carbono azul podría ser una fuente de financiación viable para promover el uso racional de los humedales costeros apoyando los esfuerzos de restauración actuales y futuros.
INTRODUCTION
There have been many local, national and international initiatives to protect wetlands against human as well as natural pressures. Adequacy of funding as well as adequate infrastructure and law enforcement consistently correlate with overall management effectiveness (though not necessarily with improved resource outcomes; Cook and Heinen 2005; Heinen et al. 2017; Leverington et al. 2010), and sustainability of funding is assumed to ensure protected area longevity (Ervin 2003). Unfortunately, sustainable financing mechanisms have persistently posed a challenge to biodiversity conservation, especially in least economically developed nations (Emerton et al. 2006). The lack of funding has affected a wide range of conservation activities (Bruner et al. 2004), including protected area expansion (though to a lesser extent) (Hockings et al. 2006), operations and enforcement (Diaz-Campos and Vilés-Lopez 2020; Munguía and Heinen 2021; Munguía et al. 2023), and conservation education programs (Shah 2021).
In addition to the need for funding, ecosystem valuation can help nations and site managers better place into context the value of their natural resources and evaluate the opportunity costs of protection (Sinclair et al. 2021). Wetlands represent a disproportionate amount of the monetary value of global ecosystem services provided by natural biomes (Costanza et al. 2014; Davidson et al. 2019). Some of these values are more easily monetized, such as the flood protection, carbon sequestration, subsistence, and recreational values of coastal wetland systems. The Ramsar Convention has promoted the analysis and determination by contracting parties of various economic values of wetlands since at least its 1997 report, Economic Valuation of Wetlands (Barbier et al. 1997). It has subsequently employed its Scientific and Technical Review Panel (STRP) and other
1 Department of Earth and Environment, Florida International University, 11200 SW 8th Street, Miami, FL 33199, USA; corresponding author contact: smung008@fiu.edu
partners to produce further guidance on wetland valuation (de Groot et al. 2006). Recently, the Ramsar secretariat has expressed interest in broadening the convention’s otherwise biodiversity-centric objectives to include provisioning of other ecosystem services (Convention on Wetlands 2018), namely, coastal blue carbon (Beers et al. 2020).
The International Partnership for Blue Carbon is a global network of governments, organizations, and research institutions that collaborate to accelerate the adoption and implementation of blue carbon activities (Blue Carbon Partnership 2023). Although the term “blue carbon” was initially coined to refer generally to carbon sequestered by the marine biome, “coastal blue carbon” refers to carbon that is sequestered in three ecosystem types: mangroves, seagrasses, and intertidal marshes (International Partnership for Blue Carbon 2017). Recent research has indicated that coastal vegetated systems may represent the most significant carbon sink per unit area (Barbier et al. 2011; Moomaw et al. 2018), especially mangrove systems. The increasing attention on these coastal wetlands has highlighted the need for expanded research in inventorying carbon stores in these systems and understanding their sociopolitical and economic contexts to improve management (Thomas 2014).
The Ramsar Convention joined the International Partnership for Blue Carbon in 2017 (The Ramsar Convention Secretariat 2017). This partnership aims to improve information sharing among representatives of government, non-governmental, and research organizations. It may also provide a viable avenue for financing wetland conservation and enhancing Ramsar implementation, provided that certain scientific, policy, and economic requirements are met. However, the Convention itself has not historically provided guidance for gaining access to carbon markets, instead leaving that work to the UN Framework Convention on Climate Change (UNFCCC) (Herr et al. 2015). UNFCC guidance thus far has focused on helping contracting parties incorporate blue carbon in their nationally determined contributions.
Blue carbon pilot projects are currently underway across the globe, like Mikoko Pamoja (a community-led, voluntary market reforestation project) in Kenya and the Sundarbans (a restoration project funded as an offset mechanism for a company) in India (Wylie et al. 2016), but there are few coordinated efforts in the Caribbean. According to Neumann and colleagues (Neumann et al. 2015), this region is under significant threat of climate change, particularly due to sea level rise in the insular nations, and needs decisive action to promote carbon mitigation on the global stage. The coastal zone is also under intense pressure for development to meet the needs of the growing resident population and to support a burgeoning tourism industry (Gable 1997). The Caribbean has widespread participation in the Ramsar Convention, with nearly 70 coastal Ramsar sites in the 19 nations that are party to the Convention. Un-
fortunately, a 2020 citizen science survey reported significantly greater deterioration and wetland loss in this region compared to other areas worldwide (McInnes et al. 2020). Given the multitude of risks that the Caribbean faces, and the strong presence of coastal wetlands of international importance, it presents a unique opportunity for a regionwide, integrated effort at understanding the role blue carbon might play in financing wetland conservation. In this paper, we review the various factors that might impact the viability of blue carbon as a market mechanism for supporting implementation of the Ramsar Convention financially. The logical first step in determining market viability is to identify appropriate benchmarks for valuation depending on the institutional and socio-economic contexts of Ramsar sites. We conduct a literature review to ascertain the compatibility of the Convention with different valuation methods, including an overview of requirements for accessing markets, a summary of market values that might be considered, and a broad overview of the potential value of mangrove carbon stocks in Ramsar sites in the Caribbean. This paper is intended to provide a starting point for decision-makers in the basin to explore the potential value of blue carbon within their territories, and specifically in their Ramsar sites.
METHODS
Literature Review
We first conducted a literature review to gain more comprehensive insight into primary valuation methods for carbon, the state of knowledge of blue carbon sequestration and storage potential in Caribbean mangroves, and the relevant structures of the Ramsar Convention for financing wetland conservation. We summarized the general requirements for valuing mangrove blue carbon and primary valuation techniques based on previous work (Jerath et al. 2016) to provide a practical overview for decision-makers. We also searched for papers that discussed requirements or estimates for blue carbon projects at Ramsar sites or sites already under some management and protection regime. To locate estimates of blue carbon stocks in Caribbean mangrove systems, we used Web of Science using the search terms “carbon” and “mangrove*” and the names of each member country or overseas territory in the Caribbean basin in the title or abstract as a search parameter, yielding 145 publications across the 19 contracting parties to the Ramsar Convention in the Caribbean. In addition, we searched for global or regional analyses by using the search terms “carbon” and “mangrove*” and “Caribbean” or “region**” or “global,” which produced an additional 51, 563, and 459 papers, respectively. Given the high overlap of papers across searches, we then removed duplicates as well as papers that were not specifically pertinent to the basin or its nations (including removing papers reporting results from sites from non-Caribbean regions of Caribbean countries, like the Gulf of Mexico or the Pacific coasts) and any papers that were not reporting estimates
of carbon stocks across one of the three primary carbon sinks (aboveground biomass (AGB), belowground biomass (BGB), or soil (SOC)) to produce a final literature set of 158 articles. We supplemented these findings with soil core data from the Coastal Carbon Network’s Coastal Carbon Atlas (Holmquist et al. 2023), which includes soil carbon cores collected by practitioners that may not have been published in peer-reviewed literature. Finally, we searched the Ramsar Convention’s documents, technical reports, and Conference proceedings to locate information on financing and the Convention’s current engagement with blue carbon efforts. We also supplemented these findings with academic articles about the Convention, located using a Google Scholar search of “Ramsar Convention” and “structure” or “financ*” and “blue carbon”. This provided an overview of financing within the Convention, and the current level of engagement in blue carbon projects by Ramsar parties and the secretariat.
Valuation
Next, we isolated various estimates for carbon stocks for the Caribbean basin. From this table, we calculated the lowest and highest possible carbon sequestration potential per unit area. We used estimates of mangrove coverage extent for the Caribbean and multiplied that area by the minimum, maximum and average carbon sequestration potential per unit area to estimate a range of total carbon stocks in Caribbean mangroves.
We then used the valuation information gathered to calculate estimated values of the total carbon stock based on different valuation techniques. More information on different valuation techniques is provided in our summary of carbon valuation methods in the next section. Here, we provide the value per unit of carbon based on three valuation techniques: voluntary markets, compliance markets, and the social cost of carbon (SCC). We used the average 2021 price for carbon offsets in the Ecosystem Marketplace ($3.13/tCO2), a voluntary marketplace for forest carbon credits (Donofrio et al. 2021), and inflated it to 2023 USD values ($3.32/tCO2) by applying an annual inflation rate of 3%. We then calculated the current market value per unit of carbon ($12.19/tC) (conversion factor: 1tC = 3.67 tCO2). For the compliance markets, we used the United Nation’s Clean Development Mechanism’s average 2022 price ($77.07/tC) (certified emissions reductions sold for between $7.34 and $146.8/tC) (UNFCCC 2022), and again adjusted this to 2023 prices per metric tonne of C ($79.38/ tC). For comparison, we also used the average price per carbon credit from the European Union’s Emissions Trading Scheme for 2022 (EUR 294.99/tC) (European Energy Exchange (EEX) 2022b; European Energy Exchange (EEX) 2022a; European Energy Exchange (EEX) 2022c; European Energy Exchange (EEX) 2022d), converted to 2023 USD/tC ($337.27/tC) (conversion factor: 1 EUR =
1.11 USD). For the SCC, we used an estimate from recent studies (Rennert et al. 2022b; Barrage and Nordhaus 2023) based on a 2% discount rate of approximately $620.23/tC (2019$) and adjusted this price to a 2023 price per unit of C ($698.07/tC). We multiplied these values by the total stocks to provide a range of estimates for the total potential values of carbon stocks in the region.
RESULTS
State of the Science
Carbon sequestration in Caribbean mangroves remains comparatively underreported in the academic literature. In our review, we initially located 145 publications across 19 countries, as well as 51 from our search for Caribbean-wide reports. After deduplication and removal of reports that did not report stocks or sequestration rates from the Caribbean for the country-level search, only 30 reports remained across 10 countries. The greatest number of publications were from Colombia (11) and Mexico (8). Only one of the publications from the Caribbean search was actually a Caribbean-wide analysis, and it covered parts of the Americas not included in the Caribbean. The relatively limited knowledge of carbon stocks in the region was additionally supported by the low number of cores included in the Coastal Carbon Atlas. Of 6,723 cores, only 219 (3.26%) were from the Caribbean. This is disproportionate to the areal extent of mangroves in the Caribbean compared to the global extent, which is closer to at least 10% (Bunting et al. 2022). Within the Ramsar system of sites, nearly one-third of all mangroves are in Latin America and the Caribbean (Beers et al. 2020).
Given the wide range of mangrove-dominated ecosystems in the Caribbean, including species composition (four species), canopy height (dwarf mangroves vs tall stands), sediment depth (shallow sediment karstic environments to deep peat environments), and extent of tidal influence (riverine vs. coastal fringing), carbon stocks vary widely. Carbon sequestration is also measured using a variety of methodologies (Howard et al. 2014), constantly evolving as new data points are acquired to improve modeling and as new remote sensing technology is deployed (Bukoski et al. 2020; Ouyang and Lee 2020; Zhu and Yan 2022; Malerba et al. 2023). In addition, as there is no singular definition for the Caribbean region, with some studies only including the islands and others lumping the Caribbean in to Central and South America, we did not find an analysis that reported mangrove stocks for the insular and continental Caribbean coastline. Instead, we present multiple estimates in Table 1 from different studies to provide context for the range of carbon stocks across different pools in the region. Across these studies, aboveground biomass represents a smaller carbon pool than either sediment or belowground. Belowground biomass is comparatively understudied, in part due to challenges in its estimation. Furthermore, where regional and global estimates are provided, Caribbean man-
Table 1. Summary of various global and regional estimates of mangrove area and the carbon stocks held in above and belowground biomass, sediments, and total ecosystem from published literature and IPCC recommendations (Hiraishi et al. 2014).
Source (Sanderman et al. 2018) (Hu et al. 2020) (Hu et al. 2020) (Kauffman et al. 2020) (Hiraishi et al. 2014)
Notes Range: 1 (Aruba) to 922,812 (Mexico) based on global LandSat imagery (Giri et al. 2011)
Defined Caribbean as strictly insular. Additional mangrove extent classified under either Central (1,388,962.5) or South (2,062,231.25) America. Based on multisource remote sensing data combined with previously reported estimates (Spalding et al. 2010)
Defined Caribbean as strictly insular. Number reported here is an average of their Caribbean, Central, and South American estimates. Note: Caribbean stocks were larger than C. or S. American
No separate Caribbean estimate. Number reported here is an average of their Central and South American estimates
Source (Kauffman et al. 2020) (Sanderman et al. 2018) (Kauffman et al. 2020) (Kauffman et al. 2020) (Hiraishi et al. 2014)
Notes No separate Caribbean estimate. Number reported here is an average of their Central and South American estimates. Their BGB also included soil up to 1 m depth; we’ve subtracted their SOC estimate to produce BGB estimates
Country-by-country estimates provided for up to 2m depth from predictive models. Restricted list to included nations and provided averages. Range: 243.4 (Mexico) to 589.4 (Cayman Islands)
No separate Caribbean estimate. Number reported here is an average of their Central and South American estimates for soil C up to 1 m depth
groves tend to be on par with or above global carbon stock averages, with the exception of aboveground biomass.
Summary of Techniques for Valuing Carbon
There are well-documented and specific conditions that facilitate a payment for ecosystem scheme. Fundamentally, these are voluntary transactions wherein a single buyer pays a single provider for an ecosystem service, contingent upon the provision of the service (Kemkes et al. 2010). These conditions are not always met, in some cases because services are poorly defined or provided at low levels (Kosoy and Corbera 2010). For a payment for ecosystem services arrangement to be successful, both financially and ecologically, transaction costs must be minimized, the selling price should ideally be sufficient to offset the opportunity cost of provisioning, and the exact type of good must be clearly defined (e.g., public good, market good, common pool resource, etc.) as not all types are amenable to payment for environmental services (Kemkes et al. 2010).
No separate Caribbean estimate. Number reported here is an average of their Central and South American estimates
IPCC Default Value for Tier 1 Estimation Sum of means of reported stocks across each carbon pool in this table
Carbon sequestration is an ecosystem service with clearly defined parameters and a relatively well-established market under global frameworks (Thomas 2014; Wylie et al. 2016). There are currently two major markets: a compliance market, in which nations purchase emissions credits to meet emissions reductions standards, and a voluntary market, in which companies or organizations may purchase offsets for corporate sustainability or philanthropic purposes (Yee 2010). Thus far, the compliance market accepts certified emissions reductions from forested systems only, so the only blue carbon offsets that could be sold through it would be from mangroves (International Partnership for Blue Carbon 2017). As these are the more important carbon sinks, this is a good start, but there are several barriers to entry that can be prohibitive due to the high certification standards that must be met (Wylie et al. 2016). The voluntary market is more accessible, but emissions credits are typically sold at a lower price point to compensate for the reduced verifiability of offsets (Yee 2010).
In either market, there are four factors that determine whether a carbon offset can be sold (Canning et al. 2021; Vanderklift et al. 2022). A project should demonstrate additionality, meaning that the offsets gained would not have been feasible without the payment (Pittock 2010). Projects must also minimize the risk of leakage , so that avoided damage is not simply displaced to a different area (Ullman et al. 2013). The carbon stock should have relative permanence, such that the avoided emissions do not occur after the sale has been concluded. Finally, carbon gains must be verifiable. Many potential projects struggle to establish baseline carbon stocks and demonstrate they meet these four expectations. Forest carbon markets have been heavily criticized in recent years for weaknesses in demonstrating additionality, concerns about the permanence of forest sinks, and the apparent disconnect between project cost and value (Boyd et al. 2023). Despite the challenges to selling blue carbon emissions offsets, there are several examples of existing blue carbon projects that are successfully participating in both markets (Wylie et al. 2016).
However, markets are only one way of valuing carbon. Another common valuation technique is the social cost of carbon (SCC), which is intended to reflect society’s willingness to pay to avoid the worst impacts of increasing carbon emissions (Jerath et al. 2016). To calculate the SCC, analysts predict future emissions based on a variety of factors, model the resultant climate response, and assess the economic impact of those climate changes to major industry sectors like agriculture, health, and more (Auffhammer 2018). Finally, these future damages are converted into their present day value using a discount rate that reflects the level of relative significance of present costs/benefits vs. future costs/benefits. As a reflection of sociocultural norms and prioritization, as well as the complex, unequally distributed impacts of carbon emissions, the SCC can be highly context-dependent. Scholars have recommended a variety of solutions, including adopting an equity-weighted global social cost of carbon that takes into account a range of priorities and detrimental effects of climate change and other carbon pollution impacts (Errickson et al. 2021; Rennert et al. 2022b). Given the variety of factors that can inform a social cost of carbon, there is no single rate that has been globally accepted (Wang et al. 2019; Rennert et al. 2022a), and many have called to instead adopt a targetbased approach (Stern and Stiglitz 2021; Wagner 2021) or use a country-level SCC (Ricke et al. 2018; Tol 2019).
The Worth of Caribbean Mangroves
Based on the data compiled in Table 1, we estimate that mangroves cover between 571,493.75 and 2,686,555 ha in the Caribbean region. As we were not able to locate previously published estimates of mangrove extent in the islands plus strictly along the Caribbean coastlines of Central and South American nations in the basin, we will use both
areal extents to represent an extreme underestimation (only island mangroves), overestimation (including Pacific slopes of continental countries in the basin), and the average of the two (1,629,024 ha) for mid-range calculations. It should be noted that this does not reflect uncertainty in the amount of mangrove cover, but rather uncertainty in the delineation of Caribbean itself. For example, some define it strictly as the insular Caribbean, while others included both the Pacific and Caribbean slopes of Central American countries but not necessarily northern South American countries. We provide both of these ends of the spectrum so users of either definition may gain some insight into the carbon stocks of “their” Caribbean. For a more robust treatment of the limitations and caveats of the estimates provided in this section, refer to the Discussion. Based on the estimates provided in table 1, we found that total ecosystem carbon stock (TECS) in the Caribbean ranged from 406.22 TgC to 2,452.15 TgC (Table 2). Note that the IPCC estimate of 832.43 TgC falls in the lower end of the above range of estimate.
Based on the TECS estimates (Table 2), we calculated a range of monetary values for the carbon stocks in the Caribbean based on SCC. On the low end of the spectrum, the total carbon pool in Caribbean mangroves is contributing approximately $283.6 billion in climate mitigation value, whereas the high-end estimate nears $2 trillion ($1,711,772,350,500). Based on the IPCC’s default value for TECS, Caribbean mangroves store $581.0 billion worth of carbon. These estimates are based on a relatively low discount rate (2%) and calculations for a future climate with less than 2oC of warming. The above estimated values are stock values or value of carbon in perpetuity, or the “stock” value over a hypothetically infinite period of time (Mercer et al. 2017). The value in perpetuity can also be converted to annualized values. The annualized value, as the name suggests, is the value of the same ecosystem service in one year, reflecting the “flow” value. The annualized or flow value is determined by multiplying the value in perpetuity or stock value by an accepted rate of annual return on stock. We apply an annual rate of return equivalent to the same 2% discount rate used above. The above estimates of stock value of the Caribbean carbon of $283.6 billion - $2.0 trillion will result at most conservative annualized (flow) value of $5.7 billion - $40 billion.
Carbon Pool (in TgC)
Table 2: Range of estimates of total carbon stored in aboveground biomass (AGB), belowground biomass (BGB), soil organic carbon (SOC) and total ecosystem carbon stock (TECS).
Market values are dependent upon additional carbon sequestered based on an implemented project. Therefore, rather than using the region-wide TECS we calculated to estimate market value, we use the difference between regional TECS and the total carbon held in all Ramsar sites across Latin America and the Caribbean, which is estimated at 620.7 TgC (Beers et al. 2020). Thus, it represents the potential of expanding protection by designating new Ramsar sites to protect additional mangrove area. As this estimate includes both the islands and the continent, we did not use the low estimate of TECS, as that only incorporated mangroves from the insular Caribbean. We find that there is as much as 1,831.45 million metric tonnes of additional carbon to be protected. On the voluntary market, projects to expand these protections could be worth upwards of $22 billion in stock value. Based on average 2023 compliance prices under the Clean Development Mechanism (low end) and the European Union’s Emissions Trading Scheme (high end), this carbon stock might be worth between $145.4617.7 billion.
DISCUSSION
There are several caveats to the estimates we provide here that should be considered when evaluating the potential of blue carbon as a financing mechanism for Ramsar sites in the Caribbean. Funding is frequently cited as a major driver of the gap between intention and execution, in the literature (Leverington et al. 2010; Heinen et al. 2017) and in contracting parties’ triennial reports. However, there is no one way to implement the Convention. For example, while some contracting parties have passed national legislation that makes all Ramsar sites protected areas (e.g., Panama), for others, Ramsar sites are not under any sort of protection just by merit of their status under the Convention unless explicitly designated as a protected area (e.g., Jamaica). Thus, while blue carbon may be a financing mechanism for Ramsar sites, designation is certainly insufficient to ensure carbon is sequestered and sufficiently protected to meet the standards of market participation.
Contracting parties will need to invest in baseline and ongoing measurements to ensure mangroves continue to be managed to sequester additional carbon in longer-term carbon pools. Ensuring additionality goes beyond designating new protected areas, as studies have shown that only protected areas that enforce relatively strict ecosystemscale protections are successful in stemming mangrove loss (Miteva et al. 2015). In some cases, such protections may conflict with the Ramsar principle of wise use, though a case could be made for re-framing wise use to emphasize the “wise” element. Additionality will only become more challenging as the compounding threats of climate change impact the Caribbean and mangroves worldwide (Alongi 2022; Chatting et al. 2022; Singh et al. 2022; Rull 2023). This could be an argument for acting more immediately to stave off these worst impacts. Given the increasing risk
of intense hurricane events in the Caribbean (Vosper et al. 2020), there are additional concerns about the permanence of carbon stocks stored in mangroves. Much of the carbon in Caribbean mangroves is stored in sediments which are significantly more resilient to hurricanes, even following catastrophic losses of aboveground biomass (Krauss et al. 2020). Effective management can intervene to facilitate restoration (e.g., planting genetically diverse propagules, clearing debris, and restoring hydrological regimes), which can attempt to address both permanence and additionality concerns and is in alignment with the Ramsar Convention’s restoration priorities (Gardner 2003). In the broader context of the impacts of climate change on coastal mangroves, some research has indicated that the carbon sequestration potential of coastal ecosystems may actually be enhanced by landward and poleward migration (Lovelock and Reef 2020). Facilitating this migration may be another avenue for identifying additional carbon sequestration.
The estimates we provide for carbon stocks are also based on simplification of the variety of factors that influence carbon sequestration in mangroves. Allocation of biomass across various carbon pools is dependent on nutrient effectiveness (Pan et al. 2023), tidal amplitude and duration (Rovai et al. 2018), precipitation and cyclone frequency (Simard et al. 2019), among others. Belowground biomass and soil organic carbon is driven by characteristics like soil depth and texture (Kauffman et al. 2020). Carbon stock and sequestration are also sensitive to physiographic types, species composition, salinity, and hydroperiod (Estrada and Soares 2017; Dai et al. 2018; Rovai et al. 2021). Given the relatively few data points in the basin, and the varying ways that scholars have delineated the Caribbean’s boundaries for assessing carbon stocks, we also had to make assumptions about mangrove extent and the relative homogeneity of carbon stocks across a variety of different conditions. More studies are needed to quantify mangrove biomass across a variety of different ecosystem types and conditions in the basin.
With respect to price estimates, as expected, market values were substantially lower than the social cost of carbon value. This reflects the difference between willingness to pay for averted losses and the expected cost of those losses (Jerath et al. 2016). However, the SCC calculation requires a number of assumptions and normative preferences be made, and there are a variety of different estimates for that social cost of carbon that we did not choose (Ricke et al. 2018; Tol 2019). We chose the cost we did because it reflected a 2o C warming scenario – which is an increasingly optimistic outcome given delays in meeting Paris Accord emissions reduction targets – and a relatively low discount rate of 2%. These are value judgements to prioritize the immediacy of action needed given the Caribbean’s sensitivity to climate change (Vosper et al. 2020), while still producing relatively achievable estimates. As the carbon market ma-
tures, one might be able to add more quality-based nuances to market designs and pricing.
These assumptions are critically important to understand, and for countries to test and adapt prior to market entry, because they will fundamentally shift the calculus of whether or not it is economically viable to sell carbon credits. If a low carbon price is set, or a low social cost of carbon adopted, in a context where sequestration is low and transaction costs are high, selling emissions credits is not financially comparable to conversion of the mangrove forest to alternate uses. From a policy perspective, countries may need to establish a work group to determine and regularly update a national social cost of carbon, as the United States has done (Stern and Stiglitz 2021), or adopt previously modeled values (Ricke et al. 2018; Tol 2019). However, we recognize that making a case for designing a payment for blue carbon through internal or external funding based on SCC may seem financially prohibitive. A more affordable basis for underwriting such programs would be abatement costs or compliance market prices.
A recent study found that only about 20% of global mangrove forests are investible for carbon finance projects due to their imminent conversion pressure (additionality), of which only 40.6% would be financially viable based on current market rates when factoring in costs of project establishment, management, and a gradually increasing carbon price (Zeng et al. 2021; Boyd et al. 2023). By their calculation, no countries in the Americas are in the top 10 for net present value of mangrove blue carbon. In addition, a more holistic calculation of global blue carbon wealth might also take into account the carbon benefits to other countries of avoided emissions to determine which nations contribute the greatest blue carbon wealth (Bertram et al. 2021). Regardless of the financial arguments for mangrove conservation, halting deforestation is absolutely critical for protecting biodiversity as well as increasing carbon stocks, perhaps by as much as 10% in the next century (Sanders et al. 2016).
Halting this trend in mangroves and across wetlands writ-large is one of the goals of the Ramsar Convention. As with many multilateral environmental agreements, the Ramsar Convention has struggled to maintain sufficient contributions to match the scale of its vision, and it has a significantly lower operating budget than other global conventions (Pittock 2010). Unfortunately, international funding mechanisms which have historically supported biodiversity conservation efforts (Emerton et al. 2006), and contributions to the Convention (Ramsar Standing Committee 2018), are increasingly being outpaced by the expanding need for significant investment to face escalating global and local development challenges. For Ramsar sites to participate in carbon markets to close this financing gap, standards for the aforementioned four requirements (additionality, permanence, leakage, and verifiability) are set and
influenced by both markets and national policies (Thamo and Pannell 2016; Regan et al. 2020). Thus, to capitalize on the blue carbon opportunity in Ramsar sites across the Caribbean (Beers et al. 2020), national policies must be evaluated to ensure that conditions, like land tenure, transaction costs, and social license to operate are favorable for a payments for ecosystem services scheme (Kemkes et al. 2010).
CONCLUSION
The existing coastal wetland carbon stocks of the Caribbean hold enormous monetizable potential, as the region boasts large expanses of some of the most productive carbon sequestering ecosystems, especially mangroves. However, there are still substantial gaps in our understanding of these stocks, including the exact extent of different ecosystem types and estimates of their carbon stocks under different geological, hydrological, and environmental conditions, including a consideration of how these stocks may be impacted by climate change. Using the site-based framework of Ramsar, pilot projects can be established to better estimate ecosystem carbon stocks and potential for designing carbon markets. For instance, there are numerous multinational companies that are seeking carbon sequestration opportunities. The carbon investment fund, Livelihoods, which represents companies like Hermès, Michelin, and Danone, has invested in blue carbon credits from projects in Ghana (Bird 2016) and the previously mentioned project in the Sundarbans (Wylie et al. 2016). Apple funded Conservation International’s efforts in Colombia to develop the first comprehensive mangrove carbon credit that remedied the undervaluation that was occurring due to using terrestrial forest methods, and the corporation claimed some of the credits for its own offsets but primarily participated philanthropically to advance the development of mangrove carbon markets (Klein 2021). National governments might seek such opportunities to partner with nongovernmental organizations and corporations to finance the development of carbon credit generating mangrove projects.
By providing small grants and training to strategically selected coastal Ramsar sites throughout the Caribbean, the Convention could contribute significantly to a more complete knowledge base of ecosystem blue carbon stocks. This paper provides a variety of benchmarks for carbon stock as well as flow values. Once carbon stocks are quantified, nations can determine where restoration projects and the establishment of new protected areas and Ramsar sites might be politically and economically viable, given access to carbon financing. Though full scientific certainty may not exist currently, the coastal Caribbean region cannot afford to postpone intervention. Blue carbon financing could be a viable funding source to promote the wise use of coastal wetlands, both by supporting restoration efforts within Ramsar sites and by adding more sites to the Ramsar network.
REFERENCES
Alongi, D.M. 2022. Climate change and mangroves. In: S.C. Das, Pulliah and E.C. Ashton (eds). Mangroves: Biodiversity, Livelihoods and Conservation. Springer Nature Singapore, pp. 175–198. doi: 10.1007/978-981-19-0519-3_8.
Auffhammer, M. 2018. Quantifying economic damages from climate change. Journal of Economic Perspectives 32(4): pp. 33–52. doi: 10.1257/jep.32.4.33.
Barbier, E.B., M.C. Acreman, and D. Knowler. 1997. Economic Valuation of Wetlands: A Guide for Policy Makers and Planners. Gland, Switzerland: Ramsar Convention Bureau.
Barbier, E.B., S.D. Hacker, C. Kennedy, E. W. Koch, A.C. Stier and B.R. Silliman. 2011. The value of estuarine and coastal ecosystem services. Ecological Monographs 81(2): pp. 169–193. doi: 10.1890/10-1510.1.
Barrage, L. and W. Nordhaus. 2023. Policies, Projections, and the Social Cost of Carbon: Results from the DICE-2023 Model. Cambridge, MA: National Bureau of Economic Research. p. w31112. Available at: http:// www.nber.org/papers/w31112.pdf [Accessed: 20 July 2023].
Beers, L.S., S. Crooks and S. Fennessy. 2020. The Contribution of Blue Carbon Ecosystems to Climate Change Mitigation. Convention on Wetlands. Available at: https://www.ramsar.org/sites/default/files/documents/ library/bn12_blue_carbon_ccmitigation_e.pdf [Accessed: 10 July 2023].
Bertram, C., M. Quaas, T.B.H. Reusch, A.T. Vafeidis, C. Wolff and W. Rickels. 2021. The blue carbon wealth of nations. Nature Climate Change 11(8), pp. 704–709. doi: 10.1038/s41558-021-01089-4.
Bird, W. 2016. Are “blue carbon” projects a win for the climate and the people? Yale E360. Available at: https://e360.yale.edu/features/african_ mangroves_blue_carbon_win_for_climate_and_for_people [Accessed: 31 October 2023].
Blue Carbon Partnership. 2023. Blue Carbon Partnership | Protecting Mangroves, Tidal Marshes, Sea Grasses. Available at: https://bluecarbonpartnership.org/ [Accessed: 31 October 2023].
Boyd, P.W., L. Bach, R. Holden and C. Turney. 2023. Redesign carbonremoval offsets to help the planet. Nature 620, pp. 947–949.
Bruner, A.G., R.E. Gullison and A. Balmford. 2004. Financial costs and shortfalls of managing and expanding protected-area systems in developing countries. BioScience 54(12), pp. 1119–1126. doi: 10.1641/0006-3568(2004)054[1119:FCASOM]2.0.CO;2.
Bukoski, J.J., A. Elwin, R.A. MacKenzie, S. Sharma, J. Purbopuspito, B. Kopania, M. Apwong, R. Poolsiri and M.D. Potts. 2020. The role of predictive model data in designing mangrove forest carbon programs. Environmental Research Letters 15(8). doi: 10.1088/1748-9326/ab7e4e.
Bunting, P., A. Rosenqvist, L. Hilarides, R.M. Lucas, N. Thomas, T. Tadono, T.A. Worthington, M. Spalding, N.J. Murray and L.M. Rebelo. 2022. Global mangrove extent change 1996-2020: Global Mangrove Watch Version 3.0. Remote Sensing 14(15). doi: 10.3390/rs14153657.
Canning, A.D., D. Jarvis, R. Costanza, S. Hasan, J.C.R. Smart, J. Finisdore, C.E. Lovelock, S. Greenhalgh, H.M. Marr, M.W. Beck, C.L. Gillies and N.J. Waltham. 2021. Financial incentives for large-scale wetland restoration: Beyond markets to common asset trusts. One Earth 4(7), pp. 937–950. doi: 10.1016/j.oneear.2021.06.006.
Chatting, M., I. Al-Maslamani, M. Walton, M.W. Skov, H. Kennedy, Y.S. Husrevoglu and Le Vay, L. 2022. Future mangrove carbon storage under climate change and deforestation. Frontiers in Marine Science 9. doi: 10.3389/fmars.2022.781876.
Convention on Wetlands. 2018. Resolution XIII.14: Promoting conservation, restoration and sustainable management of coastal blue-carbon ecosystems. In: 13th Meeting of the Conference of Parties. Dubai, United Arab Emirates.
Cook, G.S. and J.T. Heinen. 2005. On the uncertain costs and tenuous benefits of marine protected areas: A case study of the Tortugas Ecological Reserve, South Florida, USA. Natural Areas Journal 25(4):390-396.
Costanza, R., R. de Groot, P. Sutton, S. van der Ploeg, S.J. Anderson, I. Kubiszewski, S. Farber and R.K. Turner. 2014. Changes in the global value of ecosystem services. Global Environmental Change 26(1): pp. 152–158. doi: 10.1016/j.gloenvcha.2014.04.002.
Dai, Z., C.C. Trettin, S. Frolking and R.A. Birdsey. 2018. Mangrove carbon assessment tool: Model validation and assessment of mangroves in southern USA and Mexico. Estuarine, Coastal and Shelf Science 208, pp. 107–117. doi: 10.1016/j.ecss.2018.04.036.
Davidson, N.C., A.A. Van Dam, C.M. Finlayson R.J. and Mcinnes. 2019. Worth of wetlands: revised global monetary values of coastal and inland wetland ecosystem services. Marine and Freshwater Research 70, pp. 1189–1194. doi: 10.1071/MF18391.
Diaz-Campos, C.A. and K. Vilés-Lopez. 2020. Financial structuring of protected areas according to the Conservation Measures Partnership classification system of actions. PARKS: The International Journal of Protected Areas and Conservation 26(1): pp. 89–98. doi: 10.2305/IUCN. CH.2020PARKS-26-1en.
Donofrio, S., P. Maguire, K. Myers, C. Daley and K. Lin. 2021. Markets in motion: State of the voluntary carbon markets 2021. Washington, DC: Ecosystem Marketplace. Available at: https://www.ecosystemmarketplace.com/publications/state-of-the-voluntary-carbon-markets-2021/
Emerton, L., J. Bishop L. and Thomas. 2006. Sustainable financing of protected areas: A global review of challenges and options. Gland, Switzerland and Cambridge, UK: IUCN. p. x + 97 pp. doi: 10.2305/iucn. ch.2005.pag.13.en.
Errickson, F.C., K. Keller, W.D. Collins, V. Srikrishnan and D. Anthoff. 2021. Equity is more important for the social cost of methane than climate uncertainty. Nature 592(7855): pp. 564–570. doi: 10.1038/s41586021-03386-6.
Ervin, J. 2003. WWF: Rapid Assessment and Prioritization of Protected Area Management (RAPPAM) Methodology. Gland, Switzerland: World Wildlife Fund.
Estrada, G. and Soares, M. 2017. Global patterns of aboveground carbon stock and sequestration in mangroves. Anais da Academia Brasileira de Ciencias 89(2): pp. 973–989. doi: 10.1590/0001-3765201720160357.
European Energy Exchange (EEX). 2022a. Auctions by the Common Auction Platform April, May, June 2022. European Union. Available at: https://climate.ec.europa.eu/system/files/2022-12/cap_report_202206_ en.pdf [Accessed: 21 July 2023].
European Energy Exchange (EEX). 2022b. Auctions by the Common Auction Platform January, February, March 2022. European Union. Available at: https://climate.ec.europa.eu/system/files/2022-06/cap_report_202203_en.pdf [Accessed: 21 July 2023].
European Energy Exchange (EEX). 2022c. Auctions by the Common Auction Platform July, August, September 2022. European Union. Available at: https://climate.ec.europa.eu/system/files/2022-12/cap_report_202209_en.pdf [Accessed: 21 July 2023].
European Energy Exchange (EEX). 2022d. Auctions by the Common Auction Platform October, November, December 2022. European Union. Available at: https://climate.ec.europa.eu/system/files/2023-03/cap_report_202212_en.pdf [Accessed: 21 July 2023].
Gable, F.J. 1997. Climate change impacts on Caribbean coastal areas and tourism. Journal of Coastal Research (24), pp. 49–69.
Gardner, R.C. 2003. Rehabilitating nature: A comparative review of legal mechanisms that ncourage wetland restoration efforts. Catholic University Law Review 52(3): pp. 573–620.
Giri, C., E. Ochieng, L.L. Tieszen, Z. Zhu, A. Singh, T. Loveland, J. Masek and N. Duke. 2011. Status and distribution of mangrove forests of the world using earth observation satellite data: Status and distributions of global mangroves. Global Ecology and Biogeography 20(1): pp. 154–159. doi: 10.1111/j.1466-8238.2010.00584.x.
de Groot, R., M. Stuip, C.M. Finlayson and N.C. Davidson. 2006. Valuing Wetlands: Guidance for Valuing the Benefits Derived from Wetland Ecosystem Services. Gland, Switzerland: Ramsar Convention Secretariat.
Heinen, J.T., A. Roque and L.C. Collado-Vides. 2017. Managerial implications of perceptions, knowledge, attitudes, and awareness of residents regarding Puerto Morelos Reef National Park, Mexico. Journal of Coastal Research 33(2): pp. 295–303. doi: 10.2112/JCOASTRESD-15-00191.1.
Herr, D., T. Agardy, D. Benzaken, F. Hicks, J. Howard, E. Landis, A. Soles and T. Vegh. 2015. Coastal “Blue” Carbon. Gland, Switzerland: International Union for Conservation of Nature. Available at: http:// dx.doi.org/10.2305/IUCN.CH.2015.10.en [Accessed: 16 December 2021].
Hiraishi, T., T. Krug, K. Tanabe, N. Srivastava, B. Jamsranjav, M. Fukuda and T. Troxler. 2014. 2013 Supplement to the 2006 IPCC Guidelines for National Greenhouse Gas Inventories: Wetlands. Intergovernmental Panel on Climate Change. Available at: https://www.ipcc.ch/site/assets/ uploads/2018/03/Wetlands_Supplement_Entire_Report.pdf [Accessed: 20 July 2023].
Hockings, M., S. Stolton, F. Leverington, N. Dudley and J. Courrau. 2006. Evaluating Effectiveness: A Framework for Assessing Management Effectiveness of Protected Areas. Gland, Switzerland: International Union for Conservation of Nature and Natural Resources. doi: 10.1113/ jphysiol.1975.sp011193.
Holmquist, J., D. Klinges, M. Lonnerman, J. Wolfe and P. Megonigal. 2023. Database: Coastal Carbon Network Data Library. Available at: https://github.com/Smithsonian/CCRCN-Data-Library
Howard, J., S. Hoyt, K. Isensee, E. Pidgeon and M. Telszewski. 2014. Coastal blue carbon: methods for assessing carbon stocks and emissions factors in mangroves, tidal salt marshes, and seagrass meadows. pp. 1–186.
Hu, T., Y. Zhang, Y. Su, Y. Zheng, G. Lin and Q. Guo. 2020. Mapping the global mangrove forest aboveground biomass using multisource remote sensing data. Remote Sensing 12(10). doi: 10.3390/rs12101690.
International Partnership for Blue Carbon. 2017. Coastal blue carbon, an introduction for policy makers.
Jerath, M., M. Bhat, V.H. Rivera-Monroy, E. Castañeda-Moya, M. Simard and R.R. Twilley. 2016. The role of economic, policy, and ecological factors in estimating the value of carbon stocks in Everglades mangrove forests, South Florida, USA. Environmental Science and Policy 66, pp. 160–169. doi: 10.1016/j.envsci.2016.09.005.
Kauffman, J.B., M.F. Adame, V.B. Arifanti, L.M. Schile-Beers, A.F. Bernardino, R.K. Bhomia, D.C. Donato, I.C. Feller, T.O. Ferreira, M.D.J. Garcia, R.A. MacKenzie, J.P. Megonigal, D. Murdiyarso, L. Simpson and H.H. Trejo. 2020. Total ecosystem carbon stocks of mangroves across broad global environmental and physical gradients. Ecological Monographs 90(2). doi: 10.1002/ecm.1405.
Kemkes, R.J., J. Farley and C.J. Koliba. 2010. Determining when payments are an effective policy approach to ecosystem service provision. Ecological Economics 69(11): pp. 2069–2074. doi: 10.1016/j.ecolecon.2009.11.032.
Klein, J. 2021. Apple, Conservation International introduce mangrove carbon credit. GreenBiz. Available at: https://www.greenbiz.com/article/ apple-conservation-international-introduce-mangrove-carbon-credit [Accessed: 31 October 2023].
Kosoy, N. and E. Corbera. 2010. Payments for ecosystem services as commodity fetishism. Ecological Economics 69(6): pp. 1228–1236. doi: 10.1016/j.ecolecon.2009.11.002.
Krauss, K., A. From, C. Rogers, K. Whelan, K. Grimes, R. Dobbs and T. Kelley. 2020. Structural impacts, carbon losses, and regeneration in mangrove wetlands after two hurricanes on St. John, US Virgin Islands. Wetlands 40(6): pp. 2397–2412. doi: 10.1007/s13157-020-01313-5.
Leverington, F., K.L. Costa, H. Pavese, A. Lisle and M. Hockings. 2010. A global analysis of protected area management effectiveness. Environmental Management 46(5): pp. 685–698. doi: 10.1007/s00267-0109564-5.
Lovelock, C.E. and R. Reef. 2020. Variable Impacts of Climate Change on Blue Carbon. One Earth 3(2): pp. 195–211. doi: 10.1016/j.oneear.2020.07.010.
Malerba, M., M.D.D. Costa, D.A. Friess, L. Schuster, M.A. Young, D. Lagomasino, O. Serrano, S.M. Hickey, P.H. York, M. Rasheed, J.S. Lefcheck, B. Radford, T.B. Atwood, D. Ierodiaconou and P. Macreadie. 2023. Remote sensing for cost-effective blue carbon accounting. EarthScience Reviews 238. doi: 10.1016/j.earscirev.2023.104337.
McInnes, R.J., N.C. Davidson, C.P. Rostron, M. Simpson and C.M. Finlayson. 2020. A citizen science state of the world’s wetlands survey. Wetlands 40: pp. 1577–1593. doi: https://doi.org/10.1007/s13157-02001267-8
Mercer, D.E., X. Li, A. Stainback and J. Alavalapati. 2017. Valuation of agroforestry services. In: Agroforestry: Enhancing Resiliency in U.S. Agricultural Landscapes Under Changing Conditions. Gen. Tech Report. United States Department of Agriculture Forest Service, pp. 63–72.
Miteva, D.A., B.C. Murray and S.K. Pattanayak. 2015. Do protected areas reduce blue carbon emissions? A quasi-experimental evaluation of mangroves in Indonesia. Ecological Economics 119: pp. 127–135. doi: 10.1016/j.ecolecon.2015.08.005.
Moomaw, W.R., G.L. Chmura, G.T. Davies, C.M. Finlayson, B.A. Middleton, S.M. Natali, J.E. Perry, N. Roulet and A.E. Sutton-Grier. 2018. Wetlands in a changing climate: science, policy and management. Wetlands 38: pp. 183–205. doi: 10.1007/s13157-018-1023-8.
Munguía, S.M. and J.T. Heinen. 2021. Assessing protected area management effectiveness: The need for a wetland-specific evaluation tool. Environmental Management. doi: 10.1007/s00267-021-01527-1.
Munguía, S.M. and J.T. Heinen. 2023. Piloting the rapid R-MEET framework at a coastal Ramsar Site. Marine and Freshwater Research 74(11): pp. 941-955. doi: 10.1071/MF22243
Neumann, B., A.T. Vafeidis, J. Zimmermann and R.J. Nicholls. 2015. Future coastal population growth and exposure to sea-level rise and coastal flooding - A global assessment. PLoS ONE 10(3). doi: 10.1371/ journal.pone.0118571.
Ouyang, X. and S.Y. Lee. 2020. Improved estimates on global carbon stock and carbon pools in tidal wetlands. Nature Communications 11(1). doi: 10.1038/s41467-019-14120-2.
Pan, Y., Z. Zhang, M. Zhang, P. Huang, L. Dai, Z. Ma and J. Liu. 2023. Climate vs. nutrient control: A global analysis of driving environmental factors of wetland plant biomass allocation strategy. Journal of Cleaner Production 406. doi: 10.1016/j.jclepro.2023.136983.
Pittock, J. 2010. A pale reflection of political reality: Integration of global climate, wetland, and biodiversity agreements. Climate Law 1(3): pp. 343–373. doi: 10.3233/CL-2010-017.
Ramsar Standing Committee. 2018. Financial and Budgetary Matters Status of Annual Contributions Background. Gland, Switzerland: The Ramsar Convention Secretariat. Available at: https://www.ramsar.org/ about/the-ramsar-convention-secretariat. [Accessed: 6 June 2021].
Regan, C.M., J.D. Connor, D.M. Summers, C. Settre, P.J. O’Connor and T.R. Cavagnaro. 2020. The influence of crediting and permanence periods on Australian forest-based carbon offset supply. Land Use Policy. doi: 10.1016/j.landusepol.2020.104800.
Rennert, K., F. Errickson, B.C. Prest, L. Rennels, R.G. Newell, W. Pizer, C. Kingdon, J. Wingenroth, R. Cooke, B. Parthum, D. Smith, K. Cromar, D. Diaz, F.C. Moore, U.K. Müller, R.J. Plevin, A.E. Raftery, H. Ševčíková, H. Sheets, J.H. Stock, T. Tan, M. Watson, T.E. Wong and D. Anthoff. 2022a. Comprehensive evidence implies a higher social cost of CO2. Nature 610(7933), pp. 687–692. doi: 10.1038/s41586-022-052249.
Rennert, K., B.C. Prest, W.A. Pizer, R.G. Newell, D. Anthoff, C. Kingdon, L. Rennels, R. Cooke, A.E. Raftery, H. Ševčíková, F. Errickson. 2022b. The social cost of carbon: advances in long-term probabilistic projections of population, GDP, emissions, and discount rates. Brookings Papers on Economic Activity 2021(2): pp. 223–305. doi: 10.1353/ eca.2022.0003.
Ricke, K., L. Drouet, K. Caldeira and M. Tavoni. 2018. Country-level social cost of carbon. Nature Climate Change 8(10): pp. 895–900. doi: 10.1038/s41558-018-0282-y.
Rovai, A.S., R.R. Twilley, E. Castaneda-Moya, S.R. Midway, D.A. Friess, C.C. Trettin, J.J. Bukoski, A.E.L. Stovall, P.R. Pagliosa, A.L. Fonseca, R.A. Mackenzi, A. Aslan, S.D. Sasmito, M. Sillanpaa, T.G. Cole, J. Purbopuspito, M.W. Warren, D. Murdiyarso, W. Mofu, S. Sharma, P.H. Tinh and P. Riul. 2021. Macroecological patterns of forest structure and allometric scaling in mangrove forests. Global Ecology and Biogeography 30(5): pp. 1000–1013. doi: 10.1111/geb.13268.
Rovai, A.S., R.R. Twilley, E. Castaneda-Moya, P. Riul, M. CifuentesJara, M. Manrow-Villalobos, P.A. Horta, J.C. Simonassi, A.L. Fonseca and P.R. Pagliosa. 2018. Global controls on carbon storage in mangrove soils. Nature Climate Change 8(6): pp. 534–538. doi: 10.1038/s41558018-0162-5.
Rull, V. 2023. Rise and fall of Caribbean mangroves. Science of the Total Environment. doi: 10.1016/j.scitotenv.2023.163851
Sanderman, J., T. Hengl, G. Fiske, K. Solvik, M.F. Adame, L. Benson, J.J. Bukoski, P. Carnell, M. Cifuentes-Jara, D. Donato, C. Duncan, E.M. Eid, P.Z. Ermgassen, C.J.E. Lewis, P.I. Macreadie, L. Glass, S. Gress, S.L. Jardine, T.G. Jones, E.N. Nsombo, M.M. Rahman, C.J. Sanders, M. Spalding and E. Landis. 2018. A global map of mangrove forest soil carbon at 30 m spatial resolution. Environmental Research Letters 13(5). doi: 10.1088/1748-9326/aabe1c.
Sanders, C., Maher, D., Tait, D., Williams, D., Holloway, C., Sippo, J. and Santos, I. 2016. Are global mangrove carbon stocks driven by rainfall? Journal of Geophysical Research-Biogeosciences 121(10): pp. 2600–2609. doi: 10.1002/2016JG003510.
Shah, P.S. 2021. Education for sustainable development? An analysis of financing wetland conservation in the wetlands of Kenya. Financing for Development 1(3): pp. 104–125.
Simard, M., L. Fatoyinbo, C. Smetanka, V. Rivera-Monroy, E. Castaneda-Moya, N. Thomas and T. Van der Stocken. 2019. Mangrove canopy height globally related to precipitation, temperature and cyclone frequency. Nature Geoscience 12(1). doi: 10.1038/s41561-018-0279-1.
Sinclair, M., M.K. Vishnu Sagar, C. Knudsen, J. Sabu and A. Ghermandi. 2021. Economic appraisal of ecosystem services and restoration scenarios in a tropical coastal Ramsar wetland in India. Ecosystem Services 47: p. 101236. doi: 10.1016/j.ecoser.2020.101236.
Singh, M., L. Schwendenmann, G. Wang, M.F. Adame and L.J. Comissario Mandlate. 2022. Changes in mangrove carbon stocks and exposure to sea level rise (SLR) under future climate scenarios. Sustainability (Switzerland) 14(7). doi: 10.3390/su14073873.
Spalding, M., M. Kainuma and L. Collins. 2010. World Atlas of Mangroves. London, UK: Earthscan.
Stern, N. and J.E. Stiglitz. 2021. The social cost of carbon, risk, distribution, market failures: an alternative approach. SSRN Electronic Journal. Available at: https://www.ssrn.com/abstract=3785806 [Accessed: 20 July 2023].
Thamo, T. and D.J. Pannell. 2016. Challenges in developing effective policy for soil carbon sequestration: perspectives on additionality, leakage, and permanence. Climate Policy. doi: 10.1080/14693062.2015.1075372.
The Ramsar Convention Secretariat. 2017. Ramsar Convention joins the International Partnership for Blue Carbon. Available at: https://www. ramsar.org/news/ramsar-convention-joins-the-international-partnershipfor-blue-carbon
Thomas, S. 2014. Blue carbon: knowledge gaps, critical issues, and novel approaches. Ecological Economics 107: pp. 22–38. doi: 10.1016/j. ecolecon.2014.07.028.
Tol, R.S.J. 2019. A social cost of carbon for (almost) every country. Energy Economics 83: pp. 555–566. doi: 10.1016/j.eneco.2019.07.006. Ullman, R., V. Bilbao-Bastida and G. Grimsditch. 2013. Including blue carbon in climate market mechanisms. Ocean and Coastal Management 83: pp. 15–18. doi: 10.1016/j.ocecoaman.2012.02.009.
UNFCCC. 2022. Annual report of the Executive Board of the Clean Development Mechanism to the Conference of the Parties Serving as the Meeting of the Parties to the Kyoto Protocol. Sharm el-Sheikh: United Nations Framework Convention on Climate Change. Available at: https://unfccc.int/sites/default/files/resource/cmp2022_07E.pdf [Accessed: 21 July 2023].
Vanderklift, M., D. Herr, C. Lovelock, D. Murdiyarso, J. Raw and A. Steven. 2022. A guide to international climate mitigation policy and finance frameworks relevant to the protection and restoration of blue carbon ecosystems. Frontiers in Marine Science 9. doi: 10.3389/ fmars.2022.872064.
Vosper, E.L., D.M. Mitchell and K. Emanuel. 2020. Extreme hurricane rainfall affecting the Caribbean mitigated by the paris agreement goals. Environmental Research Letters 15(10): p. 104053. doi: 10.1088/17489326/ab9794.
Wagner, G. 2021. Recalculate the social cost of carbon. Nature Climate Change 11(4): pp. 293–294. doi: 10.1038/s41558-021-01018-5.
Wang, P., X. Deng, H. Zhou and S. Yu. 2019. Estimates of the social cost of carbon: a review based on meta-analysis. Journal of Cleaner Production 209, pp. 1494–1507. doi: 10.1016/j.jclepro.2018.11.058.
Wylie, L., A.E. Sutton-Grier and A. Moore. 2016. Keys to successful blue carbon projects: lessons learned from global case studies. Marine Policy 65, pp. 76–84. doi: 10.1016/j.marpol.2015.12.020.
Yee, S. 2010. REDD and BLUE arbon: Carbon Payments for Mangrove Conservation. University of California San Diego.
Zeng, Y., D. Friess, T. Sarira, K. Siman and L. Koh. 2021. Global potential and limits of mangrove blue carbon for climate change mitigation. Current Biology 31(8): pp. 1737-+. doi: 10.1016/j.cub.2021.01.070.
Zhu, J. and B. Yan. 2022. Blue carbon sink function and carbon neutrality potential of mangroves. Science of the Total Environment 822. doi: 10.1016/j.scitotenv.2022.153438.
Article rescinded (pages 20–29 removed)
How Will Sea Level Rise Affect Coastal Wetlands on the Atlantic Coast of Mexico: Impacts
and Species Responses?
Edgar Abel Sánchez-García1,2, Patricia Moreno-Casasola1 and Roberto Monroy Ibarra1
ABSTRACT
Mexico’s Atlantic Coast with its mosaic of coastal wetlands is vulnerable to sea level rise. These wetlands are transition zones between the terrestrial and the marine environments. Due to their location, the rise in sea level could increase the level of flooding and salinity in these ecosystems. A synthetic model was applied to the Mexican Atlantic coast, and the La Mancha lagoon was used for local experiments with wetland species. Our objectives were: 1) identify the potentially floodable coastal wetlands in the face of a sea level rise of one and two meters, and 2) determine the percentages of germination for seven popal (freshwater marsh) species and the survival and growth of a swamp tree species, Annona glabra seedlings under different flood and salinity conditions. For the first objective, we developed a synthetic model using three information layers: altitude of the land (elevation), water bodies, and wetland vegetation. For the second, we carried out two experiments: 1) a laboratory germination experiment with eight treatments (2 flood levels × 4 salinity levels), and 2) greenhouse growth seedlings experiment with nine treatments (3 flood levels × 3 salinity levels). Our model identified 470,480 and 720,902 ha of wetlands potentially affected under one- and two-meter scenarios, respectively. The germination experiment results showed that most popal species germinated higher under no salinity conditions as expected. The seedling experiment recorded that survival and growth were higher under no salinity conditions. In both experiments, salinity was the most stressful factor. According to the model, the tulares and mangroves will have significant areas affected by sea level rise. In addition, freshwater wetlands will be affected in two crucial stages of their cycle life: germination and seedlings establishment.
La costa atlántica de México, con su mosaico de humedales costeros, es vulnerable al aumento del nivel del mar. Estos humedales son zonas de transición entre el medio terrestre y el marino. Debido a su ubicación, el aumento del nivel
del mar podría incrementar el nivel de inundación y salinidad en estos ecosistemas. Se aplicó un modelo sintético en la costa atlántica mexicana y se utilizó la laguna de La Mancha para realizar experimentos locales con especies de humedales. Nuestros objetivos fueron: 1) identificar los humedales costeros potencialmente inundables ante un aumento del nivel del mar de uno y dos metros, y 2) determinar los porcentajes de germinación de siete especies de popales (humedales herbáceos de agua dulce) y la supervivencia y crecimiento de plántulas de Annona glabram una especie de selva inundable, bajo diferentes condiciones de inundación y salinidad. Para el primer objetivo, desarrollamos un modelo sintético utilizando tres capas de información: altitud del terreno (elevación), cuerpos de agua y vegetación de humedales. Para el segundo, llevamos a cabo dos experimentos: 1) un experimento de germinación en laboratorio con ocho tratamientos (2 niveles de inundación × 4 niveles de salinidad) y 2) un experimento en invernadero de crecimiento de plántulas con nueve tratamientos (3 niveles de inundación × 3 niveles de salinidad). Nuestro modelo identificó 470,480 y 720,902 ha de humedales potencialmente afectados en escenarios de uno y dos metros, respectivamente. Como se esperaba, los resultados del experimento de germinación mostraron que la mayoría de las especies de popales tuvieron mayor germinaron en condiciones sin salinidad. El experimento con plántulas registró que la supervivencia y el crecimiento fueron mayores en condiciones sin salinidad. En ambos experimentos, la salinidad fue el factor más estresante. De acuerdo al modelo, los tulares y manglares tendrán importantes áreas afectadas por el aumento del nivel del mar. Además, los humedales de agua dulce se verán afectados en dos etapas cruciales de su ciclo de vida: la germinación y el establecimiento de plántulas.
Global climate change will increase the mean temperature, droughts, and tropical cyclones, alter precipitation patterns, and raise the rate of sea level changes (IPCC 2021). Sea level rise is the consequence of various processes, among them, thermal expansion of the ocean caused by warming water and melting of glaciers and polar caps which promotes the addition of water to the oceans (Cazenave and Cozannet 2014; IPCC 2014; Frederikse et al. 2020). As a result, global mean sea level has risen at a rate of ~3 ± 0.04 mm/year since 1993 (Nerem et al. 2018). On the Mexican Atlantic coast, this rate is similar to the global trend,
1 Red de Ecología Funcional, Instituto de Ecología, A.C., Carretera antigua a Coatepec 351, El Haya C. P. 91073, Xalapa, Veracruz, Mexico
between 1.8 mm/year in Alvarado, Veracruz, and up to 3.6 mm/year in Isla Mujeres, Quintana Roo (Zavala-Hidalgo et al. 2011; Ruiz-Ramírez et al. 2014).
Coastal wetlands are particularly vulnerable to changes in sea level rise because they are closely linked with it - they are transition zones between the terrestrial environment and the marine aquatic environment. According to Reed et al. (2020), there are three main mechanisms through which sea level rise causes the degradation and/ or loss of coastal wetlands: 1) wetland edge erosion when adjacent to major water bodies (such as rivers and lagoons), 2) increase in salinity level leading to physiological stress (mainly in freshwater wetland species), and 3) temporal and spatial increase in flooding, which causes tolerance thresholds to be exceeded in various species. The continued rise in sea level will lead to changes in hydrology, increasing seawater intrusion, rising water levels, and salinity in coastal wetlands (Li and Pennings 2018).
It is essential to increase our knowledge of the impact of sea level rise on coastal wetlands. In this paper, we combine the information generated over several years with some results from our studies - the first results for freshwater coastal wetlands in Mexico. We have identified the potentially floodable coastal wetlands in the Mexican Atlantic coast (Sánchez-García et al. 2023). To explore with a major detail, we chose La Mancha lagoon, a coastal lagoon surrounded by mangroves and freshwater wetlands - part of La Mancha y El Llano Ramsar site on the central coast of Veracruz, in the Gulf of Mexico. In this site, we tested seed germination of various freshwater marsh species (SánchezGarcía et al. 2017) and seedling establishment of a freshwater tree species (Sánchez-García et al. 2022).
MATERIALS AND METHODS
Study Area
The study area is the Mexican coast of the Gulf of Mexico and the Caribbean Sea (Figure 1A). The wetlands of the Gulf of Mexico receive freshwater from the Sierra Madre Oriental range (Sánchez-Higueredo et al. 2020), and also rainwater filtered from nearby extensive dune system coastal waters (Yetter 2004) and seawater from tides and coastal lagoons. The wetlands along the Caribbean Sea and on the Yucatan Peninsula are established on an oligotrophic karstic landscape with a highly permeable carbonate substrate and a complex subsurface hydrologic system that transports freshwater to the coast, where it mixes with seawater (Bauer-Gottwein et al. 2011), there are no rivers. Coastal wetlands are affected by the mixture of freshwater and seawater that creates a flood and salinity gradient producing a mosaic or zonation of wetland types (Lara-Lara et al. 2008; Infante-Mata et al. 2011; López-Rosas and MorenoCasasola 2022). The mangroves are exposed to the highest salinity level (15–25 parts per thousand) because they are in contact with the sea, and the tides greatly influence the flood level. Typically, behind mangroves, “tulares” (cattail
marshes) occur in areas exposed to lower salinity (2-4 parts per thousand) with less tidal influence and with the major water level from freshwater of the inland. Behind them, the “popales” (broadleaf freshwater marshes) are establishedfreshwater wetlands (salinity: 0–2 parts per thousand) with a high water level with little movement, leading to a high deposition of sediments. Further inland, freshwater swamps (salinity: 0–2 parts per thousand) are distributed mainly in the vicinity of coastal lagoons and on floodplains. Finally, the most landward of the coastal wetlands are palm groves dominated by freshwater flooded for shortest duration and have the shallowest depth (Moreno-Casasola and InfanteMata 2010). Other types of wetlands are not so widely distributed. In Madre Lagoon, north of Mexico, there are areas covered by halophilic hydrophilic vegetation with very high salinities. In the Yucatan Peninsula, dwarf mangroves are found in high salinity areas, and in coastal areas where freshwater emerges from the karstic platform, petenes or hammocks are formed. This is a type of mangrove with two different communities in structure and function: in the area with the freshwater spring, trees are higher and mangrove species mix with tropical forest species. The surrounding
Note: CICOLMA is the La Mancha Coastal Research Center (Centro de Investigaciones Costeras La Mancha; noted as green points). It is worth noting that sometimes the gradient in the schematic drawing (1B) is interrupted by changes in land use, i.e., converted into flooded pastures, interrupted by roads, etc.
Figure 1. Location of study area and schematic showing the variety of wetland habitats in the area: A) Location of the Mexican states on the Atlantic Coast, B) The variety of contiguous coastal wetlands from the sea to inland, and C) aerial view of La Mancha lagoon, part of the La Mancha y El Llano Ramsar site 1336.
mangrove is stressed by salinity, and trees are smaller, and one or two mangrove species dominated. Mexican wetlands are described by Moreno-Casasola et al. (2012).
We carried out experiments using La Mancha’s wetlands as a case study. This site is located approximately 60 km north of the city of Veracruz, in the municipality of Actopan (between 19°40’33” and 19°31’49”N, and between 96°24’48” and 96° 22’ 25’’W; Figure 1C). The most characteristic community is the mangrove swamp dominated by Rhizophora mangle, Avicennia germinans, and Laguncularia racemosa. The freshwater swamp is dominated by Annona glabra, with the presence of individuals of Salix humboldtiana and Pachira aquatica. The “popal” is a broadleaved freshwater marsh community dominated by Sagittaria lancifolia, Hymenocallis littoralis, and Pontederia sagittata. The “tular” is cattail marsh dominated by Typha domingensis (Moreno-Casasola 2003).
Synthetic Model for Identifying Potentially Floodable Zones
To identify potentially floodable zones, we applied a bathtub inundation model with a Digital Elevation Model (DEM) based on Shuttle Radar Topography Mission (SRTM) images at 30-meter spatial resolution. Two elevation layers of one and two meters were extracted from the DEM to identify potentially floodable zones due to sea level rise. Two crucial aspects were considered to avoid overestimating the potentially floodable zones. First, all existing bodies of water within these zones were not included in the analysis because, at present, it is a floodable zone. Second, also excluded were zones that did not have a hydrographic connection with the sea since they did not have a tidal flood pathway (Li et al. 2009). All data processing and analyses were conducted using ArcMap 10.8 software (ESRI 2019).
To develop the model, we used three information layers: altitude of the land, water bodies, and wetland
Information layer
Altitude data
Water bodies
Vegetation and type of land use
Vegetation and type of land use
vegetation (Table 1). The information from “Manglares de México 2020” (Velázquez-Salazar et al. 2021) and the “Carta de Uso del Suelo y Vegetación Serie VI” (INEGI, 2017) were merged to create a new layer of wetland vegetation. It is essential to mention that the scale differs between both sources (1:50,000 and 1:250,000, respectively). Therefore, we used “Manglares de México 2020” as a base for merging both information sources.
Popal Seed Germination Experiment
Mature seeds of seven popal species were collected at La Mancha from several adult individuals of T. domingensis, S. lancifolia, P. sagittata, Boehmeria cylindrica, Ludwigia octovalvis, Cyperus digitatus, and Fuirena simplex. The experimental design combined two factors that we considered would change with sea level rise: water level and degree of water salinity. Two water levels were used: Moist (water was added to the filter paper as necessary to keep the paper moist) and Flooded (filter paper was always kept saturated −thoroughly soaked, showing a film of water on top of the paper). Four levels of salinity were used: 0 parts per thousand (‰), 5‰, 10 ‰, and 15‰. Thus, the combination of the two factors resulted in eight treatments.
The experiment lasted four weeks. For each treatment, 25 seeds per Petri dish were sown with five replicates. The seeds were incubated in 90-mm diameter Petri dishes filled with sterilized sand as a substrate and one layer of Whatman No. 1 filter paper on top. An emerged radicle was the criterion for germination. The seed germination occurred in controlled germination chambers in the laboratory at 25 °C during 14 h of light and 20 °C during ten h of darkness. Germination was recorded every 48 hours, and germinated seeds were counted and removed from the dishes. Seed germination percentage was expressed as the mean ± S.E. One-way or two-way analysis of variance (ANOVA; P < 0.05) was used to compare the treatment effects (Sokal and
DEM from Shuttle Radar Topography Mission images
Hydrographic vectors of the Mexican Hydrological Regions
Vectors of vegetation and type of land use from Manglares de México 2020
Vectors of vegetation and type of land use from Carta de Uso del Suelo y Vegetación Serie VI
30 meters
1:250,000
1:50,000
1:250,000
Data source
United States Geological Survey (USGS)
Comisión Nacional del Agua (CONAGUA)
Comisión Nacional para el Uso y Conocimiento de la Biodiversidad (CONABIO)
Instituto Nacional de Geografia y Estadística (INEGI)
Table 1. Data sources for the three layers of information used in the synthetic model.
Rohlf 1995). When ANOVA detected significant effects, Tukey’s test determined significant differences among the treatments. Nested ANOVAs were used to show how the germination of the species differed between water level and salinity. The proportion of germinated seeds at the end of the experiment was calculated for each species and for each Petri dish. The effect of treatments on the germination proportion by species was compared using a Nested ANOVA’s and Tukey posthoc tests (P≤ 0.05). The salinity factor was nested within the water level factor. In order to meet the assumptions of parametric tests, the proportion of germination of all species was arcsine transformed. The species S. lancifolia presented many zero values, so no statistical analysis was made. Detailed descriptions of the methodology can be found in Sánchez-García et al. (2017). All analyses were performed with the statistic package PAST, v. 3.14 (Hammer et al. 2001).
Annona glabra Growth Seedlings Experiment
Annona glabra seedlings were obtained from germinated seeds. The A. glabra fruits were collected from trees of the surroundings of La Mancha lagoon (Figure 2A) and taken to a greenhouse at the Centro de Investigaciones Costeras La Mancha (CICOLMA) run by the INECOL. The seeds were placed in soil recollected from a popal in CICOLMA, in polyethylene greenhouse bags 25 cm high and 15 cm in diameter for growth. At the beginning of the experiment, the seedlings had an average height of 18.6 ± 1.6 cm. The experimental design combined the same two factors (water level and salinity). Three water levels were used: Saturation (all soil’s spaces are filled with water; for that purpose, the water was permanently kept 15 cm below the soil surface in the plastic bag), Flooded (the water level was permanently maintained at 10 cm above soil level), and Flood-Drought (for four weeks, the water level was 10 cm above the soil’s surface. After this time, the bags were removed from the water and allowed to drain until they lost the water due to
evapotranspiration and gravity, and later, for the next four weeks, the plant had no contact with the water). Three level of salinity were used: 0‰, 5‰, and 15‰. Thus, the combination of the two factors resulted in nine treatments.
The experiment lasted 18 weeks. For the experiment, five seedlings were randomly assigned to each treatment. Four fiberglass tubs (130 cm long × 60 cm wide × 70 cm high) were used to apply the treatments in the greenhouse. Three tubs were filled with tap water at a constant level of 55 cm. Each of these tubs had a different salinity: 0‰, 5‰, and 15‰. Instant Ocean artificial salt (Aquarium Systems) was used to achieve salinity levels. PVC tubes of two heights (45 and 20 cm) were placed inside the tubs to obtain the different water levels. On the top for each PVC tube, we put a polyethylene bag with a seedling (Figure 2B). The seedlings were subjected a Saturation (water level kept at 15 cm below the soil surface) and Flooded conditions (water level kept at 10 cm above the soil surface). The fourth tub had no water. This is where the seedlings of the Flood-Drought treatments were placed during the weeks they did not have contact with the water. The seedlings were monitored and measured every two weeks: percent seedling survival and height. Throughout the experiment, when a seedling died, it was removed from the tub, and its height was measured. The effect of the different treatments on the seedlings’ growth (change in height) was evaluated by fitting a Linear Mixed Model (LMM). In our model, height (the difference between the final and initial value for each seedling) was specified as the response variable, water level, and salinity as fixed effects factors, and plant as a random-effects factor (to control for the measurements to which they were subjected through time), and time as a continuous random-effects variable (Crawley 2013). The water level was specified as nested in salinity. Detailed methodology can be found in Sánchez-García et al. (2022). All analyses were run in R software, version 3.6.1 (Team R Core 2019).
Figure 2. Annona glabra seedling experiment. A) Annona glabra trees, B) Polyethylene bag with Annona glabra seedling under Saturation (water level kept at 15 cm from soil level) and Flooded (water level kept at 10 cm above from soil level) at the beginning of experiment.
3. Four central wetland regions with major surface potentially floodable coastal wetlands under scenarios of an increase of one meter of sea elevation were detected: A) Pantanos de Centla, Tabasco; B) Terminos lagoon, Campeche C) Petenes, Campeche; D) Sian Ka’an, Quintana Roo. * Freshwater wetlands refer to all the other categories from Table 2.
RESULTS
Synthetic Model
We identified eight types of wetlands potentially affected (Table 2). Under a one-meter sea level rise scenario, a total area of 470,480 ha of potentially affected wetlands was recorded, where tulares (35.93%), mangroves (33.68%), and other types of wetlands (24.58%) would be the main types of wetlands affected. Under a two-meter increase in sea level, the potentially affected wetlands area increased to 720,902 ha. The main types of wetlands potentially affected would be the same as for the one-meter sea rise scenario: tulares (36.52%), mangroves (34.51%), and other types of wetlands (22.87%). The Grijalva-Usumacinta delta complex in Tabasco, the Terminos lagoon and the Petenes region in Campeche, the coast in Yucatan, and the bays of Sian Ka’an in Quintana Roo, were the primary areas with potentially affected wetlands by sea level rise under one and two meters scenarios (Figure 3).
Seed Germination
The salinity was the primary factor that affected the species’ germination. The general pattern found in most species was lower germination due to increased salinity levels, as expected. However, we recorded salinitytolerant species, such a C. digitatus, L. octovalvis, T. domingensis, and the fruits of P. sagittata (Figure 4A). The germination percentages of these species were ≥ 18% in any treatment.
Table 2. Potentially affected wetlands under sea level rise scenarios of one and two meters. “Popal” is the common name for broadleaved freshwater marsh; “tular” is the local name for cattail marsh.
Type of wetland Area potentially affected (ha) with one-meter sea level increase (% of the total)
157,755.68 (33.531)
(0.155)
Area potentially affected (ha) with two-meters sea level increase (% of the total)
(34.299)
(0.209)
(35.931) 263,310.99 (36.525)
Figure
Figure 4. Final germination percentages of seven popal species under moist and flooded conditions. We group the species into two groups according to their germination response to salinity and flooding: A) column with salinity and flooding tolerant species, and B) column with low germination species Data obtained under the four salinity levels are shown, with the germination mean values (%) ± SE. Values with a different letter are significantly different at P < 0.05. Modified from Sánchez-García et al. (2017).
Typha domingensis was the only species that showed no significant differences in germination among the different salinity treatments, and germination remained above 50%. It is worth noting that although it did not show significant differences in germination, the higher percentages were found in the treatment Flooded 5‰.
The water level factor had less impact on the germination results. Fuirena simplex, L. octovalvis and the seeds of P. sagittata showed better germination in Flooded treatments (Figure 4A). The treatment Moist 15‰ inhibited germination for F. simplex and P. sagittata seeds. On the other hand, some species like B. cylindrica and S. lancifolia, showed lower germination in all treatments (Figure 4B). The extreme treatments of 15‰ (Moist and Flooded) completely inhibited germination for seeds of S. lancifolia
Seedling Growth of Annona glabra
We recorded a 100% survival rate for the Annona glabra seedlings exposed to 0‰ salinity, whereas some seedlings died in all treatments exposed to 5 and 15‰. All the seedlings died when exposed to the Flood-Drought 15‰ treatment (Table 3). Overall, the growth of seedlings throughout the experiment was more significant in the treatment under conditions of Saturation and low salinity (0 and 5‰; Figure 5A,B). Seedling growth and final height were affected by salinity independent of the water level; the mean height of the 0‰ treatment (13.66 cm) was significantly different from the 15‰ treatment (2.75 cm; P = 0.03, Tukey test). However, there were no significant differences in height between the 5‰ treatment and any of the two salinity treatments (P = 0.27 for 0 vs 5‰; P = 0.35 for 5 vs 15‰, Tukey test). For water level, seedling growth was higher under the Saturation condition and lowest in the Flood-Drought treatments, although the difference was insignificant (P’s > 0.05). Seedlings under the treatments with 0‰ salinity (freshwater) had the most significant growth, while the seedlings subjected to the 15‰ salinity treatments grew the least (Figure 5C).
DISCUSSION
Our study found that the wetlands with the largest surface area of potentially floodable zones are mangroves and tulares. It is vital to specify that our synthetic model is a static model, and thus does not consider coastal dynamics taking place in the future. Therefore, there is not a projection. Rather, it reflects the current portion of wetlands that could be at risk, which can be interpreted as a threat indicator. Along the Mexican Atlantic coast’s landscape, it is common to find these wetlands close to one another, although land use change has caused fragmentation and the loss of natural connectivity. This vicinity can be seen in the four wetland regions with the largest surface area vulnerable to scenarios of increased sea level rise (Figure 1B). In coastal areas, wetlands are often contiguous and form spatial gradients where flood level and salinity fluctuate (Moreno-Casasola et al. 2017; López-Rosas and Moreno-
Table 3. Number of Annona glabra seedlings at the beginning and end of the experiment and percent survival of seedlings under the different water level and salinity treatments
Treatment
of seedlings at the beginning
Figure 5. Mean increase in height (cm) ± SE of A. glabra seedlings under different treatments over the time: A) 0‰ salinity treatments; B) 5‰ salinity treatments; and C) 15‰ salinity treatments. Modified from Sánchez-García et al. (2022). Note: Sat = Saturation; Fl = Flooded; Fl-Dr = Flood-Drought.
Casasola 2022). The mangroves are particularly vulnerable to sea level rise due to their proximity to the sea and location in intertidal environments (McLeod and Salm 2006). The results obtained in our synthetic model indicate that 24.6 and 38.6% of the mangroves in the Mexican Atlantic could be potentially floodable zones under scenarios of sea level rise of one and two meters, respectively. This means that flooding would be permanent and could alter water level fluctuations and salinity, affecting severely these wetlands.
Given these scenarios, the wetlands responses, specifically of mangroves, could be three: 1) vertical growth, 2) lateral migration, and/or 3) degradation and loss. The plants contribute to vertical growth or accretion in two ways: indirectly by slowing water flow and turbulence, trapping and binding mineral sediment, and directly across production and accumulation of organic matter, primarily plant roots and rhizomes (Cahoon et al. 2021). Suppose the acceleration rate of sea level rise exceeds the capacity of the wetlands to maintain optimum vertical position within the tidal frame. In that case, the lateral migration is the only possible option. The mangroves could migrate inland as supratidal areas landward of the current mangrove extent become increasingly intertidal and suitable for mangrove colonization, which allows them some adaptation under rising sea levels (Friess et al. 2022). However, the migration of the mangroves would cause the displacement of tulares and other freshwater wetlands, such as popales, freshwater swamps, and palm groves. López-Rosas et al. (2021) have reported this taking place in Pantanos de Centla Biosphere Reserve. The increase in salinity caused the inland migration of mangroves; the tulares died, and Laguncularia racemosa (white mangrove) took its place. Nevertheless, landward rigid coastal developments and topographical barriers could prevent the migration of mangroves and wetlands in many areas, for example, in the northern Gulf of Mexico (Borchert et al. 2018), leading to potentially extensive losses in areal extent because of coastal oppression (Enwright et al. 2015). Finally, if wetlands fail to adapt through vertical growth or lateral migration, they will begin to degrade due to rising water levels and salinity. The degradation and plant mortality will cause submersion of surfaces, and the substrate will begin to break up as peat collapses (Carrasco et al. 2016; Andres et al. 2019).
CONCLUSION
We found that the increase in water level and salinity directly affected the germination of seeds of freshwater wetlands and the seedling survival of A. glabra from freshwater swamps. In both cases, salinity turned out to be the most stressful factor. Soil salinity is a crucial factor in the early stages of development for many coastal wetland species. Studies have shown that a prolonged period of soil salinization changes species composition, reduces species richness, and diminishes biomass in different types of wet-
lands (Sharpe and Baldwin 2012; Li and Pennings 2018, 2019; Buffington et al. 2020). Ongoing sea level rise alters wetland hydrology over time, resulting in increased saline water incursion into previously freshwater marshes (Li and Pennings 2018). Our results show that a combination of rises in water level and salinity will cause a decrease or even impede the germination of dominant species of popales, such as Pontederia sagittata and that seedling establishment of dominant species of freshwater swamps, such as A. glabra could be negatively affected. The A. glabra swamps are established in depressions of interdune lagoons and rivers or streams with slow water flow and no abrupt floodlevel changes. Sexual reproduction and seedling establishment are synchronized with the rainy and dry seasons, and the seedlings establish when the flood level drops and the soils remain moist (Infante-Mata and Moreno-Casasola 2005; Infante-Mata et al. 2019). Therefore, the higher growth under water-saturated soil conditions observed in our study reflects the adaptations of A. glabra to the natural conditions of the environment where it has developed. The increase in water level and salinity in freshwater wetlands from the Gulf of Mexico will increase the pressure on the existing vegetation since sexual reproduction (seeds and seedlings) will be difficult for most species. Further, it has been observed that under higher salinities, plants may produce fewer reproductive structures, such as flowers or stolons (Buffington et al. 2020), which could exacerbate the regeneration issue for these wetlands. Both flooding and salinity have a more significant inhibitory effect on seedling regeneration of the species of freshwater systems than in brackish or salt wetlands, which suggests that sea level rise is likely to have more significant adverse effects on the regeneration of freshwater than salt wetlands (Middleton 2009). The outcome of the scenarios we modeled lead us to conclude that coastal wetlands along the Mexican Atlantic coast will probably be poorer in species composition, with accompanying changes in their functions and extent.
ACKNOWLEDGEMENTS
E.A.S.G. acknowledges the master and doctoral scholarship provided by the Mexican Consejo Nacional de Humanidades Ciencias y Tecnologías (723842 and 779009) and the Doctoral Program of the Instituto de Ecología, A.C. We thank the Instituto de Ecología, A.C. for financial, support, and CICOLMA for providing the space and resources needed to carry out seedling growth experiment. The authors are grateful to Kerenha Hernández for her support in the design of Figure 1B, and to Ecoguías La Mancha en Movimiento for their support during field work.
REFERENCES
Andres, K., M. Savarese, B. Bovard, and M. Parsons. 2019. Coastal wetland geomorphic and vegetative change: Effects of sea-level rise and water management on brackish marshes. Estuaries and Coasts 42:1308–1327. https://doi.org/10.3389/fenvs.2019.00025
Bauer-Gottwein, P., B.R.N. Gondwe, G. Charvet, L.E. Marín, M. Rebolledo-Vieyra, and G. Merediz-Alonso. 2011. Review: The Yucatán Peninsula karst aquifer, Mexico. Hydrogeology Journal 19:507–524. https://doi.org/10.1007/s10040-010-0699-5
Borchert, S.M., M.J. Osland, N.M. Enwright, and K.T. Griffith. 2018. Coastal wetland adaptation to sea level rise: Quantifying potential for landward migration and coastal squeeze. Journal of Applied Ecology 55:2876–2887. https://doi.org/10.1111/1365-2664.13169
Buffington, K.J., A.C. Goodman, C.M. Freeman, and K.M. Thorne. 2020. Testing the interactive effects of flooding and salinity on tidal marsh plant productivity. Aquatic Botany 164:103231. https://doi. org/10.1016/j.aquabot.2020.103231
Cahoon, D.R., K.L. McKee, and J.T. Morris. 2021. How plants influence resilience of salt marsh and mangrove wetlands to sea-level rise. Estuaries and Coasts 44:883–898. https://doi.org/10.1007/s12237-02000834-w
Carrasco, A.R., O. Ferreira, and D. Roelvink. 2016. Coastal lagoons and rising sea level: A review. Earth-Science Reviews 154:356–368. https:// doi.org/10.1016/j.earscirev.2015.11.007
Cazenave, A., and G. Le Cozannet. 2014. Sea level rise and its coastal impacts. Earth’s Future 2:15–34. https://doi.org/10.1002/2013EF000188
Crawley, M.J. 2013. The R book. Second edition. Wiley & Sons, Chichester, United Kingdom. 1051 pp.
Enwright, N.M., K.T. Griffith, and M.J. Osland. 2015. Incorporating future change into current conservation planning: evaluating tidal saline wetland migration along the U.S. Gulf of Mexico coast under alternative sea-level rise and urbanization scenarios. U.S. Geological Survey Data Series 969. https://doi.org/10.3133/ds969
ESRI. 2019. ArcGIS Desktop 10.8. Environmental Systems Research Institute, Redlands, USA.
Frederikse, T., F. Landerer, L. Caron, S. Adhikari, D. Parkes, V. W. Humphrey, S. Dangendorf, P. Hogarth, L. Zanna, L. Cheng, and Y.H. Wu. 2020. The causes of sea-level rise since 1900. Nature 584:393–397. https://doi.org/10.1038/s41586-020-2591-3
Friess, D.A., M.F. Adame, J.B. Adams, and C.E. Lovelock. 2022. Mangrove forests under climate change in a 2°C world. Wiley Interdisciplinary Reviews: Climate Change 13:1–15. https://doi.org/10.1002/wcc.792
Hammer, Ø., D.A.T. Harper, and P.D. Ryan. 2001. Past: Paleontogical statistics software packge for education and data analysis. Paleontologia Electronica 4:4–9.
INEGI. 2017. Conjunto de datos vectoriales de Uso del Suelo y Vegetación Escala 1:250 000, Serie VI.
Infante-Mata, D., and P. Moreno-Casasola. 2005. Effect of in situ storage, light, and moisture on the germination of two wetland tropical trees. Aquatic Botany 83:206–218. https://doi.org/10.1016/j. aquabot.2005.06.009
Infante-Mata, D., P. Moreno-Casasola, C. Madero-Vega, G. CastilloCampos, and B.G. Warner. 2011. Floristic composition and soil characteristics of tropical freshwater forested wetlands of Veracruz on the coastal plain of the Gulf of Mexico. Forest Ecology and Management 262:1514–1531. https://doi.org/10.1016/j.foreco.2011.06.053
Infante-Mata, D., P. Moreno-Casasola, T. Valverde, and S. Maza-Villalobos. 2019. Effects of soil flooding, sunlight and herbivory on seedlings of Annona glabra and Pachira aquatica in a tropical swamp. Wetlands Ecology and Management 27:539–551. https://doi.org/10.1007/s11273019-09676-1
IPCC. 2014. Summary for policymakers. Page Climate Change 2014: synthesis report. contribution of working groups I, II and III to the fifth assessment report of the Intergovernmental Panel on Climate Change. Geneva, Switzerland. 151 pp. https://doi.org/10.1017/ CBO9781139177245.003
IPCC. 2021. Climate Change 2021: The physical science basis. Contribution of working group I to the sixth sssessment report of the Intergovernmental Panel on Climate Change. Page (V. Masson-Delmotte, P. Zhai, A. Pirani, S. L. Connors, C. Péan, Y. Chen, L. Goldfarb, M. I. Gomis, J. B. R. Matthews, S. Berger, M. Huang, O. Yelekçi, R. Yu, B. Zhou, E. Lonnoy, T. K. Maycock, T. Waterfield, K. Leitzell, and N. Caud, Eds.). Cambridge University Press, Cambridge, United Kingdom and New York, NY, USA. 2391 pp. ttps://doi.org/10.1017/9781009157896
Lara-Lara, J.R., J.A. Arreola-Lizárraga, L.E. Calderón-Aguilera, V.F. Camacho-Ibar, G. de la Lanza-Espino, A. Escofet-Giansone, I. EspejelCarbajal, M. Guzmán-Arroyo, L.B. Ladah, M. López-Hernández, E.A. Meling-López, P. Moreno-Casasola Barceló, H. Reyes-Bonilla, E. Ríos-Jara, and J.A. Zertuche-González. 2008. Los ecosistemas costeros, insulares y epicontinentales. In: J. Soberón, G. Halfter, and J. LlorenteBousquets (eds). Capital natural de México. Vol. 1.: Conocimiento actual de la biodiversidad. CONABIO, México. Comisión Nacional para el Conocimiento y Uso de la Biodiversidad, México, D.F. 109-134 pp.
Li, F., and S.C. Pennings. 2018. Responses of tidal freshwater and brackish marsh macrophytes to pulses of saline water simulating sea level rise and reduced discharge. Wetlands 38:885–891. https://doi.org/10.1007/ s13157-018-1037-2
Li, F., and S.C. Pennings. 2019. Response and recovery of low-salinity marsh plant communities to presses and pulses of elevated salinity. Estuaries and Coasts 42:708–718. https://doi.org/10.1007/s12237-01800490-1
Li, X., R.J. Rowley, J.C. Kostelnick, D. Braaten, J. Meisel, and K. Hulbutta. 2009. GIS analysis of global impacts from sea level rise. Photogrammetric Engineering and Remote Sensing 75:807–818. https://doi. org/10.14358/PERS.75.7.807
López-Rosas, H., V.E. Espejel-González, and P. Moreno-Casasola. 2021. Variaciones espacio-temporales del nivel y salinidad del agua afectan la composición de especies del manglar-tular. Ecosistemas y Recursos Agropecuarios 8:1–21.
López-Rosas, H., and P. Moreno-Casasola. 2022. From marsh to swamps : vegetation gradient linked to estuarine hydrology. Wetland Science & Practice 40:26–35.
McLeod, E., and R.V Salm. 2006. Managing mangroves for resilience to climate change. IUCN, Gland, Switzerland. 64pp.
Middleton, B.A. 2009. Regeneration of coastal marsh vegetation impacted by hurricanes Katrina and Rita. Wetlands 29:54–65. https://doi. org/10.1672/08-18.1
Moreno-Casasola, P. 2003. Ficha informativa de los humedales de Ramsar. La Mancha y El Llano. 11 pp.
Moreno-Casasola, P., and D. Infante-Mata. 2010. Veracruz. Tierra de ciénagas y pantanos. Gobierno del Estado de Veracruz para la Conmemoración de la Independencia Nacional y de la Revolución MexicanaUniversidad Veracruzana., Xalapa, Veracruz. 411 pp.
Moreno-Casasola, P., D. Infante-Mata, and H. López-Rosas. 2012. Tropical freshwater swamps and marshes. In: Batzer DP, Baldwin AH (eds) Wetlands habitats of North America: ecology and conservation concerns. University of California Press, California. 267–282 pp.
Moreno-Casasola, P., M.E. Hernández, and A. Campos. 2017. Hydrology, soil carbon sequestration and water retention along a coastal wetland gradient in the Alvarado Lagoon System, Veracruz, Mexico. Journal of Coastal Research 77:104–115. https://doi.org/10.2112/SI77-011.1
Nerem, R.S., B.D. Beckley, J.T. Fasullo, B.D. Hamlington, D. Masters, and G.T. Mitchum. 2018. Climate-change–driven accelerated sea-level rise detected in the altimeter era. Proceedings of the National Academy of Sciences of the United States of America 115:2022–2025. https://doi. org/10.1073/pnas.171731211
Reed, D., Y. Wang, E. Meselhe, and E. White. 2020. Modeling wetland transitions and loss in coastal Louisiana under scenarios of future relative sea-level rise. Geomorphology 352:106991. https://doi. org/10.1016/j.geomorph.2019.106991
Ruiz-Ramírez, J.D., J.I. Euán-Ávila, and E. Torres-Irineo. 2014. Tendencias del nivel del mar en las costas del Caribe mexicano. European Scientific Journal 10:86–96.
Sánchez-García, E.A., K. Rodríguez-Medina, and P. Moreno-Casasola. 2017. Effects of soil saturation and salinity on seed germination in seven freshwater marsh species from the tropical coast of the Gulf of Mexico. Aquatic Botany 140:4–12. https://doi.org/10.1016/j.aquabot.2017.04.002
Sánchez-García, E.A., H. López-Rosas, V.J. Sosa, R. Lindig-Cisneros, and P. Moreno-Casasola. 2022. Effect of water level and salinity on the growth of Annona glabra L. seedlings. Wetlands Ecology and Management 30:579–593. https://doi.org/10.1007/s11273-022-09884-2
Sánchez-García, E.A., C. Yañez-Arenas, R. Lindig-Cisneros, A. LiraNoriega, R. Monroy Ibarra, and P. Moreno-Casasola. 2023. The expected impacts of sea level on the Mexican Atlantic coast. Science of the Total Environment 903:1–12. https://doi.org/10.1016/j.scitotenv.2023.166317
Sánchez-Higueredo, L.E., J.A. Ramos-Leal, J. Morán-Ramírez, P. Moreno-Casasola, U. Rodríguez-Robles, and M.E. Hernández. 2020. Ecohydrogeochemical functioning of coastal freshwater herbaceous wetlands in the Protected Natural Area, Ciénaga del Fuerte (American tropics): Spatiotemporal behaviour. Ecohydrology 13:1–13. https://doi. org/10.1002/eco.2173
Sharpe, P.J., and A.H. Baldwin. 2012. Tidal marsh plant community response to sea-level rise: A mesocosm study. Aquatic Botany 101:34–40. https://doi.org/10.1016/j.aquabot.2012.03.015
Sokal, R.R., and F.J. Rohlf. 1995. Biometry. The principles and practice of statistics in biological research. 3°. W. H. Freeman and company, New York. 850 pp.
Team R Core, R.F. for S.C. 2019. R: A Language and Environment for Statistical Computing. Vienna, Austria. Velázquez-Salazar, S. Rodríguez-Zúñiga, M.T. Alcántara-Maya, J.A.E. Villeda-Chávez, C. Valderrama-Landeros, L. Troche-Souza, B. VázquezBalderas, I. Pérez-Espinosa, M.I. Cruz-López, R. Ressl, D.V.G. De la Borbolla, O. Paz, V. Aguilar-Sierra, F. Hruby, and J.H. Muñoa-Coutiño. 2021. Manglares de México. Actualización y análisis de los datos 2020. Comisión Nacional para el Conocimiento y Uso de la Biodiversidad, Ciudad de México. 166 pp.
Yetter, J. 2004. Hydrology and geochemistry of freshwater wetlands on the Gulf coast of Veracruz, Mexico. Masther’s Thesis.University Waterloo. Ontario, Canada. 168 pp.
Zavala-Hidalgo, J.R., R. de Buen-Kalman, R. Romero-Centeno, and F. Hernández-Maguey. 2011. Tendencias del nivel del mar en la costas mexicanas. In. Botello A. V., S. Villanueva-Fragoso, J. Gutiérrez, and J. L. Rojas Galaviz, (eds). Vulnerabilidad de las zonas costeras mexicanas ante el cambio climático. SEMARNAT-INE, UNAM-ICMyL, Universidad Autónoma de Campeche. 249-268 pp.
“If the mangroves disappear, so will San Crisanto — that’s how big the risk is”: Wetlands of a
Coastal Lagoon Ecosystem and Local Adaptation to Climate Change
Marijose Casares González1,3, María Teresa Castillo Burguete2, Libertad Chavez-Rodriguez4, and Miguel A. Munguía-Rosas3
ABSTRACT
The Yucatan coast (Mexico) contains Ramsar sites of socioecological importance, but also faces problems, such as hurricanes, that increase its vulnerability. The frequency and magnitude of these threats increased, partly due to climate change, necessitating strengthened local adaptation strategies that incorporate the socioecological context and needs of wetland inhabitants. Thus, this study’s objective was to analyze responses to climate change by members of the port town San Crisanto (Yucatan) to learn about their perceptions and the actions they take when faced with hurricanes and their impacts. The study used a qualitative phenomenological methodology, working with 23 participants who witnessed three intense hydrometeorological events. As an ejido (unit of communal land tenure) in possession of land and resources, its members maintain the mangroves and manage them as a strategy of Ecosystem-based Adaptation (EbA). They support their actions with local socioecological knowledge of their territory and place-based attachment to the lagoon ecosystem that provides their livelihoods, but there also persist several practices requiring attention, such as filling floodable areas with waste, which damages the local population and ecosystem. We conclude that the ejido collective is relevant to ecosystem protection and recommend that EbA strategies be documented and strengthened in order to tend to the human population and the wetlands themselves in the face of climate change.
RESUMEN
La costa de Yucatán (México) tiene sitios Ramsar de importancia socioecológica, pero también enfrenta problemas, como los huracanes, que incrementan su vulnerabilidad. La frecuencia y magnitud de estas amenazas aumentó, en parte por el cambio climático, siendo necesario fortalecer estrategias locales de adaptación que incorporen el contexto socioecológico y las necesidades de los habitantes que viven de los humedales. Por ello el objetivo del estudio fue analizar las respuestas de miembros del puerto de San Crisanto (Yucatán) ante el cambio climático, para conocer sus percepciones y acciones ante los huracanes y
su impacto. En el estudio se usó una metodología cualitativa fenomenológica, trabajando con 23 participantes que vivieron tres eventos hidrometeorológicos intensos. Un ejido detenta la tierra y sus recursos, sus miembros manejan los manglares con una estrategia de Adaptación basada en Ecosistemas (AbE) y los conservan. Sustentan sus acciones en el conocimiento socioecológico de su territorio, apego al lugar y al ecosistema lagunar del cual obtienen sus medios de vida, pero persisten prácticas que deben atenderse; como el relleno con basura en zonas inundables, que vulnera a la población y el ecosistema. Concluimos que el colectivo ejidal es relevante para proteger los ecosistemas, siendo recomendable documentar y fortalecer las estrategias de AbE para atender a la población y humedales ante el cambio climático.
INTRODUCTION
The State of Yucatan lies in the northern part of Mexico’s Yucatan Peninsula, and with a surface area of 39,540 km2, it constitutes, along with Campeche and Quintana Roo, a great flatland geologically composed of mainly limestone rock from the Tertiary Period (García and Graniel 2010). Water is a notably essential component of this region due to its unique presentation in spaces and landscapes. The territory’s highly permeable karstic ground induces rapid filtration of rainwater into the subsoil, recharging the great interconnected subterranean aquifer that serves as the main water source for the region’s population, given the absence of superficial sources of fresh running water (García and Graniel 2010).
These subterranean waters are connected to coastal lagoons, seagrasses, and coral reefs (Morales-Ojeda et al. 2021), making the coast another vital hydro-social space for residents’ livelihoods. Extending approximately 378 km in length and bound by the Gulf of Mexico to the north, the peninsula’s coastline primarily contains barrier beaches and flooding lagoons, as well as shallow bays with visible saltwater intrusion (García and Graniel 2010). This region’s wetlands are composed of marine ecosystems, marshes, and estuaries where complex interactions exist between hydrological elements, soils, and organisms (Ramsar 2016). Included among its vegetation areas are “petenes” - islands of mangroves or tropical semideciduous forest, “tasistals” - seasonally inundated savannahs of tasiste palms (Guadarrama et al. 2018), coastal dune scrub thickets, and marine angiosperms - seagrass (Durán et al. 2014). There are also significant extensions of mangrove forests containing the four most predominant species in Mexico: Red Mangrove (Rhizophora mangle), Black Mangrove (Avicennia germinans), White Mangrove (Laguncularia racemosa), and
1 Universidad Autónoma de Querétaro, C.U. Cerro de las Campanas s/n, C.P. 76010, Querétaro, Querétaro, México.
2 Corresponding author contact: maria.castillo@cinvestav.mx, Cinvestav-Unidad Mérida, Departamento de Ecología Humana. Antigua carretera a Progreso km 6, C. P. 97310, Mérida, Yucatán, México.
3 Cinvestav-Unidad Mérida, Departamento de Ecología Humana. Antigua carretera a Progreso km 6, C. P. 97310, Mérida, Yucatán, México.
4 CIESAS Noreste, Prolongación José María Morelos, 822. C.P. 64000. Nuevo León, Monterrey, México.
Buttonwood (Conocarpus erectus). These environments are important due to their provision of different ecosystem services, such as coastal protection in the face of extreme hydrometeorological events and soil retention. Hence, three sites within this territory were declared as Wetlands of International Importance under the Ramsar Convention: Dzilam State Reserve (to the east; with 61,706.8 ha, declared in 2000); El Palmar State Reserve (to the west; with 50,177.4 ha, declared in 2003); and the Marsh and Mangroves of the North Coast of Yucatan State Reserve (MMNCYSR) (covering an area of 54,776.7 ha, declared in 2022).
The relevance of these wetlands is also related to the historical development of regional socioeconomic activities, because before 1950, the coast was sparsely inhabited, and its residents lived primarily off of subsistence fishing and inland activities such as agriculture and hunting (Fraga 2004). Another activity carried out since pre-Hispanic times is salt extraction in spaces locally referred to as ponds, located within estuaries. Salt is naturally produced when the level of seawater introduced into the ponds increases during the rainy season. The dissolved salt settles to the bottom, forming a layer called brine. In the dry season, direct sun evaporates the excess water, decanting salt to accumulate at the bottom of the pond in crystallized form (Guzmán-Noh and Gurrí 2021). These situations changed from the mid20th Century until the 1970s, since the region’s economic and social conditions propelled more settlement along the coast and led to further productive activities such as fishery of scaly fish (Salas et al. 2006) and sun and beach tourism, which incorporated the recreational use of sites such as natural springs, like those in El Corchito (Progreso, Yucatan), which forms part of the MMNCYSR (Paredes and Castillo 2018).
By settling in Yucatan’s coastal lagoon ecosystem and modifying its environment, human populations are exposed to the frequent impacts of extreme hydrometeorological phenomena. This region has the highest national landfall rates of Category 4 and 5 hurricanes (Appendini et al. 2019), which cause intense rain and flooding, cyclonic ocean swells, and strong winds. The impact of these natural events on the region are further magnified by human activities (e.g., accelerated and disorganized urban development, coastal erosion, and land use change), devastating large extensions of mangroves and increasing pollution of bodies of water (Herrera-Silveira et al. 2005). Inadequate residential and roadway infrastructure further limit local capacity to withstand these climate contingencies.
The Special Action Program Against Climate Change in Yucatan (PEACC in Spanish; 2018) reports that coast’s vulnerability might increase as of 2040, given predictions of more intense and frequent hydrometeorological phenomena. But already in 2020, the Atlantic Basin was the site of unprecedented events, namely the formation of 30 tropical storms, a record number of registered phenomena
in a single season that surpassed the 28 events recorded in 2005 (NOAA 2022). Tropical storm Amanda/Cristobal and Hurricanes Gamma, Delta, and Zeta produced flooding that was connected to 74% of the disaster declarations that year, with Veracruz, Chiapas, Tabasco, and the Yucatan Peninsula being the most affected areas in all of Mexico (CENAPRED 2021). This situation emphasizes the need to strengthen and construct adaptive measures that allow inhabitants to address the challenges stemming from climate change, taking into consideration the most vulnerable societies and ecosystems.
Mangrove ecosystems are allies in our efforts to mitigate the current and future effects of climate change, given that one of their primary ecosystem services is acting as a natural protective barrier, absorbing the impact of hurricanes normally experienced by human settlements (Herrera-Silveira et al. 2022). Similarly, research about adaptive measures in Mexican coastal localities indicate that their effective implementation is hindered by the prevalence of institutional and social difficulties. There exist several examples of strategies that demonstrate the historical importance of a culture of prevention, as characteristic of some societies, and of best practices based on local management and conservation projects in coastal wetlands (Escudero and Mendoza 2021). Hence, it is crucial to know the perceptions of and actions taken by local communities to tackle problems, given that the effects of global environmental change, including climate change, are particularly felt and perceived at the local level, and it is relevant to consider local experiences and their relationships with ecosystems (down-up approach) (Reid et al. 2009; Nash et al. 2019).
Given the significance of coastal wetlands for the livelihoods of local populations, and accounting for the socioenvironmental issues that increase the vulnerability of these coastal ecosystems and societies, our general objective was to analyze the development of local responses of adaptation to climate change undertaken by members of San Crisanto, in Yucatan, Mexico, by understanding their perceptions and actions when confronting the impacts of one of the region’s primary natural threats - hurricanes - and taking into consideration the particular characteristics of their coastal lagoon ecosystem.
STUDY AREA
San Crisanto (Figure 1) (21°21′08″N 89°10′18″W) is a port town belonging to the municipality of Sinanché, located in the Central Waterfront of Yucatan and within the Marsh and Mangroves of the North Coast of Yucatan State Reserve. According to the Index of Hydrometeorological Risks of the Coast of Yucatan (Orellana et al. 2014), this locality has a high probability of hurricane impact. Some of the strongest ones, measured on the Saffir-Simpson scale, have included Gilbert in 1988 (Category 5, which fractured the coastal highway and caused an inlet to open, joining the
sea and marshes in the near municipality of Yobain), and Isidore in 2002 (Category 3, which led to significant socioeconomic impacts across the region).
This town is home to 605 inhabitants (Inegi 2020). Included among their primary socioeconomic activities are fishing and tourism. San Crisanto also contains a homonymous ejido (unit of collective land tenure) because in 1956, 20 residents fought to obtain land as an ejido collective (1,472 ha), then securing these properties in 1992 due to reforms to Article 27 of the Mexican Constitution via the Program of Certification of Ejidal Agrarian Rights (Procede in Spanish) (Castillo-Burguete 2001). Currently, the ejido’s 35 members (ejidatarios) manage land tracts (Figure 2) of relevance to the community, such as salt ponds (20 ha), 850 hectares of mangrove forest with the four most predominant species in Mexico (Pérez 2012), and coconut palm groves (Cocus nucifera) (150 ha) where the Malayan
dwarf, tall Pacific, and hybrid varieties are cultivated and which are managed through volunteer work by ejido partners and payment of daily wages to their relatives and other community members. Regarding the management of ejido lands and the decision-making process involved, Pech (2010) described that every ejido member owns individual property titles and together manage common areas such as mangroves, salt ponds, and coconut groves, the bases for developing ejidatarios’ and community livelihoods. Ejidatarios elect representatives who serve as president for three years, analyzing and collectively deciding in assemblies about changes to and administration, management, or sale of ejido lands by voting on land management options. Ejidatarios monitor, care for, and manage the spaces that belong to them in an organized fashion and with a crew dedicated to cleaning and pruning plants in the coconut groves and cleaning the mangrove canals used for ecotour-
Figure 1. Location of the port town of San Crisanto on the northern part of the Yucatan Peninsula. (Source: Google Earth)
Figure 2. Land tracts managed by the ejido. (Source: Google Earth)
ism. They also manage resources and collaborate with international organizations and research centers through the creation of the San Crisanto Foundation civil association in 2000 (PNUD 2012).
The main challenges detected in relation to the management and care of these spaces are described by the history of the community and of the ejido itself. It is worth noting that before the creation of the ejido, inhabitants of San Crisanto freely used provision services such as mangrove wood in order to make charcoal, obtain firewood, and build houses. Ejidatarios mention that when they first began managing the lands, there was very little mangrove to speak of because of the inadequacy of management until then, so in the 1990s, they applied for permission from the Secretariat of Environment and Natural Resources to regulate their mangrove resource management (Pech 2010). The ecosystems weren’t in good condition; they noticed a paltry presence of birds and fish and poor hydrological flow through the mangroves. Flooding caused by the periodic impact of hurricanes and storms is another problem that damages homes, streets, and natural resources in the port. The most vulnerable areas are those closest to the swamp (Figure 3), where inhabitants of these dwellings fill the lagoon with debris and waste to get their houses on higher ground. Another area recurrently affected by hydrometeorological phenomena is that of the salt ponds. Salt is not regularly extracted because the ponds (Figure 4) are not in an optimal state for production. Given the constant flooding derived from the impact of hydrometeorological events (Pech 2010), the ponds are consistently muddied and their maintenance is costly. In addition to extracted salt being stored in warehouses, ejidatarios haven’t sold it because of competition from other vendors.
METHOD
This study was approached qualitatively, following the guidelines for phenomenological methodology based on
the philosophy of Edmund Husserl to understand subjects’ perspectives, their topics of interest, and the problems that surround them (Fuster 2019). The use of a non-probabilistic convenience sample informed a wider panorama of the experiences of San Crisanto’s inhabitants, and participants were selected with the criteria of being members of households that had lived through the impact of hurricanes Gilbert (1988), Isidore (2002), and the hydrometeorological events of 2020, and/or people who had occupied a government position or a leadership role in local ejidal organizations during the aforementioned events, in order to have more extensive points of reference for individuals’ history in the community. We conducted semi-structured interviews with 23 people (43% women and 57% men), asking what actions they take to handle the impact of hurricanes in their locality, about their perceptions regarding the risks posed by and changes to hydrometeorological events over the years, and their observations about the sites most vulnerable to the impacts of hurricanes where the primary actions of adaptation to climate change take place.
RESULTS AND DISCUSSION
Community perceptions and experiences in the face of hurricane impacts
Participants in this study have significant experiences that have shaped their perceptions and actions when facing hurricanes, a finding that coincides with observations by Chavez-Rodriguez (2016), reflecting on the construction of a collective memory with regards to taking on risks and disasters, comparable to Wilson (2013). These authors reported Gilbert (1988), Roxanne and Opal (1995), and Isidore (2002) as the most impactful hurricanes.
Since the impact of Hurricane Gilbert, participants identified flooding as one of the primary problems. Since 1995 when Hurricanes Opal and Roxanne flooded the port, ejidatarios decided to autonomously begin restoring mangroves’ hydrological flow, the first stage of which consisted
Figure 3. Swamp area of the lagoon where inhabitants tend to fill marshes with rubble, debris, and waste in order to build up land and situate their houses on higher ground. (Photo by Casares)
Figure 4. San Crisanto’s salt ponds flooded from the impact of tropical storms and hurricanes in 2020. (Photo by Casares)
of opening drainage canals between the swamp and the salt ponds to keep houses from flooding. Constructing canals within the mangrove forest helped fresh water from existing springs move to other areas and improve flow. Another project was the creation of Units of Environmental Management (UMA in Spanish, a place for alternative development compatible with conservation interests) for Morelet’s crocodiles (Crocodylus moreletii) and mangroves.
Nevertheless, in 2002, the path of Hurricane Isidore felled 90% of San Crisanto’s mangrove forest, and ejidatarios decided to communally clean and restore this space. The open canals were useful for having access to places where they could reforest with mangrove plants. Participants mentioned that the hurricane dispersed seeds, and mangrove varieties grew where there once were none. Maintenance in this context was grounded in local ecological knowledge transmitted by their families: they know how to clean, prune, and select the plants they extract without affecting the growth of other trees. This type of ecological knowledge is also reported in other cases, such as Savo et al. (2016).
Stemming from the ejido’s work to restore the mangroves, since 2002, they created and strengthened ecotourism projects to take advantage and make use of this space, as well as the coconut groves. In the mangrove forest, canals (Figure 5) were utilized as a means of transporting visitors on tours and being able to access natural springs (Figure 6) for recreational purposes. This activity is regulated, and ejidatarios base the number of tourists that can visit the mangrove on their prior experience: upon observing the initial ecotourism site, if they see any negative changes, they reduce the number of occupants, thus regulating the ecosystem’s carrying capacity (Castillo-Burguete et al. 2019).
Intergenerational community management and care of the mangroves, collaborative work with international organizations and educational institutions, and ejidal
organization led to members developing a “blue carbon” credit certification project in 650 ha of the mangrove forest beginning in 2011, through which they seek to obtain resources that will benefit the ejido and the community at large, allowing for long-term conservation of this ecosystem (Casares 2023). The Blue Carbon Project was initiated collaboratively between research centers, international associations like Climate Seeds, and the San Crisanto ejido, the first ejidal organization in Mexico to undertake a project of its type in coastal wetlands.
Given the uniqueness of the Blue Carbon Project, many challenges were presented. Participants from the ejido felt the biggest problems with this project were the lack of awareness and clarity with regards to Mexican laws dealing with wetlands and blue carbon. Likewise, there were no similar projects created by ejidal organizations in Mexico to serve as models, highlighting the need to consider the group’s own organizational structure. Data from technical studies and specialized techniques were needed to measure the mangroves’ capacity for carbon capture. Therefore, collaboration with research centers was essential to achieving blue carbon certification. In 2022, the certification was made official and agreements began in order to secure initial buyers, profiled only as “European companies” at the time this study was completed.
Even though participants had all experienced catastrophic hurricanes, they express that they haven’t considered emigrating from their locality because of the tranquility and safety they perceive there, as well as the proximity to their places of work out at sea and in mangrove forests. In the literature, this is defined as the relevance of placebased attachment, referring to the affective bond associated to the meaning that residents assign to their place of inhabitance, manifested through cognitions and emotions that facilitate closeness, as demonstrated in the case of Bukvic et al. (2022), also foreseen as topophilia by Tuan (1974) decades earlier. These aspects are important for studying
Figure 5. Mangrove canal in San Crisanto, used primarily for tourism. (Photo by Casares)
Figure 6. Natural springs in San Crisanto’s mangroves. (Photo by Casares)
risk perception and actions taken to handle those risks and for understanding people’s motivations and willingness to protect their environments or surrounding ecosystems (Pucker et al. 2022). Participants’ experiences have generated vast knowledge about how to face hurricanes from within households, given that the local population also acts in order to protect their houses and belongings, and to follow directions to opportunely evacuate the area when a hurricane is about to arrive, which coincides with other studies that draw attention to the fortification of this social and cultural capital of risk prevention (Audefroy et al. 2018; Malak et al. 2020).
Based on traditional ecological knowledge that ejidatarios have developed through their work in these spaces, and on the sense of belonging they have, given their placebased attachment, local people’s clarity on this subject is such that they express, “If the mangroves disappear, so will San Crisanto. That’s how big the risk is.” Their mangrove forests are not only unique because of their provision of services that are basic to their livelihood, but also because of their management under the ejidal communal land tenure system, one of the few like it in the country; this also allows ejidatarios to decide collectively and locally about how to protect and conserve this ecosystem.
Local measures of adaptation to climate change based in the area’s wetlands
Since flooding is one of the primary problems for the port town, inhabitants of the lands surrounding the marshes fill them with debris and waste so that their houses stand taller, thus diminishing the risk of flooding during the rainy hurricane season. This area is primarily inhabited by people of lower income in physically unstable houses; building up the ground with debris is a recurrent measure taken in various areas of the Yucatan coast where lower income folks see the marshes as “affordable” places to live. This measure reveals both the problem of inadequate access to housing and a lack of compliance with laws designed to protect
the marshes. The aforementioned coincides with MuñozSalazar et al. (2017), who point out that in some dynamics of spatial transformation in coastal areas, the state has not generated any processes that are truly inclusive of all people and that address adequate territorial regulations, which is one of the causes of the persistence of informal settlements and continued deterioration of wetlands. Additionally, we observed a contrasting action in the community: the construction of palafitte stilt-houses (Figure 7) to keep inhabitants safe from flooding. These prototypes are rectangular homes elevated above the ground with pilings, covering certain durability criteria to aptly withstand the effects of hydrometeorological events. These stilt-houses were constructed during participatory action research projects (Castillo-Burguete et al. 2008) initiated in the mid-1990s with community facilitators, accompanied by researchers from Cinvestav, Mérida Branch.
In relation to the measures carried out by the San Crisanto ejido, their actions can be included within the framework of strategies based on the use and management of natural resources, known as Ecosystem-based Adaptation (EbA) (UICN 2020). EbA actions within the ejido are conducted through ecosystem management, conservation, and recovery, primarily in the mangrove forest, with, for example, the Blue Carbon Project, the UMA for Morelet’s crocodiles (Crocodylus moreletii), and ecotourism activities. In this regard, Doswald et al. (2014) mentioned that one of the characteristics that strengthen the development of this type of strategy based on management, conservation, and recovery at a local level is the diversification of ecosystem-based practices like nature-based tourism, species conservation strategies, and blue carbon credit promotion that allow for a reduction in the local population’s environmental, social, and economic vulnerability, attending a variety of needs in addition to conserving biodiversity.
Another characteristic of the measures carried out by the ejido is related to community participation and relationships, which are indispensable for any project that promotes
Figure 7. Palafitte (Photo: Castillo 2002) after the impact of Hurricane Isidore and palafitte located in San Crisanto. (Photo by Casares)
the development of just and sustainable means for tackling socioenvironmental problems. This was visible in our study by way of participants’ knowledge of the socioenvironmental history of the ejido, which has consolidated community organizations that manage natural resources, also reported in part by Pech (2010).
With regards to the salt ponds, ejido members decided it wasn’t worth the effort to drain and clean them, due in part to the constant impact of hurricanes, but mainly to the fact that they were no longer competitively situated in that market. This coincides with findings by Guzmán-Noh and Gurrí (2021) who mention the recurrent impact of hurricanes as the primary cause of productive abandonment of these ponds in other areas along the coast.
Another important finding of our study is that there is little recognition of the other ecosystem services provided by these areas, such as protection and habitat for local and migratory bird life (Figures 8 and 9), a component that should be considered in comprehensive proposals of adaptive measures to climate change in this region.
CONCLUSION
In the process of fulfilling our general objective, it became clear that the wetlands located in San Crisanto are of vital importance for developing local means of adaptation to climate change and inhabitants’ livelihoods, primarily due to their relationship with the local economy and the use of the mangroves managed by the ejido. Place-based attachment to, understandings of, and local ecological knowledge about these ecosystems are important for their management, conservation, and protection. Ejidal organization has also been a relevant element for collective decision-making and follow-through of established agreements.
Strategic actions based in ecosystem management demonstrate the generation of collaborative processes for managing natural spaces, such as mangroves and the diversity of activities derived from them. Strengthening this type of strategy reveals itself as a means of protecting ecosystems
such as wetlands and carrying out actions sustainably. In the case of Mexico, lands managed under ejidal organization have been the most important and well-conserved.
Nevertheless, a critical analysis of other persistent actions in the locality, such as filling floodable land around the marsh with debris, is necessary, given that these actions perpetuate increased vulnerability of these spaces and their inhabitants. Similarly necessary is a land use ordinance that considers the relevance of these wetlands and the use and maintenance of salt ponds.
The experience shared is useful to fuel an explanation for the similarities and differences between adaptive actions and processes in response to climate change in other areas of the Yucatan coast, in places managed by ejidal organizations across the country, and spaces that demonstrate the relevance of coastal wetlands of the world for developing local livelihoods and wetland conservation. Likewise, we highlight the usefulness of phenomenological studies as an appropriate approach for identifying psychosocial aspects that influence adaptative measures and wetland conservation.
REFERENCES
Appendini, C.M., R. Meza-Padilla, S. Abud-Russell, S. Proust, R.E. Barrios, and F. Secaira-Fajardo. 2019. Effect of climate change over landfalling hurricanes at the Yucatán Peninsula. Climatic Change, 157(3-4): 469-482. doi:10.1007/s10584-019-02569-5
Audefroy, J. F., and B.N. Sánchez. 2018. Integrating local knowledge for climate change adaptation in Yucatán, Mexico. International Journal of Sustainable Built Environment, 6(1), 228-237. doi:10.1016/j. ijsbe.2017.03.007
Bukvic, A., A. Whittemore, J. Gonzales, and O. Wilhelmi. 2022. Understanding relocation in flood-prone coastal communities through the lens of place attachment. Applied Geography (Seven Oaks, England), 146(102758). 102758. https://doi.org/10.1016/j.apgeog.2022.10275
Casares González, M. 2023. Estrategias locales de adaptación al cambio climático de hogares y autoridades de San Crisanto, Yucatán. Master’s thesis. Graduate Program of Science Specialized in Human Ecology, Cinvestav-Mérida.
Castillo-Burguete, M.T. 2001. Relaciones de género en los ámbitos de participación comunitaria en un pueblo de la costa yucateca. Unpublished Doctoral Thesis. Mexico. Universidad Iberoamericana.
Figure 8. American flamingo (Phoenicopterus ruber) in the salt ponds of San Crisanto. (Photo by Casares)
Figure 9. Reddish egrets (Egretta rufescens) in the salt ponds of San Crisanto. (Photo by Casares)
Castillo-Burguete, M.T., M.D. Viga de Alva, and F. Dickinson. 2008. Changing the culture of dependency to allow for successful outcomes in participatory research: Fourteen years of experience in Yucatán, Mexico. In Reason, P., and H. Bradbury (eds.), The SAGE Handbook of Action Research, London: SAGE Publications, 2008, pp. 522-533.
Castillo-Burguete, M.T., M. Martínez-Mateos, and M.D. Viga de Alva. 2019. Natural resources knowledge socialization in Yucatán, Mexico: Promoting a mutually beneficial society-nature relationship. Ecology and Society 24(3): 21. https://doi.org/10.5751/ES-11016-240321
Chavez-Rodriguez, L. 2016. La Importancia de la Interseccionalidad en la Vulnerabilidad Social ante Eventos Hidrometeorológicos Extremos en Yucatán, México. In: Velázquez Gutiérrez, M., V. Vázquez García, A. De Luca Zuria, and D.M. Sosa Capistrán (eds.), Transformaciones ambientales e igualdad de género en América Latina: temas emergentes, estrategias y acciones, pp. 19-42. ISBN: 978-607-02-8549-3.
Centro Nacional de Prevención de Desastres (CENAPRED). 2021. Impacto socioeconómico de los principales desastres ocurridos en México 2020.
Convención sobre los humedales Ramsar. 2016. Introducción a la convención sobre humedales. Manual de la Convención de Ramsar, 5th edition.
Doswald, N., R. Munroe, D. Roe, A. Giuliani, I. Castelli, J. Stephens, I. Möller, T. Spencer, B. Vira, and H. Reid. 2014. Effectiveness of ecosystem-based approaches for adaptation: review of the evidence-base. Climate and Development, 6(2): 185–201. https://doi.org/10.1080/175655 29.2013.867247
Durán, R., G. García, and M. Méndez. 2014. Diversidad de especies de flora y fauna. Sección VIII. Biodiversidad. In Euán-Ávila, J.I., García de Fuentes A., Liceaga-Correa A., and Munguía G. (eds.), La Costa del Estado de Yucatán. Un espacio de reflexión sobre la relación sociedadnaturaleza, en el contexto de su ordenamiento ecológico territorial. Vol. II. Plaza y Valdés, Mexico.
Escudero, M., and E. Mendoza. 2021. Community Perception and Adaptation to Climate Change in Coastal Areas of Mexico. Water, 13(18). doi:10.3390/w13182483
Fuster, D. 2019. Investigación cualitativa: Método fenomenológico hermenéutico. Propósitos y Representaciones, 7(1): 201-229. Doi: http:// dx.doi.org/10.20511/pyr2019.v7n1.267
Fraga, J. 2004. Los habitantes de la zona costera de Yucatán: Entre la tradición y la modernidad. Casos de Estudio: Manejo Comunitario. In Rivera-Arriaga, E., G. J. Villalobos, I. Azuz Adeath, and F. Rosado May (eds.), El Manejo Costero en México. Universidad Autónoma de Campeche.
García, G., and E. Graniel. 2010. Geología. In Duran, R., and M. Méndez (eds.), Biodiversidad y Desarrollo Humano en Yucatán. CICY, PPDFMAM, CONABIO, SEDUMA: 496 pp. Guadarrama, P., L. Salinas-Peba, X. Chiappa-Carrara, and J. RamosZapata. 2018. Florística, composición y estructura de las comunidades vegetales de la porción occidental de la Reserva Estatal Ciénagas y Manglares de la Costa Norte de Yucatán. Revista mexicana de Biodiversidad, 89(3): 784-805. https://doi.org/10.22201/ib.20078706e.2018.3.1746
Guzmán-Noh, G., and F. D.-Gurri. 2021. Resiliencia de la actividad salinera artesanal ante la presencia de huracanes en la costa de Yucatán, México. Nova Scientia, 13(26). https://doi.org/10.21640/ns.v13i26.2725
Herrera-Silveira, J.A., C. Teutli-Hernandez, F. Secaira-Fajardo, R. Braun, J. Bowman, L. Geselbracht, M. Musgrove, M. Rogers, J. Schmidt, P.J. Robles-Toral, J.A. Canul-Cabrera, and L. Guerra-Cano. 2022. Daños a los manglares causados por huracanes. Técnicas y costos de reparación tras una tormenta. The Nature Conservancy, Arlington, Virginia.
Herrera-Silveira, J. A., F.A. Comín, and L. Capurro F. 2005. Los usos y abusos de la zona costera en la península de Yucatán. In El manejo costero en México, Vol. 38: 7–396. Universidad Autónoma de Campeche. Instituto Nacional de Estadística y Geografía (Inegi). 2020. Censo General de Población y Vivienda 2020. Principales resultados por localidad (ITER). Mexico, Inegi.
Malak, M. A., Sajib, A. M., Quader, M. A., & Anjum, H. 2020. “We are feeling older than our age”: Vulnerability and adaptive strategies of aging
people to cyclones in coastal Bangladesh. International Journal of Disaster Risk Reduction, 48. doi:10.1016/j.ijdrr.2020.101595
Morales-Ojeda, S., J. Herrera-Silveira, and R. Orellana. (2021). Almacenes de carbono en un paisaje de humedal cárstico a lo largo de un corredor transversal costero de la Península de Yucatán. Madera y bosques, 27(spe), e2742425. Epub 21 Feb. 2022. https://doi.org/10.21829/ myb.2021.2742425
Muñoz-Salazar, P., F. Gascón-Martín, and T. de Armas Pedraza. 2017. El riesgo socioambiental en los procesos de urbanización de América Latina. El caso de Vista al Mar, un campamento emplazado en los cerros de Valparaíso. Quid16. Revista del Área de Estudios Urbanos.
Nash, N., S. Capstick, L. Whitmarsh, I. Chaudhary, and R. Manandhar. 2019. Perceptions of local environmental issues and the relevance of climate change in Nepal’s Terai: Perspectives from two communities. Frontiers in Sociology 4(60). https://doi.org/10.3389/fsoc.2019.00060
National Oceanic and Atmospheric Administration (NOAA). 2022. Historical Hurricane Tracks. https://oceanservice.noaa.gov/news/historicalhurricanes/
Orellana, R., C. Espadas, and F. Nava. 2014. Clima y Riesgos Hidrometeorológicos. In Euán-Ávila, J. I., A. García de Fuentes, A. Liceaga-Correa, and G. Munguía (eds.), La Costa del Estado de Yucatán. Un espacio de reflexión sobre la relación sociedad-naturaleza, en el contexto de su ordenamiento ecológico territorial. Vol. I. Plaza y Valdés, Mexico.
Paredes Pérez, M.E., and M.T. Castillo-Burguete. 2018. Incertidumbre en el manejo de recursos y sus efectos en el desarrollo del turismo en “El corchito”. Capítulo 5. Turismo y sus impactos sociales, económicos y ambientales. 2018. Universidad Intercultural Maya.
Pech, N. 2010. “Es nuestra empresa porque la hemos hecho prosperar y de eso queremos vivir en el futuro…” Organización y manejo de recursos naturales en un ejido de la costa yucateca. Master’s thesis. Graduate Program of Science Specialized in Human Ecology, Cinvestav-Mérida.
Pérez, S. A. 2012. Percepción, uso y manejo de Cenotes en El Puerto, Yucatán. Master’s thesis. Graduate Program of Science Specialized in Human Ecology, Cinvestav-Mérida.
Programa de las Naciones Unidas para el Desarrollo (PNUD). 2012 Iniciativa Ecuatorial: Fundación San Crisanto, México.
Programa Especial de Acción ante el Cambio Climático del Estado de Yucatán (PEACC) 2018. Primer informe de Avances de acciones de mitigación y adaptación al cambio climático.
Pucker, I., M. McCauley, K. Fox, and A. Jacobel. 2022. Residents of Hawaii’s climate decisions to remain or migrate. Ecopsychology 10(10): 1-10. https://doi.org/10.1089/eco.2022.0027
Reid H., M. Alam, R. Berger, T. Canon, S. Huq, and A. Milligan. 2009. Community-based adaptation to climate change: an overview. Participatory Learning and Action 60: Community-based adaptation to climate change. International Institute for Environment and Development.
Servicio de Información sobre Sitios Ramsar. 2022. Reserva Estatal Ciénagas y Manglares de la Costa Norte de Yucatán.
Salas, S., G. Mexicano-Cíntora, and M.A. Cabrera. 2006. ¿Hacia dónde van las pesquerías en Yucatán? Tendencias, retos y perspectivas. Cinvestav-Mérida, Yucatán.
Savo, V., D. Lepofsky, J.P. Benner, K.E. Kohfeld, J. Bailey, and K. Lertzman. 2016. Observations of climate change among subsistence-oriented communities around the world. Nature Climate Change, 6(5): 462-473. doi:10.1038/nclimate2958
Tuan, Y.F. 1974. Topophilia. Prentice-Hall, INC., Englewood Cliffs, New Jersey, USA.
Unión Internacional para la Conservación de la Naturaleza y de los Recursos Naturales (UICN). 2020. Orientación para usar el Estándar Global de la UICN para soluciones basadas en la naturaleza. Un marco fácil de usar para la verificación, diseño y ampliación de las soluciones basadas en la naturaleza. 1st edition. Gland, Switzerland: UICN.
Wilson, G.A. 2013. Community resilience, social memory. Area 45, 207215. https://doi-org.access.biblioteca.cinvestav.mx/10.1111/area.12012.
Socio-environmental Value of Coastal Urban Wetlands in Veracruz, Mexico
Patricia Moreno-Casasola1, Hugo López Rosas2 , Luis Alberto Peralta3, César Vázquez-González1 , and Roberto Monroy1
ABSTRACT
Coastal wetlands are among the most valuable ecosystems globally due to the ecosystem goods and services they provide to society. Cities are expanding, and the tendency is to encroach on wetlands filled in and built upon. When restored, urban wetlands produce many benefits for their inhabitants, but maintaining wetlands faces many challenges. However, to restore them, local people and their decisionmakers must be involved. This paper focuses on the urban wetlands of the city of Veracruz: the dune lakes, Olmeca Lagoon, and Tembladeras, a freshwater marsh. A historical description of the area and its growth is given, as to how they became natural protected areas, and the state they are in now (social, biological, and water quality). This paper presents the socio-ecological interaction between human and ecological components, the values of its ecosystem services, and the actions and activities that can be developed to conserve these appreciated ecosystems.
RESUMEN
Los humedales costeros se encuentran entre los ecosistemas más importantes a nivel mundial debido a los bienes y servicios ecosistémicos que brindan a la sociedad. Las ciudades se están expandiendo y la tendencia es invadir los humedales, rellenándolos y edificar. Cuando se restauran, los humedales urbanos producen muchos beneficios para sus habitantes, pero su mantenimiento enfrenta diversos desafíos. Sin embargo, para restaurarlos, es necesario involucrar a la población local y a quienes toman las decisiones. Este artículo se centra en los humedales urbanos de la ciudad de Veracruz: los lagos interdunarios, la laguna Olmeca y Tembladeras, un pantano de agua dulce. Se proporciona una descripción histórica del área y su crecimiento, cómo se convirtieron en áreas naturales protegidas y el estado en el que se encuentran actualmente (social, biológico y de calidad del agua). Este artículo presenta la interacción socio-ecológica entre los componentes humanos y ecológicos, los valores de sus servicios ecosistémicos y las acciones y actividades que pueden desarrollarse para conservar estos valiosos ecosistemas.
INTRODUCTION
The Gulf of Mexico (GOM) is a geographic area with outstanding social, economic, and ecological importance due,
among other things, to its influence on the three countries that share its border. There are five federal Mexican entities on its southern and western border. In the central part of the GOM ––in the state of Veracruz, the mountain range called the Sierra Madre Oriental runs parallel to the coast. An extensive coastal plain is formed, along which rivers run down the extensive watersheds and drag a large amount of sediment, forming extensive dune fields (Tejeda-Martínez 2012). On the lower part of the watersheds, an intricate variety of coastal freshwater marshes, swamps, dune lakes, and mangroves are found (Moreno-Casasola 2016, NeriFlores et al. 2019). The interaction of these ecosystems with human activities has given rise to both urban and rural coastal social-ecological systems. The city and port of Veracruz are an example of coastal social-ecological systems. The purpose of this paper is to emphasize the importance
1 Instituto de Ecología AC., Red de Ecología Funcional. Carretera antigua a Coatepec 351, El Haya 91070, Xalapa, Veracruz, México; correspondence author contact: patriciamorenoc@inecol.mx
2 El Colegio de Veracruz, Carrillo Puerto 26, Zona Centro, Xalapa, 91000, Veracruz, México.
3 Tecnológico Nacional de México, Campus Veracruz. Calzada Miguel Ángel de Quevedo 2779, Col. Formando Hogar 91897, Veracruz, Veracruz, México.
Figure 1. Image from the 16th Century showing the first constructions of the port of Veracruz. An island was used to build a fortress (San Juan de Ulúa) and served as a coastal protection together with the reef system (partly seen in the back in the Google image). Image Ruffoni (1907).
of the Dune Lakes Natural Protected Area, which is made up of 33 urban dune lakes, to present the current situation of these freshwater coastal wetlands and its relation to Laguna Olmeca-Tembladeras Natural Protected Area, the socio-ecological interaction between human and ecological components, the values of its ecosystem services, as well as the actions and activities that can be developed as part of pilot projects that help to preserve them as urban wetlands.
HISTORICAL BACKGROUND
It was the first human settlement and port for the navigation route to Spain, founded by the arrival of the Spanish in the newly conquered territories (Cortés Hernández 2023). The final location of the city was determined mainly by the position of the island of San Juan de Ulúa, which generated
a naturally protected bay and provided a security situation for the settlement, reinforced with the construction of a fortress (Aranda Sánchez 2015) (Figure 1). As a vital part of its defense system, a walled, fortified city was built to confront the pirates; this involved reproducing European models of military engineering and architecture (Aranda Sánchez 2015).
More importantly, because a small bay is formed in the area with a reef system in front ––what is currently known as the Parque Nacional Sistema Arrecifal Veracruzano (PNSAV)––(Ortiz-Lozano et al. 2009), this still provides the ecosystem service of storm protection not only to the port and ship berth but also to the physical infrastructure such as homes and urban development against tropical storms and hurricanes (Burke et al. 2011). It also brings
2. Information showing growth of Veracruz: A) Historical population growth in Veracruz and the metropolitan area 1810-1970 (Veracruz, Boca del Río-
(data from Padilla
2015). B) Expansion of the metropolitan area 1980, 2000 and 2010 (Own elaboration from Landsat images). C) Change in land use of coastal freshwater marshes (broadleaf marshes — popales, cattail marshes — tulares, and dune lakes) and mangroves. The map shows the digital orthophotos and the degree of urbanization (Basic Geostatistical Areas of the INEGI 2011). The red polygons represent the Basic Geostatistical Areas in 2010.
Figure
Medellín)
Galicia
protection from the strong winds produced by cold fronts, locally called “nortes”, which consist of the movement of large masses of air whose speed ranges from 35 to 120 km/h. However, for the development of physical infrastructure, the dune system was not so favorable since it was an extension of mobile and semi-mobile parabolic and transverse dunes with dune depressions that flooded during the rainy season (Moreno-Casasola 2016), and some permanently surrounded by freshwater wetlands inland, as part of the Jamapa river floodplain (Neri-Flores et al. 2019).
Accelerated demographic growth began (5.0% annually) in the city and port of Veracruz in 1880, and in 19101930, it reached a population of 71,833 inhabitants (Padilla Galicia 2015) (Figure 2A). The linear urban growth towards the south of the city was due to the physiography of the coastline, which resulted in an elongated urban growth driven by the incipient development of the adjacent municipality of Boca del Río (Figure 2B). However, this growth occurred and continues (Figure 2C) on freshwater coastal dunes and wetlands, especially along the coastline, which modifies material and energy flow patterns and damages the dunes (Siemens et al. 2006), intending to create a flatter landscape. In this way, until the 1950s (Figure 2C), Veracruz was a traditional, compact city with low population density, an urban center corresponding to its historic center, and low demographic and economic growth. However, starting in the 1960s, there was accelerated demographic growth, which was reflected in the urbanization process until 1990 (Figure 2), especially in Boca del Río, which generated urban expansion on the dunes and interdune
lakes between 1995-2010 (Vázquez-González et al. 2019).
Today, the port and city of Veracruz have spread over dunes and wetlands, constricting these natural environments (Figures 2C and 3). Jiménez-Orocio et al. (2015) estimated that the surface of coastal dunes in the municipality of Veracruz reached 13,000 ha. However, more than half of the dune surface is now urbanized land. Some stabilized transgressive dunes, parabolic dunes, and small frontal dunes remain. This model of urbanization has caused flooding from storm surges and rain from tropical storms. It is also caused by subsurface water from the Sierra Madre and can no longer emerge in many wetlands (Neri-Flores et al. 2019). Various events have occurred in the area that imply heavy losses for the population due to flooding. This was the case of Hurricane Karl in 2010, which caused flooding and economic losses due to household material assets of 150.85 million US$ (Vázquez-González et al. 2019).
Due to the socio-ecological importance of these urban wetlands, the government of the state of Veracruz decreed the Protected Natural Area “Reserva Ecológica -Laguna Olmeca Ecological Reserve” in 2011 (Gaceta-Oficial 2011) (hereafter called Laguna Olmeca and Tembladeras NPA), and in 2016 the Protected Natural Area “Corredor Biológico Multifuncional Archipiélago de Lagunas Interdunarias de la Zona Conurbada de los Municipios de Veracruz y La Antigua” five years later (Gaceta-Oficial 2016) including 33 lagoons (hereafter called Dune Lakes NPA). The latter comprises 33 dune lakes, of which 17 are part of the Ramsar 1450 site (Sistema de Lagunas Interdunarias de la Ciudad de Veracruz), which was decreed on February 2,
Figure 3. Dune lakes immersed in the city of Veracruz with much of the coastal dunes occupied by urban development. The lakes are present in the hollows at the base of the dunes. (Source: Google Earth). The Y axis is 3x.
Figure 4. Map and view of Veracruz showing the Tembladeras-Laguna Olmeca Protected Natural Area and the location and name of the dune lakes that form part of the Dune Lakes Protected Natural Area (Corredor Biológico Multifuncional Archipiélago de Lagunas Interdunarias de la Zona Conurbada de los Municipios de Veracruz y La Antigua) and the Ramsar site. (Source: Google Earth).
2005, before the protected natural areas. Figure 4 shows a map of the area, a view of the city on a Google Earth image, and the names of the dune lakes. Its objective was to conserve the ecological state of the wetlands in order to maintain their functioning as interconnected hydrological vessels to reduce the impact of floods in the metropolitan area. Therefore, the ecosystem service of flood protection is vital in the area.
As can be seen in Figures 3 and 4, the dune lakes are immersed in the urban area and, in some cases, with a public space that separates them from the houses or private properties (i.e., Casas Díaz, El Encanto, El Ensueño, and Lagartos), and in others the urbanization reaches its shore (El Coyol, Tarimoya, and Dos Caminos). Despite the legal figure of the protected natural area and its management plan, there is little participation and collaboration between local governments (state and municipal governments), as well as incipient participation of citizens to maintain and improve the ecological conditions of lagoons to increase the quality of the environment and landscape.
There is also a published delimitation for each lake, that is, the perimeter of the water that is considered part of the protected natural area. However, the limit is at the water’s edge in most cases, with very little space for developing recreation or environmental education infrastructure. Sometimes, there are spaces (a street or just a few meters) between the houses and the lake. These spaces allow floods to be cushioned in case of rising water and also allow recreational and/or educational use. However, these decisions must be made jointly with the inhabitants around them.
VERACRUZ URBAN WETLANDS TODAY
Assessment of the General State of the Dune Lakes and Laguna Olmeca
In 2004, the state of Veracruz and the municipality of Veracruz recognized their importance. The latter decided to incorporate them as part of the city’s natural areas and worked with the neighbors to set limits to the growth and invasion of constructions on the lakes. They started formalizing streets in some of them to separate houses from the lakes, although at that time, the vision was more to convert them into parks and not urban natural lakes. Marlibran Lake still has a fountain with a water spout in the center. The state environmental authorities changed this perception and kept them as natural urban lakes.
Due to the recognized ecological and social importance of the dune lakes in the city, they were finally decreed a Natural Protected Area by the Government of Veracruz State in 2016. However, the delimitation of the perimeter only included the water body, and a buffer zone needs to be incorporated to protect and include critical zones that contribute to the maintenance of the ecological functions of dune lakes. Even so, this institutional effort continued to include the neighbors to convince them of their social and ecological importance. A Google Earth comparison of the
urbanization around them in 2005 and 2022 showed that there has been no invasion of the lake borders. Through field verifications, we have confirmed that there are no illegal discharges of sewage in the lakes. These have been significant achievements. On the other hand, stormwaters have no management; they all flow into the dune lakes and finally into Laguna Olmeca, causing pollution and garbage accumulation.
Vegetation
It is described that in the depressions of coastal dune systems, wetter areas can be found where the flooding time is variable from a few weeks (humid slack) to permanent water forming dune lakes, which remain permanently flooded for at least more than six months of the year or permanently (Peralta Pelaez et al. 2014). In these bodies of water, especially on the margins and in the shallowest areas, wetlands are established: freshwater broadleaved marshes (popales), cattails marshes (tulares), floating vegetation, and swamps. Historical records indicate that up to 200 dune lakes were formed (Sarabia-Bueno 2014). Today there are 33 lakes whose size varies between 0.4 ha and 115 ha; most are very close to sea level. They are all part of the Dune Lakes NPA, but not all are part of the Ramsar site. In 2022, it was detected that several of them dried up since this year represented a set of very dry years in the area, a period that strongly impacted several of the lakes. In September 2023, they all had water.
In the dune lake wetlands one can still find floating vegetation (Nymphoides indica, Nymphaea ampla, Salvinia sp., and Ceratophylum sp.), submerged and emergent vegetation (Typha domingensis, Phragmites communis, Paspalum spp., Thalia geniculata, Pluchea odorata, Cyperus articulatus, Phyla nodiflora, Sagittaria lancifolia subsp. media, Pontederia sagittata, Hydrocotyle umbellata, H. bonariensis). Numerous bird species frequent these wetlands, including shore and aquatic birds (Aechmophorus occidentalis and Egretta thula) and semi-aquatic birds (Fulica americana, Dendrocygna autumnalis, Ceryle torquata, and Mycteria americana) (CONANP 2005; RAMSAR 2014). The wetlands are located on the route of the world’s most significant migratory corridor of birds of prey with frequent key species such as Falco peregrinus, Accipiter cooperi, Buteo platypterus, Pandion haliaetus, and Falco sparverius
In the Protected Natural Area of Tembladeras-Laguna Olmeca (Figure 4), the central wetland communities are the popal formed by Thalia geniculata, Pontederia sagittata, and Sagittaria lancifolia. Extensive patches of Typha domingensis are also present, forming dense stands associated with species such as Cyperus articulatus, Cladium jamaicensis, and Ludwigia octovalvis. There is also floating vegetation, with Spirodela polyrrhiza, Pistia stratiotes, and Eichhornia crassipes. Palm groves dominated by Attalea liebmannii, Roystonea dunlapiana, and Sabal mexicana oc-
P_total (mg/l)
cupy rare patches. Other trees include Salix humboldtiana and Ficus insipida. Also, there is flooded grassland promoted by anthropogenic activities such as cattle ranching, which introduced grass species Cynodon plectostachyus and Brachiaria mutica that tolerate flooding (UNAM 2011).
Water Quality
The salinity indicated that all the lakes are freshwater (oligohaline). The pH fluctuated between 7.7 and 9.2. The oxygen saturation values are above 160% (Table 1). Nutrient values are variable, and there is no clear trend, except in Lake D, where water from the treatment plant is discharged. There is no more recent published water quality data.
Vidal Álvarez et al. (2022) sampled the water in Laguna Olmeca to measure fecal coliforms, biochemical oxygen demand, chemical oxygen demand, total phosphorous, total nitrogen, pH, total dissolved solids, temperature, and turbidity for producing a Water Quality Index (Brown y McCleland 1973). The value obtained was 35.02 (excessively polluted), which is a poor value, considering that the scale ranges from 0 to 100, with the latter indicating good quality. More critically, Sarabia-Bueno (2004) calculated this same index in 2004 and reported a 41.05 (heavily contaminated) value. A comparison of the two values shows a drop in water quality over two decades. There are several reasons to explain this. Over time, some dune lakes were connected through superficial channels to help drain the city during flooding, and these waters are discharged into Laguna Olmeca. The Lagoon has different discharge points for water with a high concentration of nutrients. The origin of the bacteriological contamination of the Olmeca Lagoon
is mainly attributed to the irregular discharges of domestic wastewater from the human settlements around it, as well as the inefficient treatment of the wastewater treatment plant located northeast of the Lagoon, which discharges its effluents into it, the open dump on one side of the Lagoon (Vidal Álvarez et al. 2022); storm waters sweep many city areas, contaminate dune lakes and their channels, and end up in Laguna Olmeca. All these problems have not been resolved for more than fifteen years; on the contrary, they have worsened.
Perceptions of Ecosystem Services
Torres Juárez (2022) surveyed 125 persons living in the locality of four dune lakes and Laguna Olmeca. The answers showed that many people consider it a suitable place to live with values for social and family recreation. They also consider that their house increases in value by being in front of a lake or lagoon. As ecosystem services, they recognized beauty and landscape, biodiversity, the ability to provide habitat and protection to plant and animal species, and improved air quality and temperature. They consider them a source of activities (children’s playground, neighbors’ meetings, among others), relaxation, space for sports, flood control, and, to a lesser extent, fishing and obtaining products to market.
In the year 2020, the German Society for International Cooperation (GIZ) initiated the project titled “Sustainable Development in Urban Coastal Regions through the Integration of Ecosystem Services and Biodiversity (BIOCITIS).” This project identified the importance of conservation and restoration measures for coastal wetlands. One of the wetland systems selected for the start of this project was the Dune Lakes PNA. As a component of the proj-
Table 1. Physicochemical characteristics of the water of some dune lakes based on Sarabia-Bueno (2004).
ect’s activities, in 2022, interviews and workshops were conducted with key stakeholders (academics and decisionmakers) from the municipal, state, and federal levels. The main strengths and threats to conserving these wetlands were identified in these workshops, and suggestions were generated to work together on conservation. During these workshops, it was recognized that wetlands’ leading ecosystem service is protection against flooding. Some lakes are used as recreation spaces and food sources (hook fishing). Despite their protected status, these spaces need adequate surveillance, as debris, garbage, or dead animals are constantly deposited. Furthermore, the lakes are impacted by pollution from storm runoff. During the rainy season, stormwater carries solid waste, grease from mechanical workshops, and, in some cases, wastewater from irregular settlements near these lakes, which consist of building houses in places that are not permitted because of the risk of flooding (CENAPRED 2017, González-Terrazas et al. 2019) or because they are considered territorial reserves by both state and municipal legislation. There is a consensus that requires participatory strategic planning focused on the conservation of wetlands generated by the inhabitants of the lakes, along with other key actors, such as academics and decision-makers. Figures 5 and 6 show some pictures of the dune lakes.
Ecosystem Services
Ecosystem services (ES) are the benefits that the human population obtains directly or indirectly from the functions of an ecosystem (Costanza et al. 1997, Daily et al. 1997). They were classified and detailed according to their ecological, cultural, social, and economic value by de Groot et al. (2002). However, the MEA (2005) linked them to the different facets of human well-being depending on the culture, society, and the type of use (direct or indirect) of the goods and ES. In recent years, they have acquired great attention.
For example, Costanza et al. (1997) conducted the first economic evaluation of ecosystems and biomes worldwide and by type of ecosystem service, and mangroves and freshwater wetlands had a total value of 2.3 and US$4.5 trillion/yr., respectively. Almost 20 years later, Costanza et al. (2014) carried out the same exercise to analyze the change in the value of ecosystems and biomes based on the ecosystem services offered and land use change; thus, mangroves and freshwater wetlands lost 0.5 and US$2.8 trillion/yr.
We evaluated and measured some ecosystem services in different types of wetlands (mangroves, swamps, marshes, and flooded grasslands, which formerly were freshwater wetlands). The services include carbon storage (Hernández and Moreno-Casasola 2018), plant and animal resources used by local communities (González-Marín et al. 2012, 2017), water storage in the soil (Campos et al. 2011), and fisheries dependent on different types of wetlands (Vázquez-Gonzalez et al. 2015). Likewise, a first economic valuation exercise was conducted on wetland ecosystem supply services based on the results obtained in these ecosystems, including dunes (Moreno-Casasola 2016, Vázquez-González et al. 2016). The highest monetary value of ecosystem services was the control and reduction of floods in urban areas, with 155,629 $US/ ha for 2007 prices, while the lowest was the payment for the conservation of coastal wetlands, with 26 $US/ha for 2007 prices (Vázquez-González et al. 2016). In the case of Laguna Olmeca and Tembladeras, some of these values can be extrapolated, for example, flood control and reduction, estimating values around 100 and US$150 thousand/ha/ in 2007 prices (see Vázquez-González et al. 2019). This value can serve decision-makers to reinforce the importance of these urban wetlands.
WHAT WE’VE LEARNED AND WHAT’S NEXT
Through the years, we have developed a general view of the urban problems, better understand the different types of
Figure 5. Dune lakes — El Ensueño (right side) and La Ilusión (left side) — have small parks on both extremes and a small green public area surrounding them; these lakes are connected. Photography G. Sánchez Vigil.
Figure 6. Dune lake Tarimoya, has a lower urban density than other lakes; floating mat of Water Hyacinth (Eichhornia crassipes) in foreground. Photography G. Sánchez Vigil.
wetlands, have worked on some of the causes of flooding to understand the subterranean water connectivity that links all the urban wetlands, and have set the scenario for getting involved with different stakeholders. We have developed relationships with the local government, the residents around some of the lakes, the schools in these areas, and the academic groups of various institutions.
This year, we began more intense social and environmental work in two dune lakes: El Coyol and Laguna D. These experiences and analysis on evaluation and economic valuation of ecosystem services are being adapted to these two lakes. We have finished 150 surveys with residents to understand and consider the neighbor´s perceptions and expectations. These results will be the basis for workshops with the local residents to ensure they form an essential part of the proposal of an environmental management plan for each lake. This information, coupled with the environmental services assessment, will help the county define strategies to build the bases of different payments for ecosystem services, environmental compensation, and the location of priority restoration areas for the recovery of ecosystem services. More importantly, the results can be incorporated into the programs and management plans of the Dune Lake Protected Natural Area to redirect the desired urban and peri-urban development. It should be based on the conception of a socio-ecological system, with strong participation in the residents’ long-term involvement, stressing the importance of urban development with sound environmental planning.
ACKNOWLEDGEMENT
This project is being financed by Institute of Ecology, A.C.
REFERENCES
Aranda Sánchez, J. M. 2015. Cities in parallel. Cartagena and Veracruz. ciedad y Territorio, vol. xv, núm. 48 XV:555–665. https://www.scielo. org.mx/pdf/est/v15n48/v15n48a10.pdf
Brown, R., and N. McCleland. 1974.Water Quality Index Application in the Kansas River Basin. EPA 907/9-74-001. https://www.regulations. gov/document/EPA-HQ-OW-2009-0596-2570
Burke, L., K. Reytar, M. Spalding, and A. Perry. 2011. Reefs at Risk Revisited. World Resources Institute (WRI), Washington, DC. https:// www.wri.org/research/reefs-risk-revisited
Campos, A., M. E. Hernández, P. Moreno-Casasola, E. Cejudo Espinosa, A. Robledo R., and D. Infante Mata. 2011. Soil water retention and carbon pools in tropical forested wetlands and marshes of the Gulf of Mexico. Hydrological Sciences Journal 56:1388–1406. https://doi.org/10 .1080/02626667.2011.629786
CENAPRED. 2017. Atlas Nacional de Riesgos. http://www.atlasnacionalderiesgos.gob.mx/portal/fenomenos/ CONANP. 2005. Ficha Informativa de los Humedales de Ramsar (FIR). Sistema de Lagunas Interdunarias de la Ciudad de Veracruz. Ciudad de México. https://rsis.ramsar.org/RISapp/files/RISrep/MX1450RIS.pdf
Cortés Hernández, J. 2023. Creación y edificación de la Villa Rica de la Veracruz (1519-1523). Interpretación de algunos sucesos basada en su contexto arqueológico. Pages 1–7 in R. Arboleyda Castro, editor. Veracruz. 500 años de cara al mundo a través del mar. Publicació. Secretaría de Cultura, INAH, Ciudad de México.
Costanza, R., R. D’Arge, R. De Groot, S. Farber, M. Grasso, B. Hannon, K. Limburg, S. Naeem, R. V. O’Neill, J. Paruelo, R. G. Raskin, P. Sutton, and M. Van Den Belt. 1997. The value of the world’s ecosystem services and natural capital. Nature 387:253–260. https://doi. org/10.1038/387253a0
Costanza, R., R. de Groot, P. Sutton, S. van der Ploeg, S. J. Anderson, I. Kubiszewski, S. Farber, and R. K. Turner. 2014. Changes in the global value of ecosystem services. Global Environmental Change 26:152–158. https://doi.org/10.1016/j.gloenvcha.2014.04.002
Daily, G. C., S. Alexander, P. R. Ehrlich, L. Goulder, J. Lubchenco, P. Matson, H. A. Mooney, S. Postel, S. H. Schneider, D. Tilman, and G. M. Woodwell. 1997. Ecosystem services: benefits supplied to human societies by natural ecosystems. Issues in Ecology 16(2): 18 pp. https://www. esa.org/wp-content/uploads/2013/03/issue2.pdf
Gaceta-Oficial. 2016. ANP Archipiélago de Lagunas Interdunarias. http://repositorio.veracruz.gob.mx/medioambiente/wp-content/uploads/ sites/9/2020/09/Gaceta_Actualizaci%C3%B3n-ENP-1.pdf
González-Marín, R. M., P. Moreno-Casasola, A. A. Castro-Luna, and A. Castillo. 2017. Regaining the traditional use of wildlife in wetlands on the coastal plain of Veracruz, Mexico: ensuring food security in the face of global climate change. Regional Environmental Change 17:1343–1354. https://doi.org/DOI:10.1007/s10113-016-0955-x
González-Marín, R. M., P. Moreno-Casasola, R. Orellana, and A. Castillo. 2012. Palm use and social values in rural communities on the coastal plains of Veracruz, Mexico. Environment, Development and Sustainability 14:541–555. https://doi.org/10.1007/s10668-012-9343-y
González-Terrazas, D., A. Vermonden Thibodeau, R. T. Montes Rojas, Y. S. Nava Assad, F. López Díaz, F. Gress Carrasco, M. Rojas Barajas, M. A. Linares Munguía, J. Machorro Reyes, and C. Enríquez Guadarrama. 2019. Atlas Nacional de Vulnerabilidad al Cambio Climático. México. Instituto Nacional de Ecología y Cambio Climático (INECC), Secretaría de Medio Ambiente y Recursos Naturales (SEMARNAT), Ciudad de México. https://atlasvulnerabilidad.inecc.gob.mx/
de Groot, R. S., M. A. Wilson, and R. M. J. Boumans. 2002. A typology for the classification, description and valuation of ecosystem functions, goods and services. Ecological Economics 41:393–408. https://doi. org/10.1016/S0921-8009(02)00089-7
Hernández, M. E., and P. Moreno-Casasola. 2018. Carbon fluxes and stocks in freshwater wetlands in Mexico. Madera y Bosques 24: e2401881. https://www.scielo.org.mx/scielo.php?script=sci_ abstract&pid=S1405-04712018000400401&lng=en&nrm=iso
INEGI. 2011. Censo General de Población y Vivienda 2010. https:// www.inegi.org.mx/programas/ccpv/2020/default.html
Jiménez-Orocio, O., P. Hesp, M. L. Martínez, I. Espejel, and P. MorenoCasasola. 2015. Tipos de dunas. Pages 27–48 in M. L. Martínez, P. Moreno-Casasola, I. Espejel, O. Jiménez-Orocio, D. Infante-Mata, and N. Rodríguez-Revelo, editors. Diagnóstico general de las dunas costeras de México. Comisión Nacional Forestal (CONAFOR), Ciudad de México. https://biblioteca.semarnat.gob.mx/janium/Documentos/Ciga/ libros2018/CD002912.pdf
MEA. 2005. Ecosystems and human well-being: wetlands and water. World Resources Institute, Washington, DC. https://www.millenniumassessment.org/documents/document.358.aspx.pdf
Moreno-Casasola, P. 2016. Servicios Ecosistémios de las Selvas y Bosques Costeros de Veracruz. Page (P. Moreno-Casasola, Ed.). Instituto de Ecología, A.C., Xalapa-Veracruz, México.
Neri-Flores, I., P. Moreno-Casasola, L. A. Peralta-Peláez, and R. Monroy. 2019. Groundwater and River Flooding: The Importance of Wetlands in Coastal Zones. Journal of Coastal Research 92:44–54. https:// doi.org/10.2112/SI92-006.1
Ortiz-Lozano, L., A. Granados-Barba, and I. Espejel. 2009. Ecosystemic zonification as a management tool for marine protected areas in the coastal zone: Applications for the Sistema Arrecifal Veracruzano National Park, Mexico. Ocean and Coastal Management 52:317–323. https://doi.org/10.1016/j.ocecoaman.2009.03.004
Padilla Galicia, S. 2015. Formación y Consolidación metropolitana en México, Puebla y Veracruz. Análisis Comparativo del Crecimiento y Estructura Urbana en el periodo 1970 a 2010. Universidad Nacional Autónoma de México.
Peralta Peláez, L. A., P. Moreno-Casasola, and H. López Rosas. 2014. Hydrophyte composition of dune lakes and its relationship to land-use and water physicochemistry in Veracruz, Mexico. Marine and Freshwater Research 65:312–326. https://doi.org/10.1071/MF12295
RAMSAR. 2014. Ficha Informativa de los Humedales de Ramsar (FIR). Sistema de Lagunas Interdunarias de la Ciudad de Veracruz. Veracruz. https://rsis.ramsar.org/RISapp/files/RISrep/MX1450RIS.pdf
Ruffoni, A. 1907. Puerto de La Vera Cruz Nueva, con la Fortaleza de San Juán de Ulúa, en el Reino de la Nueva España en el Mar del Norte. Tiene la ciudad de longitud 1200 varas, la tierra tiene de longitud 195 varas, tiene el canal desde tierra hasta la fortaleza 200 varas. Archivo General de Indias. Archivos Estatales (España). http://pares.mcu.es/ParesBusquedas20/catalogo/description/20070
Sarabia-Bueno, C. 2004. Sistema lagunar de la ciudad de Veracruz: propuesta de manejo bajo la visión de proyectación y gestión ambiental. PhD Thesis. Colegio de Posgraduados, Campus Veracruz, Ver.
Siemens, A., P. Moreno-Casasola, and C. Sarabia. 2006. The metabolization of wetlands by the city of Veracruz, Mexico. Journal of Latin American Geography 5:7–29. https://doi.org/10.1353/lag.2006.0010
Tejeda-Martínez, A. 2012. Introducción. Apuntes corográficos de las inundaciones en el estado de Veracruz. Pages 23–42 in A. Tejeda-Martínez and V. Arenas-Fuentes (eds) Inundaciones 2010 en el Estado de Veracruz. Consejo Veracruzano de Investigación Científica y Desarrollo Tecnológico (COVEICYDET), Xalapa-Veracruz, México. https://www. uv.mx/peccuv/files/2019/07/Inundaciones-en-Veracruz-2010-Tomo-I.pdf
Torres Juárez, R. M. C. 2022. Valor social, económico y ambiental de las lagunas interdunarias de la Ciudad de Veracruz, México. Colegio de Posgraduados.
UNAM. 2011. Informe Humedal Tembladeras. Estudio Interdisciplinario de los Humedales de la República Mexicana: Desarrollo Metodológico para el Proyecto Nacional Humedales Validación Piloto. Ciudad de México.
Vázquez-González, C., P. Moreno-Casasola, I. Espejel, B. E. EscamillaPérez, S. Díaz de León, and L. A. Peralta Peláez. 2016. Valor económico de los ecosistemas. Pages 186–203 in P. Moreno-Casasola, editor. Servicios Ecosistémicos de las Selvas y Bosques Costeros de Veracruz. INECOL-ITTO-CONAFOR-INECC, Xalapa-Veracruz, México.
Vázquez-González, C., P. Moreno-Casasola, A. Juárez, N. RiveraGuzmán, R. Monroy, and I. Espejel. 2015. Trade-offs in fishery yield between wetland conservation and land conversion on the Gulf of Mexico. Ocean and Coastal Management 114:194–203. https://doi.org/10.1016/j. ocecoaman.2015.06.020
Vázquez-González, C., P. Moreno-Casasola, L. A. Peralta Peláez, R. Monroy, and I. Espejel. 2019. The value of coastal wetland flood prevention lost to urbanization on the coastal plain of the Gulf of Mexico: An analysis of flood damage by hurricane impacts. International Journal of Disaster Risk Reduction 37:101180. https://doi.org/10.1016/j. ijdrr.2019.101180
Vidal Álvarez, M., J. Luis Marín-Muñiz, and D. Hernández Hernández. 2022. Indicador de la calidad del agua, caso de estudio: Laguna Olmeca, Veracruz, México. Journal of Basic Sciences 8:122–132. https://revistas. ujat.mx/index.php/jobs/article/view/5351
Preserving La Mancha’s Wetland Avian Heritage with a Community-Driven Bird Monitoring Initiative
Angel J. Carpinteiro-Díaz1, Enrique Romero2, and Patricia Moreno-Casasola1
ABSTRACT
The region of La Mancha includes several bodies of water and communities of wetlands and jungles. It has a rich flora and fauna, and its wetlands are a Ramsar site (La ManchaEl Llano no 1336). Since 1999, there has been a community ecotourism group made up of farmers, ranchers, and fishermen who actively participate in research projects at CICOLMA (a reserve and field station of the Instituto de Ecología A.C., a public research center). They supported the restoration of freshwater wetlands, and since then, one of their members has been monitoring monthly the birds that arrive at the restored wetland. He has recorded 200 species, including aquatic, wading, and terrestrial birds. His training and enthusiasm have allowed him to constantly support data collection and generate this list, showing the role of a small wetland in bird richness. The group’s activity has also resulted in greater community interest in conservation and becoming a livelihood.
Key words: conservation, community ecotourism, freshwater wetlands
RESUMEN
La región de La Mancha comprende varios cuerpos de agua y comunidades de humedales y selvas. Alberga una gran diversidad de fauna y sus humedales son un sitio Ramsar (La Mancha-El llano no 1336). En la zona, desde 1999, hay un grupo de ecoturismo comunitario, formado por campesinos, rancheros y pescadores. Participan activamente en proyectos de investigación en CICOLMA, una reserva y estación de campo del Instituto de Ecología A.C., un centro público de investigación. Apoyaron en la restauración de humedales de agua dulce y desde entoncen uno de sus miembros ha vneido monitoreando mensulamente las aves que llegan al humedal restaurado. Ha registrado 200 especies, entre aves acuáticas, vadeadoras y terrestres. Su capacitación y entusiasmo le han permitido apoyar de manera cosntante la toma de datos y generar este listado, mostrando el papel de un pequeño humedal en la riqueza de aves. La actividad del grupo también ha resultado en un mayor interes comunitario en la conservación además de convertirse en un medio de vida.
Palabras Clave: conservación, ecoturismo comunitario, humedales de agua dulce
INTRODUCTION
Mexico’s coastal wetlands are vital and unique ecosystems that extend along its extensive coastline of more than 11,000 kilometers, bathed by the Pacific Ocean, the Gulf of Mexico, and the Caribbean Sea. These areas, characterized by their transition between terrestrial and aquatic environments, play a fundamental role in the biodiversity conservation and the country’s ecological balance. Mexico is home to many coastal wetlands, including mangroves, marshes, floodplain forests, freshwater marshes (popales), cattail marshes (tulares), coastal lagoons, estuaries, and beaches, each with unique characteristics and functions.
Mangroves are one of Mexico’s most emblematic types of coastal wetlands, where they occupy an area in 2020, of 905,086 ha (CONABIO 2021). These forests consist of trees adapted to living in saline waters and provide a refuge and critical habitat for a wide variety of birds, fishes, crustaceans, and marine mammals. In addition, they serve as natural barriers against flooding due to storm surges (Blankespoor et al. 2017), act as carbon storages (HerreraSilveira et al. 2020), and are nurseries for many aquatic species (López-Portillo et al. 2011). Mangroves are the only ecosystem fully protected by Mexican laws, meaning they cannot be cut down, and their hydrology cannot be modified throughout the territory. Additionally, coastal lagoons and estuaries that surround the mangroves are reproductive and breeding areas for many fish species, crustaceans, and mollusks, making them essential fishing centers for the local economy.
Freshwater coastal wetlands include various communities with different compositions and structures, which occupy an extensive area, especially in the country’s southeast. They include tree and herbaceous communities established on freshwater gradients behind the mangroves and frequently connected to them (Moreno-Casasola et al. 2017). They are not as well known by society or decisionmakers, yet provide fundamental ecosystem services, such as carbon storage (Sjogersten et al. 2021; Hernández and Moreno-Casasola 2018), regulation of freshwater flooding peaks that flow down the basins (Campos et al. 2011), plant and animal resources (González-Marín et al. 2012, 2017), filter water (Verhoeven et al. 2006) and are widely used for livestock grazing in the Mexican tropics (Moreno-Casasola et al. 2012).
Birds are an essential component of wetlands, and permanent monitoring helps expand bird listings, document habitat alterations, and changes due to climate conditions, among other benefits. In areas with migration routes, they allow identification of changes in species population numbers and timing. In some countries, birdwatchers are an essential and reliable source of information on bird occurrence and migration, but in many others, there is a lack 1 Instituto de Ecología AC., Carretera antigua a Coatepec 351, El Haya 91070, Xalapa, Veracruz, México
Ecoguías La Mancha en Movimiento, Colonia La Mancha, Actopan, Veracruz, México. Correspondence author contact:patricia.moreno@inecol.mx
of citizens devoted to bird-watching. Alternatives to fulfill these roles should be explored.
Local residents in rural counties depend on the resources provided by coastal wetlands. These habitats face significant threats due to urbanization, pollution, overexploitation of resources, and climate change. The conservation and preservation of these valuable ecosystems are crucial for the well-being of Mexico´s coastal inhabitants. Conservation initiatives should form part of the existing relationship that is established between nature and people. Community ecotourism serves to raise awareness among local inhabitants of the importance of conserving the ecosystems, utilize them sustainably, and diversify livelihood options. The purpose of this paper is to share the experience of a community ecotourism group called La Mancha en Movimiento (https://www.ecoturismolamancha.org/) with an emphasis on bird watching and monitoring. The latter has proved to be a valuable mechanism to expand knowledge of the site’s diversity, increase local appreciation of wetlands, spark interest in local inhabitants on birds, and increase the group’s income through guiding bird-watching tours. The project we are describing has been developed in the neighboring freshwater wetlands of Laguna La Mancha, in Veracruz, Gulf of Mexico.
Table 1. Surface area occupied by different coastal ecosystems and land uses in the La Mancha region, corresponding to the map shown in Figure 1.
Figure 1. Map of La Mancha region. Three water bodies are shown: El Llano- a hypersaline coastal lagoon towards the north: lake Farallón a freshwater system; Laguna La Mancha. Topography and towns are also shown. The map on the right shows CICOLMA and its protected dune and wetland area, as well as other habitat types in the area.
La Mancha is located in a portion of the center of Veracruz, within the coastal area of the Actopan municipality, with an exciting history of human occupancy and a critical ecosystem and species richness. This site has a long history of occupation by pre-Hispanic societies and has significant cultural and historical value. For example, there are records of Totonacan human settlements in the area, both residential and ceremonial (the archeological sites of Quiahuiztlán, El Bernalillo, Cempoala and Cacalótlan), vestiges of salt extraction, clam farming, fishing, hunting, and gathering, that date back to between 2700-1500 BC (Medellín 1970 in Ortíz-Espejel and Hernández-Trejo 2006).
Like much of the Veracruz shoreline, La Mancha is characterized by discontinuous systems of mangroves, dunes, coastal wetlands, and lagoons – an example of the great coastal diversity present in the region and the basis of the primary activities of many of the inhabitants. Although a small area, it is rich in ecosystems (Table 1) and species (Table 2). Figure 1 shows a map of the region with the location of the water bodies, topography, main populated areas, and a public research institute, CICOLMA (La Mancha Coastal Research Center, part of the Instituto de Ecología A.C. -INECOL), where the bird monitoring has taken place.
The most recently published checklist counts 296 bird species (González-García 2006) for the La Mancha-El Llano area shown in Figure 1 (Table 2). According to this list, resident birds constitute 46% of the reserve’s total avifauna, migratory species from North America 37%, transitory species 13%, and occasional species 4%. Forty-nine species are considered threatened in various categories by national or international legislation. Also, CICOLMA is located on one of the main routes for migratory birds, where nearly 13 million birds travel in a single annual season (RuelasInzunza 2006). Studies have also cataloged 841 plant species representing more than 100 families (Castillo-Campos and Travieso-Bello 2006). Plant richness is a result of the different vegetation types both on dunes (pioneer species, coastal thickets and grasslands, and tropical forests) as well as wetlands (Moreno-Casasola et al. 2010). Land uses also increase plant richness. These plant communities are also important for birds, and migratory routes increase the number of bird species that use these environments as a stopover. Further studies will likely add to the number of other animal species as well.
These characteristics led to the area’s designation as a Wetland of International Importance (Ramsar Site No. 1336) by the Ramsar Convention on Wetlands in 2004. In addition, the area was established as a site for long-term ecological studies by the Mexican Network-LTER (Long Term Ecological Research Site 11) and is recognized as an Important Bird Areas (IBA) by BirdLife International; it is one of the CONABIO’s priority sites and is part of
Table 2. Number of recorded and protected species in the La Mancha-El Llano region. (Adapted from Moreno-Casasola 2006)
Group Species Species protected by the Mexican legislation (NOM059-SEMARNAT-2010) Endemic species
the Coastal and Marine Monitoring Network in Mexico to monitor the red tide. The area belonging to CICOLMA was also registered as a private natural protected area.
FRESHWATER WETLAND RESTORATION
In 2007, a restoration project took place on three hectares of a freshwater wetland that a C4 grass had invaded, Antelope Grass (Echinochloa pyramidalis). The main objective of the restoration research was to recover the original freshwater marsh. Plant structure and richness and the presence of bird, reptiles, and amphibian species were used as success indicators. Antelope Grass was introduced to the area as forage grass for livestock due to its tolerance to flooding. The original wetland of the site was a “popal” (freshwater broad-leaved marsh) dominated by Sagittaria lancifolia (Arrowhead) and Pontederia sagittata (Pickerelweed) as reported by Novelo (1978). The Eco-guides worked actively in its restoration with the researchers involved and helped with a plant and animal monitoring program to determine the success of the restoration activities.
The wetland is located in an interdune depression and has some isolated trees of Pachira aquatica (Apompo), Annona glabra (Pond Apple), and Salix humboldtiana (Willow). By 2016, the wetland was utterly free of the invasive grass, except in a control plot (where this species was not dealt with). Several experiments were done prior to the restoration project to better understand the biology and responses of the invader and dominant native plants (LópezRosas et al. 2006; López-Rosas and Moreno-Casasola 2012; López-Rosas et al. 2015).
Restoration activities involved: 1) cutting vegetation to the soil level before flooding season, 2) piling and burning cut grass to eliminate stolons, 3) extracting and planting native plants in the greenhouse (which proved not to be necessary very soon), 4) monthly manual extraction of grass resprouting, and 5) blocking water passage to keep the area flooded for 16 months to reduce grass resprouting. Other activities took place depending on particular situations:
1) covering the soil with black thick plastic after flooding to reduce resprouting, 2) covering with shade greenhouse mesh to reduce sunlight for C4 grass when natives were abundant and grass was scarce, and 3) leveling soil (40 cm lower) to ensure sufficient flooding. A 1 m wide and 1 m deep channel was excavated to separate the restoring plot from the neighbor’s grazing field. The channel filled naturally with water, and seedlings of Pachira aquatica trees were planted along the border to increase shading and prevent invasion from the field into our plot. The creeping shrub Dalbergia brownei was particularly resistant, covered the trees, killing them, and the rooting place could not be detected, so systemic herbicide was injected into this shrub’s stems. The native hydrophytic species characteristic of the reference wetland recovered (i.e., detailed results can be seen in López-Rosas et al. 2010 and López-Rosas et al. 2013). The project maintained a body of water for the first three years. After that, broad-leaved plants and cattails covered the whole area (Figure 2). Part of these activities involved monitoring bird usage. Enrique Romero (one of the Eco-guides) played a crucial role in this activity and he is still actively monitoring birds in the freshwater wetland and helping researchers understand the importance the wetland restoration project has had for bird life.
CONSERVING COASTAL ECOSYSTEMS AND BIODIVERSITY
La Mancha, with its coastal ecosystem diversity and the field station of CICOLMA, has provided an excellent opportunity to develop sustainable community projects linked to local conservation activities. The relationship established with residents, mainly farmers, cattle ranchers, and fishermen in a town with 450 inhabitants, has allowed a small group to organize around ecotourism, research, restoration, and conservation activities.
ECO-GUIDES AND ECOTOURISM
The “La Mancha en Movimiento” ecotourism project was initiated in 1999. A group of farmers and fishermen have
established themselves as an ecotourism microenterprise that guides groups of tourists as well as high school and university students from different parts of the country along established trails and canals through beaches, dunes, mangroves, and wetlands, including the restored wetlands (Figure 3). Several of them actively participate as field technicians supporting the field research work of researchers, resulting in bachelor’s, master’s, and doctoral students’ theses. Their knowledge of local ecosystems, their flora and fauna, and their capacity for daily observation have made them invaluable to researchers at CICOLMA.
The eco-guides have become community leaders with meaningful participation in their community and in events such as the Shorebird and Wetlands Festival — an annual event since 1999 that allows several organized local groups to develop activities to show visitors their projects. Ecotourism tours, educational workshops, sports, and cultural activities receive up to 3,000 visitors each year, and bird watching is one of the activities. In addition, they have provided training to other community groups in Veracruz (Moreno-Casasola and Salinas-Pulido, 2007) that want to develop ecotourism as a means of making a living. All these and other activities have increased not only their technical abilities but also their environmental awareness. They have become pillars of conservation in the region, significantly helping to reduce clandestine hunting and clearing forests, while increasing residents’ awareness of the environment.
Enrique Romero, one of the members of Ecoguías La Mancha en Movimiento, specialized in bird watching. He found a true vocation, and as he relates: “In the mornings, when I wake up, the first thing I hear is the birds singing; I know who starts and who is next. I know where they perch and where they nest.” He has been conducting ecotourism tours through the mangrove channels, freshwater wetlands, and dunes for 25 years and has provided support to numerous students and researchers in their field studies. All of this has given him great experience not only in the identification
Figure 2. View of the popal restoration in areas previously occupied by Antelope Grass: A) view of the restored wetland with a water body in 2014, and B) view of the restored wetland completely covered by broad-leaved plants in 2019. (Photos by P. Moreno-Casasola).
and habits of birds but also great observational capacity, sensitivity, and environmental awareness of conservation issues.
Since 2007, Enrique Romero has systematically walked monthly, with only brief interruptions, a path surrounding the popal restoration area and crossing the wetland along a series of wooden walkways (Figure 3). Enrique has been monitoring the presence of birds in this relatively small restored wetland within CICOLMA (3 hectares). He has recorded 200 different species of birds (Table 3), representing almost 50% of the total number of birds detected in the La Mancha-El Llano region. The Appendix (at the end of this article) lists the birds registered during the monitoring.
BIRD OBSERVATION AND MONITORING
Through his observations, rare species that had not been reported at the site have been detected, such as the Green Macaw (Ara militaris). Two individuals of this species were seen flying over the wetland on December 17, 2012, and Enrique commented that he had already heard the characteristic calls of these birds on other occasions. However, it was not until then that they were recorded as part of the monitoring work. These types of observations highlight the importance of the La Mancha-El Llano region and the participation of locals in the monitoring work.
Another outstanding species detected is the Northern Pootoo (Nyctibius jamaiscensis). This bird is characterized by being a shy species with nocturnal habits that, during the day, remains entirely still on the trunk of a tree to conceal itself (Figure 4). Since it has preferred resting places, it is possible to find it at the exact location on different days. Many of the visiting bird watchers at CICOLMA have this species on their target lists, and Enrique has been able to take them to its perch to observe it.
Bird monitoring has also revealed some migration patterns of different birds. They are marked in the Appendix. In one morning in November 2022, Enrique recorded 1,128 individuals of the American White Pelican (Pelecanus erythrorhynchus) flying over the site (Figure 5). Although
Table 3. The number of bird species in each category registered during the monitoring developed from 2012 to 2022.
Figure 3. Location of the wetland site where the bird monitoring is taking place within the restoration area of CICOLMA. The monitoring route is shown with the yellow line. The two yellow arrows indicate the direction of the mangrove route.
La Mancha is recognized as a migratory route for many birds of prey and sea birds, many migratory birds occupy these sites as resting points. Such is the case of species like the White-winged Dove (Zenaida asiatica) or the Eastern Kingbird (Tyrannus tyrannus), which can be seen perching on trees in groups of hundreds of individuals.
The monitoring has also recorded several species in the area protected by national or international environmental legislation. Various parrot species, such as the Yellowheaded Parrot (Amazona oratrix) or the Red-lored Parrot (Amazona autumnalis), stand out (Figure 6).
In the restored wetland, although native hydrophytes were restored, continuous periods of drought during the last several years (2016-2021) caused the popal to go dry for extended periods. Consequently, some aquatic bird species, like ducks, gallinules, and grebes, are no longer seen at the restoration site, and the overall richness has significantly decreased compared to the first years of the monitoring (Figure 7). However, the increased dry terrain favored other bird species that tend to forage in more vegetated areas. These birds including the Spot-breasted Wren (Pheugopedius maculipectus) or the Ovenbird (Seiurus aurocapilla) were only registered by the monitoring recently. Also, there are sightings of new birds of prey, like the Peregrine Falcon (Falco peregrinus) or the White-tailed Hawk (Geranoaetus albicaudatus). These changes in the species composition of the site show how dynamic bird usage is and could serve as bioindicators of the habitat successional processes that occur on a larger timescale (Figure 7). The participation of residents is the only way to ensure long-term monitoring. Community monitoring has been practiced in some countries where bird watching is an important hobby, i.e., Great Britain. Our experience through a sustainable research/ ecotourism project that has generated income and helps develop awareness and technical capacities has proved successful. The eco-guides have helped us train other rural eco-guides in other parts of Veracruz, and in these groups,
there is always one or two persons who become very interested in birds.
In most ecological communities, the largest number of individuals comes from a few very abundant species, while species with only a few individuals represent the vast majority of species present in the community. If we graph the relative abundance of the species registered by Enrique´s bird monitoring in a year, we can see that this is true for the bird community at the restoration site. From morning to afternoon, this pattern stays the same, but the most abundant species varies. At the beginning of the day, the most common species is the White-winged Dove (Zenaida asiatica), a migratory species that travels in groups of hundreds at the site, followed by the Olive-throated Parakeet (Eupsittula nana). These doves are only seen at La Mancha in the autumn-winter season, between September and December. As the sun sets, the abundance of doves gets lower, and the parakeets become the most abundant species, followed
Figure 4. Northern Pootoo (Nytibius jamaiscensis) at its roosting perch during the day. (Photo from NaturaList - La Mancha en Movimiento)
Figure 5. American White Pelican (Pelecanus erythrotynchus) flying over the La Mancha Lagoon on their migratory winter route towards the south. (Photo from NaturaLista - La Mancha en Movimiento)
Figure 6. Different species of parrots protected by the national environmental legislation have been detected: Yellow-headed Parrot (Amazona oratrix) on left and Red-lored Parrot (Amazona autumnalis) on right. (Photos from NaturaLista - La Mancha en Movimiento).
by the Montezuma Oropendola (Psarocolius montezuma). These gregarious birds return to the same perching sites or their hanging nests at the restoration site to roost during the night. Some other species, like the Broad-billed Ani (Crotophaga sulcirostris), the Great Kiskadee (Pitangus sulphuratus), or the Golden-fronted Woodpecker (Melanerpes aurifrons), remain with similar relative abundance numbers throughout the day, and we can expect to see them at any given moment. These patterns show how the wetland is differentially used by several species (and not only wetland species) as the day passes (Figure 8).
As stated before, most of the species in any given community are represented by few individuals. In longterm monitoring such as the one made in La Mancha, we can expect that many species will be recorded only one or two times at most. These species are called singletons and doubletons (SD species to abbreviate), respectively, and their presence at the study site can give us information about some ecosystem characteristics. Of the 200 species detected, almost 23% were SD species. Whilst some of these could be rare species, the truth is that sometimes a bird can only be registered a few times because of the presence or absence of particular habitats or the shy and elusive behavior of some species. In this monitoring, some waterbirds were detected only once at the popal restoration site, although they are more common in the lagoons in the region, at least in one season. Examples are the Neotropic Cormorant (Nannopterum brasilianum) and the Spotted Sandpiper (Actitis macularius). Other singletons were
Figure 7. Number of species detected along the restored wetland in La Mancha in two time periods. The absence of overlapping on the confidence intervals (shaded areas) indicates that the richness of both communities is significatively different, being lower between 2021 and 2022 (blue line).
nocturnal species, like the Black-crowned Night Heron (Nycticorax nycticorax) or the Northern Potoo (Nyctibius jamaiscensis). Some other records were rare and out-ofrange sightings, like the Military Macaw (Ara militaris) or the Bonaparte’s Gull (Chroicocephalus philadelphia). Also, the monitoring registered some nationally protected species using this restored wetland, like the Limpkin (Aramus guarauna, Threatened) or the Yellow-headed Parrot (Amazona oratrix). These unique sightings give insight into the broader-scale distribution patterns of these species and the range of habitats and conditions where they can occur
Figure 8. Rank abundance curves showing the proportion or relative abundance (pi) of birds for morning and afternoon point-counts in the freshwater wetland. Some birds use the restored wetland differentially through the day, with migrant species like the White-winged Dove (Zenaida asiatica) being more abundant during early hours; gregarious birds that are recurrent with their perching sites, like the Montezuma Oropendola (Psarocolius montezuma) become more abundant in the wetland at dusk. Some other birds are abundant all day long.
throughout the year, deepening our understanding of their dynamics and enhancing our knowledge of their conservation.
Figures 9 and 10 show several species of wetland birds in La Mancha. The source of the photographs is NaturaLista, a CONABIO project where photos are uploaded, and experts identify them or check the identification given by the photographer. La Mancha en Movimiento members have uploaded over 500 plant and animal photographs taken in La Mancha.
CONCLUSION
Although La Mancha is a small site, it has several coastal ecosystems that favor species richness. The migration corridor increases this diversity, making it a vital monitoring site. The interaction between academics and residents, such as the eco-guides, has proven invaluable for generating information over time and supporting local conservation efforts. Community ecotourism can be a mechanism that not only promotes environmental awareness among visitors but also helps advance local research projects and betters the income of local people, all while helping the conservation of natural ecosystems.
ACKNOWLEDGMENTS
We thank Roberto Monroy for the maps and the Ecoguías for their constant help in the field.
REFERENCES
Blankespoor, B., S. Dasgupta, and G.M. Lange. 2017. Mangroves as a protection from storm surges in a changing climate. Ambio 46: 478–491. https://doi.org/10.1007/s13280-016-0838-x
Campos, A.C., M.E. Hernández, P. Moreno-Casasola, E.E. Cejudo, R.A. Robledo, and D. Infante-Mata. 2011. Soil water retention and carbon pools in tropical forested wetlands and marshes of the Gulf of Mexico. Hydrological Sciences Journal 56: 1388-1406. https://doi.org/10.1080/0 2626667.2011.629786
Castillo-Campos, G., and A.C. Travieso-Bello. 2006. La flora. In: P. Moreno-Casasola (ed). Entornos Veracruzanos: La Costa de La Mancha Instituto de Ecología, A.C. Xalapa, Veracruz. México. 171-204. ISBN: 970-709-067-7
Clements, J.F., P.C. Rasmussen, T.S. Schulenberg, M.J. Iliff, T.A. Fredericks, J.A. Gerbracht, D. Lepage, A. Spencer, S.M. Billerman, B.L. Sullivan, and C.L. Wood. 2023. The eBird/Clements checklist of Birds of the World: v2023. Downloaded from https://www.birds.cornell.edu/ clementschecklist/download/
CONABIO. 2021. Distribución de los manglares en México en 2020’, escala: 1:50000. edición: 1. Comisión Nacional para el Conocimiento y Uso de la Biodiversidad. Sistema de Monitoreo de los Manglares de México (SMMM). Ciudad de México, México. González-García, F. 2006. Las aves. In: P. Moreno-Casasola (ed). Entornos Veracruzanos: La Costa de La Mancha. Instituto de Ecología, A.C. Xalapa, Veracruz. 423-448. ISBN: 970-709-067-7 González-Marín, R.M., P. Moreno-Casasola, R. Orellana, and A. Castillo. 2012. Palm use and social values in rural communities on the coastal plains of Veracruz, Mexico. Environment, Development and Sustainability 14: 541-555. https://doi.org/10.1007/s10668-012-9343-y
González-Marín, R.M., P. Moreno-Casasola, A.A. Castro-Luna, and A. Castillo. 2017. Regaining the traditional use of wildlife in wetlands: ensuring food security in the face of global climate change. Regional Environmental Change 17: 1343-1354. https:// DOI 10.1007/s10113016-0955-x.
Figure 9. Resident wading birds are seen in La Mancha wetlands throughout the year. Top-left, Reddish Egret (Egretta rufescens), listed as “At Risk of Extinction” by national legislation (NOM-059-SEMARNAT-2010) and “Near Threatened” by IUCN. Top-right, Great Egret (Ardea alba) and Snowy Egret (Egretta thula). Bottom, Green Heron (Butorides virescens). (Photos from NaturaLista - La Mancha en Movimiento).
Hernández, M.E., and P. Moreno-Casasola. 2018. Almacenes y flujos de carbono en humedales de agua dulce en México. Madera y Bosques 24: 1-12. e2401881. https://doi.org/10.21829/myb.2018.2401881
Herrera-Silveira, J.A., M.A. Pech-Cárdenas, S.M. Morales-Ojeda, S. Cinco-Castro, A. Camacho-Rico, J.P. Caamal Sosa, J.E. Mendoza-Martínez, E.Y. Pech-Poot, J. Montero, and C. Teutli-Hernandez. 2020. Blue carbon of Mexico, carbon stocks and fluxes: a systematic review. PeerJ 8:e8790. https://doi.org/10.7717/peerj.8790
López Rosas, H.L., P. Moreno-Casasola, and I.A. Mendelssohn. 2006. Effects of experimental disturbances on a tropical freshwater marsh invaded by the African grass Echinochloa pyramidalis Wetlands 26(2): 593-604. https://doi.org/10.1672/0277-5212(2006)26[593:EOEDOA]2. 0.CO;2
López-Rosas, H., F. López-Barrera, P. Moreno-Casasola, G. AguirreLeón, E. Cázares-Hernández, and L. Sánchez-Higueredo. 2010. Indicators of recovery in a tropical freshwater marsh invaded by an African grass. Ecological Restoration 28: 324-332. https://www.jstor.org/ stable/43443264
López-Rosas, H., and P. Moreno-Casasola. 2012. Invader versus natives: Effects of hydroperiod on competition between hydrophytes in a tropical freshwater marsh. Basic and Applied Ecology 13: 40-49. https://doi. org/10.1016/j.baae.2011.10.004
López Rosas, H., P. Moreno-Casasola, F. López Barrera, L.E. Sánchez Higueredo, V.E. Espejel González, and J. Vázquez. 2013. Interdune wetland restoration in central Veracruz Mexico: plant diversity recovery mediated by hydroperiod. In: M.L Martínez, J.B. Gallego-Fernández, and P.A. Hesp (eds). Coastal Dune Restoration. Springer Verlag: 255-269. López-Rosas, H.L., P. Moreno-Casasola, and V.E.E. González. 2015. Shade treatment affects structure and recovery of invasive C4 African grass Echinochloa pyramidalis Ecology and Evolution 5(6): 1327-1342. https://doi.org/10.1002/ece3.1434
López-Portillo, J., M.L. Martínez, P. Hesp, J.R. Hernández Santana, V.M. Vásquez-Reyes, L.R. Gómez Aguilar, A.P. Méndez Linares, O. JiménezOrocio, and S.L. Gachuz Delgado. 2011. Atlas de las Costas de Veracruz Manglares y Dunas Gobierno del Estado de Veracruz para la Conmemoración de la Independencia Nacional y de la Revolución Mexicana- Universidad Veracruzana. ISBN: 978-607-502-101-0
Medellín, Z.A. 1970. Cerámica del Totonacapan. Universidad Veracruzana. Xalapa. Veracruz.
Moreno-Casasola, P. (ed). 2006. Entornos Veracruzanos: la Costa de La Mancha. Instituto de Ecología A.C. Xalapa. ISBN: 970-709-067-7
Moreno-Casasola, P, and G. Salinas-Pulido. 2007. Programa de desarrollo comunitario sustentable y plan de manejo para la protección y conservación del Sitio Ramsar La Mancha-El Llano. In: G. Halffter, S, Guevara, and A. Melice (eds). Hacia una Cultura de Conservación de la Diversidad Biológica. Monografías Tercer Milenio vol. 6. Sociedad Entomológica Aragonesa. Zaragoza. 173-185. ISBN: 978-84-935872-0-8
Moreno-Casasola, P., E. Cejudo-Espinosa, A. Capistran-Barradas, D. Infante-Mata, H. López-Rosas, G. Castillo-Campos, J. Pale-Pale, and A. Campos-Cascaredo. 2010. Floristic composition, diversity and ecology of freshwater marshes in the central coastal plain of Veracruz, Mexico. Boletín de la Sociedad Botánica de México 87: 29-50. https://doi. org/10.17129/botsci.291
Moreno-Casasola, P., H. López-Rosas, and K. Rodríguez-Medina. 2012. From tropical wetlands to pastures on the coast of the Gulf of Mexico. Pastos 42: 183-215. http://polired.upm.es/index.php/pastos/article/ view/2249/2330
Moreno-Casasola, P., M.E. Hernández, and A. Campos-Cascaredo. 2017. Hydrology, soil carbon sequestration and water retention along a coastal wetland gradient in the Alvarado Lagoon System, Veracruz, Mexico. In: M.L Martínez, A. Taramelli, R. Silva (eds.) Coastal Resilience: Exploring the Many Challenges from Different Viewpoints. Journal of Coastal Research, Special Issue 77: 104-115. https://doi.org/10.2112/SI77-011.1
Novelo, R.A. 1978. La vegetación de la estación biológica El Morro de la Mancha, Veracruz. Biotica 3: 9-23.
Ortíz-Espejel, B., and H. Hernández-Trejo. 2006. La historia socioambiental. In: P. Moreno-Casasola (ed). Entornos Veracruzanos: La Costa de La Mancha. Instituto de Ecología, A.C. Xalapa, Veracruz. 25-34. ISBN: 970-709-067-7
Ruelas-Inzunza, E. 2006. La migración de las aves. In: P. Moreno-Casasola (ed). Entornos Veracruzanos: La Costa de La Mancha. Instituto de Ecología, A.C. Xalapa, Veracruz. 449-460. ISBN: 970-709-067-7
Sjogersten, S., B. de la Barreda-Bautista, C. Brown, D. Boyd, H. LópezRosas, E. Hernández, R. Monroy, M. Rincón, C. Vane, V. Moss-Hayes, J.A. Gallardo-Cruz, D. Infante-Mata, J. Hoyos-Santillán, J.V. Solórzano, C. Peralta-Carreta, and P. Moreno-Casasola. 2021. Coastal wetland ecosystems deliver large carbon stocks in tropical Mexico. Geoderma 403: 115173. https://doi.org/10.1016/j.geoderma.2021.115173
Verhoeven, J.T.A., B. Arheimer, C. Yin, and M.M. Hefting. 2006. Regional and global concerns over wetlands and water quality. Trends in Ecology and Evolution 21: 96-103. https://doi.org/10.1016/j. tree.2005.11.015
Figure 10. Some waterbird species found in La Mancha wetlands. Top-left, Redhead (Aythya americana). Top-right, Wood Stork (Mycteria americana). Bottom-left, Great Blue Heron (Ardea herodias). Bottom-right, Neotropical Cormorant (Nannopterum brasilianum). (Photos from NaturaLista – La Mancha en Movimiento).
Physical-Biotic Structure in an AquaticTerrestrial Convergence Area in the San Francisco
Marsh of the Ayapel Swamp System, Córdoba, Colombia
Maria Díaz-Mesa1, Néstor Aguirre-Ramírez, Fabio VélezMacías, and Esnedy Hernández-Atilano
ABSTRACT
This research analyzed the effect of border vegetation and pastures on the physical-biotic structure in a border sector of an aquatic-terrestrial convergence area, of the San Francisco Marsh of the Ayapel Swamp System (ASS), through organism groups, such as aquatic and terrestrial vegetation, aquatic macroinvertebrates and periphyton. In general, during the first phase of the flood pulse, a greater abundance of aquatic vegetation and periphyton algae was found (18 genera were determined in the forest and 16 in the pasture). Additionally, three families of aquatic macroinvertebrates were found in each study area. Good quality water was also found in the forest area, while moderately polluted water was found in the pasture. In the second phase of the flood pulse, the nutrients increased, the aquatic vegetation and periphyton algae densities decreased (seven genera were found in the forest and eight in the pasture), whereas the aquatic macroinvertebrates density increased, identifying six families in the forest and four in the pasture. Finally, both study areas had moderately polluted water. It is important to conserve and recover the native vegetation because it allows the presence of periphyton organisms, and aquatic macroinvertebrates, thereby making possible inorganic carbon fixation, nutrients recycling and organic matter availability. These contribute to the fish recovery, which is a fundamental economic resource in Ayapel and the surrounding areas.
Esta investigación analizó el efecto de la vegetación de borde y de las pasturas, sobre la estructura físico-biótica en un sector de borde de una zona de convergencia acuáticoterrestre, de la ciénaga San Francisco del sistema cenagoso de Ayapel-SCA, a través de grupos de organismos, como vegetación acuática y terrestre, macroinvertebrados acuáticos y las algas del perifiton. En general, en la primera fase del pulso de inundación, se encontró mayor abundancia de vegetación acuática y de algas pertenecientes al perifiton (se determinaron 18 géneros en el bosque y 16 en el pasto).
Además, en cada una de las zonas de estudio se hallaron 3 familias de macroinvertebrados acuáticos. También se encontró agua de buena calidad en la zona de bosque, mientras que en el pasto hubo agua de moderada contaminación. En la segunda fase del pulso de inundación, aumentaron los nutrientes y disminuyeron las densidades de vegetación acuática y algas del perifiton (se hallaron 7 géneros en el bosque y 8 en el pasto), sin embargo, aumentó la densidad de macroinvertebrados acuáticos, determinándose 6 familias en el bosque y 4 en el pasto. Finalmente, ambas zonas de estudio tuvieron aguas en moderada contaminación. Es importante conservar y recuperar la vegetación nativa, debido a que permite la presencia de organismos del perifiton y los macroinvertebrados acuáticos, posibilitando así la fijación de carbono inorgánico, el reciclaje de nutrientes y la disponibilidad de materia orgánica. Estos favorecen a que se recupere la oferta de peces, siendo un recurso económico fundamental en Ayapel y las zonas aledañas.
Palabras clave: Vegetación de borde, pulso de inundación, macroinvertebrados acuáticos, perifiton y líneas transectas
INTRODUCTION
Floodplains are complex and dynamic wetland systems that oscillate periodically between the terrestrial and aquatic phases, flooded by lateral overflow of rivers or lakes, and by direct precipitation or groundwater. The resulting physical-chemical characteristics cause the biota to respond by adapting to their characteristics (Ramsar 2007; Rúa et al. 2014).
Wetlands are considered among the most productive environments in the world, they are strategic ecosystems ecologically and socially as they act as regulators of the hydrological cycle and are an important source of goods and services for the livelihood of surrounding populations (Ramsar 2016; Rúa et al. 2014). They are a source and sink of sediment, organic matter and nutrients, on which countless plant and animal species depend for subsistence. Making it a suitable habitat for the establishment of great biological diversity, such as species of birds, mammals, reptiles, amphibians, fish and invertebrates (Ramsar 2016; Rúa et al. 2014). The global area of natural wetlands is estimated to have decreased by 3.4 million km2, corresponding to a loss of approximately 21% (Fluet-Chouinard et al. 2023). The most significant impact factors are pollution (54%), use of biological resources (53%), modification of natural systems (53%), and agriculture and aquaculture (42%). More than half of wetlands are affected by three to four factors (Xu et al. 2019). Other causes associated with wetland deterioration are extreme climatic events (severe droughts and floods), eutrophication, sedimentation, erosion, mining, drainage, infrastructure development such as
1 GeoLimna Group, Environmental School, Faculty of Engineering, University of Antioquia, Cra 55 Av. del Ferrocarril, Medellín, Colombia; correspondence author contact:camila.diaz@udea.edu.co
dams, dykes, channelization, mines and roads, and tourism and recreational activities (Gardner and Finlayson 2018; Mason et al. 2021; Patino and Estupinan-Suarez 2016; Kinimo et al. 2018). These activities cause deterioration of riparian vegetation, including arboreal vegetation, aquatic vegetation and pastures, which give stability to the ecosystem, provide ecological functions for the amphibians, reptiles, birds and mammals, and are a fundamental resource for fishes (Clavijo and López 2017).
In the Ayapel Swamp System (ASS), 70% of the aquatic plants are free-floating, whose roots provide shelter and food areas for small fishes along with spawning, nesting, and raising of larvae and juveniles. Fifty-two species of fish have been reported, including 15 migratory species. A common evergreen riparian tree, Symmeria paniculata is found in the swamp. It has the characteristics and ecological functions of the mangroves and serves as a niche for many species of birds, mammals, reptiles, and fishes (Marín 2012). The research question formulated in this project was: How is the physical-biotic structure in an aquatic-terrestrial convergence area with arboreal vegetation and pastures, in the San Francisco Marsh of the Ayapel Swamp System during two contrasting moments of the hydrologic cycle? Therefore, our hypothesis is that removing the semi-aquatic arboreal vegetation has a negative effect on the complexity and stability of the ecotone (Aquatic Terrestrial Transition Zone - ATTZ). The terrain becomes more unstable due to the grazing, thereby negatively impacting water quality and biodiversity among other environmental conditions and the negative impact it has on ecosystem services. This negative impact occurs because the riparian vegetation dampens
flood pulses, prevents erosion, contributes organic matter to the wetland, functions as a filter improving water quality, controls the entry of pollutants, regulates temperature and the flow of matter and energy (Clavijo and López 2017; Greer et al. 2012; Möller 2011; Rodríguez et al. 2012), protecting the littoral zone from the natural and anthropic pressures to which the system is subjected, in addition to having decisive structural and operational functions for the species, since it is the site of their feeding and reproduction.
To analyze the effect of the presence of arboreal vegetation on the physical-biotic structure and the impact of its removal and replacing it with pasture, we conducted a baseline study examining a relatively undisturbed section of the San Francisco Marsh of the Ayapel Swamp System. This study would provide a reference condition for later assessing conditions in disturbed áreas that would then establish its effect on water quality and aquatic biodiversity.
METHODOLOGY
Study Area
The Ayapel Swamp System (ASS), part of the wetland and floodplain macro-ecosystem in the Momposina Depression, is a system of lakes on the alluvial plain of the San Jorge River, located in the Colombian Caribbean side in the Department of Córdoba (altitude of 20 m.a.s.l.) (Aguilera 2009). The hydrological cycle in Ayapel is monomodal, with a rainy season (between April and November) and a dry season (between December and March). As a result, the flood pulse presents a season of low water from December into March, high water in August and September, and the so-called rising and falling water transitions in the two
Figure 1. Ayapel Location, Córdoba; Ramsar polygon and sampling site (Prepared by Maria Díaz-Mesa).
remaining intervals (Serna and Cañón 2020). Depth ranges can vary between 2 and 8 meters in the high water phase, and in dry seasons, between 1 and 3 meters; the area of the water mirror is 145 km2 in the high water season and in the dry season it can reach 40 km2 (Serna and Cañón 2020).
Field Visits
San Francisco Marsh was chosen as a sampling site. This site was selected because it is in relatively natural conditions with low anthropic influence. San Francisco is located in a fluvial environment, its geoforms originate from erosion processes of the water body currents and the accumulation or sedimentation of materials. It has a flat morphology and plain or gently inclined slopes. Areas of the marsh were chosen to have grasslands and zones of trees and shrubs where the main species cover was Symmeria paniculata. Two visits were made to the study area to collect the samples and the necessary information at two contrasting moments of the flood pulse, the first moment in rising waters (July/2018) (8°17’4.95”N, 75°2’26.04”W), and the second one in low waters (February/2019) (8°17’1.26”N, 75°2’16.85”W). The two observations were made in different sectors due to the fact that the first sector was completely dry at low water phase.
Vegetation Sampling, Identification, and Analysis
At the sampling sites, four 10 m transect lines were placed, located 5 m over the land area, and 5 m over the aquatic area. Two transect lines were in forest area (B1 y B2) and two transect lines were in pasture area (P1 y P2).In the terrestrial area, the taxonomic identification of the vegeta-
tion was carried out, of each individual along the rope was carried out. The vegetation taxonomy was identified at the sampling site, with the assistance of Prof. Dr. rer. nat. Néstor Aguirre. Contrasted with virtual collections: Colombian National Herbarium (COL, for its Spanish acronym) –GBIF (http://www.biovirtual.unal.edu.co/, and https://www. gbif.org/), The Tropicos Database (https://www.tropicos. org/home), and Global Plants JSTOR (https://plants.jstor. org/).
The surface soil samples were extracted through a shovel-width hole to a maximum depth of 20 cm. Moisture, density, and porosity were evaluated by the gravimetric method, which consisted of determining the masses of the wet and dry samples, and by difference, the moisture content was determined. Sediment density was calculated from the dry mass and the measured sample volume, a method described by Dadey, Janecek, and Klaus (1992). As for the granulometric analysis, it was performed by the hydrometer method according to the procedure described by the I.N.V.E--123-E-13 standard of 2007.
In the aquatic area, vegetation samples were collected using a 1 m² quadrant located over the water surface. In these samples, the aquatic macroinvertebrates and the periphyton associated with their roots were extracted, based on the methodology of Aguirre and Caicedo (2015). The vegetation taxonomy was identified at the sampling site, while those individuals for which this was not possible were preserved in alcohol, and were subsequently identified at the herbarium of the University of Antioquia (B2 - 411), with the assistance of Professor Francisco Javier Roldán Palacio.
Figure 2. Aerial view of the San Francisco Marsh (from Google Earth)
For the identification of the aquatic macroinvertebrates, the stereoscope BST-606 (BOECO + Co - Hamburg, Germany) was used, as well as the taxonomic keys of Machado (1989), Linares et al. (2019), Arnett and Thomas (1999), Lancaster and Downes (2014), and Domínguez and Fernández (2009). After the identification, the abundance and richness were calculated based on the methodology of Aguirre and Caicedo (2015) and the Standard Methods (2013). For identification of the periphytic algae, 30 fields were observed with 40X in the Inverted Microscope BIB-100 (BOECO + Co - Hamburg, Germany). Periphyton identification was made with the keys of Streble and Krauter (1988), and Taylor et al. (2007), and consulting the Algaebase website (https://www.algaebase.org). The Past3 software (Øyvind Hammer, Natural History Museum, University of Oslo) was used to calculate the diversity indices (Shannon-Weaver (H) diversity index, Simpson (D) dominance index and Pielou (J) equity index).
Water Quality Sampling and Analysis
For water quality, samples were taken in the subsurface part (at 20cm depth) of the water column in each area (pasture and forest). Dissolved oxygen, temperature, conductivity, and pH were measured in situ with the Multiparametric 3630 IDS (WTW - Bavaria, Germany). Turbidity was measured with the 2100Q turbidimeter (HACH - Iowa, USA), while the carbon dioxide content was measured by the colorimetric method. Phosphorus content was measured
with the PF-12 photometer (Macherey-Nagel - Düren, Germany), using the Visocolor Kit reference 931-284 with measurement range of 0.20-5.00 mg.L-1 PO4‾-P (MachereyNagel - Düren, Germany). In the same way, the concentrations of nitrites, nitrates, and ammonium were measured using the Visocolor Kits reference 931-244 (measuring range 0.02-0.50 mg.L-1 NO2-), reference 931-241 (measuring range 1.00-120.00 mg.L-1 NO3‾), and reference 931-010 (measuring range 0.50-15.00 mg.L-1 NH4+), respectively (Macherey-Nagel - Düren, Germany). At the Laboratory of Environmental Studies (LEA, for its Spanish acronym) of the University of Antioquia, the total suspended solids, volatile suspended solids, and fixed suspended solids were calculated by the gravimetric method, following the Standard Methods for water and wastewater analysis (PHA 2013). Finally, the data were analyzed in the laboratory and the results interpreted, applying the diversity indices according to the methodology of Aguirre and Caicedo (2015) and Standard Methods (2013). The similarity between the sampling sites was also analyzed using the BioDiversity Pro 2.0 software (SAMS - Oban, United Kingdom) through the Bray - Curtis Cluster analysis.
RESULTS
Rising Water Phase
Forest Area. The terrestrial vegetation coverage was composed only of Symmeria paniculata (Approx. 3m tall), it is a common, evergreen tree species from the lowest part of the flooding gradient in inundation forests (Waldhoff, D.
Table 1. Comparison of soil type, physicochemical and biotic characteristics of the San Francisco Marsh.
et al. 2002). The aquatic area contained Salvinia minima, Eichhornia crassipes, and Scleria sp. (Figure 3b). The soil found was fine-grained, classified as 34.5% silt, 18.7% clay and 46.8% fine sands. And its physical characteristics were 53.7% moisture, density 1.9 g/cm3 and porosity 33.1% (Table 1). The physicochemical characteristics, such as Secchi depth, turbidity, water temperature, and dissolved oxygen, were: 1.05 m, 8.15 NTU, 31.60 °C and 5.85 mg.L1 O2, respectively; and the total suspended solids were 50.00 mg.L-1, with 40.00 mg.L-1 of volatile suspended solids and 10.00 mg.L-1 of fixed solids. During this season, the concentrations of nitrites and nitrates were below the detection limit of the measurement method, and the phosphorus concentration in the phosphates was 0.06 mg.L-1 PO4‾-P (Table 1).
Additionally, the biota associated with the aquatic vegetation roots in this area had aquatic macroinvertebrates from the families Ampullariidae, Hydrophilidae, and Planorbidae, with the latter being the most abundant, with 11 individuals in B1 and 13 in B2 (Table 2 and Figure 4).
There were 18 different genera of algae belonging to
the periphyton, being Cymbella sp. (145 org.mL-1 in B1 and 170 org.mL-1 in B2) and Diatoma sp. (187 org.mL-1 in B1 and 119 org.mL-1) (Table 3 and Figure 5) being the most abundant. The Shannon-Weaver diversity calculated was 3.07, and 3.09 in B1 and B2, respectively. Simpson dominance with values of 0.06 for B1 and B2. And Pielou equity was 0.90, and 0.88, in B1 and B2, respectively (Table 1).
Pasture Area. The terrestrial vegetation coverage was composed of Humidicola grass. The aquatic area contained Salvinia minima, Eichhornia crassipes, Scleria sp., Ludwigia sp. and Eichhornia heterosperma (Figure 3a). The soil found was fine-grained, classified as 12.8% silt, 27% clay and 60.2% fine sands. And its physical characteristics were 89% moisture, density 1.6 g/cm3 and porosity 54.6% (Table 1). The physicochemical characteristics, such as Secchi depth, turbidity, water temperature, and dissolved oxygen, were: 0.70 m, 9.37 NTU, 32.45 °C, and 4.19 mg.L1 O2, respectively, and total suspended solids were 85.00 mg.L-1, with 50.00 mg.L-1 of fixed suspended solids and 35.00 mg.L-1 of volatile suspended solids. The concentra-
Figure 3. Topographic profiles, San Francisco Marsh of the ASS: a) pasture area, rising waters, b) forest area, rising waters, c) pasture area, low waters, and d) forest area, low waters. (Illustration by Sara Ramirez, 2019)
Table 2. Abundance and relative abundance of aquatic macroinvertebrates per transect line, associated with the aquatic vegetation roots in the San Francisco Marsh.
tions of nitrites and nitrates were below the detection limit of the measurement method, and the phosphorus concentration in the phosphates was 0.07 mg.L-1 PO4‾-P (Table 1). The biota associated with the aquatic vegetation roots were aquatic macroinvertebrates from the families Ampullariidae, Dytiscidae, and Hydrophilidae, the latter being the most abundant (10 organisms at P1 and 11 at P2) (Table 2 and Figure 4). There were a total of 16 different genera of algae belonging to the periphyton, with Diatoma sp. (68 org.mL-1 at P1 and 94 org.mL-1 at P2) and Fragilaria sp. (60 org.mL-1 at P1 and 17 org.mL-1 at P2) being the most abundant (Table 3 and Figure 5). The Shannon-Weaver diversity were 2.33, and 2.61 for P1 and P2, respectively. Simpson dominance with values of 0.12 and 0.09 for P1 and P2, respectively. And the Pielou equity were 0.91 and 0.90, in P1, P2, respectively (Table 1).
Low Water Phase
Forest Area. The terrestrial part in forest and pasture areas showed Humidicola grass. The reason why grass was found in both areas, although one of them was forest (as shown in Figure 2), was because in this season the water surface contracts, exposing areas that in previous seasons were covered by a water column, and the vegetation that germinates first are grasses, as explained by Junk in the flood pulse theory (1989). Eichhornia crassipes was found in the aquatic area (Figure 3d). The soil found was finegrained, classified as 50.1% silt, 13.6% clay and 36.2% fine sands. And its physical characteristics were 54.4% moisture, density 1.0 g/cm3 and porosity 68.9% (Table 1). The Secchi depth, turbidity, water temperature and dissolved oxygen were: 0.19 m, 97.70 NTU, 33.40 °C, and
5.04 mg.L-1 O2, respectively (Table 1). The total suspended solids were 80.50 mg.L-1, containing 65.00 mg.L-1 of fixed suspended solids and 15.50 mg.L-1 of volatile suspended solids. During that time, the nutrient levels increased; the nitrites, nitrates, and the orthophosphates phosphorus were 0.23 mg.L-1NO2‾, 21.50 mg.L-1 NO3‾, and 2.85 mg.L1PO4‾-P, respectively (Table 1). The biota associated with the aquatic vegetation roots in this area showed aquatic macroinvertebrates of the families Carabidae, Dytiscidae, Hydrophilidae, Noteridae, Planorbidae, and Thiaridae, being Noteridae the most abundant: 37 individuals in B1 and 26 in B2 (Table 2 and Figure 4). A total of 7 different genera of algae belonging to the periphyton were presented, with Pinnularia sp. being the most abundant in B2 with 68 org.mL-1, and Navicula sp. in B1 with 17 org.mL-1 (Table 3 and Figure 5). Shannon-Weaver diversity was values were 1.35 and 1.64, for B1 and B2, respectively. Simpson dominance were 0.27 and 0.24 for B1 and B2. And Pielou equity, the values were 0.98 and 0.84, in B1 and B2, respectively (Table 1).
Pasture Area. Salvinia auriculata was found in the aquatic area of the pasture (Figure 3c). The soil found was fine-grained, classified as 23.9% silt, 15.4% clay and 60.8% fine sands. And its physical characteristics were 94.4% moisture, density 2.1 g/cm3 and porosity 32.9% (Table 1).The physicochemical characteristics, such as Secchi depth, turbidity, water temperature, and dissolved oxygen, associated with the forest area were: 0.11 m, 257.50 NTU, 33.40 °C, and 0.26 mg.L-1 O2, respectively. The total suspended solids were 61.50 mg.L-1, divided into fixed suspended solids (48.50 mg.L-1) and volatile suspended solids (13.00 mg.L-1) (Table 1). The nutrient concentrations
increased compared to the previous season. The nitrates, nitrites, and the phosphorus in the orthophosphates were 12.00 mg.L-1 NO3‾, 0.12 mg.L-1 NO2‾, and 1.65 mg.L-1 PO4‾-P, respectively (Table 1). The biota associated with the aquatic vegetation roots of this transect presented aquatic macroinvertebrates of the families Dytiscidae, Hydrophilidae, Noteridae, and Thiaridae, where the families with greater abundance were Hydrophilidae (23 organisms at P1 and 15 at P2), and Noteridae (50 individuals at P1 and 38 at P2) (Table 2 and Figure 4). There were 8 different genera of algae belonging to the periphyton, being the Surirella sp. the most abundant with 51 org.mL-1 at P1, and 34 org. mL-1 at P2 (Table 3 and Figure 5). The Shannon-Weaver diversity with values of 1.63 and 1.97 for P1 and P2, respectively. Simpson dominance were 0.22 and 0.16 for P1 and P2. And the Pielou equity, the values were 0.91 and 0.95, in P1 and P2 (Table 1).
DISCUSSION
The results showed that the flood pulse determines the dynamics of the marsh, i.e., the high level of the water
column generates a greater aquatic plant diversity and a lower nutrient concentration, since aquatic plants absorb nutrients and incorporate them into their metabolic processes (Ávalos and Pérez 2009; Montoya et al. 2011; Junk et al. 1989; Mackay et al. 2012). In contrast, the shallower the depth, the more homogeneous the vegetation becomes. Aquatic plants die and accumulate on the riverbanks, therefore, the nutrient concentration increases in the water column and dissolved oxygen decreases, since this is used in the oxidation of nutrients and organic matter coming from the decomposing vegetation (Montoya et al. 2011; Junk et al. 1989; Mackay et al. 2012; Rúa et al. 2014). Besides, riparian vegetation in the forest area such as S. paniculata facilitates nutrient and sediment retention, so the water has less turbidity and less concentration of suspended solids, thereby increasing the Secchi depth (Marín et al. 2012; Rodríguez et al. 2012). This last factor possibly allows the productive area of the marsh to be deeper, favoring the presence of autotrophic organisms (Brinson et al. 1981; Miller and Fujii 2010). In comparison, the pasture vegetation favors nutrient presence due to the pesticides used to
Figure 4. Abundance of aquatic macroinvertebrates associated with the aquatic plant roots, in the San Francisco Marsh during rising and low water phases.
Rising Water Phase
Low Water Phase
control crop pests as well as the cattle feces. Subsequently, these nutrients are transported to the water allowing the appearance of aquatic plants and their proliferation, generating eutrophication problems which prevent the passage of sunlight to the water, increase the turbidity, and decrease the dissolved oxygen (Chará et al. 2010; Rodríguez et al. 2012). Because of the above, in the first season, the aquatic vegetation density was higher. The growth of the periphyton assemblage growth was stimulated, since it uses the aquatic vegetation as a substrate; hence, nutrients in the water are consumed, which are accumulated there during the dry phase.
Because of the periphyton abundance, the aquatic macroinvertebrate density was lower (Junk et al. 1989; Montoya and Aguirre 2009b; Montoya and Aguirre 2009a; Montoya et al. 2011; Piedade et al. 2010). Nevertheless, this dynamic changed during the second season, since the aquatic vegetation and the periphyton densities decreased, allowing a greater nutrient concentration and an increase in the aquatic macroinvertebrate density (Junk et al. 1989; Montoya and Aguirre 2009b; Montoya and Aguirre 2009a;
Montoya et al. 2011; Piedade et al. 2010). In this order of ideas, during the rising waters, there was lower aquatic macroinvertebrate density per transect line, and differences were found in the group to which the pasture and the forest organisms belong. In the former, the organisms are part of the Coleoptera, while in the latter they belong to the molluscs. On the other hand, during the low water season, both in the forest and in the pasture, the found organisms belong to the coleoptera (Arnett and Thomas 1999; Domínguez and Fernández, 2009; Lancaster and Downes 2014; Linares et al. 2019; Machado 1989). As claimed by some authors, the structure and spatial distribution of the macroinvertebrates in the swamps are associated with water volume alteration, which in turn affects habitat availability and heterogeneity, physical characteristics, trophic state, sediment conditions, dissolved oxygen, pH, temperature, organic matter, among other factors (Rivera et al. 2013; Mosquera 2018). In general terms, this research found greater richness in the forest area, which, in turn, had better water quality in terms of its physicochemical characteristics.
Table 3. Peripheral algae density associated with aquatic plants in the San Francisco Marsh.
According to results of the biodiversity indices: the Simpson (D) dominance, the Shannon-Weaver (H) diversity, and the Pielou (J) equity, when the water level dropped, the pasture showed lower dominance and greater diversity. At this time, the previously mentioned system is more heterogeneous than the forest, which is supported by the Pielou equity, since its values were greater in the pasture area (Aguirre and Caicedo 2015; Pla 2006). However, when the water level increased, the forest area showed lower dominance, and greater diversity, which means this is a system with greater entropy, in other words, it is more heterogeneous (Aguirre and Caicedo 2015; Moreno et al. 2011; Pla 2006). In this system, the native coverage allows for a greater richness of species belonging to the periphyton, and there is greater dissolved oxygen content given the water quality, as shown in Figure 5 and Table 1. It is worth
noting that according to the classification made by Wilhm and Dorris (1968) for the Shannon-Weaver diversity, in the transition season, the pasture area had values between 1.00 and 3.00, which classifies it as: “moderately polluted water”; meanwhile the forest area showed results above 3.00, meaning: “good quality water”. Nevertheless, in the second season, the four sampling points had values between 1.00 and 3.00, in other words: “moderately polluted waters” (Aguirre and Caicedo 2015; Staub et al. 2015). The results found in the variables H, D and J indicate that the natural conditions of the marsh allow the presence of more specialized organisms, which need more specific characteristics to make their existence and reproduction possible. The hydrological seasonality determines the water resource availability, the composition of the vegetation coverage, the nutrient and dissolved oxygen availability, and all these
Figure 5. Periphyton density associated with aquatic plant roots in the San Francisco Marsh during rising wáter and low water phases.
Rising Water Phase
Low Water Phase
Rising Water Phase
characteristics determine which organisms of the periphyton and aquatic macroinvertebrates will be present in each season (Junk et al. 1989; Talley et al. 2010).
Figure 6 (left) shows the association between the sampling points of the rising water campaign, in which a similarity of 67% between P1 and P2, and 81% between B1 and B2 was found. Since the similarities are greater than 50%, both areas were related; nevertheless, the transects located in the forest had more resemblance than those in the pasture. In the same way, Figure 6 (right) shows the association between the sampling points of the low water campaign, in which a similarity of 79% between P1 and P2, and of 29% between B1 and B2 was found, which means that in the pasture area the similarity was above 50%, while in the forest it was lower, being the first zone the most related of them. In turn, the pasture and the forest were related in 60%. The decrease in diversity is due to the reduction in the biomass quantity when the water level drops, since the flood pulse determines the biota establishment in the ecosystem (Montoya and Aguirre 2010; Mitsch et al. 2015). However, when the native vegetation is replaced and the physicochemical and biological characteristics change, a greater aquatic vegetation density is generated, which acts as a biofilter that retains the sediments and contaminants from reaching the water body. Even so, when the aquatic vegetation grows in an uncontrolled manner, because of the nutrient abundance in the water, this vegetation prevents the sunlight from entering the water body, deteriorating its quality and decreasing its diversity (Quirós et al. 2006; Rejas et al. 2012). Less specialized organisms appear, which can live in both high and low waters, and whose most relevant impact is not allowing fish populations to exist. It cannot be forgotten that human communities are part of these ecosystems. Deforestation, mining, fishing, agriculture, and cattle raising are economic activities carried out in the region (Aguilera 2009; Marín et al. 2012; Puerta et al. 2016a; 2016b). To conserve ecosystems, people also must be considered. In summary, it is essential to find a bal-
Low Water Phase
ance between the conditions provided by the forest and the pasture. Finally, by declaring the Ayapel Swamp System as a Ramsar site, it becomes necessary to investigate, formulate, propose, and implement mechanisms to conserve and recover the natural characteristics (Ramsar 2007; 2014). Protecting the riverbanks is one of the strategies which can be carried out, in a way that improves the water quality of the marsh and ensures that the entire trophic chain functions properly, thus guaranteeing both native and endemic species can continue to coexist (González et al. 1995; Ramsar 2016).
CONCLUSION
This research was carried out in an area with low anthropic intervention. When the water level was high, the native vegetation coverage protected the marsh bank, the aquatic vegetation was heterogeneous and abundant during this flood pulse phase. Meanwhile, when the water level dropped and the floodplain was exposed, only grass was found in the terrestrial area, and the aquatic vegetation density decreased. The variations and differences given between the pasture and forest areas, are influenced not only by anthropic activities, which change the native coverage to pastures dedicated to activities such as cattle raising or agriculture, but also by the effect of the natural dynamics of the system. During the rising water season, the marsh shows differences in water quality, aquatic biota density, and richness between the forest and pasture areas; however, during the low water phase, the characteristics between the sampling sites tend to homogenize. In summary, native coverage favors the diversity of organisms belonging to the periphyton; this was reflected in the diversity indices. In the pasture area, moderately polluted waters were found, while in the forest, the water quality was good, resulting in a greater ecosystem diversity. Nonetheless, in low water conditions, all the indices acquire similar values, and the water quality deteriorates, classifying it as moderately polluted water. It is fundamental to conserve and recover the native vegetation because it allows for the presence of
Figure 6. Bray-Curtis Cluster analysis of the sampling points in the San Francisco Marsh during the rising water phase (on left) and low water phase (on right).
periphyton organisms and aquatic macroinvertebrates, thus enabling inorganic carbon fixation, nutrient recycling, and organic matter availability. These organisms are the base of the trophic chain, their presence contributes to the fish recovery, being these a fundamental economic resource in the region and the country.
ACKNOWLEDGEMENTS
We would like to express our gratitude to the GeoLimna Research Group, to the Sanitary Hydrobiology, Environmental Studies, and Soils and Pavements laboratories; and to the Faculty of Engineering of the University of Antioquia for providing the resources, equipment, and necessary space for the sample analysis and research completion. We are grateful to Libia Oviedo and Wilson Pérez, residents of the sampling area, for their support during field activities, the professionals who contributed with the identification of the organisms: Francisco Javier Roldán Palacio, Juan Pablo Serna López, María Carolina Vélez Naranjo, José Andrés
Deosa Velilla and Karen Palacio Gómez. And finally, to Diego Cristobal Bautista Cortes, Sebastián Santamaria Présiga and Dominic Higgins for their cooperation in the translation process of this document.
REFERENCES
Aguilera, M.M. 2009. Ciénaga de Ayapel: Riqueza en biodiversidad y recursos hídricos. Banco De La Republica. Centro De Estudios Económicos Regionales (CEER), Cartagena, Colombia. Publication 12. ISSN 1292 - 3715.
Aguirre, N.J. and O. Caicedo. 2015. Métodos de campo y laboratorio para hidrobiología sanitaria. Universidad de Antioquia. Medellín, Colombia.
Algaebase. 2019. Algabease. [online]. https://www.algaebase.org. APHA. 2013. Standard Methods for the Examination of Water and Wastewater. Washington DC: American Public Health Association. ISBN 55-1979.
Arnett, R. and M. Thomas. 1999. American beetles Archostemata, Mixophaga, Adephaga, Polyphaga: Staphyliniformia. CRC Press Boca Raton London New York Washington, D.C. ISBN 0849319250. Ávalos, A. and E. Pérez. 2009. Metabolismo secundario de plantas. REDUCA (Biología) 2(3): 119–145. ISSN 1989-3620. http://revistareduca. es/index.php/biologia/article/view/798
Brinson, M.M., A.E. Lugo, and S. Brown. 1981. Primary productivity, decomposition and consumer activity in freshwater wetlands. Annual Review of Ecology and Systematics 12(1): 123-161. ISSN 0066-4162. https://doi.org/10.1146/annurev.es.12.110181.001011
Chará, J., L.P. Giraldo, A.M. Chará and G.X. Pedraza. 2010. Beneficios de los corredores ribereños de Guadua angustifolia en la protección de ambientes acuáticos en la Ecorregión Cafetera de Colombia. Recursos naturales y ambientales 61: 60–66. http://201.207.189.89/ bitstream/handle/11554/8443/Beneficios_de_los_corredores_riberenos2. pdf?sequence=1&isAllowed=y
Clavijo, K.J. And E.A. López. 2017. Propuesta metodológica de restauración para la vegetación riparia a partir de la variación de la composición florística en diferentes épocas climáticas del humedal Torca, Guaymaral. Producción + Limpia, 12(1): 49–62. ISSN 2323-0703. https://doi.org/10.22507/pml.v12n1a5.
Dadey, K. A., T. Janecek and A. Klaus. 1992. Dry-bulk density: its use and determination. Proc., Scientific Results, ODP, Leg 126, Bonin Arc/Trench System, 126: 551–554. https://doi.org/10.2973/odp.proc. sr.126.157.1992
Decreto No. 356 2018. Por el cual se adiciona una sección al Decreto 1076 de 2015, con el fin de designar al Complejo Cenagoso de Ayapel para ser incluido en la lista de Humedales de Importancia Internacional Ramsar, cumpliendo de lo dispuesto en la Ley 357 de 1997. 2018. 22 de febrero, Bogotá D.C, Colombia.
Domínguez, E. and H. Fernández. 2009. Macroinvertebrados bentónicos sudamericanos. Tucumán: Fund. Miguel Lillo. Tucumán, Argentina. ISBN 9789506680152.
Fluet-Chouinard, E., B.D. Stocker, Z. Zhang, A. Malhotra, J.R. Melton, B. Poulter, J.O. Kaplan, K.K. Goldewijk, S. Siebert, T. Minayeva, G. Hugelius, H. Joosten, A. Barthelmes, C. Prigent, F. Aires, A.M. Hoyt, N. Davidson, C.M. Finlayson, B. Lehner, … P.B. McIntyre. 2023. Extensive global wetland loss over the past three centuries. Nature 614(7947): 281–286. https://doi.org/10.1038/s41586-022-05572-6
Gardner, R. C. and M. Finlayson. 2018. Perspectiva mundial sobre los humedales. Conveción de Ramsar Sobre Los Humedales. Publication 88. https://www.ramsar.org/sites/default/files/documents/library/gwo_s.pdf
González, M., M. Vidal, M. Suárez and C. Molina. 1995. Consideraciones sobre el estado actual de las riberas de los principales cauces fluviales de la cuenca del río Segura, España. Anales de Biología 20(9): 117–130.
Greer, M.J.C., G.P. Closs, S.K. Crow and A.S. Hicks. 2012. Complete versus partial macrophyte removal: The impacts of two drain management strategies on freshwater fish in lowland New Zealand streams. Ecology of Freshwater Fish 21(4): 510–520. https://doi.org/10.1111/ j.1600-0633.2012.00569.x
Junk, W.J., P.B. Bayley and R.E. Sparks. 1989. The flood pulse concept in river-floodplain systems. International Large River Symposium 106: 110–127.
Kinimo, K. C., K.M. Yao, S. Marcotte, N.L. Kouassi and A. Trokourey. 2018. Distribution trends and ecological risks of arsenic and trace metals in wetland sediments around gold mining activities in central-southern and southeastern Côte d’Ivoire. Journal of Geochemical Exploration 190: 265–280. https://doi.org/10.1016/j.gexplo.2018.03.013
Lancaster, J. and B. Downes. 2014. Aquatic entomology. Oxford University Press. Oxford, United Kingdom. ISBN 9780199573226.
Linares, E., C. Lasso, M. Vera and M. Morales. 2019. Moluscos dulceacuícolas de Colombia. Instituto de Investigación de Recursos Biológicos Alexander von Humboldt. Bogotá, Colombia. ISBN 978-9585418-57-8.
Machado, T. 1989. Distribución ecológica e identificación de los coleópteros acuáticos en diferentes pisos altitudinales del departamento de Antioquia. Facultad de Ciencias Exactas y Naturales, Departamento de Biología, Medellín.
Mackay, A.W., T. Davidson, P. Wolski, S. Woodward, R. Mazebedi, W.R.L. Masamba and M. Todd. 2012. Diatom sensitivity to hydrological and nutrient variability in a subtropical, flood-pulse wetland. Ecohydrology 5(4): 491–502. https://doi.org/10.1002/eco.242
Marín, C.M., N.J. Aguirre and M. Toro. 2012. Interacciones tróficas y productividad íctica en el sistema cenagoso de Ayapel, Córdoba Colombia. Universidad de Antioquia. Medellín, Colombia.
Mason, T. J., M. Krogh, G.C. Popovic, W. Glamore and D.A. Keith. 2021. Persistent effects of underground longwall coal mining on freshwater wetland hydrology. Science of the Total Environment 772(144772). https://doi.org/10.1016/j.scitotenv.2020.144772
Miller, R.L. and R. Fujii. 2010. Plant community, primary productivity, and environmental conditions following wetland reestablishment in the Sacramento-San Joaquin Delta, California. Wetlands Ecology and Management 18(1): 1–16. https://doi.org/10.1007/s11273-009-9143-9
Mitsch, W.J., B. Bernal, and M.E. Hernandez. 2015. Ecosystem services of wetlands. International Journal of Biodiversity Science, Ecosystem Services and Management 11(1): 1–4. https://doi.org/10.1080/21513732 .2015.1006250
Möller, P. 2011. Las franjas de vegetación ribereña y su función de amortiguamiento, una consideración importante para la conservación de humedales. Gestión Ambiental 21: 96–106.
Montoya, J.J. and N. Aguirre. 2010. Dinámica de la producción primaria fitoplanctónica en un lago tropical (ciénaga Escobillitas) a lo largo del pulso de inundación. Revista Facultad de Ingeniería Universidad de Antioquia 55: 76–89.
Montoya J.V., M.M. Castillo and L. Sanchez. 2011. La importancia de las inundaciones periódicas para el funcionamiento y conservación de los ecosistemas inundables de grandes ríos tropicales: estudios en la cuenca del Orinoco. Interciencia 36(12): 900–907.
Montoya, Y. and N. Aguirre. 2009a. Dinámica del perifiton asociado con macrofitas en la ciénaga de Escobillitas y su relación con el pulso de inundación. Investigación Biodiversidad y Desarrollo 28(2): 196–202. https://doi.org/10.18636/BIODESARROLLO.V28I2.425.G447
Montoya, Y. and N. Aguirre. 2009b. Estado del arte de la limnología de lagos de planos inundables. Revista Gestión y Ambiente 12(3): 85–105. http://www.bdigital.unal.edu.co/27474/1/25323-89221-1-PB.pdf.
Moreno, C.E., F. Barragán, E. Pineda and N.P. Pavón. 2011. Reanálisis de la diversidad alfa: Alternativas para interpretar y comparar información sobre comunidades ecológicas. Revista Mexicana de Biodiversidad 82(4): 1249–1261. https://doi.org/10.22201/ ib.20078706e.2011.4.745.
Mosquera, Z. 2018. Insectos acuáticos asociados a raíces de Eichhornia crassipes (MART) Solms en ciénagas del río Atrato, Chocó – Colombia. Revista de Ciencias 21(2): 29–44. https://doi.org/10.25100/rc.v21i2.6697
Patino, J. E. and L.M. Estupinan-Suarez. 2016. Hotspots of Wetland Area Loss in Colombia. Wetlands 36(5): 935–943. https://doi.org/10.1007/ s13157-016-0806-z
Piedade, M.T.F., C.S. Ferreira and A.C. Franco. 2010. Estrategias reproductivas de la vegetación y sus respuestas al pulso de la inundación en las zonas inundables de la Amazonía Central. Ecosistemas: Revista Científica y Técnica de Ecología y Medio Ambiente 19(1): 52–66. Pla, L. 2006. Biodiversidad: Inferencia basada en el Índice de Shannon y la riqueza. Interciencia 31(8): 583–590. http://www.redalyc.org/ pdf/339/33911906.pdf.
Puerta, T.Y., N.J. Aguirre and F. de J. Vélez. 2016a. El Complejo Cenagoso de Ayapel, un nuevo sitio Ramsar. Experimenta: 16–21. Puerta, T.Y., N.J. Aguirre and F. de J. Vélez. 2016b. Sistema cenagoso de Ayapel como posible sitio Ramsar en Colombia. Gestión y Ambiente 19(1): 110–122.
Quirós, R., M. Boveri, C. Petracchi, A. Renella, J. Rosso, A. Sosnovsky and H. Von Bernard. 2006. Los efectos de la agriculturización del humedal Pampeano sobre la eutrofización de sus lagunas. Eutrofização na América do Sul: Causas, conseqüências e tecnologias de gerenciamento e controle 1: 1–16.
Ramsar. 2007. Los criterios para la identificación de Humedales de Importancia Internacional. https://www.ramsar.org/sites/default/files/ documents/library/info2007sp-05.pdf.
Ramsar. 2014. Criterios para Sitios Ramsar. http://www.ramsar.org/sites/ default/files/documents/library/ramsarsites_criteria_sp.pdf.
Ramsar. 2016. Introducción a la convención sobre los humedales. Manual de la convención de Ramsar. https://www.ramsar.org/sites/default/ files/documents/library/handbook1_5ed_introductiontoconvention_s_final.pdf.
Rejas, D., C. Valverde and C.E. Fernández. 2012. Limitación por nutrientes y pastoreo como factores de control de las densidades de bacterias y algas planctónicas en una laguna altoandina (Cochabamba, Bolivia). Revista Boliviana de Ecología y Conservación Ambiental 30: 1–12. Rivera, J.J., G.A. Pinilla and J.O. Rangel. 2013. Ensamblaje de macroinvertebrados acuáticos y su relación con las variables físicas y químicas en el humedal de Jaboque-Colombia. Caldasia 35(2): 389–408. ISSN 0366-5232.
Rodríguez, E., P.A. Domínguez, M. Pompa, J.A. Quirozarratia and M.E. Pérez. 2012. Calidad del bosque de ribera del río El Tunal, Durango, México; mediante la aplicación del índice QBR. Gayana - Botanica 69(1): 147–151. https://doi.org/10.4067/S0717-66432012000100014
Rúa, A., J. Palacio and M.T. Flórez. 2014. Relación del pulso hidrológico con la estratigrafía del sedimento del complejo de humedales de Ayapel, Colombia. Revista Facultad de Ingenieria 70: 197–206.
Serna, J. P. and J. Cañón. 2020. Projecting the future of Ayapel Cienaga : A hydroecologic analysis under climate change. Revista Facultad de Ingenieria Universidad de Antioquia 95: 73–87. https://doi.org/https:// doi.org/10.17533/udea.redin.20190940
Staub, R., J.W. Appling and A.M. Hofstetter. 2015. The Effects of Industrial Wastes of Memphis and Shelby County on Primary Planktonic Producers. BioScience 20(16): 905–912. https://doi.org/10.2307/1295583
Streble, H. and D. Krauter. 1988. Das Leben im Wassertropfen Mikroflora und Mikrofauna des Süßwassers Ein Bestimmungsbuch. FranckhKosmos Verlag. Stuttgart, Germany.
Talley, D.M., G.R. Huxel and M. Holyoak. 2010. Connectivity at the land–water interface. K.R. CROOKS and S. M (eds.), Connectivity Conservation. Cambrige: 97–129.
Taylor, J.C., C. Archibald and W.R. Harding. 2007. An illustrated guide to some common diatom species from South Africa. Water Research Commission. Pretoria, South Africa. ISBN 1770054847.
Waldhoff, D., B. Furch and W.J Junk. 2002. Fluorescence parameters, chlorophyll concentration, and anatomical features as indicators for flood adaptation of an abundant tree species in Central Amazonia: Symmeria paniculata. Environmental and Experimental Botany 48(3): 225-235. https://doi.org/10.1016/S0098-8472(02)00037-0.
Wilhm, J.L. and T.C. Dorris. 1968. Biological Parameters for Water Quality Criteria. BioScience 18(6): 477–481. https://doi. org/10.2307/1294272
Xu, T., B. Weng, D. Yan, K. Wang, X. Li, W. Bi, M. Li, X. Cheng and Y. Liu. 2019. Wetlands of international importance: Status, threats, and future protection. International Journal of Environmental Research and Public Health 16(10). https://doi.org/10.3390/ijerph16101818
Sabana Wetlands in Quintana Roo, Mexico: What We Know and What We
Don’t
Eduardo Cejudo1, Wendy Y. Ortiz Aguilar, Pedro Zapotecas Tetla, and Daniela Ortega Camacho
ABSTRACT
Locally called “sabanas” are a group of herbaceous karst wetlands in the Yucatan Peninsula (Mexico) that form in exokarstic solution depressions. They are groundwaterdependent ecosystems ranging from permanently to seasonally flooded and dominated by plants from the family Cyperaceae. In this paper, we briefly summarize most of the knowledge regarding these wetlands, highlighting some recent findings obtained from our study of a sabana wetland - La Esperanza in Quintana Roo, Mexico. We also identify areas that require attention in order to generate the basic knowledge necessary to properly evaluate their ecosystem services.
RESUMEN
Los humedales conocidos como “sabanas” en la Península de Yucatán (México), son un grupo de humedales herbáceos kársticos que se forman en depresiones exokársticas. Son ecosistemas dependientes del agua subterránea de inundación permanente hasta inundación estacional, y están dominados por plantas de la familia Cyperaceae. En este artículo, reunimos brevemente la mayor parte del conocimiento sobre estos humedales, destacando algunos hallazgos obtenidos recientemente de un sitio de estudio llamado La Esperanza en Quintana Roo, México. Finalmente, identificamos áreas que requieren atención para generar el conocimiento básico necesario para evaluar adecuadamente sus servicios ecosistémicos.
INTRODUCTION
In southeast Mexico, sabana is a local term mostly given to herb-dominated wetlands found in karst landscapes. They are typically tropical karst marshes established in solution depressions associated to geological faults and fractures (McKay et al. 2020). Sabana wetlands have been studied mainly from the floristic point of view, so our knowledge of most of them is limited. In this paper, we attempt to summarize most of the available published literature regarding sabana wetlands from the State of Quintana Roo, Mexico (Figure 1). Starting in 2017, we began research at sites in common lands (ejido) of several localities from the northern part of the State of Quintana Roo, Mexico. Herein, we also present an overview of the advancements of knowledge in these little-known tropical wetlands.
WHAT WE DO KNOW?
Sabana wetlands are established in the bottom of solution depressions carved in carbonates rocks. These depressions are commonly slender, elongated valleys, U or V-shaped, where the boundaries are terraced rock outcrops (Figures 1 and 2). These wetlands contain fine-grained, carbonate-rich silts and clays – products of weathered limestone (Scott et al. 2004). Most of them (81% of the depressions; Fragoso et al. 2014) are found below 50 meters above sea level (masl).
Microrelief and Hydroperiod
Sabana wetlands have a very distinctive cross-sectional pattern. As true for many other wetlands, tropical karst marshes are established in depressions or in lowland areas. As one approaches the center of the wetland, the ground surface of the sabana typically slopes gradually to the center of the depression. Annual fluctuations of water lead to high water level 90 cm above the ground surface in the central portion (Cejudo et al. 2021). However, during extreme hydrometeorological events such as the hurricanes Wilma (2005), Delta, and Zeta (2021), the water level can reach up to three meters above ground level (Figure 3), even spilling over the paved road that dissects the wetland. Permanent and temporal flood regimes are the most common in sabana wetlands from Quintana Roo.
Geomorphology and Soil
The three most important geomorphological features in this area are exokarstic closed depressions: sinkholes, uvalas and poljes (Fragoso et al. 2014). Sinkholes are funnel-shape depressions caused by dissolution and collapse of carbonate rock, which area oscillates from few meters to not larger than one kilometer. Uvalas are multi-coned depressions, frequently formed by the enlargement of smaller depressions. Lastly, a polje is a large, flat-floored depression that can span of several kilometers (USEPA 2002).
Palacio-Aponte et al. (2002) highlight that these wetlands are not restricted to cumulative plains established on Gleysols, they can be found along a terrestrial-aquatic continuum linked to adjacent ecosystems, regardless of their geoform, by water. These landscapes function as atypical endorheic basins, where infiltration and dissolution occur. Large parts of the terrestrial ecosystems in the Yucatan Peninsula are dominated by Leptosols, which are generally thin soils with an elevated content of calcium as a result of the parent material. Inside the wetlands, at a micro-scale, we found other types of soil. Rather than organic or gleyic soils associated with many wetlands, the dominant soil unit in some wetlands is Calcisol (Solleiro-Rebolledo et al. 2011). Apparently, a fair share of this soil was biogenically created
inventory. (Compiled from INEGI 2014)
Figure 1. General location map (above) and more detailed map showing sabana wetlands from the State of Quintana Roo, Mexico where research has been done. Wetlands classification (estuarine, palustrine, lacustrine) according to the Mexican wetlands
Figure 2. Terraced rock outcrops mark the outer limits of sabana wetlands (Photo by Eduardo Cejudo).
energy
the most abundant elements;
Figure 3. Variation in flood intensity in Lazaro Cárdenas, Quintana Roo, Mexico: 1) typical condition — saturated soil with shallow water (left) and 2) flooding after Hurricanes Delta and Zeta in 2021 (right). (Photos by Pedro Zapotecas).
Figure 4. Microscopic view of porosity of a sabana soil. Left: Image taken on a JEOL JSM6360LV Scanning Electron Microscope, 20 kV at 300X. Right: Spectrum with
dispersive X-ray spectroscopy (EDS) of the sample in the left. This spectrum shows
by algae subject to periodic flooding from rising groundwater with elevated carbonates. One of the most interesting findings is the sequence of horizons alternatively enriched with organic material or with carbonates, indicative of the duration of flooding and alternating wet and dry conditions.
As hydromorphic soils, bulk density is low, from 0.14 to 0.25 g/cm3, and they can hold anywhere from 2 to 7 grams of water per gram of soil. As a result, these soils have very high porosity (84 to 92%, Figure 4). While the soil in these wetlands is chemically dominated by calcium due to the parental rock (calcite), other elements are also important components, such as magnesium, aluminum, silicon, sulfur and small portions of iron, potassium and chloride (Cejudo et al. 2021).
Based on our observations, soil pH is slightly alkaline (7 to 8) and not very variable among dry and wet seasons (unpublished results). Electrical conductivity has been measured from 400 to 800 μs/cm, with an increase in values during the dry season, likely due to the absence of surface water (i.e., most dissolved substances precipitate and increase the amount of ions in the soil). However, these values still indicate low salinity and optimal value for nutrient availability. We also examined cationic exchange capacity (CEC) and ferrous iron. The former parameter is above 200 meq/100 g soil that are very high yet reasonable due to the soil organic matter content (Kaiser et al. 2008). These high values can be mainly attributed to the organic matter content present in the wetland soil (≈ 8%), which provides great retention capacity. The ferrous iron test (Fe2+) is a diagnosis test for redox soil conditions, which provides information regarding probable electron acceptor and microbial metabolism (Bird et al. 2011). As with electrical conductivity, Fe2+ concentration changes between seasons, decreasing during the dry season in the absence of water when anaerobic conditions cease and Fe2+ becomes oxidized into Fe3+.
Groundwater Flow
McKay and others (2020) used strontium isotopes and ion geochemistry to demonstrate that water effectively flows north within the fracture system where sabana wetlands are located. They suggest the existence of at least two flow paths, one eastward and one westward and reported differences in water chemistry in each of the flow paths with greater Mg contribution in the eastern boundary (a finding that we confirmed later, Zapotecas-Tetla 2022). As most of us dealing with the hydrogeology of this area, identifying watershed divides is challenging in karst landscapes. Hydrologically, they provided evidence that the fracture zone encompasses areas beyond the visible sabanas, providing the ecological flow for these wetlands.
Hydrogeochemistry
Sabana wetlands are dominated by calcium bicarbonate
water as a result of carbonate rock dissolution. They are phreatotrophic wetlands, primarily fed by groundwater (Cejudo et al. 2021), but also receive rainwater. When the soil is saturated and the phreatic table is above the ground, rainwater stays on top of the wetland and then gradually mixes with pore water and eventually infiltrates into the saturated zone. Thus, sabana wetlands serve as both groundwater recharge and discharge areas (Figure 5).
Vegetation
Sabana wetlands are floodable lowlands (Palacio-Aponte et al. 2002). While botanical inventories have been conducted, those studies are scarce and isolated, lacking phytogeographic and conservational approaches. The earliest description we found regarding karstic wetland in the Peninsula was in the chapter “Wetlands of Mexico” by Olmsted (1983). Due to the lack of a classification system, Olmsted used the US wetland classification system to give some order, but also referred to local names which rooted in specialized literature. She described the Peninsula as a large plain with elevation no higher than 300m above sea level with no surface flow due to high permeable sedimentary rock. Seagrasses were barely mentioned; mangroves were better described. Herbaceous wetlands were brackish and freshwater marshes, designated in a patchy organization, occurring on marl with a thin organic layer, adjacent to mangroves and/or buttonwood. The dominant species of marshes are Typha, Phragmites, Cladium, Eleocharis, and Rhynchospora. Another important contribution about herbaceous wetlands came from Rejmankova et al. (1996). Their work studied several marshes, from mesohaline to completely freshwater, in different water types from sulfate-chloride water to calcic-carbonate water. They described these wetlands generally with low nutrient levels but high N accumulation in sediments. One of the most important outcomes from their research was that biomass production and decomposition are functions of individual plant growth and environmental conditions. The decomposition of Typha domingensis and Eleocharis cellulosa is relatively fast (200 days) while Cladium jamaicensis has
Figure 5. Diagram of water movement in a cross section of the sabana wetlands “La Esperanza”, Quintana Roo, México.
a slow decomposition, with half of the tissue decomposed around 600 days. The formation of the peat layer was enhanced after the establishment of herbaceous species. There has been also reported preferences on substrate, with some plants establishing in peaty clays, and others with clayey soils or alluvial sands. For instance, the work by Bridgewater et al. (2002) in the frontier between Mexico and Belize, reported that sabanas are part of an ecotone — areas of ecological succession, not necessarily considered as stable communities. After a detailed vegetation description, they concluded that sabanas are frequently in poor conservation status, impacted by human economic activities.
In La Esperanza wetland, we found 11 species, Eleocharis cellulosa and Cladium jamaicense dominates in both saturated and unsaturated soil (Figure 6). Both can thrive in flooded conditions. On saturated soil with shorter flood periods, we found Sagittaria lancifolia, Rhynchospora colorata, and Ludwigia bonaerensis. On the outer border of the wetland, where surface water seldom reaches and the soil is almost unsaturated, we observed Persicaria segetum and Lippia graveolens. Dominant trees are Acoelorraphe wrightii, Haematoxylum campechanum, and Crescentia cujete.
Regarding plant biomass, since 2018, we have focused on the dominant sabana species: Cladium jamaicense, Eleocharis cellulosa, and Sagittaria lancifolia. Our sampling comprised of small blocks of soil, plants and root to determine the biomass per surface area and root biomass per volume. These samples are obtained from a 20 x 20 cm (0.04 m2) area, delimited with a PVC frame. Then, with a straight shovel, a cut was made in the soil to a depth of
20 to 25 cm to extract plants, soil and roots coexisting in the soil block (Figure 7). After drying, we obtained dry soil weight and dry biomass (either aerial, subterranean or both). To calculate the biomass per surface area, the proper dimensional adjustments were made to express the result in kg biomass (dry weight)/m2 and kg roots (dry weight)/cm3 in the topsoil (the upper 25 cm of the soil). What we have learned so far indicate that Eleocharis cellulosa produce more subterranean biomass (roots) than Cladium jamaicense. Unfortunately, we do not have consistent information (roots and shoots biomass) for Cladium and Sagittaria.
Macronutrients: N and P
To assess the role of wetlands in nutrient retention we have taken steps towards generating a baseline about the quantity and mass of the nutrient’s nitrogen (N) and phosphorus (P). To achieve this, we have tried to identify how these two nutrients are distributed in these ecosystems – in the water, in plants, and in the soil.
N in water. During our research, we have noticed certain trends in sabana wetlands: 1) elevated ammonium
Figure 6. Cross section of La Esperanza sabana wetlands with dominant vegetal elements.
Table 1. Aerial and subterranean biomass of the two dominant species Eleocharis cellulosa and Cladium jamaicense in La Esperanza Sabana wetland. Species
(from 0.5 to 1.5 mg N-NH4+/L), 2) nitrite ranging from not detected (>0.01 mg N-NO2-/L) to 0.2 mg N-NO2-/L) and 3) nitrate levels from 0.2 to 1 mg N-NO3-/L, occasionally values as high as 1.5 mgN-NO3-/L. These trends can be interpreted as enhanced generation or recent production of ammonium due to organic matter mineralization or decaying tissue. Sometimes we were able to “catch” the nitrite increase before being further reduced or oxidized, which then might incorporate into biomass or be moved into facultative or anaerobic zones and be denitrified. The organic nitrogen fraction (Norg, obtained from the difference between total nitrogen and dissolved inorganic nitrogen) has shown to be very important since it represents between 10 and 40 % of the total nitrogen (TN). This fraction is likely comprised by soil organic matter together with cells, either alive or dead, debris, and can be influenced by the clay content, dominant plant species, and the water table (Bai et al. 2005). Unfortunately, we do not have information about the gaseous phase of this cycle and cannot confirm paths, rates and fluxes of N into and from these wetlands. The δ15N-NO3- is currently being explored, but these results are not conclusive, either because we have not observed a typical denitrification trend (Chen et al. 2009), or our results suggest nitrate may be derived from fertilizers and from atmospheric sources. It is worth to explore both of the latter possibilities: the first one might represent regional water flow from areas with use of synthetic fertilizers, and upward via groundwater discharge. The second alternative implies that wet and dry nitrate deposition plays an important role (Poor et al. 2001). Further research is required for having information of the actual N processes and sources. P in water. Soluble reactive phosphorus is regularly low, from 0.05 to 0.2 mg P-PO43-/L. The largest share of P in wetlands is organic, as high as 90%; similar to Norg, likely derived from cells and organic debris. We think that this measured concentration is controlled by the geological and edaphic characteristics of karst landscapes, where
calcite precipitates phosphorus in mineral complexes, forming Ca-Fe/Al-P minerals (Shenker et al. 2005; Gao et al. 2019). So, most of the P is not dissolved but precipitated and stored in sediments and soils, as well as in plant tissue (see below P in plants).
N and P in plants. Presently, we only have information about the N and P concentration and stock in roots of one of the dominant species in sabana wetlands - Cladium jamaicense (Sawgrass). TN in roots of C. jamaicense oscillates between 6 and 12 g N kg-1 roots and TP from 24 to 52 mg P kg-1, separated by three orders of magnitude, with a N:P ratio from 50 to more than 2000. This is higher than the average N:P ratio of terrestrial plants (50; Elser et al. 2000); such high values have not been previously reported (Wassen et al. 1995). Results of N and P experimental enrichment showed that N:P ratios are indicative of the relative availability or deficiency of either nutrient (Güsewell et al. 2004). Thus, elevated N:P ratios can be interpreted as current P deficiency, so that this community can respond to P fertilization (i.e. external inputs). These values can also be interpreted in light of all the ecological processes such as carbon assimilation, nutrients uptake, allocation, biomass turnover and reproduction, among the most important (Güsewell 2004). We have research in progress regarding Eleocharis cellulosa.
N and P in soil. Studies on nitrogen fixation report annual nitrogen fixation rate of periphyton mats around 9 g N m-2 year-1, likely in the high end for cyanobacteria when compared with other tropical karst environments (Vargas and Novelo 2007). The concentration of TN and TP in the soil of sabana wetlands are separated by three orders of magnitude, TN from 3 to 15 g N kg-1 and from 4 to 10 mg P kg-1, where the N:P ratio gets as high as 50,000. So, we think that the little available P in soil might be associated to adsorption or precipitation with hydroxides, iron, manganese or sequestered by ion exchange with clays (Ponnamperuma 1972). Also, in calcareous soils, P is associated
Figure 7. Plant, soil, and roots sampling in sabana wetlands. Left: PVC frame for delimit a 0.04 m2 area. Right: Soil block
to minerals such as hydroxyapatite or vivianite (Audette et al. 2020). The TN in soil agrees with values reported in floodplain marshes (Bai et al 2004). At global scale, the N:P molar ratio in soils goes from 1 to 77 (Cleveland and Liptzin 2007). This review unfortunately does not included N:P ratios in wetlands, but Bedford and others (1999) mentioned that elevated N:P ratios in soil are common in soils with high OM content. The scarce information regarding molar or mass N:P ratios in tropical wetlands, invites us to further explore this topic, especially in light of climate change and changes in species composition and richness associated with cultural eutrophication.
WHAT WE DO NOT KNOW
As you can tell by the brevity and content of the prior discussion, there is so much that we do not know. To conclude this article, we have identified some areas that we consider priorities for research.
Hydrogeology
Although we have some knowledge of the regional groundwater flow (Bauer- Gottwein et al. 2011), we still need to know more precisely the local groundwater flows, such a groundwater divides (the boundary between groundwater basins), recharge and discharge zones and water budgets, among the most important topics.
Carbon Cycle and Greenhouse Gases
Given climate change, there is great need of the estimation of carbon stocks and budget, and quantification of greenhouse gases emitted from herbaceous wetlands. Some information is available for forested wetlands, particularly mangroves (Adame et al. 2021; Cinco-Castro et al. 2023) and seagrasses (Herrera-Silveira et al. 2020), but not for other wetlands.
Biodiversity Beyond Plants
While we have some studies of vegetation, they are no exhaustive. Furthermore, we need a better understanding of the biodiversity of sabana wetlands derived from broadbased ecological studies. A good number of such studies has been completed at the Natural Reserve El Eden that is the first ecological reserve in Mexico located on private property. For example, there is information on the biodiversity of algae, epiphytes, fungi, birds, diatoms, nematodes, insects, gastropods, and mammals. There are also studies on restoration, carbon and nitrogen cycling. This information is posted on the Reserve’s website (https://www. reservaeleden.mx/t-tulo) and serves as a good example of what can be produced for sabana wetlands.
Macronutrients and Micronutrients
Although we have some information about the nitrogen and phosphorus in the water, soil and plant roots of sabana
wetlands, we do not have information for the gaseous part of the N cycle. We still need to complete information of fluxes, incorporation efficiency, point or diffuse sources, among others. We are in the process of generating knowledge about the distribution of macroelements, microelements, trace elements and heavy metals in a herbaceous sabana wetland, including its water, soil, plants, and snails. Our ongoing research considers heavy metals because of the existence of a road dividing the wetland, presumably a source of contaminants from urban dust. Additionally, two of the most important pending assignments in sabanas are C and Si stocks and balances.
Management and Conservation
Sabana wetlands have not been severely altered, except for road construction. In most of the locations with sabana wetlands in this area of Mexico, local habitants do not have an immediate plan for these lands. One of the key informers in La Esperanza mention that “people are not interested in having an (economic) project on it, and we want to preserve it. But if there is someone with an aquiculture project, we will be willing to listen. But we do not have the money for starting a business”. It would be desirable to have a management plan, a living and acting document that aims to conserve biodiversity, maintain sabana ecosystems, and improve the quality of life of the local inhabitants. Such initiative must consider the environment and the society together, with the involvement and participation of several actors acknowledging and willing to adopt this commitment.
CONCLUSION
Our work has just begun and we have a long road ahead. In order to help fill the gaps, we are currently conducting research relative to the elemental composition of sabana wetlands, focusing on macronutrients, micronutrients, trace elements and heavy metals. Some other research topics to consider include carbon, nitrogen, phosphorus, and silicon fluxes and balances. There is also the need of more ecohydrological knowledge about wetlands in general, and we would welcome others to work with us and share information about sabana wetlands. Our work provides a baseline to begin to understand the hydric dynamics or the interaction with the shallow aquifer and the surrounding highlands. It is a starting point. While we have what we believe to be some of the building blocks to establish the current status of some sabana wetlands, we aim to produce more information that can be used to predict ecosystem services for these wetlands. Ultimately, we hope that all of our activities yield supporting information to promote environmental legislation that supports reserves, preserve, protects and restores wetlands and waters that feed them, and to carry out actions and processes to rehabilitate or restore wetlands.
ACKNOWLEDGEMENTS
The authors would like to acknowledge the communities of La Esperanza, Chiquilá, San Angel (municipality of Lázaro Cárdenas), and Leona Vicario (municipality of Puerto Morelos) for granting access to their lands and help us in the field work. We also thank Marco Lazcano for providing additional information about the Protected Area “El Eden” and Elizabeth Hernandez and Hector Estrada for providing comments and suggestions during the research.
REFERENCES
Audette, Y., D.S. Smith, C.T. Parsons, W. Chen, F. Rezanezhad, and P. Van Cappellen. 2020. Phosphorus binding to soil organic matter via ternary complexes with calcium. Chemosphere 260:127624.
Bai, J., H. Ouyang, W. Deng, Y. Zhu, X. Zhang, and Q. Wang. 2005. Spatial distribution characteristics of organic matter and total nitrogen of marsh soils in river marginal wetlands. Geoderma 124:181-192.
Bauer-Gottwein, P., B.R. Gondwe, G. Charvet, L.E. Marín, M. Rebolledo-Vieyra, and G. Merediz-Alonso. 2011. The Yucatán Peninsula karst aquifer, Mexico. Hydrogeology Journal 3: 507-524.
Bedford, B.L., M.R. Walbridge, and A. Aldous. 1999. Patterns in nutrient availability and plant diversity of temperate North American wetlands. Ecology 80: 2151-2169.
Bird, L.J., V. Bonnefoy, and D.K. Newman. 2011. Bioenergetic challenges of microbial iron metabolisms. Trends in Microbiology 19: 330-340.
Bridgewater, S., A. Ibáñez, J.A. Ratter, and P. Furley. 2002. Vegetation classification and floristics of the savannas and associated wetlands of the Rio Bravo Conservation and Management Area, Belize. Edinburgh Journal of Botany 59:421-442.
Cejudo, E., D. Ortega-Camacho, E.A. García-Vargas, and E. HernándezAlarcón. 2022. Physical and biogeochemical characterization of a tropical karst marsh in the Yucatan Peninsula, Mexico. Wetlands Ecology and Management 30: 83-98.
Chen, F., G. Jia, and J. Chen. 2009. Nitrate sources and watershed denitrification inferred from nitrate dual isotopes in the Beijiang River, south China. Biogeochemistry 94:163-174.
Cinco-Castro, S., J. Herrera-Silveira, J.L. Marín-Muñoz, H. HernándezNuñez, and C.T. Hernández. 2023. Carbon stock in different ecological types of mangroves in a karstic region (Yucatan, México): an opportunity to avoid site scale emissions. Frontiers in Forests and Global Change 6: 1181542.
Cleveland, C.C. and D. Liptzin. 2007. C:N:P stoichiometry in soil: is there a “Redfield ratio” for the microbial biomass? Biogeochemistry 85: 235–252.
Elser, J.J., W.F. Fagan, R.F. Denno, D.R. Dobberfuhl, A. Folarin, A. Huberty, S. Interland, S.S. Kilham, E. McCauley, K.L. Schulz, E.H. Siemann, and R.W. Sterner. 2000. Nutritional constraints in terrestrial and freshwater food webs. Nature 408: 578 –580.
USEPA (U.S. Environmental Protection Agency). 2002. A Lexicon of Cave and Karst Terminology with Special Reference to Environmental Karst Hydrology. EPA/600/R-02/003. Washington DC.
Fragoso-Servón, P., F. Bautista, O. Frausto, and A. Pereira. 2014. Characterization of karst depressions (shape, size and density) at 1: 50,000 scale and the associated type of flood in the State of Quintana Roo, Mexico. Revista mexicana de ciencias geológicas 31:127-137.
Güsewell, S. 2004. N: P ratios in terrestrial plants: variation and functional significance. New Phytologist 164:243-266.
Güsewell, S., W. Koerselman, and J.T.A. Verhoeven. 2016. Biomass N:P ratios as indicators of nutrient limitation for plant populations in wetlands. Ecological Applications 13:372-384.
Herrera-Silveira, J.A., M.A. Pech-Cardenas, S.M. Morales-Ojeda, S. Cinco-Castro, A. Camacho-Rico, J.C.P. Sosa, J.E. Mendoza-Martinez, E.Y. Pech-Poot, J. Montero, and C. Teutli-Hernandez. 2020. Blue carbon of Mexico, carbon stocks and fluxes: a systematic review. PeerJ 8:e8790. Kaiser, M., R.H. Ellerbrock, and H.H. Gerke. 2008. Cation exchange capacity and composition of soluble soil organic matter fractions. Soil Science Society of America Journal 72: 1278-1285.
McKay, J., M. Lenczewski, and R.M. Leal-Bautista. 2020. Characterization of flowpath using geochemistry and 87Sr/86Sr isotope ratios in the Yalahau region, Yucatan Peninsula, Mexico. Water 12: 2587.
Olmsted, I. 1993. Wetlands of Mexico. In: Wetlands of the World: Inventory, Ecology and Management. Vol I. Dordrecht: Springer Netherlands. Palacio Aponte, A.G., R. Noriega Trejo, and P. Zamora Crescencio. 2002. Caracterización físico-geográfica del paisaje conocido como “ bajos inundables”: El caso del Área Natural Protegida Balamkín, Campeche. Investigaciones geográficas 49:57-73.
Ponnamperuma, F.N. 1972. The chemistry of submerged soils. Advances in Agronomy 24: 29-96.
Poor, N., R. Pribble, and H. Greening. 2001. Direct wet and dry deposition of ammonia, nitric acid, ammonium and nitrate to the Tampa Bay Estuary, FL, USA. Atmospheric Environment 35: 3947-3955.
Rejmankova, E., K.O. Pope, R. Post, and E. Maltby. 1996. Herbaceous wetlands of the Yucatan Peninsula: communities at extreme ends of environmental gradients. Internationale Revue der gesamten Hydrobiologie und Hydrographie 81:223-252.
Scott, T.M., G.H. Means, R.P. Meegan, R.C. Means, S. Upchurch, R.E. Copeland, J. Jones, T. Roberts, and A. Willet. 2004. Springs of Florida. Florida Geological Survey, Tallahassee, FL. Bulletin No. 66.
Solleiro-Rebolledo, E., H.V. Cabadas-Báez, P.T. Pi, A. González, S.L. Fedick, J.A Chmilar, and D. Leonard. 2011. Genesis of hydromorphic Calcisols in wetlands of the northeast Yucatan Peninsula, Mexico. Geomorphology 135:322-331.
Vargas, R. and E. Novelo. 2007. Seasonal changes in periphyton nitrogen fixation in a protected tropical wetland. Biology and Fertility of Soils 43:367-372.
Wassen, M,J,, H.G. Olde Venterink, and E.O. de Swart. 1995. Nutrient concentrations in mire vegetation as a measure of nutrient limitation in mire ecosystems. Journal of Vegetation Science 6: 5 –16.
Zapotecas-Tetla, P. 2022. Inventario de Nitrógeno y Fósforo en humedales herbáceos del norte de Quintana Roo. Master’s Dissertation. CICY.
Tropical Wooded Peatland in Delta Amacuro State, Venezuela
Críspulo Marrero1, Miguel Niño1, Daniela Canelón1 , Franco Antonucci1 and Douglas Rodríguez-Olarte2
ABSTRACT
Reconnaissance on edaphological and biological aspects was carried out in a peatland forest near the town of Piacoa in Delta Amacuro State, southeastern Venezuela. Thirteen peat samples were taken in a stratigraphic transect, using Ramsar peat extraction and analysis protocol to study tropical peatlands. Physicochemical parameters were characterized with basic laboratory analysis: color according to the Munsell scale, relative humidity, solubility in water, specific density, pH, conductivity, percentage of organic carbon and percentage of organic matter. Rapid ecological evaluation of vegetation and ichthyofauna associated with aquatic bodies was carried out. Part of a large extension of Orinoco peatlands in delta region, the study area is a marshy wetland which, according to the Ramsar classification, qualifies as forested peatlands (Xp category). Paleoclimatic, palynological and edaphological information in the literature indicates that the peatlands were formed during Holocene processes of marine transgression that occupied settling basins and lowlands where the vegetation was not very different from the current one. Samples collected at different depths (0 to 220cm) clearly show horizons with two color tones: one dark or black (associated with a good surface aeration), and a yellowish brown or brown, associated with an absence or little amount of oxygen as it goes deeper. The pH values decrease with depth (4.25 at the top and 3.9 or 3.5 at depth). The peat has a high water retention that ranges between 60% and 83%. Vegetation in the wetland is diverse: 31 species of plants within 14 families that include tree, shrub and hydrophilic grassland vegetation were identified. In associated water bodies, 41 species of fish grouped within 27 families were found.
Se realizó un reconocimiento sobre aspectos edafológicos y biológicos en una turbera o turbal cercano a la población de Piacoa en el estado Delta Amacuro, sureste de Venezuela. Se tomaron trece muestras de turba en transectos estratigráficos, utilizando el protocolo de análisis y extracción de turba de Ramsar para estudiar turberas tropicales. Fueron caracterizados parámetros fisicoquímicos con análisis básicos de laboratorio: color según la escala de Munsell,
humedad relativa, solubilidad en agua, densidad específica, pH, conductividad, porcentaje de carbono orgánico y porcentaje de materia orgánica. Se realizó una evaluación ecológica rápida de la vegetación y la ictiofauna asociada a los cuerpos acuáticos. La turbera donde se trabajó forma parte de una gran extensión de turberas del Orinoco en la región del delta. El lugar es un humedal pantanoso que, según la clasificación Ramsar, califica dentro de la categoría Xp (turba arbolada). La información paleoclimática, palinológica y edafológica en la literatura indica que éstas se formaron durante procesos de transgresión marina del Holoceno antiguo que ocuparon cubetas y tierras bajas donde existía una vegetación no muy diferente a la actual. En muestras recolectadas a diferentes profundidades, se pueden ver claramente horizontes con dos tonos de color: uno oscuro o negro (asociado a una buena aireación superficial), y otro marrón, pardo o amarillento, asociado a ausencia o poca cantidad de oxígeno a medida que se profundiza. Los valores de pH disminuyen con la profundidad (4,25 en la parte superior y 3,9 o 3,5 en profundidad). La turba tiene una alta retención de agua que oscila entre el 60% y el 83%. La vegetación en el humedal es diversa, habiéndose identificado 31 especies de plantas dentro de 14 familias que incluyen vegetación de árboles, arbustos y pastizales hidrofílicos. En cuerpos de agua asociados se identificaron 41 especies de peces agrupadas en 27 familias.
Palabras Clave: Humedales, Turbera, Turbal, Turba, Delta del Orinoco, Cambio climático, Trampa de carbono
INTRODUCTION
Peatlands (or turbales) are environments characterized by the progressive production and accumulation of organic matter called peat. Peat is made up of semi-decomposed plant remains in environments with permanent water saturation, low oxygen levels and high acidity. In these environments, plant matter have been accumulating for thousands of years because their rate of accumulation exceeds the rate of decomposition. The natural vegetation of tropical peatlands can include dicotyledons, palms, mangroves, sedges, grasses, mosses, and other plants. The diversity of vegetation produces peat with different structures, which can include wood, herbaceous rhizomes, and roots. In highly decomposed peat ( “muck”), plant remains are less recognizable and highly decomposed, and are very dark in color (Ramsar 2018).
In Venezuela most studies on peatlands have focused on the high Andes (e.g., Molinillo and Monasterio 2005). In contrast, peatland in Piacoa (Venezuela) located in the Imataca Mountain Range is an extension of lowland peatlands and is estimated at 70,000 hectares according to
1 INBIO Instituto para el Estudio de la Biodiversidad y Aprovechamiento de Recursos Ambientales UNELLEZ VPA. Guanare, Estado Portuguesa, Venezuela; correspondence author contact: krispulom@gmail.com
2 CRP Colección Regional de Peces UCLA, Barquisimeto Estado Lara, Venezuela
Table 1. Events relevant to the evolution of the Orinoco River and the delta during the Holocene.
Sub-epoch Numerical age (years ago)
Upper Late Holocene
Middle Holocene
4,200
8,200
9,000
Climatological, biological and others events relevant to the evolution of the Orinoco River and the delta during the Holocene
• Significant quantities of Amazonian sediments are transported to the Orinoco delta platform, continuing coastal progradation there (Warne et al. 2002)
• Sea level approached its present stand. The stabilization of the sea-level that occurred would have favored the transgression of the coastal line (Montoya et al. 2009)
• The sediments transported by the Orinoco were not distributed uniformly breaking the natural channels, changing their course (avulsion) and forming now the main channels (Aslan et al. 2003)
• Worldwide the rise in sea level brought with it a strong saline intrusion around coastal lands contributed to the annihilation of large tracts of forests and in other salt-intolerant vegetation. The massive amount of dry plant material from these destroyed phytocommunities are now part of the accumulated peat (Hapsari et al. 2017).
• Humid climate like the one now experienced (Schubert 1988; Villagrán 1993; Latrubesse 2003). The bulk of the vegetation that formed the Orinoco peat is not very different from what we see today Montoya et al. 2009; Leal and Bilbao 2011 and Ballesteros et al. 2014)
Lower Early Holocene
11,700
1,6M to 10,000
• Worldwide, most of today’s tropical continental peatlands began forming, relatively close to the coastal ranges (around 10,000 years ago) (UO 2020).
• Great fluvial channels of the Venezuelan llanos rivers were created and a period of sediment deposition occurred. During this time the bulk of the material came to shape the landscape, including peat (plant material trapped in situ in depressions in the vicinity of the river). Waters from Andean rivers (including Colombian territory), and Guiana rivers, carried sediments downstream to form the Orinoco Basin (Méndez-Baamonde 2005 a and b).
• Final glaciation Wisconsin (Last Glacial Maximum, LGM) The melting of the ice begins slowly, and the transgression begins as the sea advances over the continent (Vivas 2011)
• Glaciation Wisconsin.
• 1,4 million years ago the waters of the sea were withdrawn from the coasts because its level was 110 meters below its current height (regression). The sediments carried by the ancient Orinoco were discharged directly from the continental shelf to the deep sedimentary environments of the Atlantic Ocean.
Matos (2014). This area has historically alternated between being densely covered with vegetation in humid periods, and more open during dry periods in sync with climate changes during recent geological times (Schubert 1986; González et al. 2013). Establishment of peat on the floodplains of Orinoco took place in many depressions during favorable times for the accumulation of organic matter, aided by global changes in sea level occurred in Holocene. Although the Orinoco Delta rests on very old deep rocky strata, it contains superficial sedimentary facies that constitute Venezuela’s youngest lands, mainly Holocene deposits (González de Juana et al. 1980; Vivas 2011 and Latrubesse 2003) and that is why the peat is said to of recent origin. Below, in the Table 1 we summarize the main events that were relevant in the formation of the Orinoco delta and the Piacoa peatlands.
Peatlands are vulnerable at various levels, either to anthropogenic interventions (burning, use of peat carbon and drainage of their waters; Cole et al. 2022) or largescale environmental changes, either natural or induced, for example, climate change effects (Garcin et al. 2022). These authors point out that tropical peatlands in the Congo (Africa) have responded intermittently to environmental changes by reversing carbon accumulation-lossaccumulation pattern, depending on whether the climate was predominantly humid or dry. In this regard, they say: “drying climate probably resulted in a regional drop in the water table, which triggered peat decomposition, including the loss of peat carbon accumulated prior to the onset of the drier conditions”. Therefore, from the point of view of carbon accumulation, the environmentally beneficial service provided by peatlands, because for millennia they have
been trapping CO2, which is one of the strongest promoters of the greenhouse effect (and collaterally of global warming), may be compromised in the long term depending on how global and local climate change scenarios evolve.
In Venezuela, if the long-term precipitation decrease data were confirmed, as Olivares (2018) points out (values with downward trends consistent with 2008 reports by other authors), this will eventually mean a very dry environment. In this scenario, as hypothesized by Garcin et al. (2022) for peatlands in the Congo, peatlands here in the Orinoco would lose accumulated carbon. If, on the contrary, as pointed out by Sachs et al. (2009) the Intertropical Convergence Zone (ICZ) will continue its migration to the north, reaching 126 kilometers north of its current position at the end of the century, this could affect the country by promoting an increase in the intensity, volume and frequency of rainfall, as well as the rainy coverage area. This could mean a more humid climate, which would indirectly favor the accumulation of carbon.
METHODS
Peat Analysis
Thirteen soil samples with peat were taken. Ramsar peat extraction and analysis protocol and studies of tropical peatlands were employed (Marrero 2017; Ramsar 2018). Samples were collected in a stratigraphic transect with two or three samples per point (50 cm, 100 cm and 220 cm), both in the soil and in the peat within the floodable grass-
land. All the samples were placed in 2 kg plastic bags and labeled for later analysis in soil laboratories, where were determined the following parameters: color according to the Munsell scale, relative humidity, solubility in water, specific density, pH, conductivity, percentage of organic carbon and percentage of organic matter.
Collections and Identification of Botanical Specimens
An in situ species recognition was carried out, with botanical specimens collected for their exhaustive identification in the UNELLEZ PORT University Herbarium. The analysis was complemented with phenological data available at the time of collection. The distribution of vascular species was consulted in the New Catalog of the Vascular Flora of Venezuela (Hokche et al. 2008), the Trópicos database (2022) and JSTOR Global Plants (2022).
Record for Aquatic Fauna (Fish)
Fish specimens were collected with nets, photographed, and after identification they were released. Local fish centers were visited in the Piacoa market, where people were interviewed about the origin of the fish.
Study Area and Characteristics
The Orinoco delta region is a very complex environment both in its genesis and in its current maintenance (MéndezBaamonde 2005a, b). It is divided into four large natural re-
Figure 1. Location of study area. (Produced by José Gregorio Quintero)
gions: 1) the northeastern swampy plain, 2) the deltaic plain of the Morichal Largo and Tigre rivers, 3) the Delta itself, and 4) the deltaic plains south of the Río Grande (MéndezBaamonde 2005a, b; González 2011; Colonnello 2014; Marrero and Rodríguez-Olarte 2017). The southeast sector is dominated by the Rio Grande (the principal distributary) and complex networks of anastomosing fluvial and tidal channels. The abundance of siliciclastic deposits suggests that fluvial processes such as overbank flooding strongly influence this area (Aslan et al. 2003).
The area examined where peat is located is an extension of the lower delta, and to a lesser extent, of the Middle delta. It is a plain under the marine and fluvial action of the Rio Grande and the rivers that drain from the north of the Guiana Shield, such as the Imataca, Acure, and Arature, whose sediments originate fluvio-marine reliefs, such as: channels (in the process of silting), plains flat surface swamps and in positions below sea level, marshes or swampy areas, banks and estuary islands. All of these landforms, with slopes between 0 and 1% (Castillo 1994; González 2011) have poor drainage.
Points where samples were taken are within a peat whose estimated area is 5500.4 hectares; is located near the town of Piacoa, in Juan Bautista Arismendi, Casacoima Municipality in the Delta Amacuro State and Northwest of the National Imataca Forest Reserve. Piacoa´s peats have been well studied, among others, by Matos (2014), who carried out a survey with a view to evaluating the area for its peat production potential (i.e., for use as an agricultural substrate). These peats are a natural resource located within the boundaries of the Imataca Forest Reserve and under the management and administration of the Ministerio del Poder
Figure 2. Variations in temperature and precipitation in Tucupita, Amacuro Delta State. (Produced by José Gregorio Quintero)
Figure 3. Schematic relief of the area where samples were taken in the Piacoa peatland, highlighting the basins or depressions of accumulation. (Produced by Críspulo Marrero)
Popular del Ecosocialismo (MINEC).
Climate. Annual average temperatures range between 21ºC and 31ºC. Average annual rainfall varies between 1260 mm and 1,400 mm (Figure 2). The annual precipitation regime tends to be bimodal, registering maximum values in June, July, and August, to later decrease in September and increase again from October to December. The dry season occurs from February to April, with May being a transitional month (Comerma and Mogollón 1994; Rondón-León 2009). The relative humidity values are high: in July with 85.5% and in December 81.5% - the months of maximum humidity. These high values are a consequence of the high rainfall, high evaporation (1800 mm) and the presence of woody vegetation that allows the concentration of humidity. The prevailing winds in the delta are the trade winds from the northeast, which freely run through the delta plain until they meet the foothills of the Imataca mountain range south of the Rio Grande.
Relief. The average elevation does not exceed 10 meters above sea level. There is a system of depressions whose slopes are very low (less than 0.5%), while the dragging of sediments from the Orinoco has formed banks of riverbanks, creating a system of sedimentation basins where water is retained (Figure 3). As mentioned, historically the area is a means of recent sedimentary accumulation (Holocene) active at least since the last marine transgression, when the sea advanced over the continent. This rise in sea level facilitated the filling of basins with marine clays, which were locally mixed with peat and fluvial sediments, especially in the upper delta, where the influence of the Orinoco River is greater. Periodic flooding of the Orinoco River, excess rainwater, and the slow drainage of micro-basins produce conditions of total or partial water saturation favoring peat formation across almost all of the area.
Color Munsell Black or dark 10YR2/1) Brown or yellowish dark or brown (10YR 4/4) Dark yellowish or brown (YR 4/4)
RESULTS
Peatland Type
According to Ramsar classification, the Piacoa´s peatlands can be considered within the forested peatlands or peatswamp forests (Xp category). Characteristically, they are peat colonized by trees, shrubs, or grassland vegetation. This category includes oxbows (meanders or dead arms of the river) full of peat and sedimentation basin dominated by flooded grasslands (Figure 4). Also included in this category are the peaty flooded forests, which cover extensive lowlands and are found in large areas in the western Amazon basin and on the northeastern coast of South America (Venezuela, Guyana, Suriname, and French Guiana).
Basic Physicochemical Evaluation of Piacoa Peat
The results of the physicochemical analysis are presented in Table 2. There are two color tones of peat: one dark or black and the other yellowish brown or brown. The difference in color is associated with aeration or oxygenation processes: in the case of dark peat (highly decomposed organic matter) there was extensive contact with oxygen while for brown peat it was limited (fiber were still visible). The pH values decrease as you go deeper: 4.25 at the top and 3.9 or 3.5 at the deepest part. Water retention is high (60% to 83%). The bulk density of the material varies once it has dried: it goes from 0.25 ton/m3 at the time of extraction to 0.65-0.75 once dried. This is a consequence of the arrangement of the dry particles, which are compacted when they lose moisture. The percentages of organic matter vary between 68% for peat near the surface to 49% for deep peat. This indicates an incipient lignification process of the peat at depth.
Vegetation and Flora of Piacoa Peatland
The area’s vegetation dominated by grasslands dedicated to cattle ranching interspersed with relicts of humid forest as well as thickets in different degrees of succession (Figure 5). Figure 6 shows some of the flora species found. Orinoco River is the main shaper of the landscape, permanently contributing to water balance in the main estuaries of the region. Four vegetation units were defined within and around the peat: Floodable Grassland (in the peat area), Savannah, Shrub Land (Matorrales), and Low Forest. Below is a description, as well as details of main elements that make up each defined unit.
Floodable Grassland. This unit contains water almost year-round, so its dominant species were aquatic herbs with 31 species reported. Dominant families were: Poaceae, Cyperaceae, Lentibulariaceae and Onagraceae. It was common to observe Montrichardia arborescens forming dense colonies, as well as dense colonies of several Poaceae species (Hymenachneam plexicaulis, Paspalum virgatum, Andropogon bicornis, among others). Bora (Eichhornia azurea) was also well established forming large monotypic colonies. Among grasses and on the banks of the estuary, it was common to observe at least three species of carnivorous plants of the genus Utricularia. Floating plants, among them were the aquatic ferns Azolla filiculoides and Salvinia auriculata.
Savannah. Predominant savannahs in the Piacoa sector are of anthropogenic origin. In this case they are open and wooded, where the woody element is very scarce. In other cases the trees were introduced species such as Mango (Mangifera indica) and Pesgua (Syzygium cumini) that have become invasive species, expanding through natural areas. In the floristic inventory, 23 native species and two
Table 2. Basic physicochemical parameters at
depths in the Piacoa peat. (Produced by Críspulo Marrero)
introduced species were found, with the dominant families being Cyperaceae and Poaceae. The herbaceous matrix was composed of Trachypogon spicatus, Axonopus anceps, Panicum rudgei, Bulbostylis junciformis, Lagenocarpus rigidus, Rhynchospora albomarginata, Polygala timotou, and Peramaga lioides. The woody elements were scattered and were made up of Byrsonim acrassifolia, Curatella americana, Mabeataquari, Xylopia aromatica, and Miconia albicans. Securidaca marginata and Sabicea velutina were among the suffrutes observed, while lianas were represented by Mandevilla leptophylla, Davilla kunthii and Passiflora laurifolia. Matorrales. Due to the livestock activity in the area, the formation of thickets in different successional stages is frequent. The floristic inventory recorded 60 species with dominance of Poaceae, Leguminosae, Cyperaceae, Melastomataceae, Rubiaceae, Asteraceae and Solanaceae. The most common species were Pityrogramma calomelanos, Achyranthes asperavar pubescens, Bidenscy napifolia, Cyperus luzulae, Fimbristy lismiliacea, Fuire naumbellata, Kyllingaodorata, Coutoubea ramosa, Ludwigia hyssopifolia, L. talifolia, Phytola ccarivinoides, Andropogon virgatus, and Paspalum virggatum. Woody species such as Trema micrantha, Bixauru curana, Senna multijuga, Vismia laxiflora, Clidemia bullosa and Miconia serrulata were
found in the sites that have not been buried by the tails. The most common vines and lianas are Clitoria arborescens, Momordica charantia, Stygmaphyllon sinuatum, Gouania polygama and Cissuserosa species
Low Forest. These forests are heavily impacted by logging, sporadic burning and expansion of the livestock frontier. Differences can be evidenced between forests in hilly systems and those subject to flooding. A total of 30 species were reported, with the following families being most abundant Rubiaceae, Chrysobalanaceae, Heliconiaceae, Leguminosae, and Arecaceae. They had medium to sparse coverage, with one or two tree strata, made up of individuals from 6 to 18 m tall, including Perocarpus acapulcensis, Matayba peruviana, Protium sp., Ouratea ferruginea, Hirtella racemosa, Licania sp., Aldina castanea, Brownea coccinea and Licania species.
The Area’s Importance on Local Fishes
The Orinoco delta area is very rich in wetlands, both marine and freshwater. Sediment transport processes and deltaic formation have produced many channels that communicate in a complex way, and everything is highly interconnected. The amount of fluvial sediments and organic matter present are a source of food for a multitude of organisms, especially fish. Lasso and Sánchez-Duarte (2011) recorded 440 species comprised of 20 orders and 82 families
Figure 5. Map of vegetation cover and land use in the Piacoa peatland area, Delta Amacuro. (Produced by José Gregorio Quintero)
Figure 6. Common species in the Piacoa peatland area, Delta Amacuro. (Photos by Miguel Niño and Daniela Canelón, February 2022)
in the Orinoco River delta. The best represented groups were the orders Characiformes, Perciformes (e.g., curvinas, mackerel, and mullet) and Siluriformes (catfish) with 132, 101 and 87 species, respectively. The five families with the highest species richness included Characidae (73 species), Cichlidae (26 species), Pimelodidae (24 species), Sciaenidae (23 species), and Loricariidae (17 species). Of the species identified for this system, 39% have marine and estuarine habits, while the rest are strictly freshwater.
These same authors claimed that the delta zone and particularly the “bars” and the mouths of numerous streams of the Delta, represented areas of great productivity and ecological and fishing importance. In some areas, periodic evaluations of fishing activities have been carried out, which have yielded figures of around 6,000 tons/year of commercial fishes. For this reason, the entire Orinoco delta is essential for the reproduction of numerous migratory aquatic species of fish and crustaceans, both those coming from fresh water (rest of the basin) and those coming from the oceanic side. They also constitute a refuge and feeding area for all the larval and juvenile forms of the aforementioned organisms.
The aquatic system which forms Piacoa peat is connected with other Orinoco delta environments, and despite not being a permanent water body is home to many species of the local ichthyofauna. In many places there is a layer of surface vegetation above the water, leaving enough space under it for the movement of aquatic life between the riverbed and the flood zone once they are connected. For this reason, this system is very dynamic and periodically renewed with the entry of water from the Orinoco River.
This process of movement and those places of shelter for fish are vital to the area, because a lot of fish from the river is consumed there, as can be seen on a visit to the local market. Figure 7 shows the local fish species (a total of 41 species in 27 families are reported) and 6 commercially important species captured in the area, which were photographed at the Piacoa’s Saturday market, on the banks of the Orinoco. Among the latter are: Pseudoplatystoma, Ageneiosus, Erithrinus, Hoplosternum, and Mylossoma.
FINAL CONSIDERATIONS
The Orinoco peatlands are part of the wetland complex in the megadelta of this river. Here, in this portion of the Venezuelan territory, we clearly see that there is a connecting link between past climatic events (accumulation of organic matter in the Holocene), a rich biodiversity in the present, and a valuable resource (i.e., organic fertilizer) that can improve farmland to provide food now and in the future. For these reasons, it is necessary to study the peatlands and their relationship to maintain and support a healthy aquatic system to preserve what is essential to the current aquatic ecosystem and exploit what can be done within pertinent guidelines that regulate the use of these valuable resources in a sustainable manner.
Tropical peatlands are one of Earth’s most efficient natural carbon stores. Specifically in the Orinoco delta, Vegas-Vielarrubia et al. (2010) estimate that first centimeters of the soils store 45.0–97.0 kg m− 2. Consequently, the Orinoco delta contributes approximately 0.049 Gt to the global carbon storage. This fact, in relation to peat lands in general, gives rise to an international concern as they experience rising threat from deforestation and drainage (Cole et al. 2022). Methods of peat extraction must be applied in accordance with the country’s commitments to climate change mitigation.
This entire area is an environment in a continuous process of expansion and evolution, due to the incessant supply of sediments transported by the Orinoco River and the area’s tributaries. Likewise, the annual flood patterns imposed by the water regimes mean that the ecosystem is not static, but on the contrary very dynamic and constantly changing. This means that a large number of animals and plants species take refuge in the place. There are elements of fauna and flora there that must be studied in order to systematically quantify the immense biodiversity present.
ACKNOWLEDGMENTS
We’d like to acknowledge and thank José Gregorio Quintero who prepared maps and the figure on climatic data.
REFERENCES
Aslan, A., W.A. White, A.G. Warne, and E.H. Guevara. 2003. Holocene evolution of the western Orinoco Delta. Venez. GSA Bull. 115, 479–498. https://doi.org/10.1130/ 0016-7606 (2003)115<0479: HEOTWO>2.0.CO;2
Ballesteros, T., E. Montoya, T. Vegas-Vilarrúbia, S. Giralt, M.B. Abbott, and V. Rull. 2014. An 8700-year record of the interplay of environmental and human drivers in the development of the southern Gran Sabana landscape, SE Venezuela. The Holocene 24(12) September 30, 2014. Castillo, D. 1994. Estudio integral del Delta del Orinoco. El Geógrafo. Año XIX N° 20. DIGECAFA.
Cole, L.E.S., C.M. Åkesson, K. Anggi Hapsari, D. Hawthorne, K.H. Roucoux, N.T. Girkin, H.V. Cooper, M.J. Ledger, P.O’Reilly, and S.A. Thornton. 2022. Tropical peat lands in the anthropocene: Lessons from the past. Anthropocene 37(2022)100324
Colonnello, G. 2014. Bosques y matorrales de pantano del delta del Orinoco. In: C.A. Lasso, A. Rial, G. Colonnello, A. Machado-Allison and F. Trujillo (eds.). 2014. XI. Humedales de la Orinoquia (ColombiaVenezuela). Serie Editorial Recursos Hidrobiológicos y Pesqueros Continentales de Colombia. Instituto de Investigación de Recursos Biológicos Alexander von Humboldt (IAvH). Bogotá, D. C., Colombia. 303 p. Comerma, J. and L.F. Mogollón. 1994. Suelos del Delta del Río Orinoco. Suelos de Venezuela. Editorial Palmaven. Caracas, Venezuela. 35 pp. Garcin, Y., E. Schefuß, G.C. Dargie, D. Hawthorne, I.T. Lawson, D. Sebag, G.E. Biddulph, B. Crezee, Y.E. Bocko, S.A. Ifo, Y E. Mampouya Wenina, M. Mbemba, C. E.N. Ewango, O. Emba, P. Bola, J. Kanyama Tabu, G. Tyrrell, D.M. Young, G. Gassier, N.T. Girkin, C.H. Vane, T. Adatte, A.J. Baird, A. Boom, P. Gulliver, P.J. Morris, S.E. Page, S. Sjögersten, and S.L. Lewis. 2022. Hydroclimatic vulnerability of peat carbon in the central Congo Basin. Nature. 2022. https://doi.org/10.1038/ s41586-022-05389-3
González, B.V. 2011. Los bosques del delta del Orinoco. BioLlania especial 10:1197-240 (2011).
Figure 7. Some fish species observed in the area of the Piacoa peatland.
(Photos by Críspulo Marrero)
Trachelyopterus galeatus
Hoplias malabaricus Roeboides sp
Pyrrhulina sp
Gymnotus carapo
Toracocharax sp
Eigenmannia virescens
Sternopygus macrurus
Ageneiosus sp
Fish for sale at the Piacoa flea market
Poptella sp
Polycentrus schomburkgki
González de Juana, C., J.M. Iturralbe de Arozena, and X. Picard-Cadilat. 1980. Geología de Venezuela y sus cuencas petrolíferas. Ediciones Foninves Impreso por Gráficas Armitano C.A, Caracas, Venezuela. 1031 pp. González O., M. Bezada, Z. Millán, and J. Carrera. 2013. Cambios paleoambientales durante el Pleistoceno tardío - Holoceno de la cuenca del río Portuguesa, Llanos Centro-Occidentales, Venezuela. Interciencia Oct. 2013, Vol. 38 No. 10.
Gornitz, V. 2007. Sea level rise after the ice melted and today. Science Briefs National Aeronautics and Space Administration (NASA) Goddard Institute for Space Studies, USA. 1 pp
Hapsari, A. K., S. Biagioni, T.C. Jennerjahn, P. Meyer Reimer, A. Saad, Y. Achnopha, S. Sabiham, and H. Behling. 2017. Environmental dynamics and carbon accumulation rate of a tropical peatland in Central Sumatra, Indonesia. Quaternary Science Reviews Volume 169, 1 August 2017, pages 173-187.
Hokche, O., P.E. Berry and O. Huber. 2008. Nuevo catálogo de la flora vascular de Venezuela. Fundación Instituto Botánico de Venezuela. Caracas Venezuela. 40 pp.
JSTOR Global Plants. 2022. JSTOR Global Plants. Available: https:// plants.jstor.org/ (Acces, 11 March 2022).
Lasso, C.A. and P. Sánchez-Duarte. 2011. Los peces del delta del Orinoco. Diversidad, bioecología, uso y conservación. Fundación La Salle de Ciencias Naturales y Chevron C. A. Venezuela. Caracas. 500 pp. Latrubesse, E.M. 2003. The Late-Quaternary Paleohydrology of large South American fluvial systems. In: K.J. Gregory and G. Benito (eds.). Paleohydrology: Understanding Global Change. Wiley. Hoboken, NJ, EEUU. pp. 193-212.
Leal, A.V. and A. Bilbao. 2011. Cambios de vegetación durante el Holoceno Tardío en un morichal de los Llanos del Orinoco, Venezuela. Acta Bot. Venez. 34 (2): 237-256.
Marrero, C. 2017. Introducción a los métodos para clasificar, identificar, caracterizar y delimitar los humedales de agua dulce de Venezuela. BioLlania Especial No.14, enero (2017).
Marrero, C. and D. Rodríguez-Olarte. 2017. Los humedales costeros venezolanos en los escenarios de cambios climáticos: vulnerabilidad, perspectivas y tendencias. p. 461-476. In: A.V. Botello, S. Villanueva, J. Gutiérrez and J.L. Rojas Galaviz (eds.). Vulnerabilidad de las zonas costeras de Latinoamérica al cambio climático. UJAT, UNAM, UAC. 476 p.
Matos, M.X.E. 2014. La turba carbonífera en Latinoamérica. Edición especial del libro electrónico del Centro de Estudios Universitarios de la Universidad de Monterey. Nuevo León, Monterrey, México. 66 pp.
Méndez Baamonde, J. 2005a. El delta del Orinoco. pp.12-23. Frente atlántico venezolano. Investigaciones Geoambienales PDVSA-INTEVEP. Altos de Pipe, Estado Miranda. Venezuela. 159 pp.
Méndez-Baamonde, J. 2005b. Sedimentación en la plataforma continental y frente Atlántico en el delta del Orinoco. p. 25-37. Frente atlántico venezolano Investigaciones Geoambienales PDVSA-INTEVEP. Altos de Pipe, Estado Miranda. Venezuela. 159 pp. Molinillo, M. and M. Monasterio. 2005. El Complejo de humedales del páramo El Banco (pp. 6-15) In: X. Izurieta (Ed.). Turberas altoandinas: espacios frágiles de vida y cultura.. Proyecto Peat lands in the Tropical Andes, 2005 69 pp.
Montoya, E., J. Pedra-Méndez, E. García-Falcó, M. Gómez-Paccard, S. Giralt, T. Vegas-Vilarrúbia, F. W. Stauffer and V. Rull. 2009. Long-term vegetation dynamics of a tropical megadelta: mid-holocene palaeoecology of the Orinoco delta (NE Venezuela). Collectanea Botanica Vol. 28 (2009).
Olivares, B.O. 2018. Condiciones tropicales de la lluvia estacional en la agricultura de secano de Carabobo, Venezuela. La Granja: Revista de Ciencias de la Vida. Vol. 27(1): 86-102. http://doi.org/10.17163/lgr. n27.2018.07
Ramsar. 2018. Lineamientos para inventarios de turberas tropicales a fin de facilitar su designación como sitios Ramsar. Secretaría de la Convención de Ramsar. Nota informativa N 9, Gland, Suiza.16 pp. Rondón-León, C.E. 2009. Estado Delta Amacuro. Fundación Empresas Polar. GeoVenezuela. Capítulo 45. pp. 126-197.
Sachs, J.P., D. Sachse, R.H. Smittenberg, Z. Zhang, D.S. Battist, and S. Golubic. 2009. Southward movement of the Pacific intertropical convergence zone AD 1400–1850. Nature Geoscience Vol 2 July 2009. www. nature.com/naturegeoscience. 2009 MacMillan Publishers Limited. Schubert, C. 1986. Paleoclima del Pleistoceno tardío en el Caribe y regiones adyacentes: un intento de compilación. Carlos Schubert, Centro de Ecología, Instituto Venezolano de Investigaciones Científicas. Altos de Pipe, Estado Miranda, Venezuela. 20 pp.
Schubert, C. 1988. Climatic change during the last glacial and the Caribbean: a Review. Interciencia 13: 128-137.
University of Oregon (UO). 2020. UO team identifies what could be world’s oldest tropical peatland. https://www.uoregon.edu/ October 6, 2020.
Vegas-Vilarrúbia, T., F. Baritto, P. López, G. Meleán, M.E. Ponce, L. Mora, and O. Gómez. 2010. Tropical Histosols of the lower Orinoco Delta, features and preliminary quantification of their carbon storage. Geoderma 155, 280–288.
Villagrán, M.C.1993. Una interpretación climática del registro palinológico del último ciclo glacial postglacial en Suramérica. Bull. Int. Étu. Andines 22 (1): 243-258.
Vivas, L. 2011. El cuaternario en Venezuela. GeoVenezuela. Fundación Empresas Polar, Capítulo 10. Caracas, Venezuela. pp. 24-127.
Warne, A.G., E. Guevara, and A. Aslan 2002. Late Quaternary evolution of the Orinoco Delta, Venezuela. Journal of Coastal Research Vol. 18: 225-253.
Cushion Plants from the Andes — an Overview of Current Knowledge and Some Research Needs
Violeta Martínez-Amigo1 and Ricardo Jaramillo2
ABSTRACT
Cushion plants are a unique plant life form adapted to the harshest conditions of the alpine and Antarctic environments around the world. Along the rugged topography of the Andes, cushion plants play a key role often serving as keystone species that create milder conditions and microclimates and provide shelter for other organisms. Additionally, some of them have the ability to grow under waterlogged soils in peatlands, where they have deep roots systems and low organic matter decomposition rates, resulting in high carbon accumulation rates. In this article, we will delve into the intriguing world of Andean cushion plants, exploring their adaptations and ecological roles. At the end, we raise and question some issues about cushion plants ecological processes and their implications for future studies.
RESUMEN
Las plantas en cojín son una forma de crecimiento única adaptada a resistir las duras condiciones de los ambientes alpinos y antárticos en todo el mundo. A lo largo de la abrupta topografía de los Andes, los cojines cumplen un papel fundamental al crear condiciones más moderadas y microclimas, además de proporcionar refugio a otros organismos. Además, algunas plantas en cojín tienen la capacidad de crecer en suelos saturados de agua como el de las turberas, donde tienen un sistema de raíces profundas y bajas tasas de descomposición de la materia orgánica, lo que resulta en altas tasas de acumulación de carbono. En este artículo, ahondaremos en el intrigante mundo de las plantas en cojín Andinas, explorando sus adaptaciones y roles ecológicos. Al final, planteamos algunas ideas y preguntas sobre los procesos ecológicos de las plantas cojín y sus implicaciones para futuros estudios.
INTRODUCTION
High-elevation ecosystems around the world are generally characterized by harsh environmental conditions, such as low extreme temperatures, high frequency of freeze-thaw events, high radiation, and poorly-developed soils that limit plant life. However, plants have developed fascinating adaptations to decouple from the atmospheric conditions and survive under stress (Körner 2003). One of these distinctive adaptations are cushion plants, which have modified their architecture to overcome the harsh conditions and maintain
milder ones on their inside. They are particularly interesting to study because of their large plasticity when occupying different environments, being essential elements in high mountain peatland ecosystems. Here we present an overview of two most common cushion plants in the Andean region and some of the research needs to better understand their ecology and role in mountain peatland ecosystems.
Cushion plants are a unique plant life form that can be found in the Andes (South America), the Rockies (North America), the Tibetan Plateau, the Alps in Europe, Tasmania, New Zealand, and Tierra del Fuego (Arredondo-Núñez et al. 2009; Meng et al. 2013). They are characterized by a dense, compact, and rounded shape, resembling a cushion or pillow (Figure 1). Typically, their leaves are tightly packed near the top of the stems, and they have a deep root system. These features help them decouple from the environmental temperature by insulating on the inside and retaining warmer temperatures during the day, and slowly cooling down at night (Cavieres et al. 2006; Sklenář et al. 2016). Their dome-shape also allows them to store moisture, increase soil organic matter, and protect them from abrasive winds (Hager and Faggi 1990; Pyšek and Liška 1991; Cavieres et al. 2006).
1 Department of Evolutionary Biology, Ecology and Environmental Sciences, Institut de Recerca de la Biodiversitat (IRBio), University of Barcelona, Barcelona, Spain; correspondence author contact: martinez_v@ub.edu
2 School of Forest Resources and Environmental Science, Michigan Technological University, Houghton, MI, USA.
Figure 1. Azorella aretioides growing in a glacier foreland in Antisana Volcano, Ecuador. (Photo by Ricardo Jaramillo)
DIVERSITY AND DISTRIBUTION OF CUSHION PLANTS ALONG THE ANDES
Cushion plants comprise about 338 species within 34 plant families and are widely distributed in temperate Alpine and tropical mountain regions. Along the Andes, they can be found living under a wide humidity gradient from the humid northern Páramos of Colombia and Ecuador to the drier Puna of Perú and Bolivia. Some of the most widely distributed are Plantago rigida (observed from Colombia to Bolivia) and Distichia muscoides (observed from Colombia to Argentina), with others such as, Paepalanthus karstenii (observed in Venezuela and Colombia), Azorella compacta, A. aretioides, A. pedunculata, various species of the genera Oreobolus, and Zameioscirpus (observed from Ecuador to Bolivia), Xenophyllum spp. (observed from Colombia to northern Argentina and Chile), Pycnophyllum (observed from central Perú to northern Chile and southwest Bolivia), Oxychloe andina (observed from Perú to Argentina), Astelia pumila and Donatia fascicularis (observed in Chile), Lysipomia muscoides and Patosia clandestine (observed from Bolivia to Argentina and Chile), and Aciachne pulvinate (observed from Venezuela to Perú).
ROLE OF CUSHION PLANTS AS FOUNDATION SPECIES
In tropical mountain ecosystems such as Páramo and Puna, cushion plants play a crucial role in shaping the successional patterns along elevation gradients. They are considered to be ecosystem engineers and foundation species because they are the first ones to colonize newly formed ecosystems, such as deglaciated forelands, along with mosses, lichens, and some grasses (Cavieres et al. 2006; Sklenář 2009; Molenda et al. 2012; Reid and Lortie 2012; Schöb et al. 2012). Furthermore, because they can modify their inner microenvironment and create milder conditions, they can host other non-cushion plant species, serving as nurseries and allowing their establishment and growth in otherwise inhospitable conditions (Cavieres and Badano 2009; Anthelme et al. 2012).
The rugged topography of the northern Andes sets the perfect conditions for all these species to colonize a vast variety of steep terrains near glaciers, interspersed with concave glacial valleys with wetter conditions (Figure 2). Some, such as Azorella, Xenophyllum, and Pycnophyllum species, can colonize sandy and rocky slopes with poorly developed soils (Sklenar 2009), and lava flows and moraines (Suárez et al. 2015). Around 4100 m tussocks-grasses decline in abundance, and a dynamic transition takes place towards a cushion dominance. Here, the dominance of Plantago rigida, Xenophyllum and Azorella species, is particularly more pronounced in the more humid páramos of Colombia and Ecuador (Ramsay 1992, 1999; Sklenář 2000). As the soil gets wet and peatlands start to develop, only a few species have the ability to live under waterlogged conditions (Bosman et al. 1993). While commonly we associate the peatland vegetation around the world with
soft bogs of Sphagnum mosses or grasses lawns of Carex and Juncus species, in the tropical Andes above 4100 m, peatlands tend to be dominated by cushion plants (Cleef 1981; Kleinbecker et al. 2010; Benavides et al. 2013; Suárez et al. 2021, 2023). Different regional terms describe the types of cushion peatlands found in the Andes, with “bofedales’’ being the most widespread.
At a landscape scale, when growing in a peatland, cushion plants are typically found on topographic depressions, being more abundant in the center where the water tables are close to the surface and more stable. As the water tables get deeper towards the edge, cushion plants become more dispersed, while herbs and grasses, still associated with wet conditions, become dominant and extend beyond the peatland (Coombes and Ramsay 2001). Zooming in at a site scale, cushion morphology creates a microtopography pattern of hollows and hummocks (Figure 3). In the lower points or hollows small water courses run through to temporary pools, where mosses and semi-aquatic species grow (Ruthsatz et al. 2020). At the same time, the top of the cushion or hummock is colonized by some opportunistic herbs and small shrubs, getting away from the water.
PRODUCTIVITY OF ANDEAN CUSHION PLANTS
One key characteristic of cushion-dominated peatlands in the Andean mountains is that they have some of the swiftest rates of net primary production and organic carbon generation, among all known peat-accumulating ecosystems
Figure 2. The rugged topography of the Andes allows the formation of peatlands in flat areas. (Photo by Ricardo Jaramillo)
(Chimner and Karberg 2008; Cooper et al. 2010; Salvador et al. 2014). This high rate is due to particular factors that limit organic matter decomposition, such as a relatively frequent input of groundwater and rainfall, and wet anoxic soils (Cooper et al. 2015). Actually, some of the most rapid peat accumulation rates has been reported in the Chilean Andes (2 m per 1000 years), where Oxychloe cushion plant dominates (Earle et al. 2003).
In the Andean peatlands the two most common cushion plants are Distichia muscoides and Plantago rigida (hereafter referred to as their genus name) (Bosman et al. 1993; Coombes and Ramsay 2001; Benavides et al. 2013). According to Cleef (1978), both species constitute cushion peatlands at high elevations (3000–5200 m) in the Puna and Páramo, covering a large latitudinal gradient. This elevation gradient in the northern Andes of Colombia starts in the graminoid and bamboo Páramos, where we can find cushions in boggy valleys and former lakes between 3600–4200 m (Niemann and Behling 2008). In Ecuador the pattern is slightly different, with a peak dominance of both species above 4200 m, with dispersed abundance of Plantago at lower elevations and Distichia being highly dominant at the top range of the elevation distribution range (Figure 4) (Suárez et al. 2023).
Figure 4. Distichia muscoides growing on a peatland near Mt. Carihuayrazo glacier, Ecuador. (Photo by Ricardo Jaramillo)
Figure 3. Distichia muscoides peatland microtopography of hummock and hollows, Colombia. (Photo by Violeta Martínez-Amigo)
When present in peatlands Plantago and Distichia are known to accumulate carbon underground in their roots and senescent leaves. By keeping senescent leaves on short stems, they can retain more humidity, and slow down decomposition of organic matter, making them highly efficient to incorporate organic carbon into the soil. Despite this, their root systems can be very different; on one side Distichia has deeper roots (>50 cm) that grow indefinitely from the terminal end of the stem, while the lower parts gradually die off, resulting in a high productivity of 20002800 g m-2 yr-1. On the other side, Plantago has 1.4 more root biomass than Distichia, but shorter roots and a lower annual root production (~1000 g m-2 yr-1) (Ruthsatz 2012; Palabral Aguilera 2013; Suárez et al. 2021). The resistant vegetal structure that characterizes both species prevents its decomposition, thus remaining in peat soil for long periods (Chimner and Karberg 2008; Cooper et al. 2010, 2015; Benavides et al. 2013).
While some studies have looked into the aboveground biomass (AGB) and productivity patterns of both species, more research is still needed to understand these patterns along nutrient, water and elevation gradients. Regarding Plantago the AGB of small to large cushions can range between 1700-5500 g m-2 (Jaramillo et al. 2023) with a potential contribution of 28% of the total AGB of Plantagodominated peatlands (Suárez et al. 2023). Moreover, Plantago rigida can store nearly 16 times more carbon (Mean ± SE: 13.3 ± 1.2) (Jaramillo et al. 2023) than other species of the same genus, such as Plantago tubulosa (0.81 Mg C ha 1) (Yanqui et al. 2012), raising the importance of this species in the carbon accumulation of peatlands.
When comparing both species’ carbon accumulation patterns, Plantago has higher net productivity than Distichia. The mean net ecosystem exchange reported in Plantago peatlands of Ecuador -0.69 g CO2 m-2 hr-1 (Sánchez et al. 2017) were greater than those reported for Distichia in Colombia (-0.04g CO2 m-2 hr-1) (Martínez-Amigo and Benavides 2023). Also, Distichia productivity using cranked-wire method ranged between 2.1 to 10.9 g C m-2 day-1 (Cooper et al. 2015; Planas-Clarke et al. 2020). Additionally, in terms of carbon storage, Plantago has the higher values (7 to 24 kg C m-2) (Jaramillo et al. 2023) when compared to Distichia (3.7-19.5 kg C m-2) (Martínez-Amigo and Benavides 2023). These variations may be attributed to differences in ecological niches, environmental factors, or management practices. Since they play an important role in primary production and soil carbon accumulation, their ecology is crucial for high Andean peatlands functioning. Thus, we underscore the importance of generating more data for a better understanding of the carbon dynamics of these ecosystems.
Within the vast scope of Andean cushion peatlands, there exists a rich variety of knowledge in different fields, and many of them still present gaps and uncertainties, wait-
ing to be explored. These gaps in our understanding serve as keystones towards new research horizons that spark our curiosity. Below, we raise and question some issues about ecological processes and their implications for future studies.
TOPICS FOR FUTURE RESEARCH
Phytoremediation. Andean cushion plants can grow whether on peatlands, or wet meadows with mineral soils (especially in the Puna) (Chimner et al. 2019). Along the Andean region we commonly associate Distichia cushions with deep-peaty soils, however they can also colonize sandy and coarse soils, associated with areas recently available after glacier retreat and mineral deposits of rivers (Figure 5). Furthermore, Plantago habitat is also related to soils with high mineral content, especially silver and iron concentrations, which at high concentrations could be toxic for other species (Bosman et al.1993). Moreover, the use of plants from Juncaceae and Plantaginaceae families has been reported for bioremediation of heavy metal contamination (Otoya Fernández 2023). Plant species such as Distichia muscoides are classified as hyperaccumulators because of their capacity to remove heavy metals from water sources (Zimmer et al. 2018), opening a set of new research questions about the range of soil conditions where cushion plants can establish and grow.
Figure 5. Distichia muscoides growing on a sandy and coarse soil in the Cordillera Real, Bolivia. (Photo by Violeta Martínez-Amigo)
Cushion collapse. The ongoing climate change has affected peatland hydrology in recent years due to changes in the precipitation regimes or extreme and long droughts (Oyague and Cooper 2020). Recent observations in a Colombian cushion peatland indicated grasses proliferating in the cushion’s surface and sinking of the central area, resulting in cushion collapse (Figure 6). Different hypotheses have been raised to explain the collapse; however, the water table drawdown and soil warming could be a plausible answer. Drier and warmer conditions in a peatland will lead to increased soil oxidation and decomposition rates. When water tables are high, the soil remains anaerobic, and the organic matter accumulates faster than it decomposes. But, under aerobic conditions, microbial activity accelerates carbon decomposition, enhancing the mineralization of the soil and causing peat subsidence, possibly resulting in cushion sinking. Despite this recent phenomenon drawing the attention of the scientific community, Bosman et al. (1994) argues that the collapse and replacing of Plantago cushions by Oreobolus cleefi is related to a development phase of peatlands, and cushion collapse could be a consequence of autogenic factors. In this sense, more research is needed to understand the successional patterns and the effects of extreme environmental conditions to cushion plant physiology and interspecific relations.
Climate change effects. Under the climate change context, with increasing mean temperatures, changes in
precipitation patterns, and glacier melts, the range and distribution of Distichia and Plantago could be affected. These species are usually found in environments shaped by glacier retreat and influenced by meltwater sources, however, their connection to glacier water is still debated. A particular case is the Distichia-dominated peatland of “El Valle de los Cojines” (El Cocuy, Colombia), where cushions are collapsing because of a decreased input of glacier water in recent years. The glacier-fed stream that runs through the center of the peatland carries less and less water than before. Some studies suggest that in the drier Puna the hydrology of cushion peatlands depends directly on glaciers, which ensure a constant water supply for maintaining stable water tables (Verzijl and Quispe 2013; Loza Herrera et al. 2015). However, recent studies propose that they do not necessarily depend on that hydrologic resource and unexpected factors are affecting cushion mortality (Oyague and Cooper 2020).
The relationship between low water table and the proliferation of species adapted to drier conditions was reported by Martínez-Amigo and Benavides (2023), showing different trajectories of plant composition, with decreasing cushion cover and increased abundance of grasses. These changes in species composition raise questions about the successional patterns of host cushion species and the interspecific relations with other plant life forms. In a context of less precipitation and decreasing water table levels species
Figure 6. Cushion collapse in El Cocuy National Park, Colombia. (Photo by Violeta Martínez-Amigo)
with a high dependence on water supply, such as Distichia, could reduce its ecological niche, while others such as Plantago would expand it. There are complex interactions between environmental factors that shape different biotic relations that need to be addressed to understand the successional patterns in these ecosystems.
Cushion plants are peat-forming species and changes in the species composition from cushion plant dominance towards other types of vegetation could result in alterations in the peat accumulation patterns. Thus, concerns arise about how climate change will affect cushion-dominated peatland carbon accumulation patterns and methane emissions. Moreover, there are few studies describing the dynamics of carbon accumulation and greenhouse gas fluxes (CO2 and CH4) in Andean cushion peatlands as discussed previously with large differences between Plantago and Distichia. Despite these differences being attributed to site specific characteristics (e.g., grazing, herbivory, and drainage) we still need to understand how environmental factors are driving the carbon cycle in cushion peatlands.
CONCLUSION
The theoretical framework of the Andean cushion plants presents countless possibilities for novel research. We have identified some of the questions and knowledge gaps in the ecology of these unique plant life forms that we need to address to expand our comprehension of Andean peatlands. The challenges we underscore are: 1) the applications of cushion plants in bioremediation to remove heavy metals from water sources, 2) the changing drivers that could cause cushion collapse, 3) the glacier melting effect on peatland hydrology, 4) the successional patterns on cushion species and their interspecific relations, 5) the carbon accumulation patterns, and 6) methane emissions of cushion peatlands.
REFERENCES
Anthelme, F., B. Buendia, C. Mazoyer, and O. Dangles. 2012. Unexpected mechanisms sustain the stress gradient hypothesis in a tropical alpine environment. Journal of Vegetation Science 23: 62–72. doi: https://doi. org/10.1111/j.1654-1103.2011.01333.x.
Arredondo-Núñez, A., E. Badano, and R. Bustamante. 2009. How beneficial are nurse plants? A meta-analysis of the effects of cushion plants on high-Andean plant communities. Community Ecology 10: 1–6.
Benavides, J.C., D.H. Vitt, and R.K. Wieder. 2013. The influence of climate change on recent peat accumulation patterns of Distichia muscoides cushion bogs in the high-elevation tropical Andes of Colombia. Journal of Geophysical Research: Biogeosciences 118: 1627–1635. doi: https:// doi.org/10.1002/2013JG002419.
Benfield, A.J., Z. Yu, and J.C. Benavides. 2021. Environmental controls over Holocene carbon accumulation in Distichia muscoides-dominated peatlands in the eastern Andes of Colombia. Quaternary Science Reviews 251: 106687.
Bosman, A.F., H. Hooghiemstra, and A.M. Cleef. 1994. Holocene mire development and climatic change from a high Andean Plantago rigida cushion mire. The Holocene 4: 233–243. doi: 10.1177/095968369400400302.
Bosman, A.F., P.C. van der Molen, R. Young, and A.M. Cleef. 1993. Ecology of a paramo cushion mire. Journal of Vegetation Science 4: 633–640. doi: 10.2307/3236128.
Cavieres, L.A., and E.I. Badano. 2009. Do facilitative interactions increase species richness at the entire community level? Journal of Ecology 97: 1181–1191. doi: https://doi.org/10.1111/j.13652745.2009.01579.x.
Cavieres, L.A., E.I. Badano, A. Sierra-Almeida, S. Gómez-González, and M.A. Molina-Montenegro. 2006. Positive interactions between alpine plant species and the nurse cushion plant Laretia acaulis do not increase with elevation in the Andes of central Chile. New Phytologist 169: 59–69. doi: https://doi.org/10.1111/j.1469-8137.2005.01573.x.
Chimner, R.A., L. Bourgeau-Chavez, S. Grelik, J.A. Hribljan, A.M.P. Clarke, M.H. Polk, E.A. Lilleskov, and B. Fuentealba. 2019. Mapping Mountain Peatlands and Wet Meadows Using Multi-Date, Multi-Sensor Remote Sensing in the Cordillera Blanca, Peru. Wetlands 39: 1057–1067. doi: 10.1007/s13157-019-01134-1.
Chimner, R., and J. Karberg. 2008. Long-term carbon accumulation in two tropical mountain peatlands, Andes Mountains, Ecuador. Mires & Peat 3.
Cleef, A.M. 1981. The Vegetation of the Páramos of the Colombian Cordillera Oriental. Mededelingen van het Botanisch Museum en Herbarium van de Rijksuniversiteit te Utrecht 481: 1–320.
Cleef, A.M. 1978. Characteristics of neotropical paramo vegetation and its subantarctic relations. Erdwissenschaftliche Forschung 11: 365–390.
Coombes, L. and P.M. Ramsay. 2001. Vegetation of a cushion mire at 3600 m in Volcán Chiles, Ecuador. In: The Ecology of Volcán Chiles: High-altitude Ecosystems on the Ecuador-Colombia border. Pebble & Shell, Plymouth, United Kingdom, pp. 47–54.
Cooper, D.J., K. Kaczynski, D. Slayback, and K. Yager. 2015. Growth and Organic Carbon Production in Peatlands Dominated by Distichia muscoides, Bolivia, South America. Arctic, Antarctic, and Alpine Research 47: 505–510. doi: 10.1657/AAAR0014-060.
Cooper, D.J., E.C. Wolf, C. Colson, W. Vering, A. Granda, and M. Meyer. 2010. Alpine Peatlands of the Andes, Cajamarca, Peru. Arctic, Antarctic, and Alpine Research 42: 19–33. doi: 10.1657/1938-424642.1.19.
Earle, L.R., B.G. Warner, and R. Aravena. 2003. Rapid development of an unusual peat-accumulating ecosystem in the Chilean Altiplano. Quaternary Research 59: 2–11. doi: 10.1016/S0033-5894(02)00011-X.
Jaramillo, R., A. Marmol-Guijarro, L.G. Doskocil, S. Chimbolema, and E. Suárez. 2023. Using 3D models to quantify aboveground biomass in the cushion-forming species Plantago rigida in an Andean páramo peatland. Mires and Peat 29: 1–7. doi: 10.19189/MaP.2023.RSC. Sc.1829791.
Kleinbecker, T., N. Hölzel, and A. Vogel. 2010. Patterns and gradients of diversity in South Patagonian ombrotrophic peat bogs. Austral Ecology 35: 1–12. doi: https://doi.org/10.1111/j.1442-9993.2009.02003.x.
Körner, C. 2003. Alpine plant life: Functional plant ecology of high mountain ecosystems. Springer. Berlin, Germany
Loza Herrera, S., R. Meneses, F. Anthelme 2015. Comunidades vegetales de los bofedales de la Cordillera Real (Bolivia) bajo el calentamiento global. Ecología en Bolivia 50, 39–56.
Martínez-Amigo, V. and J.C. Benavides. 2023. Carbon balance shift in mountain peatlands along a gradient of grazing disturbance in the tropical Andes (Colombia). Plant Ecology. https://doi.org/10.1007/s11258023-01356-8
Meng, F., P. Shi, W. Yan, 2013. The Function of cushion plants in Alpine ecosystems: Patterns and mechanisms. Chinese Journal of Applied and Environmental Biology 19: 561–568.
Molenda, O., A. Reid, and C.J. Lortie. 2012. The Alpine Cushion Plant Silene acaulis as Foundation Species: A Bug’s-Eye View to Facilitation and Microclimate. PLOS ONE 7: 1–10. doi: 10.1371/journal. pone.0037223.
Niemann, H., and H. Behling. 2008. Late Quaternary vegetation, climate and fire dynamics inferred from the El Tiro record in the southeastern Ecuadorian Andes. Journal of Quaternary Science 23: 203–212. doi: https://doi.org/10.1002/jqs.1134.
Otoya, M. C. 2023. Potencial de Distichia muscoides en la biorremediación de un bofedal impactado con drenaje ácido de roca en Áncash. Licenciatura en Biología-Microbiología-Parasitología. Universidad Nacional Pedro Ruiz Gallo, Lambayeque, Perú. Oyague, E., and D.J. Cooper. 2020. Peatlands of the central Andes puna, South America. Wetland Science & Practice 37: 255–260.
Palabral Aguilera, A. 2013. Relación de la composición florística y su biomasa subterránea con las variables hidrológicas en bofedales de Sajama, Bolivia. Herbario Nacional de Bolivia. http://biblioteca.cehum.org/ handle/CEHUM2018/1418
Planas-Clarke, A.M., R.A. Chimner, J.A. Hribljan, E.A. Lilleskov, and B. Fuentealba. 2020. The effect of water table levels and short-term ditch restoration on mountain peatland carbon cycling in the Cordillera Blanca, Peru. Wetlands Ecology and Management 28: 51–69. doi: 10.1007/s11273-019-09694-z.
Ramsay, P.M. 1999. Landscape mosaics in the High Andes: the role of fire in páramo communities. Nature and Culture in Landscape Ecology: Experiences for the 3rd Millennium, 192.
Ramsay, P.M. 1992. The páramo vegetation of Ecuador: the community ecology, dynamics and productivity of tropical grasslands in the Andes Bangor University (United Kingdom).
Reid, A.M., and C.J. Lortie. 2012. Cushion plants are foundation species with positive effects extending to higher trophic levels. Ecosphere 3: 1-18. doi: https://doi.org/10.1890/ES12-00106.1.
Ruthsatz, B. 2012. Vegetation and ecology of the high Andean peatlands of Bolivia. Phytocoenologia 42: 133–179. doi: 10.1127/0340269X/2012/0042-0535.
Ruthsatz, B., K. Schittek, and B. Backes, B. 2020. The vegetation of cushion peatlands in the Argentine Andes and changes in their floristic composition across a latitudinal gradient from 39 S to 22 S. Phytocoenologia, 50: 249–278.
Salvador, F., J. Monerris, and L. Rochefort. 2014. Peatlands of the Peruvian Puna ecoregion: types, characteristics and disturbance. Mires and Peat 15: 1–17.
Sánchez, M.E., R.A. Chimner, J.A. Hribljan, E.A. Lilleskov, and E. Suárez. 2017. Carbon dioxide and methane fluxes in grazed and undisturbed mountain peatlands in the Ecuadorian Andes. Mires and Peat 19: 1–18. doi: 10.19189/MaP.2017.OMB.277.
Schöb, C., B.J. Butterfield, and F.I. Pugnaire. 2012. Foundation species influence trait-based community assembly. New Phytologist 196: 824–834.
Sklenář, P. 2000. Vegetation ecology and phytogeography of Ecuadorian superpáramos. Doctoral dissertation, Charles University, Prague. Sklenář, P. 2009. Presence of cushion plants increases community diversity in the high equatorial Andes. Flora - Morphology, Distribution, Functional Ecology of Plants 204: 270–277. doi: https://doi. org/10.1016/j.flora.2008.04.001.
Sklenar, P. 2009. Presence of cushion plants increases community diversity in the high equatorial Andes. FLORA 204: 270–277. doi: 10.1016/j. flora.2008.04.001.
Sklenář, P., A. Kucerová, J. Macková, K. Romoleroux. 2016. Temperature microclimates of plants in a tropical alpine environment: How much does growth form matter? Arctic, Antarctic, and Alpine Research 48: 61–78. doi: 10.1657/AAAR0014-084.
Suárez, E., S. Chimbolema, R.A. Chimner, and E.A. Lilleskov. 2021. Root biomass and production by two cushion plant species of tropical high-elevation peatlands in the Andean páramo. Mires and Peat 27: 1–9. doi: 10.19189/MaP.2020.OMB.StA.2131.
Suárez, E., J.A. Hribljan, S. Chimbolema, K. Harvey, V. Triana, J.E. Zurita, R. Jaramillo, and L.G. Doskocil. 2023. Vegetation structure and aboveground biomass of Páramo peatlands along a high-elevation gradient in the northern Ecuadorian Andes. Frontiers in Plant Science 14: 1-9 doi: 10.3389/fpls.2023.1102340.
Suárez, E., K. Orndahl, and K. Goodwin. 2015. Lava Flows and Moraines as Corridors for Early Plant Colonization of Glacier Forefronts on Tropical Volcanoes. Biotropica 47: 645–649.
Verzijl, A., and S.G. Quispe. 2013. The system nobody sees: Irrigated wetland management and alpaca herding in the Peruvian Andes. Mountain Research and Development 33: 280–293.
Yanqui, R.M., L.C. Minaya, and M.V. Balbín. 2012. Almacenamiento de carbono en especies predominantes de flora en el lago Chinchaycocha. Apuntes de Ciencia & Sociedad 2.
Zimmer, A., M.K.B. Rodríguez, C.J.A. Oropeza, J.W.S. León, and J.R. Bullard. 2018. Implementación de Dos Sistemas de Biorremediación como Estrategia para la Prevención y Mitigación de los Efectos del Drenaje Ácido de Roca en la Cordillera Blanca, Perú. Revista de Glaciares y Ecosistemas de Montaña 4: 57-76.\
Tropical Mountain Peatlands from Southern Espinhaço Range, Brazil: Ecosystem
Services, Biodiversity and Paleoenvironmental Reconstruction
Alexandre Christofaro Silva1 and Diego Tassinari2
ABSTRACT
Peatlands are transition ecosystems between terrestrial and aquatic environments, formed over time and space by the accumulation of plant materials under conditions of excessive moisture, low nutrient availability, low pH and oxygen scarcity, in which organic matter undergoes slow processes of humification. Peatland ecosystems from the Southern Espinhaço Range (SdEM), located in the State of Minas Gerais, were formed by the sui generis combination of environmental factors, setting the stage for their vast biodiversity, endemic and peculiar. For thousands of years these ecosystems have been developing, preserving proxies for environmental reconstitution, sequestering more and more carbon, and increasing their capacity to store water (spongelike effect) and regulate the water discharge from streams. Environmental reconstruction studies carried out in these ecosystems have revealed various regional paleoclimatic changes in the last 35,000 years. The carbon stock sequestered is 8.7 Mt, and 255 million m3 of water are stored in 25,385 hectares of these peatlands. These ecosystems constitute the headwaters of the most important rivers in Eastern Brazil: the São Francisco, Jequitinhonha, and Doce River basins, and regulate their flows during the dry season. However, peatlands located outside of conservation units are threatened by human activity. The Long-Term Ecological Research Program “Peatlands of the Southern Espinhaço Range: Ecosystem Services and Biodiversity” (PELDturf; funded by National Council of Scientific and Technologic Development - CNPq and Minas Gerais State Research Support Foundation - Fapemig), initiated in 2021, has intensified the characterization and monitoring of biodiversity and ecosystem services of peatlands. The results of two decades of research have revealed the importance of these ecosystems for biodiversity, the global carbon cycle, regional water resources, and paleoenvironmental reconstruction. It has also become evident that the rapid degradation of these ecosystems, mainly caused by human activity, can irreversibly compromise their ecosystem services, biodiversity, and paleoenvironmental reconstruction studies in the medium term. Therefore, it is imperative to empower local and regional communities regarding the importance of peatland ecosystems for the environment, socio-economy, and quality of life for their populations, as well as for the planet.
Keywords: wetlands, water storage, carbon sequestration, paleoenvironments.
RESUMO
As turfeiras são ecossistemas de transição entre ambientes terrestres e aquáticos, formados ao longo do tempo e do espaço pelo acúmulo de materiais vegetais em condições de umidade excessiva, baixa disponibilidade de nutrientes, baixo pH e escassez de oxigênio, nos quais a matéria orgânica sofre lentos processos de humificação. Os ecossistemas de turfeiras da Serra do Espinhaço Meridional (SdEM), localizados no Estado de Minas Gerais, foram formados pela combinação sui generis de fatores ambientais, preparando o cenário para sua vasta biodiversidade, endêmica e peculiar. Durante milhares de anos, estes ecossistemas foram se desenvolvendo, preservando proxies para a reconstituição ambiental, sequestrando cada vez mais carbono e aumentando a sua capacidade de armazenar água (efeito de esponja) e regular a vazão dos cursos d’água. Estudos de reconstrução ambiental realizados nestes ecossistemas revelaram diversas alterações paleoclimáticas regionais nos últimos 35.000 anos. O estoque de carbono sequestrado é de 8,7 Mt e 255 milhões de m3 de água estão armazenados em 25.385 ha dessas turfeiras. Esses ecossistemas constituem as cabeceiras dos rios mais importantes do Leste do Brasil: as bacias dos rios São Francisco, Jequitinhonha e Doce, e regulam seus fluxos durante a estação seca. No entanto, as turfeiras localizadas fora das unidades de conservação estão ameaçadas pela atividade humana. O Programa de Pesquisa Ecológica de Longa Duração “Turfeiras da Serra do Espinhaço Meridional: Serviços Ecossistêmicos e Biodiversidade” (PELDturf; financiado pelo Conselho Nacional de Desenvolvimento Científico e Tecnológico - CNPq e Fundação de Amparo à Pesquisa do Estado de Minas Gerais - Fapemig), iniciado em 2021, intensificou a caracterização e monitorização da biodiversidade e dos serviços ecossistêmicos das turfeiras. Os resultados de duas décadas de investigação revelaram a importância destes ecossistemas para a biodiversidade, o ciclo global do carbono, os recursos hídricos regionais e a reconstrução paleoambiental. Tornou-se também evidente que a rápida degradação destes ecossistemas, causada principalmente pela atividade humana, pode comprometer irreversivelmente os seus serviços ecossistêmicos, a biodiversidade e os estudos de reconstrução paleoambiental, no médio prazo. Portanto, é imperativo capacitar as comunidades locais e regionais no que diz respeito à importância dos ecossistemas de turfeiras para o ambiente, a socioeconomia e a qualidade de vida das suas populações, bem como para o planeta.
1 Full Professor - Department of Forestry Engineering/Federal University of Vales of Jequitinhonha and Mucuri (UFVJM) - alexandre.christo@ufvjm.edu.br
2 Doctor in post-doctoral internship - Postgraduate Program in Vegetable Production/Federal University of Vales of Jequitinhonha and Mucuri (UFVJM) diego.tassinari@ufvjm.edu.br
Palavras-chave: áreas úmidas, armazenamento de água, sequestro de carbono, paleoambientes.
INTRODUCTION
Peatlands are transition ecosystems between terrestrial and aquatic environments, formed over time and space by the accumulation of plant tissues under conditions of excessive moisture, low nutrient availability, low pH, and oxygen scarcity, as organic matter undergoes slow processes of humification/mineralization (Moore 1997; Costa et al. 2003; Campos et al. 2012).
Most world’s peatlands (4,880,000 km2) occur in polar, boreal, and temperate regions (78%), while 21% are in the tropics (UNEP, 2022). Their importance in the global carbon cycle is evidenced by their representing approximately 4.2% of the world’s soils yet storing 28.4% of its carbon (Joosten and Clarke 2002; Janfada et al. 2006; Yu 2012).
Peatland ecosystems cover 3% of the Brazilian territory (260,000 km2) (UNEP 2022). They are found in the Amazon, on the coastal plains of the Southeast and South regions, in the highlands in the South and in the Espin-
haço Range, with greater expression in its central portion (tropical mountain peatlands), located in the State of Minas Gerais (Southern Espinhaço Range - SdEM) and recognized by UNESCO as a “Terrestrial Biosphere Reserve.” These ecosystems have significant socioecological, economic, historical, cultural, landscape, geological, archaeological, paleontological, and scientific relevance.
The SdEM presents extensive stepped planation surfaces, ranging from 1,000 to 2,000 meters in altitude. Depressions on these surfaces are underlain by poorly permeable quartzite lithologies and thereby accumulate water seasonally (Campos et al. 2016). In the initial stages of peatland formation, as the water dries out, vegetation develops, but during the rainy season, the depression is flooded, vegetation dies, and the cycle repeats annually. Thus, organic matter slowly accumulates, reaching a thickness of over 6 meters (Silva et al. 2009; Horák-Terra et al. 2014, 2015 and 2020).
The radiocarbon age of the basal peat layer indicates that the peatland ecosystems from SdEM began forming in the Pleistocene, at least around 45,000 years before present
Figure 1. Peatland ecosystems from the Southern Espinhaço Range (SdEM). A and B: wet grassland vegetation and a patch of semi-deciduous seasonal forest in the headwaters of the Araçuaí river. The white flowers of Rhynchospora speciosa (Cyperaceae) are conspicuous. C and D: wet grassland vegetation and patches of semi-deciduous seasonal forest in the headwaters of the Preto River, inside a protected nature conservation site. The plant in the foreground of D is Chusquea pinifolia (locally known as bamboo, a member of the Poaceae)
(BP) (Horák-Terra et al. 2014; Silva et al. 2020). They are still poorly understood in Brazil but provide ecosystem services such as water storage and carbon sequestration. Their anaerobic conditions lead to low redox potential values, contributing to the preservation of records of paleoclimatic and paleoenvironmental changes. These services, along with their unique biodiversity, make these ecosystems extremely important locally, regionally, and globally.
The peatlands provide numerous functions. While they function as a sponge (Gorham 1991; Campos et al. 2012; Barral 2018), storing excess water from the rainy season, they slowly release it during the dry season, thereby regulating the flow of watercourses. The continuous accumulation of organic matter and its preservation in the environment (due to slow decomposition) make these ecosystems active carbon sequesters, contributing to mitigating global warming (Campos et al. 2012; Silva et al. 2013b). Pollen grains, phytoliths, charcoal fragments, isotopes of C and N, as well as major and minor inorganic elements, are proxies that allow inference about vegetation cover, erosion/sedimentation, and atmospheric cycles, as well as the dynamics of the paleolandscape since the Late Pleistocene (HorákTerra et al. 2020). Several phases of paleoclimate and paleoenvironmental changes in the last 35,000 years have been interpreted through paleoenvironmental reconstruction studies conducted in these peatlands (Schellekens et al. 2014; Horák-Terra et al. 2015 and 2020; Silva et al. 2016, 2017, 2019 and 2020; Machado et al. 2021; Costa et al. 2022a and b). Furthermore, these ecosystems are also essential for the quality of life of traditional populations and regional communities. In 2019, the collection of “semprevivas” flowers (meaning “everlasting”), a centuries-old activity carried out by traditional populations, was recognized by the UN/FAO as one of the “Globally Important Agricultural Heritage Systems” (GIAHS), revealing to Brazil and the world the role of these ecosystems in regional sustainable development. Several species are collected, among which those from the Euriocaulaceae family stand out: Syngonanthus elegans – Sempre-vivas pé-de-ouro; Comanthera elegantula - Sempre-vivas brejeira, and Paepalanthus chiquitensis - Sempre-vivas gigante.
Despite their environmental, social, economic, and scientific importance, these ecosystems have been continuously impacted by human activities. Peatlands located outside protected areas are affected by fires, which significantly reduce local biodiversity, cause carbon loss, gradually decrease their volume, and directly influence the persistence and flow of watercourses. Sediments generated by erosion are carried into the peatlands, leading to siltation and a gradual decrease in their water retention capacity, carbon sequestration, and “sempre-vivas” flower production.
Peatlands conservation is vital for the maintenance of their ecosystem services, sustainable extraction, and paleoenvironmental reconstruction. Long-term research
focused on investigating the functioning patterns of tropical mountain peatland ecosystems and the impacts caused by human activities are essential to understanding their functionalities. In 2021, the Long-Term Ecological Research Program (PELD) ‘Peatlands of the Southern Espinhaço Range: Ecosystem Services and Biodiversity’ – known as PELD TURF, was initiated.
DISTRIBUTION OF PEATLAND ECOSYSTEMS IN THE SOUTHERN ESPINHAÇO RANGE
The region of the SdEM where the peatland ecosystems have been mapped covers an area of 11,801 km2 (Figure 2), in the State of Minas Gerais, Brazil. The SdEM is represented by a set of plateaus oriented predominantly in a north-south direction and with a convexity oriented towards the west. As a result of complex geotectonic evolution, combined with exogenous processes, it has become a large plateau formed by stepped planation surfaces at different altitudes and separated by dissected valleys. The altitudes range from 1,000 to 2,062 m, with an average of 1,250 m (Silva et al. 2005). The current climate is generally classified according to the Köppen classification as Cwb, i.e., mesothermal with summer rains and mild summers. The average annual precipitation varies from 1,000 to over 1,500 mm, and the average annual temperatures range from less than 16 to 24°C. Over 90% of peatlands occur in areas where the average annual precipitation is greater than 1,300 mm, and the average annual temperature ranges between 18 and 22°C (Silva et al. 2022).
The SdEM is the water divide and contributes to the three largest basins in eastern Brazil: the Jequitinhonha River and its major tributary the Araçuaí River, as well as important tributaries of the São Francisco River, such as the Jequitaí River and the Paraúna River, and of the Doce River, such as the Santo Antônio River and the Vermelho River. Many of the watercourses that originate there are named after the dark color of their waters, a consequence of the organic acids derived from peatland ecosystems.
The peatland ecosystems cover an area of 25,385 ha (253.9 km2), which represents 2.15% of the total area (Figure 2). They are distributed in the basins of the São Francisco and Jequitinhonha rivers, being less abundant in the Doce River basin (Silva 2012; Silva et al. 2013b). In general, the Histosols in the peatland ecosystems of the SdEM are very deep, acidic, oligotrophic, highly porous, low in density, saturated with water up to the surface, and have high levels of organic matter in an advanced stage of decomposition.
ECOSYSTEM SERVICES
Water Storage and Availability
The Histosols of the SdEM have a huge water retention capacity (weight/weight), ranging from 36% to 1,727% (Campos et al. 2011; Silva et al. 2013a; Bispo et al. 2015). As mentioned earlier, these organic soils absorb water like
a sponge (Gorham 1991). The higher the organic matter content and the lower the soil bulk density, the greater the water retention capacity. The mapping of 1,180,000 ha (11,800 km2) of the SdEM carried out by Brandão-Martins (2023) identified 25,385 ha of peatlands (253.9 km2). It is estimated that they can store 255 million m3 of water (0.26 km3), which would correspond to a water depth stored in these soils of 9,948 m³ ha-1 or 995 mm (Silva et al. 2023).
Figure 3 shows the peatland ecosystems of the Araçuaí River (AR - impacted) and the Preto River (RP - preserved) with their recharge areas, outlets, and the location of the automatic weather station. The discharge at the outlets of both ecosystems has been monitored since September 2016. Despite the much smaller recharge area, the preserved peatland showed higher specific discharge (L s-1 km-2) during almost the entire analyzed period (September 2016 to June 2023; Figure 4). This peatland has its basin protected by the conservation unit, a high density of vegetation cover, and has not been affected by fires in the last 15 years.
Groundwater Level
The groundwater level in the RP (preserved) and AR (impacted) peatland ecosystems, as well as climatic variables, have been monitored daily since June 2016, respectively by level gauges installed in inspection wells and by an automatic weather station located near the peatlands (Figure 3). The groundwater level fluctuated more negatively in the impacted peatland, reaching a minimum value of 0.9 m and a maximum of 0.11 m below the surface. In the preserved peatland, the fluctuation was 50% less, reaching 0.6 m be-
Figure 2. Distribution of peatlands in the river basins of the northern portion of Southern of Espinhaço Range. (Derived from Brandão-Martins 2023)
Figure 3. Peatland ecosystems of the Araçuaí River and Preto River with their recharge areas, outlets, and the location of the weather station.
Figure 4. Specific discharges during the monitoring period (September 2016 to June 2023) in the preserved peatland (headwaters of the Preto River) and impacted peatland (headwaters of the Araçuaí River).
low the surface while forming a water layer of 0.1 m above the surface in 2022 and 2023. No surface water was observed in the AR peatland during the study period. In both cases, the minimum and maximum levels were reached, respectively, at the end of the dry season (September) and the end of the rainy season (March) (Figure 5). The impacted peatland gradually loses its water retention capacity, influencing the flow in the upper course of the Araçuaí River during the dry season.
Water Quality in Peatland Ecosystems of the Southern Espinhaço Range
The fluctuations of the groundwater level are crucial for the maintenance of tropical peatland ecosystems, as they control the processes of organic matter accumulation and decomposition. These fluctuations also influence the chemical composition of the water, the flux of carbon dioxide (CO2) and methane (CH4) to the atmosphere, and the carbon input into the peatland waters (Kettridge et al. 2015).
Among the physical parameters used to assess water quality in peatlands, temperature, color, turbidity, and dissolved solids are the most common. The water temperature in peatlands tends to show significant seasonal differences, and anthropogenic impacts can increase the temperature of the peatland (Silva et al. 2022). The color of the water is related to the presence of dissolved solids, while turbidity is associated with suspended solids. Normally, peatland waters have a darker color and low turbidity (Bispo et al. 2016; Barral 2018), so an increase in this parameter is an important indicator of degradation.
In the peatlands of the SdEM, the pH is less than 6 and sometimes less than 5, electrical conductivity is very low, less than 0.02 mS cm-1, DO ranges from 4 to 6 mg L-1, BOD is around 0.11 mg L-1, and COD ranges from 8 to 81 mg L-1, indicating reduced microbial activity (Bispo et al. 2016; Barral 2018). The average concentrations of TOC (total organic carbon) range from 3 to 5 mg L-1, and the carbon load exported by the peatlands shows spatial variation (average between 15.8 and 58.18 mg s-1) and
Figure 5. Groundwater level (monthly average) during the monitoring period (September 2016 to June 2023) in the inspection well installed in the preserved peatland (headwaters of the Preto River - RP) and the impacted peatland (headwaters of the Araçuaí River - AR).
Table 1. Altitude, depth, and radiocarbon age, average C and N contents, and C/N ratio of 111 dated layers from 25 peatland cores collected in the SdEM.)
Attributes Average Range
Altitude (m) 1,437 1,168–2,062
Depth of dated layers (cm) 118 4‒419
Depth of basal layers 178 15‒419
14C age of dated layers (yr BP) 9,929 Modern ‒43,646
Calibrated 14C age of dated layers (cal. yr BP) 14,396 Modern ‒43,646
temporal variation (from 3.87 to 167 mg s-1) (Barral 2018). The presence of metals and dissolved nutrients is strongly influenced by the climatic and geological characteristics of the peatland region. Bispo (2013) found low concentrations of macronutrients (P, K, N, S) and micronutrients (P, Mn, Zn, Cu) and significant concentrations of Fe and Al in the peatland waters.
Table 2. Number of peatland cores collected, average depth, average stage of organic matter decomposition, average carbon content, and average radiocarbon age of the basal organic layer (Silva et al. 2020).
Altitude (m) Number of peatland cores
1760–2015 3
*von Post scale; 1Horak-Terra et al. (2014); 2Bispo et al. (2015); 3Silva et al. (2009)
Carbon Sequestration in the Peatlands
The total organic carbon (TOC) stock in these peatlands is 8.7 Mt (Silva et al. 2023), with average C contents of 341 t ha-1 in peatland ecosystems. Samples collected from 25 peatland cores, ranging from 1,160 to 2,014 m elevation, allowed for radiocarbon dating of 111 peat layers, with depths ranging from 4 to 419 cm and ages ranging from modern to 43,696 cal. years BP. These ecosystems began to form 43,686 cal. years BP, and the average age of their basal layers is 14,646 cal. years BP (Table 1).
Depth decreases, organic carbon content increases, and the stage of organic matter decomposition decreases with altitude (Table 2).
The vertical growth rate (VGR) ranges from 0.034 to 11.3 mm yr-1, with a median and mean of 0.15 and 0.62 mm yr-1, respectively. The carbon accumulation rate (CAR) varies from 0.3 to 70.1 g m-2 yr-1, with a median and mean of 10.3 and 14.5 g m-2 yr-1. Considering the median values of VGR and CAR and the mean age of the 14C-dated layers (9,929 cal. yr BP), it was estimated that the mean VGR and CAR during the Holocene were 1.5 m and 103 kg m-2, respectively. Thus, the average carbon accumulation during the Holocene would be 1,022 t ha-1, assuming linear growth and no interference such as climate change (dry periods), fires, and anthropogenic impacts in the last 300 years.
These data demonstrate the carbon sequestration potential of peatland ecosystems in the SdEM. While carbon accumulation continues in the 21st century, it occurs mainly (or only) in peatlands protected by conservation units. A significant paradox exists: these ecosystems contribute to carbon sequestration, mitigating global warming, but global warming (and anthropogenic impacts) can accelerate carbon losses to the atmosphere, reducing VGR and CAR.
BIODIVERSITY
The information in this section was extracted from Mendonça Filho et al. (2022).
It is estimated that the vegetation along the Espinhaço Range comprises about 5,000 species of vascular plants, of which 40% are endemic, belonging to 134 families and 753
genera (Silveira et al. 2016). This represents approximately 15% of Brazil’s vascular flora in less than 1% of its territory (Reflora, 2016).
In the higher areas of the SdEM, a vegetation mosaic is formed by alternating grasslands and forests (Gonzaga & Machado 2021). The forested portions are naturally fragmented into “forest islands” (woodland patches or capões) (Silveira et al. 2016; Coelho et al. 2016; Coelho et al .2018; Moura et al. 2021; Costa et al. 2021a). The grassland formation is predominantly composed of rupestrian grasslands and open grasslands. The rupestrian grasslands occur on shallow, sandy soils with few nutrients and low water retention capacity. They experience intense winds, solar radiation, high daily temperature fluctuations, and long periods of drought. The wet grasslands, which usually occur between the rupestrian grasslands and woodland patches, are characterized by a dense herbaceous layer of grass-like plants, associated with Histosols, and located at altitudes above 1,100 m.
Flora of the Peatlands
In the peatlands of the SdEM, the dense herbaceous layer is mainly composed of representatives of the families Cyperaceae (Rhynchospora spp., Lagenocarpus spp.), Poaceae (Chusquea pinifolia, Loudetiopsis chrysothrix), Xyridaceae (Xyris spp.), and Melastomataceae (Cambessedesia hilariana, Lavoisiera imbricata, Microlicia spp.) (Figure 6). These plants are common in the rupestrian grasslands surrounding the wet grasslands. Sometimes, several densely clustered individuals form patches in the landscape, such as Microlicia sp. and Lavoisiera imbricata (Figure 7). Smaller and scattered individuals belonging to the families Droseraceae (Drosera spp.), Lentibulariaceae (Utricularia spp.), Eriocaulaceae (Paepalanthus spp., Comanthera spp., and Syngonanthus spp.), and Orchidaceae (Epidendrum spp., Cleistes spp., Habenaria spp., and Sisyrinchium spp.) are also frequent in these areas (Mendonça Filho et al. 2022). Some species occur exclusively in wet areas, such as Eriocaulon aquatile, Leiothrix fluitans, Sygonanthus hygrotrichus, Mayaca spp., Paepalanthus planifolius, Paepalanthus distichophyllus, and Paepalanthus flaccidus
Figure 6. Some common herbs of the peatlands: A - Microlicia sp. (Melastomataceae), B - Lavoisiera imbricata (Melastomataceae), C - Xyris platystachya (Xyridaceae), D - Rhynchospora sp. (Cyperaceae) with Xyris, E - Rinchosphora speciosa (Cyperaceae) , and F - Lagenocarpus rigidus (Cyperaceae).(Photos A–D, F by Carlos Victor M. Filho and E by Fabiane N. Costa)
Eriocaulaceae is one of the most characteristic families in these high areas of the Espinhaço Range, with several species known as “sempre-vivas” (everlasting flowers). Some of these species of local economic importance, occur in both the rupestrian grasslands and wet grasslands, such as Comanthera xeranthemoides and C. centauroides. There are also species from other families, such as Cyperaceae and Xyridaceae, that occur in these wet areas and are also harvested and traded, including Rhynchospora spp., Xyris spp., and Cephalostemum riedelianus. A significant number of endemic and still poorly known species exist, such as Actinocephalus coutoensis and Paepalanthus diamantinensis, and new species have recently been discovered (Mendonça Filho et al. 2022).
PALEOENVIRONMENTAL RECONSTRUCTION
Here, we present the main paleoenvironmental inferences at the local and regional scales since the Late Pleistocene, based on the analysis of peat cores from Pinheiro (HorákTerra et al. 2020), Pau de Fruta (Horák-Terra et al. 2015), and Rio Preto (Costa et al. 2022a and b; Machado et al. 2021).
Paleoenvironment during the Late Pleistocene
The palynological record from the Pinheiro peatland suggests a drier and warmer climate (Figure 7), with cooling events and some landscape instability between ~35 to 29.6k cal. yr BP (Horák-Terra et al. 2020). From ~29.6 to 13.5k cal. yr BP (calibrated time scale), including the Last Glacial
Maximum (LGM), both the Pinheiro peatland core and the Rio Preto I peatland core suggest predominantly wet and cold conditions (Costa et al. 2022a,b; Horák-Terra et al. 2020; Figure 7). The Rio Preto I peatland core indicates a locally humid and cold climate during the period from ~23 to 13.5k cal. yr BP (Costa et al. 2022a,b). However, Machado et al. (2021), studying phytolith assemblages in the same peatland (Rio Preto II), inferred a less humid environment during this period (Figure 7).
Paleoenvironment during the Pleistocene-Holocene Transition
During the Pleistocene-Holocene transition, between ~13.5 to 11.7k cal. yr BP, the Rio Preto I peatland core indicates a trend of increasing temperature and decreasing moisture compared to the previous period (Costa, 2018).
The Pinheiro peatland also recorded a slight reduction in precipitation around 14.3k cal. yr BP, associated with the Bølling-Allerød interstadial (Horák-Terra et al. 2020). The geochemistry of both peatlands (Rio Preto I and Pinheiro) indicated a period of greater soil stability in the surrounding areas (lower occurrence of erosion) (Costa et al. 2022a,b; Horák-Terra et al. 2020).
Paleoenvironment during the Holocene
With the onset of the Holocene, the trends initiated in the previous period were maintained (Figure 7). However, the areas of dry grassland expanded, and erosional processes increased, suggesting the beginning of a new climatic pattern (Horák-Terra et al. 2020; Costa et al. 2022a,b).
The analysis of environmental geochemistry in the Pau de Fruta and Rio Preto I peatlands also showed the presence of elements associated with long-distance transport (wind erosion) around ~8.3 to 8.1k cal. yr BP, related to the global climatic event “8.2k event.” The “8.2k event” may have been responsible for changes in atmospheric transport (changes in wind frequency or direction, greater availability of source areas, or a combination of factors) (Horák-Terra et al. 2015).
The Rio Preto I peatland core recorded a warm and less humid environment from ~8.5 to 7k cal. yr BP compared to previous periods (Costa et al.2022a,b). This environment was subsequently inferred in the Pinheiro and Pau de Fruta peatlands, between ~6.1 to 3.1k cal. yr BP and ~4.2 to 2.2k cal. yr BP, respectively (Horák-Terra et al. 2020).
After the period of reduced moisture at the regional scale, there was an expansion of the humid and cold forest,
Figure 7. Synthesis of paleoenvironmental changes at the regional and local scales recorded in peatlands from the Southern Espinhaço Range. P/H = PleistoceneHolocene transition. Pinheiro peatland (Horák-Terra et al. 2020); Pau de Fruta peatland (Horák-Terra et al. 2015); Rio Preto peatland (Costa et al. 2022a and b; Machado et al. 2021). (Source: Horak-Terra et al. 2022)
indicating a relative increase in humidity. This vegetation configuration suggests the presence of a sub-humid climate, which would have allowed the establishment of the Cerrado biome as it currently occurs (Horák-Terra et al. 2015 and 2020; Costa et al. 2022a,b).
These studies highlight the excellent potential of the peatlands in the SdEM as archives of environmental and climatic changes.
HUMAN IMPACTS ON THE PEATLANDS
Peatland ecosystems have existed at least since the Late Pleistocene, while human settlements in the SdEM date back to the Upper/Middle Holocene. However, the impacts of human activity on these ecosystems intensified in the 19th and 20th Centuries. The most common impacts are animal trampling, fires, erosion, and sediment deposition, all resulting from extensive livestock grazing (cattle, horses, and mules). Animal trampling causes soil compaction, reducing infiltration and increasing surface runoff in the water recharge area, leading to erosion (Figure 8). In
peatlands, trampling reduces porosity and water retention capacity. Frequent fires in the water recharge area reduce vegetation density and favor surface sealing, increasing surface runoff and accelerating erosion (Figure 9). In peatlands, fires mineralize the organic matter on the surface, causing subsidence, accelerating carbon losses to the atmosphere, reducing water storage capacity, and affecting the biodiversity. They also cause the contraction of organic material, reducing porosity and increasing hydrophobicity of organic compounds, resulting in a decrease in stored water.
Studies conducted by Bispo et al. (2015, 2016) and Barral et al. (2023) in RP and AR peatland ecosystems (Figure 3) document the effects of human activity. The preserved RP peatland had the highest average carbon content and average water volume, as well as the lowest soil density (Table 3), less fluctuation of the water table (Figure 5), higher specific discharge (Figure 4), and greater vertical growth rates and carbon accumulation compared to the anthropized AR peatland.
Figure 8. Impacts of animal trampling in the headwaters of the Araçuaí River: A - animals near a wooded area and peatland, B - concentrated animal trampling at a stream crossing, C - erosion and sedimentation with trampling marks, D -
Barral et al. (2023) showed that carbon losses through water at the outlet of the AR peatland are more than 3 times greater than at the outlet of the RP peatland, and the carbon balance is negative (Table 4). These data demonstrate that the degradation of anthropized peatlands can lead to their disappearance in the medium term.
The use and occupation of areas surrounding eight peatland ecosystems in SdEM, within a radius of 1 km, were studied by Fonseca et al. (2018) using aerial photographs and satellite images from 1964 to 2014 (50 years).
Between 1964 and 1984, the only land use was pasture, but starting from 1995, other uses such as forestry and annual crops were identified, increasing the occupied area by more than 3 times. The decline of diamond mining in the late 20th Century led to increased occupation of the surrounding areas as many miners shifted to agriculture.
The intensification of land use around the peatlands can, in the medium term, affect their carbon sequestration and water storage capacity, compromising biodiversity and impacting the population of SdEM. It also contributes to
Figure 9. Fire impact in the water recharge area and peatland ecosystem of the Araçuaí River (SdEM), in June 2021. On the right, a piezometer for monitoring the water table, burned. (Source: Silva et al. 2022)
Table 4. Area and carbon accumulation under different vegetation
SdEM. (Bispo et al. 2016)
Table 3. Area, average depth, volume, soil density, and average carbon content of two peatland ecosystems in SdEM (Bispo et al.2016).
global warming and reduces the flow of important watercourses in the semi-arid region of northeastern Minas Gerais state.
FINAL REMARKS
Over tens of thousands of years, the peatland ecosystems from SdEM have been developing, preserving proxies for environmental reconstruction, sequestering carbon, and increasing their water storage capacity. However, with the arrival of European settlers in the 18th Century, this scenario began to change. From the late 19th Century onwards, degradation has been accelerating due to population growth, technological advancement, and regional economic cycles. The increasing population has led to a higher demand for food and energy, while technology has enabled the mining of wetland areas. Furthermore, the decline of diamond mining in the late 20th Century led to increased occupation of the surrounding areas. In the 21st Century, ornamental quartzite mining has been modifying the landscape.
The degradation of the peatlands in the headwaters of the Araçuaí River (monitored anthropized peatland) combined with changes in rainfall patterns in the region may lead to water scarcity becoming increasingly more common during the dry season in the medium term. This will affect agricultural activities and the urban water supply of several municipalities in the Araçuaí River Basin and, consequently, the Jequitinhonha River Basin.
Researchers from UFVJM and other institutions in Brazil and abroad began studying these ecosystems in the early 21st Century. Since 2016, ecosystem services have been monitored in two of these ecosystems: the Rio Preto peatland (protected) and the Araçuaí River peatland (anthropized). With the start of the Long-Term Ecological Research Program “Peatlands of the Southern Espinhaço Range: Ecosystem Services and Biodiversity” - PELD TURF (funded by CNPq and Fapemig) in February 2021, monitoring became more intensive, and the research team expanded. More than two dozen Brazilian and foreign researchers began collecting data on physical and biotic components on these peatland ecosystems.
The results of two decades of research point in divergent directions. On the one hand, they have revealed the importance of these ecosystems for biodiversity, the global carbon cycle, regional water resources, and paleoenvironmental reconstruction. On the other hand, they have made it clear that the rapid degradation of these ecosystems, mainly caused by human activity, can irreversibly compromise their environmental services, biodiversity, and paleoenvironmental reconstruction studies in the medium term. Therefore, it is essential to empower local and regional communities regarding the importance of peatland ecosystems for the environment, socio-economy, quality of life for their populations, and the planet. PELD TURF is taking the first steps in this direction, initiating its communication (outreach) programs with a focus on traditional communi-
ties and the population of SdEM. Videos and printed publications are being produced for dissemination in schools, the public, private and nonprofit sectors presenting the ecosystem services provided by peatlands and their interdependence with local/regional communities and the planet in a simple language.
REFERENCES
Barral, U.M. 2018. Hidrologia e fluxo de carbono em turfeiras tropicais de montanha. (Tese de doutorado). Universidade Federal dos Vales do Jequitinhonha e Mucuri, Diamantina.
Barral, U.M., A.C. Silva, C. Christófaro, C.R. Costa, D. Tassinari, A. Penafort Filho, G.M. Macedo, D.F.A. Bispo, and T.S. Gonçalves. 2023. Can anthropization govern the water and carbon dynamics? A case study of peatlands in Serra do Espinhaço Meridional, Brazil. Wetlands Ecology and Management 31: 479–497 https://doi.org/10.1007/s11273-023-09929
Bispo, D.F.A. 2013. Caracterização qualiquantitativa dos recursos hídricos e da dinâmica do carbono de turfeiras das cabeceiras do Rio Araçuaí. (Dissertação de mestrado). Universidade Federal dos Vales do Jequitinhonha e Mucuri, Diamantina.
Bispo, D.F.A., A.C. Silva, C. Christofaro, M.L.N. Silva, M.S. Barbosa, B.P.C. Silva, U.M. Barral, and J.D. Fabris. 2016. Hydrology and carbon dynamics of tropical peatlands from Southeast Brazil. Catena 143: 18-25. https://doi.org/10.1016/j.catena.2016.03.040.
Bispo, D.F., Silva, A.C., Christofaro, C., Silva, M.L.N., Barbosa, M.S., Silva, B.P.C., & Barral, U.M. 2015. Caracterização de turfeiras das cabeceiras do Rio Araçuaí, Minas Gerais. Rev. Bras. Cienc. do Solo 39: 475-489. https://doi.org/10.1590/01000683rbcs20140337
Brandão-Martins, J.V.M. 2023. Mapeamento de Turfeiras Tropicais de Montanha na Serra do Espinhaço Meridional. (Trabalho de conclusão de curso de graduação). Universidade de Brasília, Brasília.
Campos, J.R.R., A.C. Silva, and P. Vidal-Torrado. 2012. Mapping, organic matter mass and water volume of a peatland in Serra do Espinhaço Meridional. Revista Brasileira de Ciência do Solo 36: 723-732. https:// doi.org/10.1590/S0100-06832012000300004.
Campos, J. R. R., A.C. Silva, J.S.C. Fernandes, M.M. Ferreira, and D.V. Silva. 2011. Water retention in a peatland with organic matter in different decomposition stages. Rev. Bras. Ciência do Solo 35: 1217-1227. https:// doi.org/10.1590/s0100-06832011000400015.
Campos, J.R.R., A.C.Silva, L. Slater, M.R. Nanni, and P. Vidal-Torrado. 2016. Stratigraphic control and chronology of peat bog deposition in the Serra do Espinhaço Meridional, Brazil. Catena 143: 167-173. https://doi. org /10.1016/j.catena.2016.04.009.
Coelho, M.S., G.W. Fernandes, P. Pacheco, V. Diniz, A. Meireles, R.M. Santos, F.C. Carvalho, and D. Negreiros. 2016. Archipelago of montane forests surrounded by rupestrian grasslands: new insights and perspectives. In: Fernandes, G. W. (Ed.), Ecology and Conservation of mountaintop grasslands in Brazil (v. 1, pp. 129-153). New York: Springer.
Coelho, M.S., F.S. Neves, L.N. Perillo, P. Morellato, P., and G.W. Fernandes. 2018. Forest archipelagos: A natural model of metacommunity under the threat of fire. Flora (Jena) 1: 1-10. https://doi.org/10.1016/j. flora.2017.03.013 0367-2530.
Costa, C.R., I. Horák-Terra, H.H.G. Coe, K.F. Chueng, D.O.B.F. Machado, P.B. Camargo, U.M. Barral, D. Tassinari, and A.C. Silva. 2022a. Multi-proxy analysis of a Holocene records from a high-altitude tropical peatland in the Serra do Espinhaço Meridional, Brazil. Journal of South American Earth Sciences 116: 103795. https://doi.org/10.1016/j. jsames.2022.103795.
Costa, C.R., C.F.P. Luz, I. Horák-Terra, P.B. Camargo, U.M. Barral, C.V. Mendonça Filho, T.S. Gonçalves, and A.C. Silva. 2022b. Paleoenvironmental dynamics in central-eastern Brazil during the last 23 000 years: tropical peatland record in the Cerrado biome. Journal of Quaternary Science 37:1-15. DOI: 10.1002/jqs.3459
Costa, C.S.B., B.E. Irgang, A.R. Peixoto, and J.C. Marangoni. 2003. Composição florística das formações vegetais sobre uma turfeira topotró-
fica da planície costeira do Rio Grande do Sul, Brasil. Acta Bot. Bras. 17:203-212. https://doi.org/10.1590/S0102-33062003000200004.
Costa, T.R., C.C. Moura, L.S. Silva, A.P.D. Gonzaga, and E.L.M. Machado. 2021a. Funcionalidade de ilhas florestais na Reserva da Biosfera da Serra do Espinhaço. In Almeida, P, and F. Martins (Eds.), Pesquisa e desenvolvimento de abordagens para o ensino de ciências biológicas (1. ed., pp. 93-108). Editora Amplla. DOI: 10.51859/ampla.pda.351.1121-0
Costa, T.R., C.C. Moura, E.L.M. Machado, and A.P.D. Gonzaga. 2021b. Flora arbórea de capões na Reserva da Biosfera da Serra do Espinhaço. Revista Espinhaço 10:1-12. https://doi.org/10.5281/zenodo.5104405.
Fonseca, S.F.; A.C. Silva, and J.A. Senna. 2018. Técnicas de geoprocessamento aplicadas na identificação de usos da terra no entorno das turfeiras da Serra do Espinhaço Meridional. R. Ra’e Ga 43:124 -139. DOI: 10.5380/raega
Gorham, E. 1991. Northern Peatlands: Role in the Carbon Cycle and Probable Responses to Climatic Warming on JSTOR. Ecol. Appl. 1:182195. https://doi.org/10.2307/1941811.
Horák-Terra, I., A.M. Cortizas, C.F.P. Luz, A.C. Silva, T. Mighall, P.B. Camargo, C.V. Mendonça-Filho, P.E. Oliveira, F.W. Cruz, and P. Vidal-Torrado. 2020. Late Quaternary vegetation and climate dynamics in central-eastern Brazil: insights from a ~35k cal a bp peat record in the Cerrado biome. J. Quat. Sci. 35:664-676. https://doi.org/10.1002/ jqs.3209.
Horák-Terra, I., A.M. Cortizas, C.F.P. Luz, P. Rivas López, A.C. Silva, and P. Vidal-Torrado. 2015. Holocene climate change in central-eastern Brazil reconstructed using pollen and geochemical records of Pau de Fruta mire (Serra do Espinhaço Meridional, Minas Gerais). Palaeogeogr. Palaeoclimatol. Palaeoecol. 437:117-131. https://doi.org/10.1016/j. palaeo.2015.07.027.
Horák-Terra, I., A.M. Cortizas, P.B. Camargo, A.C. Silva, and P. VidalTorrado. 2014. Characterization of properties and main processes related to the genesis and evolution of tropical mountain mires from Serra do Espinhaço Meridional, Minas Gerais, Brazil. Geoderma 232-234:183197. https://doi.org/10.1016/j.geoderma.2014.05.008
Horák-Terra, I., C.R. Costa, A.C. Silva, and D. Tassinari. Passado, presente e futuro. In: Silva, A.C., A.R. Rech, and D. Tassinari. (org.). Turfeiras da Serra do Espinhaço Meridional: serviços ecossistêmicos, interações bióticas e paleoambientes. Curitiba: Appris Editora. p. 107-146.
Janfada, A., J. Headley, K. Peru, and S. Barbour. 2006. A laboratory evaluation of the sorption of oil sands naphthenic acids on organic rich soils. J. Environ. Sci. Heal. - Part A Toxic/Hazardous Subst. Environ. Eng. 41:985-997. https://doi.org/10.1080/10934520600620105.
Joosten, H., and D. Clarke. 2002. Wise use of mires and peatlands: Background and principles including a framework for decision making. International Mire Conservation Group. International Peat Society, Jyväskylä, v. 304.
Kettridge, N., M.R. Turetsky, J.H. Sherwood, D.K. Thompson, C.A. Miller, B.W. Benscoter, M.D. Flannigan, B. M. Wotton, and J. M. Waddington. 2015. Moderate drop in water table increases peatland vulnerability to post-fire regime shift. Scientifc Reports 5:8063. https://doi. org/10.1038/srep08063.
Machado, D.O.B.F., K.F. Chueng, H.H.G. Coe, A.C. Silva, and C.R. Costa. 2021. Paleoenvironmental reconstruction of the headwaters of the preto river, Minas Gerais state, Brazil, through siliceous bioindicators. J. South Am. Earth Sci. 108:102249. https://doi.org/10.1016/j. jsames.2021.103349.
Mendonça Filho, C.V., F.N. Costa, E.L.M. Machado, A.P. Gonzaga, A.P. Lourenço, C. N.S. Oliveira, C.C. Moura, S.N. Fonseca, T.R. Costa, and A.R. Rech. 2022. Biodiversidade. In: Silva, A.C., A.R. Rech, and D. Tassinari. (org.). Turfeiras da Serra do Espinhaço Meridional: serviços ecossistêmicos, interações bióticas e paleoambientes. Curitiba: Appris Editora. p. 81-106.
Moore, P.D. 1997. Bog standards in Minnesota. Nature 386:655-657. https://doi.org/10.1038/386655a0.
Moura, C. C., T.R. Costa, P.A. Oliveira, D.C. Fonseca, and E.L.M. Machado. 2021. Como é a estrutura e a diversidade alpha e beta de matas de galeria inundáveis? Diversitas Journal 6:1920-1945.
Reflora. Lista de Espécies da Flora do Brasil. 2016. Jardim Botânico do Rio de Janeiro, Brasil. http://floradobrasil.jbrj.gov.br/.
Schellekens, J., I. Horák-Terra, P. Buurman, A.C. Silva, and P. VidalTorrado. 2014. Holocene vegetation and fire dynamics in central-eastern Brazil: Molecular records from the Pau de Fruta peatland. Org. Geochem. 77:32-42. https://doi.org/10.1016/j.orggeochem.2014.08.011.
Silva, A.C., M.S. Barbosa, U.M. Barral, B.P.C. Silva, J.C.S. Fernandes, A.J.S. Viana, C.V. Mendonça Filho, D.F.A. Bispo, C. Christófaro, C. Ragonezi, and L.R.G. Guilherme. 2019. Organic matter composition and paleoclimatic changes in tropical mountain peatlands currently under grasslands and forest clusters. Catena 180:69-82. https://doi. org/10.1016/j.catena.2019.04.017.
Silva, A.C., I. Horák, P. Vidal-Torrado, A.M. Cortizas, J.R. Racedo, and J.R.R. Campos. 2009. Turfeiras da Serra do Espinhaço Meridional - MG: II - influência da drenagem na composição elementar e substâncias húmicas. Rev. Bras. Ciência do Solo 33: 1399-1408. https://doi.org/10.1590/ s0100-06832009000500031.
Silva, A.C., I. Horàk-Terra, U.M. Barral, C.R. Costa, S.T. Gonçalves, T. Pinto, B.P.C. Silva, J.S.C. Fernandes, C.V. Mendonça Filho, and P. Vidal-Torrado. 2020. Altitude, vegetation, paleoclimate, and radiocarbon age of the basal layer of peatlands of the Serra do Espinhaço Meridional, Brazil. J. South Am. Earth Sci., 103:102728. https://doi.org/10.1016/j. jsames.2020.102728.
Silva, A.C., L.C.V.S.F. Pedreira, and P.A. Almeida Abreu. 2005. Serra do Espinhaço Meridional: paisagens e ambientes. Belo Horizonte, O Lutador.
Silva, A.C., V.E. Silva, B.P.C. Silva, P.B. Camargo, R.C. Pereira, U.M. Barral, A.M.M. Botelho, And P. Vidal-Torrado. 2013a. Composição lignocelulósica e isótopica da vegetação e da matéria orgânica do solo de uma turfeira tropical. I - Composição florística, fitomassa e acúmulo de carbono. Rev. Bras. Cienc. do Solo 37:121-133. https://doi.org/10.1590/ S0100-06832013000100014
Silva, M.L., A.C. Silva, B.P.C. Silva, U.M. Barral, P.G.S. Soares, and P. Vidal-Torrado. 2013b. Surface Mapping, organic matter and water stocks in peatlands of the Serra do Espinhaço Meridional Brazil Revista Brasileira de Ciência do Solo, 37:1149-1157. https://doi.org/10.1590/ S0100-06832013000500004
Silva, A.C., A.R. Rech, and D. Tassinari. 2022. Peatlands of Southern Espinhaço Mountain Range, Brazil: Ecosystem Services, Biotic Interactions and Paleoenvironments. Curitiba: Publisher and Bookstore Appris.
Silva, A.C., D. Tassinari, I. Horak-Terra, U.M. Barral, P. Vidal-Torrado, and C.R. Costa. 2023. Turfeiras do Brasil: Ocorrência, Serviços Ecossistêmicos, Biodiversidade, Impactos Antropogênicos e Paleoambientes. In: Junk, W., Cunha, C. N. (org.). Áreas Úmidas Brasileiras. Cuiabá: Instituto Nacional de Áreas Úmidas (no prelo).
Silva, M.L. 2012. Turfeiras da Serra do Espinhaço Meridional: mapeamento e estoque de matéria orgânica. (Dissertação de Mestrado). Universidade Federal dos Vales do Jequitinhonha e Mucuri, Diamantina.
Silva, M.L., and A.C. Silva. 2016. Gênese de turfeiras e mudanças ambientais quaternárias na Serra do Espinhaço Meridional–MG. Geociências 35: 393-404.
Silveira, F.A.O., D. Negreiros, N.P.U. Barbosa, E. Buisson, F.F. Carmo, D.W. Carstensen, A.A. Conceição, T.G. Cornelissen, L. Echternacht, G.W. Fernandes, Q.S. Garcia, T.J. Guerra, C.M. Jacobi, J.P. Lemos-Filho, S. Le Stradic, L.P.C. Morellato, F.S. Neves, R S. Oliveira, C.E. Schaefer, P.L. Viana, and H. Lambers. 2016. Ecology and evolution of plant diversity in the endangered campo rupestre: a neglected conservation priority. Plant Soil 403:129-152. https://doi.org/10.1007/s11104-015-2637-8.
UNEP; 2022. Global Peatlands Assessment – The State of the World’s Peatlands: Evidence for action toward the conservation, restoration, and sustainable management of peatlands. Main Report. Global Peatlands Initiative. United Nations Environment Programme, Nairobi. Available at: https://www.unep.org/resources/global-peatlands-assessment-2022
Yu, Z.C. 2012. Northern peatland carbon stocks and dynamics: A review. Biogeosciences 9:4071-4085. https://doi.org/10.5194/bg-9-4071-2012.
Cost-Effective Wetland Risk Assessment for Ramsar Site Management in Southern Mexico
Tatiana Lobato-de Magalhães1,2, Everardo Barba3, and Dulce Infante Mata4
ABSTRACT
Despite wetlands are increasingly threatened by human land-use transformation and degradation, there is a lack of rapid, low-cost, and effective methods to assess and manage risks. Here we demonstrate and propose the use of ad-hoc consultation and directional surveys to assess the wetland risk severity, probability, and consequences for three Southern Mexico Ramsar sites. We compiled wetland functionalities and risks from the scientific literature and Ramsar Information Sheet for each of the 41 Southern Mexico Ramsar sites, then we create a list of relevant wetland functions and risks. To reduce variables (functions and risks) as well as to choose the focal sites, we used principal components analysis (PCAs). To prioritize risks based on the experts’ opinions (96 regional wetland scientists) we applied Multi-Criteria Decision Making (MCDM) procedures. Our findings indicate climate change and drought as high risk for all studied wetlands. Agriculture and livestock were highly significant to the Pantanos de Centla coastal wetand area while María Eugenia highland wetlands have been more affected by urbanization and wastewater effluents. This methodology proved to be a cost-effective and timely approach to inform first-steps to decision-makers on risk identification, wetland management, and conservation planning at landscape-scale. This approach could mitigate the lack of funds designated to conservation and risk analysis for wetlands, which is a further issue in several developing countries, including Mexico.
Keywords Collaborative studies, ecosystem functions, Los Petenes, María Eugenia, multi-criteria decision making, Pantanos de Centla, risk prioritization
RESUMEN
A pesar de que los humedales están cada vez más amenazados por las acciones antrópicas, faltan métodos rápidos, de bajo costo y eficaces para evaluar y gestionar los riesgos a los ecosistemas de humedales. Este artículo demuestra y propone el uso de consultas ad hoc para evaluar la gravedad, probabilidad y consecuencias de riesgos para tres Sitios Ramsar del Sur de México. Se recopilaron las funcionalidades y riesgos de los humedales a partir de la literatura científica, incluyendo la ‘Información Ramsar’ para cada
uno de los 41 Sitios Ramsar del Sur de México, así elaborar una lista de funciones y riesgos relevantes. Se utilizó un análisis de componentes principales para reducir el número de variables, para elegir los sitios focales. Para priorizar los riesgos con base en las opiniones de los expertos (96 científicos regionales de humedales), se aplicaron procedimientos de toma de decisiones multicriterio. Los hallazgos de este estudio indican que el cambio climático y la sequía son de alto riesgo para todos los humedales estudiados. La agricultura y la ganadería fueron muy importantes para el humedal costero Pantanos de Centla, mientras que el humedal de tierras altas María Eugenia ha sido más afectado por la urbanización y los efluentes de aguas residuales. Esta metodología demostró ser un enfoque rentable y oportuno para informar a los tomadores de decisiones los primeros pasos sobre la identificación de riesgos, el manejo de humedales y la planificación de la conservación a escala de paisaje. Este enfoque podría mitigar la falta de fondos destinados a la conservación y análisis de riesgos de los humedales, que es un problema recurrente en varios países en desarrollo, incluido México.
Palabras clave: Estudios colaborativos, funciones ecosistémicas, Los Petenes, María Eugenia, toma de decisiones multicriterio, Pantanos de Centla, priorización de riesgos.
INTRODUCTION
Wetlands are dynamic ecosystems that act as natural connectors between upland and aquatic systems, maintain biodiversity at regional and landscape scales, and are increasingly threatened by human land-use transformation and degradation (Calhoun et al. 2017; Schofield et al. 2018). In the last four decades, the estimated wetland losses are around 60% in Latin America and worldwide (Landgrave and Moreno-Casasola 2012). Moreover, wetlands are extremely susceptible to climate change, and losses will increase with rising temperatures and the decline of precipitation (Darrah et al. 2019). Consequently, there is need for a timely and cost-effective method to assess risks for wetlands for a wide use, particularly for developing countries where there is a lack of wetland professionals plus funds designated for environmental risk studies and long-term monitoring are usually scarce.
Wetland risk assessment and ecological indicators have been subjects of interest for the last few decades, especially for internationally important Ramsar sites. The first Wetland Risk Assessment Framework was developed by the Ramsar Convention during the 7th Meeting of the Conference of the Contracting Parties to the Convention on Wetlands based on van Dam et al. (1999). Their frame-
1 Faculty of Natural Sciences, Universidad Autónoma de Querétaro, Querétaro, QRO, Mexico. Corresponding author email address: tatilobato@gmail.com; tatiana.lobato@uaq.mx Instituto de Ecología AC., Carretera antigua a Coatepec 351, El Haya 91070, Xalapa, Veracruz, México
2 Biological Sciences Department, North Dakota State University, Fargo, USA
3 Sustainability Science Department, El Colegio de La Frontera Sur (ECOSUR), Villahermosa, Tabasco, Mexico
4 Sustainability Science Department, El Colegio de La Frontera Sur (ECOSUR), Tapachula, Chiapas, Mexico
work encompasses six steps: identification of the problem, identification of the adverse effects, identification of the extend of the problem, identification of the risk, risk management and reduction, and monitoring. Overall, research on wetland management and conservation is lacking in Latin America countries (e.g., Salazar-Navarro et al. 2020), where wetland ecosystems are under increased threat, particularly for the inland wetlands (Lobato-de Magalhães et al. 2020).
While Mexico has the second-highest number of Ramsar sites worldwide (144 sites designated as Wetlands of International Importance, surface area of 8,721,911 ha), behind the United Kingdom (175 sites) (Mauerhofer et al. 2015), its wetlands are severely threatened (Landgrave and Moreno-Casasola 2012; Gortari-Ludlow et al. 2015). A third of Mexico’s Ramsar sites are in the Southern territory (41 sites) (Ramsar 2020). This region has some of the highest levels of aquatic plant species richness and endemism worldwide (Murphy et al. 2019). Additionally, Southern Mexico wetlands are valuable heritage places that provide several ecosystem services and substantially contribute to maintaining biodiversity at local and landscape levels (Smardon 2006; Gortari-Ludlow et al. 2015; Alcocer and Aguilar-Sierra 2019; Davidson et al. 2019). Surprisingly only 25 Southern Mexico Ramsar sites have management plans (13 implemented) while four sites have plans in preparation and the rest lack any planning. This suggests a low level of concern for wetland conservation in the country as well as emphasizes the need for a meta-analysis about risks and state of conservation of Mexican Ramsar sites (Lobatode Magalhães et al. 2020).
The 41 Southern Mexico Ramsar sites are highly diverse ecosystems that cover 34,232 km2 (2% of the total country surface) in seven Mexican states (lat. 14.68º and 22.47º North, long. -98.63º and -86.78º West), Campeche State (3 Ramsar sites), Chiapas (12), Guerrero (1), Oaxaca (4), Quintana Roo (12), Tabasco (1), and Yucatan (8). Eighty-five percent of those Ramsar sites occurs at low elevations (< 300 m a.s.l.), with the highest elevation Ramsar sites being highland wetlands located in Chiapas State (La Kisst and María Eugenia; 2,120 m a.s.l.). Most Southern Mexico Ramsar sites are classified as coastal and marine (64%), followed by inland wetlands (36%) ranging in size from 0.2 km2 to 7,050 km2 (Lobato-de Magalhães et al. 2020; Ramsar 2020).
Here, we propose the use of a cost-effective tool to wetland risk assessment using a collaborative approach (ad-hoc consulting) and multi criterion decision-making (MCDM). The principal objectives of this study are to determine the main ecosystem functions provided by wetlands, identify the major wetland risks, and analyze the effectiveness of the use of ad-hoc groups for cost-effective analysis for risks in three representative Ramsar sites: 1) Pantanos de Centla Biosphere Reserve (Tabasco State), 2) Los Petenes
Biosphere Reserve (Campeche State), and 3) María Eugenia Highland Wetlands (Chiapas State). Our findings can contribute to understanding risk analysis for wetlands in general and specifically for Ramsar sites. This methodology is a potentially useful tool for decision-making and conservation strategies for Southern Mexico wetlands at local and landscape scales.
MATERIALS AND METHODS
Study Area and Data Source
The study was focused on three Ramsar Sites: Pantanos de Centla Biosphere Reserve (Lat. 18°18’ N, Long. 92°27’ W; Tabasco State), Los Petenes Biosphere Reserve (Lat. 20°11′ N, Long. 90°32′ W; Campeche State), and María Eugenia
Figure 1. Views of habitats at the study’s Ramsar sites: a) Pantanos de Centla Biosphere Reserve, a mosaic of swamps, marshes, and mangroves which harbor several species (Tabasco State), b) Los Petenes Biosphere Reserve, a peculiar wetland landscape with natural fragment of forests (Campeche State), and c) María Eugenia Highland Wetlands, a highly threatened urban mountain wetland comprised of woody plants (Salix) and herbs like Typha and Schoenoplectus (Chiapas State). (Photos by Dulce I. Mata)
Figure 2. Location of Ramsar sites in Southern Mexico with study areas labelled. Source: shapefiles by INEGI (https://www.inegi.org.mx). (Map by T. Lobato-de Magalhães)
Highland Wetlands (Lat. 16°43’ N, 92°37’ W; Chiapas State) (Figures 1 and 2). We choose these wetlands as a model for the case study because they are highly significant natural places representing a vary characteristics (e.g., size, year of foundation, geographical localization, wetland type) and are the subject of other studies of our research group.
Pantanos de Centla Biosphere Reserve (3,027 km2) is one of the oldest Mexican Ramsar sites (designed in 1995) that covers 12% of the total Tabasco State surface. Among these temporary and permanent flooded wetlands, the Grijalva River and the Usumacinta River form an estuarine ecosystem that is considered one of the most important deltas in North and Mesoamerica because of the water flow and the importance for migratory birds and plant species of freshwater marsh and mangrove (López-Jiménez et al. 2020), as dominant species Typha dominguensis (Cattail), Cladium jamaicense (Sawgrass), Thalia geniculata (Alligator-flag Shrubland), Haematoxyllum campechianum (Bloodowood Three), Vallisneria americana (Wild celery), and Avicennia germinans (Black Mangrove), Laguncularia racemosa (White Mangrove), and Rhizophora mangle (Red Mangrove) (Barba-Macías et al. 2018).
Los Petenes Biosphere Reserve (2,829 km2) is represented by islands of forest associated with springs and
water holes, which constitute a critical habitat for wildlife in the Campeche State. It contains a great diversity of ecosystems, biological wealth, and a significant archaeological heritage for the Mayan culture. That naturally fragmented wetlands are endemic to the Yucatan Peninsula, encompassing mangroves with Avicennia germinans (Black Mangrove), Laguncularia racemosa (White Mangrove), and Rhizophora mangle (Red Mangrove), emergent herbaceous wetlands (salt marshes) including those dominated by Cladium jamaicense (Sawgrass), and flooded forests with species of the Sapotaceae family (Arellano-Rivas et al. 2018).
María Eugenia (1 km2) is the most recent Ramsar Site Mexican Ramsar site, designated in 2012. It contains urban highland wetlands that are extremely threatened and play a vital role in the provision of water to Southern Mexico cities such as San Cristóbal de las Casas, Chiapas. Locally known as “tulares”, the dominant aquatic plants of these highland wetlands are Typha (Cattail), Phragmites karka (Common Reed), Cyperus articulatus (Umbrella Sedge), Eleocharis montevidensis (Spike-rush), Schoenoplectus americanus (Bulrush), and tree species are Prunus serotine, Salix bonplandiana, and Sambucus canadensis (Lot 2004; Chediack et al. 2018). María Eugenia is an important resting place for migratory birds, and a refuge for local species,
such as the endemic fish Profundulus hildebrandi (Popoyote) (Lobato-de Magalhães et al. 2020; Ramsar 2020).
To assess risks based on the experts’ opinions we applied Multi-Criteria Decision Making (MCDM) following Malekmohammadi and Blouchi (2014) and took three steps: risk identification, risk characterization, and risk prioritization. We created a survey focused on the three wetlands functions and risks, which was shared with more than 100 wetland scientists and practitioners affiliated with Southern Mexico scientific organizations, including the National Commission of Protected Areas, National Commission of Water, and several universities and research institutes (source data available on request from the lead author). Surveys comprised three parts: general questions (e.g., education level, years of experience with wetland science, age, gender), functions, and risks.
Risk Identification
We identified the major wetland ecosystem functions (ecological endpoints) and ecological risks associated with these endpoints following the IUCN booklet (Dugan 1990) and reviewing the Ramsar Information for each of the 41 Ramsar sites (Ramsar 2020). Ecosystem functions were described in five major aspects: A - hydrologic flux and storage, B - biological productivity, C - biogeochemical cycling and storage, D - community and wildlife habitat, and E - other services, resulting in 17 wetland functions (Table 1). Hydrologic flux and storage address groundwater recharge/
discharge, flood control and protection, and water supply. Biological productivity relates to carbon storage, food storage, non-food and wildlife resources, forage resources, agricultural and forest resources, historical or cultural resources. Biogeochemical cycling and storage involve control of erosion, sedimentation, and toxic materials, protection from storm, wastewater treatment, water quality. Community and wildlife habitat encompass biodiversity, preservation of flora and fauna, protection od threatened, rare, and endangered species. Wetland risks were described in six major aspects: A - change of natural habitat, B - use of natural resources, C - pollution, D - climate change and drought, E - change on the hydrology, and F - urbanization and wetland use, producing 40 wetland risks (Table 2).
To reduce correlated variables for both functions and risks we performed correlations and principal component analysis (PCAs) in R v. 3.6.1 (Friendly 2002; R Core Team 2020), highlighting seven ecosystem functions: 1) regulation services and hazard reduction, 2) food and non-food products, 3) erosion and contamination control, 4) biodiversity and genetic resources, 5) scientific and educational, 6) spiritual and inspirational, and 7) freshwater source, and seven risks: 1) agriculture, livestock, and aquaculture, 2) invasive and other problematic species, 3) hunting, fishing, gathering terrestrial plants, wood harvesting, 4) urban, agricultural, and industrial effluents/waste, 5) climate change and drought, 6) urbanization, and 7) recreational and tourism) that could represent all data (Table 1 and Table 2).
Major ecosystem function group Ecosystem function by Ramsar Terminology used on the surveys
A. Hydrologic flux and storage
• Regulation services
• Maintenance of hydrological regimes
• Hazard reduction
• Climate regulation
B. Biological productivity
C. Biogeochemical cycling and storage
D. Community and wildlife habitat (ecological)
E. Other services
• Food for humans
• Wetland non-food products
• Erosion protection
• Pollution control and detoxification
• Nutrient cycling
• Soil formation
• Biodiversity
• Genetic material
• Cultural services
• Recreation and tourism
• Scientific and educational
• Spiritual and inspirational
• Freshwater source
1. Regulation services and hazard reduction
2. Food and non-food products
3. Erosion and contamination control
4. Biodiversity and genetic resources
5. Scientific and educational
6. Spiritual and inspirational
7. Freshwater source
Table 1. Principal ecosystem functions of Southern Mexico Ramsar sites.
Table 2. Characteristics of the risk factors in Southern Mexico Ramsar wetland.
Major risk group Risks by Ramsar
A. Change of natural habitat
• Natural system modifications
• Vegetation clearance/ land conversion
• Wood and pulp plantations
• Agriculture
• Livestock farming and ranching
• Annual and perennial non-timber crops
• Marine and freshwater aquaculture
• Habitat shifting and alteration
• Problematic native species
• Invasive non-native / alien species
• Invasive and other problematic species and genes
Terminology used on the surveys
1. Agriculture, livestock, and aquaculture
2. Invasive and other problematic species
B. Use of natural resources
• Biological resource use
• Fishing and harvesting aquatic resources
• Logging and wood harvesting
• Hunting and collecting terrestrial animals
• Gathering terrestrial plants
C. Pollution
D. Climate change and drought
E. Change on the hydrology
F. Urbanization and wetland use
• Air-borne pollutants
• Agricultural and forestry effluents
• Industrial and military effluents
• Oil and gas drilling
• Salinization
• Household sewage
• Urban wastewater
• Pollution
• Garbage and solid waste
• Climate change and severe weather
• Excess heat
• Storms and flooding
• Canalization and river regulation
• Water regulation
• Water releases
• Drainage and dredging
• Human settlements (non-agricultural)
• Transportation and service corridors (shipping lanes)
• Energy production and mining
• Dams and water management/use
• Unspecified development
• Water abstraction
• Human intrusions and disturbance
• Recreational and tourism activities (Sound) (Light)
4. Urban, agricultural and industrial effluents / waste
5. Climate change and drought
6. Urbanization
7. Recreation and tourism
Risk Characterization
In this step we estimated the severity of risks, the range of consequences and the probability of the risks through an ad-hoc consultation with a group of experts. For each identified risk, we used a semi-quantitative method to describe the relative risk scale as below.
• Severity: (1) Very low (<4): biogeochemical change, (2) Low (6–4): physical and chemical changes, (3) Moderate (9–7): disruption of biology, (4) High (12–10): hydrological changes, and (5) Very high (15–13): destruction of the integrity or existence.
• Consequence: (1) Very low: < one quarter, (2) Low: one quarter, (3) Moderate: half, (4) High: three quarter, and (5) Very high: all the wetland and the surrounding ecosystems.
• Probability: (1) Very low: impossible or remote under normal conditions, (2) Low: unlikely under normal conditions, (3) Moderate: possible (risks may occur from existing risks), (4) High: common (risks occur usually), and (5) Very high: certain (risks occur continuously).
We then calculated the risk level using the equation proposed by Malekmohammadi and Blouchi (2014) to expert’s opinion:
Risk = severity × range of consequence × probability
Risk Prioritization
We used multi-criteria decision making (MCDM) to prioritize risks following Zhao et al. (2006) and Zhang et al. (2009). We used pairwise comparisons based on judgments of experts to weight the indexes and options of the risks and derive priority scales (Saaty 2008). Pairwise comparison matrices have been used to make proposals for corrective action to reduce risks and is recommended to be applied in Ecological Risk Assessment (ERA) for wetlands (Malekmohammadi and Blouchi 2014). This method minimizes error due to negligence and ensures accuracy in the sense that it has a built-in method to check the inconsistency of judgments (Ramanathan 2001; Malekmohammadi and Blouchi 2014). After this step managers and decision–makers should have plenty of information to identify risks (e.g., zones with different levels of risk) to guide management strategies and planning.
RESULTS
The PCAs and correlations allowed us to identify seven functions and seven risks (Figure 3; Tables 1 and 2). From the 100 wetland scientists and practitioners invited to participate on this survey, we obtained answers of 96 participants. The experts who participated in the survey were mostly male researchers (73%), with more than 5 years of experience with wetland science (62%), a level of education of master or doctorate (75%), > 36 years old (93%),
Figure 3. Principal Component Analysis for (a) ecosystem functions clusters i: regulation services and hazard reduction, ii: food and non-food products, iii: erosion and contamination control, iv: biodiversity and genetic recourses, v: scientific and educational, vi: spiritual and inspirational, vii freshwater source, (b) wetland risks clusters i: agricultural, livestock and aquaculture, ii: invasive and other problematic species, iii: hunting, fishing gathering, iv: urban agricultural and industrial effluents, v: climate change and drought, vi: urbanization, vii: recreation and tourism, of Southern Mexico Ramsar sites.
while the minority of the experts lived close to the studied wetland (30%) or was a member of an indigenous ethnic (8%) (Figure 4).
Wetland Functions
Regarding wetland functions, biodiversity and genetic resources was recognized as one of the most important functions for the three studied Ramsar sites (Figure 5a). The second most important function was regulation services and hazard reduction for Pantanos de Centla (29% experts’ opinion), and food and non-food products for Los Petenes (26% experts’ opinion). In María Eugenia freshwater source (43% experts’ opinion) was the principal function followed by biodiversity and genetic resources (36% experts’ opinion). Overall, scientific, educational, spiritual and inspirational use was of limited importance for the studied sites.
Wetland Risks
Multi criterion decision-making results showed agriculture, livestock, and aquaculture as the major risk for Pantanos de Centla, climate change and drought for Los Petenes, while urbanization was the most important risk to María Eugenia (Figure 5b). Through the prioritization of risks results we observed three different scenarios (Table 3). Overall, Los Petenes showed more conserved wetland with low-risk scenario than the other sites. Only one risk was classified as unacceptable — climate change and drought, as the other six evaluated risks were acceptable or acceptable with a conditional control. Pantanos de Centla had a moderate risk scenario, with two risks classified as unacceptableagriculture, livestock and aquaculture and climate change and drought. María Eugenia showed a higher risk than the other sites, with three unaccepted risks - urbanization, climate change and drought, and agriculture, livestock, and
Figure 4. Results of the survey from 100 wetland scientists and practitioners affiliated with Southern Mexico scientific organizations. Information about the participants: (a) education level, (b) years of experience with wetland science, (c) age range, (d) gender, (e) if lives close to the wetland, and (f) if is part of any indigenous ethnic.
aquaculture. Of the seven risks analyzed in this study three of them were classified as acceptable or acceptable with a conditional for all sites: invasive and other problematic species, hunting, fishing, gathering terrestrial plants, and recreation and tourism.
The survey also asked for experts to identify a favorite wetland animal. Among the responses were the fish Profundulus hildebrandi (Popoyote), mud turtles Kinosternon spp. (Mud Turtle), Dermatemys mawii (Central America River Turtle), Trichechus manatus (Manatee), Lontra longicaudis (Neotropical Otter), dragonflies, and aquatic birds such as Turdus rufitorques, and Tyto alba. Although not asked, a few experts mentioned that they have also a favorite wetland plant, as seagrasses.
DISCUSSION
Climate change, ecosystem services, and protected areas are research priorities of many collaborative studies (Dey et al. 2020). Our study demonstrated an effective low-cost and timely alternative to assess wetland risks on a vast territory as Southern Mexico. Around 62% of the responses were made by a scientific community with huge experience in wetland science, while few participants were early-career
wetland scientists or practitioners who work for governmental institutions.
The coastal wetlands, Pantanos de Centla and Los Petenes, are biodiverse ecosystems extremely important to mitigate hazards as the impacts of cyclones in the Caribbean coast (López-Jiménez et al. 2020), while the inland wetland of María Eugenia was most important for water supply (Chediack et al. 2018). The greatest risks for the latter wetland are urban development, agricultural activities, and invasive or problematic species, besides the climate change. While Gortari et al. (2015) reported the major risks for several Mexican wetlands (study focused on 78 inland wetlands) were agriculture and aquaculture, biological resource use, and pollution, our findings found that agricultural activities, climate change, and urbanization were the principal risks for the studied wetlands
Pantanos de Centla Biosphere Reserve
It is important to note that in the last two decades, lowland floodable forests have been drastically reduced by agricultural activities. The Pantanos de Centla has experienced a notable land-use change – the conversion of natural floodplain vegetation to livestock and agricultural areas (De
Figure 5. Results for functions and risks for three Ramsar sites in Southern Mexico: (a) major functions provided by wetlands through expert’s opinion and (b) risk level for seven groups of risks. PC = Pantanos de Centla Biosphere Reserve, LP = Los Petenes Biosphere Reserve, and ME = María Eugenia Highland Wetlands.
Table 3. Results of wetland risks using Multi-Criteria Decision Making (MCDM) for three Southern Mexico Ramsar sites (based on experts’ opinions of 96 regional wetland scientists).
Ramsar
Pantanos de Centla Biosphere Reserve
la Rosa-Velázquez et al. 2017). Some of the participant experts mentioned that a huge threat for this area is the illegal wood logging (timber harvest) and the use of mangrove fires to illegally hunt native threatened species for human consume (e.g., Dermatemys mawii, Central America River Turtle). Although Pantanos de Centla had more than 76 plant species and other animal species used by people (SEMARNAT 2020), our study highlights biological resource use as moderate risk. Interestingly, local groups and cooperatives have developed sustainable use management plans for species such as the Crocodylus moreletti (Mexican Crocodile). Some experts mentioned that Pantanos de Centla is highly susceptible to impacts from potential dams in the Usumacinta watershed. Additionally, this area’s wetlands have different characteristics, each one with different susceptibility, pressure, and danger, with some issues limited to a geographical area. Overall, it is difficult to generalize the threats to the Pantanos de Centla, making it is necessary to regionalize the different environments and their relationship with various threats. Nonetheless, urban and industrial sources of pollution (particularly oil), agriculture and livestock, and drastic changes in hydrology, represent constant and growing threats to the health and conservation of this wetland.
Los Petenes Biosphere Reserve
The Los Petenes Biosphere Reserve remains a very well conserved area, yet some experts suggested that it is still a good time to take preventive and restoration actions in the face of the various threats. Although it is a protected area, management monitoring and planning are lacking, particularly for fishing and use of natural resources. They mentioned that there are many irregularities and ecological disorder in Los Petenes and that local people who depend on the wetland must be included on the management plan because they are key stakeholders who are committed to protecting the wetlands. Environmental education and the sustainable use of biological resources should be encouraged and, where appropriate, its regulations supervised, so that the inhabitants and the floating population make the reserve their own and preserve it in the long term.
María Eugenia Highland Wetlands
The situation for María Eugenia is critical because it suffers threats from urbanization including cutting down the little remaining vegetation and the invasion of exotic or domestic fauna. Although native fauna is still observed, native populations are decreasing, particularly for aquatic birds. Rapid intervention is required to stop faunal invasions and filling of wetlands. The Mexican state must act quickly and urgently to protect the main source of water for the city’s inhabitants and the environmental services provided by wetlands against floods and disasters in this region. Urban development and filling of wetlands pose significant threats to the future of María Eugenia wetlands.
CONCLUSIONS
Our approach is of high value not only for its contribution to understanding the wetlands in the study areas but also because it can quickly capture information from the scientific community on wetland functions and risks. The methodology could be applied by the National Wetland Committee for all Mexican Ramsar sites. Furthermore, the tool could be useful to build a risk meta-analysis and support decisions-makers doing integrated wetland management plans from local to regional scales across Mexico as well as in other developing countries.
ACKNOWLEDGEMENTS
We acknowledge the collaboration of the experts who contributed for the survey. We highlight and thanks the participation of CONAGUA, CONANP, UMAR, UJAT, UNACAR, UADY, UNAM, UQROO, and ECOSUR representatives. The first author holt a postdoctoral fellowship from ECOSUR at CONACyT (National Council of Science and Technology) in Mexico (Dic 2019- Nov 2020). National Commission of Water (CONAGUA) project N. A3-S-65801.
REFERENCES
Alcocer, J. and V. Aguilar-Sierra. 2019. Biodiversity in inland waters. In: Ibáñez, A.L. (ed.) Mexican Aquatic Environments. Springer Nature, Switzerland, pp 43-75. https://doi.org/10.1007/978-3-030-11126-7
Arellano-Rivas, A., J.A. De-Nova and M.A. Munguía-Rosas. 2018. Patch isolation and shape predict plant functional diversity in a naturally fragmented forest. Journal of Plant Ecology 11(1): 136-146.
Barba-Macías, E., M.A. Mesa-Jurado, A. Espinoza-Tenorio and A. Ortega-Argueta. 2018. Biodiversity Conservation in the Pantanos de Centla Biosphere Reserve: Ecological and Socioeconomic Threats. In: Ortega-Rubio, A. (eds) Mexican Natural Resources Management and Biodiversity Conservation. Springer, Cham. https://doi.org/10.1007/9783-319-90584-6_20
Calhoun, A.J., D.M. Mushet, K.P. Bell, D. Boix, J.A. Fitzsimons and F. Isselin-Nondedeu. 2017. Temporary wetlands: challenges and solutions to conserving a ‘disappearing’ ecosystem. Biological Conservation 211: 3-11. https://doi.org/10.1016/j.biocon.2016.11.024
Chediack, S.E., N. Ramírez-Marcial, M. Martínez-Icó and H.E. Castañeda-Ocaña. 2018. Macrófitos de los humedales de montaña de San Cristóbal de Las Casas, Chiapas, México. Revista Mexicana de Biodiversidad 89(3): 757-768. https://doi.org/10.22201/ib.20078706e.2018.3.2420
Darrah, S.E., Y. Shennan-Farpón, J. Loh, N.C. Davidson, C.M. Finlayson, R.C. Gardner and M.J. Walpole. 2019. Improvements to the Wetland Extent Trends (WET) index as a tool for monitoring natural and man-made wetlands. Ecological Indicators 99: 294-298. https://doi. org/10.1016/j.ecolind.2018.12.032
Davidson, N.C., A.A. Van Dam, C.M. Finlayson, and R.J. McInnes. 2019. Worth of wetlands: revised global monetary values of coastal and inland wetland ecosystem services. Marine and Freshwater Research https://doi.org/10.1071/MF18391
De la Rosa-Velázquez, M.I., A. Espinoza-Tenorio, M.Á. Díaz-Perera, A. Ortega-Argueta, R. Ramos-Reyes and I. Espejel. 2017. Development stressors are stronger than protected area management: a case of the Pantanos de Centla Biosphere Reserve, Mexico. Land Use Policy 67: 340-351. https://doi.org/10.1016/j.landusepol.2017.06.009
Dey, C.J., A.I. Rego, J.D. Midwood and M.A. Koops. 2020. A review and meta-analysis of collaborative research prioritization studies in ecology, biodiversity conservation and environmental science. Proceedings of the Royal Society B 287(1923): 20200012. https://doi.org/10.1098/ rspb.2020.0012
Dugan, P.J. 1990. Wetland Conservation: a review of current issues and required action. IUCN, Gland, Switzerland. https://portals.iucn.org/ library/node/6048
Friendly, M. 2002 Corrgrams: Exploratory displays for correlation matrices. American Statistical 56: 316-324. https://doi. org/10.1198/000313002533
Gortari-Ludlow, N., G. Espinosa-Reyes, J. Flores-Rivas, J. Salgado-Ortiz and L. Chapa-Vargas. 2015. Threats, conservation actions, and research within 78 Mexican non-coastal protected wetlands. Journal of Nature Conservation 23: 73-79.
Landgrave, R. and P. Moreno-Casasola. 2012. Evaluación cuantitativa de la pérdida de humedales en México. Investigación Ambiental 4: 19-35.
Lobato-de Magalhães, T., L. Guadalupe-Cruz and E. Barba. 2020. Wetland Conservation Concerns in Southern Mexico. Wetland Science and Practice 37(4): 294-301.
López-Jiménez, L.N., D.A. Jiménez-López, O. Castillo-Acosta, J.A. Gallardo-Cruz and A.I. Fernández-Montes de Oca. 2020. Plantas vasculares de la Reserva de la Biosfera Pantanos de Centla, México. Botanical Sciences 98(1): 159-204. https://doi.org/10.17129/botsci.2279
Lot, A. 2004. Flora and vegetation of freshwater wetlands in the coastal zone of the Gulf of Mexico. In: Caso, M., I. Pisanty and E. Ezcurra. (Eds) (Spanish version) Environmental Analysis of the Gulf of Mexico, INECOL, INE, Harte Research Institute, Corpus Christi. https://www harteresearchinstitute.org/environmental-analysis-gulf-mexico Malekmohammadi, B. and L.R. Blouchi. 2014. Ecological risk assessment of wetland ecosystems using multi criteria decision making and geographic information system. Ecological Indicators 41: 133-144. https://doi.org/10.1016/j.ecolind.2014.01.038
Mauerhofer, V., R.E. Kim and C. Stevens. 2015. When implementation works: A comparison of Ramsar Convention implementation in different continents. Environmental Science Policy 51: 95-105. https://doi. org/10.1016/j.envsci.2015.03.016
Murphy, K., A. Efremov, T.A. Davidson, E. Molina-Navarro, K. Fidanza, T.C. Crivelari-Betiol, P. Chambers, J. Tapia-Grimaldo, S. Varandas-Martins, I. Springuel, M. Kennedy, R.P. Mormul, E. Dibble, D. Hofstra, B.A. Lukács, D. Gebler, L. Baastrup-Spohr and J. UrrutiaEstrada. 2019. World distribution, diversity and endemism of aquatic macrophytes. Aquatic Botany 158: 103127. https://doi.org/10.1016/j. aquabot.2019.06.006
R Core Team. 2020. R: a Language and Environment for Statistical Computing R Foundation for Statistical Computing, Vienna, Austria. R-project.org/
Ramanathan, R. 2001. A note on the use of the analytic hierarchy process for environmental impact assessment. Journal of Environmental Management 63, 27-35. https://doi.org/10.1006/jema.2001.0455
Ramsar. 2020. Ramsar sites information service. Available via https:// rsis.ramsar.org/ris-search/332?pagetab=0 Accessed 2 Mar 2020
Saaty, T.L. 2008. Decision making with the analytic hierarchy process. International Journal of Services Science 1(1): 83–98. https://doi. org/10.1504/IJSSCI.2008.017590
Salazar-Navarro, K., A.D. Olortigue-Tello, H. Aponte and T. Lobato-de Magalhães. 2020. Wetland Science in Latin America and the Caribbean Region: Insights into the Andean States. Wetland Science and Practice 37(4): 232-240.
SEMARNAT. 2020. Política Nacional de Humedales. Available via https://agua.org.mx/wp-content/uploads/2017/07/politica-nacional-dehumedales.pdf Accessed 17 Mar 2020.
Smardon, R.C. 2006. Heritage values and functions of wetlands in Southern Mexico. Landscape and Urban Planning 74(3-4): 296-312. https://doi.org/10.1016/j.landurbplan.2004.09.009
van Dam, R.A., C.M. Finlayson and C.L. Humphrey. 1999. Wetland risk assessment. In: Finlayson, C.M., A.G. Spiers (eds.) Techniques for enhanced wetland inventory and monitoring. Supervising Scientist Report 147, 83-118, Canberra.
Zhang, K., C. Kluck and G. Achari. 2009. Comparative approach for ranking contaminated sites based on the risk assessment paradigm using fuzzy PROMETHEE. Environmental Management 44 (5): 952-967.
Zhao, M.Y., C.T. Cheng, K.W. Chau and G. Li. 2006. Multiple criteria data envelopment analysis for full ranking units associated to environment impact assessment. International Journal of Environment and Pollution 28 (3/4), 448-464.
Using Pistia stratiotes to Phytoremediate Oil and Grease from Greywater in Georgetown, Guyana
Sharida Reuben1, Judith Rosales2, and Seon Hamer3
ABSTRACT
This study sought to investigate whether turbidity can be used as a surrogate variable for oil and grease pollution and to analyze the growth dynamic of Pistia stratiotes L. (water lettuce) to phytoremediate oil and grease from water. A quantitative analysis was done using a Completely Randomized Design (CRD) using seven treatments of greywaters with constant concentrations of nutrients (NPK) and emulsifier, and variable concentrations of waste lubricant oil which included a control over a 20-day period. The growth of the Pistia plants was monitored using the Leaf Area. The data were then analyzed using a one-way ANOVA. The results showed a significant correlation between turbidity and oil and grease. The greywater that was treated with Pistia stratiotes had as high as 85% reduction in oil and grease over a period of 30 days and as low as 65% in 20 days. Consequently, Pistia stratiotes was found to be highly efficient in phytoremediation of oil and grease pollution. The results also suggest that turbidity can be used as a surrogate variable for oil and grease pollution.
Keywords: Phytoremediation, pollution, wastewater, oil and grease, turbidity, surrogate variable
RESUMEN
Este estudio buscó investigar si la turbidez puede usarse como una variable sustituta para la contaminación por petróleo y grasa y analizar la dinámica de crecimiento de Pistia stratiotes L. (lechuga de agua) para fitoremediar el aceite y la grasa del agua. Se realizó un análisis cuantitativo mediante un Diseño Completamente Aleatorizado (CRD) utilizando siete tratamientos de aguas grises con concentraciones constantes de nutrientes (NPK) y emulsionante, y concentraciones variables de aceite lubricante residual que incluyó un control durante un período de 20 días. El crecimiento de las plantas de Pistia se controló utilizando el área foliar. Luego, los datos se analizaron mediante un ANOVA unidireccional. Los resultados mostraron una correlación significativa entre la turbidez y el aceite y la grasa. Las aguas grises tratadas con Pistia stratiotes tuvieron una reducción de hasta un 85 % de aceite y grasa en un período de 30 días y tan solo un 65 % en 20 días. En consecuencia, se descubrió que Pistia stratiotes es muy eficaz en la fitoremediación de la contaminación por aceites y grasas. Los resultados también sugieren que la turbidez puede us-
1 Upper Mazaruni District Council, Kamarang River, Region 7, Guyana
arse como una variable sustituta para la contaminación por petróleo y grasa.
Different types of oils such as derivatives of petroleum, vegetables, or animal fats all share some common physical properties producing environmental effects that can be devastating in water bodies. Among those effects are oxygen depletion, and negative impacts on the health of fish and aquatic birds. Oil and grease are present in wastewater usually in concentrations between 10 to 100 mg/L. It is considered an organic contaminant with a recommended limit of 10.0 mg/L (Mustapha 2018).
In Georgetown, Guyana, the city is crossed by canals where greywater is discharged from residential and commercial areas. These canals can be considered as constructed wetlands as they are inhabited by many aquatic species, native and exotic, as well as fishes, amphibians, reptiles, invertebrates, and aquatic birds (Mitsch and Gosselink 2015) and also receive water from local river basins and reservoirs. The greywaters may contain oils and detergents creating emulsifier solutions (e.g., waste lubricant oil also comes from mechanic shops).
Guyana ( “the land of many waters”) has a new oilbased economy producing increasing environmental pollution, especially the disposal of waste lubricant oils in the different processes that involve the use of engines in terrestrial, marine, and freshwater ecosystems. The increase in vehicles and machinery, as well as ocean-going vessels, means that there will be an increase in the volume of waste lubricant oil in canals. Waterlilies (Nymphaea spp.), Lotus (Nelumbo nucifera), and Amazon Water Lily (Victoria amazonica) are found in deep canals with good flow dynamics, while several aquatic weeds including Water Hyacinth (Eichhornia crassipes), Water Lettuce (Pistia stratiotes), and Duckweed (Lemna minor) can reach high densities when there is a clear indication of water pollution (personal observations).
Several studies at the University of Guyana have demonstrated the potential of aquatic species such as Eichhornia crassipes, Nelumbo nucifera, and Pistia stratiotes in removing nitrogen, phosphorous, and heavy metals such as copper and zinc in controlled environments or from wastewaters (Persaud 2013; Persaud 2011; Harnchandra 2008). Contamination resulting from various petroleum oil derivatives are often ignored by such studies. Lubricant oil changes at gas stations, auto repair shops, and mechanic shops are carelessly disposed of and washed into drains
2 School of Graduate Studies and Research, University of Guyana, Turkeyen Campus, Greater Georgetown, Guyana. Correspondence author contact: judith.rosales@uog.edu.gy
3 Department of Environmental Studies, Faculty of Earth & Environmental Sciences, University of Guyana, Turkeyen Campus, Greater Georgetown, Guyana.
(Franklin et al. 2012). The greywaters may contain waste lubricant oils and detergents acting as emulsifier agents or surfactants producing an oil and water mix that can negatively impact water quality. Wetland plants may provide a cost-effective alternative biological clean-up mechanism compared to the other methods (Elredaisy 2010).
A number of studies point to the value of phytoremediation for water treatment in Guyana canals and elsewhere. Eichornia crassipes and Spirodela polyrhiza (Greater Duckweed) could absorb several pollutants (e.g., lead, chloride, sulphate, phosphate, potassium) from the canals in only 15 days according to Nazir and others (2020). Byrne and others (2015) demonstrated the potential for phytoremediation of nutrients and coliforms from wastewaters in the canals using the aquatic plants Typha dominguensis (Cattail) and Spirodela polyrhiza. A significant decrease in turbidity was found with time in all the experimental chambers with both species. Aquatic plant phytoremediation has the potential to decrease oil and grease pollution in water bodies. Previous experimental data from Tiwari and others (2017) demonstrated that phytoremediation of waste lubricant oils by Pistia stratiotes coupled with harvesting, composting, and biogas production can be part of the solution. Dominguez-Rosado and Pichtel (2004) examined and evaluated the degradation of used motor oil in the soil rhizosphere of selected plant species: Soybean (Glycine max)/ Green Bean (Phaseolus vulgaris), Sunflower (Helianthus annus)/Indian Mustard (Brassica juncea), mixed grasses/ maize (Zea mays), and mixed clover (Red Clover, Trifolium pratense/Ladino Clover, Trifolium repens). A pilot experiment with Pistia stratiotes was evaluated in its potential to phytoremediate wastewaters and was effective in reducing turbidity (Schwantes et al. 2019). However, an extensive review by Ekperusi (2018) found that although P. stratiotes has been successful in the reduction of organic pollutants and heavy metals in greywaters and shows high potential in the phytoremediation of agrochemicals, pharmaceutic and radioactive wastes, nanomaterial and petroleum hydrocarbons, it needs more evaluation in its potential for remediating waste oils. Consequently, research on the remediation of petroleum hydrocarbons by P. stratiotes is a promising area of phytoremediation, especially since ecologically based or nature-based solutions are a hot topic.
Our study aimed to provide new data for the phytoremediation of waste lubricant oils in lab-controlled environments resembling the greywaters in canals of Georgetown, capital city of Guyana. This city is drained by a series of canals originally used for the drainage of the swamps that allowed the use of such lands for agriculture and urbanization. Domestic wastewater generated in households, office buildings, and commercial areas enters the canals supposedly without fecal contamination. Sources include sinks, showers, baths, cloth washers, and dishwashers. However, greywater may still have some microorganisms content
including microalgae that can also work on the phytoremediation process (Hernandez-Perez et al. 2018). The objective of our study was to evaluate the use of turbidity as a surrogate variable for the reduction of oil and grease water pollution and analyze the dynamics of Pistia stratiotes growth in the phytoremediation of variable concentrations of oils and grease.
STUDY AREA
Georgetown, Guyana (known as “the land of many waters”) is located in northeastern South America (6’81 N58’12 W). Since the transformation of the original swamp coastal ecosystems to agricultural and urban lands during the 1800s, this capital city has been crossed by canals that take stormwater from the roads and send it to the sea. Canals in front of the residential areas (Figure 1) are common. When the tide rises, the sluices are closed and when the tide is low, the sluices are opened, allowing the water to drain out. The city experiences tropical macrothermic, humid weather with an average precipitation of 2,290 mm concentrated in two rainy seasons between mid-April to mid-August and from December to January.
Figure 1. Picture of canal with Pistia stratiotes (Water Lettuce) in Plaisance, East Coast Demerara, Guyana, used for collection of the study plants.
METHODS AND MATERIALS
Research Design
A quantitative analysis with an experimental design was carried out in the greenhouse of the Faculty of Agriculture and Forestry (FAF) at the University of Guyana (Turkeyen, Greater Georgetown). The experiment followed a Completely Randomized Design (CRD) with four single blanks (To, ToE, ToN, TONE) and three replicates assigned for each of three treatments with different concentrations of waste lubricant oil. The blanks consisted of zero to common concentrations of emulsifier E and a nutrient solution N. The greenhouse received a similar percentage of the total daily irradiance every day so that all the experimental and control treatments can be controlled with minimum external disturbance and under the same conditions thereby allowing homogeneity (Figures 2 and 3). A portion of used waste lubricant oil was collected directly from one car engine provided by a car shop in Georgetown on the October 18, 2019. Twenty-five plastic containers with a capacity of 20 liters were used for the experiment.
MATERIALS AND EQUIPMENT
Deionized water (DIW) without microorganisms was used in the experiment. A small water pump (marine type), valve, small hose/tube, and nutrients 15:30:15 NPK hydro-
ponic nutrient solution (N), were all bought on October 25, 2019. Sodium lauryl sulfate emulsifier (E) was purchased from Sterling Products on November 28, 2019. Plant rosettes of Pistia stratiotes were collected on December 4, 2019 from a canal in a commercial area on Prince William Street, Plaisance, East Coast Demerara (Figure 3). They were rinsed with tap water then with DIW and placed in a big container where they were left in DIW water for seven days so that they could reach stabilization in the new environmental conditions. The presence of dark leaves was used as a criterion to eliminate stressed rosettes.
Experimental Treatments
The number of rosettes and the amount of waste lubricant oil varied in the experiment. The following were the no oil blanks and oil treatments applied: Blanks = control (absolute, To, only NPK ToN, only Emulsifier ToE, only nutrient and emulsifier ToNE); T2 and T3 for 5ml of waste lubricant oil; T4 and T5 for 10ml of waste lubricant oil; T6 and T7 for 20ml of waste lubricant oil.
T2: Four (4) water lettuce rosettes with 5ml of waste lubricant oil plus 15:30:15 0.6 mg/l hydroponic nutrient solution + 1mg/l SLS emulsifier.
T3: 5ml waste lubricant oil + 15:30:15 (N/P/K) 0.6 mg/l hydroponic nutrient solution + 1mg/l SLS emulsifier but no water lettuce rosettes.
T4: Four (4) water lettuce rosettes with 10ml of waste lubricant oil plus 15:30:15 (N/P/K) 0.6 mg/l hydroponic nutrient solution and 1mg/l SLS emulsifier.
T5: 10ml waste lubricant oil + 15:30:15 0.6 mg/l hydroponic nutrient solution + 1mg/l SLS emulsifier but no water lettuce rosettes.
T6: Four (4) water lettuce rosettes with 20ml of waste lubricant oil + 15:30:15 0.6 mg/l hydroponic nutrient solution and 1mg/l SLS emulsifier.
T7: 20ml waste lubricant oil + 15:30:15 0.6 mg/l hydroponic nutrient solution + 1mg/l SLS emulsifier but no water lettuce rosettes.
Twenty-four (24) water lettuce rosettes of similar size and number of leaves (3) were selected from the container and weighed in the lab to obtain the initial fresh biomass then four (4) water lettuce rosettes were placed in each container replicate of the respective treatments that included Pistia stratiotes water lettuce rosettes (T2 5 ml, T4 10 ml, and T6 20 ml). The waterline was marked on the outside of the container and was checked every day. If the
water fell below the waterline more DIW was added/poured thereby keeping the water level constant. Also, the containers were aerated every day (except Saturday and Sunday) for 10 minutes each using the water pump. To evaluate leaf area, pictures of the plants growing in the containers with treatments were taken every Monday, Wednesday, and Friday for 4 weeks. Figure 4 show pictures of experimental containers with plants and without plants.
Turbidity
Turbidity was measured every Monday, Wednesday, and Friday. The water collected in the test tube was lightly shaken then poured back and forth into the glass bottle in order to ensure the sample was homogenous. It was then placed in the turbidimeter (2100P ISO Portable Turbidimeter), the range was set to “Auto range” then the turbidity was measured. This was repeated for all twenty-five samples. The bottle was washed and rinsed with distilled water after each sample was read. Turbidity was measured at times 0, 10, and 20 days together with the number of rosettes of Pistia stratiotes plants. New rosettes were incorporated at the 20 days to replace the rosettes that had sunk and those that were overshading the others. This was carried out in order to reduce the effects of intraspecific competition among individuals. A similar approach followed by Fonkou and others (2002) in an experimental waste control using populations of Pistia stratiotes and is supported by the explanations by Fletcher and others (2020) about community competition in natural experiments with several species. At the time 0 of the experiment a sample of water was collected in 300ml bottles to determine the concentration
Figure 4. The containers in the experiment (a=10 ml waste lubricant oil and no Pistia plants; b=20 ml of waste lubricant oil and Pistia plants; c=blank T0N no plants, DWI with Nutrients; d,e, f = evolution 0, 10, 20 days of treatments with Pistia plants, 5 ml waste lubricant oil in solution of DWI with Nutrients and emulsifier.
of oil and grease and the correlation with turbidity was calculated. Turbidity was then used as a surrogate of oil and grease concentrations.
Oil and Grease Concentrations
The Institute of Applied Science and Technology (IAST) lab determined oil and grease concentrations using the trichloromethane (chloroform) colorimetric method (Cirne et al. 2016). The first water sample (500ml) was collected and taken to IAST on December 11, 2019 for initial oil and grease content to be determined, with a final determination performed on January 14, 2020.
Determination of Leaf Area
Pictures were taken every Monday, Wednesday, and Friday using a smartphone. The phone was positioned at a similar height and angle each time to record the entire container. The pictures taken were copied to the computer where they were opened in ImageJ app to measure leaf area.
Determination of Wet and Dry Weight
On January 2, 2020, the water lettuce plants were weighed, the number of leaves counted, and length of roots measured and then placed in the respective containers. At the end of the experiment, the plants were scooped up with a strainer and placed in labeled bags then taken to the lab at FAF
where they were rinsed with tap water followed by distilled water. They were placed on Bounty tissue to remove excess water. Plants were immediately weighed whole then divided into roots and leaves and weighed separately. The plants were then placed on A4 paper, labeled then pictures were taken. This was repeated for each of the treatments with plants. The plants were left in the lab to dry from January 15, 2020, weighed on the 17th then again on the 20th of January 2020.
Data Analysis
Statistical analysis was performed using the SPSS 20.0 for Windows. Normality tests were made for turbidity and ln transformations were carried out. All the general descriptions of media and standard deviation of the different variables were processed, and also one-way ANOVA (p= 0.05) in order to determine a potential difference between the means. Post-hoc analysis using Least Significant Deviation (LSD) tested Ho whether the means are equal, or if the H1 alternative hypothesis is rejected and the means are different (p=0.05). A correlation between turbidity and oil and grease concentration was carried out at the beginning of the experiment and a percentage of reduction of turbidity was selected as a surrogate variable to measure the success of the phytoremediation. The percentage of reduction in turbidity was calculated at 10 and 20 days.
Table 2. Correlations between Ln turbidity and oil and grease concentration at time 0. The correlation is significant and given that, it was possible to use turbidity to evaluate the phytoremediation success of using Pistia stratiotes plants.
With Pistia
(Pistia, 5 ml waste oil)
T4 (Pistia, 10 ml waste oil)
(Pistia, 20 ml waste oil)
Without Pistia
plant, 5 ml waste oil)
(no plant, 10 ml waste oil)
plant, 20 ml waste oil)
**. Correlation is significant at the 0.01 level (2-tailed).
Table 1. Comparison of means between final concentrations of waste lubricant oil with and without plants of Pistia stratiotes using ChiSquare. It should be noted that the treatment with 20 ml of waste lubricant oil resulted in a significantly lower concentration value at the end of the experiment.
RESULTS
Turbidity and oil and grease concentration values at the beginning of the experiment (Tables 1 and 2) showed significant differences between the means of the different treatments. Higher turbidity was observed in the treatments with higher oil and grease concentrations. Turbidity decreased in all the oil and grease treatments with Pistia plants (Figure 5). On the other hand, there was a slight increase of turbidity in the blanks especially the ones with nutrients and emulsifiers which was reflected in the observation of green color (Figure 6). There was a significant correlation between the Ln of Turbidity and the Oil and Grease concentration values (Table 3). The analysis after 30 days for the treatment with 20 ml of oil and grease resulted in an average reduction of 83% in the concentration of oil and grease compared with the initial value (Figure 7). It had a consistent reduction above 70% of the concentration with the presence of populations of Pistia stratiotes and was statistically significant.
Leaf area increased during the first 10 days of the experiment when some of the rosettes of Pistia stratiotes were harvested, and a new cohort of plants was added to exploit the continuous effect of phytoremediation (Figure 8). On the other hand, in all treatments weight values of dry leaves and dry roots fluctuated and increased as the process of phytoremediation proceeded. Foliar and root dry weight were higher in the treatments with oil and grease of 10 and 20 ml (Figure 9).
DISCUSSION
This experiment suggests the water renovation value of harvesting Pistia stratiotes every 10 days in the management of water canals draining the city of Georgetown. Fonkou and others (2022) in wastewaters indicate a replacement every 15 days, although in our lab experiment the growth efficiency of Pistia might be faster and that is why we replaced sunk rosettes at 10 days and not at 15 days as they did. Oil and grease are organic contaminants with a recommended limit of 10.0 mg/L (Mustapha 2018). In this experiment, all concentrations were below the recommended limit. It can be demonstrated that starting with a local population of 4 rosettes per 15 l in a 20 cm depth water body there will be at least a 70% reduction in the concentration of oil and grease and a production of 6kg/150,000 liters of greywater polluted with waste lubricant oils as a potential for use in composting. Green microalgae and other microorganisms such as bacteria may also be responsible for some of the remediation of waste lubricant oil based on the observation of increasing green color and turbidity in the water. The emulsifier acting as surfactant can also release additional nutrients from the oils which may add a source of nutrients to be used by microorganisms (i.e., the growth of microalgae). The increase in turbidity in the blank with only nutrients and emulsifier and a darker green color on the last
Figure 5. Variation in turbidity with time in each of the treatments with waste lubricant oil (5 ml of oil, 10 ml of oil, 20 ml of oil). All experiments showed a reduction in turbidity indicating that there was an effective process of bioremediation. The experiments with the plants Pistia stratiotes were more efficient in reducing the turbidity and hence the oil and grease concentrations especially T6,the treatment with 20 ml of oil, while the lower percentage reduction was noticed in the 20 ml and 5 ml experiments.
Figure 6. Variation in turbidity with time in the blanks without waste lubricant oil nor plants of Pistia stratiotes (water lettuce). T0= absolute blank only DWI deionized water, T0E= DWI+Emulsifier, T0N=DWI+Nutrients NPK, T0NE=DWI+Nutrients+Emulsifier. This figure shows potential existence of microorganisms adding its effects to the process of bioremediation. It can be noticed a slight increase in turbidity that was related to the growth of microorganisms.
Table 3. Comparison of the reduction of turbidity at 10 and 20 days in the different treatments. It can be noticed that at day 10, the highest phytoremediation percentage in terms of the surrogate variable turbidity was for the 20 ml with Pistia stratiotes plants. The differences with the treatments without plants however are not very large indicating that other sources of bioremediation can be present.
Figure 7. Oil and grease concentrations at the beginning (black) and 30 days at the end of the experiment (cross-hatched – with plants; gray – no plants). 20 ml of waste oil). An effective phytoremediation of the oil and grease concentration is clearly a result of the presence of the plants of Pistia stratiotes, however another potential bioremediation factors could be added with the presence of microorganisms.
day indicate that the presence of microalgae can also be participating in the phytoremediation process as observed by Hernández-Pérez et al. (2018).
Lu and others (2010) utilized Pistia stratiotes to phytoremediate nutrients from eutrophic stormwaters in constructed water detention systems. They found that there was an improvement in the water quality as seen from the reduction of turbidity by 65.54% compared with the control. Our study also demonstrated the potential of Pistia to reduce turbidity plus there was a marked difference in oil and grease content between the planted and unplanted control as was seen in Figures 5 and 7. The efficiency in the growth can be seen in the growth dynamics of both the leaf areas and the leaves and roots dry weights as seen in Figures 8 and 9.
CONCLUSION AND RECOMMENDATIONS
This study showed that there is a high potential that turbidity can be used as a surrogate variable to monitor oil and grease pollution in water. Wastewater that was phytoremediated with Pistia stratiotes had a significant reduction in oil and grease contamination with phytoremediation efficiency ranging from 65% to 83% over a 30-day period. To fully make use of the phytoremediation property of Pistia stratiotes, we decided that periodic resupplies would have to be conducted since plants that reach their biological growth peak may have reduced phytoremediation efficiencies and slow the wastewater treatment process. That was observed in Figure 8 and it would fit the replacement value that is demonstrated by Fonkou and others (2022) in wastewaters. Fletcher and others (2020) also explain the competitive effects of wetland communities with different plant species and phytoremediation is carried out based on the
Figure 8. Temporal dynamics in the of leaf area growth of Pistia stratiotes with zero and three different concentrations of the waste lubricant oil (5 ml, 10 ml, 20 ml). This figure show how in T1 the presence of Pistia stratiotes without oil and grease concentrations increase and further is reduced given the overshading establishing competition among the individuals. The largest growth is produced in the 20 ml concentration but after the 10 days there is a replacement of those rosettes that were overshaded and the same pattern of growth is repeated.
temporal growth dynamics of the individuals. Intraspecific competition among individuals of Pistia stratiotes would also need to be taken into account.
For future work, we recommend:
1. Repeating this experiment with different sizes of plants at lower concentrations of oil and conducting the experiment for a longer period.
2. Identification of green algae and bacteria as potential co-workers in the process of wastewater remediation.
ACKNOWLEDGEMENTS
This study is part of the Bachelor thesis of the first author. Funding for the lab analysis was received from the Research Grant Programme: Achieving a green state: Building human capacity for natural resources management in Guyana as part of a partnership between the University of Guyana and the Tropical Conservation and Development Program at the University of Florida (USA), Grant Funding provided by WWF Guianas and NORAD. The authors also want to acknowledge the support from the Dean and personnel of the Faculty of Agriculture and Forestry for allowing the use of the greenhouse and lab facilities and the IAST (Institute of Applied Science and Technology) for the advice with the Oil and Grease sampling procedures. We also thank WSP editor Ralph Tiner for all his suggestions to improve the manuscript.
REFERENCES
Akinbile, C. O., and M. Yusoff. 2012. Assessing water hyacinth (Eichhornia crassipes) and lettuce (Pistia stratiotes) effectiveness in Aquaculture wastewater treatment. International Journal of Phytoremediation 14: 201-211. https://doi.org/10.1080/15226514.2011.587482
Byrne, C.A., A. Nankishore and A. Ansari. 2015. Wastewater management using an aquatic and semi-aquatic plant species, Cattail (Typha dominguensis) and Duckweed (Spirodela polyrhiza L.). Journal of Agriculture and Ecology Research International 3: 75-80. https://doi. org/10.9734/JAERI/2015/15583
Cirne I., J. Boaventura, Y. Guedes, and E. Lucas. 2016. Methods for determination of oil and grease contents in wastewater from the petroleum industry. Chemistry & Chemical Technology 10: 437-444. https://doi. org/10.23939/chcht10.04.437
Dominguez-Rosado, E. and J. Pichtel. 2004. Phytoremediation of soil contaminated with used motor oil: II. Greenhouse studies. Environmental Engineering Science 21: 169–180. https://doi. org/10.1089/10928750477308734h
Ekperusi, A. 2018. Phytoremediation of petroleum hydrocarbons in polluted waters using Pistia stratiotes: gaps and future perspective. Proceedings of the Nigeria Annual International Conference and Exhibition (pp. 1-17). Nigeria: Society of Petroleum Engineers.
Elredaisy, S. 2010. Ecological benefits of bioremediation of oil contaminated water in Rich Savannah of Palogue, Upper Nile Area-Southern Sudan. Journal of Bioremediation & Biodegradation 1: 1-7. https://doi. org/10.4172/2155-6199.1000103
Fletcher, J., N. Willby, D.M. Oliver and R.S. Quilliam 2020. Phytoremediation using aquatic plants. Chapter 12. In: Shmaefsky, B. (eds) Phytoremediation. Concepts and Strategies in Plant Sciences. Springer, Cham. https://doi.org/10.1007/978-3-030-00099-8_7
Fonkou T., P. Agendia, I. Kengne, A. Amongou and N. Jean 2002. Potentials of water lettuce (Pistia stratiotes) in domestic sewage treatment with macrophytic lagoon systems in Cameroon.. In Proceedings of International Symposium on Environmental Pollution Control and Waste Management pp.709-714. Tunisia.
Figure 9. Temporal dynamics of Pistia stratiotes leaves weight in the graph above and roots weight in the graph below with zero and three different concentrations of the waste lubricant oil (5 ml, 10 ml, 20 ml). This figure shows how the productivity of Pistia stratiotes without oil and grease concentrations increase and further is reduced given the overshading establishing competition among the individuals. The largest carbon uptake is produced in the 20 ml concentration.
Franklin, M., P. Ketwaru and D. Simmons. 2012. An assessment of used oil management among mechanics in Linden: existing and alternative use as a supplemental fuel, Georgetown. Journal of Academic Research & Essays 1: 1-13 pp. https://doi.org/10.52377/YDEK3267
Harnchandra, A. 2008. Phytoextraction of heavy metals from wastewater using the water hyacinth (Eichhornia crassipes). University of Guyana, Undergraduate Thesis. Department of Environmental Studies. Georgetown, Guyana.
Hernandez-Perez, A., H. Mattos, and J. Ramos-Suarez. 2018. Phytoremediation using microalgae: techniques and perspectives. Chapter 8. In V. Matichenkov (ed.) Phytoremediation: Methods, Management and Assessment. Nova Science Publishers, Inc., Hauppauge, NY.
Mitsch, W., and J. Gosselink. 2015. Wetlands (5th ed.). John Wiley & Sons, Inc., Hoboken, NJ.
Mustapha, H. 2018. Treatment of Petroleum Refinery Wastewater with Constructed Wetlands. Wageningen University. Leiden: CRC Press/ Balkema. https://doi.org/10.18174/444370
Nazir, S., S. Gomathinayagam and A. Ansari. 2020. The use of Spirodela polyrrhiza (Duckweed) and Eichhornia crassipes (Water Hyacinth) to phytoremediate wastewater in Guyana. Asian Journal of Applied Science and Technology 4: 69-75. https://doi.org/10.38177/ajast.2020.4310
Persaud, K. 2011. An assessment of the potential of water hyacinth (Eichhornia crassipes) for phytoremediation of domestic waste. University of Guyana, Undergraduate Thesis. Department of Environmental Studies. Georgetown, Guyana.
Persaud, M. 2013. An assessment of Lotus (Nelumbo Nucifera) and water lettuce (Pistia stratiotes) for remediation of domestic wastewater University of Guyana, Undergraduate Thesis. Department of Environmental Studies. Georgetown, Guyana.
Schwantes, D., A. Schiller, J. Manfrin, M Campagnolo and E. Somavilla. 2019. Pistia stratiotes in the phytoremediation and post-treatment of domestic sewage. International Journal of Phytoremediation 21: 714-723. https://doi.org/10.1080/15226514.2018.155659
Tiwari, J., A. Kumar, and N. Kumar. 2017. Phytoremediation potential of industrially important and biofuel plants. In K. Bauddh, B. Singh, & J. Korstad (Eds.). Phytoremediation Potential of Bioenergy Plants Springer Nature Singapore Pte Ltd., Singapore. pp. 211-254.
Functional Connectivity of the California Bulrush (Schoenoplectus californicus) in Central-Western Wetlands in Mexico
Efraín Noriega-Rico1, Yessica Rico1 , and Tatiana Lobato-de Magalhães2,3
ABSTRACT
Wetlands are natural links between terrestrial and aquatic ecosystems maintaining biodiversity at regional and landscape levels. Wetland conservation in Mexico could benefit from understanding functional connectivity for aquatic plants. This is an ongoing research project aimed at identifying the landscape factors that determine gene flow and genetic diversity of Schoenoplectus californicus in the highland wetlands of Central-Western Mexico. Between 10 to 30 leaf tissue samples from S. californicus individuals were collected in natural and artificial wetlands in the states of Michoacán, Guanajuato, and Jalisco for genomic DNA extraction. A total of sixteen nuclear microsatellite markers developed for S. americanus will be transferred and genotyped to estimate genetic diversity and differentiation and to statistically test their relationship with landscape elements. To date, 419 individuals from 27 sites have been sampled from 11 wetlands. Six out of 16 microsatellites have been transferred. The results of this work will guide the design of wetland management and conservation strategies at the landscape scale, particularly in anthropogenic landscapes where wetlands are at high risk.
RESUMEN
Los humedales actúan como conectores naturales entre los ecosistemas terrestres y acuáticos, y mantienen la biodiversidad a escalas regional y del paisaje. La conectividad funcional ha sido poco estudiada en plantas acuáticas a pesar de su potencial para informar la conservación de humedales en la región neotropical. Esta investigación en curso tiene como objetivo identificar los elementos del paisaje que determinan el flujo de genes y la diversidad genética de Schoenoplectus californicus en los humedales del Centro-Occidente de México. Se colectarán entre 10 a 30 muestras de tejido foliar de individuos de S. californicus en humedales naturales y artificiales en los estados de Michoacán, Guanajuato y Jalisco para extraer ADN genómico. Un total de dieciséis microsatélites nucleares desarrollados para S. americanus serán transferidos y genotipados para estimar la diversidad y diferenciación genética, y para
probar estadísticamente su relación con los elementos del paisaje. Al presente se han registrado 27 sitios de colectas, discriminados en 11 humedales independientes, obteniendo un total de 419 individuos. Se han transferido 6 de los 16 microsatélites con buena amplificación y especificidad. Los resultados de este trabajo guiarán el diseño de estrategias de manejo y conservación de humedales a escala de paisaje, particularmente en paisajes antrópicos donde los humedales están en gran riesgo.
INTRODUCTION
Freshwater wetlands act as natural connectors between terrestrial and aquatic ecosystems and sustain biodiversity and human well-being by supplying ecological services (Schofield et al. 2018; Lobato-de Magalhães et al. 2020). Freshwater wetlands are vulnerable to many factors, such as changes in land use, pollution, and climate change, and recent estimates of wetland loss report that since 1700, 21% of the world’s wetlands have been lost. (Fluet-Chouinard et al. 2023). Maintaining functional connectivity of freshwater wetlands is of high importance for preserving biodiversity and ecosystem functions (Babu 2023). For plants, functional connectivity involves the effective dispersal of seeds and pollen between habitat patches, their interaction with dispersal vectors, the landscape elements, and the environment (Auffret et al. 2017).
The study of functional connectivity through genetic methods allows the identification of genetically isolated and depauperate populations, as well as the landscape elements that facilitate or restrict gene flow. For example, de la Luz Perez-Garcia et al. (2023) characterized the genetic diversity of a woody bamboo (Guadua velutina Londoño & L.G. Clark) in the rivers of the Huasteca Potosina in Mexico and found that the river network functions as the primary corridor for gene flow. Moreover, Lobato-de Magalhães et al. (2020) assessed the functional connectivity of the yellow floating heart (Nymphoides fallax Ornduff) in geographically isolated temporary wetlands in central Mexico and found that connectivity was associated with genetic diversity when wetlands were within 5 km, while forest cover sustains gene flow. Thus, conducting studies on functional connectivity using genetic data in aquatic plants is crucial for the conservation planning of wetlands in human-modified landscapes (Lozada-Gobilard et al. 2021).
Mexico’s wetlands are home to a wide variety of aquatic plants (Lobato-de Magalhães et al. 2020), of which Schoenoplectus californicus (C.A. Mey.) Soják (Cyperace-
1 Instituto de Ecología, A.C. Red de Diversidad Biológica del Occidente Mexicano, Centro Regional del Bajío, Pátzcuaro, Mexico. Corresponding author contact: efrain.noriega@posgrado.ecologia.edu.mx
2 Natural Sciences Faculty, Universidad Autónoma de Querétaro, Querétaro, QRO, Mexico
3 Biological Sciences Department, North Dakota State University, Fargo, ND, USA
ae) is a characteristic plant of the central-western wetlands. Native from Southern California to Patagonia (Tropicos 2023), it is a perennial, polyploid sedge (with 32 to 68 chromosomes) that reproduces sexually and vegetatively (Tena-Flores et al. 2014; Kettenring et al. 2019). The species has been used for construction materials, handicrafts, and phytoremediation, and as a nesting site and food source for migratory birds (Tiner 2014; Hidalgo-Cordero et al. 2020). Wetlands in Central-Western Mexico face significant threats, including declining water levels, contamination from untreated wastewater, the presence of livestock, and the proliferation of invasive plant species. These factors jeopardize the ecological and economic benefits that these wetlands provide to local communities. Hence, it is imperative to study functional connectivity in this region to develop effective conservation strategies and identifying hub populations of S. californicus necessary for preserving genetic diversity and functional connectivity in the CentralWestern Mexico wetland system.
Therefore, the objective of this research is to assess the genetic diversity and functional connectivity of S. californicus in freshwater wetlands in Central-Western Mexico. Specifically, our questions are: (1) Do large and wellconnected wetlands harbor higher genetic diversity for S. californicus? (2) Do landscape elements explain functional connectivity of S. californicus?
Figure 1. Photographs of the species Schoenoplectus californicus in (A) Lake Chapala, Jalisco, (B) Lake Cuitzeo, Michoacán, where the presence of the invasive species Pontederia crassipes (syn. Eichhornia crassipes) is evident, (C–D) and close-up of some specimens where the inflorescence of the study species is observed.
Figure 2. Geographic distribution of S. californicus populations in the freshwater wetlands of Central-Western Mexico, with land use and vegetation characterization. The red dots represent collection sites. 1-4: Zirahuén Lagoon; 5,6,8-11: Pátzcuaro Lake; 7: El Jaguey Lake; 12: Tunguitiro Lagoon; 13: Bellas Fuentes; 14: Hierbabuena; 15: Laguna; 16: Copándaro; 17-19: Cuitzeo Lake; 20-22: Yuriria Lake; 23-27: Chapala Lake.
MATERIAL AND METHODS
The study area includes natural and man-made freshwater wetlands in Michoacán, Guanajuato, and Jalisco states (Figure 2). A systematic sampling approach was employed considering between 10 to 30 individuals per site. Individuals were collected from both the edge and center of each wetland to ensure genetic variability within each. Leaf tissue samples were collected and stored in silica gel. Botanical vouchers were deposited on the IEB INECOL Herbarium.
Genomic DNA was extracted using the CTAB technique (Wagner et al. 1987). Sixteen microsatellite markers specific to Schoenoplectus americanus will be transferred to S. californicus (Blum et al. 2005). Microsatellite products will be observed by 1% agarose gel electrophoresis. Methods to amplify and genotype microsatellites will follow the protocols of Lobato-de Magalhães et al. (2020). All genetic analysis procedures will be performed at the Laboratory of Genetics and Molecular Biology of the Centro Regional del Bajío Instituto de Ecología, Pátzcuaro, Mexico.
We will calculate genetic diversity parameters (e.g., HE, HO, FIS, FST, population-specific FST) using SPAGeDi V.1.5a, which allows the use of codominant polyploid data. To evaluate genetic structure, we will perform a Bayesian clustering algorithm implemented in STRUCTURE V.2.3.4, and a multivariate discriminant analysis (DAPC) using adegenet in R V.4.2.1.
Connectivity network analyses will be performed using a graph theory approach to estimate wetland connectivity by parameterizing several structural connectivity indices that consider the geographical distance among wetlands (e.g., Hanski index, integral connectivity index, connectivity probability index) using igraph in R V.4.2.1. Site variables considered will be wetland size, perimeter, depth, and the 19 bioenvironmental variables (Worldclim) and presence of agriculture around the wetland. These site parameters and the wetland connectivity indices will be related against estimates of genetic diversity and populationspecific FST using linear regression approaches. To evaluate the effects of landscape elements on gene flow, we will construct several landscape layers using the aridity index (CGIARCSI), forest and agriculture covers, the hydrological-network, and slope. These landscape layers will be optimized using a resistance-surface approach in ResistanceGA and their association with estimates of FST will be evaluated through a model selection approach using linear mixed effects models with maximum likelihood population effects (MPLE).
WORK TO DATE AND PRELIMINARY FINDINGS
We have sampled 27 sites with the presence of S. californicus within 11 wetlands (Figure 2). Chapala and Cuitzeo lakes (266 km) are the wetlands with the greatest distance
between them. The wetlands with the shortest distance are Bellas Fuentes and Hierbabuena with 3 km. Wetlands like Lake Pátzcuaro, Cuitzeo, and Chapala have been distinguished by high anthropogenic pressure in their surroundings and the presence of invasive aquatic plants such as the species Pontederia crassipes Mart., commonly known as “water lily”. DNA extractions have been carried out for all sampling sites, and six nuclear microsatellites from the species S. americanus have been transferred, showing specificity and good amplification for S. californicus. Changes in land use and vegetation can impact the composition and structure of the landscape, which in turn can influence the flow of organisms and their genes (Echeverria et al. 2014). Land use and vegetation in our study area have been heavily modified, with agriculture being the primary anthropogenic activity covering extensive areas of land around the wetlands under investigation in the states of Michoacán, Guanajuato, and Jalisco.
EXPECTATIONS
The study on the functional connectivity of Schoenoplectus californicus in freshwater wetlands in Central-Western Mexico will allow us to characterize the patterns of genetic diversity and structure for this aquatic plant. It will also result in the development of a functional connectivity model that integrates environmental, genetic, and landscape data. This landscape genetics approach as a conservation tool may contribute to the formulation of conservation actions to protect an ecosystem that is rapidly disappearing.
ACKNOWLEDGMENTS AND FUNDING
First author holds a Master scholarship by National Council of Humanities, Science, and Technology, CONAHCYT (n. 1240930). This research received funds from the 2023 SWS Student Research Grant.
REFERENCES
Auffret, A.G., Y. Rico, J.M. Bullock, D.A. P. Hooftman, R.J. Pakeman, M.B. Soons, A. Suárez-Esteban, A. Traveset, H.H. Wagner, and S.A.O. Cousins. 2017. Plant functional connectivity – integrating landscape structure and effective dispersal. Journal of Ecology 105(6): 1648–1656. https://doi.org/10.1111/1365-2745.12742
Babu, A. 2023. Review of the role of the landscape approach in biodiversity conservation. Sustainability and Biodiversity Conservation 2(1): 61–86.
Blum, M.J., J.S. Mclachlan, C.J. Saunders, and J.D. Herrick. 2005. Characterization of microsatellite loci in Schoenoplectus americanus (Cyperaceae). Molecular Ecology Notes 5(3): 661–663. https://doi. org/10.1111/j.1471-8286.2005.01047.x
Davidson, N.C. 2014. How much wetland has the world lost? Longterm and recent trends in global wetland area. Marine and Freshwater Research 65(10): 934-941. https://doi.org/10.1071/MF14173
de la Luz Perez-Garcia, M., J. Pérez-Alquicira, Y. Rico, O. VargasPonce, and E. Ruiz-Sanchez. 2023. Rivers as corridors for gene flow of the neotropical bamboo Guadua velutina. Aquatic Botany 186: 103632. https://doi.org/10.1016/j.aquabot.2023.103632
Echeverría, C., G. Bolados, J. Rodríguez, M. Aguayo, and A. Premoli, 2014. Ecología de Paisajes Forestales. In C. Donoso., M. Gonzales., & A. Lara (Eds.), Ecología Forestal Bases para el Manejo Sustentable y Conservación de dos Bosques Nativos de Chile (pp. 583-604).
Fluet-Chouinard, E., B.D. Stocker, Z. Zhang, et al. 2023. Extensive global wetland loss over the past three centuries. Nature 614, 281–286. https://doi.org/10.1038/s41586-022-05572-6
Hidalgo-Cordero, J.F., T. García-Ortuño, and J. García-Navarro. 2020. Comparison of binderless boards produced with different tissues of totora (Schoenoplectus californicus (C.A. Mey) Soják) stems. Journal of Building Engineering 27: 100961. https://doi.org/10.1016/j. jobe.2019.100961
Kettenring, K.M., B.N. Mossman, R. Downard, and K.E. Mock. 2019. Fine-scale genetic diversity and landscape-scale genetic structuring in three foundational bulrush species: Implications for wetland revegetation. Restoration Ecology 27(2): 408–420. https://doi.org/10.1111/ rec.12884
Landgrave, R., and P. Moreno-Casasola. 2012. Evaluación cuantitativa de la pérdida de humedales en México. Investigación ambiental. Ciencia y política pública 4(1): 19-35
Lobato-de Magalhães, T., Y. Rico, D. Cabrera-Toledo, and M. Martínez. 2020. Plant functional connectivity of Nymphoides fallax in geographically isolated temporary wetlands in Mexican highlands. Aquatic Botany 164: 103215. https://doi.org/10.1016/j.aquabot.2020.103215
Lozada-Gobilard, S., C. Schwarzer, R. Dyer, R. Tiedemann, and J. Joshi. 2021. Genetic diversity and connectivity in plant species differing in clonality and dispersal mechanisms in wetland island habitats. Journal of Heredity 112(1): 108–121. https://doi.org/10.1093/jhered/esaa059
Schofield, K.A., L.C. Alexander, C.E. Ridley, M.K. Vanderhoof, K.M. Fritz, B.C. Autrey, J.E. DeMeester, W.G. Kepner, C.R. Lane, S.G. Leibowitz, and A.I. Pollard. 2018. Biota connect aquatic habitats throughout freshwater ecosystem mosaics. Journal of the American Water Resources Association 54(2): 372–399. https://doi.org/10.1111/1752-1688.12634
Tena-Flores, J.A., M.S. González-Elizondo, Y. Herrera-Arrieta, N. Almaraz-Abarca, N. Mayek-Pérez, and A.L.L. Vanzela. 2014. Karyotype characterization of four Mexican species of Schoenoplectus (Cyperaceae) and first report of polyploid mixoploidy for the family. Caryologia 67(2): 124–134. https://doi.org/10.1080/00087114.2014.931633
Tiner, R.W. 2014. The Uros of Lake Titicaca and their dependence on Totora (Schoenoplectus californicus ssp. totora: Cyperaceae). Wetland Science and Practice 31(2): 13-16. Tropicos. 2023. Schoenoplectus californicus (C.A. Mey.) Soják. Missouri Botanical Garden. <https://www.tropicos.org/name/9904887> Wagner, D.B., G.R. Furnier, M.A. Saghai-Maroof, S.M. Williams, B.P. Dancik, and R.W. Allard. 1987. Chloroplast DNA polymorphisms in lodgepole and jack pines and their hybrids. Proceedings of the National Academy of Sciences of the United States of America 84(7): 2097–2100. https://doi.org/10.1073/pnas.84.7.2097
Wetlands on the Paintbrush: A Self-Profile of José Herrera Gallegos and Selected Art
This article highlights my self-profile and some selected wetland art pieces, among them the watercolor “Pantanos de Centla, Tabasco, Mexico” a donation as the prize for the winner of their Latin American Caribbean (LAC) wetland photo contest. I’ve documented various Mexican ecosystems from deserts to wetlands. My works and palette are dominated by earthy colors such as burnt sienna and ocher yellow, balanced with cold colors such as turquoise blue and viridian green. One of my upcoming projects is to set up an exhibition with the theme of the Mexican seas and waters in Baja California Sur.
RESUMEN
Este artículo destaca mi perfil personal y algunas obras de arte seleccionadas sobre humedales, entre ellas la acuarela “Pantanos de Centla, Tabasco, México”, una donación
como premio para el ganador de su concurso de fotografía de humedales en el Caribe Latinoamericano (LAC). He documentado varios ecosistemas mexicanos desde desiertos hasta humedales. Mis obras y mi paleta están dominadas por colores terrosos como el siena tostado y el amarillo ocre, equilibrados con colores fríos como el azul turquesa y el verde viridian. Uno de mis próximos proyectos es montar una exposición con la temática de los mares y aguas mexicanas en Baja California Sur.
BACKGROUND
Since I donated a piece of art to the Society of Wetland Scientists for use as the prize for the winner of their Latin American Caribbean (LAC) wetland photo contest, they offered me an opportunity to tell folks about my development as an award-winning artist.
Originally from Oaxaca, Mexico, a multi-ethnic and multicultural city and one of the cradles of Mexican art, I am heir to the legacy that local artists left behind, especially Rufino Tamayo and Francisco Toledo (Figure 1). My career has not been academic as I learned by observing some artists from this city having discovered my natural talent for drawing at the age of 10. I have been a teacher of art education and a member of artist groups in Oaxaca where I explored the techniques of engraving, oil, acrylics and mixed techniques, and finally settling on watercolors as a career. I am one of many active watercolorists in Mexico, giving workshops in most of the states. I belong to the
Figure 1. José Herrera Gallegos in his atelier.
Mexican Society of Watercolorists and am currently part of the ESTAMPA gallery in Oaxaca. My style is defined by constant evolution, beginning with traditional watercolor almost 20 years ago, even reaching abstraction today using alternative materials, where I disassociate myself from the term “watercolor” to give way to a dialogue with aqueous techniques, playing with different formats and textures.
Since 2012, my career has taken off when I won the amateur watercolor contest organized by the Ministry of Culture of Mexico, breaking into the vibrant Mexican cultural endeavor. Since then I’ve received various awards inside and outside of Mexico. Not having completed a degree related to the arts, I chose to absorb knowledge by traveling the globe to learn how watercolor was reflected in the vision of different artists while also attending numerous festivals in Europe, Asia and South America. Among my accomplishments are: the last winner of Potrer Art Argentina in 2019 (the only Mexican to achieve it); two honorable mentions in the prize of the Mexican Society of Watercolorists, second place in the International Watercolor Society watercolor biennial in Quito Ecuador in 2017, representative artist of the Mexican delegation in Fabriano in acquarello 2018 and second place in the Tlaloc 2019 prize. Before the eruption of social networks, I had already participated in numerous collective exhibitions in the United States; in galleries in Austin Texas, Los Angeles, Pasadena, Sebastopol and San Francisco California; Arizona, New York, Massachusetts and Seattle. In recent months I have participated in the meeting of watercolorists in Frutillar Chile in November 2022, in 2023 Potrer art, potrero de
los Funes in Argentina, Ayacucho watercolor meeting in Peru and recently in plein air Prague in Czech Republic, Fabriano and Urbino in Acquarello (in Italy) and gave a watercolor workshop in Beziers, France.
MEXICAN ECOSYSTEM WATERCOLORS
I’ve traveled throughout Mexico and through the watercolor technique I’ve documented various Mexican ecosystems from deserts to jungles and wetlands (Figures 2-5) by highlighting human interactions with these sites and the observation of the delicate balance that they maintain. My works and palette are dominated by earthy colors such as burnt sienna and ocher yellow, balanced with cold colors such as turquoise blue and viridian green. One of my upcoming projects is to set up an exhibition with the theme of the Mexican seas and waters in Baja California Sur.
PANTANOS DE CENTLA, TABASCO, MEXICO
Centla is the largest area of wetlands in North America: a refuge and breeding area for large populations of migratory waterfowl with high biological wealth. Located in the northeast of the state of Tabasco, it covers 302,706 ha in the municipalities of Centla, Jonuta, Macuspana and Campeche, and is home to one of the largest hydrological systems in Mexico (Grijalva and Usumacinta rivers). The swamps are one of the ecosystems with the greatest biodiversity along with estuaries, dunes, marshes, mangroves, fluvial islands and water mirrors where a great variety of fish, mollusks, insects, reptiles and plants live. Among its flora and fauna, the red, black, and white mangrove, the
Figure 2. Watercolor of Pantanos de Centla, Tabasco, Mexico, 2023 by José Herrera Gallegos. This was honored as the first prize for the winner of the SWS LAC photo contest for 2024 (the photo is featured on this cover of this issue - January 2024).
howler monkey, caiman and green iguana stand out, as well as some endangered species: jaguar, ocelot, manatee, peregrine falcon, white turtle, and the Jabirú stork (the largest bird in Mexico).
LAGUNAS DE CHACAHUA, OAXACA, MEXICO
Lagunas de Chacahua National Park, Oaxaca is one of the most representative natural protected areas of the Oaxaca coast. The lagoons were decreed as a National Park on July 9, 1937 and recognized as a Wetland of International Importance (Ramsar site) in February 2008. The Park is the habitat of three species of sea turtles: Laud, Carey and Golfina, which nest on the beaches of San Juan and Bahía de Chacahua. Among the environmental services provided by this National Park, the following stand out: carbon capture, oxygen production, aesthetic value for tourism, food production for different organisms such as shrimp, aquifer recharge and biodiversity maintenance.
AXOLOTL
The Mexican Axolotl or Axolotl, Ambystoma mexicanum, is a salamander with the unusual characteristic of retaining its larval features into its adult life. This condition, known as neoteny, means that it retains its tadpole-like dorsal fin
Figure 3. Watercolor of the mangroves of Lagunas de Chacahua, Oaxaca, Mexico, 2023 by José Herrera Gallegos.
Figure 4. Watercolor of Axolotl, Mexico, 2021 by José Herrera Gallegos.
which runs nearly the entire length of its body, and its external gills which protrude from the back of its broad, feather-like head. This unique amphibian is in critical danger of extinction according to the Red List of the International Union for Conservation of Nature, due to habitat loss, the introduction of invasive species into its habitat, overexploitation, pollution, and its consumption as food. The Axolotl is found only in the lake complex of Xochimilco (pronounced Sochimilco), near Mexico City, and differs from most salamanders in that it lives permanently in the water. In extremely rare cases, the Axolotl matures and emerges from the water, but in most cases, they prefer to stay at the bottom of Xochimilco’s lakes and canals.
PARQUE DEL ESTE, CARACAS, VENEZUELA
East Park (Parque del Este) is a public recreation park in the Leoncio Martínez Parish, Sucre Municipality, in the Metropolitan Area of Caracas, in Venezuela. An attraction for birders as well as others seeking an experience with nature or a pleasant stroll or jog within the city, it is home to more than 130 species of national flora and numerous animal species.
RECENT HERRERA’S COLLECTIVE EXHIBITIONS:
2022 “Musas” galería KUMUTU . Loreto baja California Sur, México.
2021 Acuarela mexicana en Moscú. Galería Sare Moscú, Rusia 2020. Legados por generaciones pasadas, Sangremal galeria. Querétaro, México.
2020 “Oaxaca en acuarela” Estampa galería. Oaxaca México.
2019 México en acuarela Sala de exposiciones JUANA FRANCÉS.Madrid, España.
2019 “Encanto de luna y agua” Centro de las artes “Santa Rosa de Viterbo”. Querétaro México.
2018 “Dialéctica Oaxaqueña” Augusta Savage gallery. Amherst, Massachusetts USA.
2019 “RECENT WORKS” Loreto bay gallery. Loreto, Baja California Sur, México.
2018 “Herrera Gallegos:Mexican watercoloris” La Peña gallery. Austin, Texas. USA.
Figure 5. Watercolor of Great Egret (Ardea alba) and Egyptian Blue Water Lily (Nymphaea caerulea) in East Park, Caracas, Venezuela, 2020 by José Herrera Gallegos.
Observations from an Expedition to Costa Rican Peatlands
Julie Loisel1,2, Jan Peters1, Cosima Tegetmeyer3 Nick Girkin4,5, Andrew Parsekian6, and Jacklyn Rivera Wong7
ABSTRACT
In July and August of 2023, we visited Costa Rica to examine some of the country’s peatlands. The purpose of our trip was to collect peat samples from a variety of wetland habitats from the coast to the highlands for future analysis. We summarize our observations in this short essay.
RESUMEN
En julio y agosto de 2023, visitamos Costa Rica para examinar algunas de las turberas del país. El propósito de nuestro viaje fue recolectar muestras de turba de una variedad de hábitats de humedales desde la costa hasta las tierras
altas para análisis futuros. Resumimos nuestras observaciones en este breve artículo.
INTRODUCTION
Across most of Central and South America, the spatial distribution of peatlands has been estimated using probability maps (e.g., Gumbricht et al. 2017, Melton et al. 2022). The large extent of these “potential peatlands” has increased their visibility on the global stage due to their roles in storing carbon, providing habitat for unique species, and mediating water flow (UNEP 2022). However, the difficulty to access these tropical ecosystems have made ground obser-
Figure 1. Map showing peatland areas that were visited during our 2023 field expedition across Costa Rica. The Global Peatland Database (GPD) can be viewed here: https://greifswaldmoor.de/global-peatland-database-en.html
1 Department of Geography, Texas A&M University, College Station, Texas, USA; correspondence author contact: julieloisel@tamu.edu
2 Department of Geography, University of Nevada-Reno, Reno, Nevada, USA
3 Michael Succow Foundation, Partner in Greifswald Mire Centre, Greifswald, Germany
4 School of Water, Energy and Environment, Cranfield University, UK
5 School of Biosciences, University of Nottingham, UK
6 Department of Geology and Geophysics, University of Wyoming, Laramie, Wyoming, USA
7 National Wetlands Program, National System of Conservation Areas, Costa Rica
(A) (B)
Figure 2. Caño Negro (10°52’N 84°45’W), a National Wildlife Refuge and Wetland of International Importance (RAMSAR site #541), is home to seven types of wetlands, including (A) this palustrine wetland that serves as habitat for a great number of birds (including endangered ones), and (B) important populations of Caiman (Caiman crocodilus). (Photos by Patrick Campbell)
Figure 3. Medio Queso Wetland (11°02’N 84°41’W), a transboundary wetland complex between Costa Rica and Nicaragua, is a riverine peatland (A) characterized by major water level fluctuations throughout the year (>2 m); it is often burned for grazing. We retrieved peat cores (B) along a transect that traverses the western portion of this wetland complex. (Photos by Patrick Campbell and Julie Loisel, respectively)
vations challenging and, as a result, the ‘true’ location and extent of tropical peatlands still remain highly uncertain in many regions. For these reasons, it has become crucial to gain more knowledge of tropical peatlands distribution, processes, and properties. In July and August 2023, our team of ten students and five scientists ventured across Costa Rica to confirm the presence of peat soils and collect peat samples (Figure 1). With the support of several government officials and guides, we traveled to three regions where the potential for peat had been outlined in national probability maps (Villegas 2018; Peters and Tegetmeyer 2019). Those regions were also selected because they are important for land management purposes and represent common landscape features in Costa Rica and Central America, including high-altitude mountain, river floodplain, and coastal (back-barrier) zones (Cohen et al. 1995).
This study is also relevant to policy development in Costa Rica, which now includes commitments to its Nationally Determined Contributions (NDCs) related to increasing carbon sequestration and/or reducing greenhouse gas (GHG) emissions from terrestrial ecosystems. In addition, by 2030, improved schemes for Payments for Ecosystem Services (PES), which are expected to include soils and peatlands as priorities, should become more widely available and potentially very useful for continuing the wise management of Costa Rica’s natural ecosystems. To achieve the aforementioned policy objectives, better knowledge on the distribution and status of national peatlands is key. The new knowledge that will come out of the selected regions and study sites is expected to provide benchmarks to the advancement of the country’s NDCs and PES plans.
OUR EXPEDITION
From the coastline to the mountainous páramo, but also across inland lowlands and along rivers, we found peat. Our journey began in the northern portion of the country, in the province of Alajuela, near Lake Nicaragua. The study area is found in the “moist rain forest” zone and the landscape is characterized by large, groundwater-fed wetland complexes that include palustrine wetlands, marshes, riparian forests, and many others (SINAC 2018). We boated across the northern part of the seasonally flooded wetlands in Caño Negro National Wildlife Refuge, a Ramsar Wetland of International Importance. We were advised by the park rangers to visit a few shallow lagoons that were dominated by Eleocharis equisetoides and Scleria microcarpa (Figure 2A). To our own disbelief, we retrieved peat cores in excess of 200 cm in depth, directly from the boat platform, in waters about 50 cm deep. We also visited an adjacent site, the Medio Queso Wetland (Figure 3A), which is defined as a riparian peatland (Pérez-Castillo et al. 2023). The dominant plant type we encountered there was Eleocharis interstincta. This time, our team walked a transect from the valley edge towards the Medio Queso River and retrieved peat cores in excess of 300 cm in depth (Figure 3B). Note that
Figure 4. The mountain peat bogs in Costa Rica (9°39’N 83°51’W) are part of the “Turberas de Talamanca” (RAMSAR site #1286). A general view of Bog 68 (A) shows the layered vegetation communities, from the Sphagnum carpet and herbaceous understory to the tall ferns and sparse trees. This closer view of Bog 70 (B) shows surface water coming into the peatland near its lower edge. The behavior of Sphagnum spp. is worth noting. Here (C), it is interspersed with lichen in a similar fashion as in Arctic peatlands. There (D), it grows around the lower portions of shrubs. And lastly, we noted extensive carpets of Sphagnum section cuspidata (E) at Bog 70. (Photos by Patrick Campbell, Nataleigh Perez, Jan Peters, and Hannah Mitchell)
the age, history, and chemistry of these peat soils remain unknown so far, as laboratory analyses will be carried out over the next few years.
The high-elevation peatlands (~ 2750 m.a.s.l.) found in the trans-continental Talamanca Mountains were nothing short of spectacular. We only had time to visit two sites (Bog 68 and Bog 70; Figure 4) along the road that crosses Los Quetzales and Tapantí National Parks. Those two sites
(A)
along the southern Caribbean coast
Costa
82°36’W - 10°02’N 83°08’W). Notably, we visited the Gandoca-Manzanillo National Wildlife Refuge, which is also a wetland of international importance given its habitat for nesting turtles and its high biodiversity, with some endangered and threatened species present (RAMSAR site #783). Many of the coastal sites we visited were only accessible by boat (A); the Raphia palms (B) combined with the muddy wet soils made these ecosystems difficult to access and challenging to navigate. (Photos by Patrick Campbell and Andrew Parsekian)
(Photos by Patrick Campbell and Jan Peters)
Figure 5. Yolillal (peat swamps)
of
Rica (9°35N
Figure 6. Red mangrove stands along the southern Caribbean coast of Costa Rica (9°35N 82°36’W): (A) - This mangrove forest is located along the Gandoca lagoon and is protected by local land owners, and (B) - Peat cores were collected in the mangrove forest and wells were installed to monitor water level fluctuations.
are also designated as mountain wetlands of high importance by Ramsar, given their position in a large biological corridor and provision of habitat for endemic species. These small peatlands form a mosaic of flat and open vegetation with few bushes and trees (Figures 4A, 4B), within the otherwise steep and dense mountain cloud forest. Notable are the near-continuous Sphagnum mosses that carpet these ecosystems (Figure 4C-D), even enclosing shrubs, ferns, and small trees (Figure 4E). Since these peatlands had already been described in the literature (e.g., Jiménez 2016; Ricardo et al. 2022), the goal of our visit there was to collect surface vegetation and peat core samples, rather than to confirm the existence of peat. We collected over 100 cm of peat in depth, which is in line with previous studies.
The trip ended in the yolillal (swamp forests) and mangroves of the southern Caribbean coast, where peat was recently described by Peters and Tegetmeyer (2019). These two ecosystems are characterized by low vegetation diversity, with the swamp forests primarily composed of Raphia taedigera (palm; Figure 5A) while the mangroves were almost uniquely comprised by Rhizophora mangle (Figure 6A). Unlike the open wetlands that we encountered in the north and in the mountains, the coastal peat swamps were difficult to navigate, both in terms of orienting oneself under the darker closed canopy as well as walking through thick, but soft wet peat, while forging a path with machetes (Figure 5B). As for the mangroves, their formidable root systems made exploration on foot a slow (but fun!) process (Figure 6B). Here again, we consistently retrieved long peat cores in the 200- to 300-cm range. With that said, extensive ground truthing walks along the coastline around Gandoca could not confirm peat occurrence in many adjacent areas, even within dominant Raphia taedigera stands. The origin and process(es) behind peat initiation and maintenance over time thus remain unclear in this area, but may relate to the geomorphological history given the migrating dynamic of the streams that transect the land. Nevertheless, peat was confirmed in many sectors, including in “Laguna de Manzanillo”, which is locally known as a forest swamp (Jiménez 2016). With the support of local park rangers, peat occurrence was confirmed in this sector, after a strenuous mission to the edge of the site. A 250-cm peat core was retrieved for further analysis. Peters and Tegetmeyer (2019) had described this site as a probable peatland complex, but it had not been confirmed until this summer.
FINAL REMARKS
Overall, the expedition was a success. Our team identified peatlands across the Costa Rican landscape, some of them never described as peatlands before in the literature (here’s a link to our storytelling field book: https://patrickcampbell.exposure.co/back-waters-1). We also retrieved
numerous samples that will help us quantify the amount of carbon stored in these soils in addition to understanding the paleoenvironmental history of these understudied ecosystems. This work also acts as initial input for the government of Costa Rica within the framework of compliance with its 2020 NDC goal. It is essential to build a baseline of technical information for peatlands to support decision-making and stop the degradation and loss of these ecosystems. The current NDC, in compliance with the Paris Agreement, commits Costa Rica to take actions aligned with a trajectory consistent with the global goal of limiting the increase in global average temperature to 1.5°C. At the same time, peatland protection will contribute to increasing the country’s adaptive capacity, especially by buffering water and safeguarding coastal zones, protecting specific biodiversity, and reducing its vulnerability to climate change.
REFERENCES
Cohen, A., O. Ramirez, L. Obando, L. Malavassi, and A. Ramirez. 1995. Peat Deposits of Central America and the Caribbean Region. In: R.L. Miller, G. Escalante, J.A. Reinemund, and M.J. Bergin (editors). Energy and Mineral Potential of the Central American-Caribbean Region. Berlin, Heidelberg: Springer. pp. 193-197.
Gumbricht, T., R.M. Roman-Cuesta, L. Verchot, M. Herold, F. Wittmann, E. Householder, N. Herold, and D. Murdiyarso. 2017. An expert system model for mapping tropical wetlands and peatlands reveals South America as the largest contributor. Global Change Biology 23(9): 35813599.
Jiménez, J.A. 2016. Bogs, marshes, and swamps of Costa Rica. In: Maarten Kappelle (editor). Costa Rican Ecosystems. University of Chicago Press, Chicago, IL, USA. pp. 866-894.
Melton, J.R., E. Chan, K. Millard, M. Fortier, R.S. Winton, J.M. MartínLópez, H. Cadillo-Quiroz, D. Kidd, and L.V. Verchot. 2022. A map of global peatland extent created using machine learning (Peat-ML). Geoscience Model Development 15: 4709-4738.
Pérez-Castillo, A.G., M. Monge-Muñoz, A.M. Durán-Quesada, W. Giraldo-Sanclemente, A.C. Méndez-Esquivel, N. Briceño, and H. CadilloQuiroz. 2023. Assessment of vegetation and peat soil characteristics of a fire-impacted tropical peatland in Costa Rica. Preprint.
Peters, J., and C. Tegetmeyer. 2019. Inventory of peatlands in the Caribbean and first description of priority areas. Proceedings of the Greifswald Mire Centre, 05/2019.
Ricardo, S.M., G.A. Paola, S.G. Rolando, E.H. Germain, P.S. Roy, and P. María. 2022. Exploring dissolved organic carbon variations in a high elevation tropical peatland ecosystem: Cerro de la Muerte, Costa Rica. Frontiers in Water 3: 742780.
SINAC. 2018. Proyecto Humedales de SINAC-PNUD-GEF. Ecosistemas Vegetales del Complejo de Humedales de Caño Negro, Los Chiles, Costa Rica. SINAC, PNUD. Turrialba, Costa Rica. SINAC/PNUD.
UNEP. 2022. Global Peatlands Assessment – The State of the World’s Peatlands: Evidence for action toward the conservation, restoration, and sustainable management of peatlands. Main Report. Global Peatlands Initiative. United Nations Environment Programme, Nairobi.
Villegas, L. 2018. Mapping of coastal peatlands in the Caribbean region: Columbia and Costa Rica. M.Sc. thesis, Institute of Botany and Landscape Ecology, Greifswald University, Germany.
SELECT IMAGES FROM THE PHOTO CONTEST
Some photos from the photo contest are shown below. We thank the photographers for their contributions. Note that some images have been cropped to emphasize certain aspects.
WETLAND SCENES
High-elevation wetland dominated by Oxychloe andina, a member of the Rush Family (Juncacea), in Sajama, Bolivia by Kevin Guzman.
Cushion plant peatland high in the Andes, Huascarán National Park, Peru by Rod Chimner.
San Lorenzo lagoon (artificial) in Neuquén City, Neuquén Province, Argentina showing bulrushes (Schoenoplectus californicus var. californicus and Bolboschoenus martitimus subsp. paludosus) along the shore and cattail (Typha subulata) behind by Adriel Ian Jocou.
Temporary wetland with Yellow Floating-heart (Nymphoides fallax; yellow flowers) and Chihuahuan Arrowhead (Sagittaria demersa; white flowers), Querétaro, Mexico by Tatiana Lobato de Magalhães.
Aerial view of mangroves in Punta Morales, Puntarenas, Costa Rica by Tanner Scholten.
Lacustrine wetland dominated by California Bulrush (Schoenoplectus californicus) and Horned Pondweed (Zannichellia palustris; submerged - not visible) in Chapala Lake, Mexico by Tatiana Lobato de Magalhães.
The Ciénaga Poza Palo is located near the Cauca River north of Antioquia, Colombia by Mario F. Mora Goyes. Here are floating plant species (e.g., Pontederia crassipes and Salvinia minima), rooted floating-leaf species (e.g., Nymphaea spp. and Nymphoides humboldtiana), emergent species (e.g., Persicaria hispida, Hymenachne amplexicaulis, and Eleocharis spp.), and shrub species such as Giant Sensitive Tree (Mimosa pigra) and Primrose-willows (Ludwigia spp.).
The Buitrago lagoon in the Chingaza National Natural Park in Colombia by Mario F. Mora Goyes. It is part of the most important reserves of the Andean Province that represents one of the unique ecosystems in the north of the tropical Andes: The Paramo. Species such as Sphagnum spp., a bamboo (Chusquea tessellata) and a giant palmlike daisy (Espeletia uribei) are part of the vegetation of the littoral zone of the lagoon. Espeletia uribei is the largest of the Aster family (Asteracea) growing to a height of 60 feet.
Black Mangrove or Mangle Negro (Avicennia germinans) in Laguan de Tacarigua National Park, Estado Miranda, Paez, Venezuela by Angel Huerta. Aerial roots are an example of negative geotropism.
WETLAND WILDLIFE
“Beauty in danger”, Spectacled Caiman (Caiman crocodilus) in Shushufindi, Ecuador by Sara Kreisel.
Carey turtles (Eretmochelys imbricata) enjoying a beautiful Mangrove of the Caribbean Sea, Rosario islands, Cartagena, Colombia by Paula Montoya.
Osprey (Pandion haliaetus ridgwayi) nesting in Red Mangrove (Rhizophora mangle), Sian Ka’an, Quintana Roo, Mexico by Alberto Alcántara.
Young Cattle Egret (Bubulcus ibis) in nest of Red Mangrove (Rhizophora mangle) on a small island near Chira Island in the Gulf of Nicoya, Costa Rica by Tanner Scholten.
Bare-throated Tiger-Heron (Tigrisoma mexicanum) perched on an artisanal fishing boat in the Rhizophora mangle-dominated mangroves of the Gulf of Nicoya, Costa Rica by Tanner Scholten.
Green Kingfisher (Chloroceryle americana) along the Sierpe River, Costa Rica by Tanner Scholten.
Basin Tree Frog (Boana lanciformis) in the ecological reserve Conservación Tingana in the Alto Mayo Protection Forest, San Martín, Perú by Alisa Aliaga Samanez.
WETLAND PLANTS
“Ahuehuete” or Montezuma Cypress (Taxodium mucronatum), Camécuaro Lake, Mexico by Paula Andrea Montoya.
Water Hyacinth (Pontederia crassipes), Ayapel, Colombia by Daniela Salazar Suaza.
Salzmann’s Mille-Graines (Oldenlandia salzmannii) along the shores of Limay River, Plottier City, Neuquén Province, Argentina by Adriel Ian Jocou.
Tea Mangrove or Mangle piñuelo (Pelliciera rhizophorea),Térraba-Sierpe National Wetland, Costa Rica by Julio César Chávez Barrera. It may be one of the rarest mangroves on Earth.
Sunset on Lake Chapala, Mismaloya, Jalisco, Mexico with California Bulrush (Schoenoplectus californicus) in the foreground by Efrain Noriega-Rico.
Listedbelow are some links to some random news articles that may be of interest. Links from past issues can be accessed on the SWS website news page. This section includes links to mostly newspaper articles that may be of interest. Members are encouraged to send links to articles about wetlands in their local area. Please send the links to WSP Editor at ralphtiner83@gmail.com and reference “Wetlands in the News” in the subject box. Thanks for your cooperation. For another source on the latest news about wetlands and related topics, readers are referred to the National Association of Wetland Managers website (formerly the Association of State Wetland Managers). Their “Wetland News Digest” includes links to government agency public notices and newspaper articles that should be of interest, especially dealing with wetland regulations, court cases, management, and threats: https://www.nawm.org/publications/wetland-news-digest.
Wetland Conservation Initiative
Jumping swamp creature with 8 yellow legs discovered in Botswana. It’s a new species
Expert report imagines possible futures for ecologically rich slice of Nova Scotia
Building a wetland on farm
What It Takes to Save the Axolotl Wild idea: Should we return the Caloosahatchee to its natural state?
How a thumb-sized climate migrant with a giant crab claw is disrupting the Northeast’s Great Marsh ecosystem Invasive flower threatens livelihoods of farmers, fishermen in war-torn Syria
Yancheng in E China’s Jiangsu makes innovation in wetland conservation
Wetland restored at Cottonwood Creek in Encinitas.
Part of sea wall removed to help Northey Island saltmarsh Movement to give ‘nature’ same rights as humans gains steam in US
‘Take It Down and They’ll Return’: The Stunning Revival of the Penobscot River
New study sheds light on how much methane is produced from Arctic lakes and wetlands
Peatlands were drained for agriculture. Now researchers are trying to restore them
Beavers Have Engineered Ecosystems in the Tetons for Millennia
A Historic Release Of Wildlife
Orphaned beavers released in rewilding project
Wetlands to be restored, protected for our community
Twenty-five acre farm in Delaware begins its transition to a multi-habitat wetland
In Pictures: Vast wetlands and habitat for migratory birds on the verge of destruction due to gov’t San Tin tech hub
Climate Change Threatens the Future of Wild Rice
Ocean Warming Is Wiping Out Southern California’s Mussel Beds
The Great Sediment Shortfall: Why Rivers Can’t Rescue Coastal Wetlands
Wetlands are at the heart of solving the biggest global challenge of our time
Spanish minister hails deal to save Andalucía wetlands as a model for green transition
The fish that eats piranhas for breakfast
Rescuing axolotls in Mexico: Meet Jesús Correa Rangel
Orange County’s new wetlands ordinance aims to protect ‘Earth’s kidneys’
Understanding the Distribution and Ecology of Forested Ephemeral Wetlands
Suncor plans to pump 1 billion barrels of oil from a wetland — but vows to protect the other half with a wall
Governor Holcomb dedicates over 100 acres of wetland in Noble County
DUCKS UNLIMITED RECEIVES SUPPORT FROM USDA FOR KANSAS NEBRASKA WETLAND INITIATIVE
Roman water management impacted the hydrological functioning of wetlands during drought periods
Scientists map loss of groundwater storage around the world
Roadside Attraction: A coastal project hugs the I-10 west of Kenner
Marlborough Bay Meadow nature reserve opens to public Great Salt Lake trust issues $8.5M to 8 projects seeking to protect lake’s wetlands
Pakistan is planting lots of mangrove forests. So why are some upset?
Texas family rejects millions for their property and does something remarkable with it instead: ‘I’m just very grateful’
Listedbelow are some wetland books that have come to our attention over the years. Please help us add new books and major reports to this listing. If your agency, organization, or institution has published new publications on wetlands, please send the information to Editor of Wetland Science & Practice at ralphtiner83@gmail.com. Your cooperation is appreciated.
BOOKS
• History of Wetland Science: A Perspective from Wetland Leaders
• An Introduction to the Aquatic Insects of North America (5th Edition)
• Wading Right In: Discovering the Nature of Wetlands
• Sedges of Maine
• Sedges and Rushes of Minnesota
• Wetland & Stream Rapid Assessments: Development,Validation, and Application
• Eager: The Surprising Secret Life of Beavers and Why They Matter
• Wetland Indicators – A Guide to Wetland Formation, Identification, Delineation, Classification, and Mapping
• Wetland Soils: Genesis, Hydrology, Landscapes, and Classification
• Creating and Restoring Wetlands: From Theory to Practice
• Salt Marsh Secrets. Who uncovered them and how?
• Remote Sensing of Wetlands: Applications and Advances.
SWS JOURNAL
What’s New in the SWS Journal- WETLANDS?
• Wetlands (5th Edition).
• Black Swan Lake – Life of a Wetland
• Coastal Wetlands of the World: Geology, Ecology, Distributionand Applications
• Florida’s Wetlands
• Mid-Atlantic Freshwater Wetlands: Science, Management,Policy, and Practice
• The Atchafalaya River Basin: History and Ecology of an American Wetland
• Tidal Wetlands Primer: An Introduction to their Ecology, Natural History, Status and Conservation
• Wetland Landscape Characterization: Practical Tools, Methods, and Approaches for Landscape Ecology
• Wetland Techniques (3 volumes)
• Wildflowers and Other Plants of Iowa Wetlands
• Wetland Restoration: A Handbook for New Zealand Freshwater Systems
• Wetland Ecosystems
• Constructed Wetlands and Sustainable Development
• Tussock Sedge: A Wetland Superplant
• Waubesa Wetlands: New Look at an Old Gem
The following articles appear in Volume 43, issue 6 of WETLANDS, journal for the Society of Wetland Scientists.
Connecting Wetland Flooding Patterns to Insect Abundance Using High-Resolution Inundation Frequency Data
Phosphorus Fluxes in a Restored Carolina Bay Wetland Following Eight Years of Restoration
Knowledge of Spawning Phenology may Enhance Selective Barrier Passage for Wetland Fishes
Revisiting hydro-ecological impacts of climate change on a restored floodplain wetland via hydrological / hydraulic modelling and the UK Climate Projections 2018 scenarios
Seasonal Sediment Dynamics in a Constructed and Natural Tidal Marsh in the Northern Gulf of Mexico
The Relationship Between the Establishment of Aquatic Macrophytes and the Death of Mangroves in a South American Estuary: New Assessments of a Serious Environmental Problem
Temperature and Precipitation Trends of the Shoulder Seasons at Polar Bear Pass (Nanuit Itillinga) – A Ramsar Wetland of Importance, Nunavut
Morphoanatomical Analysis and Diversity of Andean Urban Wetland seed Banks: A tool for Ecological Rehabilitation
Assessing Nutrient Assimilation by Wetland Impoundments Across Environmental Gradients
About Wetland Science & Practice (WSP)
Wetland Science and Practice (WSP) is the SWS quarterly publication aimed at providing information on select SWS activities (technical committee summaries, chapter workshop overview/abstracts, and SWS-funded student activities), articles on ongoing or recently completed wetland research, restoration, or management projects, freelance articles on the general ecology and natural history of wetlands, and highlights of current events. The July issue is typically dedicated to publishing the proceedings of our annual conference. WSP also serves as an outlet for commentaries, perspectives and opinions on important developments in wetland science, theory, management and policy. Both invited and unsolicited manuscripts are reviewed by the WSP editor for suitability for publication. When deemed necessary or upon request, some articles are subject to scientific peer review. Student papers are welcomed. Please see publication guidelines herein. Electronic access to Wetland Science and Practice is included in your SWS membership. All issues published, except the current issue, are available via the internet to the general public. The current issue is only available to SWS members; it will be available to the public four months after its publication when the next issue is released (e.g., the January 2022 issue will be an open access issue in April 2022). WSP is an excellent choice to convey the results of your projects or interest in wetlands to others. Also note that as of January 2021, WSP will publish advertisements, contact info@sws. org for details.
HOW YOU CAN HELP
If you read something you like in WSP, or that you think someone else would find interesting, be sure to share. Share links to your Facebook, Twitter, Instagram and LinkedIn accounts.
Make sure that all your SWS colleagues are checking out our recent issues, and help spread the word about SWS to non-members!
Questions? Contact editor Ralph Tiner, PWS Emeritus (ralphtiner83@gmail.com).
WSP Manuscript – General Guidelines
LENGTH:
Approximately 5,000 words; can be longer if necessary.
STYLE:
See existing articles from 2014 to more recent years available online at: https://members.sws.org/wetland-science-and-practice Standard format/outline for articles: Title, authors (affiliations and correspondence author email in footnotes), followed by Abstract, then Text (e.g., Introduction, Methods, Results, Discussion, and Conclusion), and ending with References. All articles must have an abstract.
TEXT:
Word document, 12 font, Times New Roman, single-spaced; keep tables and figures separate, although captions can be included in text. For reference citations in text use this format: (Smith 2016; Jones and Whithead 2014; Peterson et al. 2010). Do not perform formatting (e.g., capitalization of headings and subheadings). Do not indent paragraphs…just separate paragraphs by lines.
FIGURES:
Please include color images and photos of subject wetland(s) as WSP is a full-color e-publication. Image size should be less than 1MB; 500KB may work best for this e-publication. Figures should be original (not published elsewhere) or in the public domain. If figure was published elsewhere (copyrighted), it is the responsibility of the author to secure permission for use. Be sure to provide proper credit in the caption.
Reference Citation Examples
• Claus, S., S. Imgraben, K. Brennan, A. Carthey, B. Daly, R. Blakey, E. Turak, and N. Saintilan. 2011. Assessing the ex-tent and condition of wetlands in NSW: Supporting report A – Conceptual framework, Monitoring, evaluation and re-porting program, Technical report series, Office of Environ-ment and Heritage, Sydney, Australia. OEH 2011/0727.
• Clements, F.E. 1916. Plant Succession: An Analysis of the Development of Vegetation. Carnegie Institution of Washington. Washington D.C. Publication 242.
• Colburn, E.A. 2004. Vernal Pools: Natural History and Conservation. McDonald & Woodward Publishing Company, Blacksburg, VA.
• Cole, C.A. and R.P. Brooks. 2000. Patterns of wetland hydrology in the Ridge and Valley Province, Pennsylvania, USA. Wetlands 20: 438-447.
Please be sure to add the doi link to citations where possible.
If you have questions, please contact the editor, Ralph Tiner at ralphtiner83@gmail.com
2024 Advertising Prospectus
Monthly Newsletter
The SWS monthly newsletter is sent to approximately 3,000 members around the world, and enjoys an open rate between 40-50%, which is well above industry average. Place your organization in front of leading environmental scientists monthly with an ad that links to your website.
Price (per ad)
• Ad Format: .jpeg or .png
• Ad Due Date: Artwork and link URL due on the first of the month in which the ad is to run.
• Distribution Date: On or around the 15th of each month
The SWS website boasts nearly 200 daily visitors annually and is a user-friendly, engaging, and SEO optimized format. By purchasing ad space on sws.org, you will increase the visibility of your product or service directly to our audience of wetland professionals, academics, and other science-based fields that will benefit the most from what your company has to offer. Quarter 1
• Ad Due Date: Artwork and link URL due one week prior to beginning run date
• Ad Begin Date: Ad uploaded the first day of the first month of the quarter
WSP is the SWS quarterly publication aimed at providing information on select SWS activities (technical committee summaries, chapter and section workshop overview/abstracts, and SWS-funded student activities); brief summary articles on current or recently completed wetland research, restoration, or management projects; information on the general ecology and natural history of wetlands; and highlights of current events. It is distributed digitally, with over 2,000 impressions and more than 300 reads in the first six months after release.
• Ad Format: Press quality .pdf with images rendered at 300 or higher dpi
• Ad Due Date: Artwork is due on the 15th of the month prior to the month of publication
• Distribution Date: WSP is published on or around the middle of the month of publication
Coastal Wetlands of the Wilderness Lakes System, South Africa, Photographed by Douglas Macfarlane.