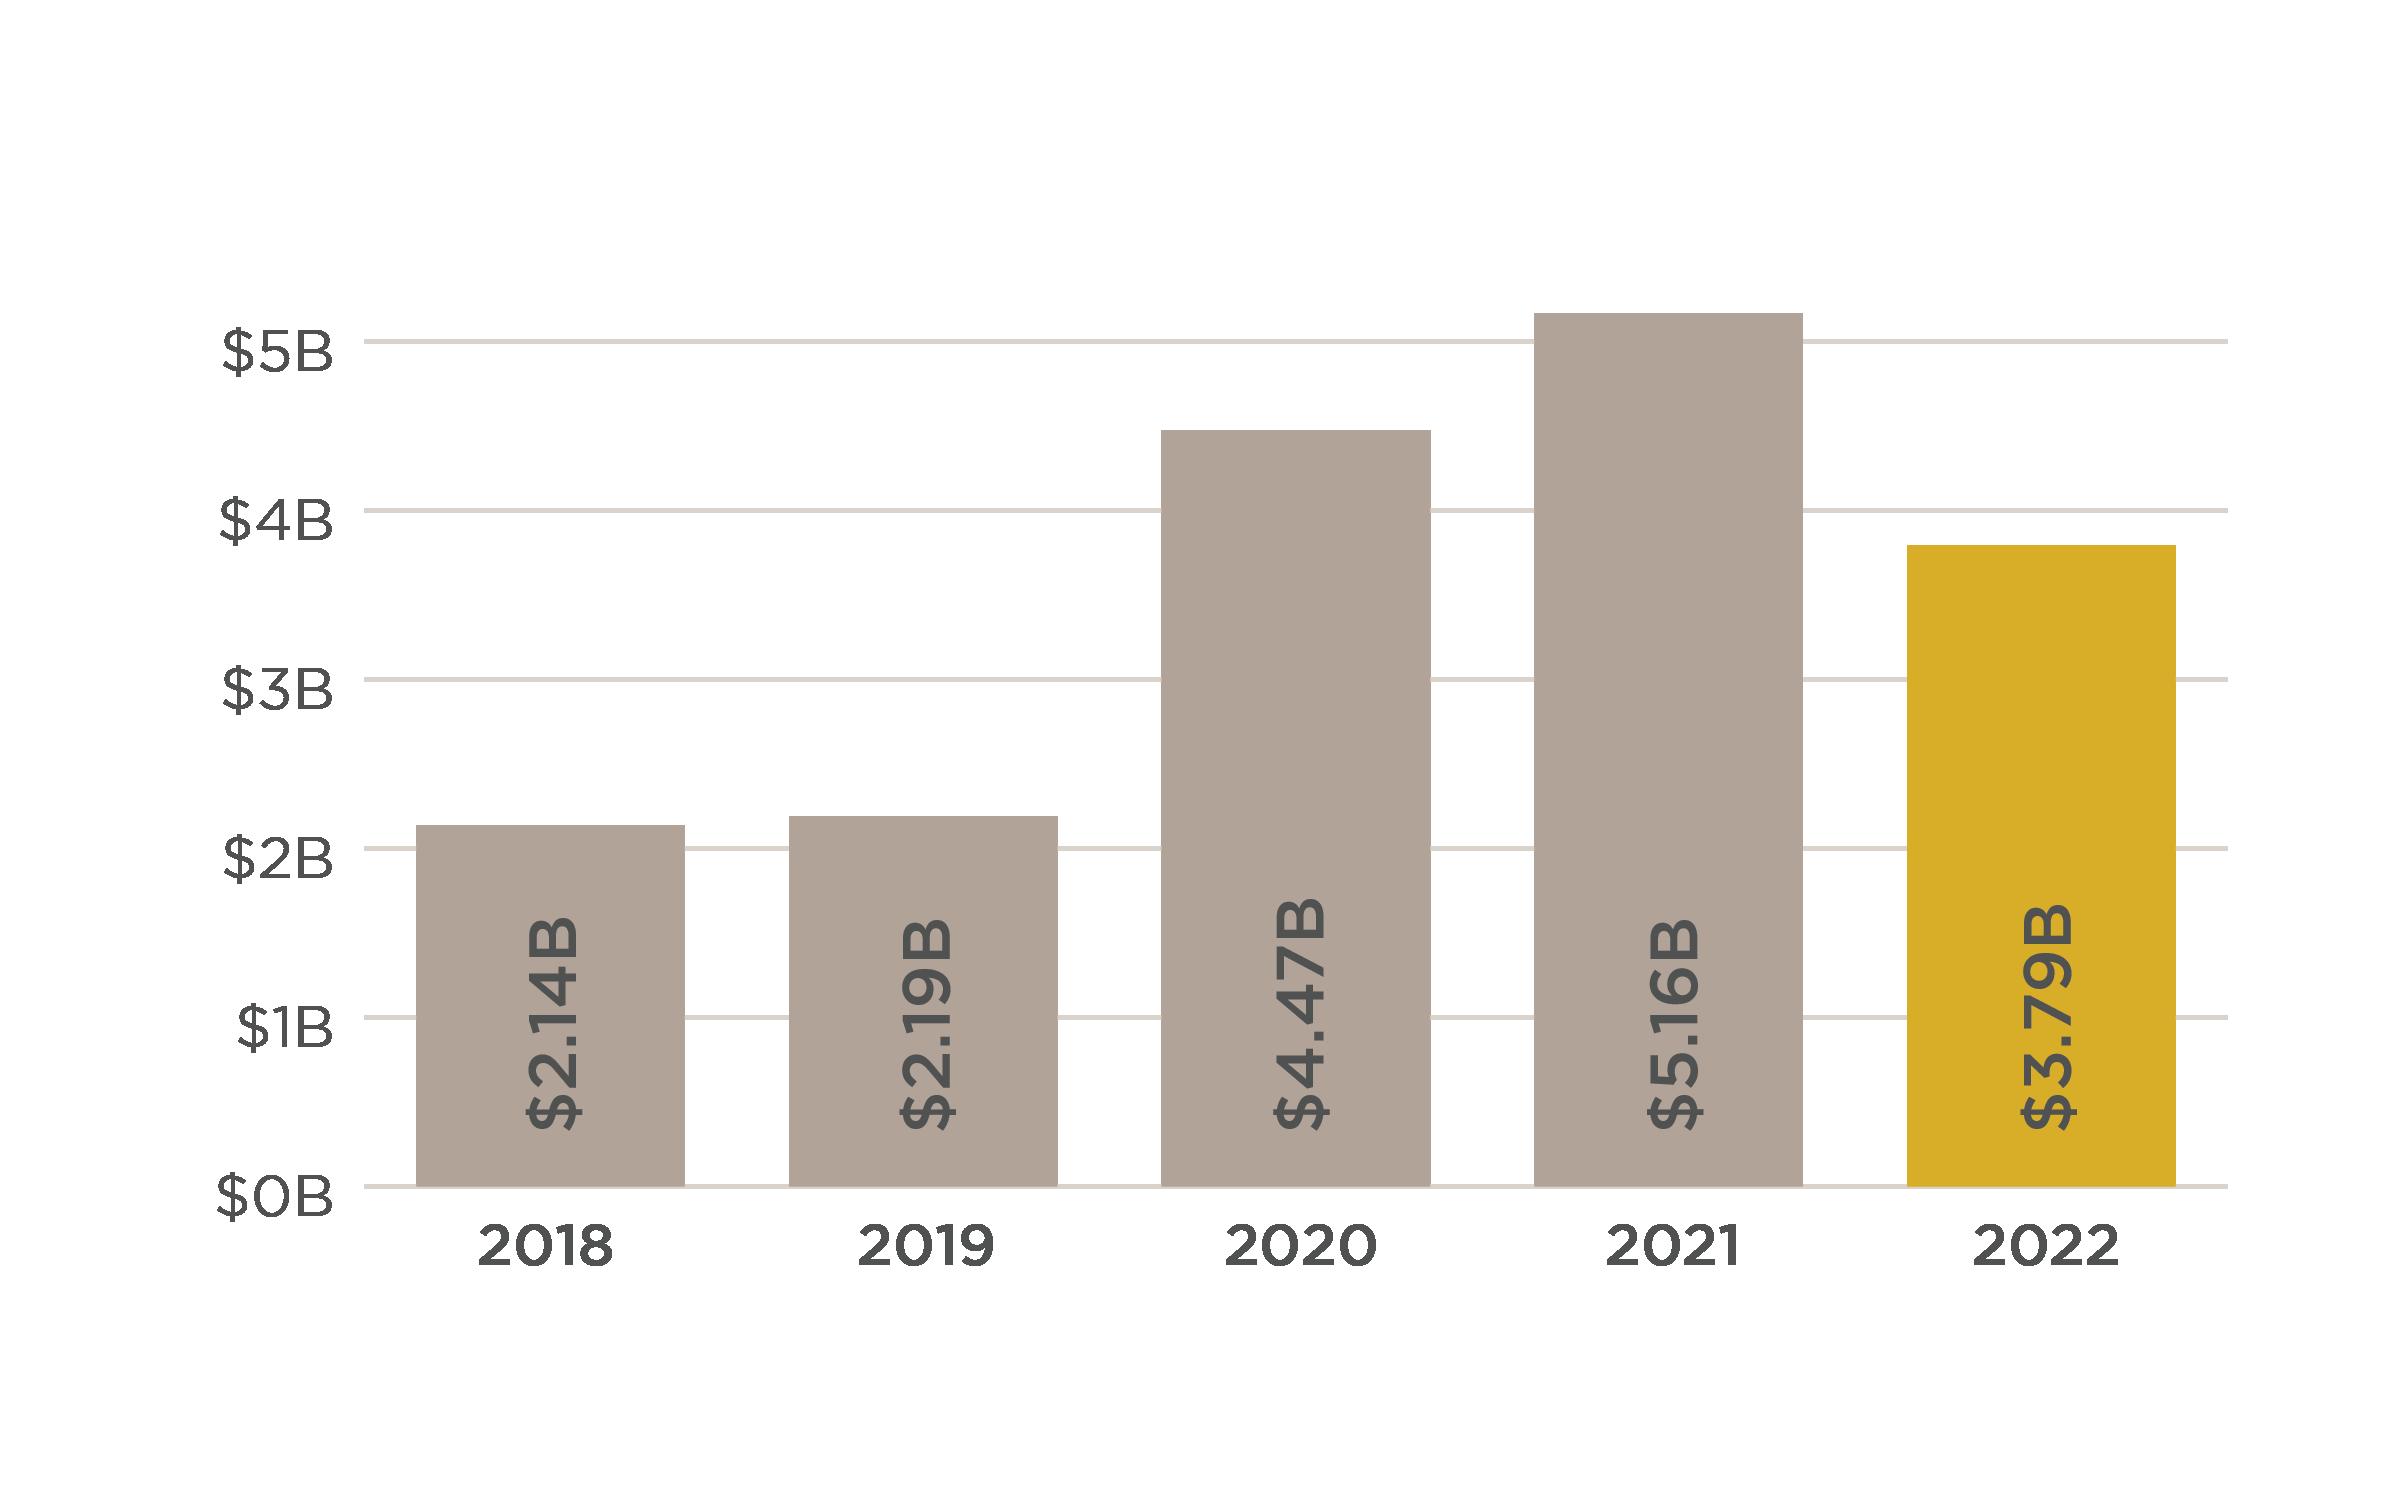
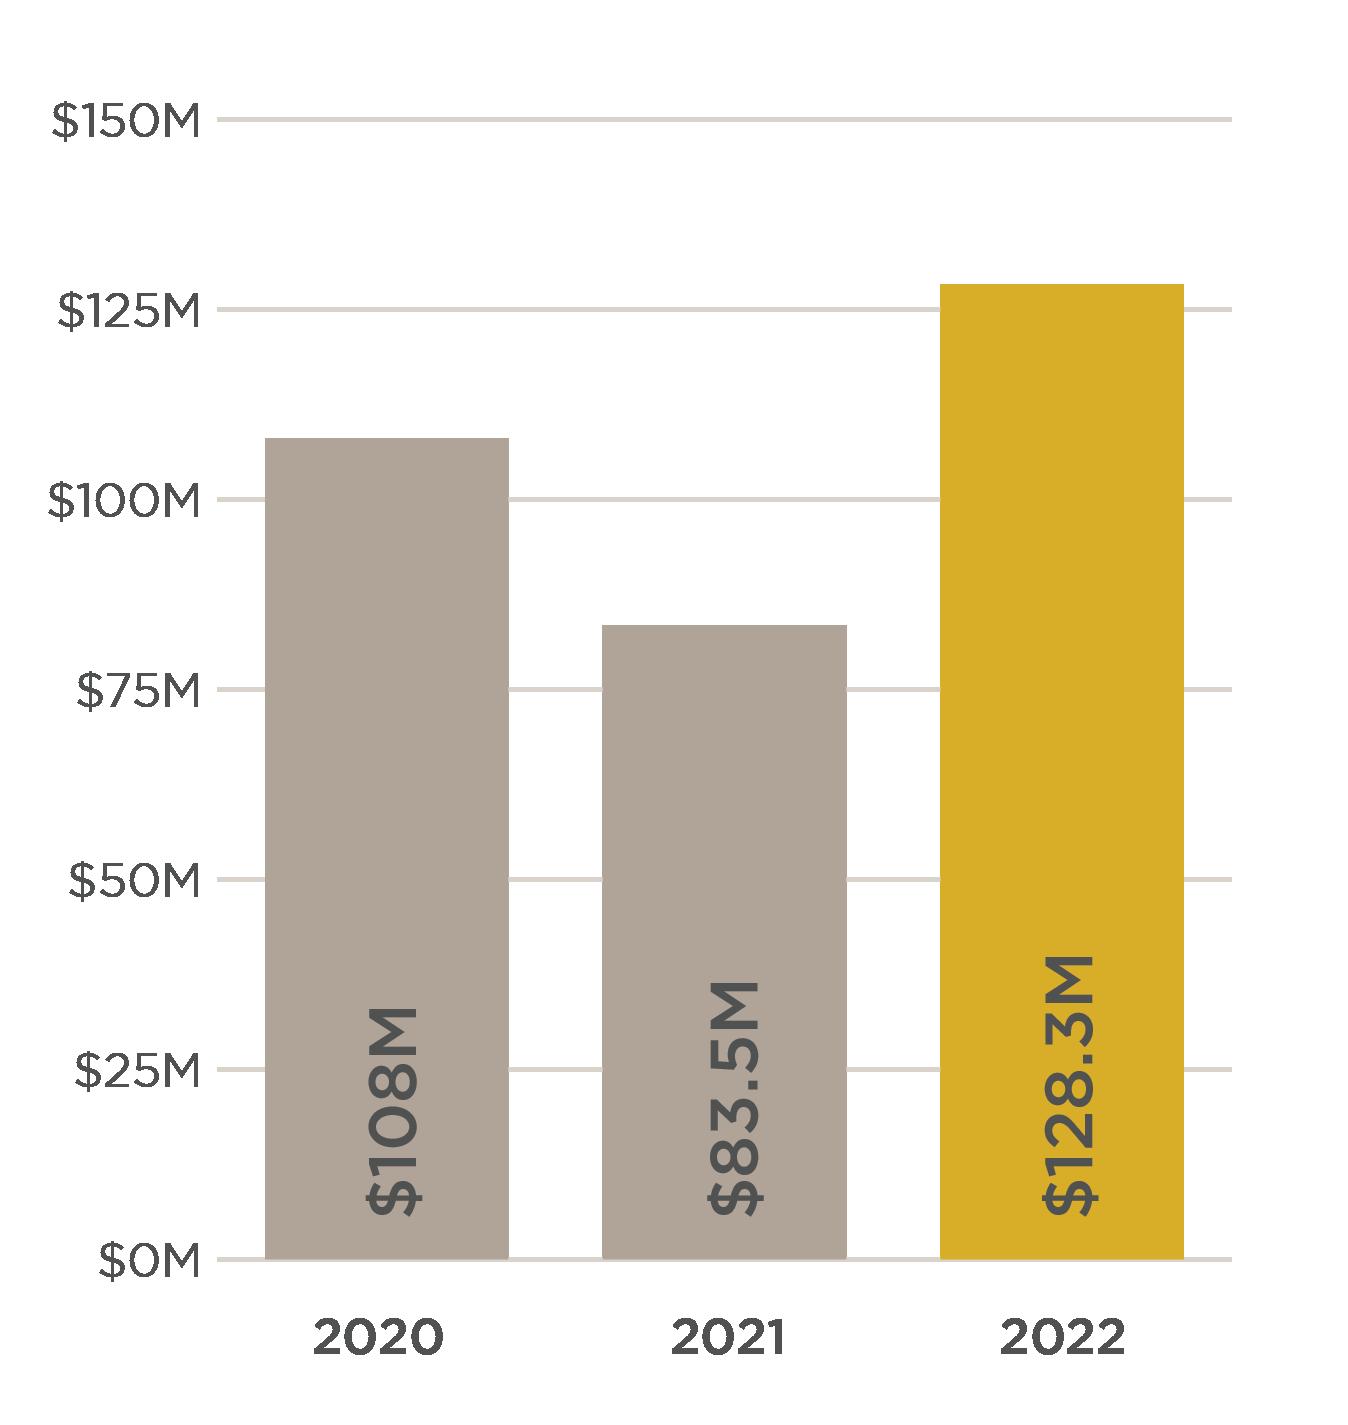
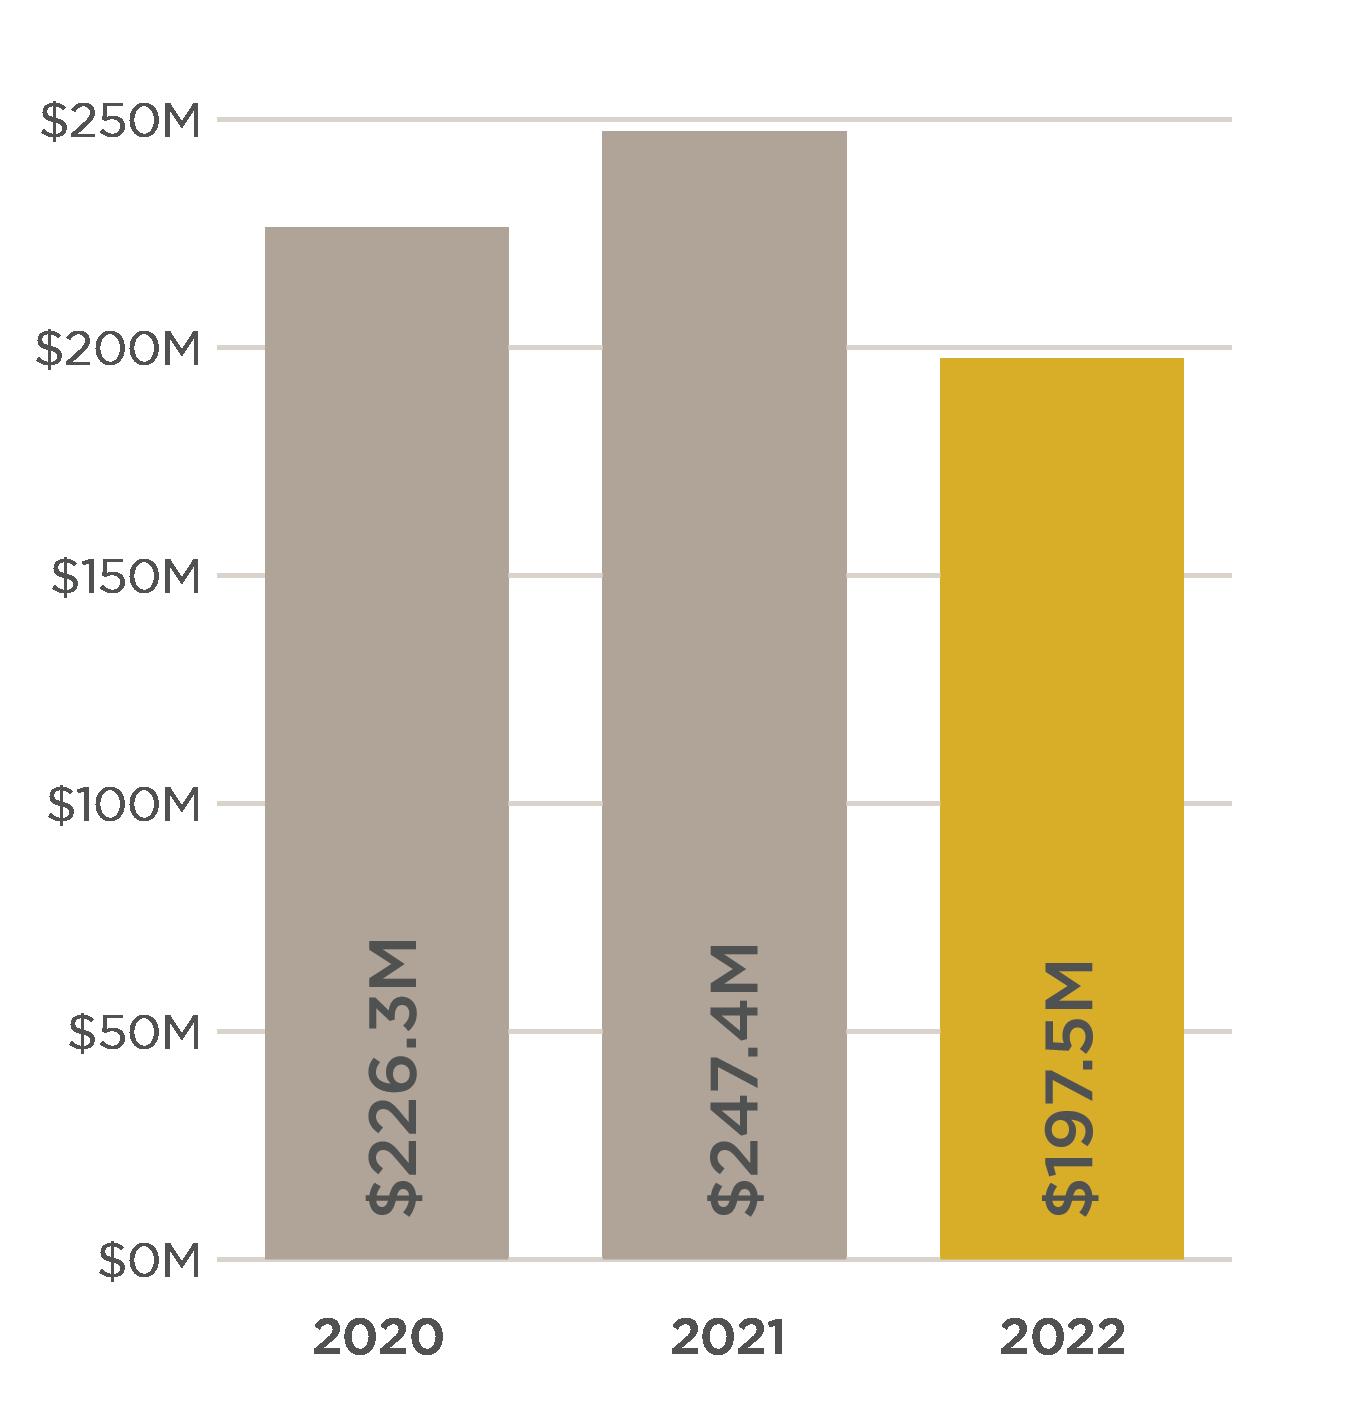
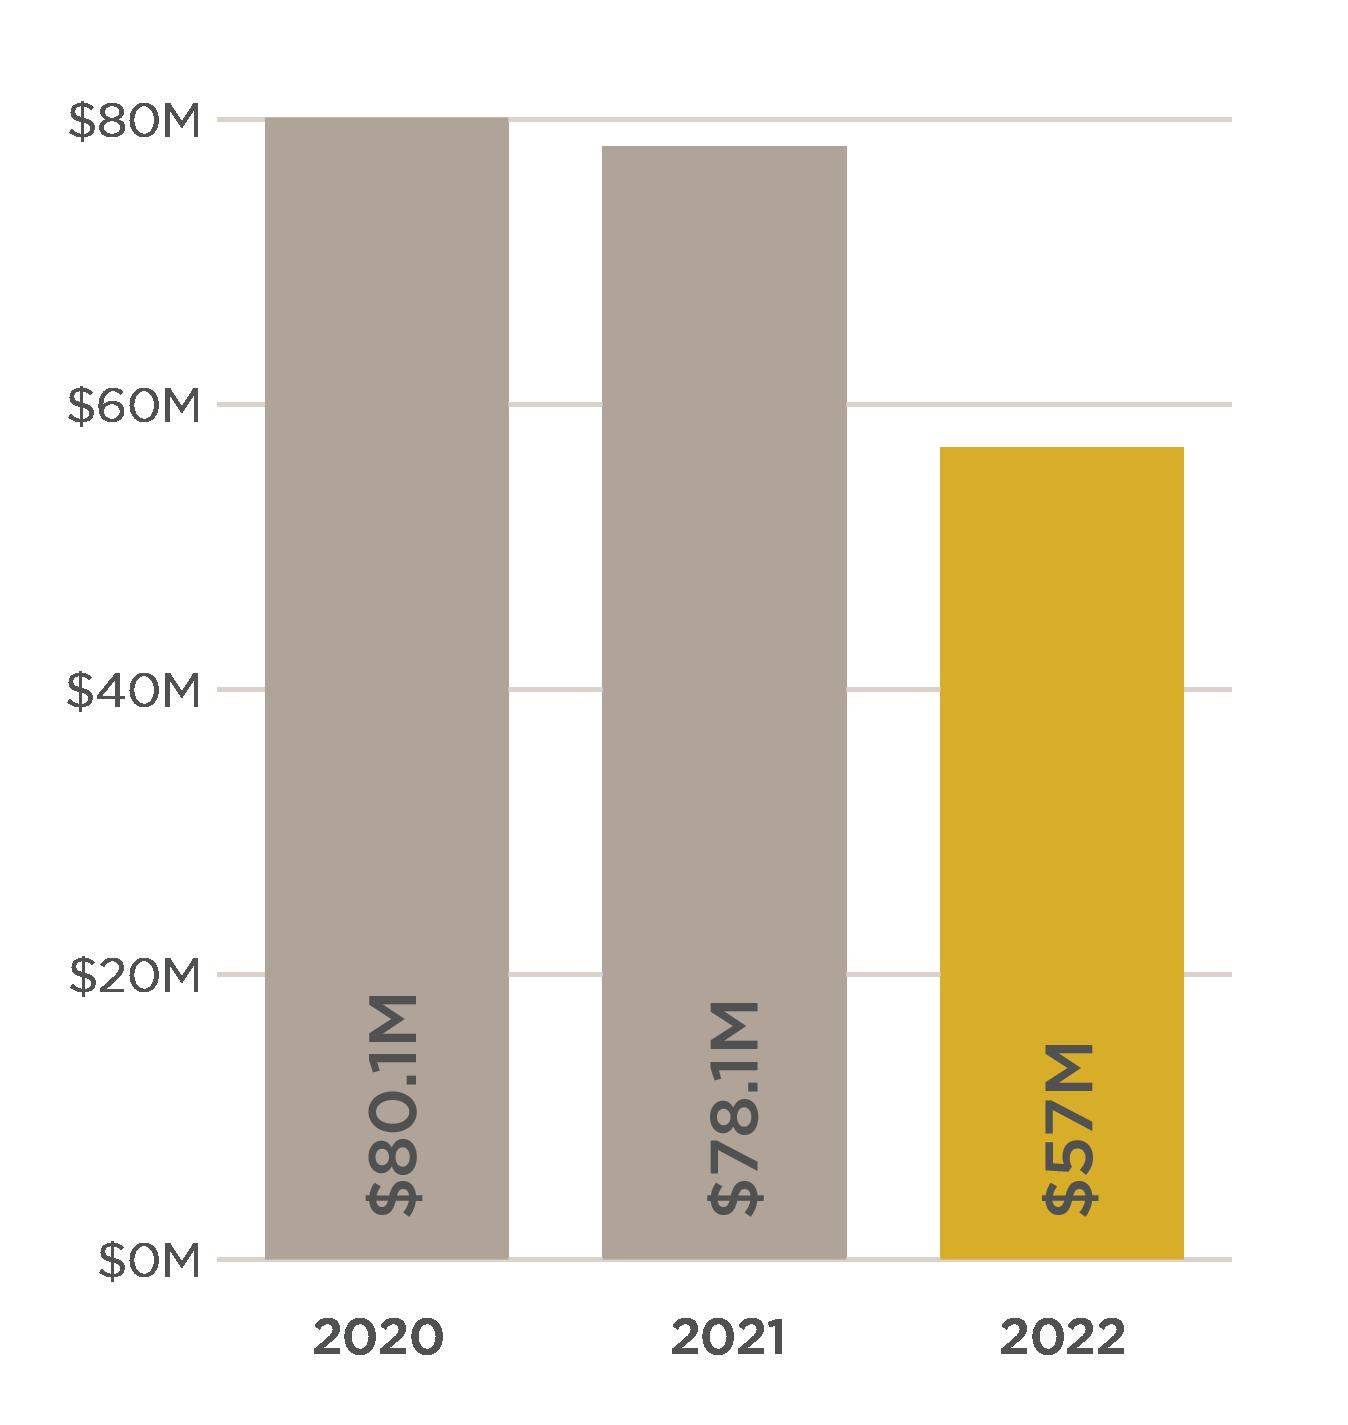
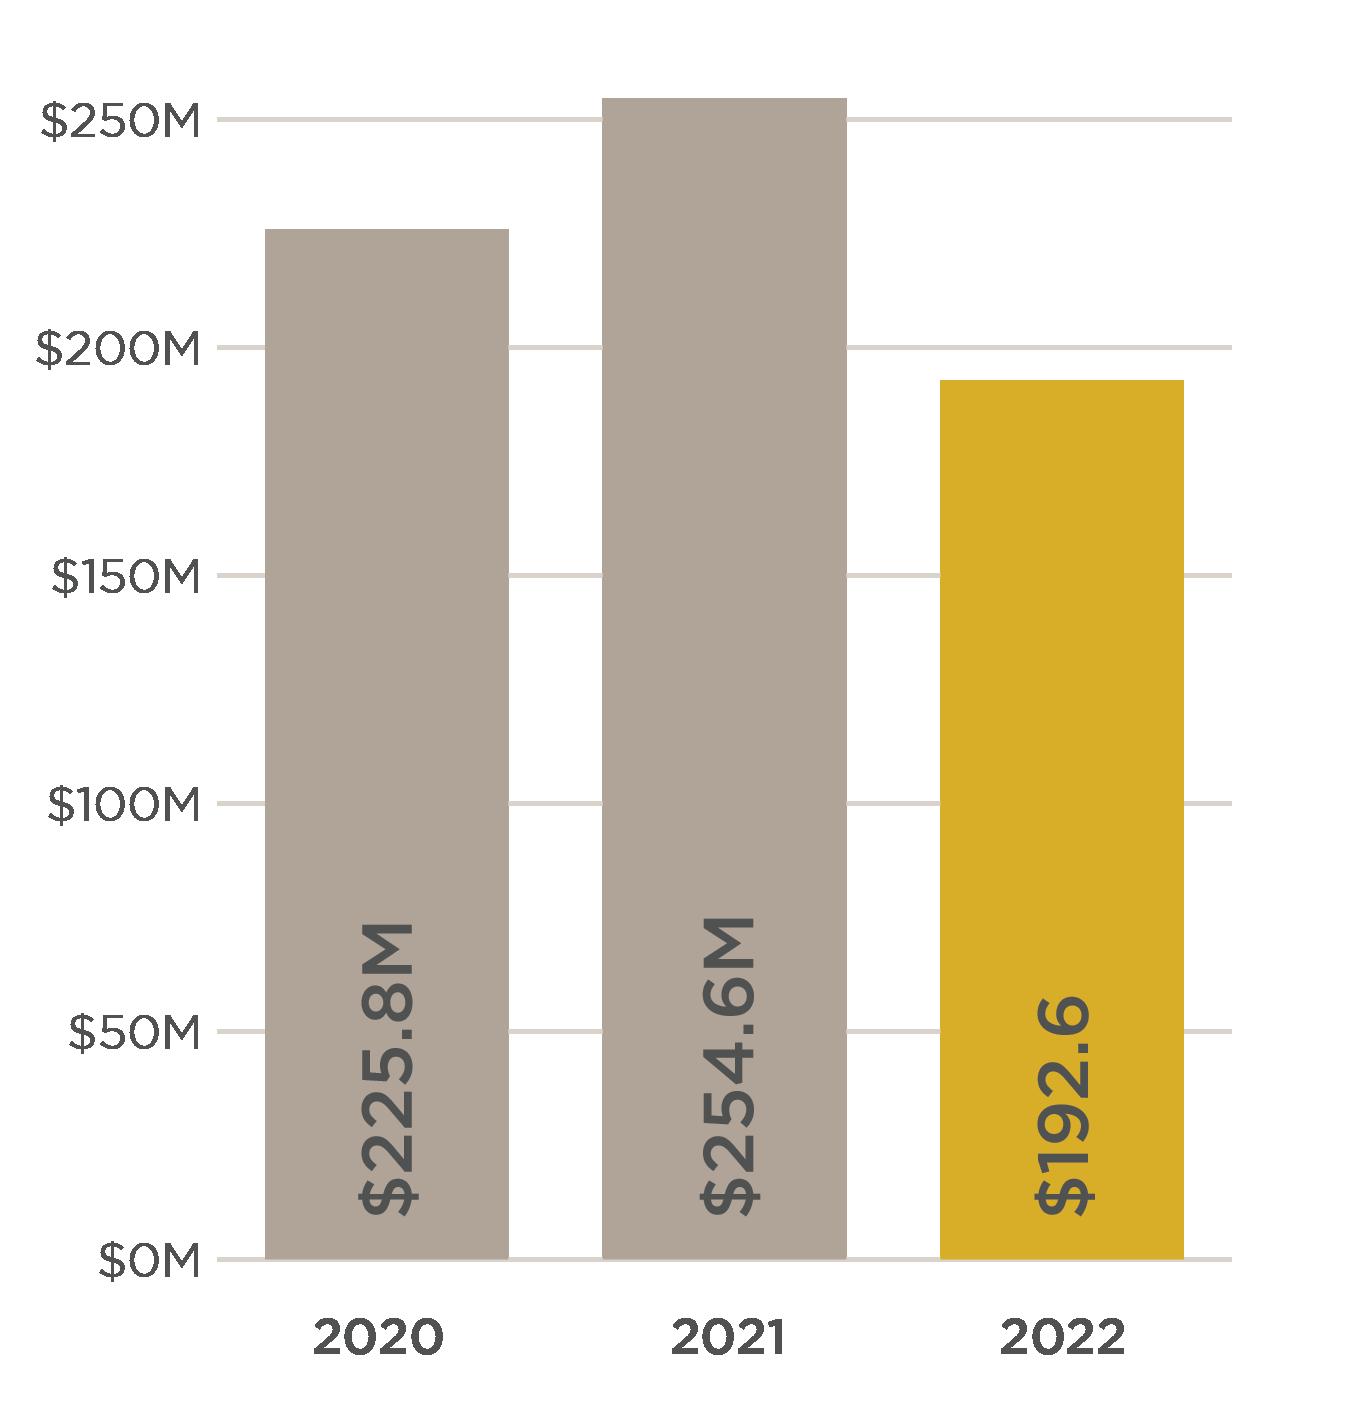
COMMERCIAL & LAND OVERVIEW
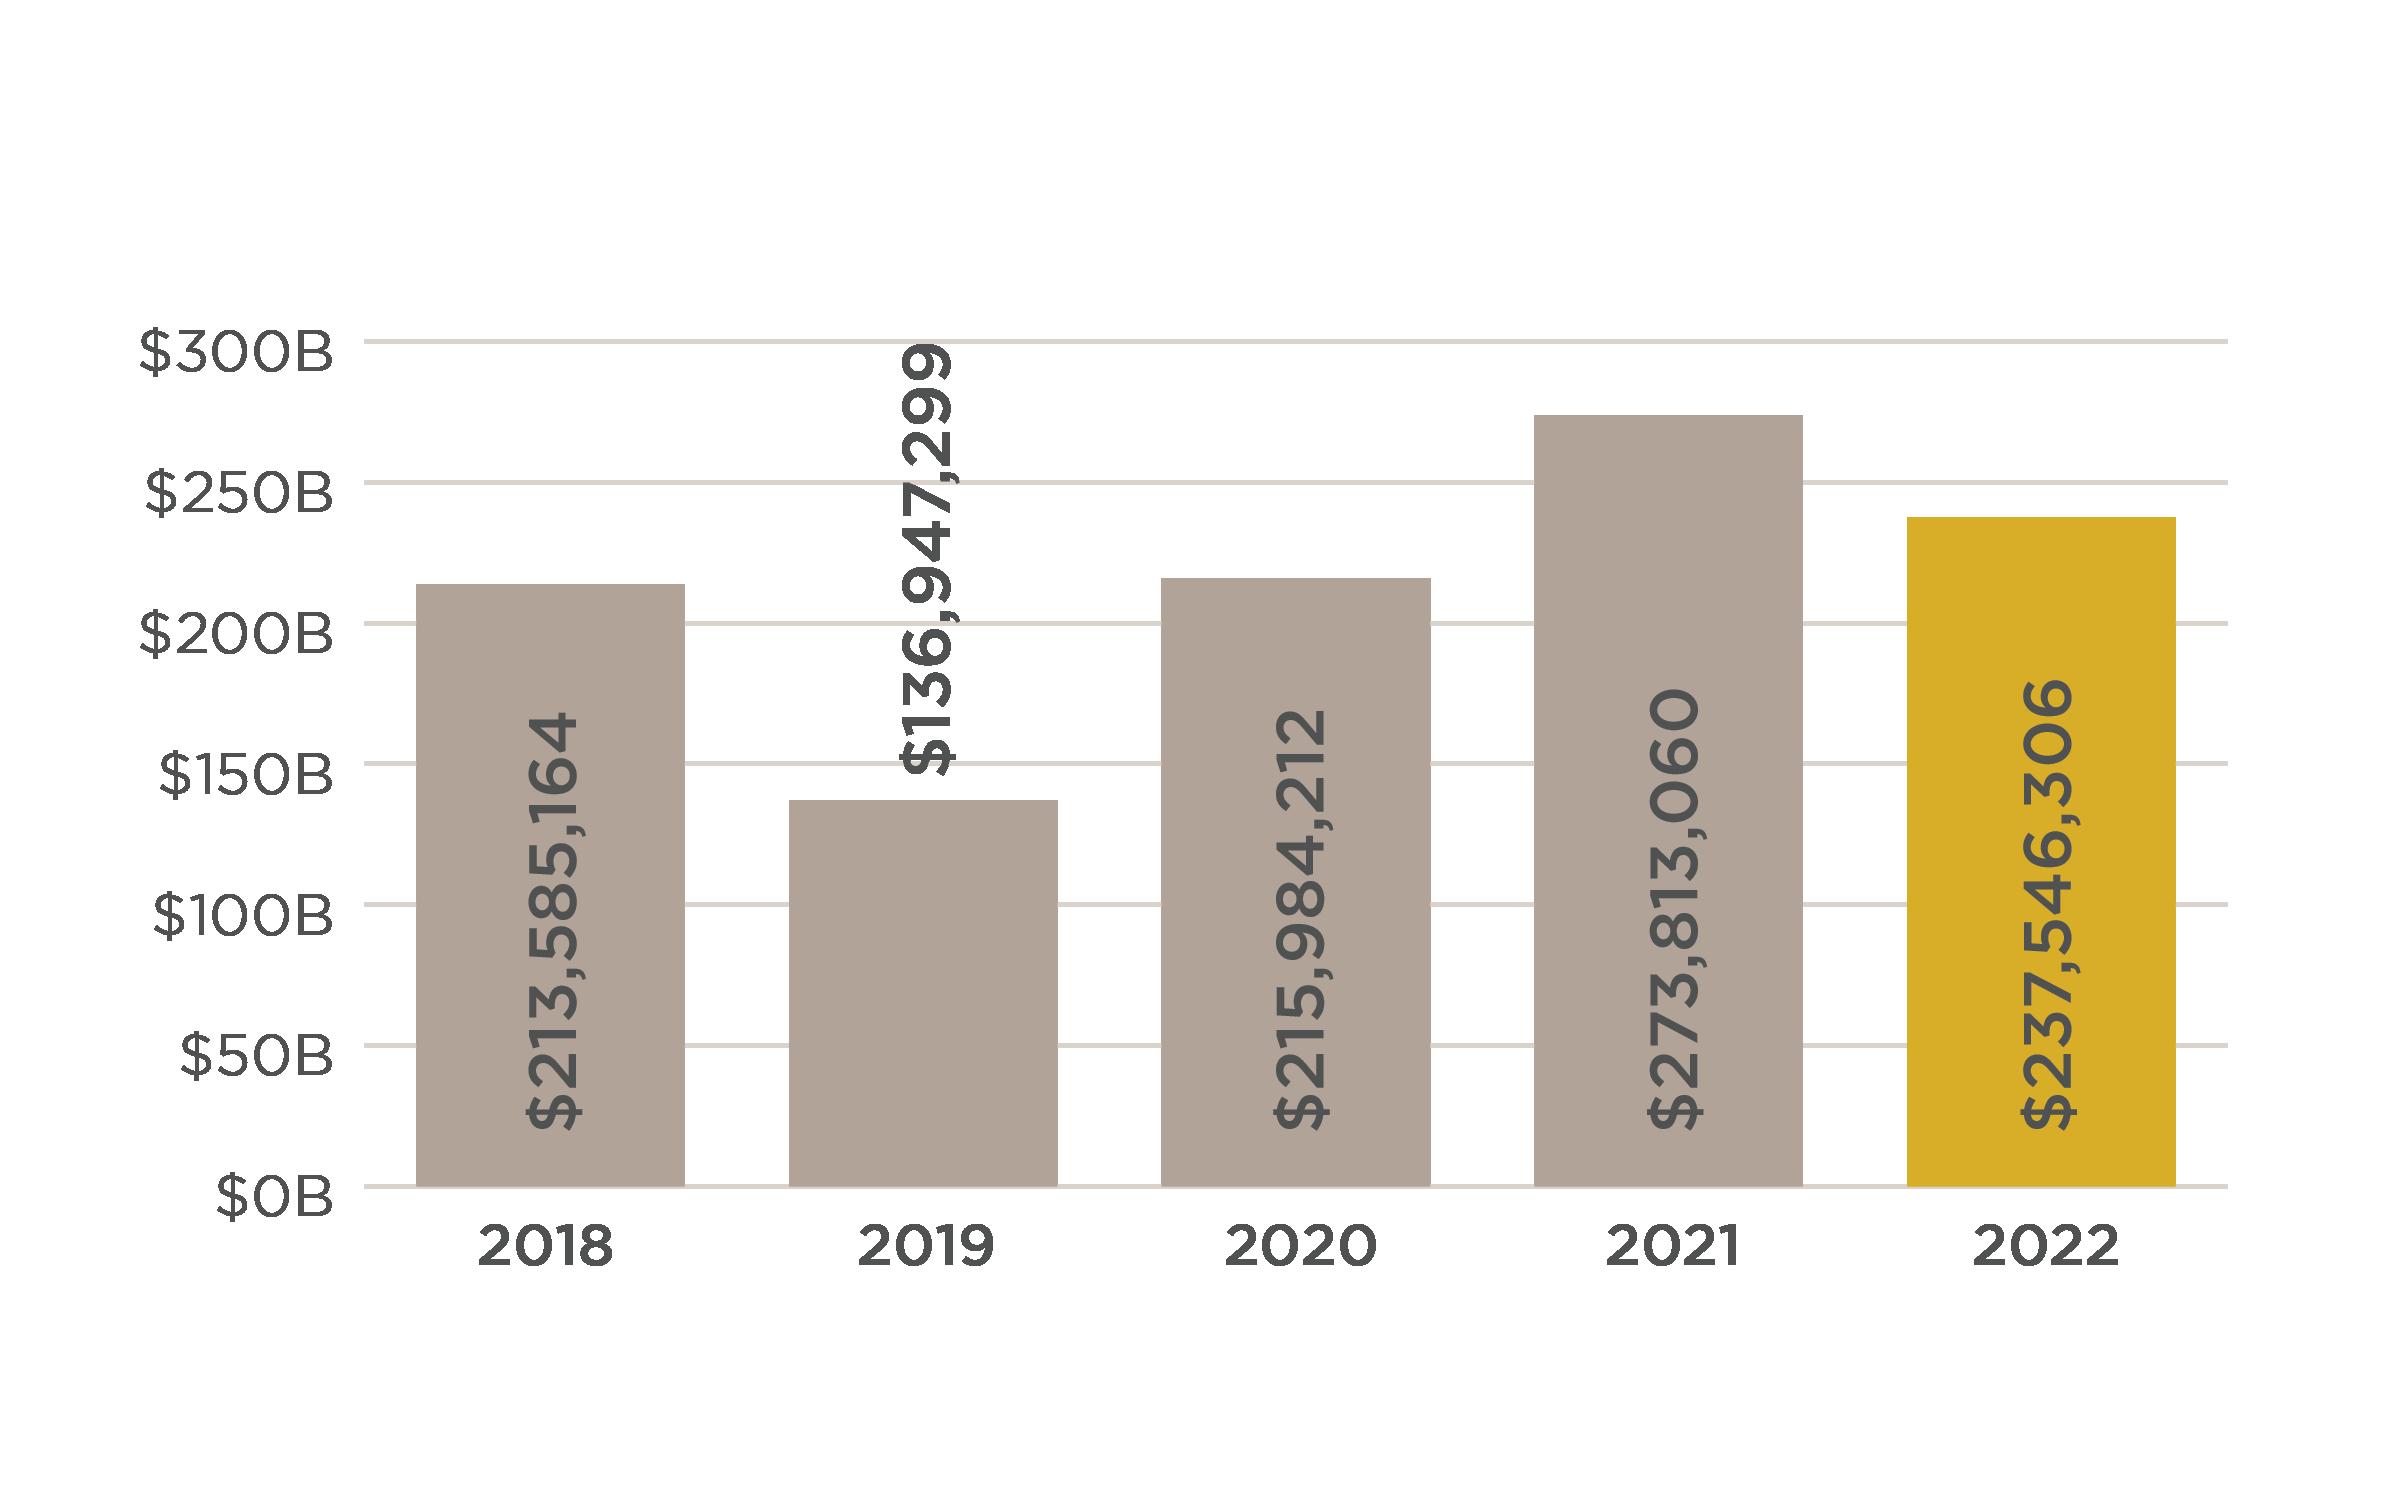
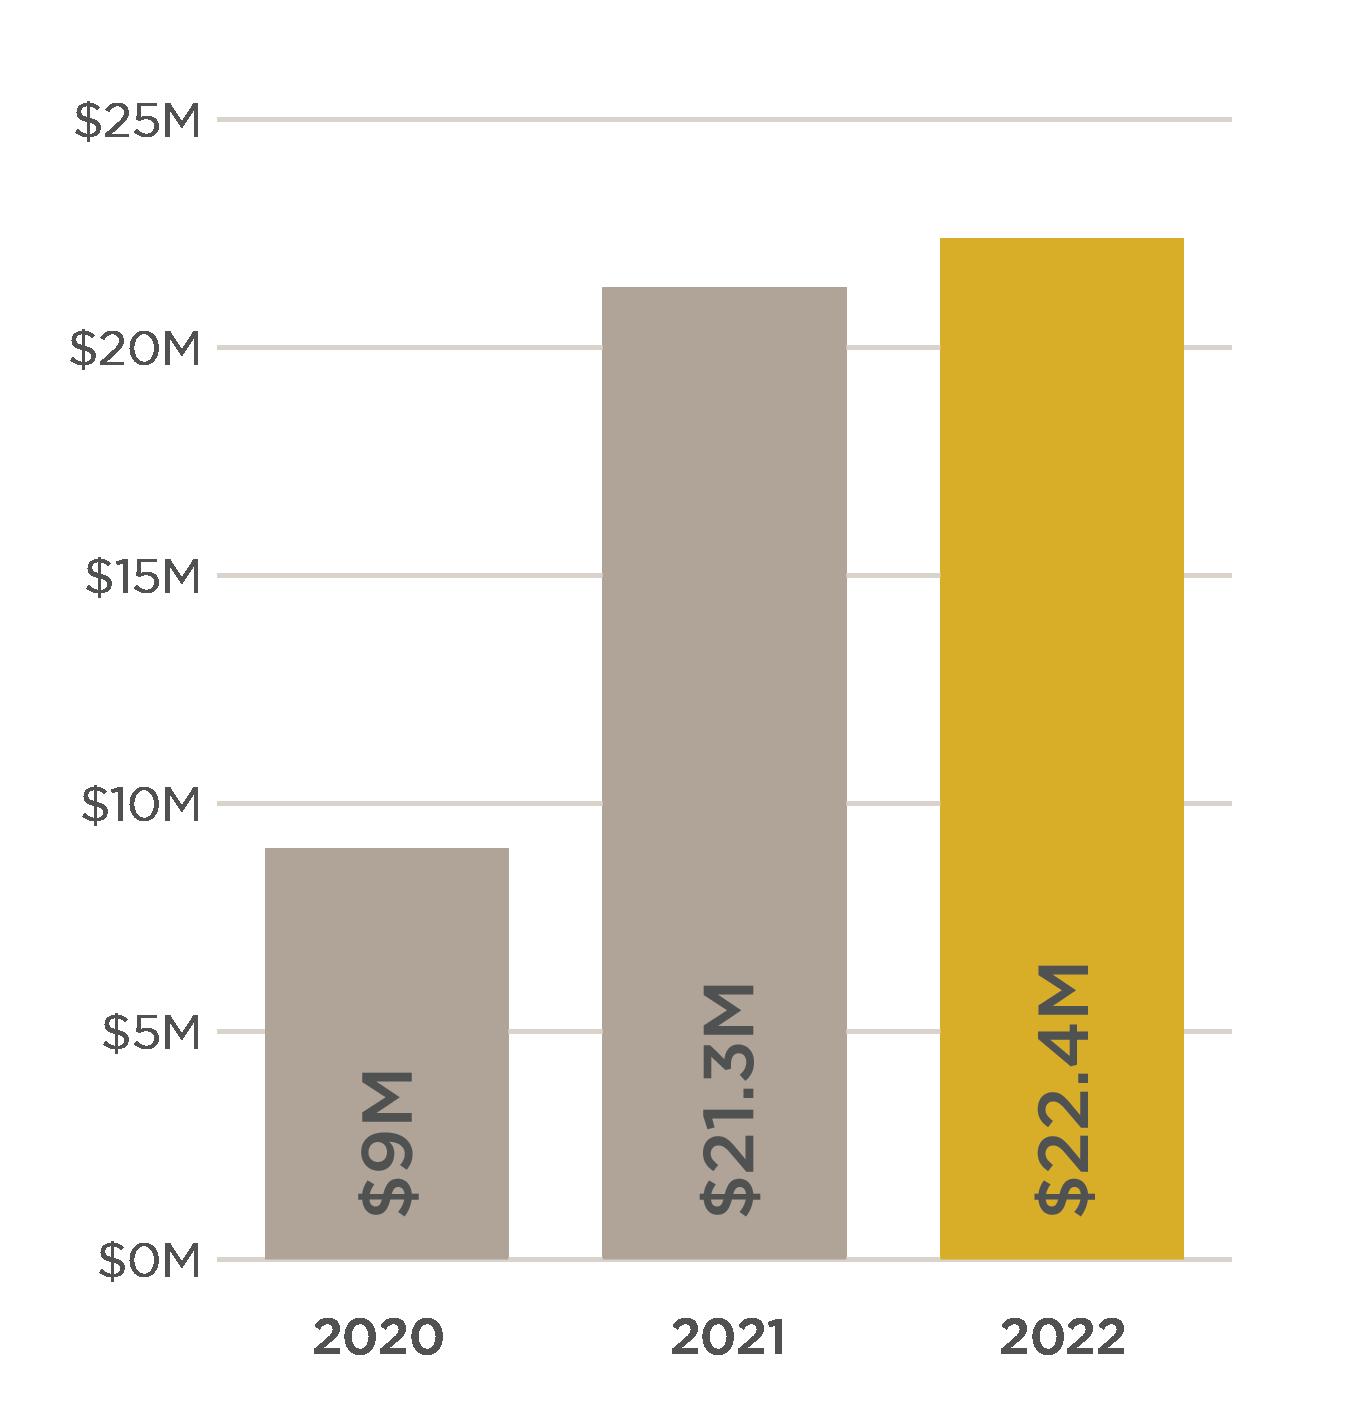
COMMERCIAL SALES VOLUME COMPARISON
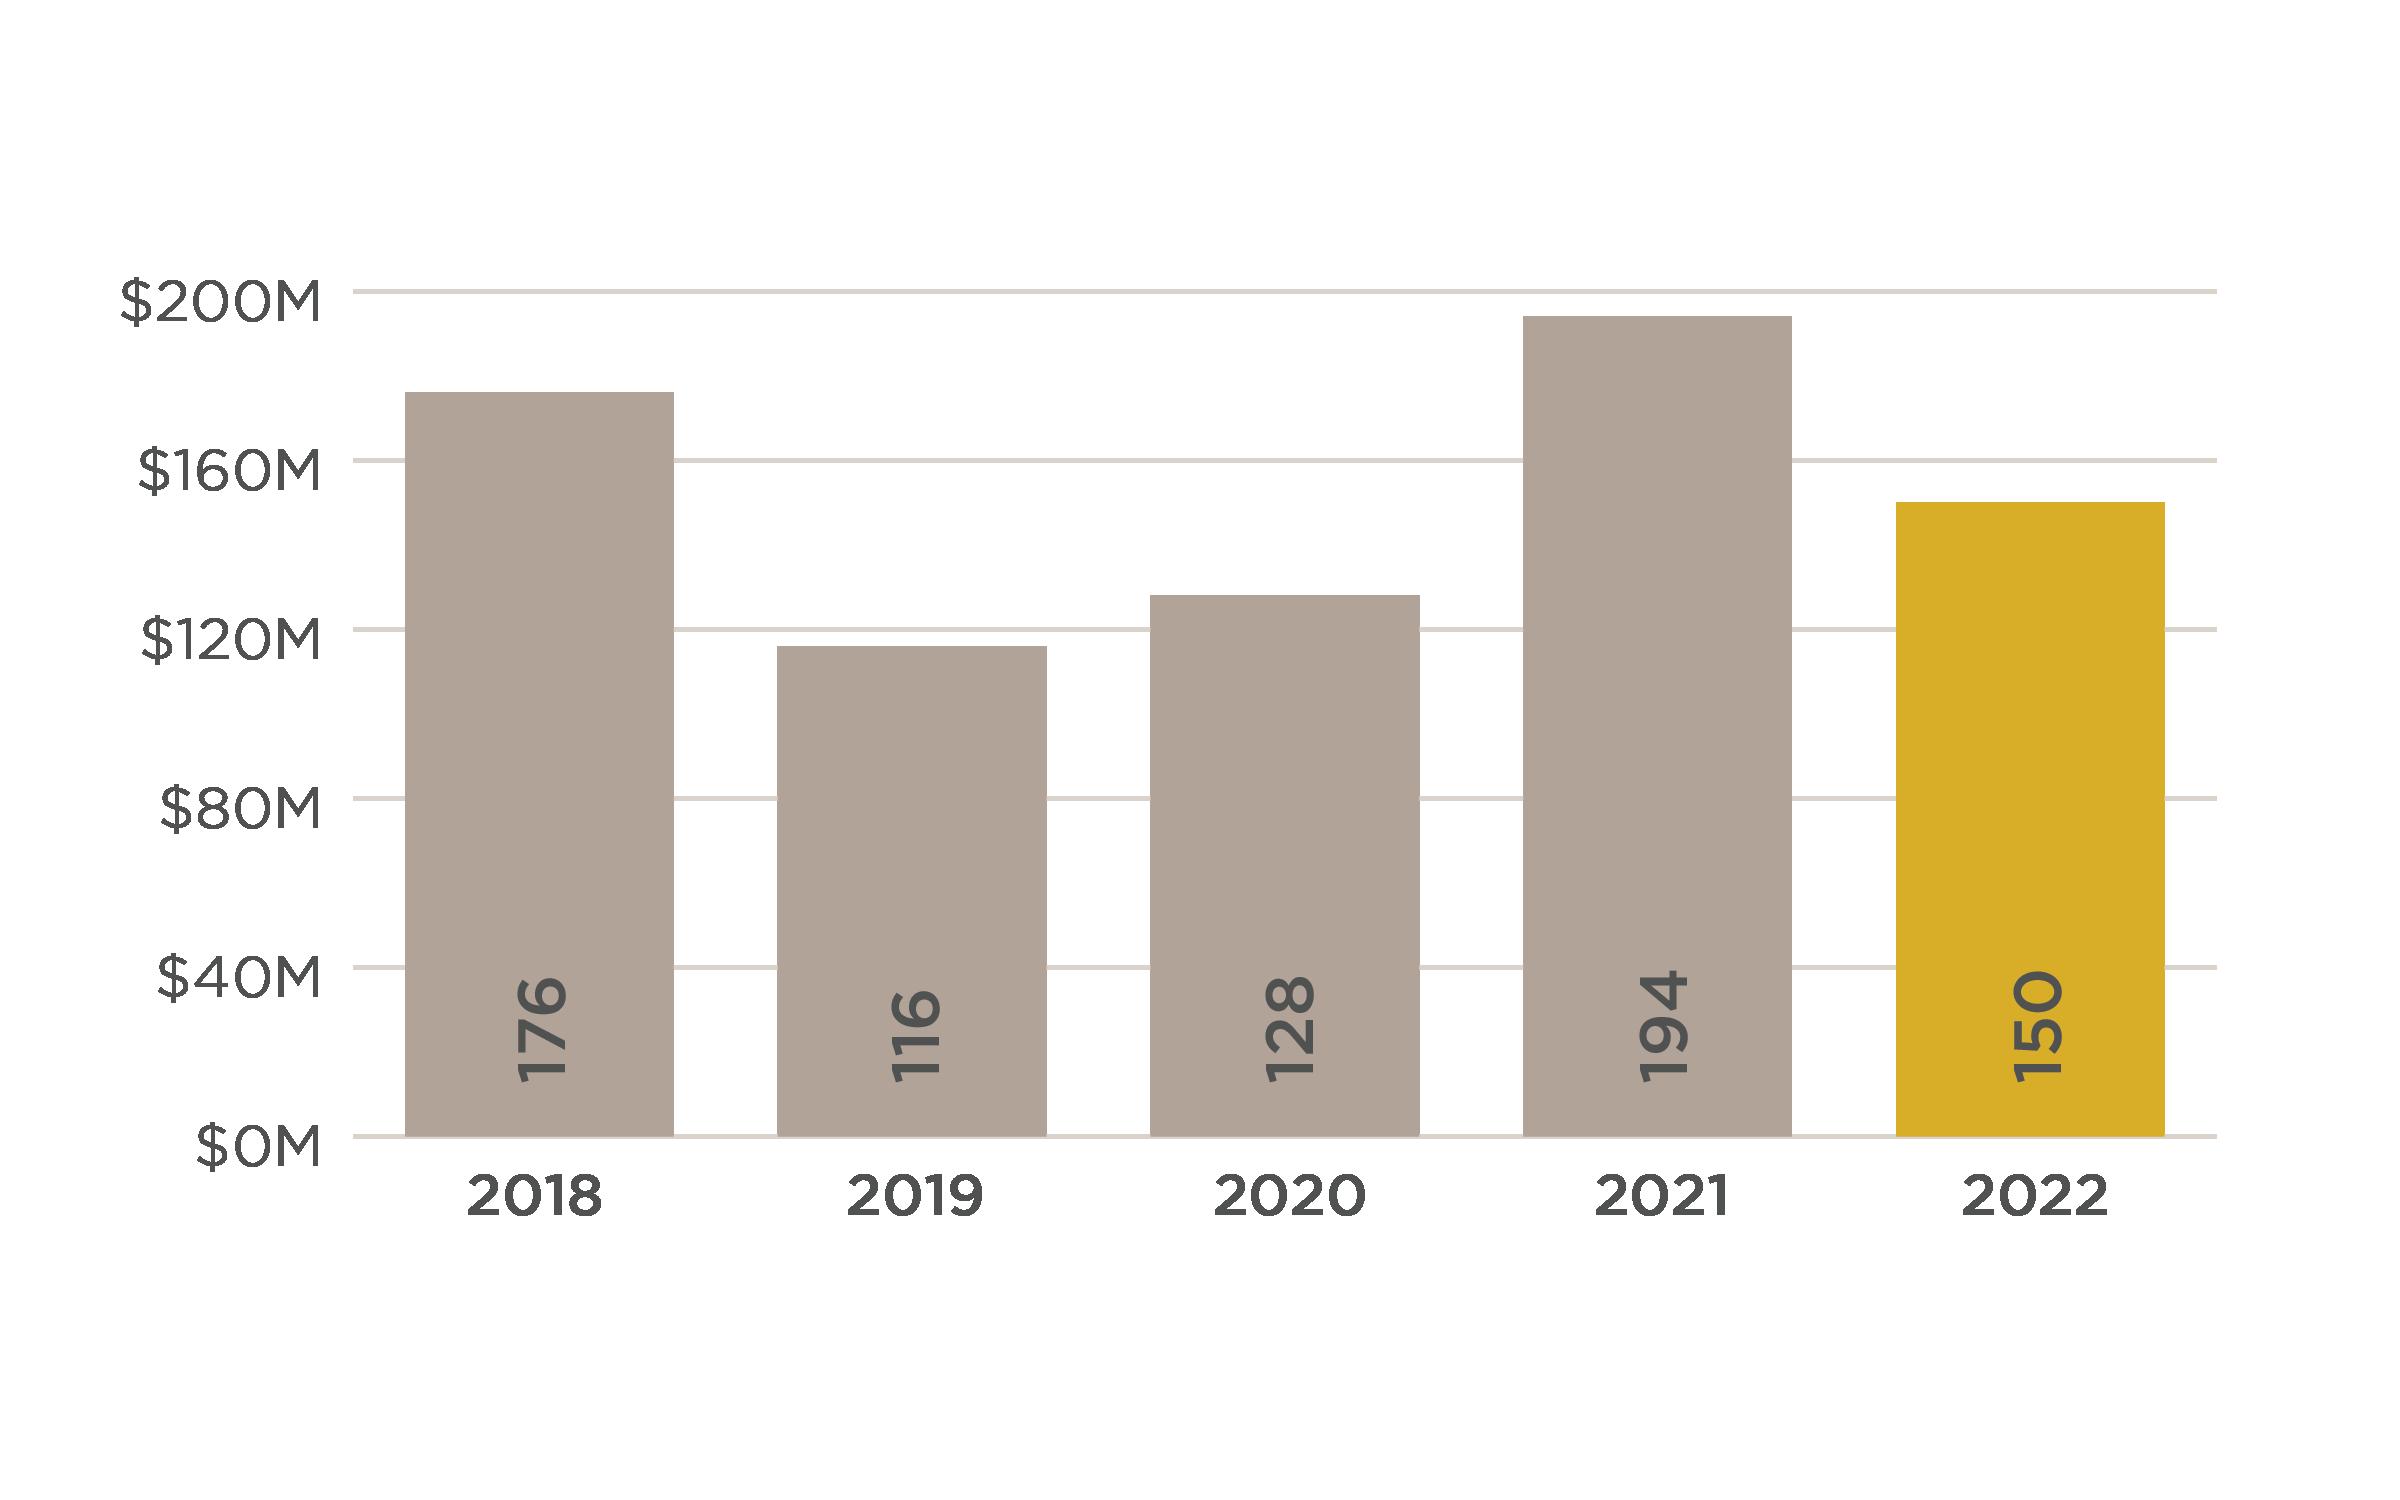
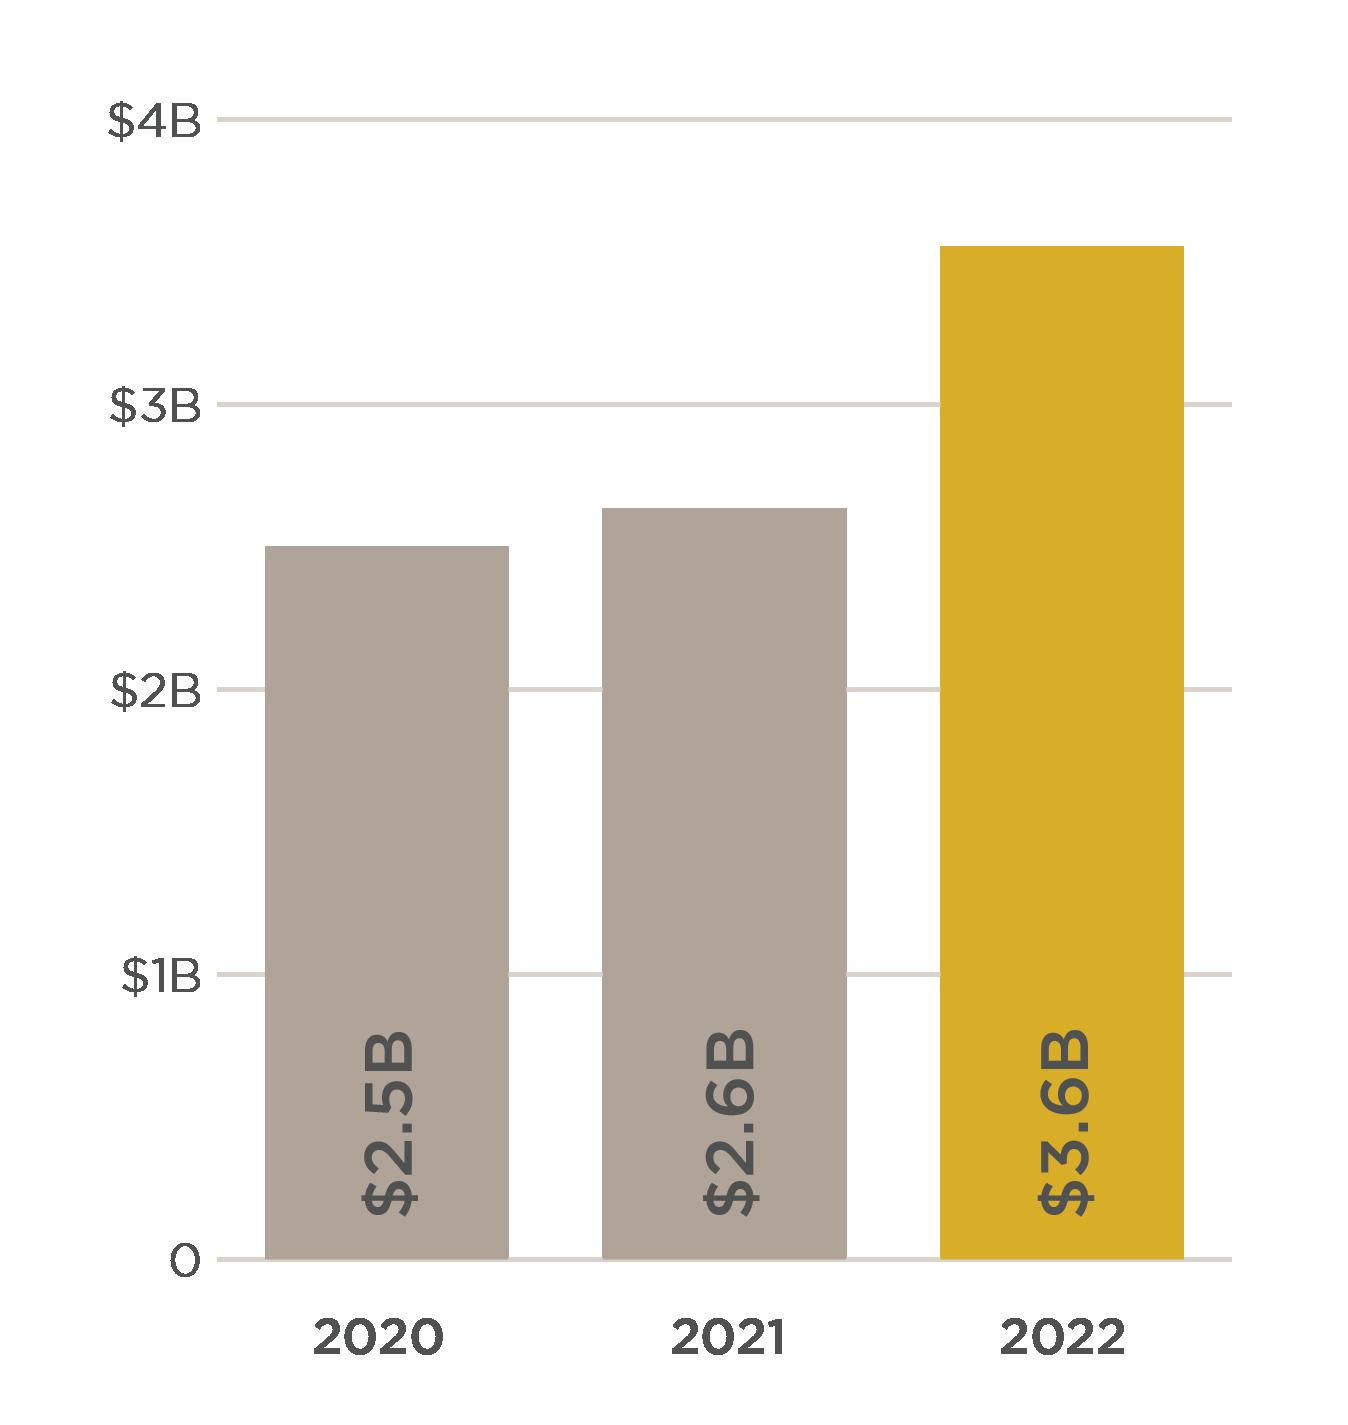
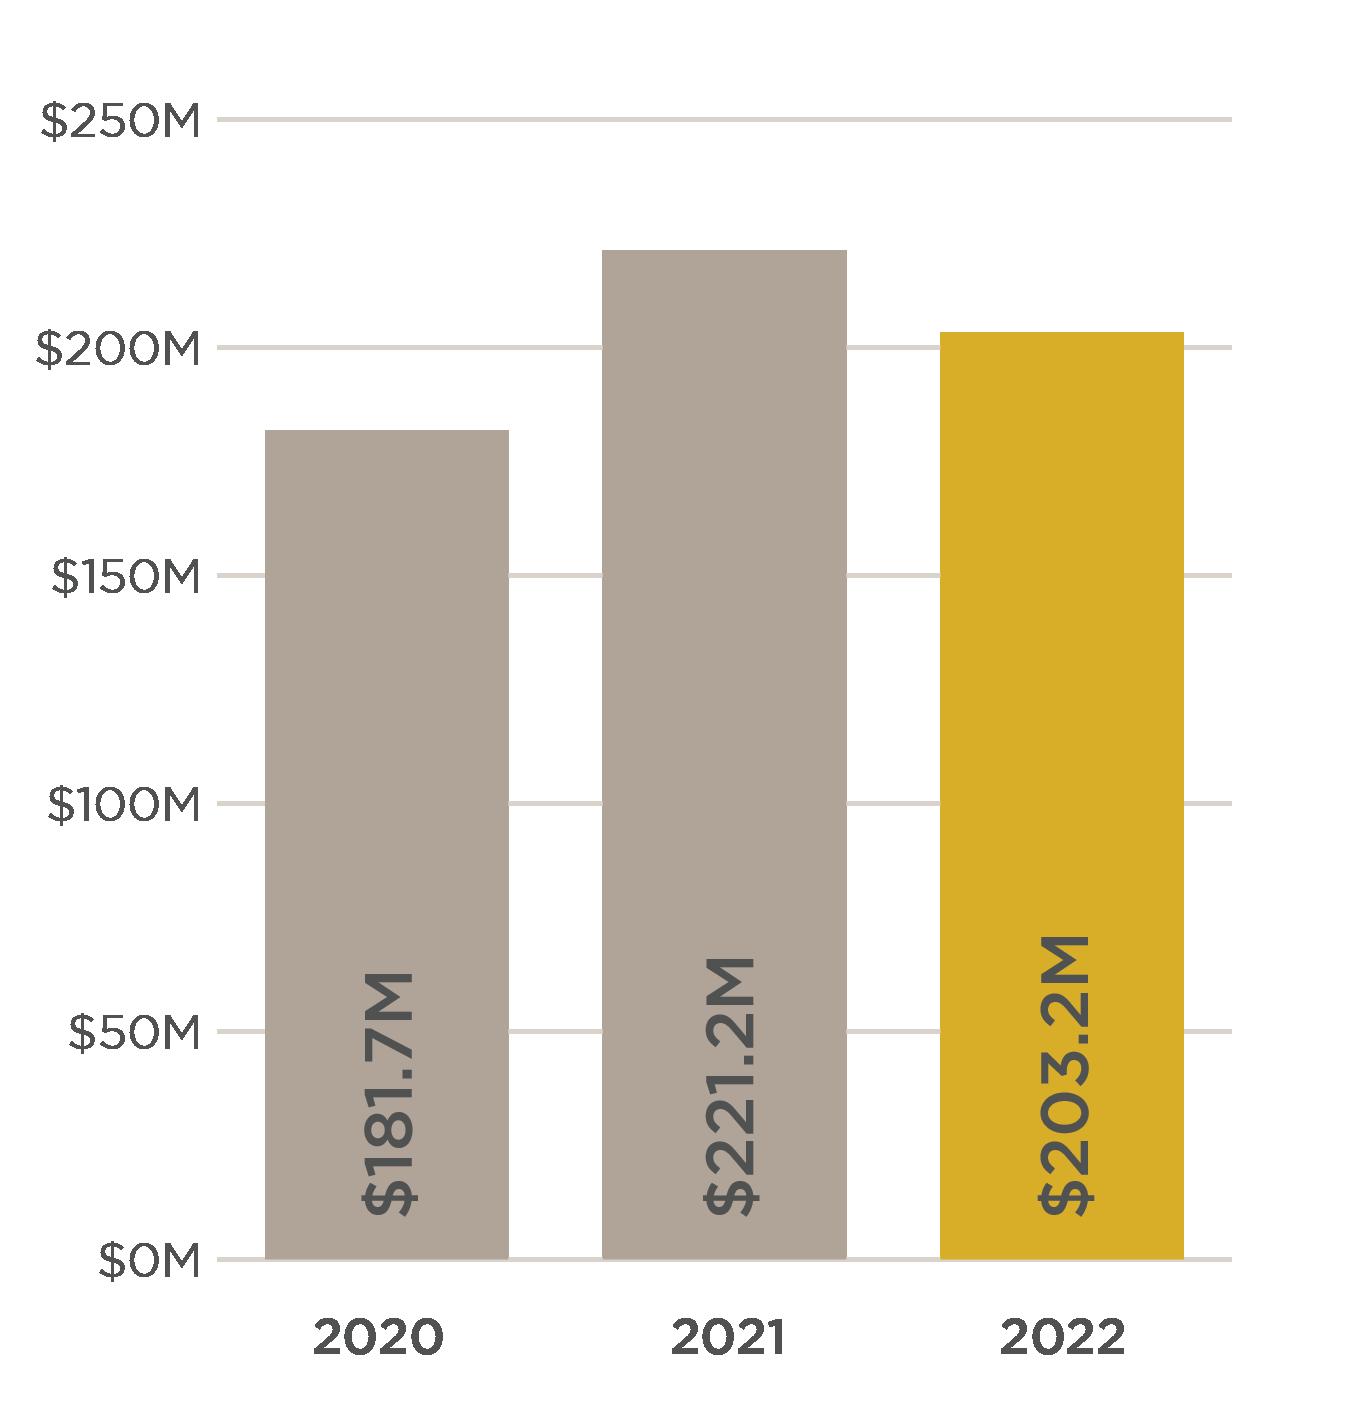
LAND SALES VOLUME COMPARISON
The Slifer Report 2023 | 5
SINGLE FAMILY & DUPLEX
SALES VOLUME
NO OF SALES AVG DAYS ON MARKET AVG SALE AVG PRICE/ SF
2018 $494,323,752 75 294 $6,590,983 $1,463 2019 $675,447,609 89 303 $7,589,299 $1,481 2020 $1,810,627,218 162 312 $11,176,711 $1,855 2021 $1,852,306,685 143 239 $12,953,194 $2,198 2022 $1,317,135,952 71 163 $18,551,211 $3,048
CONDOMINIUM & TOW NHOME
SALES VOLUME NO OF SALES AVG DAYS ON MARKET AVG SALE AVG PRICE/ SF
2018 $376,112,104 141 289 $2,667,462 $1,520 2019 $331,464,341 141 237 $2,350,811 $1,573 2020 $691,603,182 185 252 $3,738,396 $1,899 2021 $780,448,584 245 153 $3,185,504 $2,110 2022 $1,033,664,795 614 104 $1,683,493 $1,090
Slifer Smith & Frampton Real Estate | 6
ASPEN
AREA highlights SINGLE FAMILY & DUPLEX CONDOMINIUM & TOWNHOME 2018 93% 94% 2019 91% 95% 2020 92% 95% 2021 94% 97%
98% 99% SALES VOLUME COMPARISON 43% increasein averagepriceper squarefoot for singlefamily homes 50% decreasein number of single familyhomesales SALE VS. LIST PRICE COMPARISON
2022
SINGLE FAMILY & DUPLEX
SALES VOLUME NO OF SALES AVG DAYS ON MARKET AVG SALE AVG PRICE/ SF
2018 $42,227,000 10 524 $4,222,700 $719 2019 $16,087,000 11 376 $1,462,455 $391
2020 $40,444,000 10 349 $4,044,400 $916 2021 $128,945,000 14 222 $9,210,357 $1,634 2022 $1,744,000 3 57 $581,333 $467
CONDOMINIUM & TOW NHOME
2018 $674,000 2 93 $337,000 $543 2019 $589,500 2 47 $294,750 $625 2020 $735,000 2 129 $367,500 $612 2021 $850,000 2 142 $425,000 $763 2022 $328,449 1 586 $328,449 $733
The Slifer Report 2023 | 7
WOODY CREEK
SALES VOLUME NO OF SALES AVG DAYS ON MARKET AVG SALE AVG PRICE/ SF
AREA highlights SALES VOLUME COMPARISON SINGLE FAMILY & DUPLEX CONDOMINIUM & TOWNHOME
90% 98%
94% 97%
95% 94%
97% 98%
96% 103% SALE VS. LIST PRICE COMPARISON 71% decreasein averagepriceper squarefoot for singlefamily homes 79% decreasein number of single familyhomesales
2018
2019
2020
2021
2022
SINGLE FAMILY & DUPLEX
SALES VOLUME NO OF SALES AVG DAYS ON MARKET AVG SALE AVG PRICE/ SF
2018 $134,474,266 43 302 $3,127,309 $758 2019 $197,562,570 49 383 $4,031,889 $911 2020 $299,395,787 69 252 $4,339,069 $977 2021 $396,938,545 73 188 $5,437,514 $1,245 2022 $239,754,484 33 180 $7,265,287 $1,598
CONDOMINIUM & TOW NHOME
2018 $135,578,829 156 239 $869,095 $689 2019 $139,538,009 128 271 $1,090,141 $791 2020 $277,619,204 197 237 $1,409,235 $844 2021 $352,230,877 245 136 $1,437,677 $1,009 2022 $241,777,650 114 91 $2,120,857 $1,509
Slifer Smith & Frampton Real Estate | 8
SNOWMASS VILLAGE
SALES VOLUME NO OF SALES AVG DAYS ON MARKET AVG SALE AVG PRICE/ SF
SINGLE FAMILY & DUPLEX CONDOMINIUM & TOWNHOME
92% 96%
91% 96%
94% 96%
96% 98%
96% 97% SALES VOLUME COMPARISON SALE VS. LIST PRICE COMPARISON AREA highlights 34% increasein averagesales pricefor single familyhomes 55% decreasein number of single familyhomesales
2018
2019
2020
2021
2022
2018 $59,556,800 22 370 $2,707,127 $714 2019 $29,979,000 13 254 $2,306,077 $575 2020 $107,979,999 31 390 $3,483,226 $726 2021 $83,449,250 26 185 $3,209,587 $738 2022 $127,541,150 20 186 $6,377,058 $1,232
2018 $0 0 0 $0 $0 2019 $1,545,000 1 65 $1,545,000 $267 2020 $0 0 0 $0 $0 2021 $0 0 0 $0 $0 2022 $725,000 1 67 $725,000 $1,436
The Slifer Report 2023 | 9
SNOWMASS
OLD
SINGLE FAMILY & DUPLEX SALES VOLUME NO OF SALES AVG DAYS ON MARKET AVG SALE AVG PRICE/ SF
SALES
CONDOMINIUM & TOW NHOME SALES VOLUME NO OF
AVG DAYS ON MARKET AVG SALE AVG PRICE/ SF
SALES VOLUME COMPARISON SINGLE FAMILY & DUPLEX CONDOMINIUM & TOWNHOME
95% 0%
89% 108%
93% 0%
95% 0%
95% 97% SALE VS. LIST PRICE COMPARISON AREA highlights 99% increasein averagesales pricefor single familyhomes 23% decreasein number of single familyhomesales
2018
2019
2020
2021
2022
FAMILY &
2018 $101,557,669 81 223 $1,253,798 $452 2019 $89,800,209 78 158 $1,151,285 $415 2020 $130,757,993 97 180 $1,348,021 $494 2021 $166,788,415 93 148 $1,793,424 $561 2022 $92,022,500 55 91 $1,673,136 $650
CONDOMINIUM & TOW NHOME
2018 $44,009,815 76 173 $579,077 $433 2019 $57,548,772 89 189 $646,615 $434 2020 $95,570,692 117 173 $816,844 $710 2021 $80,615,200 94 84 $857,609 $932 2022 $105,825,399 88 160 $1,198,749 $738
Smith & Frampton Real Estate | 10
Slifer
BASALT
SINGLE
DUPLEX SALES VOLUME NO OF SALES AVG DAYS ON MARKET AVG SALE AVG PRICE/ SF
SALES VOLUME NO OF SALES AVG DAYS ON MARKET AVG SALE AVG PRICE/ SF
SINGLE FAMILY & DUPLEX CONDOMINIUM & TOWNHOME
95% 98%
95% 98%
96% 98%
97% 99%
98% 100% SALES VOLUME COMPARISON SALE VS. LIST PRICE COMPARISON AREA highlights 16% increasein averagepriceper squarefoot for singlefamily homes 5% decreaseinsales volumefor single familyhomes
2018
2019
2020
2021
2022
MISSOURI
The Slifer Report 2023 | 11
HEIGHTS
VOLUME NO OF SALES AVG DAYS ON MARKET AVG SALE AVG PRICE/ SF
SINGLE FAMILY & DUPLEX SALES
SALES VOLUME NO OF SALES AVG DAYS ON MARKET AVG SALE AVG PRICE/ SF
$0 0 0 $0 $0
$0 0 0 $0 $0
$0 0 0 $0 $0
$0 0 0 $0 $0
$0
0 $0 $0 SALES VOLUME COMPARISON SINGLE FAMILY & DUPLEX CONDOMINIUM & TOWNHOME 2018 95% 0% 2019 94% 0% 2020 95% 0%
96% 0% 2022 97% 0% SALE VS. LIST PRICE COMPARISON AREA highlights 27% increasein averagepriceper squarefoot for singlefamily homes 38% decreasein number of single familyhomesales
2018 $29,482,771 34 240 $867,140 $285 2019 $54,164,120 45 222 $1,203,647 $306 2020 $80,112,110 46 239 $1,741,568 $380 2021 $78,094,075 42 153 $1,859,383 $478 2022 $56,963,683 26 160 $2,190,911 $605 CONDOMINIUM & TOW NHOME
2018
2019
2020
2021
2022
0
2021
2018 $93,269,393 103 170 $905,528 $308 2019 $104,525,900 101 186 $1,034,910 $322 2020 $181,516,565 140 156 $1,296,547 $382 2021 $187,470,258 121 97 $1,549,341 $497 2022 $144,265,615 76 129 $1,898,232 $582
&
2018 $31,234,307 61 151 $512,038 $300 2019 $41,936,276 73 112 $574,470 $317 2020 $44,332,009 73 157 $607,288 $339 2021 $67,120,258 96 139 $699,169 $434 2022 $48,380,309 53 159 $912,836 $505
Smith & Frampton Real Estate | 12
Slifer
CARBONDALE
SINGLE FAMILY & DUPLEX SALES VOLUME NO OF SALES AVG DAYS ON MARKET AVG SALE AVG PRICE/ SF
CONDOMINIUM
TOW NHOME SALES VOLUME NO OF SALES AVG DAYS ON MARKET AVG SALE AVG PRICE/ SF
SINGLE FAMILY & DUPLEX CONDOMINIUM & TOWNHOME
96% 97%
96% 98%
97% 99%
98% 100%
97% 99% SALES VOLUME COMPARISON SALE VS. LIST PRICE COMPARISON AREA highlights 32% increasein averagesales pricefor condos +townhomes 45% decreasein number of sales for condos+ townhomes
2018
2019
2020
2021
2022
SINGLE FAMILY
2018 $5,383,000 10 142 $538,300 $343 2019 $9,400,000 12 178 $783,333 $353 2020 $8,854,500 11 180 $804,955 $346 2021 $21,018,125 23 89 $913,832 $412 2022 $22,158,000 7 203 $3,165,429 $535
CONDOMINIUM & TOW NHOME
2018 $0 0 0 $0 $0 2019 $0 0 0 $0 $0 2020 $162,000 1 318 $162,000 $621 2021 $295,000 1 18 $295,000 $565 2022 $215,000 1 16 $215,000 $824
The Slifer Report 2023 | 13 REDSTONE
& DUPLEX SALES VOLUME NO OF SALES AVG DAYS ON MARKET AVG SALE AVG PRICE/ SF
SALES VOLUME NO OF SALES AVG DAYS ON MARKET AVG SALE AVG PRICE/ SF
SALES VOLUME COMPARISON SINGLE FAMILY & DUPLEX CONDOMINIUM & TOWNHOME
100% 0%
97% 0%
96% 88%
95% 102%
95% 105% SALE VS. LIST PRICE COMPARISON AREA highlights 246% increasein averagesales pricefor single familyhomes 70% decreasein number of single familyhomesales
2018
2019
2020
2021
2022

Slifer Smith & Frampton Real Estate | 14 MARBLE
SALES VOLUME
OF SALES AVG DAYS ON MARKET AVG SALE AVG PRICE/
SINGLE FAMILY & DUPLEX
NO
SF
SALES VOLUME NO OF SALES AVG DAYS ON MARKET AVG SALE AVG PRICE/ SF
$0 0 0 $0
$0
$0
$0
$0
$0
$0
$0
SINGLE FAMILY & DUPLEX CONDOMINIUM & TOWNHOME 2018 97% 0% 2019 97% 0% 2020 92% 0% 2021 100% 0% 2022 98% 0% SALES VOLUME COMPARISON SALE VS. LIST PRICE COMPARISON AREA highlights 45% increasein averagesales pricefor single familyhomes 57% decreasein number of sales for singlefamily homes
2018 $5,621,000 12 124 $468,417 $208 2019 $1,565,600 5 121 $313,120 $270 2020 $7,113,000 12 213 $592,750 $274 2021 $4,956,000 7 143 $708,000 $255 2022 $3,090,500 3 178 $1,030,167 $352 CONDOMINIUM & TOW NHOME
2018
$0 2019
0 0
$0 2020
0 0 $0 $0 2021
0 0
$0 2022
0 0
$0
SINGLE FAMILY & DUPLEX
SALES VOLUME
NO OF SALES AVG DAYS ON MARKET AVG SALE AVG PRICE/ SF
2018 $102,910,471 179 111 $574,919 $246 2019 $93,876,810 154 112 $609,590 $244
2020 $154,803,462 230 93 $673,059 $271 2021 $182,944,279 219 86 $835,362 $345 2022 $158,072,534 161 90 $981,817 $395
CONDOMINIUM & TOW NHOME
SALES VOLUME NO OF SALES AVG DAYS ON MARKET AVG SALE AVG PRICE/ SF
2018 $23,509,700 77 85 $305,321 $232 2019 $32,068,149 100 100 $320,681 $252 2020 $26,874,945 81 87 $331,789 $267 2021 $38,292,100 95 80 $403,075 $307 2022 $45,154,120 85 93 $531,225 $363
The Slifer Report 2023 | 15
GLENWOOD SPRINGS
SALES VOLUME COMPARISON SINGLE FAMILY & DUPLEX CONDOMINIUM & TOWNHOME
97% 98%
98% 98%
98% 98%
99% 100%
98% 99% SALE VS. LIST PRICE COMPARISON AREA highlights 18% increasein averagesales pricefor single familyhomes 26% decreasein number of single familyhomesales
2018
2019
2020
2021
2022
2018 $42,858,272 103 98 $416,100 $213 2019 $45,138,300 102 111 $442,532 $207 2020 $46,617,300 98 101 $475,687 $237 2021 $61,331,336 105 78 $584,108 $274 2022 $55,971,124 85 83 $658,484 $312
2018 $17,049,510 64 103 $266,399 $193 2019 $21,154,700 72 96 $293,815 $206 2020 $16,695,200 57 97 $292,898 $218 2021 $21,974,563 63 54 $348,803 $259 2022 $20,343,090 51 48 $398,884 $302
Slifer Smith & Frampton Real Estate | 16 NEW CASTLE
SINGLE FAMILY & DUPLEX SALES VOLUME NO OF SALES AVG DAYS ON MARKET AVG SALE AVG PRICE/ SF
CONDOMINIUM & TOW NHOME SALES VOLUME NO OF SALES AVG DAYS ON MARKET AVG SALE AVG PRICE/ SF
SINGLE FAMILY & DUPLEX CONDOMINIUM & TOWNHOME
99% 99%
98% 99%
99% 100%
99% 100%
98% 101% SALES VOLUME COMPARISON SALE VS. LIST PRICE COMPARISON AREA highlights 13% increasein averagesales pricefor single familyhomes 19% decreasein number of sales for singlefamily homes
2018
2019
2020
2021
2022
SINGLE FAMILY & DUPLEX
SALES VOLUME NO OF SALES AVG DAYS ON MARKET AVG SALE AVG PRICE/ SF
2018 $31,782,835 88 108 $361,169 $192 2019 $31,498,292 83 111 $379,497 185
2020 $38,364,286 82 97 $467,857 $221
2021 $53,377,544 103 85 $518,229 $4,884 2022 $44,097,983 78 91 $565,359 $289
CONDOMINIUM & TOW NHOME
SALES VOLUME NO OF SALES AVG DAYS ON MARKET AVG SALE AVG PRICE/ SF
2018 $5,387,350 23 121 $234,233 $155 2019 $6,027,900 22 93 $273,995 $163
2020 $5,290,800 20 110 $264,540 $179 2021 $3,651,000 11 54 $331,909 $187 2022 $3,895,000 11 59 $354,091 $247
The Slifer Report 2023 | 17 SILT
SALES VOLUME COMPARISON SINGLE FAMILY & DUPLEX CONDOMINIUM & TOWNHOME
99% 99%
98% 99%
99% 99%
99% 100%
98% 99% SALE VS. LIST PRICE COMPARISON AREA highlights 32% increasein averagepriceper squarefoot for condos+ townhomes 24% decreasein number of single familyhomesales
2018
2019
2020
2021
2022
2018 $61,303,845 203 84 $301,989 $170 2019 $60,776,817 186 92 $326,757 $182 2020 $67,189,218 189 82 $355,499 $195 2021 $92,883,316 221 83 $420,286 $235 2022 $73,631,229 154 80 $478,125 $3,248
CONDOMINIUM & TOW NHOME
2018 $9,207,399 52 90 $177,065 $129 2019 $10,608,100 52 90 $204,002 $147 2020 $10,532,450 51 72 $206,519 $189 2021 $22,945,100 86 133 $266,803 $189 2022 $10,395,500 37 111 $280,959 $220
Smith & Frampton Real Estate | 18
Slifer
RIFLE
SINGLE FAMILY & DUPLEX SALES VOLUME NO OF SALES AVG DAYS ON MARKET AVG SALE AVG PRICE/ SF
SALES VOLUME NO OF SALES AVG DAYS ON MARKET AVG SALE AVG PRICE/ SF
SINGLE FAMILY & DUPLEX CONDOMINIUM & TOWNHOME
98% 99%
98% 99%
99% 98%
99% 100%
99% 100% SALES VOLUME COMPARISON AREA highlights 16% increasein averagepriceper squarefoot for condos+ townhomes 57% decreasein number of sales for condos+ townhomes
2018
2019
2020
2021
2022
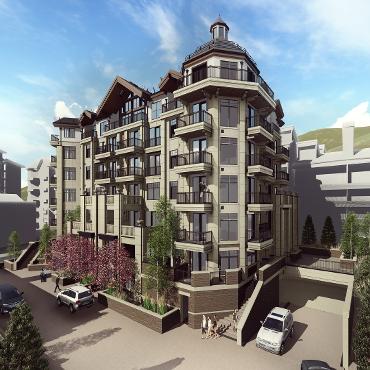
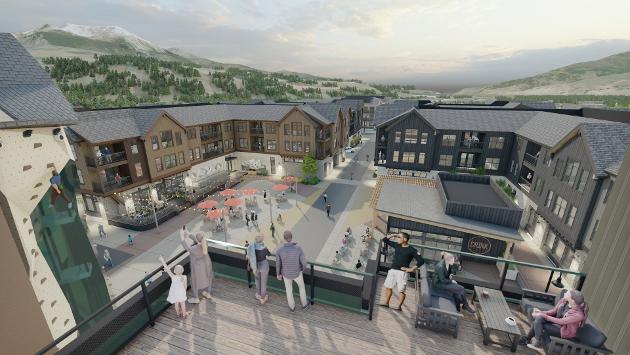
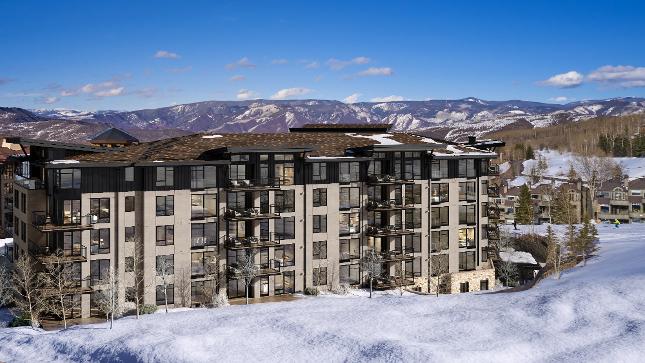
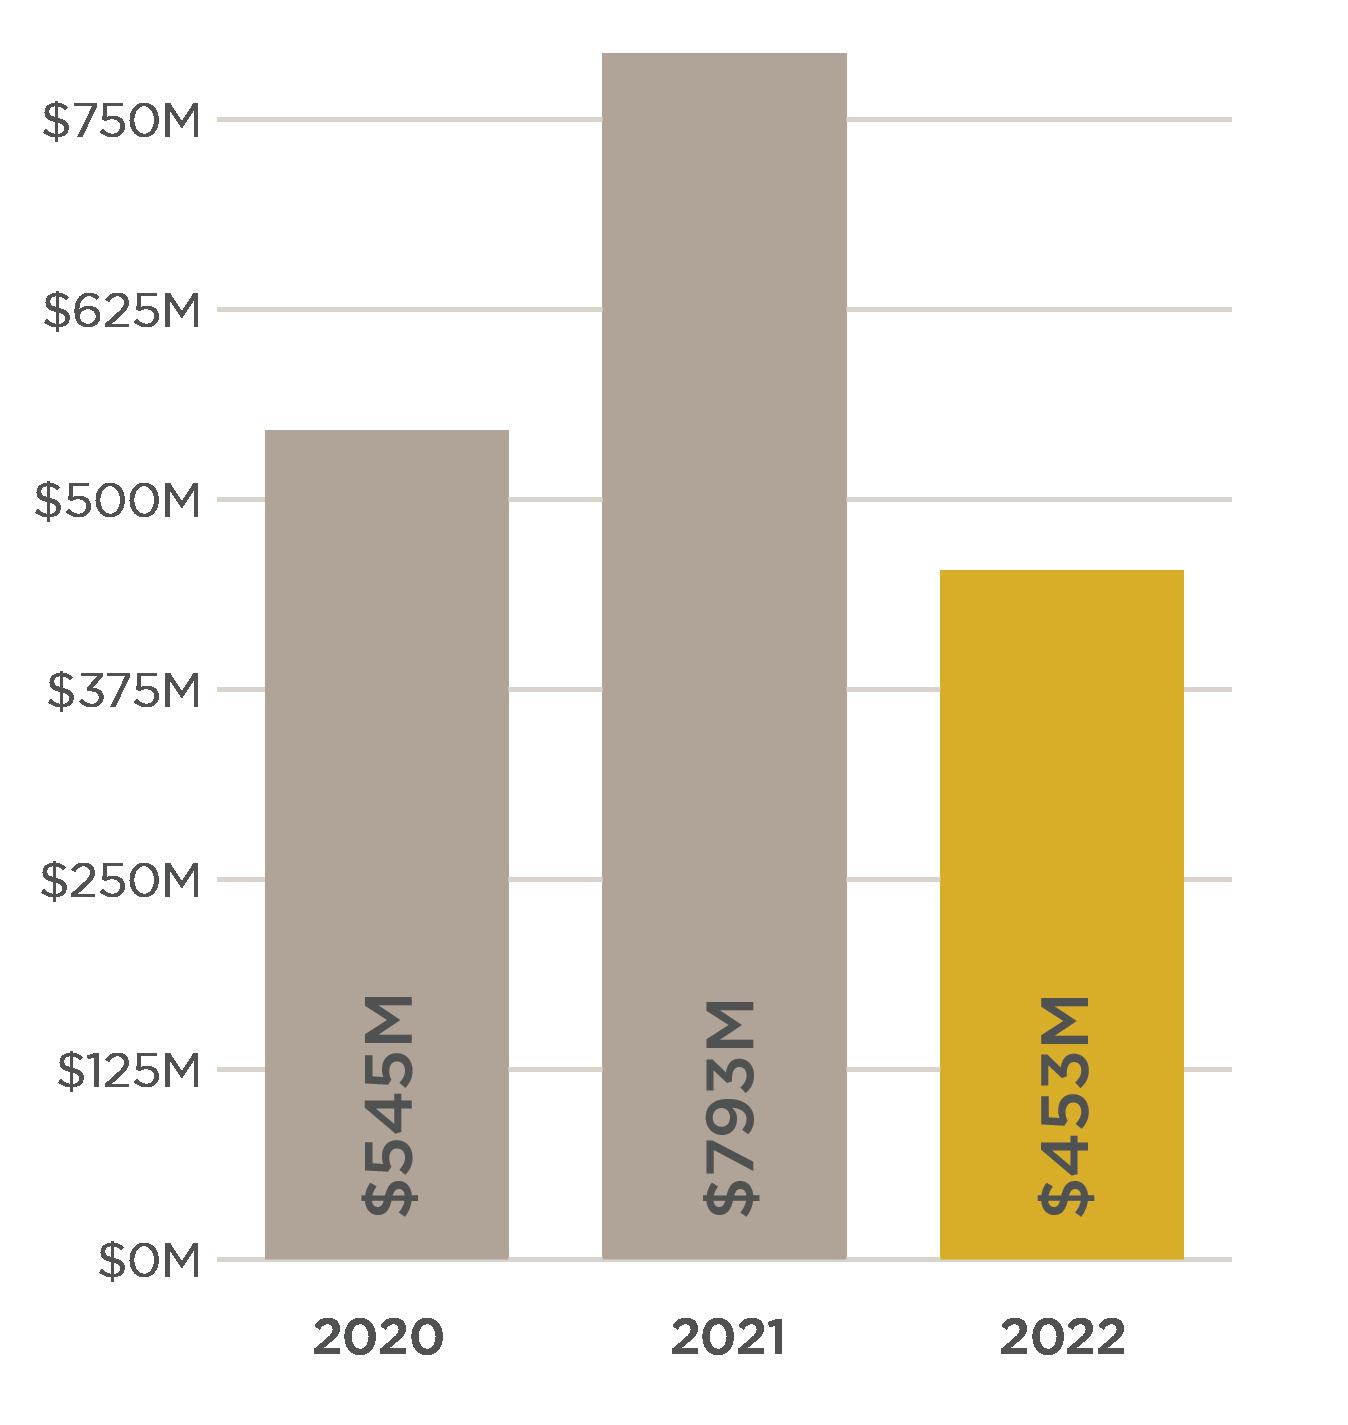
The Slifer Report 2023 | 19 NEW DEVELOPMENT REVIEW Weareproud to betheonlybrokerageinColorado withafull divisiondedicated to bringingnewdevelopmentsto market.Our end-to-endservicecontinuedto deliver in 2022,creatingmorenewhomesinour communitiesthanever before Thisyear the divisioncelebratedover $1billion inclosed &pending salessinceit startedin2020. 9 Projects launched in 20 22 NEW DEVELOPMENT SPOTLIGHT To learnmore,visit SliferDevelopmentSales com >>> $1B+ Division historic closed + pending sales LEGACY AT VAIL SQUARE Lionshead | Vail LegacyVail com IN HABITANCE Downtown | Silverthorne LiveAtInhabitance.com CIRQUE X VICEROY Snowmass Base Village CirqueViceroy.com 20 0 + New homes delivered AREA CLOSED VOLUME CONTRACTS CLOSED PENDING VOLUME PENDING CONTRACTS TOTAL VOLUME TOTAL CONTRACTS Roaring Fork Valley $1,339,500 17 $96,356,289 11 $97,695,789 28 Eagle County $31,720,000 8 $280,389,656 103 $312,109,656 111 Summit County $28,877,000 30 $208,649,400 126 $237,526,400 156 Denver - - $16,511,169 27 $16,511,169 27 Tot al $61,936,50 0 55 $60 1,90 6,514 267 $663,843,0 14 322


S TA Y U P T O D A T E ALL YEAR & V I E W O U R P R O P E R T I E S ANYTIME A S P E N R E A L E S TA T E . C O M