2023 ECONOMIC FORECAST THE YEAR OF TRUTH
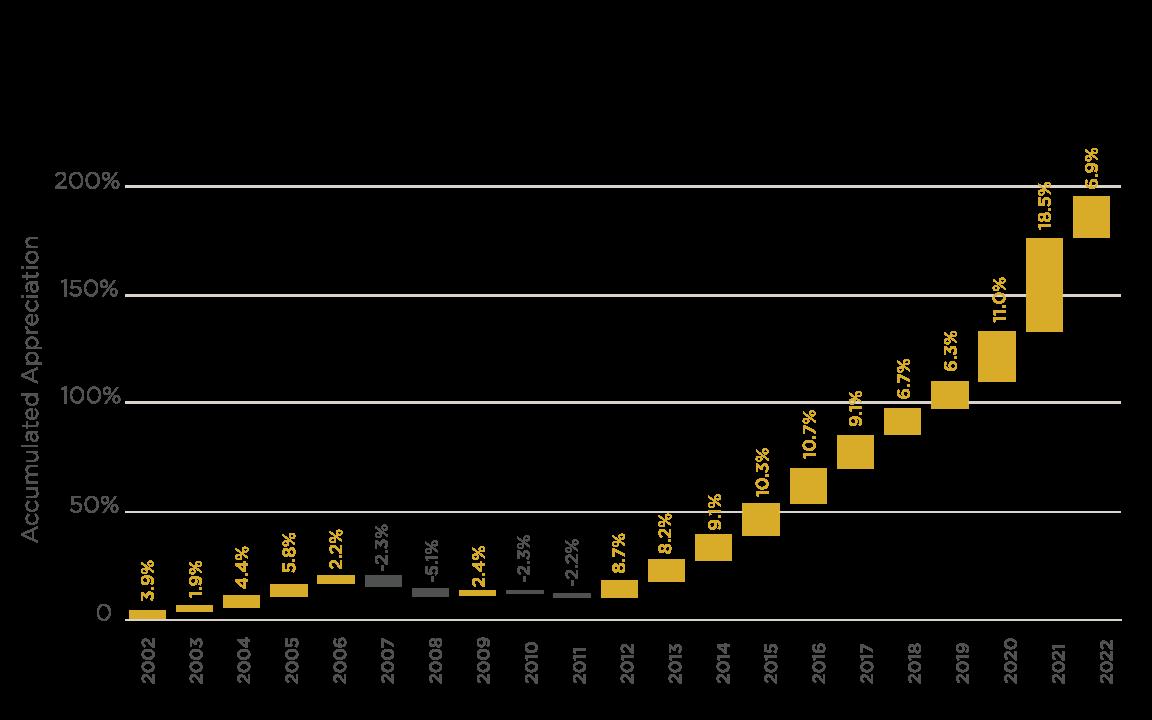
With over 6 million existing home sales in 2021across the US, our industry experienced a near 20-year high Aswepredicted,2022sawthoserarefied salesnumbersreturnto earth with just over 4 million,a30%decline/normalization and morein linewith thelong-term averageof 41million existing home sales dating back to 1968 This market normalization was a result a seriesof industry headwindsthat curbed adecadelong real estatecycleincluding uncertainty linked to thepandemic,aggressivemonetary policy,mounting geopolitical tension and natural disasters right in our own backyard.Not to mention, the home price ?run up?we experienced throughout the cycle combined with once-in-a-generation interest rate increases to cool inflation which caused affordability challengesacrossthenation felt most particularly by first timehomebuyers

Analystssuggest that inflation remainsstructural and not demand induced which seemsto be playing out with the real-time risk of over-tightening policies This market dynamic will encourage many investors to seek inflation hedges which will be a net benefit to real estate Whilewewill meet 2023with continued choppy waters, the housing market will haveasteady and gradual recovery in 2023 and into 2024 stabilizing in line with long-term historical averages before cresting the 5 million existing home sales watermark in 2024. Here on the Front Range, the new official ?Hockey Capital of the US?, we?d welcome a ?hockey stick? recovery (otherwise known as a sharp and steep improvement) but the truth is, there hasn? t been a prolonged ?hockey stick recovery? in over 40 years in our industry tracking and thus wearepreparedfor agood,olefashioned cyclical recovery:measured,steadyandgradual.
Overall, this leads to our clear and present prediction of 2023: People will be doing business and thereisno one better to navigatethesewatersthan thosewho havebeen in thebusiness since1962and successfullysailedthesecyclical seasmanytimesbefore
Real estatehasbeen an organized industryfor well over acentury and thesamefundamentals that drove business then, will drive business now. The most important of those factors is partnering with a professional. 20 years?worth of consecutive, third-party research confirms that now, more than ever, people are looking for qualified partners for the sale and purchase of their homes In fact, the number of homebuyers and sellers partnering with an agent now exceeds 90% Despite countless efforts to disrupt the agent relationship, the fact remains: consumerslikeour product andarehappywith our services Encouragingly,emergingresearch now suggeststhat millennialsuse agentseven more than their parent because it?sconsidered ?smart? Weagree!
May 2023 serve your housing wants and needs in Colorado?s Front Range well.
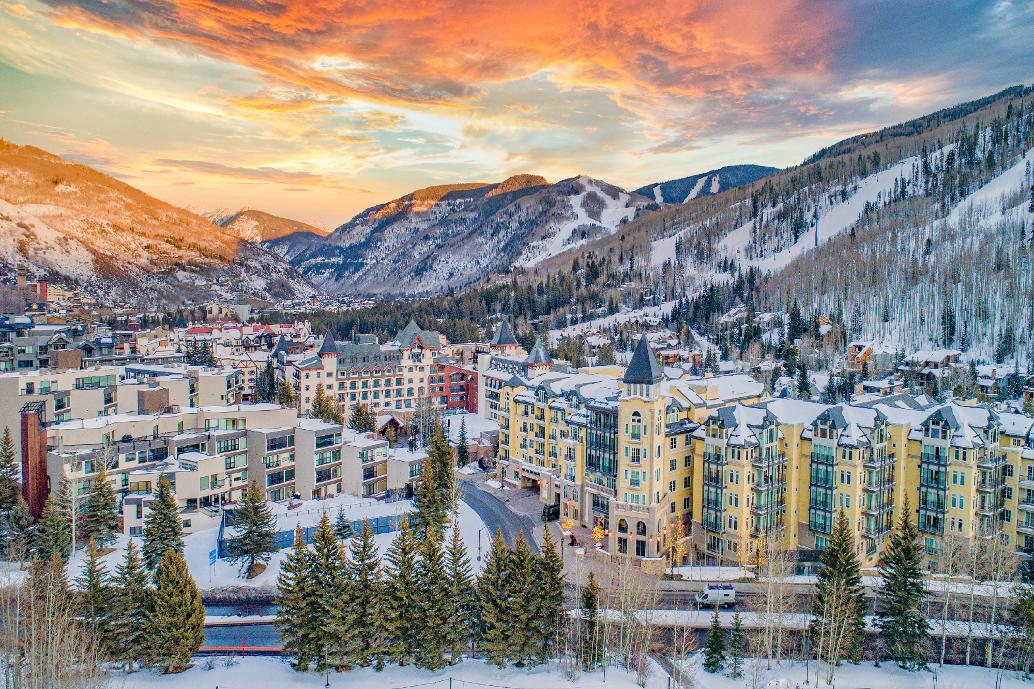
Pictured | Speer Boulevard
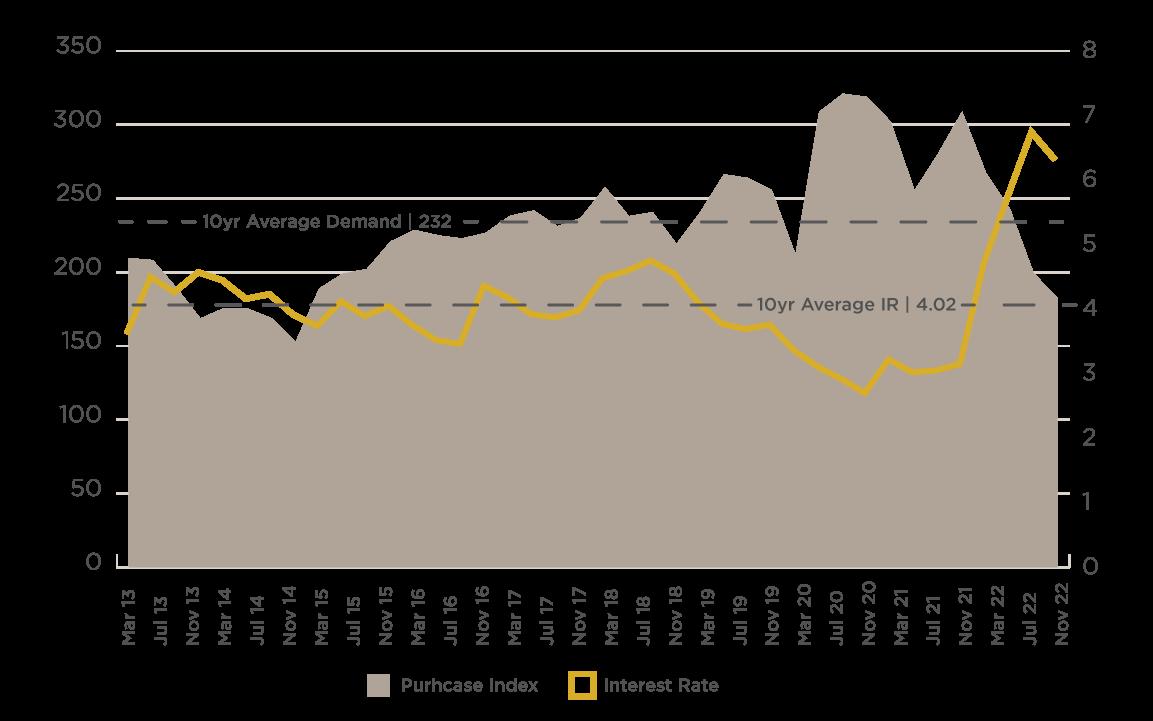
TERM QUARTERLY 30 YEAR FIXED RATE VS. PURCHASE
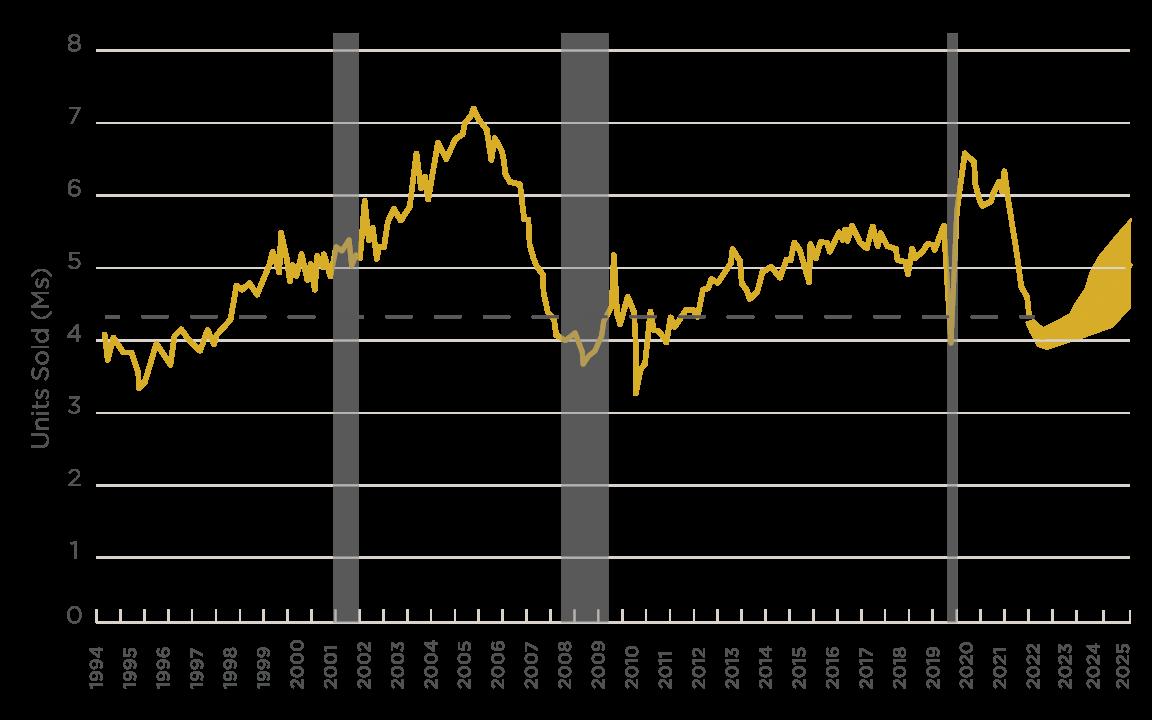
U.S. EXISTING HOME SALES (SAAR) LONG TERM TRENDS
The Slifer Report 2023 | 9
LONG
INDEX
-------- SSF FORECA ST SOURCE|
of Realtors
National Association

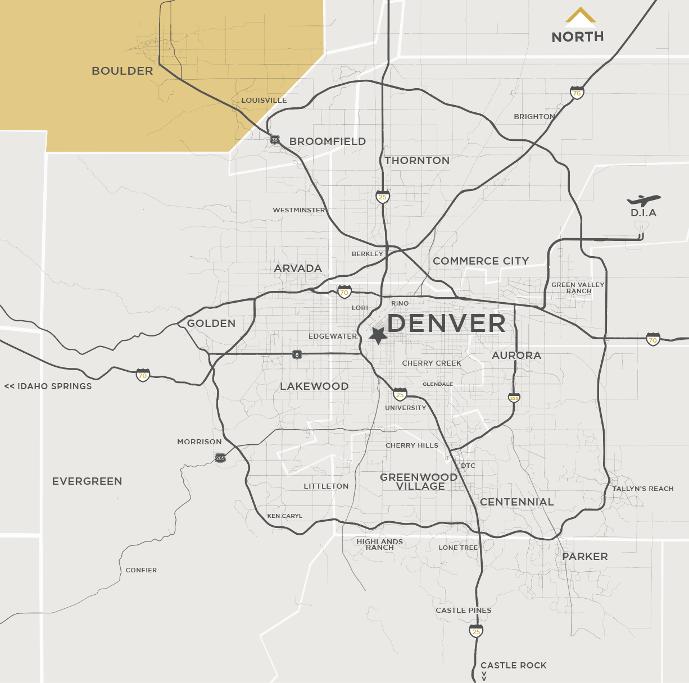
BOULDER VALLEY Pictured | Pearl Street Boulder SOURCE| 2020 datafromDataUSA&US Bureauof Labor Statistics *MedianSalefor SingleFamily&Duplex for 2022 *Unemployment Rate:Q4 2022 IN THE KNOW... 5TIDBITSFROM THELOCALS 1 BRUNCH at Lucile's Creole Cafe 2 BROWSE vintage posters and historic maps at Art Source international 3 STROLL through the Boulder Farmers Market 4 LEAF PEEP on the Peak to Peak Highway 5. CHEER on the CU Buffs at Folsom Field POPULATION
POPULATION
MEDIAN
*UNEMPLOYMENT
MEDIAN
AVERAGE
HOME
*MEDIAN
| 329,543
GROWTH | +1187% SINCE 2010
AGE | 36 9
RATE | 2 6%
HOUSEHOLD INCOME | $87,476
COMMUTE TIME | 23 5 MINUTES
OWNERSHIP RATE | 63 6%
PROPERTY SALE PRICE | $842,250
SINGLE FAMILY & DUPLEX
SALES VOLUME
NO OF SALES AVG DAYS ON MARKET AVG SALE MEDIAN SALE
2018 $1,751,730,399 2,435 38 $719,396 $600,000 2019 $1,804,797,750 2,502 38 $721,342 $589,950 2020 $4,996,903,482 6,367 34 $784,813 $636,000 2021 $4,739,161,061 4,716 21 $1,004,911 $783,250 2022 $3,784,506,229 3,526 21 $1,073,314 $842,250
TOW
2018 $398,776,558 913 30 $436,776 $375,000 2019 $378,995,025 897 43 $422,514 $370,347 2020 $1,073,820,397 2,287 39 $469,532 $405,000 2021 $1,091,982,278 2,077 30 $525,750 $445,000 2022 $931,817,623 1,508 22 $617,916 $516,033
The Slifer Report 2023 | 11
CONDOMINIUM &
NHOME SALES VOLUME NO OF SALES AVG DAYS ON MARKET AVG SALE MEDIAN SALE
$371 Avg.PricePer SquareFoot (SF) AREA highlights AVERAGE PRICE PER SQUARE FOOT SALE VS LIST PRICE COMPARISON 2018 2019 2020 2021 2022 Single Family & Duplex $245 $256 $271 $338 $371 Condominium & Townhome $288 $284 $328 $379 $413 AVERAGE SALE / LAST LISTED PRICE Single Family & Duplex 100.00% Condominium & Townhome 100 00% TOP 5 PLACES TO LIVE IN THE U S 8% Median Sale (SF+Duplex) 25% No of Sales Boulder County Data SALES VOLUME COMPARISON

Pictured | Stearns Lake
*UNEMPLOYMENT
MEDIAN
AVERAGE
HOME
*MEDIAN
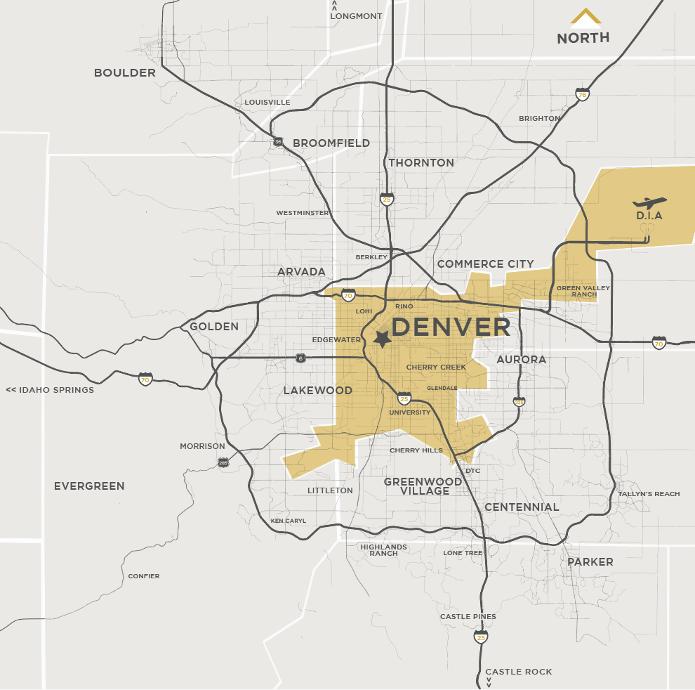
SOURCE| 2020 datafromDataUSA&US Bureauof Labor Statistics *MedianSalefor SingleFamily&Duplex for 2022 *Unemployment Rate:Q4 2022 IN THE KNOW... 5TIDBITSFROM THELOCALS 1 SIP at 4 Noses Brewing Company 2 VISIT Broomfield Days 3. ENJOY over 280 miles of walking and biking trails 4 EAT at Mama Lolita's Mexican 5 PADDLE board on Standley Lake
NORTH METRO | BROOMFIELD
POPULATION | 75,325 POPULATION GROWTH | +34 7% SINCE 2010 MEDIAN AGE | 38 4
RATE | 2 8%
HOUSEHOLD INCOME | $101,206
COMMUTE TIME | 26 8 MINUTES
OWNERSHIP RATE | 66 3%
PROPERTY SALE PRICE | $688,000
2018 $486,389,201 917 30 $530,414 $485,900 2019 $602,239,079 1,088 34 $553,529 $508,000
2020 $873,439,420 1,447 27 $603,621 $540,000 2021 $842,886,923 1,200 13 $702,406 $635,000 2022 $697,316,895 913 17 $763,764 $688,000 CONDOMINIUM
2018 $73,552,055 213 21 $345,315 $337,000 2019 $63,874,745 175 29 $364,999 $350,000 2020 $136,429,050 353 27 $386,485 $390,000 2021 $152,395,254 339 16 $449,544 $450,000 2022 $160,518,881 311 23 $516,138 $530,000
The Slifer Report 2023 | 13
SINGLE FAMILY & DUPLEX
SALES VOLUME NO. OF SALES AVG. DAYS ON MARKET AVG. SALE MEDIAN SALE
VOLUME
OF SALES AVG DAYS ON MARKET AVG SALE
& TOW NHOME SALES
NO
MEDIAN SALE
$303 AveragePriceper squarefoot AREA highlights AVERAGE PRICE PER SQUARE FOOT SALE VS. LIST PRICE COMPARISON 2018 2019 2020 2021 2022 Single Family & Duplex $215 $217 $226 $271 $303 Condominium & Townhome $259 $263 $275 $305 $328 AVERAGE SALE / LAST LISTED PRICE Single Family & Duplex 100 00% Condominium & Townhome 100.00% 21,0 0 0 ACRES 5TH SMALLEST COUNTY IN THE U S 8% MedianSale 24% no.of sales Broomfield County Data SALES VOLUME COMPARISON
POPULATION | 711,463 POPULATION GROWTH | +18 54% SINCE 2010 MEDIAN AGE | 34 6

AVERAGE
HOME
*MEDIAN
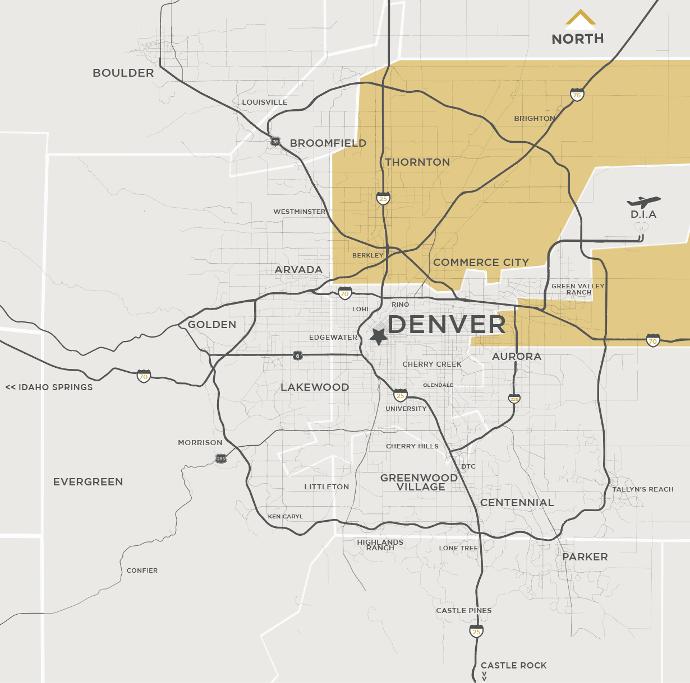
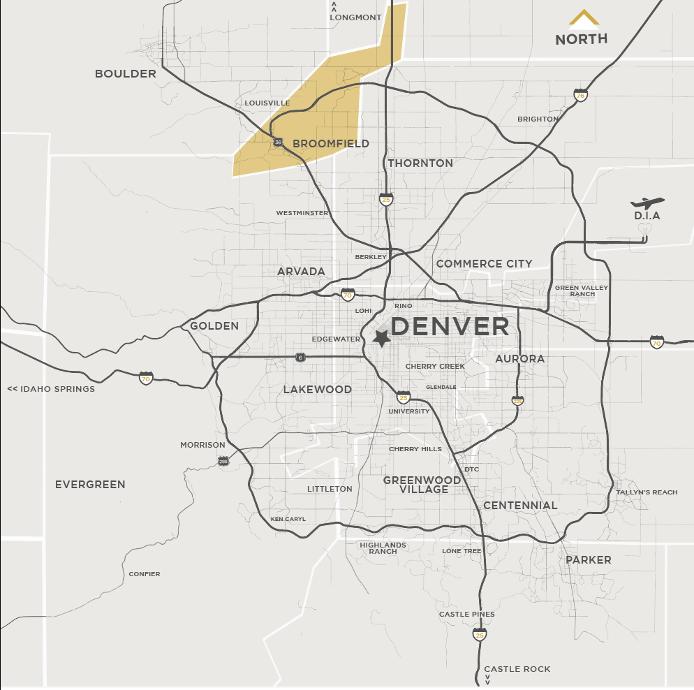
SOURCE| 2020 datafromDataUSA&US Bureauof Labor Statistics *MedianSalefor SingleFamily&Duplex for 2022 *Unemployment Rate:Q4 2022 IN THE KNOW... 5TIDBITSFROM THELOCALS 1 CELEBRATE the arts at the new week long Art RINO Festival 2 UNWIND at Cretan's Wine Bar & Restaurant 3. SHOP at Berkeley Supply co. 4 JOIN a volleyball league at wash park 5. DIVE into local & sustainable cuisine at Koko Ni Pictured | City Park
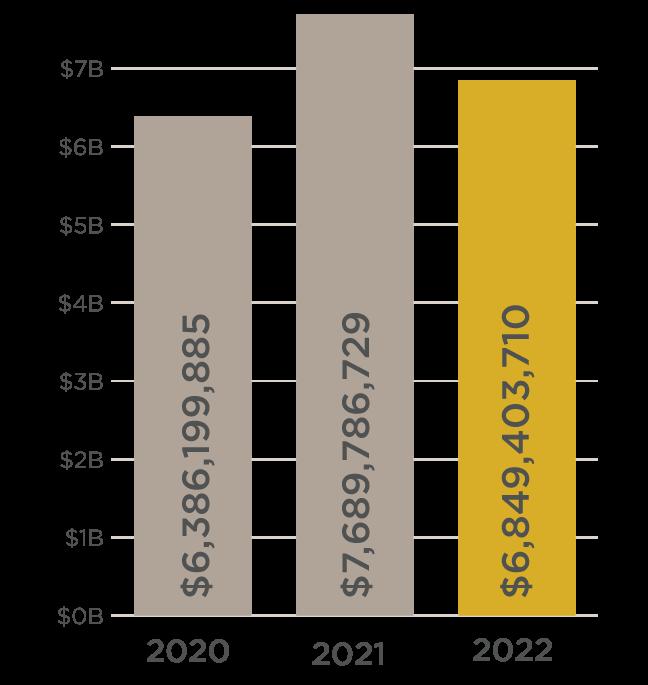
DENVER
*UNEMPLOYMENT RATE | 3 4% MEDIAN HOUSEHOLD INCOME | $72,661
COMMUTE TIME | 25,7 MINUTES
OWNERSHIP RATE | 50 4%
PROPERTY SALE PRICE | $675,000
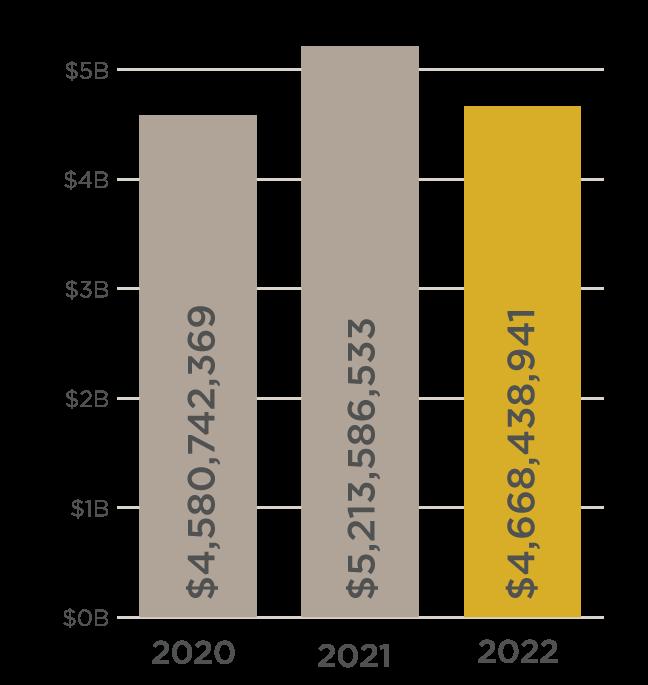
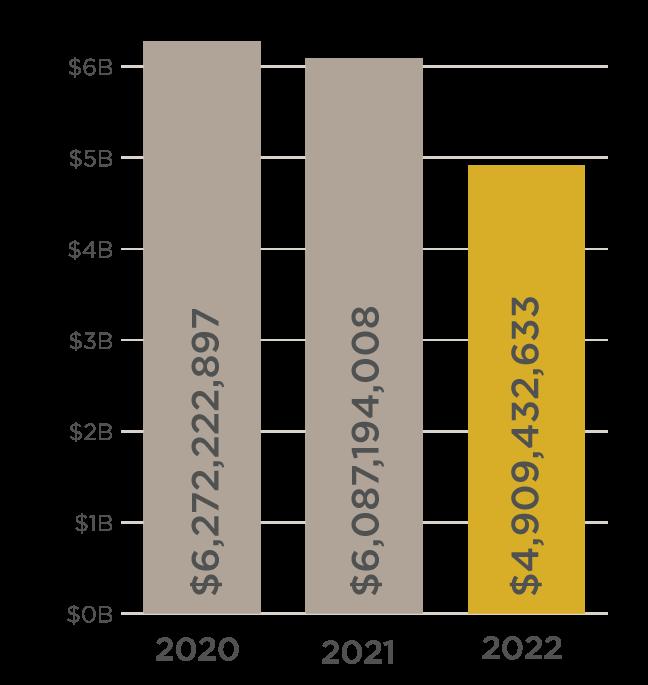
SINGLE FAMILY & DUPLEX
SALES VOLUME
NO OF SALES AVG DAYS ON MARKET AVG SALE MEDIAN SALE
2018 $4,164,393,794 7,239 21 $605,966 $484,950 2019 $4,498,966,637 7,516 28 $641,843 $502,250
2020 $5,448,702,594 8,263 22 $704,063 $550,000 2021 $6,718,910,900 8,594 13 $760,202 $609,000
2022 $5,791,169,984 6,585 15 $875,817 $675,000
& TOW
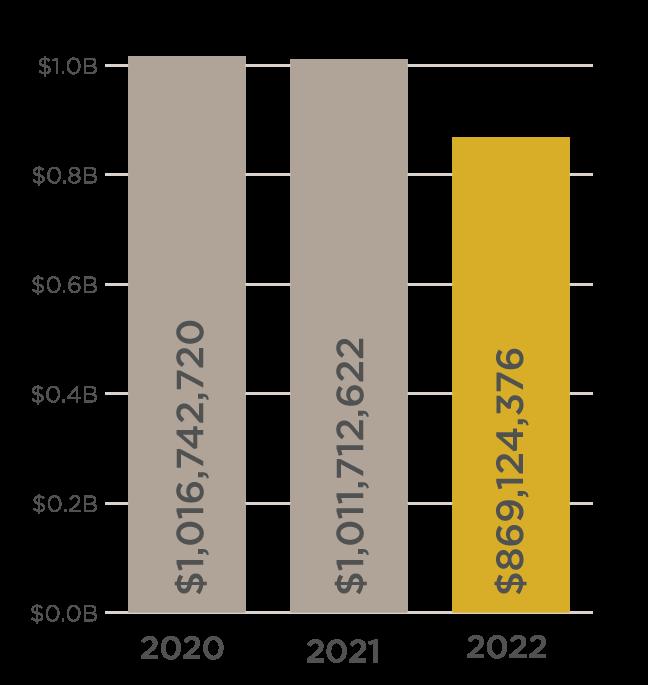
2018 $2,461,578,643 5,658 30 $435,062 $379,950 2019 $2,695,197,464 5,932 37 $454,349 $375,000 2020 $3,015,413,381 6,441 36 $468,159 $415,000 2021 $3,962,478,848 7,519 27 $526,995 $435,000 2022 $3,187,436,516 5,608 20 $568,373 $455,000
The Slifer Report 2023 | 15
CONDOMINIUM
NHOME SALES VOLUME NO OF SALES AVG DAYS ON MARKET AVG SALE MEDIAN SALE
$402 AveragePricePer SquareFoot AREA highlights AVERAGE PRICE PER SQUARE FOOT SALE VS LIST PRICE COMPARISON 2018 2019 2020 2021 2022 Single Family & Duplex $279 $283 $309 $362 $402 Condominium & Townhome $326 $326 $342 $384 $419 AVERAGE SALE / LAST LISTED PRICE Single Family & Duplex 100 70% Condominium & Townhome 100.00% 5,280 ' ELEVATION 11% Median Sales 23% no of Sales Denver County Data 30 0 DAYS OF SUNSHINE SALES VOLUME COMPARISON

*UNEMPLOYMENT
AVERAGE
HOME
*MEDIAN
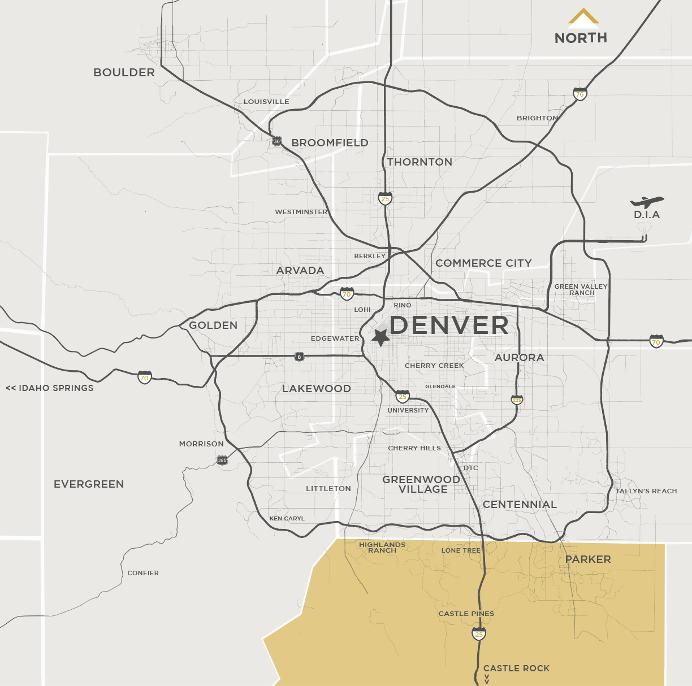
SOURCE|
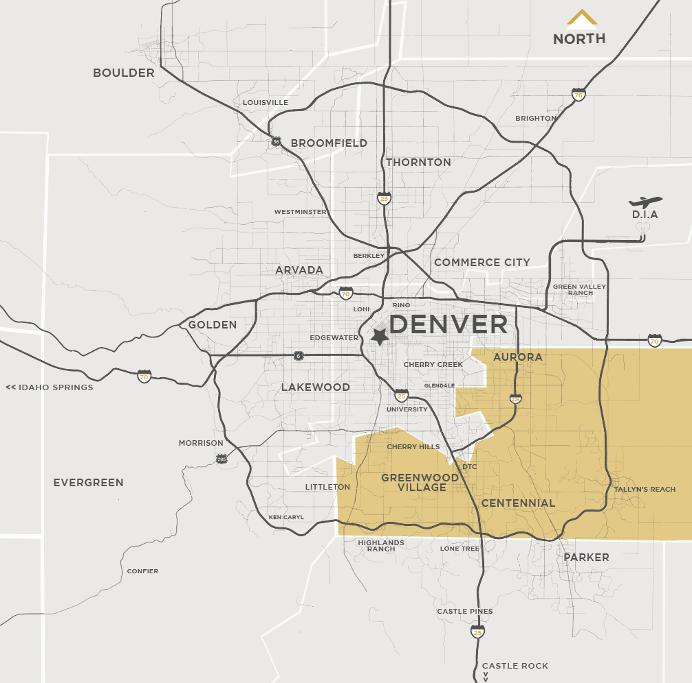
datafromDataUSA&US Bureauof Labor Statistics *MedianSalefor SingleFamily&Duplex for 2022 *Unemployment Rate:Q4 2022 IN THE KNOW... 5TIDBITSFROM THELOCALS 1 TRAIN at Snöbahn Indoor Ski Facility 2 ENJOY a show at Gothic Theater 3. INDULGE in all the outdoor activities at Cherry Creek State Park and Reservoir 4. PERUSE through Stanley Marketplace 5. DINE at Enso Sushi and Grill Pictured | Cherry Creek State Park
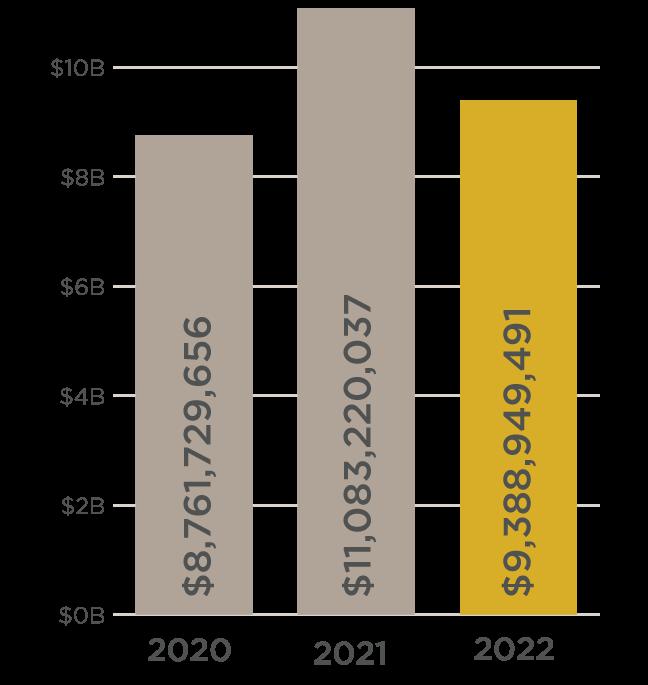
SOUTHEAST DENVER | AURORA POPULATION | 654,900 POPULATION GROWTH | +14 49% SINCE 2010 MEDIAN AGE | 36 8
RATE | 3 4% MEDIAN HOUSEHOLD INCOME | $80,291
COMMUTE TIME | 28 2 MINUTES
OWNERSHIP RATE | 64 2%
PROPERTY SALE PRICE | $597,144
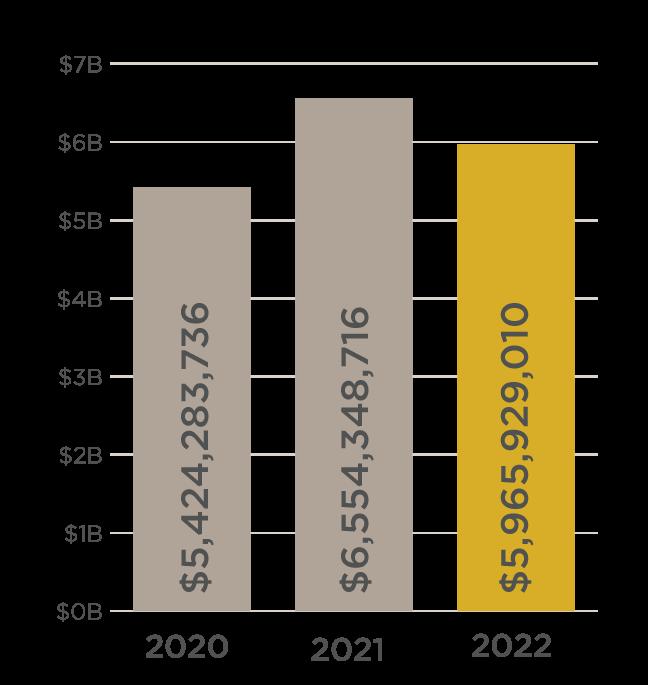
2020
SALES VOLUME NO. OF SALES AVG. DAYS ON MARKET AVG. SALE MEDIAN SALE
2018 $3,772,162,541 7,654 23 $492,835 $410,000
2019 $4,071,078,804 8,095 28 $502,913 $420,000
2020 $4,784,819,705 8,799 22 $543,791 $450,000
2021 $5,680,462,559 8,770 11 $647,715 $535,000
2022 $5,032,034,299 7,086 16 $710,137 $597,144
CONDOMINIUM & TOW NHOME
2018 $1,083,244,979 3,900 19 $277,755 $260,000 2019 $1,183,914,406 4,062 29 $291,461 $270,000
2020 $1,313,230,271 4,309 26 $304,765 $282,000
2021 $1,641,156,195 4,740 14 $346,235 $322,950
2022 $1,443,593,459 3,755 13 $384,446 $365,000
The Slifer Report 2023 | 17
SINGLE FAMILY & DUPLEX
SALES VOLUME NO OF SALES AVG DAYS ON MARKET AVG SALE MEDIAN SALE
$282 AveragePricePer SquareFoot AREA highlights AVERAGE PRICE PER SQUARE FOOT SALE VS. LIST PRICE COMPARISON 2018 2019 2020 2021 2022 Single Family & Duplex $196 $201 $213 $254 $282 Condominium & Townhome $208 $213 $223 $256 $294 AVERAGE SALE / LAST LISTED PRICE Single Family & Duplex 100 40% Condominium & Townhome 100 70% 8,0 0 0 ACRES OF OPEN SPACE 12% Median SalesPrice 19% no.of Sales Arapahoe County Data SALES VOLUME COMPARISON

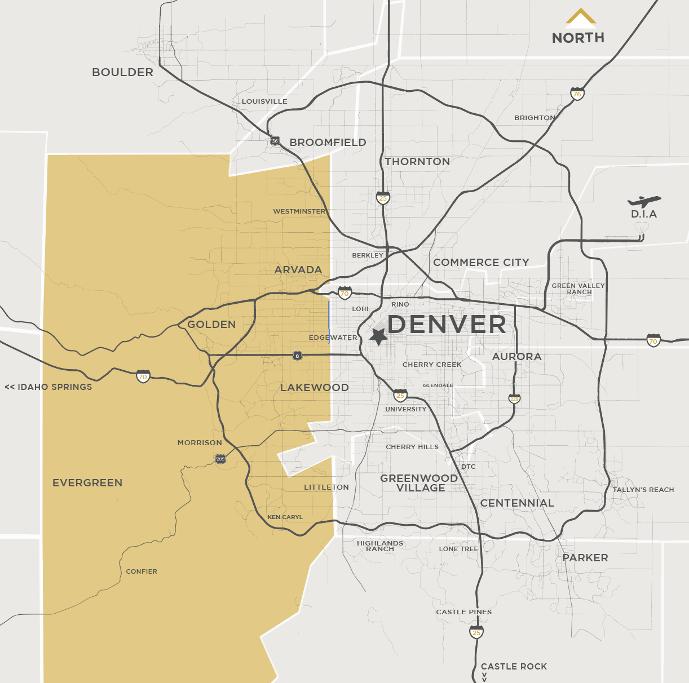
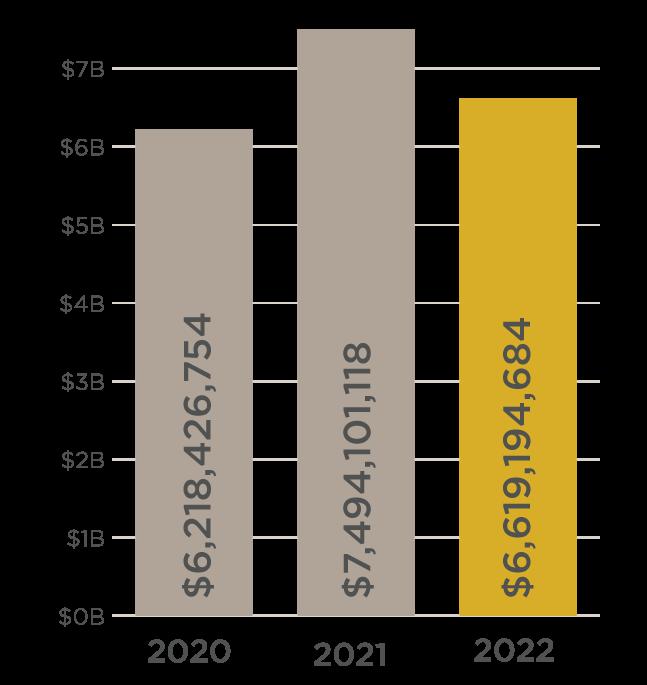
WEST METRO | FOOTHILLS POPULATION | 579,581 POPULATION GROWTH | +8 42% SINCE 2010 MEDIAN AGE | 40 2 *UNEMPLOYMENT RATE | 3.0% MEDIAN HOUSEHOLD INCOME | $87,793 AVERAGE COMMUTE TIME | 27 8 MINUTES HOME OWNERSHIP RATE | 717% *MEDIAN PROPERTY SALE PRICE | $680,500 SOURCE| 2020 datafromDataUSA&US Bureauof Labor Statistics *MedianSalefor SingleFamily&Duplex for 2022 *Unemployment Rate:Q4 2022 IN THE KNOW... 5TIDBITSFROM THELOCALS 1. DINE at Sherpa House 2. VISIT Staunton State Park for ample hiking trails 3 FIND vintage goods at the Pine Emporium 4. FLOW at Yoga on the Rocks 5. TUBE down Clear Creek in Golden Pictured | Red Rocks Park & Amphitheater
SALES VOLUME NO. OF SALES AVG. DAYS ON MARKET AVG. SALE MEDIAN SALE
2018 $3,828,913,484 7,383 25 $518,612 $451,000
2019 $4,023,629,786 7,489 28 $537,272 $472,500
2020 $5,137,097,685 8,724 22 $588,847 $520,000
2021 $6,161,253,950 8,719 12 $706,647 $615,000
2022 $5,377,310,346 6,791 17 $791,829 $680,500
CONDOMINIUM & TOW NHOME
2018 $823,464,377 2,669 17 $308,529 $282,000
2019 $897,109,119 2,787 23 $321,891 $295,000
2020 $1,053,526,857 3,142 20 $335,305 $310,000
2021 $1,208,497,361 3,133 12 $385,732 $363,500
2022 $1,238,562,609 2,753 14 $449,896 $415,000
The Slifer Report 2023 | 19
SINGLE FAMILY & DUPLEX
SALES VOLUME NO OF SALES AVG DAYS ON MARKET AVG SALE MEDIAN SALE
$320 AveragePricePer SquareFoot AREA highlights AVERAGE PRICE PER SQUARE FOOT SALE VS. LIST PRICE COMPARISON 2018 2019 2020 2021 2022 Single Family & Duplex $212 $219 $237 $284 $320 Condominium & Townhome $237 $244 $253 $299 $337 AVERAGE SALE / LAST LISTED PRICE Single Family & Duplex 100 50% Condominium & Townhome 10100% 72% HOME OW NERSHIP 11% Median SalesPrice 22% no.of Sales Jefferson County Data SALES VOLUME COMPARISON

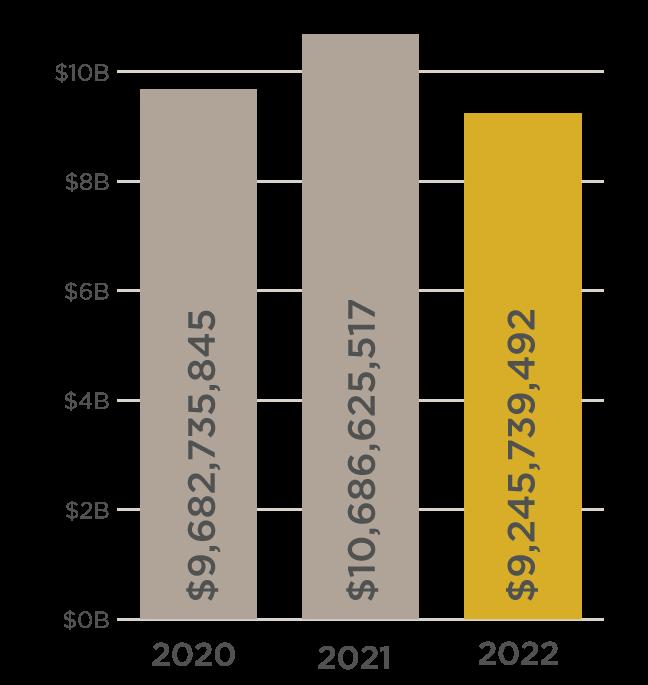
NORTHERN COLORADO SOURCE| 2020 datafromDataUSA&US Bureauof Labor Statistics *MedianSalefor SingleFamily&Duplex for 2022 *Unemployment Rate:Q4 2022 IN THE KNOW... TOP5TIDBITSFROM THELOCALS 1 BOOK a tee time at TPC Colorado Golf Club 2. FLOAT down the beautiful Cache La Poudre River 3 LOUNGE at Social Speakeasy 4 JAM out at the Mishawaka Amphitheatre 5. CAMP at Big Thompson Campground on Carter Lake Reservoir POPULATION | 702,569 POPULATION GROWTH | +27 17% SINCE 2010 MEDIAN AGE | 35 4 *UNEMPLOYMENT RATE | 3 1% MEDIAN HOUSEHOLD INCOME | $75,349 AVERAGE COMMUTE TIME | 25 7 MINUTES HOME OWNERSHIP RATE | 70.4% *MEDIAN PROPERTY SALE PRICE | $ Pictured | Horsetooth Reservoir
2018 $2,238,685,597 5,231 44 $427,965 $386,000 2019 $2,468,012,218 5,592 41 $441,347 $396,080 2020 $8,379,326,144 18,141 36 $461,900 $412,500 2021 $8,986,668,632 16,715 21 $537,641 $475,000 2022 $7,843,076,404 12,947 21 $605,783 $535,000 CONDOMINIUM
2018 $191,737,880 643 46 $298,193 $281,000 2019 $199,160,096 656 34 $303,598 $289,900 2020 $954,264,071 2,952 51 $323,260 $305,000 2021 $1,183,059,886 3,190 26 $370,865 $346,000 2022 $1,008,645,811 2,440 23 $413,379 $389,900
The Slifer Report 2023 | 21
SINGLE FAMILY & DUPLEX
SALES VOLUME NO. OF SALES AVG. DAYS ON MARKET AVG. SALE MEDIAN SALE
AVG DAYS
AVG
& TOW NHOME SALES VOLUME NO OF SALES
ON MARKET
SALE MEDIAN SALE
$268 PricePer Square Foot AREA highlights AVERAGE PRICE PER SQUARE FOOT SALE VS LIST PRICE COMPARISON 2018 2019 2020 2021 2022 Single Family & Duplex $189 $194 $203 $235 $268 Condominium & Townhome $208 $219 $224 $252 $287 AVERAGE SALE / LAST LISTED PRICE Single Family & Duplex 100 00% Condominium & Townhome 100 00% #1 FASTEST GROW ING REGION IN COLORADO 13% MedianSalesPrice 23% no of Sales Larimer & Weld County Data SALES VOLUME COMPARISON


 Pictured | Mountain Goat on Mt Blue Sky