
Condo Report Mission Bay 2024 Q1 Paul Hwang | Ranked #1 Broker 415.216.8746 | paul@skyboxrealty.com
Hello Neighbors,
2023 ended with lowered interest rates and a boom in the AI sector. Q1 2024 had your over year decrease in the number of condominium transactions, although the average sales price increased. Buyer traffic slowed at the end of Q1. Well priced two bedroom demand is outpacing one bedroom demand. Rents continue to hold up, however, may be positioned for a decrease.
Three Fed rate cuts are anticipated for the remainder of the year. Macy’s Flagship in Union Square shockingly announced their closing, yet we are seeing new businesses opening in our immediate area, Saint Frank Coffee & Boichik Bagels to name a few. The National Association of Realtors settled a historic lawsuit that will change the commission structure for Realtors. Realtors are no longer allowed to pre-fix and advertise the commissions for buyers’ agents. These changes begin in July.
The combination of rising equities and lower interest rates will favorably benefit condominium sales for the remainder of 2024. Typically the year after an election year is not as strong as the election year. Please contact me for a personalized analysis of your real estate needs, I look forward to being of service to you.
Best Regards,
Paul Hwang, Ranked #1 in South Beach | 415.216.8746
This document has been prepared by Skybox Realty for advertising and general information only. Skybox Realty makes no guarantees, representations or warranties of any kind, expressed or implied, regarding the information including, but not limited to, warranties of content, accuracy and reliability. Any interested party should undertake their own inquiries as to the accuracy of the information. Skybox Realty excludes unequivocally all inferred or implied terms, conditions and warranties arising out of this document and excludes all liability for loss and damages arising there from.
Skybox Realty 2024 Q1 Report All Data From SFARMLS
© Skybox Realty Inc, 2024 3 Paul Hwang | 415.216.8746 | paul@skyboxrealty.com Table of Contents Mission Bay 2024 Q1 Snapshot 235 Berry 255 Berry Arterra Park Terrace The Beacon Madrone Radiance Arden One Mission Bay Q1 Sales Who You Work With Matters 5 6 - 9 10 - 13 14 - 17 18 - 21 22 - 25 26 - 29 30 - 33 34 - 37 38 - 41 42 - 43 44 - 45
THE BEACON

Caltrain


BERRY300 BERRY325

I 280


Oracle Park
China Basin Park

MISSIONCREEK BERRY ST

ONE MISSION BAY BERRY235 BERRY255
CHANNELST

4TH ST

ARDEN
LONGBRIDGEST
RADIANCE MADRONE

CHINA BASIN ST
MISSION BAY BLVD NORTH


MISSION BAY

OWENSST
3RD ST


BRIDGEVIEW WAY

UCSF

Mission Bay
16TH ST

MISSISSIPPI ST

Mariposa Park
UCSF Medical Center
MARIPOSA ST

TENNESSEE
SOUTH ST
The Chase Center
ILLINOIS ST TERRY A FRANCOIS BLVD

Mission Bay 2024 Q1
© Skybox Realty Inc, 2024 5 Paul Hwang | 415.216.8746 | paul@skyboxrealty.com
of Transactions
Average Price per Square Foot
Average Sales Price
Average Days on the Market 91 22% YOY / 40% QOQ 17% YOY / 58% QOQ .2% YOY / 13% QOQ 17% YOY / 49% QOQ
Median Price $1,145,150
#
14
$1,036
$1,342,614
*
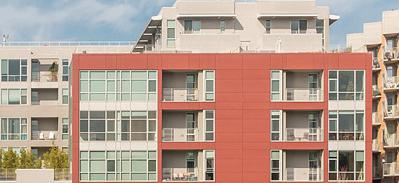
235 Berry
307 | $1,345,000 (2BR) $1089/sf

All Data From SFARMLS

© Skybox Realty Inc, 2024 7 SOLD ACTIVE IN CONTRACT OFF MARKET 502 | $1,050,000 (2BR) $1094/sf

All Data From SFARMLS 235 Berry # of Transactions 0 Average Sales Price $------- YOY / ---- QOQ ---- YOY / ---- QOQ * Median Price $---Q1 Q4 Q3 Q2 Price Per SF MEDIAN $/SF $1200 $1100 $1000 $900 AVG $/SF
© Skybox Realty Inc, 2024 9 235 Berry Buyer Demographic Average $/SF $---Average Days on Market ------- YOY / ---- QOQ ---- YOY / ---- QOQ CASH LOAN UNKNOWN 2023 Q3 2023 Q4 2024 Q1 No Sales in 2023 Q4 No Sales in 2023 Q3 No Sales in 2024 Q1

All Data From SFARMLS
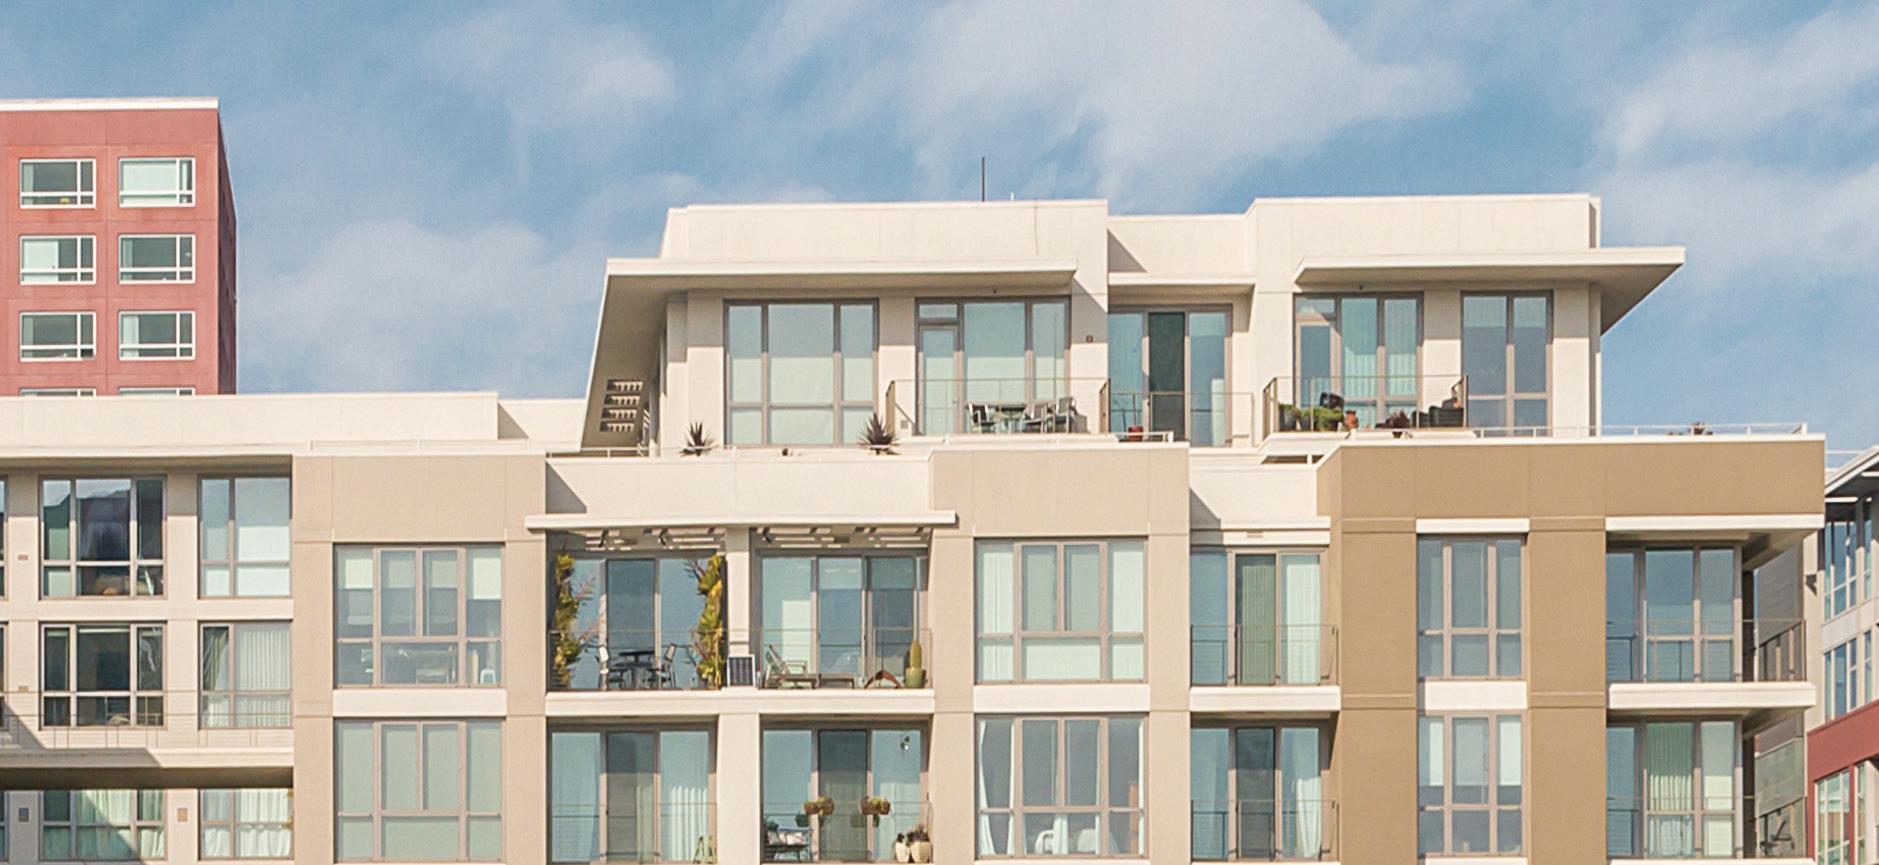
255 Berry

© Skybox Realty Inc, 2024 11 SOLD ACTIVE IN CONTRACT OFF MARKET

All Data From SFARMLS 255 Berry # of Transactions 0 Average Sales Price $---100% YOY / ---- QOQ 100% YOY / ---- QOQ * Median Price $---Q1 Q4 Q3 Q2 Price Per SF MEDIAN $/SF $1200 $1100 $1000 $900 AVG $/SF $1,052/SF
© Skybox Realty Inc, 2024 13 255 Berry Buyer Demographic Average $/SF $---Average Days on Market ---100% YOY / ---- QOQ 100% YOY / ---- QOQ CASH LOAN UNKNOWN 2023 Q3 2023 Q4 2024 Q1 No Sales in 2023 Q3 No Sales in 2023 Q4 No Sales in 2024 Q1
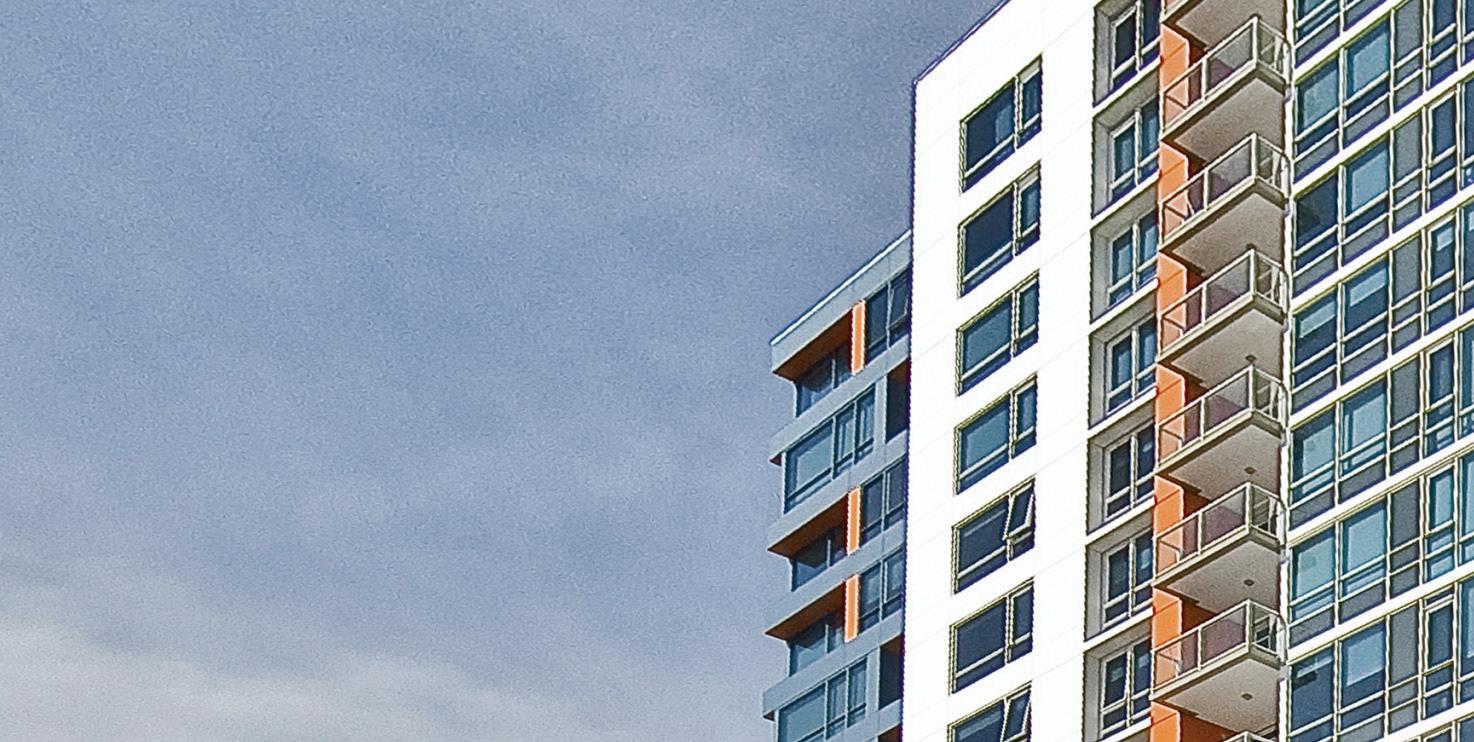
Arterra
All Data From SFARMLS
515 | $742,000 (1BR) $1016/sf
1411 | $1,068,000 (2BR) $1146/sf
© Skybox Realty Inc, 2024 15 SOLD ACTIVE IN CONTRACT OFF MARKET 1505 | $803,000 (1BR) $1097/sf 618 | $699,000 (1BR) $----/sf 501 | $1,065,300 (2BR) $930/sf
All Data From SFARMLS
# of Transactions 3 50% YOY / ---- QOQ Average Sales Price $870,100 24% YOY / 2.4% QOQ * Median Price $803,000 Q4 Q3 Q2 Price Per SF MEDIAN $/SF $1250 $1150 $1050 $950 AVG $/SF $1,020/SF Q1 $1,037/SF $1,014/SF
Arterra
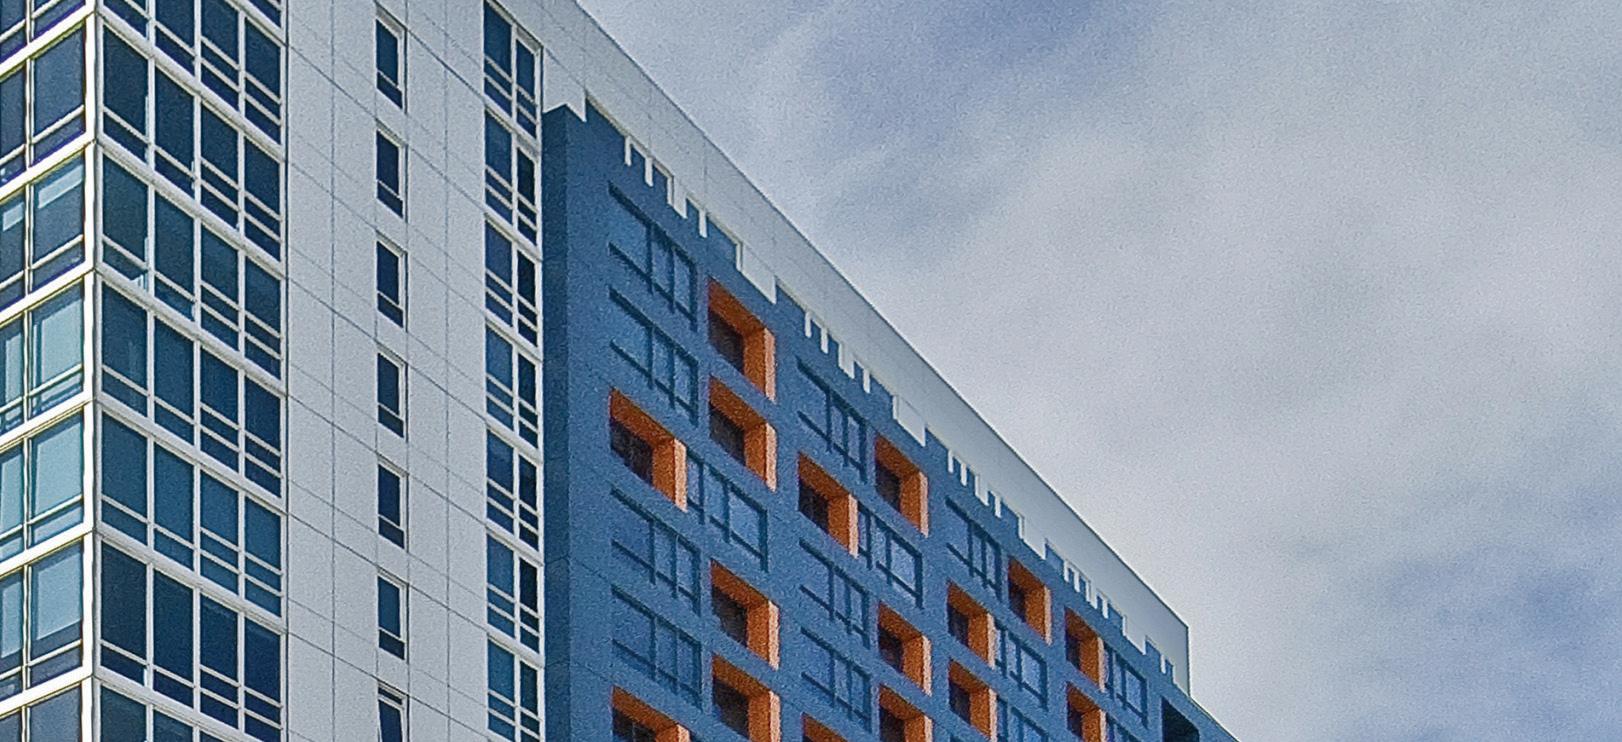
© Skybox Realty Inc, 2024 17 300 Berry Average $/SF $1,014 Average Days on Market 76 Buyer Demographic 9.8% YOY / .6% QOQ 153% YOY / 105% QOQ CASH LOAN UNKNOWN 2023 Q3 2023 Q4 2024 Q1
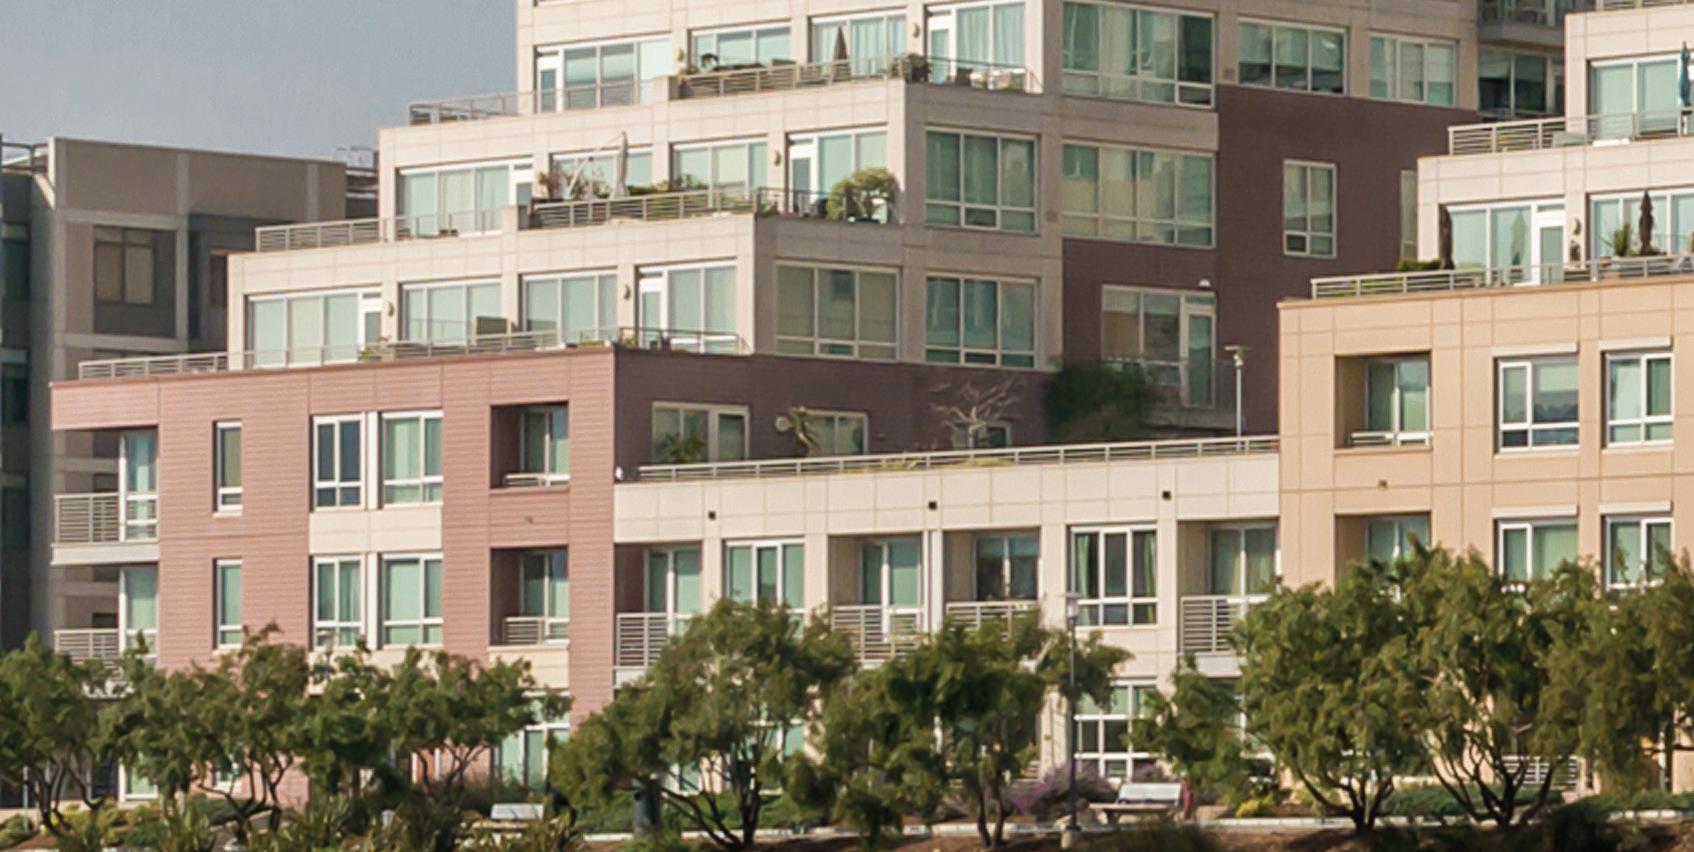
Park Terrace

All Data From SFARMLS

© Skybox Realty Inc, 2024 19 SOLD ACTIVE IN CONTRACT OFF MARKET
All Data From SFARMLS
# of Transactions 0 ---- YOY / ---- QOQ Average Sales Price $------- YOY / ---- QOQ * Median Price $---Q1 Q4 Q3 Q2 Price Per SF MEDIAN $/SF $1100 $1000 $900 $800 AVG $/SF $950/SF $1,104/SF
Park Terrace

© Skybox Realty Inc, 2024 21 325 Berry Average $/SF $---Average Days on Market ---Buyer Demographic ---- YOY / ---- QOQ ---- YOY / ---- QOQ CASH LOAN UNKNOWN 2023 Q3 2023 Q4 2024 Q1 No Sales in 2023 Q4 No Sales in 2024 Q1
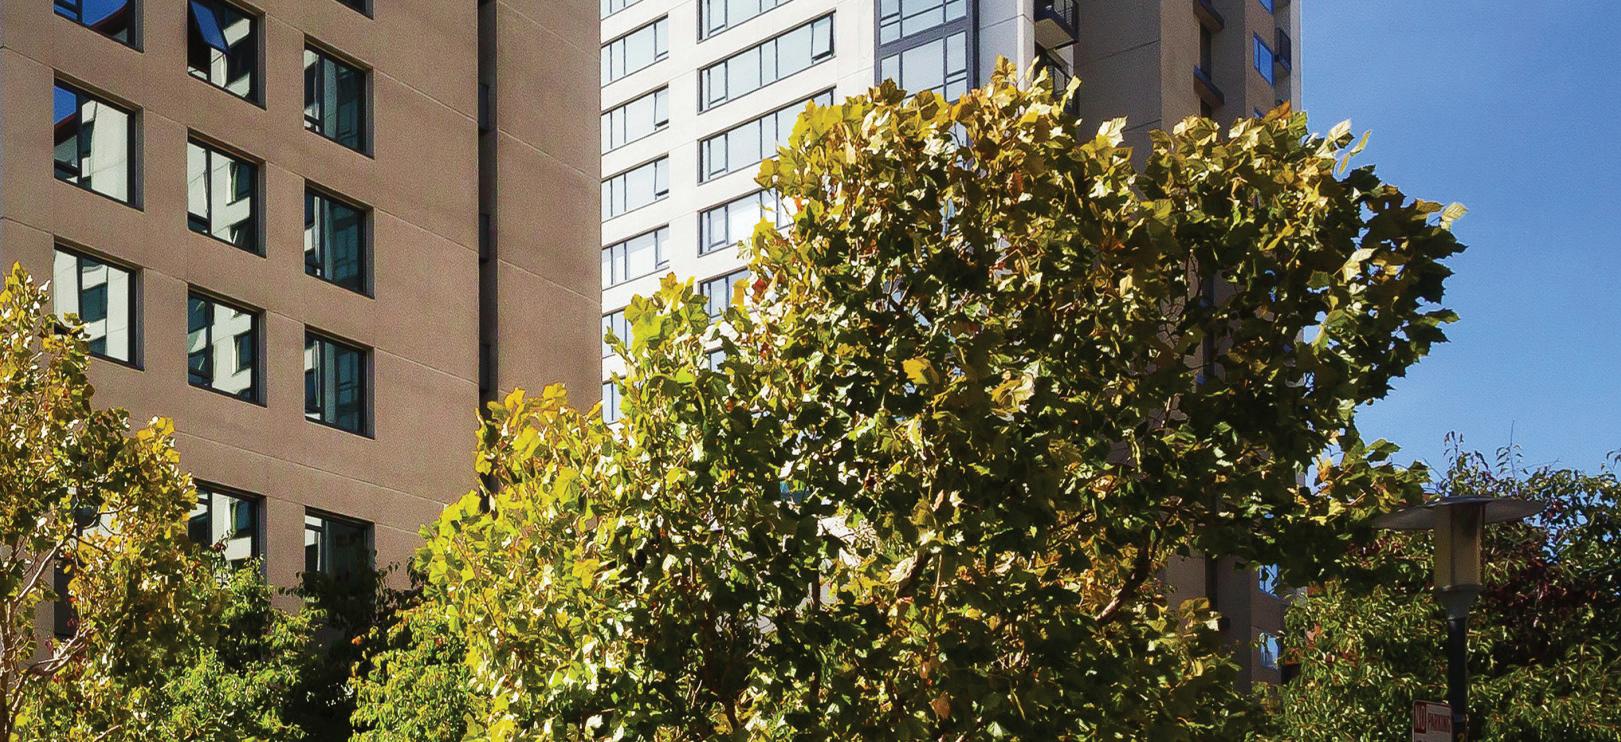
The Beacon


All Data From SFARMLS
544 | $999,500 (2BR) $899/sf 961 | $579,000 (1BR) $937/sf 365 408 | $679,000 (1BR) $863/sf


© Skybox Realty Inc, 2024 23 SOLD ACTIVE IN CONTRACT OFF MARKET 534 | $578,000 (1BR) $761/sf 1403 | $1,225,000 (2BR) $953/sf 372 | $699,999 (1BR) $931/sf 953 | $579,000 (1BR) $----/sf 423 | $850,000 (2BR) $917/sf 854 | $475,000 (1BR) $764/sf 761 | $549,000 (0BR) $888/sf 1103 | $1,159,000 (2BR) $901/sf 1009 | $799,900 (1BR) $972/sf 1601 | $883,300 (1BR) $1062/sf 365 | $950,000 (2BR) $800/sf 1410 | $738,000 (1BR) $898/sf 857 | $799,000 (1BR) $724/sf 915 | $795,000 (1BR) $880/sf

All Data From SFARMLS
# of Transactions 4 43% YOY / 100% QOQ Average Sales Price $830,325 5.9% YOY / 10% QOQ * Median Price $810,650 Q1 Q4 Q3 Q2 Price Per SF MEDIAN $/SF $1000 $900 $800 $700 AVG $/SF $842/SF $897/SF $876/SF $919/SF
The Beacon
© Skybox Realty Inc, 2024 25 250 / 260 King Average $/SF $919 Average Days on Market 103 Buyer Demographic 5.5% YOY / 9.1% QOQ .98% YOY / 54% QOQ CASH LOAN UNKNOWN 2023 Q3 2023 Q4 2024 Q1
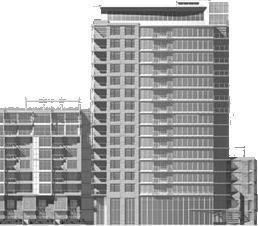
Madrone
611
442
420
305

All Data From SFARMLS
| $1,375,000 (2BR) $1169/sf
| $1,695,000 (2BR) $1428/sf
| $1,150,000 (1BR) $1243/sf
$1,549,000 (2BR) $1141/sf
|
© Skybox Realty Inc, 2024 27 SOLD ACTIVE IN CONTRACT OFF MARKET 118 | $799,000 (1BR) $888/sf 440 | $1,035,000 (2BR) $921/sf 547 | $1,600,000 (2BR) $950/sf

All Data From SFARMLS
# of Transactions 2 60% YOY / 100% QOQ Average Sales Price $1,317,500 1.8% YOY / 100% QOQ * Median Price $1,317,500 Q1 Q4 Q3 Q2 Price Per SF MEDIAN $/SF $1200 $1100 $1000 $900 AVG $/SF $1,112/SF $935/SF
Madrone

© Skybox Realty Inc, 2024 29 420 / 480 Mission Bay, 435 China Basin Average $/SF $935 Average Days on Market 216 Buyer Demographic 18% YOY / 100% QOQ 575% YOY / 100% QOQ CASH LOAN UNKNOWN 2023 Q3 2023 Q4 2024 Q1 No Sales in 2023 Q3 No Sales in 2023 Q4
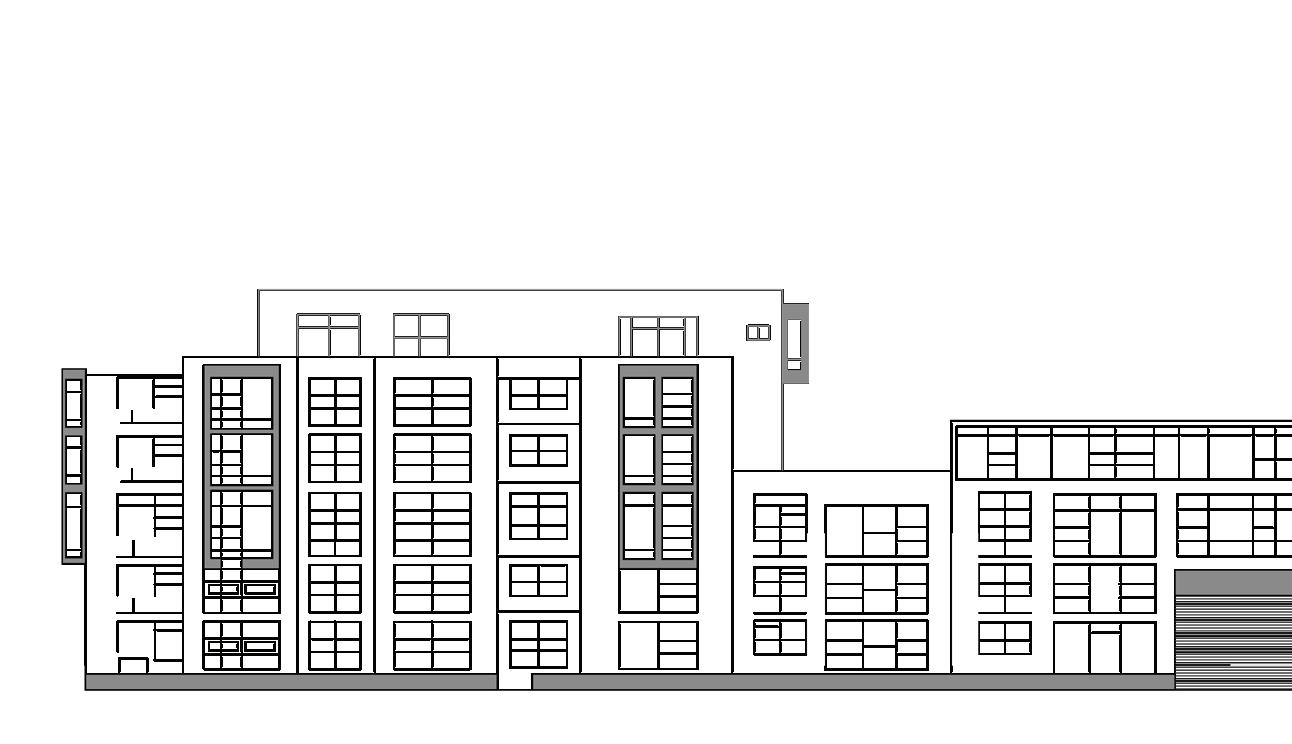
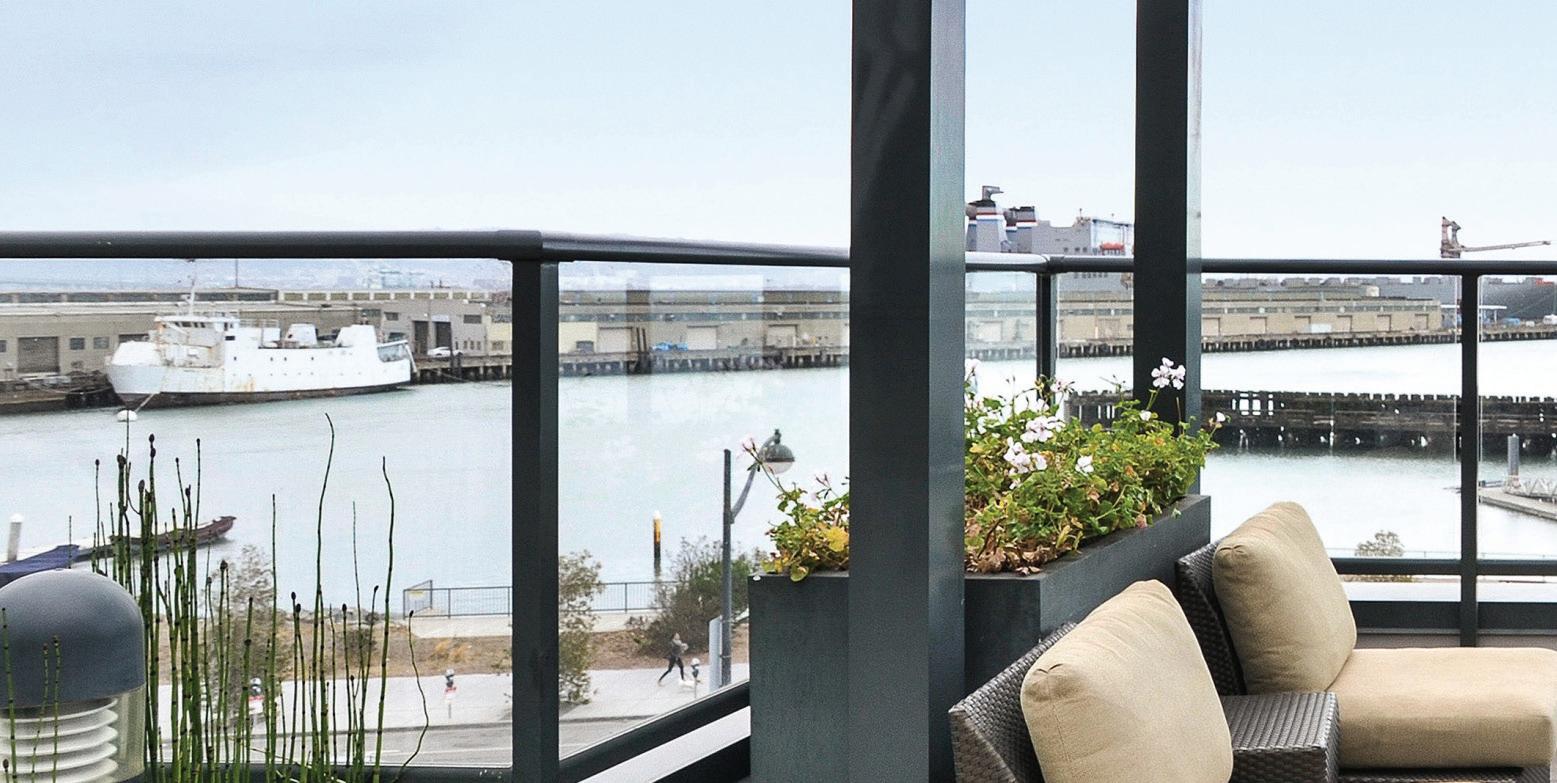
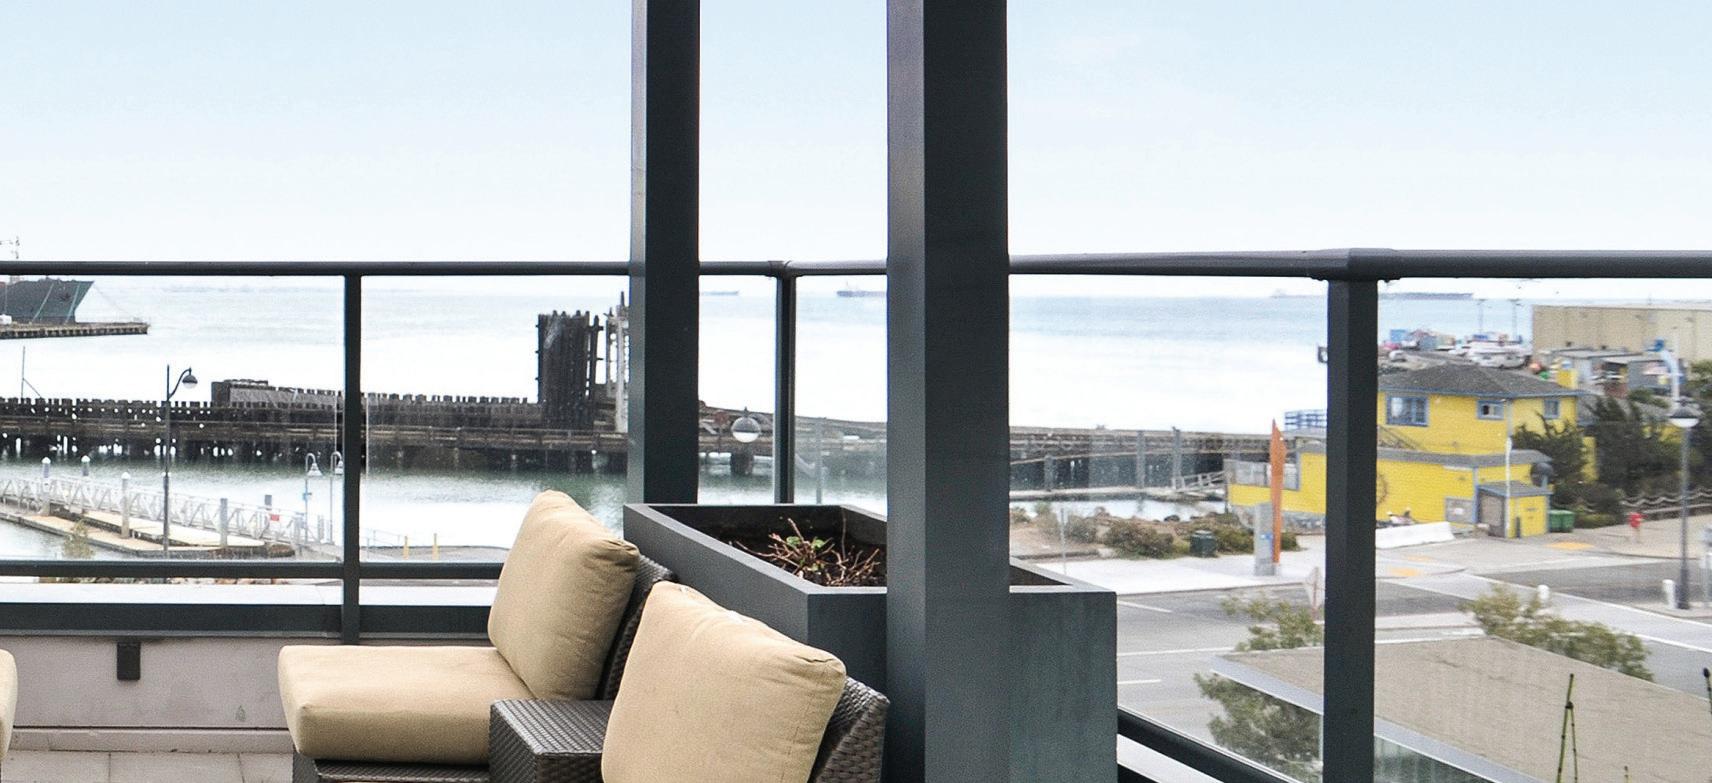
Radiance
All Data From SFARMLS
| $1,195,000 (2BR) $----/sf
405

© Skybox Realty Inc, 2024 31 SOLD ACTIVE IN CONTRACT OFF MARKET
All Data From SFARMLS Radiance # of Transactions 0 ---- YOY / 100% QOQ Average
$------- YOY / 100% QOQ * Median Price $---Q1 Q4 Q3 Q2 Price Per SF MEDIAN $/SF $1200 $1100 $1000 $900 AVG $/SF $1,004/SF $1,009/SF
Sales Price
© Skybox Realty Inc, 2024 33
Average $/SF $---Average Days on Market ---Buyer Demographic ---- YOY / 100% QOQ ---- YOY / 100% QOQ CASH LOAN UNKNOWN 2023 Q3 2023 Q4 2024 Q1 No Sales in 2024 Q1 No Sales in 2023 Q3
330 Mission Bay, 325 China Basin
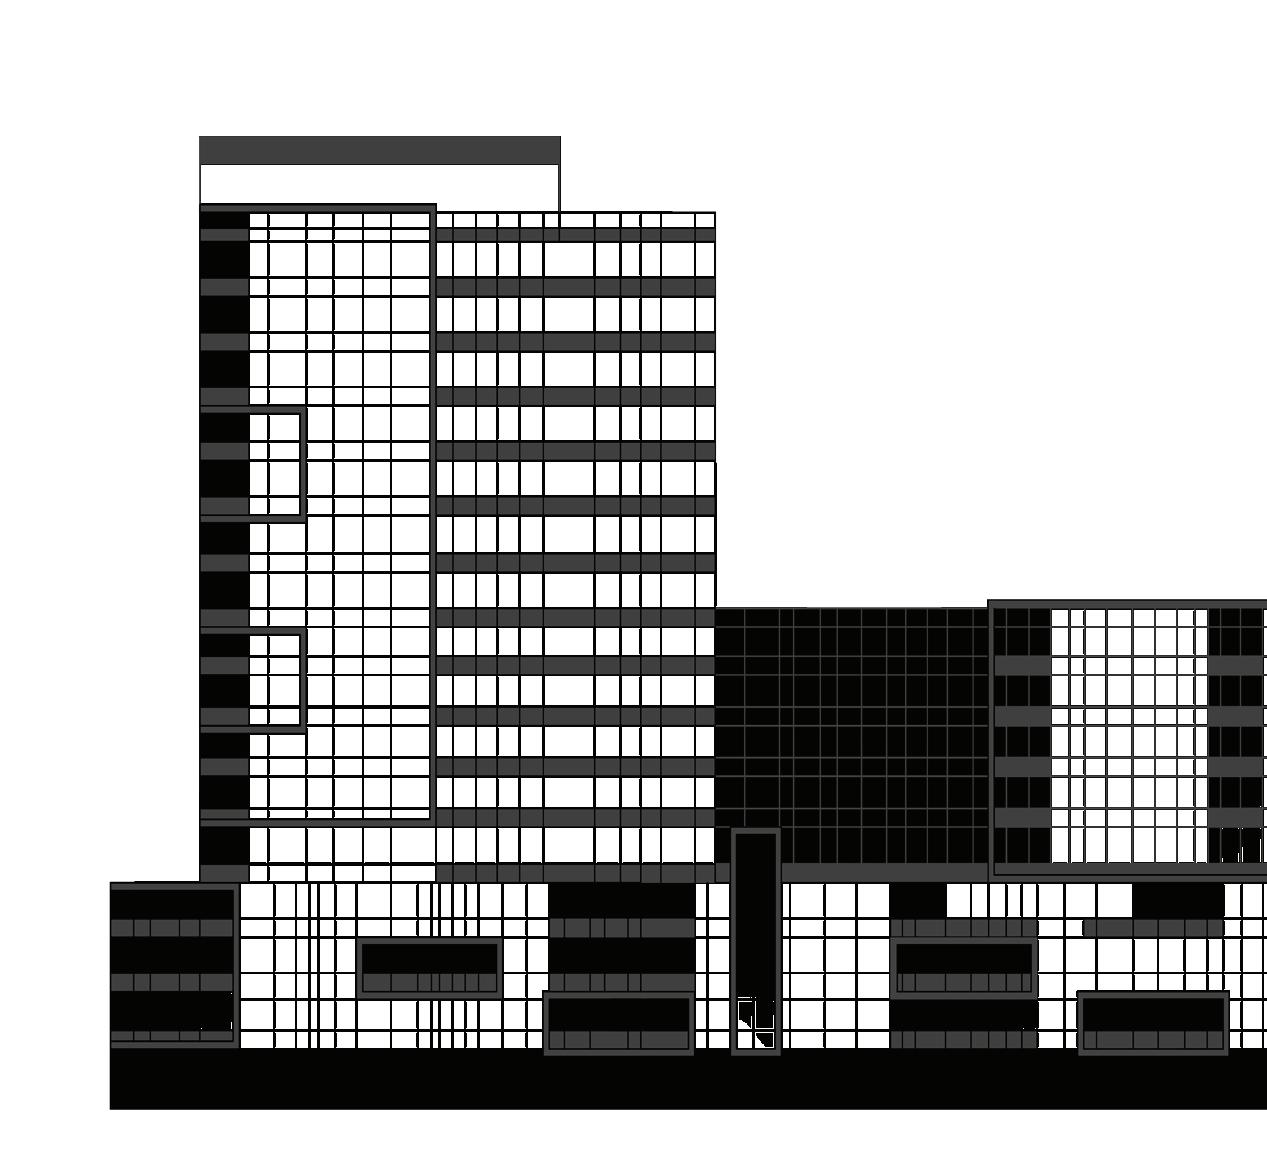
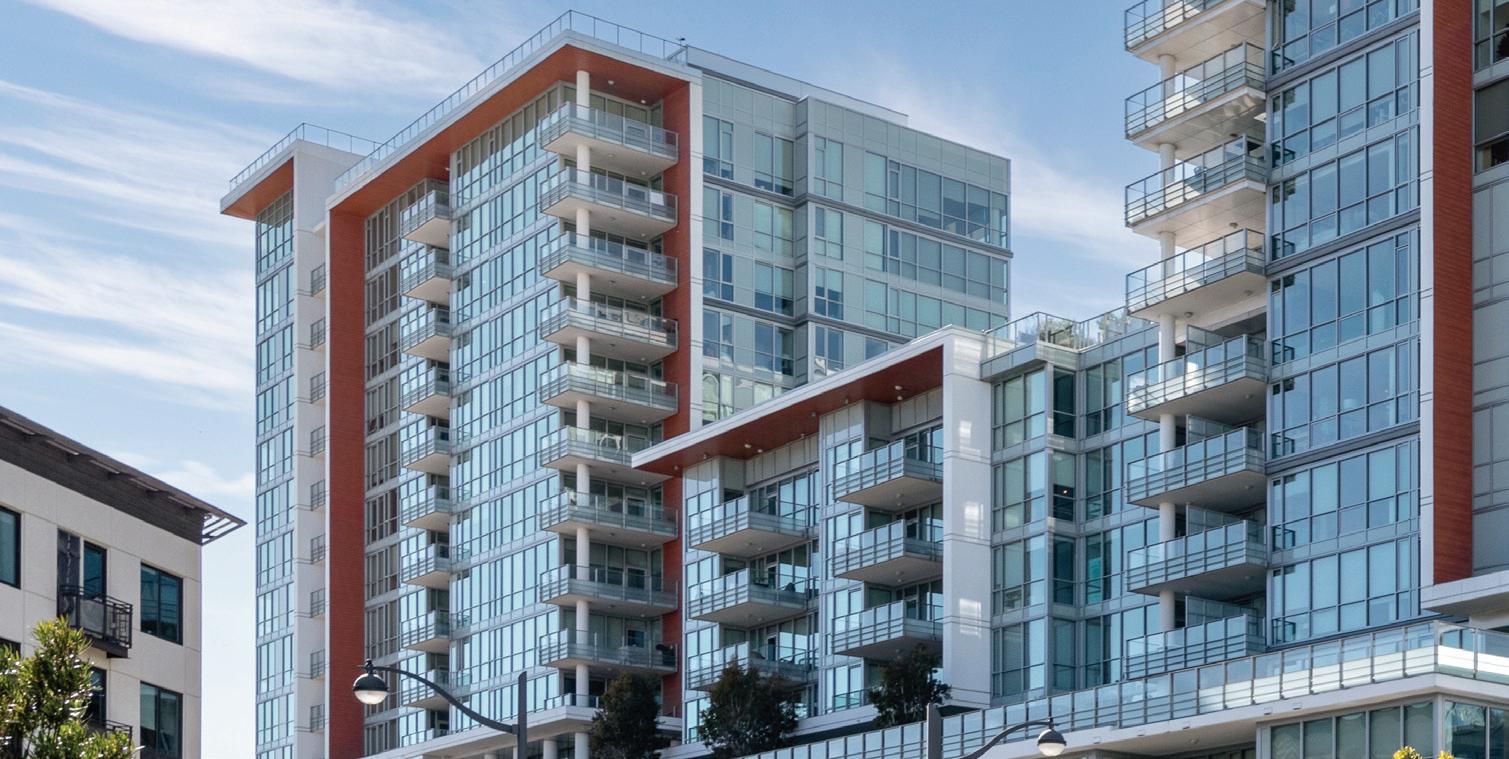
Arden
900 | $1,849,000
220 | $899,000 (1BR) $1049/sf
All Data From SFARMLS
(2BR) $1394/sf

© Skybox Realty Inc, 2024 35 SOLD ACTIVE IN CONTRACT OFF MARKET 212 | $1,550,000 (2BR) $1181/sf 605 | $3,100,000 (3BR) $----/sf 508 | $1,550,000 (2BR) $1300/sf 909 | $1,580,000 (2BR) $1295/sf 1011 | $1,050,000 (1BR) $1339/sf
All Data From SFARMLS
# of Transactions 3 200% YOY / 200% QOQ Average Sales Price $2,076,667 8.8% YOY / 50% QOQ * Median Price $1,580,000 Q1 Q4 Q3 Q2 Price Per SF MEDIAN $/SF $1300 $1200 $1100 $1000 AVG $/SF $1,156/SF $1,284/SF $969/SF $1,238/SF
Arden

© Skybox Realty Inc, 2024 37 Average $/SF $1,238 Average Days on Market 45 Buyer Demographic 16% YOY / 28% QOQ 100% YOY / 18% QOQ CASH LOAN UNKNOWN 2023 Q3 2023 Q4 2024 Q1 708 / 718 Long Bridge
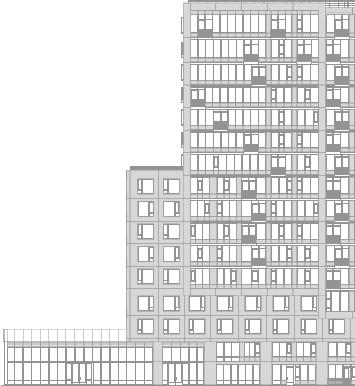
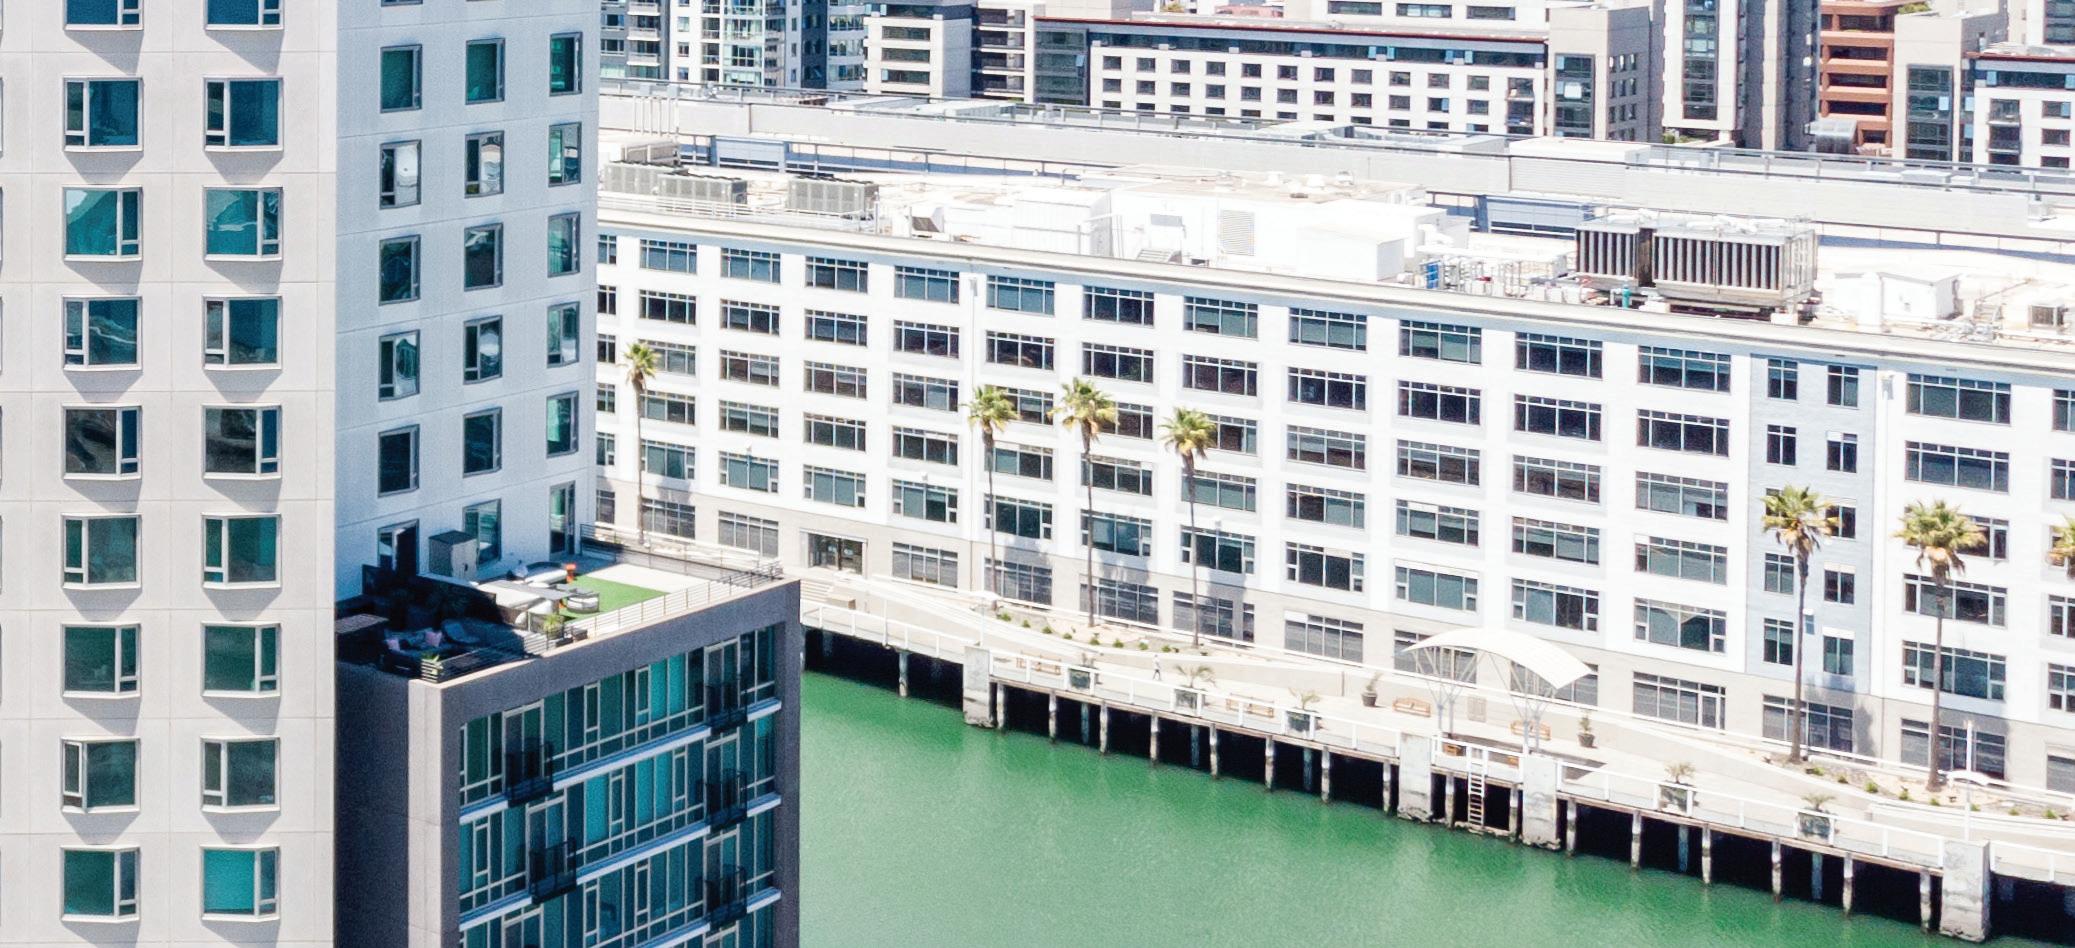
One Mission Bay Resales
All Data From SFARMLS
433 | $1,500,000 (2BR) $1270/sf 1401 | $2,680,000 (3BR) $1356/sf 814 | $1,298,000 (2BR) $1083/sf

© Skybox Realty Inc, 2024 39 SOLD ACTIVE IN CONTRACT OFF MARKET 421 | $899,000 (1BR) $1178/sf 1406 | $1,320,000 (2BR) $1042/sf
One Mission Bay Resales

All Data From SFARMLS
# of Transactions 2 ---- YOY / 100% QOQ Average
$2,000,000 59% YOY / 233% QOQ * Median Price $2,000,000 Q1 Q4 Q3 Q2 Price Per SF MEDIAN $/SF $1300 $1200 $1100 $1000 AVG $/SF $1,271/SF $1,196/SF $1,181/SF $1,199/SF
Sales Price
© Skybox Realty Inc, 2024 41 Average $/SF $1,199 Average Days on Market 61 Buyer Demographic 6.8% YOY / 1.5% QOQ 27% YOY / 43% QOQ CASH LOAN UNKNOWN 2023 Q3 2023 Q4 2024 Q1 1000 3rd, 110 Channel
2023 Q1 Sales
250 King 854
250 King 1410
300 Berry 515
300 Berry 1505
260 King 1601
435 China Basin 440
300 Berry 501
260 King 1403
1000 3rd 1406 708 Long Bridge
435 China Basin 547
1000
Skybox Realty 2024 Q1 Report All Data From SFARMLS
Address
212
909
708 Long Bridge
605 BR / BA 1 / 1 1 / 1 1 / 1 1 / 1 1 / 1 2 / 1 2 / 2 2 / 2 2 / 2 2 / 2 2 / 2 2 / 2.5 3 / 2.5 3 / 3 SQFT 622 822 730 732 832 1,124 1,146 1,286 1,267 1,312 1,220 1,685 1,976
3rd 1401 718 Long Bridge
* Only showing sold homes in buildings featured in this book. Does not include new construction or bmrs.
© Skybox Realty Inc, 2024 43
Hwang | 415.216.8746 | paul@skyboxrealty.com
Paul
Sale Price $475,000 $738,000 $742,000 $803,000 $883,300 $1,035,000 $1,065,300 $1,225,000 $1,320,000 $1,550,000 $1,580,000 $1,600,000 $2,680,000 $3,100,000 $/SF $763.67 $897.81 $1,016.44 $1,096.99 $1,061.66 $920.82 $929.58 $952.57 $1,041.83 $1,181.40 $1,295.08 $949.55 $1,356.28 $---% Sale/List 105.56 98.40 101.92 100.63 98.69 94.18 97.29 94.59 132.26 93.94 97.53 94.40 97.81 101.64

Skybox Realty 2024 Q1 Report All Data From SFARMLS
# of Transactions 107+ Sold Volume
Paul Hwang Activity (2021-2024 Sales)
Paul Hwang
$193,099,400
Call me to find out how we can feature your off market listing to all of our prospective buyers in our Quarterly Reports!
© Skybox Realty Inc, 2024 45
Hwang | 415.216.8746 | paul@skyboxrealty.com
Paul
*
Paul Hwang Leasing Activity
62+
2023 # Leased
2024 # Leased To Date 16+

Click here to subscribe to our digital monthly market updates and quarterly reports. Paul Hwang Ranked #1 in South Beach 415.216.8746 | dre 01371169 paul@skyboxrealty.com 流利國語


