

Survey Resources for St. Joseph’s Care Group Staff

This publication is available at https://redcap.link/sjcg_guide
Prepared by:

REDCap Survey Resources for St. Joseph’s Care Group Staff
Welcome to REDCap
REDCap (Research Electronic Data Capture) is a secure web application for building and managing online surveys and databases. The database and web server are both housed on St. Joseph’s Care Group servers, providing a stable, secure data storage environment meeting PIPEDA and PHIPA compliance standards.
The Centre for Applied Health Research (CAHR) at St. Joseph’s Care Group oversees management of the REDCap platform for the organization. While CAHR staff serve as REDCap administrators, we are limited in our capacity to provide user support. We encourage you to take advantage of this guidebook and the resources available within REDCap and on the internet before reaching out for assistance.
This Guidebook
Although REDCap has a number of capabilities, this beginner’s guidebook will focus on creating, administering, and managing a single survey project For additional REDCap information, advanced guides, and troubleshooting information, please refer to the ‘Help & FAQ’ and ‘Training Videos’ sections accessible from any REDCap screen. There are also numerous helpful sites and guides available on the internet.
Please keep in mind that your REDCap interface may look somewhat different from the illustrations included in this guidebook; interfaces will vary by administrative privilege and display size, and regular software updates may result in esthetic changes.
Getting Started
In order to access REDCap you will need a user account. Requests for new accounts must include manager approval and may be directed via email to the CAHR (maxwellh@tbh.net). New users will receive an email confirmation with a username, a temporary password, and instructions to finalize account set-up.
New users have the option of creating new projects from scratch or being assigned to pre-existing projects by other users. New projects may be requested by clicking the ‘+ New Project’ link (please allow up to 3 business days for approval), and all accessible projects are listed on the ‘My Projects’ page
Note that it is your responsibility to ensure that your project and its associated data meets with organizational standards (e.g., privacy and confidentiality requirements of the Research Ethics Board or Health Records).
Creating a Survey
1) Log into REDCap (redcap.sjcg.net), and navigate to your project (see ‘Getting Started’ on the previous page if you have no projects listed)
2) If this is your first time opening your project, you will be taken to the ‘Project Home’. To get started, navigate to ‘Project Setup’ via the tabs on the top of your screen, or via the toolbar menu.

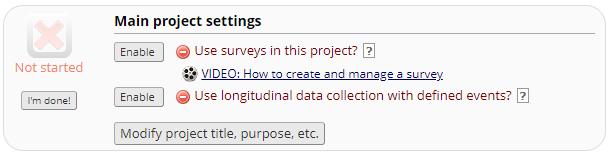
3) Enable surveys in the ‘Main project settings’, and then click ‘I’m done!’

4) Click ‘Online Designer’ in the ‘Design your data collection instruments’ section.


5) You should see ‘Form 1’ listed. To enable this instrument as a survey, click ‘Enable’


Tip: If you want to rename your instrument (above, we’ve changed it to ‘My First Instrument’), click the ‘Choose action’ button and select ‘Rename’ from the drop-down menu.
6) You should now be on the ‘Set Up My Survey’ page. There are a number of settings here, and most are optional. For example:
a. Basic Survey Options:
i. Modify the survey name that will appear at the top of the survey page
ii. Create instructions that respondents will see at the top of the survey page
b. Survey Design Options:
i. Add a logo
ii. Apply enhanced buttons and checkboxes if respondents are likely to be utilizing a phone/tablet
iii. Customize the color scheme
c. Survey Customizations:
i. Turn off/on auto numbering of fields
ii. Choose whether you want your survey on a single or multiple pages (better for longer surveys)
iii. Allow participants to download a pdf of their responses
d. Survey Access:
i. Create expiration dates
ii. Allow ‘Save & Return later’ options for respondents
e. Survey Termination Options:
i. Modify message to display upon survey completion
ii. Redirect respondents to another survey or website upon completion
iii. Set stop actions
iv. Send confirmation emails (receipts)*
Ensure you click ‘Save Changes’ at the bottom of this page to save your survey settings. You can come back to these settings at any point by clicking ‘Survey Settings’ which will now appear on the Online Designer page.
*Tip: If you are planning on sending confirmation emails, you will need to include a validated email field in your instrument (see the Advanced Customizations section in this guide for information on how to validate a field). In addition, you will need to designate this field for communications in ‘Project Setup’ > ‘Enable
optional modules and customizations’ Keep in mind that once email addresses are collected, the data will not be considered anonymous.
7) Once you’ve modified your survey’s settings and clicked the ‘Save Changes’ button, you will be directed back to Online Designer page. Click on the instrument name to begin adding fields to your survey.
a. Your instrument will be pre-populated with a ‘Record ID’ field’. We recommend leaving this field as it is.
b. To add a new field, click the ‘Add Field’ button to open the ‘Add New Field’ pop-up window:
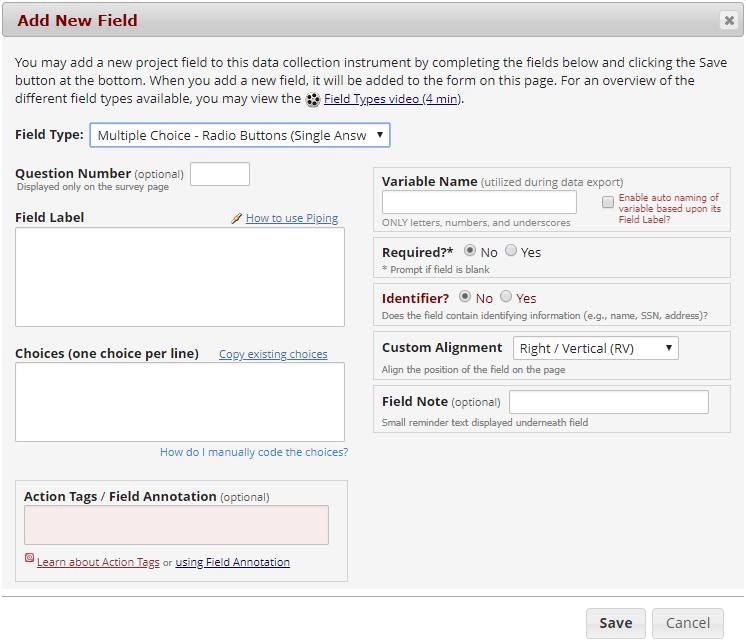

c. Select the Field Type you want to use from the ‘Field Type’ drop-down menu (see ‘Field Types’ breakdown in this guide more information on each type).
d. Create a ‘Field Label’ (visible to survey respondents this is typically the question you are asking).
e. Create a ‘Variable Name’ (only letters, numbers or underscores with no spaces). It’s advisable to keep this short yet still descriptive enough to be recognizable when it comes time to export your data.
f. For multiple choice and checkbox fields, you will need to define the response options. In the ‘Choices’ box, enter each response option on a separate line, in the order you want them to appear in the survey. Unless you wish to code your response values manually, REDCap will automatically assign each option a numerical value once you’ve entered your response options.


Tip: If you are repeating response options over a large number of fields, you can ‘Copy existing choices’ to copy response options from another field.
Tip: If you are listing scaled response items (i.e., responses related to each other with the purpose of measuring intensity, for example as never/sometimes/usually/always or agree/neutral/disagree) and plan to look at mean(average) scores, ensure you start by giving your most negative response the lowest value, and continue up the scale. When you calculate your means later on, higher means will indicate more positive responses, and vice versa.
g. Optional: make the field ‘Required’ to ensure all respondents complete it.
h. Optional: create a ‘Field Note’ to display a small message or reminder below the field.
i. Optional: apply validation (text fields) or action tags (see Advanced Customizations in this guide)
j. Click ‘Save’ to save your field.
Repeat these steps for every field in your survey.
Tip: Once you’ve created your field, you have some options to modify them.


Edit: launches ‘Edit Field’ pop-up window
Copy: create a duplicate of the current field
Branching Logic: launches ‘Branching Logic’ pop-up window (see description below)
Move: alternative to the drag-and-drop option if you need to change the order of your fields
Stop Action: terminates survey based on response (specialized type of branching logic)
Delete: permanently removes the field
Tip: when you have a number multiple choice fields in a row that require the same response options, you may choose ‘Add Matrix of Fields’ instead of ‘Add Field’. Here you can create multiple fields with a single list of response options.


8) Once your fields have been created, you have the option to use ‘Branching Logic’ if you want certain fields to only appear under specific conditions (see Advanced Customizations in this guide).
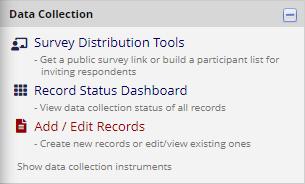
9) It’s now time to test your survey and make sure things behave as expected. While there is a ‘Preview instrument’ option in the Online Designer, you will need to launch the public, external version of your survey to test all functionality. To do this, select ‘Survey Distribution Tools’ from the toolbar menu.

You’ll now be in on ‘Survey Distribution Tools’ Page. Click ‘Open public survey’.

Thoroughly test your survey. Feel free to share the link provided on the ‘Survey Distribution Tools’ page with collaborators. Enter test data. Try exporting your test data to ensure it’s what you’re looking for (see section on Data Exports for information on how to do this). Go back and edit your survey in the Online Designer.
This testing process is very important; once you enter the data collection stage of your project, some survey edits will require approval by a CAHR administrator.
10) When you’re confident your survey is ready, it’s time to switch your project from its current ‘Development Status’ to ‘Production Status’. To do this, return to the ‘Project Setup’ page.
a. Click ‘I’m Done!’ in the ‘Design your data collection instruments & enable your surveys’ section .
b. Click ‘I’m Done!’ in the ‘Enable optional modules and customizations’ section
c. Click ‘I’m Done! in the ‘Test your project thoroughly’ section.
d. In the ‘Move your project to production status’ section below, click ‘Move project to production’ (if you’ve been entering test data, you will most likely select ‘Delete ALL data’ when prompted).
11) Begin data collection!
Editing a Survey in Production
In the last section you learned how to create a survey and move it from ‘Development Mode’ into ‘Production Status’. When a project is in Production and you need to make edits to a survey field, you will need to move the project into ‘Draft Mode’. This ensures that your edits do not occur in real-time, and guards against data corruption. Your survey will continue to function normally when you are in Draft Mode.
Please note that it is very important that you understand the basic functions of REDCap before attempting to edit a project in production. Edits have the potential to interfere with logic and calculated fields and carry the risk of corrupting your instrument alongside the data you have collected.
1) To begin editing your instrument, navigate to the ‘Designer’, accessible from the toolbar menu:


2) From the Designer page, click the option to ‘Enter Draft Mode’:


3) Once in draft mode, edit your fields as needed, noting the following best practices to avoid data orphaning/corruption:
a. Do not change variable names.
b. Do not delete fields or response options; utilize ‘Action Tags’ to hide questions and response options (see ‘Advanced Customizations’ in this guide).
c. Do not change the values of response options, or vice versa (instead, hide old options with Action Tags and create new ones)
d. While minor wording changes are acceptable, do not change the intent of a question.
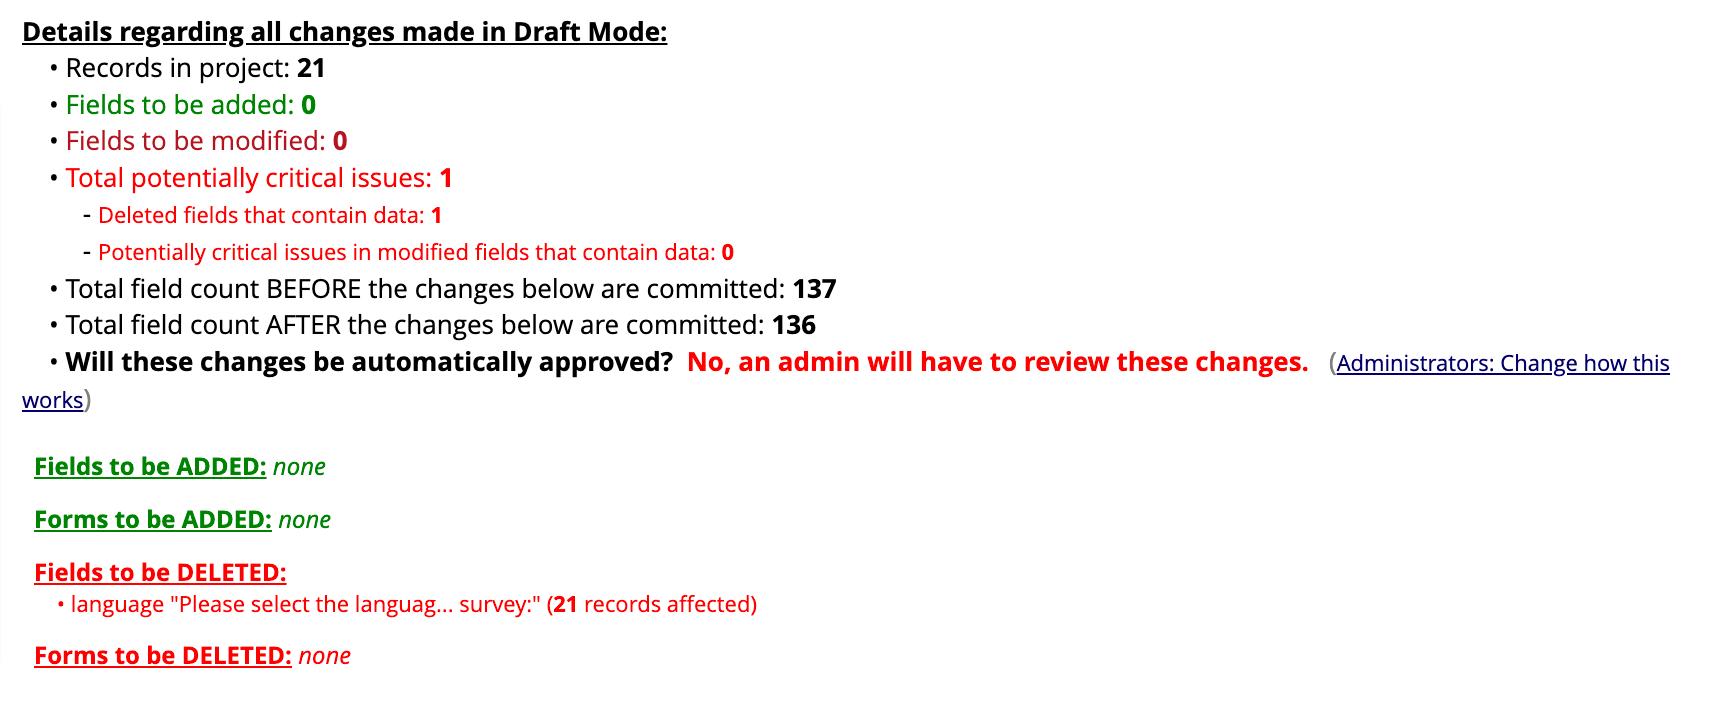
4) Once you are satisfied with your changes, navigate back to the main Online Designer page (list of instruments), and open your summary of drafted changes.


Carefully review the details of you drafted edits. Potentially critical issues are highlighted in red, which may be a sign of an unintended error. Be sure unintended errors are fixed before submitting your drafted changes in order to avoid downtime and loss of data.

5) ‘Submit Changes for Review’ to move your project and survey back into Production Status. Most edits are instantaneous. Others (especially those with potentially critical issues) may require administrator approval. Approvals are typically granted within 3 business days.
Field Types
Text Box: a single-line text box for text and numbers.
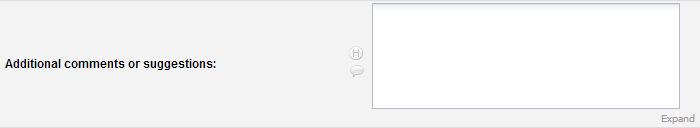
Notes Box: a large text box for a large amount of text. This is convenient for long descriptions and ‘Additional Comments’ boxes.

Calculated Field: a field which performs real-time calculations based on the entries in other fields. The syntax for complicated calculations can be intricate, but REDCap will alert you to any syntax errors, and will refuse to attempt calculations until they are resolved, preventing data errors. Variable names are referred to in [brackets] in the written calculation equation.


In this example, weight_lbs and height_in are two variables from previous questions being utilized to calculate Body Mass Index (BMI). Clicking the ‘How do I format the equation?’ link will open a dialog box describing some of the nuances and specifications of the calculation syntax, such as the rounding function used in this example.


In data entry, it is impossible to directly edit the value of a calculated field (hence the red text). This ensures the integrity of the calculation procedure.
Multiple Choice – Drop-down List: a drop-down menu with options. Only one option can be selected. This can help save space on a data form if there are many different choices to display.


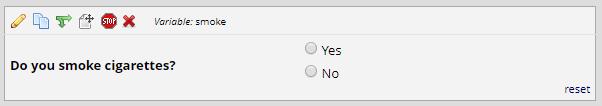
Multiple Choice – Radio Buttons: a set of radio buttons (round buttons), from which only one choice can be selected at a time. The ‘reset’ button in the corner removes any current selection and returns the field to a null (absent) value.
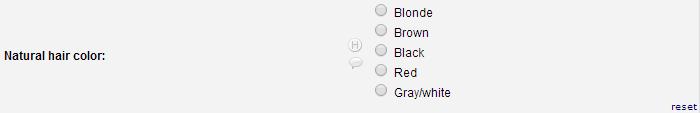

Tip: Enabling ‘Enhanced radio buttons and checkboxes’ in survey settings makes the above example more user friendly for touch-screen users:


Check-boxes: check-boxes allow the selection of multiple options (i.e., ‘select all that apply).


Yes-No: radio buttons with the options ‘Yes’ and ‘No.’ These values are automatically coded: ‘Yes’ = 1, ‘No’ = 0.
True-False: radio buttons with the options ‘True’ and ‘False.’ These values are automatically coded: ‘True’ = 1, ‘False’ = 0.
Signature: A field to collect hand-drawn survey respondent signatures.
File Upload: an uploading tool for any associated images or documents that may need to be attached to individual records.
Slider: visual analogue scale coded as values 0-100. You may provide labels above the left, middle, and right sides of the slider.


Descriptive Text: text displayed with optional image/file attachment. The file may be displayed as a clickable (downloadable) link, or (if the file is an image) displayed in-line with the text.

Begin New Section: a field composed of a single line appearing in different color from the rest of your form, indicating separation. This is largely for aesthetic/organization purposes. Adding text (to serve as a header) is optional. When deploying a survey, you have the option to break each section into separate pages, giving these headers separation functionality (see ‘Survey Settings’)
Action Tags
Action Tags serve a number of different purposes within a field. For example, you can set default responses, generate timestamps, hide fields, or make fields read only. New Action Tags are added to REDCap with every iteration of the software.
You can utilize Action Tags when you create or edit a field.

Action Tags may be coded manually, or by clicking ‘Learn about Action Tags’ to browse tags and apply them to your field. Some of our favourite Action Tags include:
Tag
Description & Usage
@HIDDEN Hides the question from the respondent Useful when you no longer need the question but need to retain previously collected data.
@HIDECHOICE Hides a specific response option from the respondent Useful when you no longer need the response option but need to retain previously collected data
@TODAY Inserts the current date into a text field
@READONLY Makes the field read-only Often used in combination with other tags, such as @TODAY.
@WORLDLIMIT (@CHARLIMIT)
Set a limit for the number of words (or characters) in a text or notes field
Tip: The Action Tags field doubles as a space for field annotation.
Example
@HIDECHOICE=1,2
@WORDLIMIT=100
Branching Logic
Sometimes, you may want certain fields to only appear under specific conditions. As an example, you may wish to omit questions about smoking behaviour if you know the respondent doesn’t smoke.
1) Start by clicking the branching logic icon for the field that you want to remain hidden until certain conditions are met.
2) A branching logic pop-up window will appear. Use the ‘Drag-N-Drop Logic Builder’ to select the conditions under which you want the question to appear. In the example below, we only want the question (number of daily cigarettes consumed) to appear if the respondent indicates they are a smoker. Click ‘Save’.


Tip: branching logic can be simple (as with the example above) or very complex. To program more complex logic in your instrument, you have the option to utilize the ‘Advanced Branching Logic Syntax window’. Further details on this option are included in REDCap.
Notifications and Alerts
It is possible to receive an email when an online survey has been completed or when a completed survey meets certain criteria. From the ‘Applications’ toolbar, select ‘Alerts & Notifications’, then ‘+ Add New Alert’. Define the logic of the alert, its recipient(s), and email message, before hitting ‘Save’.
Tip: piping (see below) can be utilized to summarize survey responses in the body of the email message.
Piping
The Piping feature allows you to copy previously collected data into another part of your project. Some of the places piping can be used include field labels, field notes, section and matrix headers, response options, completion text, email receipts, and notifications/alerts. Start by identifying the data you want to ‘pipe’. In the example below, I want the response from the first question copied over into the field label for the second question. To do this, I identify the field label from the first question (ice_cream) and place it in square brackets where I want it to appear.


Below, you can see how this question will appear to respondents. Once they’ve selected their response in question one,

Validation
Validation allows you to control the type of data that can be entered into a text field. For example, you can ensure the data is formatted as a number, date, email address, postal code or phone number, and apply minimum/maximum acceptable ranges. Validation helps to avoid data entry errors, and ensures fields are correctly interpreted for data sorting and communication purposes. When a respondent attempts to enter data into a validated field, they will receive an error if the entry not formatted correctly.
Tip: When a text field is validated with a date format, respondents will have access to a pop-up calendar tool to assist with data entry.
Data Collection
Anonymous Surveys via the Public Survey Link
This is a very simple way to collect data. You distribute a single link to your survey, which does not track IP addresses, email addresses, or any other identifying information.
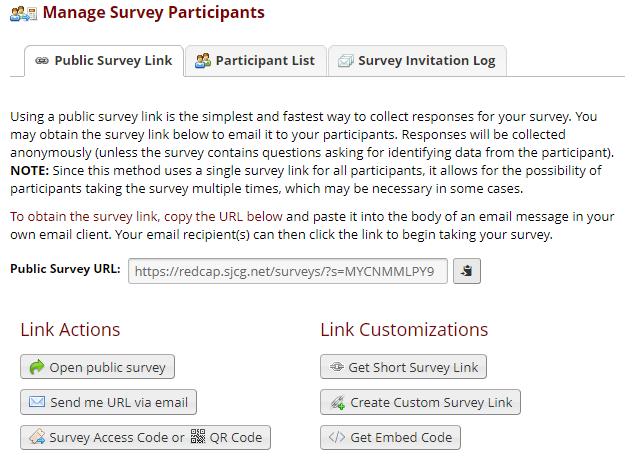
1) Navigate to ‘Survey Distribution Tools’ in your toolbar menu.

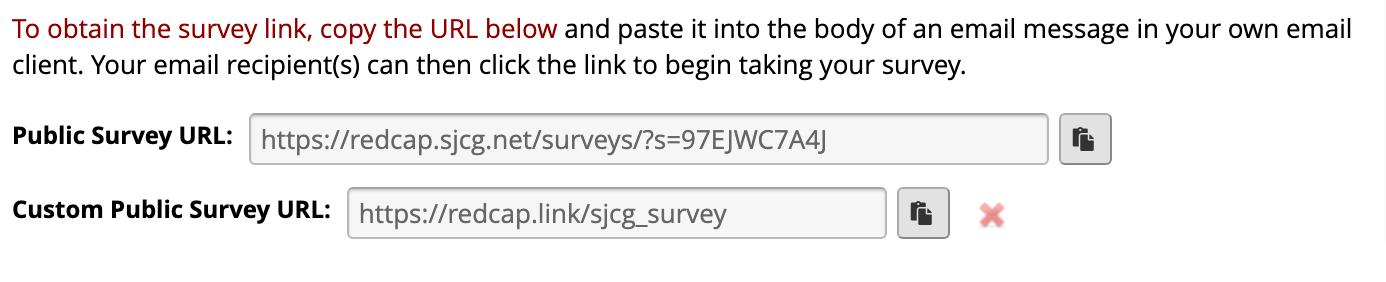
2) You can distribute the ‘Public Survey URL’, or if you’d like, you can create a shorter, customized survey link using the ‘Create Custom Survey Link’ button.
You will now see two links available. Copy and paste your link into an email, website, or other form of distribution.

3. You may also want to take advantage the QR code option, which works well for mail out campaigns or posters. Respondents can scan your code with their smart devices to access the survey.
Anonymous Surveys via the Participant List
With this method, you can send customized emails and reminders via REDCap, and limit the number of times each participant completes your survey. Responses will remain anonymous provided that you:
• Do not enable participant identifiers (an option available once the participant list is created; see nonanonymous surveys, below)
• Do not enable a designated email field (within survey settings).
• Do not collect identifiable data within your survey.
• Receive a large number of responses; (30+); if you are unsure how many responses to expect, we would not recommend this method.
1) Navigate to ‘Survey Distribution Tools’ in the toolbar menu

2) Select ‘Participant List’ from the tabs.

3) Click ‘Add participants’
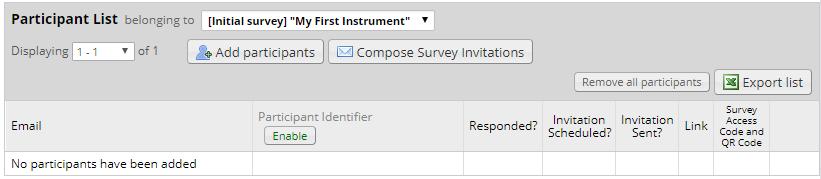

4) Add your participant’s email addresses to the pop-up box, one per line, and click ‘Add participants’.


5) Now click ‘Compose Survey Invitations’.

6) You’ll now see a number of options.
a. Optional: send your invitations immediately (default) or on a specified date/time
b. Optional: enable reminders for non-responders
c. Tailor your email subject line and body.
d. Preview your email.
e. Send a test email to yourself (note that the link will not work, but you can view the email).
f. Customize the recipient list (for example if you need to stagger distribution or add a new email at a later date)


7) Once you’ve customized your invitations, click the ‘Send Invitations’ button.
Tip: You can navigate back to the Participant List to check on response status. Below, we can see three full responses (green checks), one partial response (orange check), and one non-response.


Non-Anonymous Surveys
In specific situations, REDCap users may need to employ a non-anonymous survey distribution method. This would be necessary in cases where the survey data needs to be linked with other data, whether it’s additional data from REDCap (e.g., a longitudinal study) or offline information.
As a reminder, it is your responsibility to ensure that your project and its associated data meets with organizational standards (e.g., privacy and confidentiality requirements of the Research Ethics Board or Health Records).
Invitations to non-anonymous surveys are distributed using the same steps outlined for non-anonymous surveys utilizing the participant list (see above), with the exception that ‘Participant Identifiers’ are enabled:
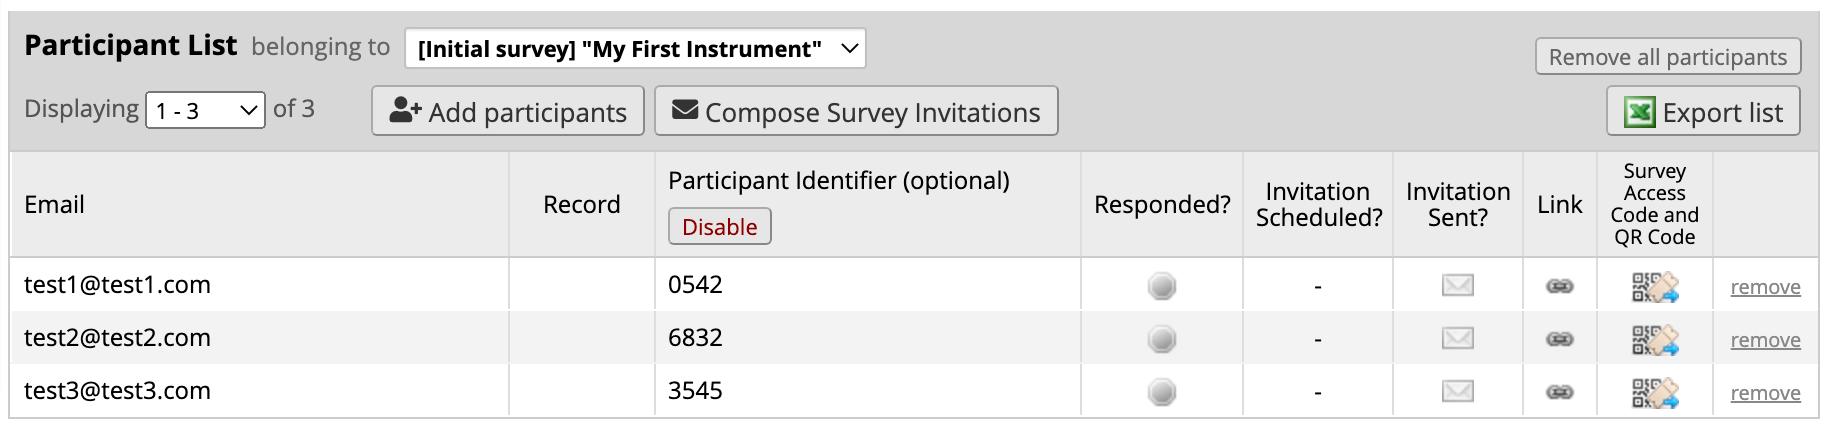

When adding participants to the list (one per list), identifiers are included with each email address, separated by a comma. For example: test1@test1.com, 0542 test2@test2.com, 6832
Tip: If you are collecting longitudinal data, several helpful videos are included in REDCap via the ‘Video Tutorials’ link available from any screen.
Data Exports
When it’s time to download your data:
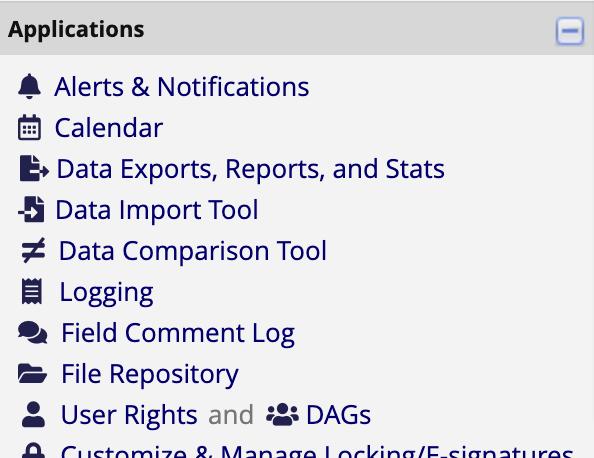
1) Navigate to ‘Data Exports, Reports, and Stats’ in your toolbar menu.


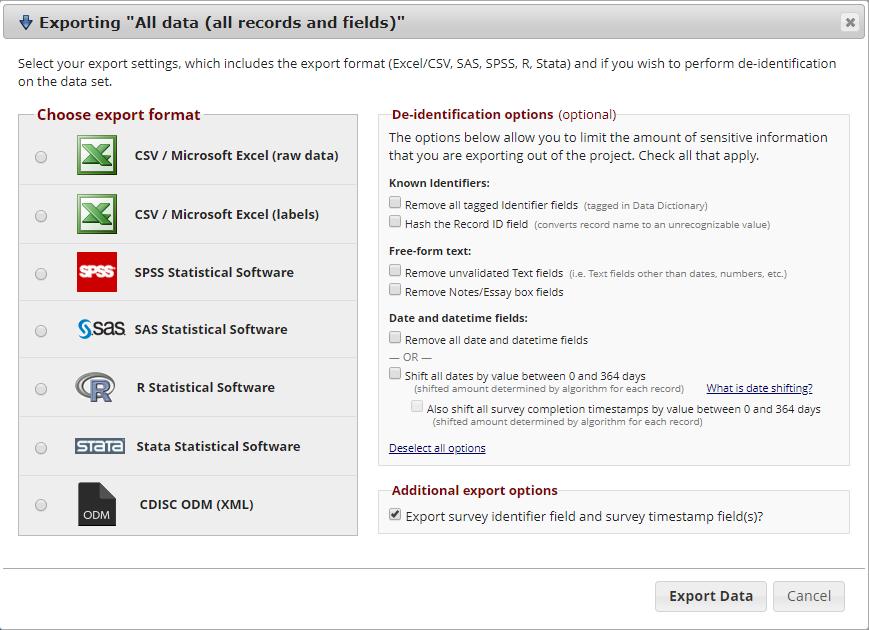
2) While you may customize which data you want to download (see the next section), click ‘Export Data’ to download all your data.


3) You have several options available for download, though most users will want to select the ‘CSV / Microsoft Excel (raw data) option. Select your format and click ‘Export Data’.

4) You’ll now see a screen that reads, ‘Data export was successful!’ Don’t be fooled! You still need to click the download icon to save the exported data to your computer.


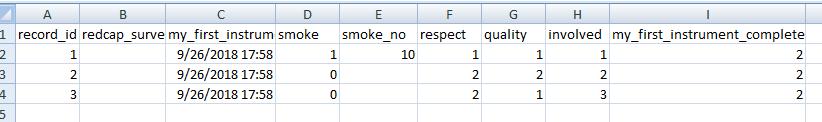
5) Take a look at your exported data. Note that because the data is ‘raw’, you will see the numerical values associated with your different response options (assigned when you created your fields).

Tip: You can view your ‘Codebook’ in REDCap or download your ‘Dictionary’ from the ‘Project Home and Design’ toolbar menu if you need help matching numerical response options with their labels. Note that you do not need to enter draft mode download the dictionary. Scroll down the page and click ‘Download the current Data Dictionary’.


Your downloaded data dictionary will be in the form of an Excel file that looks something like this:

Reports, Stats & Charts
Reports
Reports allow you to customize the data you view and download.
1) From the toolbar menu, select ‘Data Exports, Reports, and Stats’ and click ‘+ New Report’

2) Give your report a name.

3) Identify the fields you would like in your report:


4) Filter your report based on data collected; for the example below, only records from 2021 that are marked as complete will be included:


Tip: If you do want to sort data by date, you must include a field validated as a date in your data collection tool. We recommend including a textbox field that is validated with a date/time format and appropriate action tags. E.g., create a field called ‘Timestamp’, validate with D-M-Y formatting, and include the action tags @TODAY (to populate with the current date) and @HIDDEN (to keep the field hidden from respondents).
5) Identify ‘Live Filters’ if you are interested in dynamically filtering your Stats & Charts (see next section) in real time. In the example below, the ‘City’ field has been identified as a live filter. This will create a drop-down at the top of your Stats & Charts page to allow you to switch back and forth between different groups of data (in this example, different cities). Note that live filters will not be reflected in data exports.


6) You have the option to sort how your data is displayed in your report; below, the report has been set-up to sort data by date:
7) Remember to click ‘Save Report’ at the bottom of your page.
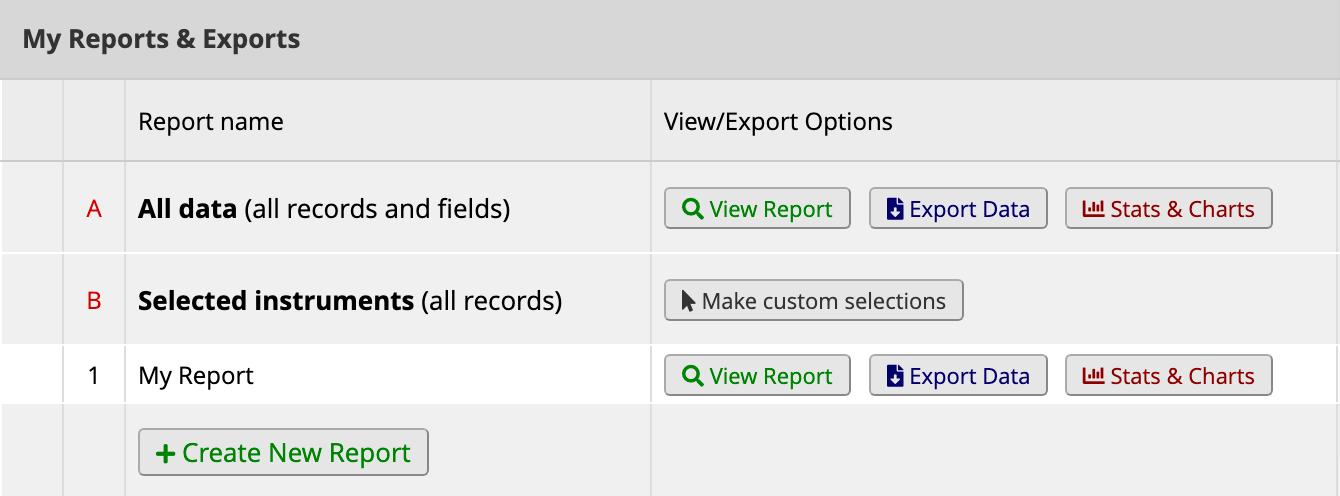
Your reports will be accessible from the toolbar menu. You can view the raw data of the report in REDCap, export it, and view summaries of it in ‘Stats & Charts’ (see below).
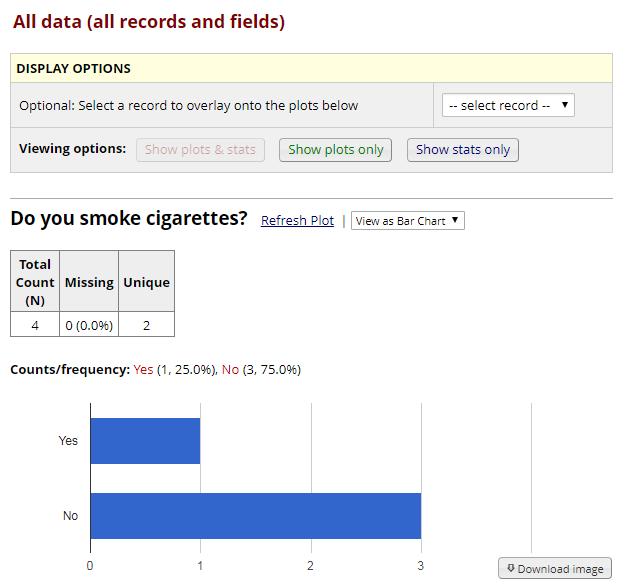
Stats & Charts
Stats & Charts summarize your data and reports in an easy-to-read format.
1) From the toolbar menu, select ‘Data Exports, Reports, and Stats’ and click ‘Stats & Charts’ beside the data/report.


2) Here you’ll see graphs (you can select bar charts or pie charts) for relevant data, alongside counts and percentages. Select ‘Print Page’ to save your report to PDF format or select ‘Download Image’ to save individual charts.

User Rights
It is best practice to have more than one user on a project, specifically at least one additional user with full user rights. This ensures that the project remains accessible if you are unavailable.
1) Navigate to ‘User Rights’, accessible from your toolbar menu:

2) To find the user, start typing their last name into the ‘Add New User’ box. Select the username, and then click the ‘+ Add with Custom Rights’ button:


3) From the pop-up window, select the rights you would like the user to have. You have many different options here, some of which are pre-selected. Some of these could be important if data needs to be withheld from the user (i.e., for confidentiality/privacy/blinding purposes), or if you want to safeguard the structure of your project. There is a full description of each of these rights within the REDCap help files. To see this, click ‘Help & FAQ’, search ‘user rights’, and then click on the results in the ‘Applications’ tab. From here, you will see ‘What are the User Rights that can be granted/restricted?’. Expand the question to see a full listing of user rights and their associated implications and warnings.
Tip: Granting ‘User Rights’ (under ‘Highest Level Privileges’) gives the user the ability to add other users and control the rights of all users, including their own rights.


4) Once your user rights have been assigned, it is important to ensure that your user list remains up-to-date. If a user is no longer associated with a project, they should be removed. A current user list is displayed on your project’s home page, each time you open it up To remove a user or edit a user’s rights, navigate to ‘User Rights’ (Step 1 above), click on the username, and select ‘Edit User Privileges’. You will see the same pop-up window from Step 3, above. To remove a user, click the ‘Remove User’ button in the lower left-hand corner.