St. Joseph’s Care Group
Client Satisfaction Survey 2022
December 2018 • 1
St. Joseph’s Care Group – Client Satisfaction Survey 2022 January 2023 • 2 Table of Contents Executive Summary 3 Introduction & Overview 4 The Survey............................................................................................................................. 4 Survey Distribution ................................................................................................................. 5 Response Rate.......................................................................................................................... 7 Demographic Information 8 Question 1: Length of Stay ..................................................................................................... 8 Question 2: Client’s Age Group 9 Question 3: Client’s Gender...................................................................................................10 Question 4: Respondent Type 11 Question 5: Cultural Background 12 Questions 6 & 7: Language 13 Satisfaction Results 14 Question 8: Courtesy & Respect............................................................................................14 Question 9: Listening.............................................................................................................15 Question 10: Involvement......................................................................................................16 Question 11: Understanding Explanations.............................................................................17 Question 12: Cultural Support................................................................................................18 Question 13: Quality of Care .................................................................................................19 Question 14: Cleanliness.......................................................................................................20 Question 15: Food.................................................................................................................21 Question 17: Raising Concerns.............................................................................................22 Question 16: Other Supports 23 Question 17: Recommend to Others 24 Year-over-Year Comparison 25 Corporate Total .....................................................................................................................25 Seniors’ Health......................................................................................................................26 Addictions & Mental Health....................................................................................................27 Rehabilitative Care................................................................................................................28 Indigenous Experience..............................................................................................................29 Comments 29 Seniors’ Health 30 Addictions & Mental Health 31 Rehab & Chronic Disease 32 Appendix A: Cover Letters & Survey 33 Appendix B: Survey Numbers & Response Rates.....................................................................36 Appendix C: Demographic Details 39 Appendix D: Satisfaction Responses 42 Appendix E: Scores 2018-2022.................................................................................................46
Executive Summary
The annual St. Joseph’s Care Group client satisfaction survey was distributed to clients accessing services between September 12 and November 6, 2022. Clients, residents, and family members/ substitute decision makers were encouraged to respond. The survey comprised seven questions to gather basic demographic information followed by 12 satisfaction questions. In total, 2269 surveys were distributed and 1234 returned (54.4%).
Based on the top two positive response options:
97%Felt respected
72% Positively rated Food quality
95% Said staff listened
95% Rated the quality of care as good or excellent
97% Saw the facilities as clean
90%Felt culturally supported
88% Felt involved in their care 96%Would recommend their program to others
95% Had things explained in a way they understood
90% Were helped to access other supports
86% Felt they could raise a concern
St. Joseph’s Care Group – Client Satisfaction Survey 2022 January 2023 • 3
Introduction & Overview
St. Joseph’s Care Group (SJCG) provides programs and services at seven different sites, including Balmoral Centre, Behavioural Sciences Centre, Hogarth Riverview Manor, St. Joseph’s Health Centre, St. Joseph’s Heritage, St. Joseph’s Hospital, and Sister Margaret Smith Centre SJCG’s broad service areas are Seniors’ Health; Addictions and Mental Health; and Rehabilitative Care. To measure client satisfaction across SJCG, a corporate-wide client satisfaction survey was developed in 2009 by the Client Satisfaction Survey Committee. The high-level snapshot captured by the survey permits comparison of satisfaction over time and across the broad range of services provided by SJCG. It also sets the stage for more in-depth measures of client and resident experience at the program level.
The Survey
The 2022 corporate survey comprised 19 items. The first seven items captured basic demographic information: length of time receiving services, age group, gender, whether the respondent was a client or a family member/substitute decision maker, cultural background, and two questions regarding language. The next eleven items asked for respondents’ opinions regarding the services they received, with four options ranging from one (the lowest score) to four (the highest/best score). Respondents were given the option of “not applicable” for questions about food, cleanliness of the facility, and whether staff helped them access services outside of the program. The final item was an open-ended comments section.
Revisions to the 2022 survey comprised the addition of a question to measure respondents’ comfort in raising concerns about their or their family members’ care.
Please see Appendix A for a copy of the survey.
The survey was made available in English, Oji-Cree syllabics, French, Italian, and Finnish
St. Joseph’s Care Group – Client Satisfaction Survey 2022 January 2023 • 4
Survey Distribution
In July 2022, the Centre for Applied Health Research (CAHR) contacted managers to determine their programs’ requirements for the survey period. Where possible, managers were provided with previous years’ distribution rates to assist with these estimates.
Managers received paper-based survey kits one week prior to the beginning of the survey period. These kits included the following for each program area:
• English survey packages (comprising a cover letter, survey, return envelope, and prize ballot)
• Translations (available in Oji-Cree syllabics, French, Italian, and Finnish)
• Collection envelopes
• A tracking form
Respondents were offered the option of completing the survey electronically. The web address was provided in the cover letter that accompanied the survey. The online survey was also available in English, Oji-Cree syllabics, French, Italian, and Finnish
Each program determined the most appropriate manner to distribute the survey to clients. For example, some surveys were hand delivered to inpatients while others were distributed during client appointments at SJCG facilities or in the community. Some programs mailed surveys to clients (stamped, addressed envelopes were provided upon request so that completed surveys could be mailed back to the CAHR at no cost to the respondent) Upon completing their survey, respondents were asked to seal it in the envelope provided, which was then returned to the CAHR.
Within long-term care (LTC), the process was slightly different from the rest of the organization.
Only cognitively intact residents (with a score of 0 or 1 on the Cognitive Performance Scale of the interRAI assessment tool) were approached to complete the survey. And while the rest of the organization approached clients OR substitute decision makers, LTC residents’ substitute decision makers (power of attorney of care) were provided a survey, in order to align with Ontario’s LongTerm Care Act.
St. Joseph’s Care Group – Client Satisfaction Survey 2022 January 2023 • 5
For the total number of surveys distributed by each program, please see Appendix B
All program areas were provided with posters and tent cards to assist with promotion of the survey. Prior to the survey being distributed, information about the survey was provided in iNsider News to inform staff about the survey process To further bolster response rates, respondents were also eligible to win one of three $100 cash cards All ballots were directed to Communications & Engagement for random drawing of the prizes.
St. Joseph’s Care Group – Client Satisfaction Survey 2022 January 2023 • 6
Response Rate
In total, 1234 surveys were completed, representing a corporate response rate of 54 4% One survey was completed in French, one in Italian, and none in Finnish or Oji-Cree Nine surveys were completed online. The table below provides information on the number of completed surveys returned by each division (see Appendix B for the number of surveys returned from each program).
Number of Surveys Returned:
The graph below illustrates trends in response rates overall and by division over the past five years.
St. Joseph’s Care Group – Client Satisfaction Survey 2022 January 2023 • 7
Number % Seniors' Health 382 49.4% Addictions & Mental Health 349 61.1% Rehabilitative Care 502 54.4% TOTAL 1234 54.4%
0% 10% 20% 30% 40% 50% 60% 70% 80% 90% 100% 2018 2019 2020 2021 2022
Demographic Information
Respondents were asked to provide some basic demographic information. Numbers are based on complete responses. See Appendix C for further details.
Question 1: Length of Stay
Seniors' Health
Addictions & Mental Health
Rehabilitative Care
St. Joseph’s Care Group – Client Satisfaction Survey 2022 January 2023 • 8
1.1% 10.9% 10.7% 54.1% 23.2% 0% 20% 40% 60% 80% 100% < 1 month 1-6 months 7-12 months 1-5 years > 5 years
6.9% 30.8% 13.5% 27.4% 21.3% 0% 20% 40% 60% 80% 100%
14.4% 23.7% 7.5% 30.8% 23.5% 0% 20% 40% 60% 80% 100%
8.1% 21.8% 10.2% 37.0% 22.8% 0% 20% 40% 60% 80% 100% TOTAL
Question 2: Client’s Age Group
Seniors' Health
Addictions & Mental Health
Rehabilitative Care
St. Joseph’s Care Group – Client Satisfaction Survey 2022 January 2023 • 9
0.0% 0.5% 1.6% 4.2% 2.9% 10.6% 11.6% 21.9% 46.7% 0% 20% 40% 60% 80% 100% < 15 15 to 24 25 to 34 35 to 44 45 to 54 55 to 64 65 to 74 75 to 84 85+
1.7% 13.9% 20.2% 18.2% 19.7% 16.8% 8.7% 0.9% 0.0% 0% 20% 40% 60% 80% 100%
3.8% 2.2% 2.6% 2.2% 6.0% 13.0% 29.1% 24.8% 16.2% 0% 20% 40% 60% 80% 100%
2.0% 5.0% 7.3% 7.4% 8.9% 13.3% 17.9% 17.2% 21.1% 0% 20% 40% 60% 80% 100% TOTAL
Question 3: Client’s Gender
Addictions & Mental Health
St. Joseph’s Care Group – Client Satisfaction Survey 2022 January 2023 • 10
36.8% 62.7% 0.5% 0% 20% 40% 60% 80% 100% Male Female Other Gender Identity Seniors' Health 38.7% 58.7% 2.6% 0% 20% 40% 60% 80% 100%
48.6% 51.0% 0.4% 0% 20% 40% 60% 80% 100%
Care 42.1% 56.8% 1.1% 0% 20% 40% 60% 80% 100% TOTAL
Rehabilitative
Question 4: Respondent Type
St. Joseph’s Care Group – Client Satisfaction Survey 2022 January 2023 • 11
71.4% 28.6% 0% 20% 40% 60% 80% 100% Client Family/Substitute Decision Maker Seniors' Health 96.7% 3.3% 0% 20% 40% 60% 80% 100% Addictions & Mental Health 80.5% 19.5% 0% 20% 40% 60% 80% 100% Rehabilitative Care 82.3% 17.7% 0% 20% 40% 60% 80% 100% TOTAL
Question 5: Cultural Background
St. Joseph’s Care Group – Client Satisfaction Survey 2022 January 2023 • 12 White, 85.1% Indigenous, 12.0% Other, 3.0%
First Nation, 8.3% Metis, 1.4% MultiCultural Indigenous, 2.2% Black, 0.3% Latin/ Hispanic, 0.1% Asian, 0.4% Other, 0.8% MultiCultural NonIndigenous, 1.3%
Questions 6 & 7: Language
Q. In what language are you most comfortable receiving healthcare services?
From the 17 (1.4%) of respondents who selected a language other than English:
Q. Did you have access to someone who could explain what you needed to know about your (or your family member’s) care in a language in which you are comfortable?
St. Joseph’s Care Group – Client Satisfaction Survey 2022 January 2023 • 13
English, 99.0% French, 0.3% Italian, 0.5% Finnish, 0.2% Yes, a healthcare provider, 42.9% Yes, an interpreter, 7.1% Yes, a person close to me, 28.6% No, 14.3% I do not know, 7.1% TOTAL
Satisfaction Results
See Appendix D for further details.
Question 8: Courtesy & Respect
How often did staff treat you with courtesy and respect?
Seniors' Health

Addictions & Mental Health
Rehabilitative Care
St. Joseph’s Care Group – Client Satisfaction Survey 2022 January 2023 • 14
4.00 3.00 2.00 1.00 0.0% 25.0% 50.0% 75.0% 100.0% 3.69 3.88 3.85 3.81
TOTAL Never, 0.3% Never, 0.6% Never, 0.3% Sometimes, 4.0% Sometimes, 1.7% Sometimes, 1.8% Sometimes, 2.5% Usually, 23.3% Usually, 8.1% Usually, 9.3% Usually, 13.3% Always, 72.7% Always, 89.9% Always, 88.3% Always, 83.9%
Question 9: Listening
How often did staff listen carefully to you?

Seniors' Health
Addictions & Mental Health
Rehabilitative Care
TOTAL
St. Joseph’s Care Group – Client Satisfaction Survey 2022 January 2023 • 15
4.00 3.00 2.00 1.00 0.0% 25.0% 50.0% 75.0% 100.0% 3.49 3.80 3.82 3.71
Never, 0.3% Never, 0.3% Never, 0.2% Sometimes, 9.8% Sometimes, 1.2% Sometimes, 2.8% Sometimes, 4.5% Usually, 30.3% Usually, 16.8% Usually, 12.2% Usually, 19.1% Always, 59.6% Always, 81.7% Always, 85.0% Always, 76.2%
Question 10: Involvement
How often did staff involve you in planning your (or your family member’s) care?
Seniors' Health
Addictions & Mental Health
Rehabilitative Care
TOTAL
St. Joseph’s Care Group – Client Satisfaction Survey 2022 January 2023 • 16
4.00 3.00 2.00 1.00 0.0% 25.0% 50.0% 75.0% 100.0% 3.12 3.73 3.68 3.52
Never, 9.5% Never, 1.5% Never, 2.5% Never, 4.4% Sometimes, 15.8% Sometimes, 4.4% Sometimes, 5.1% Sometimes, 8.2% Usually, 28.0% Usually, 13.3% Usually, 14.4% Usually, 18.3% Always, 46.7% Always, 80.8% Always, 77.9% Always, 69.0%
Question 11: Understanding Explanations
How often did staff explain things in a way you could understand?

Seniors' Health
Addictions & Mental Health
Rehabilitative Care
TOTAL
St. Joseph’s Care Group – Client Satisfaction Survey 2022 January 2023 • 17
4.00 3.00 2.00 1.00 0.0% 25.0% 50.0% 75.0% 100.0% 3.51 3.79 3.78 3.70
Never, 1.6% Never, 0.3% Never, 1.0% Never, 1.0% Sometimes, 7.4% Sometimes, 2.1% Sometimes, 2.5% Sometimes, 3.9% Usually, 29.0% Usually, 16.1% Usually, 14.2% Usually, 19.4% Always, 62.0% Always, 81.5% Always, 82.3% Always, 75.7%
Question 12: Cultural Support
How often did staff provide an environment that is supportive of your cultural background?

Seniors' Health
Addictions & Mental Health
Rehabilitative Care
TOTAL
St. Joseph’s Care Group – Client Satisfaction Survey 2022 January 2023 • 18
4.00 3.00 2.00 1.00 0.0% 25.0% 50.0% 75.0% 100.0% 3.32 3.70 3.79 3.62
Never, 9.9% Never, 3.0% Never, 2.2% Never, 4.8% Sometimes, 7.3% Sometimes, 5.9% Sometimes, 2.2% Sometimes, 4.9% Usually, 23.9% Usually, 8.9% Usually, 9.8% Usually, 13.9% Always, 58.9% Always, 82.2% Always, 85.9% Always, 76.5%
Question 13: Quality of Care
How would you rate the overall quality of the care you (or your family member) have received?
Seniors' Health
Addictions & Mental Health
Rehabilitative Care
TOTAL
St. Joseph’s Care Group – Client Satisfaction Survey 2022 January 2023 • 19
4.00 3.00 2.00 1.00 0.0% 25.0% 50.0% 75.0% 100.0% 3.32 3.76 3.80 3.64
Poor, 1.3% Poor, 0.3% Poor, 0.6% Poor, 0.7% Fair, 8.2% Fair, 2.6% Fair, 2.2% Fair, 4.2% Good, 47.8% Good, 18.3% Good, 13.2% Good, 25.4% Excellent, 42.7% Excellent, 78.8% Excellent, 83.9% Excellent, 69.7%
Question 14: Cleanliness
How would you rate the cleanliness of the building?

Seniors' Health
Addictions & Mental Health
Rehabilitative Care
TOTAL
St. Joseph’s Care Group – Client Satisfaction Survey 2022 January 2023 • 20
4.00 3.00 2.00 1.00 0.0% 25.0% 50.0% 75.0% 100.0% 3.51 3.78 3.73 3.67
Poor, 1.3% Poor, 0.6% Poor, 1.1% Poor, 1.0% Fair, 4.8% Fair, 0.3% Fair, 1.7% Fair, 2.3% Good, 35.5% Good, 19.6% Good, 20.8% Good, 25.2% Excellent, 58.4% Excellent, 79.5% Excellent, 76.4% Excellent, 71.5%
Question 15: Food
How would you rate the overall quality of the food?

Seniors' Health
Addictions & Mental Health
Rehabilitative Care
TOTAL
St. Joseph’s Care Group – Client Satisfaction Survey 2022 January 2023 • 21
4.00 3.00 2.00 1.00 0.0% 25.0% 50.0% 75.0% 100.0% 2.66 3.17 3.14 2.91
Poor, 14.8% Poor, 4.2% Poor, 3.4% Poor, 9.4% Fair, 22.4% Fair, 16.9% Fair, 13.7% Fair, 18.9% Good, 44.3% Good, 36.1% Good, 48.6% Good, 43.4% Excellent, 18.5% Excellent, 42.8% Excellent, 34.3% Excellent, 28.3%
Question 16: Raising Concerns
Do you feel that you can raise a concern about staff without it affecting your (or your family member’s) care?

Seniors' Health
Addictions & Mental Health
Care
St. Joseph’s Care Group – Client Satisfaction Survey 2022 January 2023 • 22
4.00 3.00 2.00 1.00 0.0% 25.0% 50.0% 75.0% 100.0% 3.19 3.32 3.27 3.26
TOTAL No definitely not, 4.9% No definitely not, 4.1% No definitely not, 7.8% No definitely not, 5.8% No I do not think so, 9.8% No I do not think so, 7.7% No I do not think so, 6.7% No I do not think so, 7.9% Yes I think so, 46.9% Yes I think so, 40.4% Yes I think so, 36.3% Yes I think so, 40.8% Yes definitely, 38.5% Yes definitely, 47.8% Yes definitely, 49.2% Yes definitely, 45.4%
Rehabilitative
Question 17: Other Supports
Did staff help you to access other services and supports available, whether with St. Joseph’s Care Group or in the community (for example, housing, dental services, mental health services, caregiver supports)?

Seniors' Health
Addictions & Mental Health
St. Joseph’s Care Group – Client Satisfaction Survey 2022 January 2023 • 23
4.00 3.00 2.00 1.00 0.0% 25.0% 50.0% 75.0% 100.0% 3.28 3.65 3.59 3.51
TOTAL No definitely not, 4.3% No definitely not, 0.4% No definitely not, 1.0% No definitely not, 1.9% No I do not think so, 9.8% No I do not think so, 5.3% No I do not think so, 8.4% No I do not think so, 7.8% Yes I think so, 39.4% Yes I think so, 22.9% Yes I think so, 20.6% Yes I think so, 27.3% Yes definitely, 46.5% Yes definitely, 71.4% Yes definitely, 69.9% Yes definitely, 63.0%
Rehabilitative Care
Question 18: Recommend to Others
Would you recommend the program to others?

Seniors' Health
Addictions & Mental Health
Rehabilitative Care TOTAL
St. Joseph’s Care Group – Client Satisfaction Survey 2022 January 2023 • 24
4.00 3.00 2.00 1.00 0.0% 25.0% 50.0% 75.0% 100.0% 3.42 3.78 3.80 3.67
No definitely not, 2.4% No definitely not, 0.6% No definitely not, 0.4% No definitely not, 1.1% No I do not think so, 4.9% No I do not think so, 1.7% No I do not think so, 1.4% No I do not think so, 2.6% Yes I think so, 41.5% Yes I think so, 16.6% Yes I think so, 16.1% Yes I think so, 24.1% Yes definitely, 51.2% Yes definitely, 81.1% Yes definitely, 82.0% Yes definitely, 72.2%

St. Joseph’s Care Group – Client Satisfaction Survey 2022 January 2023 • 25 Year-over-Year Comparison Corporate Total Courtesy & Respect Listening Involvement with Planning Understanding Explanations Cultural Support Quality of Care Cleanliness Food Other Supports Recommend to Others 3.78 3.65 3.51 3.64 3.62 3.57 3.69 2.98 3.39 3.62 3.81 3.71 3.52 3.70 3.62 3.64 3.67 2.91 3.50 3.67 2021 2022
*Also see Appendix E: 2016-2020 Scores
Seniors’ Health
St. Joseph’s Care Group – Client Satisfaction Survey 2022 January 2023 • 26
Year-over-Year Comparison
Courtesy & Respect Listening Involvement with Planning Understanding Explanations Cultural Support Quality of Care Cleanliness Food Other Supports Recommend to Others 3.73 3.53 3.30 3.57 3.50 3.35 3.59 2.61 3.13 3.47 3.69 3.49 3.12 3.51 3.32 3.32 3.51 2.66 3.27 3.42 2021 2022
Addictions & Mental Health
Courtesy
St. Joseph’s Care Group – Client Satisfaction Survey 2022 January 2023 • 27
Year-over-Year Comparison
& Respect
with Planning Understanding Explanations Cultural Support Quality of Care Cleanliness Food Other Supports Recommend to Others 3.74 3.67 3.59 3.65 3.60 3.59 3.75 3.36 3.49 3.60 3.88 3.80 3.73 3.79 3.70 3.76 3.78 3.17 3.65 3.78 2021 2022
Listening Involvement
Rehabilitative Care
Courtesy & Respect
Listening
St. Joseph’s Care Group – Client Satisfaction Survey 2022 January 2023 • 28
Year-over-Year Comparison
Cultural Support Quality of Care Cleanliness Food Other Supports Recommend to Others 3.84 3.72 3.60 3.70 3.75 3.73 3.72 3.21 3.49 3.75 3.85 3.82 3.68 3.78 3.79 3.80 3.73 3.14 3.59 3.80 2021 2022
Involvement with Planning Understanding Explanations
Indigenous Experience
Statistical regression was used to estimate differences in satisfaction for Indigenous respondents, while controlling for other factors such as program, gender, and age. Mean differences (in comparison to non-Indigenous respondents on a four-point scale) are illustrated below. Note that some differences are statistically significant (dark purple; in other words, we can rule out that the results are due to chance) while others are not statistically significant (light purple; we cannot rule out that the results are due to chance).
Courtesy & Respect
Listening
Involvement with Planning
Understanding Explanations
Cultural Support
Quality of Care
Cleanliness
Food
Raising Concerns
Other Supports
Recommend to Others
St. Joseph’s Care Group – Client Satisfaction Survey 2022 January 2023 • 29
-0.034 -0.010 -0.102 -0.140 -0.378 -0.145 -0.274 -0.007 -0.280 -0.133 -0.113 - (poorer) + (better) Statistically significant (p<.05) Not statistically significant
Seniors’ Health
St. Joseph’s Care Group – Client Satisfaction Survey 2022 January 2023 • 30 Comments
171 respondents (44.8%) provided 237 comments: +/- Theme Sample Comments # - Food & Dining More fruit; better food; dining area too crowded; not following dietary plan; not enough seasoning; limited choices; food is inconsistent; more variety needed 69 + Quality of Care Quality of care is excellent; happy with our care experience; heartfelt care; well taken care of; thank you for the good care 19 + Staff Attitudes & Training Great staff; staff are pleasant and courteous; staff are friendly; staff very good at their jobs; staff are efficient 17Staff Attitudes & Training Make sure staff read the care plan; staff on cell phones; staff do not know clients’ names; staff need to be more personable; staff need more training 14Products, Programs & Services Spiritual services lacking; need foot care; not enough physiotherapy; more creative programs; more physical activities; cancellation of concerts 14 - Staffing Staff need more time for transitions; not enough staff; short-staffed; more funding for staff; no men on staff 14 - Communication No communication with physicians; requests misunderstood/ignored/dismissed; managers inaccessible; uninformed of care plan 13 - Environment Noisy hallways; room is dirty; poor security; smokers at entrance; stained linens; dusty; smells 13 - Quality of Care Quality of care is poor overnight; disappointed with care; residents uncared for 8 + Products, Programs & Services Recreational activities enjoyable; programs are effective; appreciate the services 8 + Food & Dining Enjoy the BBQs; good improvements in kitchen; food is getting better 7 - Access to Care Waiting too long for appointments; more frequent physician visits 6 Other Inappropriate meds; more recycling needed; cost too high; don’t want to do chores; open more entrances 35 + Positive Feedback - Areas for Improvement
Addictions & Mental Health
St. Joseph’s Care Group – Client Satisfaction Survey 2022 January 2023 • 31
respondents (40.0%) provided 153 comments: +/- Theme Sample Comments # + Staff Attitudes & Training Great staff; very empathetic; friendly staff; very respectful and non-judgmental; passionate; staff easy to talk to 37 + Products, Programs & Services Services saved my life; support is excellent; treatment is helping; life-changing; program has helped so much; helpful 32 + Quality of Care Excellent care; amazing care; well cared for 18 - Access to Care Long wait times; longer-term programs needed; more frequent appointments needed; more beds needed 8Staff Attitudes & Training No help from staff; staff not empathetic; staff have inconsistent rules; staff on cell phones 5 - Communication Update the client-facing web portal; hard to hear reception staff through glass 5 - Food & Dining Better food; less processed foods 4Products, Programs & Services More Indigenous-friendly programming; invite Elders; more recreation and exercise; less gender-segregated care; more focus on harm reduction (over abstinencebased treatment) 4 + Environment Very comfortable setting; great facility 4 Other Need better parking; want Netflix; more smoking passes 36 + Positive Feedback - Areas for Improvement
129
Rehab & Chronic Disease
202
St. Joseph’s Care Group – Client Satisfaction Survey 2022 January 2023 • 32
+/- Theme Sample Comments # + Staff Attitudes & Training Easy to talk to; caring and helpful; great staff; staff are awesome; compassionate staff; always willing to help; knowledgeable; polite 57 + Quality of Care Excellent care; very well cared for; professional care and support 43 + Products, Programs & Services Great services; appreciate reminder calls; appreciate the program; beneficial service; fills gaps in community 40 - Environment Security is worrying; parking is terrible; noisy; cigarette butts at entrance; grab bars needed; open more entrances; unclean 13Staff Attitudes & Training Staff are rude; staff don’t listen; unapproachable 12Products, Programs & Services Need a lab for onsite bloodwork; no coordination of services; more funding needed; wait times too long; would like service more often 8 - Quality of Care Lack of compassion; management does not care about complaints; call bells unanswered 6 - Staffing Staff is overworked; more staff needed; short-staffed 6 - Access to Care Reinstate free diabetic foot care; want more frequent care 5 - Food & Dining Food is cold; food is late; too mushy; stop using paper plates (makes food cold); portions small 5 + Communication Explanations are understandable; informative; appreciate check-ins 5 - Communication Better explanations; better communication of diagnoses 3 Other Get rid of masks; parkade confusing; issues with LIFT transport; happy here; thank you 30 + Positive Feedback - Areas for Improvement
respondents (40.2%) provided 233 comments:
Appendix A: Cover Letters & Survey
September 12, 2022
Dear Client, Resident or Family Member:


St. Joseph’s Care Group is working hard to ensure our clients, residents, and their family members receive the best possible service. I would appreciate hearing from you about your experiences with our staff, programs, and care. Your thoughts and ideas will help us to improve.
Please take a few minutes to complete the survey attached to this letter. I encourage you to answer all questions. You do not have to answer any questions that make you feel uncomfortable.
This survey is confidential and anonymous. All surveys will be sent to the Centre for Applied Health Research at St. Joseph’s Care Group. Your healthcare provider(s) will not see your responses.
Please place your completed survey in the envelope provided and then:
• mail it to the Centre for Applied Health Research, or
• place it in the large ‘survey return’ envelope in your program/home area, or
• give it to a staff member.
You can complete the survey on-line if you prefer. The survey can be accessed at www.cahr.sjcg.net/survey
The survey is available in English, Finnish, Italian, French and Oji-Cree. Please contact any staff member to obtain a copy of the survey in one of these languages. If you have questions or need help completing the survey, please contact Hillary Maxwell, Research Coordinator, at 343-2431 x 2107.
By completing the survey, you will have a chance to win a draw for 1 of 3 $100 gift cards. A ballot for the draw is included with this survey package. Please complete the ballot and return it to Communications & Engagement at St. Joseph’s Care Group. This can be done by mailing it in, placing it in the return envelope in your program/home area, or giving it to a staff member. Your ballot cannot be linked to your survey responses.
Thank you for taking the time to complete this survey. I value your ideas and information about your experiences with the Care Group. The results of the survey will be available on the St. Joseph’s Care Group website in 2023 (www.sjcg.net).
Please return your survey by November 6, 2022
Sincerely,
 Kelli O’Brien, MSc Rehab President and Chief Executive Officer
St. Joseph’s Care Group – Client Satisfaction Survey 2022 January 2023 • 33
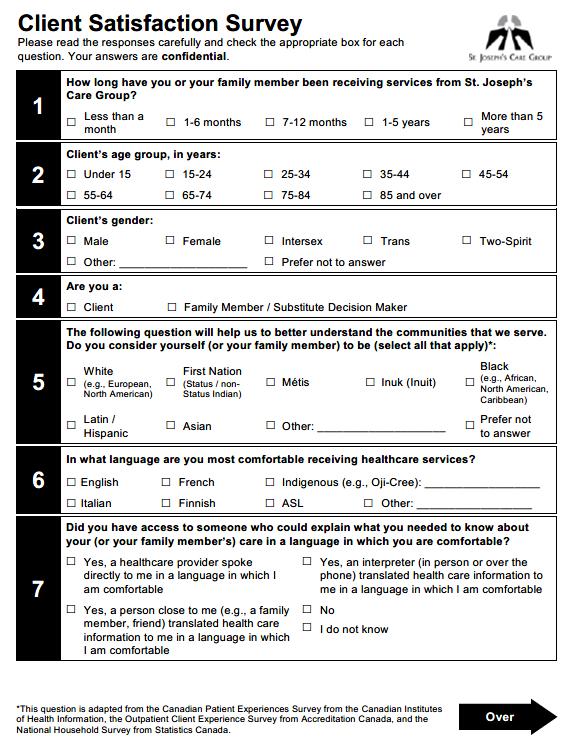
Client Satisfaction Survey
Please read the responses carefully and check the appropriate box for each question. Your answers are confidential.
1
How long have you or your family member been receiving services from St. Joseph’s Care Group? Less than a month 1-6 months 7-12 months 1-5 years More than 5 years
Client’s age group, in years:
2
3
Client’s gender:
Male Female Intersex Trans Two-Spirit Other: ____________________ Prefer not to answer
4 Are you a:
Client Family Member / Substitute Decision Maker
The following question will help us to better understand the communities that we serve.
5
6
Do you consider yourself (or your family member) to be (select all that apply)*: White (e.g., European, North American) First Nation (Status / nonStatus Indian) Métis Inuk (Inuit) Black (e.g., African, North American, Caribbean)
Latin / Hispanic
Asian
Other: Prefer not to answer
In what language are you most comfortable receiving healthcare services?
English French Indigenous (e.g., Oji-Cree):
Other:
Italian
Finnish
7 Did you have access to someone who could explain what you needed to know about your (or your family member’s) care in a language in which you are comfortable?
Yes, a healthcare provider spoke directly to me in a language in which I am comfortable
Yes, a person close to me (e.g., a family member, friend) translated health care information to me in a language in which I am comfortable
Yes, an interpreter (in person or over the phone) translated health care information to me in a language in which I am comfortable
No I do not know
*This question is adapted from the Canadian Patient Experiences Survey from the Canadian Institutes of Health Information, the Outpatient Client Experience Survey from Accreditation Canada, and the National Household Survey from Statistics Canada. This survey is confidential


January 2023 • 34
Under 15
15-24
25-34
35-44
45-54 55-64 65-74
75-84 85 and over
ASL
[Program Name]
Over
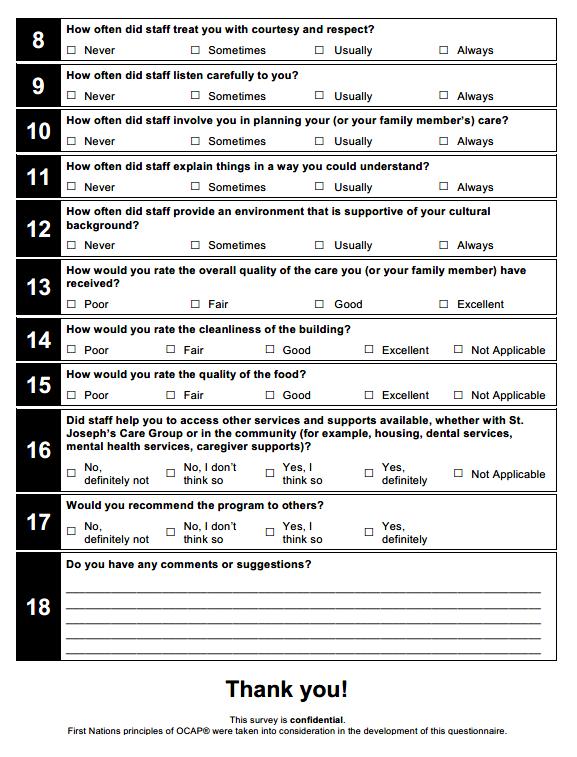
How often did staff listen carefully to you?
How often did staff involve you in planning your (or your family member’s) care?
How often did staff explain things in a way you could understand?
How often did staff provide an environment that is supportive of your cultural background?
How would you rate the overall quality of the care you (or your family member) have received?
How would you rate the cleanliness of the building?
How would you rate the quality of the food?
Do you feel that you can raise a concern about staff without it affecting your (or your family member’s) care?
No, definitely not
No, I don’t think so
Yes, I think so Yes, definitely
Did staff help you to access other services and supports available, whether with St. Joseph’s Care Group or in the community (for example, housing, dental services, mental health services, caregiver supports)?
No, definitely not
No, I don’t think so
Yes, I think so
Would you recommend the program to others?
No, definitely not
Yes, definitely Not Applicable
No, I don’t think so Yes, I think so Yes, definitely
Do you have any other comments or suggestions?
January 2023 • 35 8
Never Sometimes Usually Always 9
How often did staff treat you with courtesy and respect?
Never Sometimes Usually Always 10
Never Sometimes Usually Always 11
Never Sometimes Usually Always 12
Never Sometimes Usually Always 13
Poor Fair Good Excellent 14
Poor Fair Good Excellent Not Applicable 15
Poor Fair Good Excellent Not Applicable 16
17
18
19
Thank you!
Appendix B: Survey Numbers & Response Rates
Seniors’ Health
*Numbers requested do not include translated surveys.
**Response rates may be greater than 100% if unsolicited surveys are completed online or translations are completed; rates are based on distribution numbers provided by each program.
St. Joseph’s Care Group – Client Satisfaction Survey 2022 January 2023 • 36
Program # Requested # Distributed # Completed Response Rate Bethammi 2nd Floor 47 36 13 36.1% Bethammi 3rd Floor 47 40 31 77.5% HRM 1N (Daffodil) 35 26 5 19.2% HRM 2N (Lavender) 35 28 8 28.6% HRM 2S (Bluebell) 35 25 5 20.0% HRM 3N (Lily) 35 30 11 36.7% HRM 3S (Daisy) 35 27 10 37.0% HRM 4N (Iris) 35 26 7 26.9% HRM 4S (Lilac) 35 22 7 31.8% HRM 5N (Marigold) 35 27 8 29.6% HRM 5S (Orchid) 35 30 10 33.3% HRM 6N (Rose) 35 22 11 50.0% HRM 6S (Tulip) 35 26 8 30.8% HRM 7N (Trillium) 35 27 14 51.9% HRM 7S (Violet) 35 22 7 31.8% HRM Birch 35 26 11 42.3% HRM Spruce 35 23 8 34.8% P.R. Cook Apartments 135 130 101 77.7% Sister Leila Greco Apartments 132 132 56 42.4% High Support Housing 29 28 30 100.0% Medium Support Housing 22 22 22 100.0% Total Seniors’ Health 937 775 383 49.4%
Addictions & Mental Health
*Numbers requested do not include translated surveys.
**Response rates may be greater than 100% if unsolicited surveys are completed online or translations are completed; rates are based on distribution numbers provided by each program.
St. Joseph’s Care Group – Client Satisfaction Survey 2022 January 2023 • 37
Program # Requested* # Distributed # Completed Response Rate Adult Addictions / Problem Gambling 150 142 111 78.2% Adult Rehab (1E) 20 18 12 66.7% Adult Rehab (2E) 20 18 15 83.3% CAPS 50 10 10 100.0% CHO 5 5 0 0.0% Chronic Pain Management 70 33 43 130.3% Comprehensive Comm. Support 60 54 11 20.4% Dual Diagnosis 20 1 1 100.0% Eating Disorders 30 40 13 32.5% Employment Options 50 49 22 44.9% GAPPS 50 50 1 2.0% Homes for Good 30 16 11 68.8% Mental Health Outpatient 250 60 60 100.0% RAAM 30 1 8 100.0% Shared Mental Health 0 - -Withdrawal Management 30 34 26 76.5% Youth Addictions 30 40 5 12.5% Total Addictions & Mental Health 895 571 349 61.1%
Rehabilitative Care
*Numbers requested do not include translated surveys.
**Response rates may be greater than 100% if unsolicited surveys are completed online or translations are completed; rates are based on distribution numbers provided by each program.
St. Joseph’s Care Group – Client Satisfaction Survey 2022 January 2023 • 38
Program # Requested* # Distributed # Completed Response Rate Ambulatory Care 50 30 7 23.3% Amputee Program 20 29 5 17.2% Asthma Clinic 20 1 8 800.0% Chiropody 25 20 12 60.0% Community Exercise 20 0 -Community Psychogeriatric 20 17 11 64.7% Diabetes Health 100 104 100 96.2% Enhancing Care Program 15 15 2 13.3% Foot Care 100 60 60 100.0% Geriatric Assessment and Rehab (5N) 50 50 24 48.0% Geriatric Assessment and Rehab (5S) 55 55 12 21.8% Geriatric Telemedicine 25 1 8 100.0% Hospice / Palliative Care (4N) 40 17 12 70.6% Manor House (Adult Day) 60 50 26 52.0% Medically Complex Services (2N) 50 32 2 6.3% Medically Complex Services (2S) 30 16 0 0.0% Neuro Day OP 75 60 24 40.0% Physio & OT OP 60 26 23 88.5% Pulmonary Rehab 30 17 15 88.2% Rehabilitation (3N) 25 25 0 0.0% Rehabilitation (3S) 25 25 8 32.0% Rheumatic Disease 50 41 33 80.5% Seniors Outpatient Services 170 135 77 57.0% Transition (4S) 28 17 12 70.6% Wound Care 100 80 21 26.3% Total Rehabilitative Care 1243 923 502 54.4%
Appendix C: Demographic Details
Question 1: Length of time receiving services
Question 2: Client’s age group
St. Joseph’s Care Group – Client Satisfaction Survey 2022 January 2023 • 39
Seniors’ Health Addictions & Mental Health Rehabilitative Care Total # % # % # % # % < 1 month 4 1.1% 24 6.9% 71 14.4% 99 8.1% 1-6 months 41 10.9% 107 30.8% 117 23.7% 265 21.8% 7-12 months 40 10.7% 47 13.5% 37 7.5% 124 10.2% 1-5 years 203 54.1% 95 27.4% 152 30.8% 450 37.0% > 5 years 87 23.2% 74 21.3% 116 23.5% 277 22.8% Total 375 100.0% 347 100.0% 493 100.0% 1215 100.0%
Seniors’ Health Addictions & Mental Health Rehabilitative Care Total # % # % # % # % < 15 0 0.0% 6 1.7% 19 3.8% 25 2.0% 15 to 24 2 0.5% 48 13.9% 11 2.2% 61 5.0% 25 to 34 6 1.6% 70 20.2% 13 2.6% 89 7.3% 35 to 44 16 4.2% 63 18.2% 11 2.2% 90 7.4% 45 to 54 11 2.9% 68 19.7% 30 6.0% 109 8.9% 55 to 64 40 10.6% 58 16.8% 65 13.0% 163 13.3% 65 to 74 44 11.6% 30 8.7% 145 29.1% 219 17.9% 75 to 84 83 21.9% 3 0.9% 124 24.8% 210 17.2% 85+ 177 46.7% 0 0.0% 81 16.2% 258 21.1% Total 379 100.0% 346 100.0% 499 100.0% 1224 100.0%
Question 3: Client’s gender
Question 4: Role
Question 5: Cultural Background
St. Joseph’s Care Group – Client Satisfaction Survey 2022 January 2023 • 40
Seniors’ Health Addictions & Mental Health Rehabilitative Care Total # % # % # % # % Male 139 36.8% 133 38.7% 243 48.6% 515 42.1% Female 237 62.7% 202 58.7% 255 51.0% 694 56.8% Other Gender Identity 2 0.5% 9 2.6% 2 0.4% 13 1.1% Total 378 100.0% 344 100.0% 500 100.0% 1222 100.0%
Seniors’ Health Addictions & Mental Health Rehabilitative Care Total # % # % # % # % Client 262 71.4% 324 96.7% 389 80.5% 975 82.3% Family/Substitute Decision Maker 105 28.6% 11 3.3% 94 19.5% 210 17.7% Total 367 100.0% 335 100.0% 483 100.0% 1185 100.0%
Seniors’ Health Addictions & Mental Health Rehabilitative Care Total # % # % # % # % White 341 91.2% 256 74.4% 435 87.9% 1032 85.1% First Nation 21 5.6% 49 14.2% 31 6.3% 101 8.3% Metis 1 0.3% 10 2.9% 6 1.2% 17 1.4% Inuk (Inuit) 0 0.0% 0 0.0% 0 0.0% 0 0.0% Black 1 0.3% 3 0.9% 0 0.0% 4 0.3% Latin/ Hispanic 0 0.0% 1 0.3% 0 0.0% 1 0.1% Asian 2 0.5% 2 0.6% 1 0.2% 5 0.4% Other 4 1.1% 2 0.6% 4 0.8% 10 0.8% Multi-Cultural Indigenous 0 0.0% 16 4.7% 11 2.2% 27 2.2% Multi-Cultural NonIndigenous 4 1.1% 5 1.5% 7 1.4% 16 1.3% Total 374 100.0% 344 100.0% 495 100.0% 1213 100.0%
Question 6: Language of Care
St. Joseph’s Care Group – Client Satisfaction Survey 2022 January 2023 • 41
Seniors’ Health Addictions & Mental Health Rehabilitative Care Total # % # % # % # % English 376 98.7% 347 99.4% 494 98.6% 1217 98.9% French 1 0.3% 1 0.3% 2 0.4% 4 0.3% Indigenous 0 0.0% 0 0.0% 0 0.0% 0 0.0% Italian 2 0.5% 1 0.3% 3 0.6% 6 0.5% Finnish 1 0.3% 0 0.0% 1 0.2% 2 0.2% ASL 0 0.0% 0 0.0% 0 0.0% 0 0.0% Other 1 0.3% 0 0.0% 1 0.2% 2 0.2% Total 381 100.0% 349 100.0% 501 100.0% 1231 100.0%
Appendix D: Satisfaction Responses
Question 8: Courtesy & Respect
How often did staff treat you with courtesy and respect?
Question 9: Listening
How often did staff listen carefully to you?
Question 10: Involvement
How often did staff involve you in planning your care?
St. Joseph’s Care Group – Client Satisfaction Survey 2022 January 2023 • 42
Seniors’ Health Addictions & Mental Health Rehab & Chronic Disease Total # % # % # % # % Never 0 0.0% 1 0.3% 3 0.6% 4 0.3% Sometimes 15 4.0% 6 1.7% 9 1.8% 30 2.5% Usually 88 23.3% 28 8.1% 46 9.3% 162 13.3% Always 274 72.7% 310 89.9% 436 88.3% 1020 83.9% Total 377 100.0% 345 100.0% 494 100.0% 1216 100.0%
Seniors’ Health Addictions & Mental Health Rehab & Chronic Disease Total # % # % # % # % Never 1 0.3% 1 0.3% 0 0.0% 2 0.2% Sometimes 37 9.8% 4 1.2% 14 2.8% 55 4.5% Usually 114 30.3% 58 16.8% 60 12.2% 232 19.1% Always 224 59.6% 282 81.7% 418 85.0% 924 76.2% Total 376 100.0% 345 100.0% 492 100.0% 1213 100.0%
Seniors’ Health Addictions & Mental Health Rehab & Chronic Disease Total # % # % # % # % Never 35 9.5% 5 1.5% 12 2.5% 52 4.4% Sometimes 58 15.8% 15 4.4% 24 5.1% 97 8.2% Usually 103 28.0% 45 13.3% 68 14.4% 216 18.3% Always 172 46.7% 274 80.8% 367 77.9% 813 69.0% Total 368 100.0% 339 100.0% 471 100.0% 1178 100.0%
Question 11: Understanding Explanations
How often did staff explain things in a way you could understand?
Question 12: Cultural Support
How often did staff provide an environment that is supportive of your cultural background?
Question 13: Quality of Care
How would you rate the overall quality of the care you (or your family member) have received?
St. Joseph’s Care Group – Client Satisfaction Survey 2022 January 2023 • 43
Seniors’ Health Addictions & Mental Health Rehab & Chronic Disease Total # % # % # % # % Never 6 1.6% 1 0.3% 5 1.0% 12 1.0% Sometimes 28 7.4% 7 2.1% 12 2.5% 47 3.9% Usually 109 29.0% 55 16.1% 69 14.2% 233 19.4% Always 233 62.0% 278 81.5% 401 82.3% 912 75.7% Total 376 100.0% 341 100.0% 487 100.0% 1204 100.0%
Seniors’ Health Addictions & Mental Health Rehab & Chronic Disease Total # % # % # % # % Never 35 9.9% 10 3.0% 10 2.2% 55 4.8% Sometimes 26 7.3% 20 5.9% 10 2.2% 56 4.9% Usually 85 23.9% 30 8.9% 45 9.8% 160 13.9% Always 209 58.9% 277 82.2% 395 85.9% 881 76.5% Total 355 100.0% 337 100.0% 460 100.0% 1152 100.0%
Seniors’ Health Addictions & Mental Health Rehab & Chronic Disease Total # % # % # % # % Poor 5 1.3% 1 0.3% 3 0.6% 9 0.7% Fair 31 8.2% 9 2.6% 11 2.2% 51 4.2% Good 181 47.8% 63 18.3% 65 13.2% 309 25.4% Excellent 162 42.7% 272 78.8% 413 83.9% 847 69.7% Total 379 100.0% 345 100.0% 492 100.0% 1216 100.0%
Question 14: Cleanliness
How would you rate the cleanliness of the building?
Question 15: Food
How would you rate the overall quality of the food?
Question 16: Raising Concerns
Do you feel that you can raise a concern about staff without it affecting your (or your family member’s) care?
St. Joseph’s Care Group – Client Satisfaction Survey 2022 January 2023 • 44
Seniors’ Health Addictions & Mental Health Rehab & Chronic Disease Total # % # % # % # % Poor 5 1.3% 2 0.6% 5 1.1% 12 1.0% Fair 18 4.8% 1 0.3% 8 1.7% 27 2.3% Good 134 35.5% 65 19.6% 97 20.8% 296 25.2% Excellent 220 58.4% 264 79.5% 356 76.4% 840 71.5% Total 377 100.0% 332 100.0% 466 100.0% 1175 100.0%
Seniors’ Health Addictions & Mental Health Rehab & Chronic Disease Total # % # % # % # % Poor 52 14.8% 7 4.2% 6 3.4% 65 9.4% Fair 79 22.4% 28 16.9% 24 13.7% 131 18.9% Good 156 44.3% 60 36.1% 85 48.6% 301 43.4% Excellent 65 18.5% 71 42.8% 60 34.3% 196 28.3% Total 352 100.0% 166 100.0% 175 100.0% 693 100.0%
Seniors’ Health Addictions & Mental Health Rehab & Chronic Disease Total # % # % # % # % No definitely not 18 4.9% 14 4.1% 36 7.8% 68 5.8% No I do not think so 36 9.8% 26 7.7% 31 6.7% 93 7.9% Yes I think so 173 46.9% 137 40.4% 168 36.3% 478 40.8% Yes definitely 142 38.5% 162 47.8% 228 49.2% 532 45.4% Total 369 100.0% 339 100.0% 463 100.0% 1171 100.0%
Question 17: Other Supports
Did staff help you to access other services and supports available, whether with St. Joseph’s Care Group or in the community (for example, housing, dental services, mental health services, caregiver supports)?
Question 18: Recommend to Others
Would you recommend the program to others?
St. Joseph’s Care Group – Client Satisfaction Survey 2022 January 2023 • 45
Seniors’ Health Addictions & Mental Health Rehab & Chronic Disease Total # % # % # % # % No definitely not 11 4.1% 1 0.4% 4 1.4% 16 1.9% No I do not think so 28 10.4% 14 5.3% 24 8.3% 66 8.0% Yes I think so 108 40.0% 61 22.9% 59 20.5% 228 27.7% Yes definitely 123 45.6% 190 71.4% 201 69.8% 514 62.4% Total 270 100.0% 266 100.0% 288 100.0% 824 100.0%
Seniors’ Health Addictions & Mental Health Rehab & Chronic Disease Total # % # % # % # % No definitely not 9 2.4% 2 0.6% 2 0.4% 13 1.1% No I do not think so 18 4.9% 6 1.7% 7 1.4% 31 2.6% Yes I think so 154 41.5% 57 16.6% 78 16.1% 289 24.1% Yes definitely 190 51.2% 279 81.1% 396 82.0% 865 72.2% Total 371 100.0% 344 100.0% 483 100.0% 1198 100.0%
Appendix E: Scores 2018-2022
Figure 1: Corporate Total Mean Scores
St. Joseph’s Care Group – Client Satisfaction Survey 2022 January 2023 • 46
2018 2019 2020 2021 2022 Respect 3.74 3.77 3.77 3.78 3.81 Listen 3.59 3.67 3.65 3.65 3.71 Involve 3.46 3.56 3.47 3.51 3.52 Explain 3.62 3.72 3.69 3.64 3.70 Cultural 3.57 3.71 3.59 3.62 3.62 Quality 3.55 3.60 3.61 3.57 3.64 Cleanliness 3.61 3.63 3.65 3.69 3.67 Food 3.03 2.82 2.90 2.98 2.91 Access 3.32 3.44 3.42 3.39 3.50 Recommend 3.62 3.66 3.68 3.62 3.67 2.25 2.50 2.75 3.00 3.25 3.50 3.75 4.00
Figure 2: Seniors’ Health Mean
Scores
St. Joseph’s Care Group – Client Satisfaction Survey 2022 January 2023 • 47
2017 2018 2019 2020 2021 2022 Respect 3.68 3.59 3.72 3.74 3.73 3.69 Listen 3.43 3.35 3.53 3.48 3.53 3.49 Involve 3.11 3.10 3.34 3.23 3.30 3.12 Explain 3.51 3.38 3.63 3.63 3.57 3.51 Cultural 3.39 3.23 3.60 3.47 3.50 3.32 Quality 3.29 3.22 3.31 3.43 3.35 3.32 Cleanliness 3.46 3.48 3.47 3.59 3.59 3.51 Food 2.81 2.77 2.45 2.60 2.61 2.66 Access 3.05 2.85 3.16 3.05 3.13 3.27 Recommend 3.45 3.35 3.40 3.50 3.47 3.42 2.25 2.50 2.75 3.00 3.25 3.50 3.75 4.00
Figure 3: Addictions & Mental Health Mean Scores
St. Joseph’s Care Group – Client Satisfaction Survey 2022 January 2023 • 48
2018 2019 2020 2021 2022 Respect 3.76 3.75 3.74 3.74 3.88 Listen 3.69 3.69 3.69 3.67 3.80 Involve 3.66 3.66 3.59 3.59 3.73 Explain 3.70 3.73 3.69 3.65 3.79 Cultural 3.69 3.69 3.67 3.60 3.70 Quality 3.68 3.67 3.69 3.59 3.76 Cleanliness 3.76 3.73 3.73 3.75 3.78 Food 3.37 3.07 3.21 3.36 3.17 Access 3.64 3.53 3.63 3.49 3.65 Recommend 3.73 3.71 3.74 3.60 3.78 2.25 2.50 2.75 3.00 3.25 3.50 3.75 4.00
Figure 4: Rehab & Chronic Disease Mean Scores
St. Joseph’s Care Group – Client Satisfaction Survey 2022 January 2023 • 49
2018 2019 2020 2021 2022 Respect 3.86 3.84 3.82 3.84 3.85 Listen 3.74 3.75 3.73 3.72 3.82 Involve 3.65 3.66 3.54 3.60 3.68 Explain 3.78 3.78 3.73 3.70 3.78 Cultural 3.77 3.81 3.61 3.75 3.79 Quality 3.77 3.78 3.68 3.73 3.80 Cleanliness 3.63 3.67 3.62 3.72 3.73 Food 3.24 3.22 3.01 3.21 3.14 Access 3.56 3.60 3.54 3.49 3.59 Recommend 3.77 3.83 3.76 3.75 3.80 2.25 2.50 2.75 3.00 3.25 3.50 3.75 4.00
Centre for Applied Health Research
Michel Bédard
Hillary Maxwell Sacha Dubois
Aryn Ertl
Natalie Mullin-Bélanger
St. Joseph’s Care Group – Client Satisfaction Survey 2022 January 2023 • 50
