St. Joseph’s Care Group
Client Satisfaction Survey 2021
December 2018 1

St. Joseph’s Care Group – Client Satisfaction Survey 2021 December 2021 2 Table of Contents Executive Summary 3 Introduction & Overview 4 The Survey............................................................................................................................. 4 Survey Distribution ................................................................................................................. 5 Response Rate.......................................................................................................................... 7 Demographic Information 8 Question 1: Length of Stay 8 Question 2: Client’s Age Group 9 Question 3: Client’s Gender 10 Question 4: Respondent Type 11 Question 5: Cultural Background 12 Questions 6 & 7: Language 13 Satisfaction Results 14 Question 8: Courtesy & Respect............................................................................................14 Question 9: Listening.............................................................................................................15 Question 10: Involvement......................................................................................................16 Question 11: Understanding Explanations.............................................................................17 Question 12: Cultural Support 18 Question 13: Quality of Care 19 Question 14: Cleanliness 20 Question 15: Food 21 Question 16: Other Supports 22 Question 17: Recommend to Others 23 Year-over-Year Comparison 24 Corporate Total .....................................................................................................................24 Seniors’ Health......................................................................................................................25 Addictions & Mental Health....................................................................................................26 Rehabilitative Care................................................................................................................27 Indigenous Experience..............................................................................................................28 Comments 28 Seniors’ Health 29 Addictions & Mental Health 30 Rehab & Chronic Disease 31 Appendix A: Cover Letters & Survey 32 Appendix B: Survey Numbers & Response Rates.....................................................................35 Appendix C: Demographic Details.............................................................................................38 Appendix D: Satisfaction Responses 41 Appendix E: Scores 2017-2021.................................................................................................45
Executive Summary
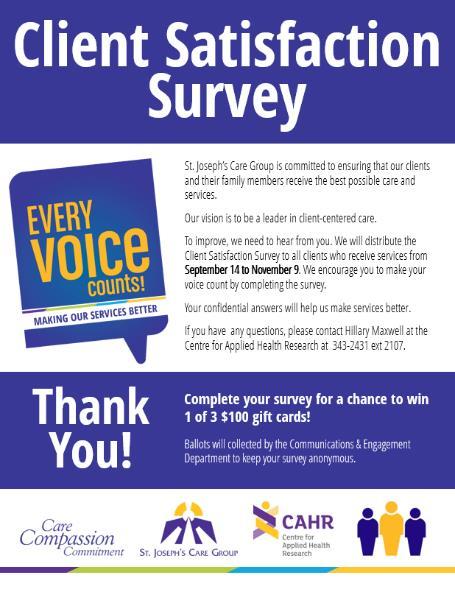
The annual St. Joseph’s Care Group client satisfaction survey was distributed to clients accessing services between September 13 and November 8, 2021 Clients, residents, and family members/ substitute decision makers were encouraged to respond. The survey comprised seven questions to gather basic demographic information followed by 11 satisfaction questions. In total, 2161 surveys were distributed and 1301 returned (60.2%)
Based on the top two positive response options:
96%Felt respected
74% Positively rated Food quality
93% Said staff listened
93% Rated the quality of care as good or excellent
96%Saw the facilities as clean
92%Felt culturally supported
87% Felt involved in their care 95%Would recommend their program to others
87% Were helped to access other supports
93% Had things explained in a way they understood

St. Joseph’s Care Group – Client Satisfaction Survey 2021 December 2021 3
Introduction & Overview
St. Joseph’s Care Group (SJCG) provides programs and services at seven different sites, including Balmoral Centre, Behavioural Sciences Centre, Hogarth Riverview Manor, St. Joseph’s Health Centre, St. Joseph’s Heritage, St. Joseph’s Hospital, and Sister Margaret Smith Centre SJCG’s broad service areas are Seniors’ Health; Mental Health and Addiction Services; and Rehabilitative Care. To measure client satisfaction across SJCG, a corporate-wide client satisfaction survey was developed in 2009 by the Client Satisfaction Survey Committee. The highlevel snapshot captured by the survey permits comparison of satisfaction over time and across the broad range of services provided by SJCG. It also sets the stage for more in-depth measures of client and resident experience at the program level.
The Survey
The 2021 corporate survey comprised 18 items. The first seven items captured basic demographic information: length of time receiving services, age group, gender, whether the respondent was a client or a family member/substitute decision maker, cultural background, and two questions regarding language. The next ten items asked for respondents’ opinions regarding the services they received, with four options ranging from one (the lowest score) to four (the highest/best score). Respondents were given the option of “not applicable” for questions about food, cleanliness of the facility, and whether staff helped them access services outside of the program. The final item was an open-ended comments section.
No major revisions were made from the 2020 survey.
Please see Appendix A for a copy of the survey.
The survey was made available in English, Oji-Cree syllabics, French, Italian, and Finnish
St. Joseph’s Care Group – Client Satisfaction Survey 2021 December 2021 4
Survey Distribution
In July 2021, the Centre for Applied Health Research (CAHR) contacted managers to determine their programs’ requirements for the survey period. Where possible, managers were provided with previous years’ distribution rates to assist with these estimates.
Managers received paper-based survey kits one week prior to the beginning of the survey period. These kits included the following for each program area:
English survey packages (comprising a cover letter, survey, return envelope, and prize ballot)
A translation pack (including a minimum of one survey package in each of Oji-Cree syllabics, French, Italian, and Finnish)
Collection envelopes
A tracking form
Respondents were offered the option of completing the survey electronically. The web address was provided in the cover letter that accompanied the survey. The online survey was also available in English, Oji-Cree syllabics, French, Italian, and Finnish
Each program determined the most appropriate manner to distribute the survey to clients. For example, some surveys were hand delivered to inpatients while others were distributed during client appointments at SJCG facilities or in the community. Some programs mailed surveys to clients (stamped, addressed envelopes were provided upon request so that completed surveys could be mailed back to the CAHR at no cost to the respondent) Upon completing their survey, respondents were asked to seal it in the envelope provided, which was then returned to the CAHR.
Within long-term care (LTC), the process was slightly different from the rest of the organization.
Only cognitively intact residents (with a score of 0 or 1 on the Cognitive Performance Scale of the interRAI assessment tool) were approached to complete the survey. And while the rest of the organization approached clients OR substitute decision makers, every LTC resident’s substitute decision maker (power of attorney of care) was provided a survey, in order to align with Ontario’s Long-Term Care Act.
St. Joseph’s Care Group – Client Satisfaction Survey 2021 December 2021 5
For the total number of surveys distributed by each program, please see Appendix B
All program areas were provided with posters and tent cards to assist with promotion of the survey. Prior to the survey being distributed, information about the survey was provided in iNsider News to inform staff about the survey process To further bolster response rates, respondents were also eligible to win one of three $100 cash cards All ballots were directed to Communications & Engagement for random drawing and distribution of the prizes.
St. Joseph’s Care Group – Client Satisfaction Survey 2021 December 2021 6
Response Rate
In total, 1301 surveys were completed, representing a corporate response rate of 60.2% One survey was completed in Finnish, and none in French, Italian, or Oji-Cree. Nineteen surveys were completed online. The table below provides information on the number of completed surveys returned by each division (see Appendix B for the number of surveys returned from each program).
Number of Surveys Returned:
The graph below illustrates trends in response rates overall and by division over the past five years.
St. Joseph’s Care Group – Client Satisfaction Survey 2021 December 2021 7
Number % Seniors' Health 402 51.3% Addictions & Mental Health 410 72.2% Rehabilitative Care 489 60.4% TOTAL 1301 60.2%
0% 10% 20% 30% 40% 50% 60% 70% 80% 90% 100% 2017 2018 2019 2020 2021
Demographic Information
Respondents were asked to provide some basic demographic information. Numbers are based on complete responses. See Appendix C for further details.
Question 1: Length of Stay
Seniors' Health
Addictions & Mental Health
Rehabilitative Care
St. Joseph’s Care Group – Client Satisfaction Survey 2021 December 2021 8
2.0% 10.9% 10.1% 58.5% 18.5% 0% 20% 40% 60% 80% 100% < 1 month 1-6 months 7-12 months 1-5 years > 5 years
11.6% 19.0% 11.6% 29.1% 28.6% 0% 20% 40% 60% 80% 100%
17.5% 33.1% 9.8% 23.1% 16.5% 0% 20% 40% 60% 80% 100%
10.9% 21.8% 10.5% 35.9% 20.9% 0% 20% 40% 60% 80% 100% TOTAL
Question 2: Client’s Age Group
Seniors' Health
Addictions & Mental Health
100% Rehabilitative Care
St. Joseph’s Care Group – Client Satisfaction Survey 2021 December 2021 9
0.0% 0.0% 0.0% 0.3% 1.0% 5.1% 10.1% 22.5% 61.1% 0% 20% 40% 60% 80% 100% < 15 15 to 24 25 to 34 35 to 44 45 to 54 55 to 64 65 to 74 75 to 84 85+
3.5% 12.3% 16.5% 15.1% 17.3% 20.7% 11.4% 3.0% 0.2% 0% 20% 40% 60% 80% 100%
0.8% 0.4% 1.4% 2.3% 5.4% 10.5% 26.8% 34.0% 18.4% 0% 20% 40% 60% 80%
1.4% 4.0% 5.8% 5.7% 7.8% 12.1% 16.8% 20.7% 25.8% 0% 20% 40% 60% 80% 100% TOTAL
Question 3: Client’s Gender
St. Joseph’s Care Group – Client Satisfaction Survey 2021 December 2021 10
28.9% 70.9% 0.3% 0% 20% 40% 60% 80% 100% Male Female Other Gender Identity Seniors' Health 48.1% 50.1% 1.7% 0% 20% 40% 60% 80% 100%
44.9% 55.1% 0.0% 0% 20% 40% 60% 80% 100% Rehabilitative Care 41.0% 58.4% 0.6% 0% 20% 40% 60% 80% 100% TOTAL
Addictions & Mental Health
Question 4: Respondent Type
St. Joseph’s Care Group – Client Satisfaction Survey 2021 December 2021 11
59.8% 40.2% 0% 20% 40% 60% 80% 100% Client Family/Substitute Decision Maker Seniors' Health 86.8% 13.2% 0% 20% 40% 60% 80% 100% Addictions & Mental Health 82.2% 17.8% 0% 20% 40% 60% 80% 100% Rehabilitative Care 76.6% 23.4% 0% 20% 40% 60% 80% 100% TOTAL
Question 5: Cultural Background
St. Joseph’s Care Group – Client Satisfaction Survey 2021 December 2021 12 White, 84.1% Indigenous, 14.0% Other,
1.9%
First Nation, 10.4% Metis,
Inuk (Inuit), 0.1% MultiCultural Indigenous,
Black,
Latin/ Hispanic, 0.2% Asian,
Other, 0.8% MultiCultural NonIndigenous, 0.5%
1.4%
2.1%
0.4%
0.1%
Questions 6 & 7: Language
Q. In what language are you most comfortable receiving healthcare services?
From the 52 (4%) of respondents who selected a language other than English:
Q. Did you have access to someone who could explain what you needed to know about your (or your family member’s) care in a language in which you are comfortable?
St. Joseph’s Care Group – Client Satisfaction Survey 2021 December 2021 13
English, 96.7% French, 0.7% Indigenous, 1.9% Italian, 0.3% Finnish, 0.4% Yes, a healthcare provider, 44.7% Yes, an interpreter, 17.0% Yes, a person close to me, 34.0% No, 4.3% TOTAL
Satisfaction Results
See Appendix D for further details.
Question 8: Courtesy & Respect
How often did staff treat you with courtesy and respect?
Seniors' Health

Addictions & Mental Health
Rehabilitative Care
St. Joseph’s Care Group – Client Satisfaction Survey 2021 December 2021 14
4.00 3.00 2.00 1.00 0.0% 25.0% 50.0% 75.0% 100.0% 3.73 3.74 3.84 3.78
TOTAL Never, 0.5% Never, 0.7% Never, 0.2% Never, 0.5% Sometimes, 3.0% Sometimes, 4.2% Sometimes, 2.3% Sometimes, 3.1% Usually, 19.4% Usually, 15.5% Usually, 10.5% Usually, 14.8% Always, 77.1% Always, 79.6% Always, 87.1% Always, 81.6%
Question 9: Listening
How often did staff listen carefully to you?

Seniors' Health
Addictions & Mental Health
Rehabilitative Care
TOTAL
St. Joseph’s Care Group – Client Satisfaction Survey 2021 December 2021 15
4.00 3.00 2.00 1.00 0.0% 25.0% 50.0% 75.0% 100.0% 3.53 3.67 3.72 3.65
Never, 0.8% Never, 0.6% Never, 0.5% Sometimes, 8.1% Sometimes, 6.0% Sometimes, 4.6% Sometimes, 6.1% Usually, 28.5% Usually, 21.1% Usually, 16.6% Usually, 21.7% Always, 62.6% Always, 73.0% Always, 78.3% Always, 71.8%
Question 10: Involvement
How often did staff involve you in planning your (or your family member’s) care?
Seniors' Health
Addictions & Mental Health
Rehabilitative Care
TOTAL
St. Joseph’s Care Group – Client Satisfaction Survey 2021 December 2021 16
4.00 3.00 2.00 1.00 0.0% 25.0% 50.0% 75.0% 100.0% 3.30 3.59 3.60 3.51
Never, 7.3% Never, 1.0% Never, 4.1% Never, 4.1% Sometimes, 11.8% Sometimes, 8.7% Sometimes, 5.6% Sometimes, 8.5% Usually, 24.3% Usually, 20.4% Usually, 16.6% Usually, 20.2% Always, 56.5% Always, 69.8% Always, 73.7% Always, 67.2%
Question 11: Understanding Explanations
How often did staff explain things in a way you could understand?

Seniors' Health
Addictions & Mental Health
Rehabilitative Care
TOTAL
St. Joseph’s Care Group – Client Satisfaction Survey 2021 December 2021 17
4.00 3.00 2.00 1.00 0.0% 25.0% 50.0% 75.0% 100.0% 3.57 3.65 3.70 3.64
Never, 1.5% Never, 0.2% Never, 1.0% Never, 0.9% Sometimes, 7.6% Sometimes, 5.9% Sometimes, 5.1% Sometimes, 6.1% Usually, 23.0% Usually, 22.5% Usually, 17.0% Usually, 20.6% Always, 67.9% Always, 71.3% Always, 76.8% Always, 72.3%
Question 12: Cultural Support
How often did staff provide an environment that is supportive of your cultural background?

Seniors' Health
Addictions & Mental Health
Rehabilitative Care
TOTAL
St. Joseph’s Care Group – Client Satisfaction Survey 2021 December 2021 18
4.00 3.00 2.00 1.00 0.0% 25.0% 50.0% 75.0% 100.0% 3.50 3.60 3.75 3.62
Never, 7.9% Never, 1.7% Never, 3.0% Never, 4.0% Sometimes, 4.1% Sometimes, 6.2% Sometimes, 2.6% Sometimes, 4.2% Usually, 18.2% Usually, 22.7% Usually, 11.1% Usually, 17.0% Always, 69.8% Always, 69.3% Always, 83.3% Always, 74.8%
Question 13: Quality of Care
How would you rate the overall quality of the care you (or your family member) have received?
Seniors' Health
Addictions & Mental Health
Rehabilitative Care
TOTAL
St. Joseph’s Care Group – Client Satisfaction Survey 2021 December 2021 19
4.00 3.00 2.00 1.00 0.0% 25.0% 50.0% 75.0% 100.0% 3.35 3.59 3.73 3.57
Poor, 1.3% Poor, 0.7% Poor, 1.2% Poor, 1.1% Fair, 10.1% Fair, 6.2% Fair, 2.3% Fair, 5.9% Good, 40.5% Good, 26.6% Good, 19.2% Good, 28.1% Excellent, 48.1% Excellent, 66.5% Excellent, 77.3% Excellent, 64.9%
Question 14: Cleanliness
How would you rate the cleanliness of the building?

Seniors' Health
Addictions & Mental Health
Rehabilitative Care
TOTAL
St. Joseph’s Care Group – Client Satisfaction Survey 2021 December 2021 20
4.00 3.00 2.00 1.00 0.0% 25.0% 50.0% 75.0% 100.0% 3.59 3.75 3.72 3.69
Poor, 0.5% Poor, 0.4% Poor, 0.3% Fair, 5.4% Fair, 4.1% Fair, 2.8% Fair, 4.0% Good, 28.3% Good, 17.2% Good, 20.8% Good, 22.0% Excellent, 65.8% Excellent, 78.7% Excellent, 76.0% Excellent, 73.7%
Question 15: Food
How would you rate the overall quality of the food?

Seniors' Health
Addictions & Mental Health
Rehabilitative Care
TOTAL
St. Joseph’s Care Group – Client Satisfaction Survey 2021 December 2021 21
4.00 3.00 2.00 1.00 0.0% 25.0% 50.0% 75.0% 100.0% 2.61 3.36 3.21 2.98
Poor, 14.8% Poor, 1.3% Poor, 4.3% Poor, 8.2% Fair, 26.2% Fair, 8.8% Fair, 14.2% Fair, 18.2% Good, 42.1% Good, 42.3% Good, 37.9% Good, 41.0% Excellent, 16.9% Excellent, 47.6% Excellent, 43.5% Excellent, 32.6%
Question 16: Other Supports
Did staff help you to access other services and supports available, whether with St. Joseph’s Care Group or in the community (for example, housing, dental services, mental health services, caregiver supports)?

Seniors' Health
Addictions & Mental Health Rehabilitative Care
St. Joseph’s Care Group – Client Satisfaction Survey 2021 December 2021 22
4.00 3.00 2.00 1.00 0.0% 25.0% 50.0% 75.0% 100.0% 3.13 3.49 3.49 3.39
TOTAL No definitely not, 10.8% No definitely not, 0.9% No definitely not, 3.9% No definitely not, 4.7% No I do not think so, 13.3% No I do not think so, 8.5% No I do not think so, 4.6% No I do not think so, 8.5% Yes I think so, 28.1% Yes I think so, 30.9% Yes I think so, 29.6% Yes I think so, 29.7% Yes definitely, 47.8% Yes definitely, 59.7% Yes definitely, 61.8% Yes definitely, 57.1%
Question 17: Recommend to Others
Would you recommend the program to others?

Seniors' Health
Addictions & Mental Health
Rehabilitative Care
TOTAL
St. Joseph’s Care Group – Client Satisfaction Survey 2021 December 2021 23
4.00 3.00 2.00 1.00 0.0% 25.0% 50.0% 75.0% 100.0% 3.47 3.60 3.75 3.62
No definitely not, 2.8% No definitely not, 1.0% No definitely not, 1.3% No definitely not, 1.7% No I do not think so, 6.6% No I do not think so, 3.0% No I do not think so, 2.1% No I do not think so, 3.8% Yes I think so, 31.4% Yes I think so, 30.5% Yes I think so, 16.7% Yes I think so, 25.6% Yes definitely, 59.2% Yes definitely, 65.5% Yes definitely, 80.0% Yes definitely, 69.0%


St. Joseph’s Care Group – Client Satisfaction Survey 2021 December 2021 24 Year-over-Year Comparison
Total Courtesy & Respect Listening Involvement with Planning Understanding Explanations Cultural Support Quality of Care Cleanliness Food Other Supports Recommend to Others 3.77 3.65 3.47 3.69 3.59 3.61 3.65 2.90 3.42 3.68 3.78 3.65 3.51 3.64 3.62 3.57 3.69 2.98 3.39 3.62 2020 2021 *Also
Corporate
see Appendix E: 2016-2020 Scores
Year-over-Year Comparison
Seniors’ Health
St. Joseph’s Care Group – Client Satisfaction Survey 2021 December 2021 25
Courtesy & Respect Listening Involvement with Planning Understanding Explanations Cultural Support Quality of Care Cleanliness Food Other Supports Recommend to Others 3.74 3.48 3.23 3.63 3.47 3.43 3.59 2.60 3.05 3.50 3.73 3.53 3.30 3.57 3.50 3.35 3.59 2.61 3.13 3.47 2020 2021
St. Joseph’s Care Group – Client Satisfaction Survey 2021 December 2021 26
Courtesy & Respect Listening Involvement with Planning Understanding Explanations Cultural Support Quality of Care Cleanliness Food Other Supports Recommend to Others 3.74 3.69 3.59 3.69 3.67 3.69 3.73 3.21 3.63 3.74 3.74 3.67 3.59 3.65 3.60 3.59 3.75 3.36 3.49 3.60 2020 2021
Year-over-Year Comparison Addictions & Mental Health
Year-over-Year Comparison
Rehabilitative Care
Courtesy & Respect
St. Joseph’s Care Group – Client Satisfaction Survey 2021 December 2021 27
Planning
Cultural Support Quality of Care Cleanliness Food Other Supports Recommend to Others 3.82 3.73 3.54 3.73 3.61 3.68 3.62 3.01 3.54 3.76 3.84 3.72 3.60 3.70 3.75 3.73 3.72 3.21 3.49 3.75 2020 2021
Listening Involvement with
Understanding Explanations
Indigenous Experience
Statistical regression was used to estimate differences in satisfaction for Indigenous respondents, while controlling for other factors such as program, gender, and age. Mean differences (in comparison to non-Indigenous respondents on a four-point scale) are illustrated below. Note that some differences are statistically significant (dark purple; in other words, we can rule out that the results are due to chance) while others are not statistically significant (light purple; we cannot rule out that the results are due to chance).
Courtesy & Respect
Listening
Involvement with Planning
Understanding Explanations
Cultural Support
Quality of Care
Cleanliness
Food
Other Supports
Recommend to Others
St. Joseph’s Care Group – Client Satisfaction Survey 2021 December 2021 28
-0.090 -0.052 -0.071 -0.035 -0.252 -0.099 -0.005 0.050 -0.023 -0.049 - (poorer) + (better) Statistically significant (p<.05) Not statistically significant
Seniors’ Health
St. Joseph’s Care Group – Client Satisfaction Survey 2021 December 2021 29 Comments
143 respondents (35.6%) provided 189 comments: +/- Theme Sample Comments # - Food & Dining More variety needed; food too cold/hot; poor quality; inaccurate menus; unhealthy food; overcooked 34Products, Programs & Services More activities needed; poor laundry services; spiritual services lacking; better entertainment needed 25 - Staffing Need more staff; supervision is poor; residents ignored; too much staff overturn; more one-on-one time with residents needed 25 + Quality of Care Excellent care; thank you for care; good work 21 - Environment Security is poor; items being stolen/misplaced; cleaning is insufficient; there are too many fire drills; dining rooms are too loud 19Staff Attitudes & Training Many staff have difficulty with English; some staff improperly trained; staff are too task-oriented; staff spend too much time talking on cell phones 17 + Staff Attitudes & Training Staff are exceptional; dedicated; courteous; caring; friendly 12 - Quality of Care Residents left in soiled clothes; care is too rushed; residents are being overmedicated 7 - Communication Managers do not return calls; lack of communication; family input is not considered 6 + Environment Great facility; nice place to live 3 + Products, Programs & Services Recommend the program 2 Other Visitors shouldn’t be allowed in without COVID vaccinations; more volunteers needed; inappropriate behaviour by other residents 18 + Positive Feedback - Areas for Improvement
Addictions & Mental Health
98
St. Joseph’s Care Group – Client Satisfaction Survey 2021 December 2021 30
respondents
131 comments: +/- Theme Sample Comments # + Products, Programs & Services Very happy with service; amazing resource; asset for the community; broad range of programs; program helpful 25 + Quality of Care Care is excellent; treatment was exceptional; positive experience 23 + Staff Attitudes & Training Staff are caring; friendly; excellent leaders; empathetic; respectful; professional; non-judgmental 23Products, Programs & Services Would like more outings; more recreation; more programs needed for youth 15 + Environment Safe place; appreciate access to virtual care 8 - Environment Building is difficult to navigate; too cold; parking should be free 6 - Food Coffee should be available; better menus needed; poor quality food 5Staff Attitudes & Training Inattentive staff; outdated knowledge 5 - Access to Care Wait times too long 3 - Communication Better communication needed; want more input into care 3 + Food Food is better now; allow more treats 3 - Quality of Care Better care needed 2 Other Too much paperwork; give staff a raise; provide more smoking breaks 10 + Positive Feedback - Areas for Improvement
(23.9%) provided
Rehab & Chronic Disease
St. Joseph’s Care Group – Client Satisfaction Survey 2021 December 2021 31
186 respondents (38.0%) provided 234 comments: +/- Theme Sample Comments # + Products, Programs & Services Excellent service; very satisfied with program; very helpful program; grateful for program 60 + Staff Attitudes & Training Staff are committed; supportive; knowledgeable; caring; patient; thoughtful; respectful 56 + Quality of Care Fantastic care; excellent care; good work; thank you for care 29Products, Programs & Services Put to bed too early so staff could leave; little entertainment; patient boards not updated; equipment is old; lacking bariatric equipment 11Staff Attitudes & Training Some staff have poor attitudes; ‘not my patient’ mentality; 11 - Communication Poor communication between staff and family; language barriers 9 - Environment Parking is difficult; air circulation is poor; too cold; insufficient parking; cleanliness is poor 9 - Food Under-seasoned; more variety needed 8 + Environment Clean facilities; safe 8 - Staffing Short-staffed; too much staff overturn 4 - Quality of Care Call bells ignored 3 Other Policies change too frequently; should not be charged for missed appointments; good/poor implementation of COVID safety measures 26 + Positive Feedback - Areas for Improvement
Appendix A: Cover Letters & Survey
September 13, 2021
Dear Client, Resident or Family Member:

St. Joseph’s Care Group is working hard to ensure our clients, residents, and their family members receive the best possible service. I would appreciate hearing from you about your experiences with our staff, programs, and care. Your thoughts and ideas will help us to improve.
Please take a few minutes to complete the survey attached to this letter. I encourage you to answer all questions. You do not have to answer any questions that make you feel uncomfortable.
This survey is confidential and anonymous. All surveys will be sent to the Centre for Applied Health Research at St. Joseph’s Care Group. Your healthcare provider(s) will not see your responses.
Please place your completed survey in the envelope provided and then:
• mail it to the Centre for Applied Health Research, or
• place it in the large ‘survey return’ envelope in your program/home area, or
• give it to a staff member.
You can complete the survey on-line if you prefer. The survey can be accessed at www.cahr.sjcg.net/survey
The survey is available in English, Finnish, Italian, French and Oji-Cree. Please contact any staff member to obtain a copy of the survey in one of these languages. If you have questions or need help completing the survey, please contact Hillary Maxwell, Research Coordinator, at 343-2431 x 2107.
By completing the survey, you will have a chance to win a draw for 1 of 3 $100 gift cards. A ballot for the draw is included with this survey package. Please complete the ballot and return it to Communications & Engagement at St. Joseph’s Care Group. This can be done by mailing it in, placing it in the return envelope in your program/home area, or giving it to a staff member. Your ballot cannot be linked to your survey responses.
Thank you for taking the time to complete this survey. I value your ideas and information about your experiences with the Care Group. The results of the survey will be available on the St. Joseph’s Care Group website in 2022 (www.sjcg.net).
Please return your survey by November 8, 2021
Sincerely,
 Kelli O’Brien, MSc Rehab President and Chief Executive Officer
St. Joseph’s Care Group – Client Satisfaction Survey 2021 December 2021 32
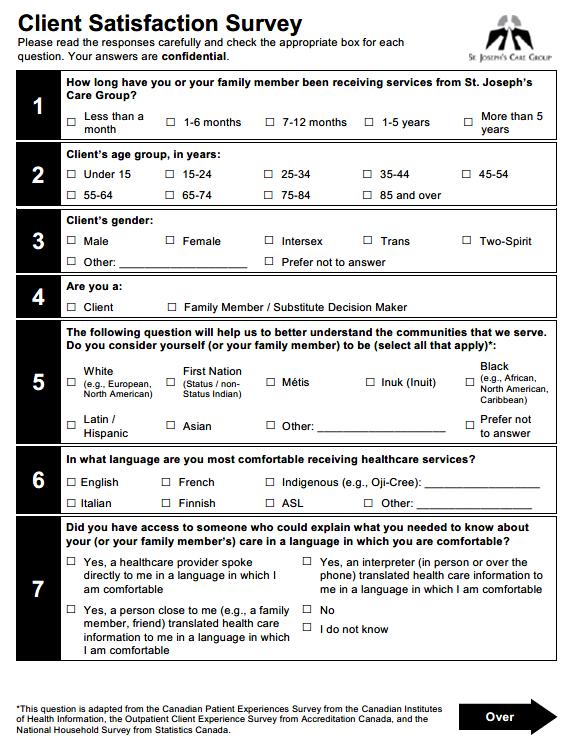
Client Satisfaction Survey
Please read the responses carefully and check the appropriate box for each question. Your answers are confidential.
1
How long have you or your family member been receiving services from St. Joseph’s Care Group? Less than a month 1-6 months 7-12 months 1-5 years More than 5 years
Client’s age group, in years:
2
3
Client’s gender:
Male Female Intersex Trans Two-Spirit Other: ____________________ Prefer not to answer
4 Are you a:
Client Family Member / Substitute Decision Maker
The following question will help us to better understand the communities that we serve.
5
6
Do you consider yourself (or your family member) to be (select all that apply)*: White (e.g., European, North American) First Nation (Status / nonStatus Indian) Métis Inuk (Inuit) Black (e.g., African, North American, Caribbean)
Latin / Hispanic
Asian
Other: Prefer not to answer
In what language are you most comfortable receiving healthcare services?
English French Indigenous (e.g., Oji-Cree):
Italian
ASL
7 Did you have access to someone who could explain what you needed to know about your (or your family member’s) care in a language in which you are comfortable?
Yes, a healthcare provider spoke directly to me in a language in which I am comfortable
Yes, a person close to me (e.g., a family member, friend) translated health care information to me in a language in which I am comfortable
Yes, an interpreter (in person or over the phone) translated health care information to me in a language in which I am comfortable
No I do not know
*This question is adapted from the Canadian Patient Experiences Survey from the Canadian Institutes of Health Information, the Outpatient Client Experience Survey from Accreditation Canada, and the National Household Survey from Statistics Canada.


January 2021 33
Under 15
15-24
25-34
35-44
45-54 55-64
65-74
75-84 85 and over
Finnish
Other:
[Program Name]
Over
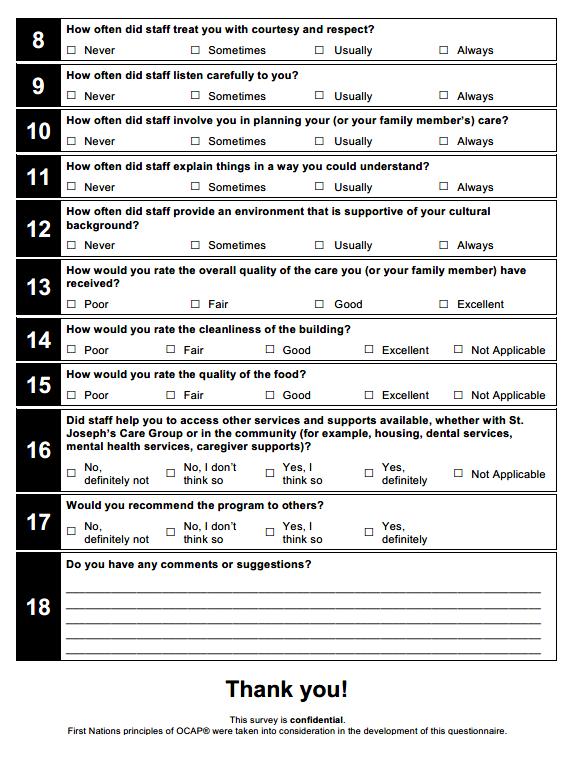
How often did staff treat you with courtesy and respect?
often did staff listen carefully to you?
How often did staff involve you in planning your (or your family member’s) care?
How often did staff explain things in a way you could understand?
often did staff provide an environment that is supportive of your cultural background?
How would you rate the overall quality of the care you (or your family member) have received?
How would you rate the cleanliness of the building?
Did staff help you to access other services and supports available, whether with St. Joseph’s Care Group or in the community (for example, housing, dental services, mental health services, caregiver supports)?
Would you recommend the program to others?
Do you have any other comments or suggestions?
January 2021 34 8
Never Sometimes Usually Always 9
Never Sometimes Usually Always 10
How
Never Sometimes Usually Always 11
Never Sometimes Usually Always 12
Never Sometimes Usually Always 13
Poor Fair Good Excellent 14
Poor Fair Good Excellent Not Applicable 15 How
food? Poor Fair Good Excellent Not Applicable 16
How
would you rate the quality of the
No, definitely not No, I don’t think so Yes, I think so Yes, definitely Not Applicable 17
No, definitely not No, I don’t think so Yes, I think so Yes, definitely 18
Thank you! This survey is confidential
Appendix B: Survey Numbers & Response Rates
Seniors’ Health
*Numbers requested do not include translated surveys.
**Response rates may be greater than 100% if unsolicited surveys are completed online or translations are completed; rates are based on distribution numbers provided by each program.
St. Joseph’s Care Group – Client Satisfaction Survey 2021 January 2021 35
Program # Requested # Distributed # Completed Response Rate Bethammi 2nd Floor 47 47 14 29.8% Bethammi 3rd Floor 47 47 23 48.9% HRM 1N (Daffodil) 35 28 9 32.1% HRM 2N (Lavender) 35 34 13 38.2% HRM 2S (Bluebell) 35 27 16 59.3% HRM 3N (Lily) 35 28 13 46.4% HRM 3S (Daisy) 35 29 16 55.2% HRM 4N (Iris) 35 26 9 34.6% HRM 4S (Lilac) 35 27 8 29.6% HRM 5N (Marigold) 35 35 8 22.9% HRM 5S (Orchid) 35 29 9 31.0% HRM 6N (Rose) 35 27 9 33.3% HRM 6S (Tulip) 35 31 13 41.9% HRM 7N (Trillium) 35 31 16 51.6% HRM 7S (Violet) 35 26 10 38.5% HRM Birch 35 28 14 50.0% HRM Spruce 35 27 17 63.0% P.R. Cook Apartments 125 125 72 57.6% Sister Leila Greco Apartments 132 132 113 85.6% Total Seniors’ Health 876 784 402 51.3%
Addictions & Mental Health
St. Joseph’s Care Group – Client Satisfaction Survey 2021 January 2021 36
Program # Requested* # Distributed # Completed Response Rate Adult Addictions / Problem Gambling 150 99 68 68.7% Adult Rehab (1E) 20 12 12 100.0% Adult Rehab (2E) 20 14 14 100.0% CAPS 50 32 25 78.1% Chronic Pain Management 70 63 59 93.7% Comprehensive Comm. Support 50 39 23 59.0% Dual Diagnosis 20 5 5 100.0% Eating Disorders 30 18 8 44.4% Employment Options 50 36 21 58.3% GAPPS 50 54 5 9.3% High Support Housing 29 28 28 100.0% Homes for Good 30 25 28 112.0% Homes for Special Care 30 21 20 95.2% Medium Support Housing 22 20 19 95.0% Mental Health Outpatient 250 21 20 95.2% RAAM 30 23 23 100.0% Shared Mental Health 10 0 0Withdrawal Management 30 28 23 82.1% Youth Addictions 30 30 9 30.0% Total Addictions & Mental Health 971 568 410 72.2%
Rehabilitative Care
St. Joseph’s Care Group – Client Satisfaction Survey 2021 January 2021 37
Program # Requested* # Distributed # Completed Response Rate Ambulatory Care 30 25 11 44.0% Amputee Program 40 11 9 81.8% Asthma Clinic 30 4 1 25.0% Chiropody 20 0 0Community Exercise 20 15 5 33.3% Community Psychogeriatric 20 10 5 50.0% Diabetes Health 100 100 50 50.0% Foot Care 50 50 31 62.0% Geriatric Assessment and Rehab (5N) 50 42 37 88.1% Geriatric Assessment and Rehab (5S) 55 34 35 102.9% Geriatric Telemedicine 25 24 8 33.3% Hospice / Palliative Care (4N) 40 22 23 104.5% Manor House (Adult Day) 60 56 30 53.6% Medically Complex Services (2N) 50 41 12 29.3% Medically Complex Services (2S) 30 21 15 71.4% Neuro Day OP 75 38 15 39.5% Physio & OT OP 30 27 26 96.3% Pulmonary Rehab 20 18 17 94.4% Rehabilitation (3N) 40 29 0 0.0% Rehabilitation (3S) 40 29 16 55.2% Rheumatic Disease 40 39 32 82.1% Seniors Outpatient Services 150 121 72 59.5% Transition (4S) 28 20 22 110.0% Wound Care 100 33 17 51.5% Total Rehabilitative Care 1143 809 489 60.4%
Appendix C: Demographic Details
Question 1: Length of time receiving services
Question 2: Client’s age group
St. Joseph’s Care Group – Client Satisfaction Survey 2021 January 2021 38
Seniors’ Health Addictions & Mental Health Rehabilitative Care Total # % # % # % # % < 1 month 8 2.0% 47 11.6% 84 17.5% 139 10.9% 1-6 months 43 10.9% 77 19.0% 159 33.1% 279 21.8% 7-12 months 40 10.1% 47 11.6% 47 9.8% 134 10.5% 1-5 years 231 58.5% 118 29.1% 111 23.1% 460 35.9% > 5 years 73 18.5% 116 28.6% 79 16.5% 268 20.9% Total 395 100.0% 405 100.0% 480 100.0% 1280 100.0%
Seniors’ Health Addictions & Mental Health Rehabilitative Care Total # % # % # % # % < 15 0 0.0% 14 3.5% 4 0.8% 18 1.4% 15 to 24 0 0.0% 50 12.3% 2 0.4% 52 4.0% 25 to 34 0 0.0% 67 16.5% 7 1.4% 74 5.8% 35 to 44 1 0.3% 61 15.1% 11 2.3% 73 5.7% 45 to 54 4 1.0% 70 17.3% 26 5.4% 100 7.8% 55 to 64 20 5.1% 84 20.7% 51 10.5% 155 12.1% 65 to 74 40 10.1% 46 11.4% 130 26.8% 216 16.8% 75 to 84 89 22.5% 12 3.0% 165 34.0% 266 20.7% 85+ 242 61.1% 1 0.2% 89 18.4% 332 25.8% Total 396 100.0% 405 100.0% 485 100.0% 1286 100.0%
Question 3: Client’s gender
Question 4: Role
Question 5: Cultural Background
St. Joseph’s Care Group – Client Satisfaction Survey 2021 January 2021 39
Seniors’ Health Addictions & Mental Health Rehabilitative Care Total # % # % # % # % Male 115 28.9% 195 48.1% 218 44.9% 528 41.0% Female 282 70.9% 203 50.1% 267 55.1% 752 58.4% Other Gender Identity 1 0.3% 7 1.7% 0 0.0% 8 0.6% Total 398 100.0% 405 100.0% 485 100.0% 1288 100.0%
Seniors’ Health Addictions & Mental Health Rehabilitative Care Total # % # % # % # % Client 237 59.8% 335 86.8% 388 82.2% 960 76.6% Family/Substitute Decision Maker 159 40.2% 51 13.2% 84 17.8% 294 23.4% Total 396 100.0% 386 100.0% 472 100.0% 1254 100.0%
Seniors’ Health Addictions & Mental Health Rehabilitative Care Total # % # % # % # % White 376 95.2% 266 65.8% 437 90.3% 1079 84.1% First Nation 8 2.0% 92 22.8% 34 7.0% 134 10.4% Métis 5 1.3% 10 2.5% 3 0.6% 18 1.4% Inuk (Inuit) 0 0.0% 1 0.2% 0 0.0% 1 0.1% Black 0 0.0% 4 1.0% 1 0.2% 5 0.4% Latin/ Hispanic 0 0.0% 2 0.5% 0 0.0% 2 0.2% Asian 0 0.0% 0 0.0% 1 0.2% 1 0.1% Other 2 0.5% 6 1.5% 2 0.4% 10 0.8% Multi-Cultural Indigenous 2 0.5% 20 5.0% 5 1.0% 27 2.1% Multi-Cultural NonIndigenous 2 0.5% 3 0.7% 1 0.2% 6 0.5% Total 395 100.0% 404 100.0% 484 100.0% 1283 100.0%
Question 6: Language of Care
St. Joseph’s Care Group – Client Satisfaction Survey 2021 January 2021 40
Seniors’ Health Addictions & Mental Health Rehabilitative Care Total # % # % # % # % English 389 97.7% 382 93.4% 478 97.8% 1249 96.4% French 4 1.0% 4 1.0% 1 0.2% 9 0.7% Indigenous 0 0.0% 22 5.4% 2 0.4% 24 1.9% Italian 2 0.5% 1 0.2% 1 0.2% 4 0.3% Finnish 2 0.5% 0 0.0% 3 0.6% 5 0.4% ASL 0 0.0% 0 0.0% 0 0.0% 0 0.0% Other 1 0.3% 0 0.0% 4 0.8% 5 0.4% Total 398 100.0% 409 100.0% 489 100.0% 1296 100.0%
Appendix D: Satisfaction Responses
Question 8: Courtesy & Respect
How often did staff treat you with courtesy and respect?
Question 9: Listening
How often did staff listen carefully to you?
Question 10: Involvement
How often did staff involve you in planning your care?
St. Joseph’s Care Group – Client Satisfaction Survey 2021 January 2021 41
Seniors’ Health Addictions & Mental Health Rehab & Chronic Disease Total # % # % # % # % Never 2 0.5% 3 0.7% 1 0.2% 6 0.5% Sometimes 12 3.0% 17 4.2% 11 2.3% 40 3.1% Usually 77 19.4% 63 15.5% 51 10.5% 191 14.8% Always 306 77.1% 324 79.6% 424 87.1% 1054 81.6% Total 397 100.0% 407 100.0% 487 100.0% 1291 100.0%
Seniors’ Health Addictions & Mental Health Rehab & Chronic Disease Total # % # % # % # % Never 3 0.8% 0 0.0% 3 0.6% 6 0.5% Sometimes 32 8.1% 24 6.0% 22 4.6% 78 6.1% Usually 113 28.5% 85 21.1% 80 16.6% 278 21.7% Always 248 62.6% 294 73.0% 378 78.3% 920 71.8% Total 396 100.0% 403 100.0% 483 100.0% 1282 100.0%
Seniors’ Health Addictions & Mental Health Rehab & Chronic Disease Total # % # % # % # % Never 28 7.3% 4 1.0% 19 4.1% 51 4.1% Sometimes 45 11.8% 35 8.7% 26 5.6% 106 8.5% Usually 93 24.3% 82 20.4% 77 16.6% 252 20.2% Always 216 56.5% 280 69.8% 342 73.7% 838 67.2% Total 382 100.0% 401 100.0% 464 100.0% 1247 100.0%
Question 11: Understanding Explanations
How often did staff explain things in a way you could understand?
Question 12: Cultural Support
How often did staff provide an environment that is supportive of your cultural background?
Question 13: Quality of Care
How would you rate the overall quality of the care you (or your family member) have received?
St. Joseph’s Care Group – Client Satisfaction Survey 2021 January 2021 42
Seniors’ Health Addictions & Mental Health Rehab & Chronic Disease Total # % # % # % # % Never 6 1.5% 1 0.2% 5 1.0% 12 0.9% Sometimes 30 7.6% 24 5.9% 25 5.1% 79 6.1% Usually 91 23.0% 91 22.5% 83 17.0% 265 20.6% Always 269 67.9% 288 71.3% 374 76.8% 931 72.3% Total 396 100.0% 404 100.0% 487 100.0% 1287 100.0%
Seniors’ Health Addictions & Mental Health Rehab & Chronic Disease Total # % # % # % # % Never 29 7.9% 7 1.7% 14 3.0% 50 4.0% Sometimes 15 4.1% 25 6.2% 12 2.6% 52 4.2% Usually 67 18.2% 91 22.7% 52 11.1% 210 17.0% Always 257 69.8% 278 69.3% 390 83.3% 925 74.8% Total 368 100.0% 401 100.0% 468 100.0% 1237 100.0%
Seniors’ Health Addictions & Mental Health Rehab & Chronic Disease Total # % # % # % # % Poor 5 1.3% 3 0.7% 6 1.2% 14 1.1% Fair 40 10.1% 25 6.2% 11 2.3% 76 5.9% Good 160 40.5% 107 26.6% 93 19.2% 360 28.1% Excellent 190 48.1% 268 66.5% 374 77.3% 832 64.9% Total 395 100.0% 403 100.0% 484 100.0% 1282 100.0%
Question 14: Cleanliness
How would you rate the cleanliness of the building?
Question 15: Food
How would you rate the overall quality of the food?
Question 16: Other Supports
Did staff help you to access other services and supports available, whether with St. Joseph’s Care Group or in the community (for example, housing, dental services, mental health services, caregiver supports)?
St. Joseph’s Care Group – Client Satisfaction Survey 2021 January 2021 43
Seniors’ Health Addictions & Mental Health Rehab & Chronic Disease Total # % # % # % # % Poor 2 0.5% 0 0.0% 2 0.4% 4 0.3% Fair 21 5.4% 16 4.1% 13 2.8% 50 4.0% Good 111 28.3% 67 17.2% 97 20.8% 275 22.0% Excellent 258 65.8% 307 78.7% 355 76.0% 920 73.7% Total 392 100.0% 390 100.0% 467 100.0% 1249 100.0%
Seniors’ Health Addictions & Mental Health Rehab & Chronic Disease Total # % # % # % # % Poor 56 14.8% 3 1.3% 10 4.3% 69 8.2% Fair 99 26.2% 20 8.8% 33 14.2% 152 18.2% Good 159 42.1% 96 42.3% 88 37.9% 343 41.0% Excellent 64 16.9% 108 47.6% 101 43.5% 273 32.6% Total 378 100.0% 227 100.0% 232 100.0% 837 100.0%
Seniors’ Health Addictions & Mental Health Rehab & Chronic Disease Total # % # % # % # % No definitely not 27 10.8% 3 0.9% 12 3.9% 42 4.7% No I do not think so 33 13.3% 29 8.5% 14 4.6% 76 8.5% Yes I think so 70 28.1% 105 30.9% 90 29.6% 265 29.7% Yes definitely 119 47.8% 203 59.7% 188 61.8% 510 57.1% Total 249 100.0% 340 100.0% 304 100.0% 893 100.0%
Question 17: Recommend to Others
Would you recommend the program to others?
St. Joseph’s Care Group – Client Satisfaction Survey 2021 January 2021 44
Seniors’ Health Addictions & Mental Health Rehab & Chronic Disease Total # % # % # % # % No definitely not 11 2.8% 4 1.0% 6 1.3% 21 1.7% No I do not think so 26 6.6% 12 3.0% 10 2.1% 48 3.8% Yes I think so 123 31.4% 121 30.5% 80 16.7% 324 25.6% Yes definitely 232 59.2% 260 65.5% 383 80.0% 875 69.0% Total 392 100.0% 397 100.0% 479 100.0% 1268 100.0%
Appendix E: Scores 2017-2021
Figure 1: Corporate Total Mean Scores
St. Joseph’s Care Group – Client Satisfaction Survey 2021 January 2021 45
2017 2018 2019 2020 2021 Respect 3.77 3.74 3.77 3.77 3.78 Listen 3.62 3.59 3.67 3.65 3.65 Involve 3.46 3.46 3.56 3.47 3.51 Explain 3.65 3.62 3.72 3.69 3.64 Cultural 3.63 3.57 3.71 3.59 3.62 Quality 3.56 3.55 3.60 3.61 3.57 Cleanliness 3.59 3.61 3.63 3.65 3.69 Food 3.04 3.03 2.82 2.90 2.98 Access 3.39 3.32 3.44 3.42 3.39 Recommend 3.64 3.62 3.66 3.68 3.62 2.25 2.50 2.75 3.00 3.25 3.50 3.75 4.00
Figure 2: Seniors’ Health Mean Scores
St. Joseph’s Care Group – Client Satisfaction Survey 2021 January 2021 46
2017 2018 2019 2020 2021 Respect 3.68 3.59 3.72 3.74 3.73 Listen 3.43 3.35 3.53 3.48 3.53 Involve 3.11 3.10 3.34 3.23 3.30 Explain 3.51 3.38 3.63 3.63 3.57 Cultural 3.39 3.23 3.60 3.47 3.50 Quality 3.29 3.22 3.31 3.43 3.35 Cleanliness 3.46 3.48 3.47 3.59 3.59 Food 2.81 2.77 2.45 2.60 2.61 Access 3.05 2.85 3.16 3.05 3.13 Recommend 3.45 3.35 3.40 3.50 3.47 2.25 2.50 2.75 3.00 3.25 3.50 3.75 4.00
Figure 3: Addictions & Mental Health Mean Scores
St. Joseph’s Care Group – Client Satisfaction Survey 2021 January 2021 47
2017 2018 2019 2020 2021 Respect 3.76 3.76 3.75 3.74 3.74 Listen 3.62 3.69 3.69 3.69 3.67 Involve 3.55 3.66 3.66 3.59 3.59 Explain 3.64 3.70 3.73 3.69 3.65 Cultural 3.66 3.69 3.69 3.67 3.60 Quality 3.59 3.68 3.67 3.69 3.59 Cleanliness 3.70 3.76 3.73 3.73 3.75 Food 3.16 3.37 3.07 3.21 3.36 Access 3.55 3.64 3.53 3.63 3.49 Recommend 3.66 3.73 3.71 3.74 3.60 2.25 2.50 2.75 3.00 3.25 3.50 3.75 4.00
Figure 4: Rehab & Chronic Disease Mean Scores
St. Joseph’s Care Group – Client Satisfaction Survey 2021 January 2021 48
2017 2018 2019 2020 2021 Respect 3.85 3.86 3.84 3.82 3.84 Listen 3.75 3.74 3.75 3.73 3.72 Involve 3.66 3.65 3.66 3.54 3.60 Explain 3.75 3.78 3.78 3.73 3.70 Cultural 3.77 3.77 3.81 3.61 3.75 Quality 3.72 3.77 3.78 3.68 3.73 Cleanliness 3.62 3.63 3.67 3.62 3.72 Food 3.26 3.24 3.22 3.01 3.21 Access 3.52 3.56 3.60 3.54 3.49 Recommend 3.75 3.77 3.83 3.76 3.75 2.25 2.50 2.75 3.00 3.25 3.50 3.75 4.00
Centre for Applied Health Research
Michel Bédard
Hillary Maxwell
Sacha Dubois
Aryn Ertl
Natalie Mullin-Bélanger
St. Joseph’s Care Group – Client Satisfaction Survey 2021 January 2021 49