
St. Joseph’s Care Group Client Satisfaction Survey 2015
St. Joseph’s Care Group – Client Satisfaction Survey 2015 Centre for Applied Health Research – December 2015 1 Table of Contents Executive Summary.................................................................................................................................2 Introduction..............................................................................................................................................3 The Survey ...............................................................................................................................................3 Survey Distribution..................................................................................................................................4 Participating Programs ........................................................................................................................... 5 Response Rate.........................................................................................................................................5 Demographic Information.......................................................................................................................6 Satisfaction Question Responses..........................................................................................................8 Conclusion............................................................................................................................................. 20 Acknowledgements............................................................................................................................... 21 Appendix A: Client Satisfaction Survey Committee ........................................................................... 22 Appendix B: Client Satisfaction Cover Letter and Questionnaire 2015 ............................................ 23 Appendix C: Survey Numbers and Response Rate ............................................................................ 26 Appendix D: Demographic Details....................................................................................................... 28 Appendix E: Satisfaction Responses .................................................................................................. 30 Appendix F: Comparison of mean scores (all programs) from 2009 to 2015 ................................... 34
Executive Summary
The annual St. Joseph’s Care Group (SJCG) client satisfaction survey was distributed to clients accessing services between September 28, 2015 and October 17, 2015 Clients and family member/substitute decision makers were encouraged to respond. The survey comprises five questions to gather basic demographic information and then follows with 11 satisfaction questions. In total 1192 surveys were completed. Overall respondents indicated that:
98% were “usually” or “always” treated with courtesy and respect by staff
96 % “usually” or “always” had staff listen to them carefully
88 % “usually” or “always” felt that staff involved them in their care
95 % “usually” or “always” felt staff explained things in a way they understood
92 % “usually” or “always” felt staff provided an environment supportive of their cultural background
95 % rated the overall quality of care as “Good” or “Excellent”
97 % felt that the cleanliness of the facilities was “Good” or “Excellent”
81 % rated the quality of the food served at SJCG facilities as “Good” or “Excellent”
85 % had staff help them access services and supports outside of their program; and
97 % would recommend SJCG programs to others
St. Joseph’s Care Group – Client Satisfaction Survey 2015 Centre for Applied Health Research – December 2015 2
Introduction
St. Joseph’s Care Group (SJCG) provides programs and services at eight different sites, including: Balmoral Centre, Behavioural Sciences Centre, Hogarth Riverview Manor, Lakehead Psychiatric Hospital, Sister Margaret Smith Centre, St. Joseph’s Health Centre, St. Joseph’s Heritage, and St. Joseph’s Hospital. St. Joseph’s Care Group’s broad service areas are Seniors’ Health, Mental Health and Addiction Services, and Rehabilitative Care & Chronic Disease Management To examine client satisfaction at all programs at SJCG, a corporate-wide client satisfaction survey was developed in 2009 by the Client Satisfaction Survey Committee (see Appendix A for a list of the current members)
The Survey
The 2015 survey comprises 17 questions. The first five questions capture basic demographic information (length of time receiving services, age group, sex, whether the respondent was a client or a family member/substitute decision maker, and racial/cultural background of the client). The question about cultural/racial back ground was changed from “Please select the group that best describes you” to “The following question will help us to better understand the communities that we serve. Do you consider yourself (the client) to be:”. The corresponding response options were also modified. The changes to this question were made after reviewing the Canadian Patient Experiences Survey from the Canadian Institutes of Health Information, the Outpatient Client Experience Survey from Accreditation Canada, and the National Household Survey from Statistics Canada.
Respondents are then asked for their opinions on the services that they received. They have a choice of four options ranging from 1 (the lowest score) to 4 (the highest score). Respondents were also given the option of “not applicable” for questions about food, cleanliness of the facility and whether staff helped them access services outside of the program.
There were a number of revisions to the satisfaction section of 2015 survey. Some of the questions were re-ordered. The question “How often did staff provide an environment that is supportive of people with diverse backgrounds?” (from the 2014 survey) was changed to “How often did staff provide an environment that is supportive of your cultural background?”. In addition, a new question was added to capture whether staff helped respondents access services outside the program
Thus, the questions on the 2015 survey are:
1. How often did staff treat you with courtesy and respect?
2. How often did staff listen carefully to you?
3. How often did staff involve you in planning your, or your family member’s, care?
4. How often did staff explain things in a way you could understand?
5. How often did staff provide an environment that is supportive of your cultural background?
St. Joseph’s Care Group – Client Satisfaction Survey 2015 Centre for Applied Health Research – December 2015 3
6. How would you rate the overall quality of care you, or your family member, have received?
7. What more can we do to improve the quality of care you, or your family member, have received? (open-ended question)
8. How would you rate the cleanliness of the building?
9. How would you rate the overall quality of the food?
10. Did staff help you access necessary services and supports outside of this program (for example housing, dental services, mental health services, caregiver supports)?
11. Would you recommend the program to others?
12. Do you have any other comments or suggestions? (open-ended question)
See Appendix B for a copy of the questionnaire. The survey was made available in English, Finnish, French, Italian, and Oji-Cree.
An additional question was added to the French version of the survey. This question was added to meet French Language Services requirements. This question was: How would you rate the quality of French languages services at St. Joseph's Care Group? (Comment évalueriez-vous la qualité des services offerts en français au St. Joseph’s Care Group?).1
Survey Distribution
Prior to the survey being distributed, information about the survey was provided in The Insider to inform staff about the survey. Managers were provided with posters with the survey details to display in program areas. The poster was formatted using the “Every Voice Counts” template. Cards with the survey details were also distributed on the food trays for the inpatient areas at St. Joseph’s Hospital. In addition to English versions of the survey, each program was provided with three copies of the survey in Finnish, Italian, French and Oji-Cree. Additional copies could also be requested.
Managers were asked to provide the survey to all clients who accessed services between Sunday, September 28, 2015 and Saturday, October 17, 2015. Each program determined the most appropriate manner to distribute the survey to clients. For example, surveys were hand delivered to inpatients while others programs distributed surveys during client appointments at SJCG facilities or in the community. Other programs mailed surveys to clients or family members. Stamped, addressed envelopes were provided so completed surveys could be mailed back to the CAHR at no cost to the respondent. For the total number of surveys requested and distributed by each program, please see Appendix C.
Participants were encouraged to complete a survey, seal it in the envelope provided with the survey, and to return it to the CAHR. It was also possible to complete the survey online. The
1 Given that only two individuals answered using the French version of the survey, these results are not reported.
St. Joseph’s Care Group – Client Satisfaction Survey 2015 Centre for Applied Health Research – December 2015 4
web address was provided in the cover letter that accompanied the survey. The on-line survey was available in English, Finnish, French, and Italian.
Attached to each survey was a ballot to complete and return to Communications & Engagement to win a prize. Prizes included three $25 gift cards to Intercity Shopping Centre and ten $5 gift cards to Tim Horton’s. Communications & Engagement collected the return ballots (n = 972), drew the winning ballots and contacted the winners.
Managers were offered the opportunity to have trained volunteers meet with clients to complete the survey. Processes were set in place with the Volunteer Coordinators to ensure completed surveys were returned to the Centre for Applied Health Research
Participating Programs
The table below provides information about the number of completed surveys returned by each program area (see Appendix C for the number of surveys returned from each program). In total 1192 surveys were returned. There were 2 surveys completed in French, 1 in Finnish, 1 in Italian, and none in Oji-Cree. Eleven surveys were completed on-line. Volunteers were utilized at Bethammi Nursing Home and St. Joseph’s Hospital to assist clients to complete the survey
Table 1: Number of Surveys Returned
The response rate for the survey was determined by dividing the number of surveys returned by the number of surveys distributed. Based on the information available, the response rate was 56.9%. See Appendix C for further details on the response rate for each program
St. Joseph’s Care Group – Client Satisfaction Survey 2015 Centre for Applied Health Research – December 2015 5
Number Percent Seniors’ Health 380 31.9 Mental Health and Addiction Services 280 31.9 Rehabilitative Care & Chronic Disease Management 432 36.2 GRAND TOTAL 1192 100 Response
Rate
Demographic Information
Respondents were asked to provide some basic demographic information. Numbers are based on complete responses. See Appendix D for further details.
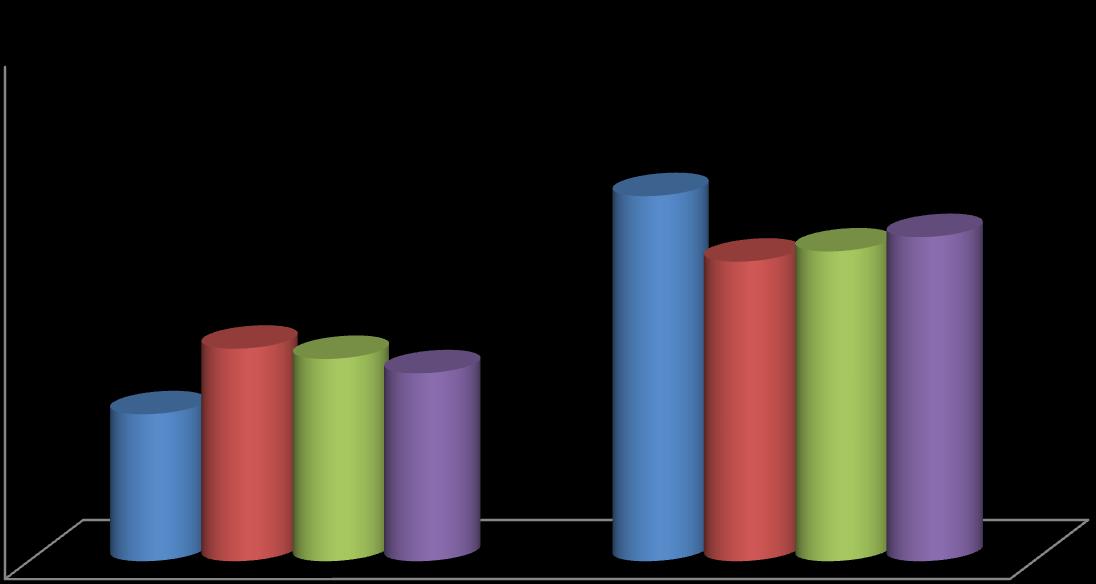
1: Length of time receiving services from St. Joseph’s Care Group (by percent)


2: Client’s Age Group (by percent)

St. Joseph’s Care Group – Client Satisfaction Survey 2015 Centre for Applied Health Research – December 2015 6 Rehabilitative Care & Chronic Disease Management Mental Health & Addictions Seniors' Health Total
Chart
0 10 20 30 40 50 60 70 80 90 100 Less than one month 1-6 months 7-12 months 1-5 years More than 5 years 3.9 14.9 11.8 51.8 17.6 9.1 20.5 8.8 34.4 27.2 20.0 30.2 9.2 21.7 18.8 11.4 22.2 9.9 35.3 21.2 0 10 20 30 40 50 60 70 80 90 100 Under 15 15 to 24 25 to 34 35 to 44 45 to 54 55 to 64 65 to 74 75 to 84 85 and over 0.0 0.0 0.0 0.0 0.3 2.7 11.7 33.3 52.0 2.9 13.1 18.2 16.6 18.2 21.2 6.4 2.4 0.8 0.7 1.9 1.9 7.7 6.2 17.9 26.1 20.8 16.7 1.2 4.9 6.6 8.1 8.2 14.1 15.2 18.9 22.8 Percent % Percent %
Chart
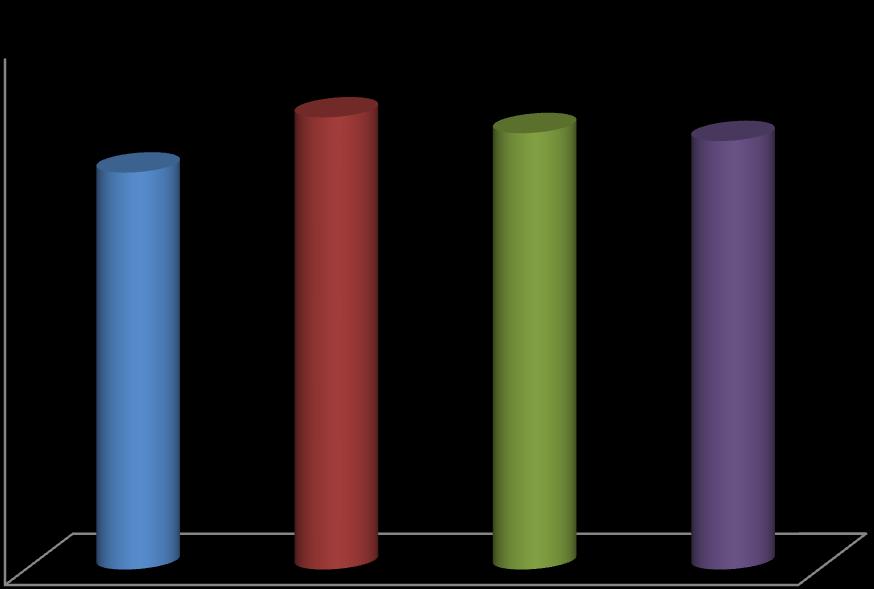
Chart 3: Client or Family Member/Substitute Decision Maker (by percent)


St. Joseph’s Care Group – Client Satisfaction Survey 2015 Centre for Applied Health Research – December 2015 7 Rehabilitative Care & Chronic Disease Management Mental Health & Addictions Seniors' Health Total
0 20 40 60 80 100 Client Family member or Substitute decision maker 68.9 31.1 94.9 5.1 84.1 15.9 83.0 17.0 0 10 20 30 40 50 60 70 80 90 100 Male Female 28.7 71.3 41.5 58.5 39.5 60.5 36.7 63.3 Percent % Percent %
Chart 4: Clients’ Sex (by percent)
Chart 5: Racial/Cultural Group of Respondents – All Programs (by percent)*
White
First Nation
Métis
Inuk (Inuit)
Black
Latin/Hispanic
Asian
Other
Prefer not to answer
* Due to limited numbers, the values for all programs are presented (see Appendix E for further details).
Satisfaction Question Responses
On the following pages, two charts are displayed for each of the ten satisfaction questions. The top chart displays the percent of respondents who answered 1, 2, 3, or 4 for each program area The bottom chart displays the overall average response (i.e., mean) by program area. Along with responses by program area, each chart also includes an additional bar displaying the responses for all programs together Results presented below are based on complete responses and as a result may not total 1192. In Appendix E, you will find the numbers and percents, and mean score and standard deviation for each question. See Appendix F for the mean scores for each question from surveys conducted from 2009 to present
St. Joseph’s Care Group – Client Satisfaction Survey 2015 Centre for Applied Health Research – December 2015 8
89.0 6.9 1.0 0.4 0.3 0.4 0.5 0.9 0.5
Question 1: How often did staff treat you with courtesy and respect? (n=1189)
Chart 6a: Percent by Program Area

Chart 6b: Mean by Program Area


St. Joseph’s Care Group – Client Satisfaction Survey 2015 Centre for Applied Health Research – December 2015 9 Rehabilitative Care & Chronic Disease Management Mental Health & Addictions Seniors' Health Total
0 10 20 30 40 50 60 70 80 90 100 Never Sometimes Usually Always 0.0 2.6 20.3 77.0 0.0 2.6 19.5 77.9 0.7 1.2 12.1 86.0 0.3 2.1 17.1 80.6 2.0 2.2 2.4 2.6 2.8 3.0 3.2 3.4 3.6 3.8 4.0 3.74 3.75 3.83 3.78 Percent %
Question 2: How often did staff listen carefully to you? (n=1183)
Chart 7a: Percent by Program Area


Chart 7b: Mean by Program Area

St. Joseph’s Care Group – Client Satisfaction Survey 2015 Centre for Applied Health Research – December 2015 10 Rehabilitative Care & Chronic Disease Management Mental Health & Addictions Seniors' Health Total
0 10 20 30 40 50 60 70 80 90 100 Never Sometimes Usually Always 0.3 5.6 29.1 65.0 0.3 4.2 23.5 72.0 0.5 1.6 17.7 80.2 0.3 3.7 23.2 72.8 2.0 2.2 2.4 2.6 2.8 3.0 3.2 3.4 3.6 3.8 4.0 3.59 3.67 3.78 3.68 Percent %
Question 3: How often did staff involve you in planning your, or your family member’s, care? (n=1148)
Chart 8a: Percent by Program Area


Chart 8b: Mean by Program Area

St. Joseph’s Care Group – Client Satisfaction Survey 2015 Centre for Applied Health Research – December 2015 11 Rehabilitative Care & Chronic Disease Management Mental Health & Addictions Seniors' Health Total
0 10 20 30 40 50 60 70 80 90 100 Never Sometimes Usually Always 6.1 11.6 26.2 56.1 3.2 7.0 21.4 68.4 2.9 6.3 19.9 70.9 4.0 8.2 22.4 65.4 2.0 2.2 2.4 2.6 2.8 3.0 3.2 3.4 3.6 3.8 4.0 3.32 3.55 3.59 3.49 Percent %
Question 4: How often did staff explain things in a way you could understand? (n=1181)
Chart 9a: Percent by Program Area

Chart 9b: Mean by Program Area

St. Joseph’s Care Group – Client Satisfaction Survey 2015 Centre for Applied Health Research – December 2015 12 Rehabilitative Care & Chronic Disease Management Mental Health & Addictions Seniors' Health Total
0 10 20 30 40 50 60 70 80 90 100 Never Sometimes Usually Always 1.9 5.6 27.0 65.5 1.1 4.2 26.1 68.6 0.5 2.8 18.0 78.7 1.1 4.1 23.5 71.3 2.0 2.2 2.4 2.6 2.8 3.0 3.2 3.4 3.6 3.8 4.0 3.56 3.62 3.75 3.65 Percent %
Question 5: How often did staff provide an environment that is supportive of your cultural background? (n=1091)
Chart 10a: Percent by Program Area


Chart 10b: Mean by Program Area

St. Joseph’s Care Group – Client Satisfaction Survey 2015 Centre for Applied Health Research – December 2015 13 Rehabilitative Care & Chronic Disease Management Mental Health & Addictions Seniors' Health Total
0 10 20 30 40 50 60 70 80 90 100 Never Sometimes Usually Always 6.0 5.4 20.8 67.9 2.2 5.4 13.9 78.5 2.8 3.4 11.4 82.4 3.6 4.7 15.1 76.6 2.0 2.2 2.4 2.6 2.8 3.0 3.2 3.4 3.6 3.8 4.0 3.51 3.69 3.73 3.65
Question 6: How would you rate the overall quality of care you, or your family member, have received? (n=1183)
Chart 11a: Percent by Program Area

Chart 11b: Mean by Program Area

St. Joseph’s Care Group – Client Satisfaction Survey 2015 Centre for Applied Health Research – December 2015 14 Rehabilitative Care & Chronic Disease Management Mental Health & Addictions Seniors' Health Total
0 10 20 30 40 50 60 70 80 90 100 Poor Fair Good Excellent 0.5 6.1 32.9 60.5 1.8 2.9 23.0 72.3 0.7 2.8 16.9 79.6 1.0 3.9 23.9 71.2 2.0 2.2 2.4 2.6 2.8 3.0 3.2 3.4 3.6 3.8 4.0 3.53 3.66 3.75 3.65 Percent %
Question 7: What more can we do to improve the quality of care you, or your family member, have received?
A total of 580 respondents (48.7%) included suggestions on what more can be done to improve the quality of care provided. The table below is a summary of the comments.
Table 2: Summary of Comments
– increase, add, or continue existing programs/services, increase clients’ engagement in activities, increase baths/showers, increase program funding, decrease wait lists, increase number of staff
consistency and attentiveness, prioritize tasks, listen, need
*Some respondents commented on more than one topic, therefore the total number of comments is greater than 580 (which is the number of people who responded).
St. Joseph’s Care Group – Client Satisfaction Survey 2015 Centre for Applied Health Research – December 2015 15
Comment Number * Quality of care – good/excellent, no improvements needed, satisfied,
up the good work Staff Attitude – great, caring, compassionate, and friendly 265 28
131
Staff Attitude – increase
to
helpful,
patient, respectful and supportive 57
Environment – improve accessibility and safety, increase/improve parking, improve access to equipment, increase cleanliness and privacy 44 Food – increase variety and quality including fresh fruits and vegetables, ensure adequate food temperatures, less salt, make snacks available, and provide healthier foods 26 Communication – increase workers who can speak another language, and increase communication between health professionals, between clients and staff, and between staff and family members 8 Scheduling – increase follow-up and reminders for appointments 9 Other Programs/Referrals – increase referrals and provide more information about programs within and outside of SJCG 7 Staff Education – increase knowledge and training of staff and volunteers 12 Planning and Organization – programs/services need to be more organized, care plans improved, and decrease medication errors 15 Other – unsure, undecipherable 6 Total 608
keep
Programs/Services
be more
understanding,
Question 8: How would you rate the cleanliness of the building? (n=1144)
Chart 12a: Percent by Program Area

Chart 12b: Mean by Program Area
St. Joseph’s Care Group – Client Satisfaction Survey 2015 Centre for Applied Health Research – December 2015 16 Rehabilitative Care & Chronic Disease Management Mental Health & Addictions Seniors' Health Total
0 10 20 30 40 50 60 70 80 90 100 Poor Fair Good Excellent 0.3 3.9 40.0 55.8 0.3 2.2 22.6 74.9 0.2 1.7 29.7 68.4 0.3 2.5 30.7 66.5 2.0 2.2 2.4 2.6 2.8 3.0 3.2 3.4 3.6 3.8 4.0 3.51 3.72 3.66 3.63 Percent %
Question 9: How do you rate the overall quality of the food? (n=666)
Chart 13a: Percent by Program Area

Chart 13b: Mean by Program Area

St. Joseph’s Care Group – Client Satisfaction Survey 2015 Centre for Applied Health Research – December 2015 17 Rehabilitative Care & Chronic Disease Management Mental Health & Addictions Seniors' Health Total
0 10 20 30 40 50 60 70 80 90 100 Poor Fair Good Excellent 5.0 19.7 57.2 18.1 3.0 10.4 37.8 48.8 1.5 14.8 49.3 34.5 3.5 15.9 50.0 30.6 2.0 2.2 2.4 2.6 2.8 3.0 3.2 3.4 3.6 3.8 4.0 2.88 3.32 3.17 3.08 Percent %
Question 10: Did staff help you access necessary services and supports outside of this program (for example housing, dental services, mental health services, caregiver supports)? (n=680)
Chart 14a: Percent by Program Area


Chart 14b: Mean by Program Area

St. Joseph’s Care Group – Client Satisfaction Survey 2015 Centre for Applied Health Research – December 2015 18 Rehabilitative Care & Chronic Disease Management Mental Health & Addictions Seniors' Health Total
0 10 20 30 40 50 60 70 80 90 100 No, definitely not No, I don't think so Yes, I think so Yes, definitely 5.8 15.1 32.9 46.2 3.0 7.4 29.9 59.8 4.3 10.9 27.7 57.1 4.3 10.9 30.3 54.6 2.0 2.2 2.4 2.6 2.8 3.0 3.2 3.4 3.6 3.8 4.0 3.20 3.46 3.37 3.35
Question 11: Would you recommend the program to others? (n=1151)
Chart 15a: Percent by Program Area

Chart 15b: Mean by Program Area

St. Joseph’s Care Group – Client Satisfaction Survey 2015 Centre for Applied Health Research – December 2015 19 Rehabilitative Care & Chronic Disease Management Mental Health & Addictions Seniors' Health Total
0 10 20 30 40 50 60 70 80 90 100 No definitely not No I do not think so Yes I think so Yes definitely 0.6 3.1 30.0 66.4 1.3 3.5 28.5 66.8 0.5 1.7 23.4 74.4 0.8 2.7 27.1 69.4 2.0 2.2 2.4 2.6 2.8 3.0 3.2 3.4 3.6 3.8 4.0 3.62 3.61 3.72 3.65 Percent %
Question 12: Do you have any other comments or suggestions?
A total of 421 respondents (35.3%) included additional written comments on their surveys. The table below is a summary of the comments.
Table 2: Summary of Comments
Comment
Programs/Services – helpful, needed, good quality, satisfied, excellent, appreciated
Staff – helpful, caring, compassionate, supportive, friendly, respectful, professional, wonderful, courteous
Programs/Services – increase existing programs/services, suggestions for improvement, timing, more program funding, not enough staff, help clients find housing, increase activities
Food – poorly prepared, cold, poor variety, inappropriate serving size, meal time rushed, not enough healthy food, food unavailable, too expensive, provide more local food
Staff – not prompt, rude, disrespectful, provide inadequate care, inattentive, lack of communication, rushed, unfriendly, unorganized, impatient
poor accessibility, inadequate space, dirty, noisy, poor parking, temperature, issues with elevator, construction, dull atmosphere, safety issues
Education – staff, family and clients
Other – unclear, “unsure” or “no” as comment,
* Some respondents commented on more than one topic, therefore the total number of comments is greater than 421 (which is the number of people who responded).
Conclusion
Overall satisfaction with services provided by the staff at SJCG is high and similar to results obtained since 2009. However, there are clients who express less favourable opinions about their care The results from the 2015 survey could prove useful at the program level to identify areas for improvement.
Each year efforts are made to provide the survey to as many clients as possible. Again this year was the survey was made available in Finnish, French, Italian, and Oji-Cree which received limited use. This year a question was targeted to French respondents. However, given that only two individuals answered the survey in French, we were unable to present these results. The on-line version of the survey was utilized by only 11 respondents. There is the potential to
St. Joseph’s Care Group – Client Satisfaction Survey 2015 Centre for Applied Health Research – December 2015 20
Number *
213
Food – good Environment – clean, aesthetically pleasing, friendly, safe 85 1 8
63
36
34
Environment –
survey content, comments about other clients 69 16 18 Total: 543
suggestions for
expand the use of the online survey and to provide it in Oji-Cree. Again this year there were many ballots submitted for the draw and it was well received.
Acknowledgements
This survey would not have been possible without the participation of the clients who responded to the survey. Many thanks are also extended to staff involved in the distribution of the survey and to volunteers who assisted with the administration of the survey.
St. Joseph’s Care Group – Client Satisfaction Survey 2015 Centre
–
21
for Applied Health Research
December 2015
Appendix A: Client Satisfaction Survey Committee
Name Position
Janet Sillman Vice President, Addictions and Mental Health
Heather Boynton Manager, Mental Health Outpatient Programs
Heidi West Manager, LTC Housing & Support Services Programs
Stella Alexander Client/Family Representative
Janine Black Director, Inpatient Complex Care and Rehabilitative
Shelby Poletti Manager, Quality and Performance
Anna Grenier Coordinator, Volunteer Services: HRM & SJ Heritage
Susan Franchi Director, Outpatient Rehabilitation and Chronic Disease Management
Carrie Gibbons Research Coordinator, Centre for Applied Health Research
St. Joseph’s Care Group – Client Satisfaction Survey 2015 Centre for Applied Health Research – December 2015 22
Appendix B: Client Satisfaction Cover Letter and Questionnaire 2015
Dear Client or Family Member:
St. Joseph’s Care Group is working very hard to ensure our clients and their family members receive the best possible services. I would appreciate hearing from you about your experience with our staff and our programs and services. Your thoughts and ideas will help us improve the care we provide.
Please take a few minutes to complete the survey attached to this letter. I encourage you to answer all questions. You do not have to answer questions that make you uncomfortable.
This survey is confidential and anonymous. All surveys will be sent to the Centre for Applied Health Research at St. Joseph’s Care Group. Your healthcare provider(s) will not see your responses.
Please place your completed survey in the envelope provided and then either:
mail it to the Centre for Applied Health Research, or
place it in the large ‘survey return’ envelope in your program area, or
give it to a staff member.
Please return the survey by October 17, 2015
You can complete the survey on-line if you prefer. The survey can be accessed at: http://tinyurl.com/sjcgclientsurvey.
The survey is available in English, Finnish, Italian, French and Oji-Cree. Please contact any staff member to obtain a copy of the survey in one of these languages.
If you have questions or need help completing the survey, please contact Carrie Gibbons, Research Coordinator, at 343-4300 ext. 4404.
By completing the survey, you will have a chance to win a draw for either 1 of 3 $25 gift cards to Intercity Shopping Centre or 1 of 10 $5 gift cards to Tim Horton’s. A ballot for the draw is included with this survey package. Please complete the ballot and return it to Communications & Engagement at St. Joseph’s Care Group. This can be done by mailing it in, placing it in the return envelope in your program area, or giving it to a staff member. Your ballot cannot be linked to your survey responses.
Thank you for taking the time to complete this survey. I value your ideas and information about your experiences with the Care Group. The results of the survey will be available on the St. Joseph’s Care Group website in early 2016 (www.sjcg.net).
Yours truly,
 Tracy Buckler, RN, BScN, MHS, CHE President & Chief Executive Officer

St. Joseph’s Care Group – Client Satisfaction Survey 2015 23
Please answer all questions on both sides of the sheet. Check only one box for each question.
How long have you or your family member been receiving services from St. Joseph’s Care Group?
Less than a month 1 – 6 months 7 – 12 months
Client’s age group Are you a:
1 – 5 years More than 5 years
Client’s sex: (in years)
Client
Male
Under 15 Family Member/Substitute Decision Maker Female
15 to 24
25 to 34 The following question will help us to better understand the 35 to 44 communities that we serve. Do you consider yourself (the client) to be:* 45 to 54 White (for example European, Latin/Hispanic 55 to 64 North American)
Asian 65 to 74
75 to 84
85 and over
First Nation
Métis
Inuk (Inuit)
Black (for example African, North American, Caribbean)
Other: ____________
Prefer not to answer
Please read the responses carefully and check the appropriate box for each question.
1. How often did staff treat you with courtesy and respect?
Never
Sometimes
2. How often did staff listen carefully to you?
Never
Sometimes
Usually
Usually
3. How often did staff involve you in planning your, or your family member’s, care?
Never
Sometimes
Usually
4. How often did staff explain things in a way you could understand?
Never
Sometimes
Usually
Always
Always
Always
Always
5. How often did staff provide an environment that is supportive of your cultural background?
Never
Sometimes
Usually
Always
6. How would you rate the overall quality of care you, or your family member, have received?
Poor
Fair
Good
Excellent
PLEASE TURN PAGE OVER
St. Joseph’s Care Group – Client Satisfaction Survey 2015 24
* This question is adapted from the Canadian Patient Experiences Survey from the Canadian Institutes of Health Information, the Outpatient Client Experience Survey from Accreditation Canada, and the National Household Survey from Statistics Canada.
7. What more can we do to improve the quality of care you, or your family member, have received?
8. How would you rate the cleanliness of the building?
Poor Fair Good Excellent Not applicable
9. How would you rate the overall quality of the food?
Poor
Fair
Good Excellent Not applicable
10. Did staff help you access necessary services and supports outside of this program (for example housing, dental services, mental health services, caregiver supports)? No, definitely not No, I don’t think so Yes, I think so Yes, definitely Not applicable
11. Would you recommend the program to others? No, definitely not No, I don’t think so Yes, I think so Yes, definitely
12. Do you have any other comments or suggestions?
Thank you!
St. Joseph’s Care Group – Client Satisfaction Survey 2015 25
Appendix C: Survey Numbers and Response Rate
St. Joseph’s Care Group – Client Satisfaction Survey 2015 Centre for Applied Health Research – December 2015 26
Program Number Requested * Number Distributed Number Returned Response Rate Seniors’ Health Hogarth Riverview Manor 72 70 25 35.7% Bethammi Nursing Home 113 111 52 46.9% Sister Leila Greco Apartments 132 130 88 67.7% P.R. Cook 128 111 64 57.7% Manor House Adult Day Program 95 88 39 44.3% Geriatric Telemedicine 20 15 3 2.0% Senior Psychiatry Day Program 39 27 17 63.0% Senior Community Psychiatry Program 120 70 13 18.6% Geriatric Assessment Program 145 116 65 56.0% Day Hospital 55 23 14 60.9% TOTAL 920 761 380 49.9% Mental Health and Addictions Program for Community Recovery 60 21 13 61.9% Adult Addictions & Problem Gambling 175 126 80 63.5% Comprehensive Community Support Team 80 23 13 56.5% Homes for Special Care and Medium Support Housing 15 15 0 0% Employment Services 30 30 4 13.3% GAPPS 40 30 14 46.7% Shared Mental Health Care 30 8 1 12.5% Balmoral Centre Withdrawal Management 25 25 21 84.0% Eating Disorders Program 30 15 13 86.7% Youth Addictions 50 46 18 39.1% High Support Homes 23 23 23 100.0% Adult Rehab 21 16 14 87.5% Older Adult 19 18 5 27.8% Chronic Pain 30 30 4 13.3%** Mental Health Outpatient 250 142 126 88.7% Dual Diagnosis 30 30 0 0%** Personal Development 75 64 31 48.4% TOTAL 983 662 380 57.4% Rehabilitation Care & Chronic Disease Management Neuro Day O/P 135 76 32 42.1% Foot Care 120 67 58 86.6% Rheumatic Disease Program 59 18 17 94.4% O/P Physio & OT 100 56 45 80.4% Ambulatory Care 30 30 21 70.0%** Wound Care 200 83 30 37.5% Chiropody 50 0 0 0% Pulmonary Rehab Program 45 31 26 83.9%
* This total does not include the Finnish, Oji-Cree, French or Italian versions of the survey that were provided to each program.
**The number of surveys distributed were not recorded, thus we have assumed all surveys that were requested were distributed.
St. Joseph’s Care Group – Client Satisfaction Survey 2015 Centre for Applied Health Research – December 2015 27 Program Number Requested * Number Distributed Number Returned Response Rate Asthma Clinic 40 17 16 94.1% Hospice Palliative Care- 4N 45 34 13 38.2% Transition-4S 28 23 13 56.5% Temporary Transitional Care Unit 26 9 7 77.8% Special Rehab & ABI- 3N 35 27 17 63.0% General Rehab- 3S 30 26 21 80.8% Geriatric Assessment & Rehab Care (I/P)- 5N 40 32 21 65.6% Extensive Services- 5S 40 29 19 65.5% Medically Complex Services- 2N 60 41 16 39.0% Reactivation- 2S 40 22 14 63.6% Diabetes Health 50 51 46 90.2% TOTAL 1168 672 432 64.3% GRAND TOTAL 3076 2095 1192 56.9%
Appendix D: Demographic Details
Table 1: Length of time receiving services from St. Joseph’s Care Group
Table 2: Client's Age Group
Table 3: Respondent is a client or family member/substitute decision maker
St. Joseph’s Care Group – Client Satisfaction Survey 2015 Centre for Applied Health Research – December 2015 28
Seniors’ Health Mental Health and Addictions Rehabilitative Care & Chronic Disease Management All Programs # % # % # % # % Less than 1 month 14 3.9 34 9.1 83 20.0 131 11.4 1-6 months 54 14.9 77 20.5 125 30.2 256 22.2 7-12 months 43 11.8 33 8.8 38 9.2 114 9.9 1-5 years 188 51.8 129 34.4 90 21.7 407 35.3 More than 5 years 64 17.6 102 27.2 78 18.8 244 21.2 Total 363 100 375 100 414 100 1152 100
Seniors’ Health Mental Health and Addictions Rehabilitative Care & Chronic Disease Management All Programs # % # % # % # % Under 15 years 0 0 11 2.9 3 0.7 14 1.2 15 to 24 years 0 0 49 13.1 8 1.9 57 4.9 25 to 34 years 0 0 68 18.2 8 1.9 76 6.6 34 to 44 years 0 0 62 16.6 32 7.7 94 8.1 45 to 54 years 1 0.3 68 18.2 26 6.2 95 8.2 55 to 64 years 10 2.7 79 21.2 75 17.9 164 14.1 65 to 74 years 43 11.7 24 6.4 109 26.1 176 15.2 75 to 84 years 123 33.3 9 2.4 87 20.8 219 18.9 85 years and older 192 52.0 3 0.8 70 16.7 265 22.8 Total 369 100 373 100 418 100 1160 100
Seniors’ Health Mental Health and Addictions Rehabilitative Care & Chronic Disease Management All Programs # % # % # % # % Client 228 68.9 335 94.9 329 84.1 892 83.0 Family/Decision maker 103 31.1 18 5.1 62 15.9 183 17.0 Total 331 30.8 353 32.8 391 36.4 1075 100.0
Table 4: Clients’ Sex
Table 5: Respondents’ Racial/Cultural Background
St. Joseph’s Care Group – Client Satisfaction Survey 2015 Centre for Applied Health Research – December 2015 29
Seniors’ Health Mental Health and Addictions Rehabilitative Care & Chronic Disease Management All Programs # % # % # % # % Male 100 28.7 140 41.5 154 39.5 394 36.7 Female 248 71.3 197 58.5 236 60.5 681 63.3 Total 348 100 337 100 390 100 1075 100
Seniors’ Health Mental Health and Addictions Rehabilitative Care & Chronic Disease Management All Programs # % # % # % # % White 348 95.9 292 79.8 376 91.3 1016 89.0 First Nation 2 .6 53 14.5 24 5.8 79 6.9 Métis 1 2 7 1.9 3 .7 11 1.0 Inuk (Inuit) 2 6 0 0 2 .5 4 .4 Black 2 .6 1 .3 1 .2 4 .3 Latin/Hispanic 2 6 1 .3 2 .5 5 .4 Asian 2 .6 4 1.1 0 0 6 .5 Other 3 .8 5 1.4 2 .5 10 .9 Prefer not to answer 1 2 3 .8 2 .5 6 .5 Total 363 100 366 100 412 100 1141 100
Appendix E: Satisfaction Responses
Question 1: How often did staff treat you with courtesy and respect?
Question 2: How often did staff listen carefully to you?
Question 3: How often did staff involve you in planning your, or your family member’s, care?
St. Joseph’s Care Group – Client Satisfaction Survey 2015 Centre for Applied Health Research – December 2015 30
Seniors’ Health Mental Health and Addictions Rehabilitative Care & Chronic Disease Management All Programs # % # % # % # % 1 = Never 0 0 0 0 3 0.7 3 0.3 2 = Sometimes 10 2.6 10 2.6 5 1.2 25 2.1 3 = Usually 77 20.3 74 19.5 52 12.1 203 17.1 4 = Always 292 77.0 296 77.9 370 86.0 958 80.6 Total 379 100 380 100 430 100 1189 100 Mean (SD) 3.74 (0.49) 3.75 (0.49) 3.83 (0.45) 3.78 (0.48)
Seniors’ Health Mental Health and Addictions Rehabilitative Care & Chronic Disease Management All Programs # % # % # % # % 1 = Never 1 0.3 1 0.3 2 0.5 4 0.3 2 = Sometimes 21 5.6 16 4.2 7 1.6 44 3.7 3 = Usually 109 29.1 89 23.5 76 17.7 274 23.2 4 = Always 243 65.0 273 72.0 345 80.2 861 72.8 Total 374 100 379 100 430 100 1183 100 Mean (SD) 3.59 (0.61) 3.67 (0.57) 3.78 (0.48) 3.68 (0.56)
Seniors’ Health Mental Health and Addictions Rehabilitative Care & Chronic Disease Management All Programs # % # % # % # % 1 = Never 22 6.1 12 3.2 12 2.9 46 4.0 2 = Sometimes 42 11.6 26 7.0 26 6.3 94 8.2 3 = Usually 95 26.2 80 21.4 82 19.9 257 22.4 4 = Always 203 56.1 256 68.4 292 70.9 751 65.4 Total 362 100 374 100 412 100 1148 100 Mean (SD) 3.32 (0.90) 3.55 (0.76) 3.59 (0.74) 3.49 (0.81)
Question 4: How often did staff explain things in a way you could understand?
Question 5: How often did staff provide an environment that is supportive of your cultural background?
Question 6: How would you rate the overall quality of care you, or your family member, have received?
St. Joseph’s Care Group – Client Satisfaction Survey 2015 Centre for Applied Health Research – December 2015 31
Seniors’ Health Mental Health and Addictions Rehabilitative Care & Chronic Disease Management All Programs # % # % # % # % 1 = Never 7 1.9 4 1.1 2 0.5 13 1.1 2 = Sometimes 21 5.6 16 4.2 12 2.8 49 4.1 3 = Usually 101 27.0 99 26.1 77 18.0 277 23.5 4 = Always 245 65.5 260 68.6 337 78.7 842 71.3 Total 374 100 379 100 428 100 1181 100 Mean (SD) 3.56 (0.69) 3.62 (0.62) 3.75 (0.52) 3.65 (0.61)
Seniors’ Health Mental Health and Addictions Rehabilitative Care & Chronic Disease Management All Programs # % # % # % # % 1 = Never 20 6.0 8 2.2 11 2.8 39 3.6 2 = Sometimes 18 5.4 20 5.4 13 3.4 51 4.7 3 = Usually 70 20.8 51 13.9 44 11.4 165 15.1 4 = Always 228 67.9 289 78.5 319 82.4 836 76.6 Total 336 100 368 100 387 100 1091 100 Mean (SD) 3.51 (0.85) 3.69 (0.68) 3.73 (0.66) 3.65 (0.73)
Seniors’ Health Mental Health and Addictions Rehabilitative Care & Chronic Disease Management All Programs # % # % # % # % 1 = Poor 2 0.5 7 1.8 3 0.7 12 1.0 2 = Fair 23 6.1 11 2.9 12 2.8 46 3.9 3 = Good 124 32.9 87 23.0 72 16.9 283 23.9 4 = Excellent 228 60.5 274 72.3 340 79.6 842 71.2 Total 377 100 379 100 427 100 1183 100 Mean (SD) 3.53 (0.64) 3.66 (0.63) 3.75 (0.53) 3.65 (0.61)
Question 8: How would you rate the cleanliness of the building?
Question 9: How do you rate the overall quality of the food? Seniors’ Health
Question 10: Did staff help you access necessary services and supports outside of this program (for example housing, dental services, mental health services, caregiver supports)? Seniors’
St. Joseph’s Care Group – Client Satisfaction Survey 2015 Centre for Applied Health Research – December 2015 32
Seniors’ Health Mental Health and
Rehabilitative Care & Chronic Disease Management All Programs # % # % # % # % 1 = Poor 1 0.3 1 0.3 1 0.2 3 0.3 2 = Fair 14 3.9 8 2.2 7 1.7 29 2.5 3 = Good 144 40.0 82 22.6 125 29.7 351 30.7 4 = Excellent 201 55.8 272 74.9 288 68.4 761 66.5 Total 360 100 363 100 421 100 1144 100 Mean (SD) 3.51 (0.59) 3.72 (0.51) 3.66 (0.52) 3.63 (0.55)
Addictions
Mental Health and Addictions Rehabilitative Care & Chronic Disease Management All Programs # % # % # % # % 1 = Poor 15 5.0 5 3.0 3 1.5 23 3.5 2 = Fair 59 19.7 17 10.4 30 14.8 106 15.9 3 = Good 171 57.2 62 37.8 100 49.3 333 50.0 4 = Excellent 54 18.1 80 48.8 70 34.5 204 30.6 Total 229 100 164 100 203 100 666 100 Mean (SD) 2.88 (0.75) 3.32 (0.78) 3.17 (0.73) 3.08 (0.77)
Health Mental Health and Addictions Rehabilitative Care & Chronic Disease Management All Programs # % # % # % # % 1 = No, definitely not 13 5.8 8 3.0 8 4.3 29 4.3 2 = No, I don’t think so 34 15.1 20 7.4 20 10.9 74 10.9 3 = Yes, I think so 74 32.9 81 29.9 51 27.7 206 30.3 4 = Yes, definitely 104 46.2 162 59.8 105 57.1 371 54.6 Total 225 100 271 100 184 100 680 100 Mean (SD) 3.20 (0.90) 3.46 (0.76) 3.37 (0.85) 3.35 (0.84)
Question 11: Would you recommend the program to others?
St. Joseph’s Care Group – Client Satisfaction Survey 2015 Centre for Applied Health Research – December 2015 33
Seniors’ Health Mental Health and Addictions Rehabilitative Care & Chronic Disease Management All Programs # % # % # % # %
not 2 0.6 5 1.3 2 0.5 9 0.8
don’t think so 11 3.1 13 3.5 7 1.7 31 2.7
= Yes, I think so 107 30.0 107 28.5 98 23.4 312 27.1 4 = Yes, definitely 237 66.4 251 66.8 311 74.4 799 69.4 Total 357 100 376 100 418 100 1151 100 Mean (SD) 3.62 (0.58) 3.61 (0.62) 3.72 (0.52) 3.65 (0.57)
1 = No, definitely
2 = No, I
3
Appendix F: Comparison of Mean Scores (all programs) from 2009 to 2015


St. Joseph’s Care Group – Client Satisfaction Survey 2015 Centre for Applied Health Research – December 2015 34
2009 2010 2011 2012 2013 2014 2015 0.00 0.50 1.00 1.50 2.00 2.50 3.00 3.50 4.00 3.74 3.65 3.46 3.61 3.61 3.69 3.12 3.64 3.74 3.62 3.44 3.61 3.57 3.66 3.12 3.60 3.75 3.63 3.43 3.64 3.60 3.69 3.12 3.63 3.79 3.66 3.50 3.68 3.63 3.63 3.07 3.66 3.76 3.66 3.49 3.62 3.62 3.67 3.10 3.61 3.57 3.79 3.68 3.50 3.68 3.66 3.69 3.09 3.60 3.57 3.78 3.68 3.49 3.65 3.65 3.63 3.08 3.65
