Leveraging decentralized entrepreneurial approach to safe water supply
A comprehensive study on safe water kiosks and their impact in rural Kenya

Conducted by In partnership with


Document title: Leveraging decentralized entrepreneurial approach to safe water supply: a comprehensive study on safe water kiosks and their impact in rural Kenya
Submitted to: Siemens Stiftung
Date: 26 February 2024
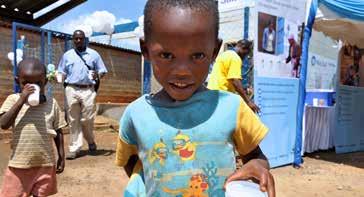
Photo credits: siemens-stiftung.org; Skyjuice.org
Disclaimer
While this report has been prepared in good faith and based on international best practices in research and consulting, EED Advisory does not accept responsibility whatsoever for any consequences of its use. Readers are responsible for assessing the relevance and accuracy of the content of this publication. EED Advisory will not be liable for any loss, damage, cost, or expense incurred or arising by reason of any person using or relying on information in this report.
Acknowledgment
The development of this report was facilitated by Siemens Stiftung. Throughout this study, multiple stakeholders were engaged ranging from field experts, Implementing partners (KWAHO and SWAP Kenya among others), County Government Officers, Maji Safi Kiosks owners, operators, and the end users. We would like to extend our gratitude to them for enabling the successful completion of this study.
The drafting of this report was made possible by contributions from EED advisory’s internal team including the Statisticians, Analysts, and GIS experts whom we value their effort.
Authors
Elmah Odhiambo, Joyce Irungu, Anne Waburi, Carl Ngaira (EED Advisory) with contributions from Christine Meinhardt (Siemens Stiftung), Stephen Njuguna, and Paul Njuguna (external Consultants SWE project).
Design and Layout
Michael Lusaba
© EED Advisory Limited 2024. All Rights Reserved.
EED Advisory Limited
90 James Gichuru Rd, Ikigai Lavington, Nairobi – Kenya
P.O. Box 66053-00800, Nairobi, | T: +254 745033484
E: contact@eedadvisory.com | W: www.eedadvisory.com
Table of contents Executive summary 1 1.Introduction 9 1.1 Water serviceprovision in Kenya 10 1.2 Significance of the Safe Water Enterprise (SWE) models 12 1.3 About the Safe Water Enterprise (SWE) project in Kenya 14 1.4 Summary of the approach and methodology 16 2. The Safe Water Enterprise (SWE) kiosks project in Kenya 17 2.1 Project implementation process (PIP) 18 2.2 Setting up Safe Water Enterprise (SWE) kiosks in Kenya 21 2.3 SWE kiosks profiles and the water supply system 24 3. Technical performance of the SWE kiosks 26 3.1 Overview and context 27 3.2 Socioeconomic and demographic analysis: Who is using the safe water from the kiosks? 28 3.3 Water sources and use 32 3.4 Water access 35 3.5 Water quality 46 3.6 Water supply and demand 50 3.7 Non-revenue water 52 3.8 Reliability 54 3.9 Operation and maintenance 56 3.10 Suggestions to improve the operation of SWE kiosks 57 3.11 Technical performance of the SWE kiosks 58 4. Financial performance of the water kiosk 62 4.1 Overview and context 63 4.2 SWE project actors implementation cost 64 4.3 Revenue analysis 65 4.4 Cost analysis 69 4.5 Cost benefit analysis 73 5. Sustainability and scalability of the kiosks 74 5.1 Overview and context 75 5.2 Sustainability of the SWE kiosks 76 5.3 Scalability of the SWE kiosks 80
6. Social and health impacts of the SWE project 83 6.1 Overview and context 84 6.2 The social impact of SWE kiosks 85 6.3 The health impact of SWE kiosks 88 7. Lessons learned and success indicators 91 7.1 Overview and context 92 7.2 Success indicators 93 7.3 Lessons learned 95 8. General conclusion and recommendations 99 8.1 Overall project performance and general conclusion 100 8.2 Conclusion 103 8.3 Recommendations 105 ANNEXES 106 ANNEX 1: LIST OF KEY INFORMANTS INTERVIEWED 107 ANNEX 2: Siemens Stiftung SWE Project established in Kenya 108 ANNEX 3: RESEARCH METHODOLOGY 109 ANNEX 4: INDIVIDUAL KIOSK PROFILES 126 ANNEX 5: HOUSEHOLD QUESTIONNAIRE 132 ANNEX 6: KEY INFORMANT INTERVIEW GUIDEs 132 ANNEX 7: BUSINESS QUESTIONNAIRE 132 ANNEX 8: OBSERVATION CHECKLIST 132 ANNEX 9: DATA QUALITY CONTROL PROTOCOL 132 ANNEX 10: ENUMERATORS & SUPERVISORS’ TRAINING MANUAL 132
List of figures
Figure 1: Primary source of water in informal settlements in Nairobi, Mombasa, and Kisumu 11 Figure 2: Per capita cost of implementing varied decentralized solutions - piped small scale water supply systems vs. Safe Water Enterprise in urban and rural settings in Kenya and India (EED Advisory, 2023) 13 Figure 3: SWE / Maji Safi kiosk sites – locations and selection 14 Figure 4: Summary of data collection methods used in this study 16 Figure 5: SWE project implementation process 18 Figure 6: Components of the SWE project 19 Figure 7: Project's target group 20 Figure 8: WASREB's steps in the identification of water service delivery options in marginalized areas 21 Figure 9: The SWE kiosks water supply system. Source: EED Advisory, 2023 24 Figure 10: Gender of household head (Maji Safi users) 28 Figure 11: Gender of household head in Non-Maji Safi households 29 Figure 12: Education level of household head in Maji Safi households 30 Figure 13: Education level of household head in non-Maji Safi households 31 Figure 14: Head of household income ranges (no represents Non-Maji Safi users and yes represents Maji Safi users) 31 Figure 15: Distribution of Maji Safi and non-Maji Safi users across the study respondents 32 Figure 16: Main source of water for non-Maji Safi households 33 Figure 17: Reasons for selection of water source among non-Maji Safi households 34 Figure 18: Comparison of distance to water point and collection time among Maji Safi and non-Maji Safi users 36 Figure 19: Time spent collecting water among Maji Safi households (minutes) 37 Figure 20: JMP water service levels ladder 38 Figure 21: Maji Safi households satisfaction with amount of water received 40 Figure 22: Average price per 20-litre jerrican at the water point 41 Figure 23: Comparison of average price of Maji Safi at the water point vs water vendor 42 Figure 24: Satisfaction with the price of water among Maji Safi households 43 Figure 25: Water quality satisfaction rate for Maji Safi users 47 Figure 26: Average quantity of water consumed per household per day 51 Figure 27: Maji Safi kiosks non-revenue water (%) 53 Figure 28: Parameters for assessing reliability 54 Figure 29: Satisfaction of Maji Safi users with time taken to restore water in incase of interruptions 55 Figure 30: Suggestions from Maji Safi users to improve Maji Safi operations 57 Figure 31: Revenue trends: Yearly revenues, annual growth rate, and the compounded annual growth rate of the SWE kiosks 65
Figure 32: Differentiated pricing mechanism in Kangemi driving changes in revenue share per consumer type for Kangemi 66 Figure 33: Comparing the cumulative revenue and cumulative volumes of water sold from Kiosks with a similar production capacity and base charge. Non-revenue water is observed to affect the revenue potential of Ngoliba and Sondu 67 Figure 34: Driving revenue growth through increasing sales revenue from alternative sources and decreasing non-revenue water. A comparison of Korumba, Maragua, and Sondu SWE kiosks 68 Figure 35: Cost trends: yearly costs, annual growth rate, and the compounded annual growth rate of the SWE kiosks. 69 Figure 36: The approximate costs incurred per month based on the KII responses from the operators 70 Figure 37: Comparison of cost and revenue per unit production (KES/litre) 71 Figure 38: Comparison of revenue, expenses, and net balance across the SWE models 73 Figure 39: Year-on-year cash surplus per kiosk 73 Figure 40: Dimensions of sustainability 75 Figure 41: Sustainability ranking of each water kiosk 79 Figure 42: Scalability potential of the SWE kiosks 81 Figure 43: Time taken queuing satisfaction rates 85 Figure 44: Payment and tariffs satisfaction rates 87 Figure 45: Health benefits across the six kiosks 88 Figure 46: Positive experiences reported by households 90 Figure 47: Maji Safi kiosks users queuing for safe drinking water at Ngoliba kiosk –Kiambu County 93 Figure 48: An image of the Sky Hydrant filtration system at Korumba Kiosk - Kisumu County 95 Figure 49: Preview of the kiosk systems by World Vision and Siemens Stiftung 98 Figure 50: Study approach 109 Figure 51: Activities conducted during the inception phase 110 Figure 52: Stakeholder mapping 110 Figure 53: Summary of data collection methods used in this study 115 Figure 54: A representation of the RCT study design 116 Figure 55: SWP map interface for the Sondu kiosk 119 Figure 56: Field data collection activities 120 Figure 57: A decision tree for the financial analysis 122 Figure 58: Dimensions of sustainability 123 Figure 59: Application of OECD criteria to synthesize project findings 124 Figure 60: Illustration of the RAG rating system 125
List of tables
Table 1: Components of a water kiosk according to WASREB's guidelines (2019) 22 Table 2: Regulatory provisions for water kiosks 23 Table 3: Summary information on the SWE kiosks evaluated 25 Table 4: Household uses of Maji Safi 33 Table 5: Classification of Maji Safi service level as per the JMP ladder 38 Table 6: Average price of water per 20-litre jerrican 43 Table 7: Determining the water burden across households 44 Table 8: Determining the water burden across the Maji Safi users 45 Table 9: Water quality testing frequency for Maji Safi kiosks 46 Table 10: Maji Safi water quality performance against KEBS and WHO standards 48 Table 11: Water supplied by Maji Safi kiosks across the six sites 50 Table 12: Kiosk operating hours, frequency of breakdowns, and average response time 55 Table 13: Scoring criteria to determine the technical viability of the water kiosks 58 Table 14: Technical viability rating for the Maji Safi kiosks 59 Table 15: Kiosk-specific interventions to improve their technical viability 61 Table 16: Breakdown of total budgetary costs for SWE implementation across East Africa 64 Table 17: Social sustainability findings 76 Table 18: Technical and environmental sustainability rating for each water kiosk 77 Table 19: Suggested improvements in addressing accessibility challenges 78 Table 20: Scalability parameters 81 Table 21: Select case studies of related/similar projects 98 Table 22: Overall rating of the SWE kiosk project 100 Table 23: List of key informants interviewed 107 Table 24: SWE kiosk projects in Kenya 108 Table 25: A list of data collection tools 111 Table 26: Technical viability assessment parameters 112 Table 27: Financial viability assessment parameters 113 Table 28: Social impact assessment parameters for kiosk operators and consumers 114 Table 29: Sample distribution 117 Table 30: A non-exhaustive list of businesses interviewed 117 Table 31: Contents of the thematic analysis 121 Table 32: Kangemi resource centre kiosk profile 126 Table 33: Ngoliba health centre kiosk profile 127 Table 34: Maragua Market kiosk profile 128 Table 35: Korumba kiosk profile 129 Table 36: Sondu kiosk profile 130 Table 37: Wath Ong'er kiosk profile 131
List of abbreviations
AWF : African Water Facility
CAPEX : Capital Expenditure
CHVs : Community Health Volunteers
CoK : Constitution of Kenya
CWS : Centre for Water Security and Cooperation
DHS : Demographic and Health Survey
GoK : Government of Kenya
IDA : International Development Association
IRC WASH : International Water and Sanitation Centre
MO : Master Operator
NGOs : Non-Governmental Organizations
O&M : Operations and Maintenance
PHOs : Public Health Officers
PPCP : Public-Private Community Partnership
SDGs : Sustainable Development Goals
SWE : Safe Water Enterprises
SSWSPS : Small-Scale Water Service Providers
UNHROHC : United Nations Human Rights Office of the High Commissioner
WASH : Water, Sanitation, and Hygiene
WASREB : Water Services Regulatory Board
WSP : Water Service Providers
WSTF : Water Sector Trust Fund
WUAs : Water Users Associations
Definition of key terms used in this report
Health impact: Has been used in this report to refer to the health benefits that the community enjoys from using water derived from the Safe Water Enterprise (SWE) kiosks
Maji Safi kiosk: These are Safe Water Enterprise kiosks, locally known as MajiSafi kiosks
Maji Safi Users: Households that derive water from the Safe Water Enterprise kiosks
Non-Maji Safi Users: Households that do not depend on water from the Safe Water Enterprise kiosks
Scalability: Has been used to refer to the capacity of the Safe Water Enterprise (SWE) kiosks to expand or adapt the water kiosk infrastructure, services, and resources to meet the growing needs of the community/consumers it serves
Sustainability: Has been used in this report to refer to the ability of the Safe Water Enterprise (SWE) kiosks to withstand both the financial, environmental, and social factors to consistently provide safe water to the consumers
SWE kiosks: These are the Safe Water Enterprise kiosks
Reliability: Three parameters have been used to define the reliability of the kiosks; hours of supply, reported frequency of breakdowns in the past three months, and response time taken to restore the system in case of a breakdown
Accessibility: This encompasses the distance to the water point, the time spent to get to the water point and fetch water, and the quantity of water that households can fetch
Non-revenue water (NRW): This refers to the water that has been produced and is "lost" before it reaches the customer.
Executive summary


Introduction and context of the study
For Kenya, universal access to water, sanitation, and hygiene services (WASH) by 2030 is a USD 22 billion investment question to expand and improve the current services.
Universal access to water in Kenya is a multi-faceted challenge encompassing both a local and socio-economic dimension; stark disparities exist between urban and rural access and high to low-income households. For Kenya, universal access to water, sanitation, and hygiene services (WASH) by 2030 is a USD 22 billion investment question to expand and improve the current services. Presently only USD 11 billion is projected to be available for investment between 2023 – 2030. In the wake of the water delivery service gap, unregulated small-scale service providers flourish, filling a critical gap. Whereas traditional centralized service solutions are critical in closing the gap, for most developing countries, the financial investment required to meet the need is often inadequate.
As governments struggle to mobilize enough resources for investment, entrepreneurs, impact investors and donor organizations have experimented with decentralized solution approaches to expand access to safe drinking water. Cognizant of the water access challenges in rural and underserved communities, Siemens Stiftung and SkyJuice Foundation Inc. together initiated the Safe Water Enterprise (SWE) project across several counties in Kenya in 2012/13. These included Kisumu, Migori, Homa Bay, Nandi, Kwale, Nairobi, Muranga, and Kiambu counties. As the project drew to a close, the Siemens Stiftung team handed over all safe water kiosks to the respective County governments as per the Water Act 2016 to hold the assets in trust for the community.


2 Executive summary
Approach and methodology
• Kiosk management
• Kiosk operators
Sustainability and scalability assessment
Siemens Stiftung commissioned this study to assess six safe water kiosk sites with regard to 1) the extent to which the applied community-led social entrepreneurial kiosk model has been achieved, i) the technical and business performance goals, ii) financial sustainability, iii) scalability as well as iv) the potential social impacts. The study also aims to 2) identify the i) best practices and ii) success factors, iii) challenges and weaknesses of the model in order to be able to structure further interventions. A mixed methodology approach was employed in obtaining the needed data for this study as demonstrated below and comprehensively discussed in Annex 3 of this report.
• Key informants
• Kiosk management and operators
• Households
• Key informant interviews (KIIs)(n=27)
• KII guides
• Vendors interviews(n=27)
Social and health impact analysis
• Households
• Businesses
• Water vendors
• Key informants
Identifying lessons learnt
Identifying best practices and key success factors
• Kiosk management
• Kiosk operators
• Partners
• Siemens Stiftung team
• Households’ interviews(n=512)
• Business interviews(n=57)
• Kiosk management
• Key informants
• Observations(n=6)
• HHs questionnaire
• Business questionnaire
• Vendors questionnaire
• Observations checklist
3 Executive summary
Activity
respondent
collection method
Technical and business performance evaluation
Target
Data
Data collection tool
A randomized control study design was employed to understand the impact of the safe water enterprise kiosks on the community. This involved selecting an equal number of participants from both the intervention arm (consumers who obtained water from the kiosk) and the control arm (the consumers who did not obtain water from the kiosk). The six SWE kiosks evaluated in this study are equipped with different water supply set-ups and operate in different contexts and serve different clients. The SWE kiosks were implemented in partnership with different community partners and have varying governance, and or management structures. Four of the water kiosks are owned and governed by Community-Based Organizations (CBOs) now officially registered as Water User Associations (WUAs), comprising member committees while two are managed by host institutions as shown below.
4 Executive summary
Source Storage (17,000 litres) Purification Wath Ong’er kiosk
Source Storage (11,000 litres)
Purification Sondu kiosk
+
Source Storage (22,000 litres) Purification Maragua Market kiosk Source Storage (20,000 litres) Purification Korumba kiosk Source Storage (17,000 litres) Purification Ngoliba health centre kiosk Source Storage (50,000 litres) Purification Kangemi resource centre
Assessment findings
The Safe Water Enterprise (SWE) technology uses a lowkey membrane ultrafiltration unit that works without electricity by using gravity and produces up to 10,000 litres of safe drinking water per day without requiring chemical treatment.

The Safe Water Enterprise (SWE) technology uses a lowkey membrane ultrafiltration unit that works without electricity by using gravity and produces up to 10,000 litres of safe drinking water per day without requiring chemical treatment. The water from the kiosks is accessible, highly affordable, and is primarily used for drinking with consumers from Wath Ong’er, Ngoliba and Maragua kiosks having 24/7 access via water ATMs. However, in some of the kiosks, especially those in rural areas, distance to the kiosks remains an issue, and water vendors are stepping in to fill the existing gap as the kiosks look to scale.
A scoring matrix outlined in chapter three (36) of this report was developed to rate the technical efficiency of the six kiosks. Based on the ratings, all kiosks fall within the moderate to high technical viability range. Except for the Korumba and Ngoliba kiosks which have moderate technical viability, the rest of the kiosks have high technical viability. To improve technical efficiency, the SWE kiosks could:
i. Establish alternative methods to enhance the dependability of their water supply.
ii. Reduce their Non-Revenue Water (NRW) that currently affects the revenues for water which they otherwise would have sold to consumers.
iii. Embrace more regular water testing both from the source and at the kiosk to enhance overall water quality
iv. Establish mechanisms to manage the operation and maintenance needs (O&M) either by having a permanent technician or considering a guaranteed service model
Over three years, most of the SWEs indicated revenue growth, regardless of the setting (rural/peri-urban). Kangemi and Maragua SWEs had a year-on-year increase in their revenue streams with a compounded annual growth rate of 28% and 20%. Wath Ong’er, Ngoliba, and Sondu had a CAGR of 9%, 3%, and 15%, respectively - with fluctuations in their year-on-year revenue, all notably higher than the industry CAGR indicated by the water utilities (2.9%).
5 Executive summary
Except for Wath Ong’er that has been paying loans in that period, the kiosks, and the main expense classes are homogeneous and primarily related to the operations across the SWEs. The kiosks’ expenses revolve around, wages, repairs and maintenance, electricity costs, and transportation.
Although the tariffs seem to provide adequate cost coverage, Kangemi and Korumba’s fluctuations highlight the need to develop elaborate cost-effective coping strategies for when production is low. These may include introducing additional water storage to ensure a base supply that can allow sufficient revenue collection to cover the usual times of the water supply system. For longer times – lower production than normal, the kiosks' operators will need to be aware of where they can easily reduce their costs.
All the water kiosks are technically, financially, and environmentally sustainable with only Korumba and Ngoliba exhibiting moderate viability. They will require a few or minor adjustments to ensure long-term sustainability, while the rest are ranked as highly viable. The sustainability of a water kiosk is crucial for its ability to scale. For example, sustainable water kiosks must generate enough revenue to cover their operational costs, maintenance, and potential expansion.
The potential for the kiosks to scale in their present condition is low without external support. Scalability involves the capacity to expand or adapt the water kiosk infrastructure, services, and resources to meet the growing needs of the community it serves. None of the kiosks, in their current state, can scale their operations; enhance the production capacity, set up satellite and or alternative kiosks, and supply water to high-water consumption facilities consistently. One of the ways to scale is to seek financial aid; this can come from either donor partners or banking institutions.
The Safe Water Enterprise (SWE) kiosks have positively impacted the health and well-being of the beneficiary communities. Access to clean water through a water kiosk can profoundly impact a community's health and enhance social equity by reducing disparities in access to clean water, particularly in marginalized communities. The following are some of the success indicators of the project:
i. Reduced waiting time as a majority of the users experienced minimal wait times, with an average wait of 5 minutes or less. The time that would otherwise be used queueing or walking to fetch water is now used for doing other household chores.
Scalability involves the capacity to expand or adapt the water kiosk infrastructure, services, and resources to meet the growing needs of the community it serves.

6
Executive summary
ii. Rise in business establishments such as butcheries, saloons, and restaurants that obtain water from the kiosks. Water vending has also become popular across the six sites.
iii. Across the six sites, users report a reduction in waterborne diseases, with over 90% of respondents rating the water as clean and safe hence lowering incidences of illnesses like diarrhea and cholera. This is coupled with improved hygiene and sanitation practices.
Access to safe water not only contributes to better health but also spurs community growth in many aspects. For rural and underserved communities where access to safe water is limited due to the multiplicity of unsafe water sources, the Safe Water Kiosks can be seen as a game changer, and Maji Safi is a popular phrase. The following are some of the lessons learned:
i. Efficient water provision requires reliable technology.
ii. Revenues generated from the kiosks may only ensure sustainability but not scalability of the kiosks.
iii. Adequate and continued stakeholder engagement is instrumental for the decentralized systems.
iv. Ultimately, the kiosks can only project what they can track.

7 Executive summary
Conclusion and recommendations
In conclusion, the SWE kiosks have increased access to clean and safe drinking water and influenced the establishment and growth of businesses and social amenities in the respective communities in the six sites under assessment. Further, there is potential to reduce the non-revenue water and increase revenues that would inform their scalability. The following are thus recommended:
i. There is a greater need to capacity-build the kiosk management and operators on fiscal management and maintenance practices. This would go a long way in influencing their potential to scale up and remain sustainable.
ii. To address their operation and maintenance (O&M) challenges, the kiosk may adopt a guaranteed service model in which the entity is granted a portion of the operating costs to cover infrastructural maintenance based on annual contractual agreements.
iii. It will be important for the kiosk management to partner with local health centers/ dispensaries and other interest groups to facilitate awareness creation on the continued use of safe water for drinking and improving their hygiene practices.
iv. For the kiosks to be scalable, there is a need for the local administrations especially the county government to support the community-based social enterprise models through partnerships for collective action with private sector actors.

8 Executive summary
1. Introduction


1.1 Water service provision in Kenya
For Kenya, universal access to water, sanitation, and hygiene services (WASH) by 2030 is a USD 22 billion investement question to expand and improve the current services.

1. World Bank (2023).
Unblocking Sector Financing for Universal Access to Water Supply and Sanitation in Kenya. Sector Note. https:// www.usaid.gov/kenya/document/water-sanitation-and-hygiene-finance
For Kenya, universal access to Water, Sanitation, and Hygiene Services (WASH) by 2030 is a USD 22 billion investment question to expand and improve the current services. Presently only USD 11 billion is projected to be available for investment between 2023 – 2030.1 By definition the term “universal access to water and sanitation” is amorphous. For this reason, organizations such as the Centre for Water Security and Cooperation (CWSC) offer perspicuity by redefining access to anchor and placing emphasis on water being physically available in the home, and in reliable and sufficient quantities to meet domestic needs safely.2 According to Kenya’s Demographic and Health Survey (DHS 2022), only 68% of the household population have access to at least basic drinking water services3 – an improved water source with not more than a 30-minute round-trip collection time. Only 46% of the households have access to drinking water on their premises with 67% of these households indicating sufficient quantities of drinking water within the previous 30 days.4 By CWSC’s definition, only 31% of Kenyan Households have universal access in 2022.
The lack of access to water in Kenya is a multi-faceted challenge encompassing both a local and socio-economic dimension. This means that stark disparities arise when comparing urban to rural access and high- and low-income households. In rural areas, the proportion of households with drinking water on their premises is 35% which is half that in urban areas at 70%. For the lowest wealth quintile, only 14% of households have access to water on their premises compared to 84% in the highest quintile.5 Indicating that for every 6 households in the highest wealth quintile with access to water on their premises, there is only 1 household in the lowest wealth quintile reporting the same.
2. CWSC (2021). Access Defined Linking Source, Shelter and Service. https:// drive.google.com/file/d/1Pgnp3vFI6b2vzTbHo0C094g0xz2fJJ8W/view
3. KNBS (2023). Kenya Demographic and Health Survey 2022. Key Indicators Report. https://dhsprogram.com/pubs/ pdf/DM186/DM186.pdf
4. KNBS (2023). Kenya Demographic and Health Survey 2022. Volume 1. https:// dhsprogram.com/pubs/pdf/ FR380/FR380bis.pdf
5. ibid
10
1. Introduction
To understand the dynamics of access and underinvestment in rural and urban low-income areas, a review of water service delivery provision is essential. Historically, the legal framework and institutional arrangements for the Government of Kenya (GoK) to develop water supply systems date back to the Water Act, 1952, Chapter 372 (enacted during the colonial period), and the National Water Master Plan (1974).6 The latter intimated the goal to ensure access to drinking water, at reasonable distances to all households, by the year 2000. However, by the year 2000 – supply systems were developed in only 10 municipalities serving 3.9 million urban dwellers. An additional 550 rural water schemes7 serving 2.3 million people accessed some level of service through community-operated self-help groups whose capital investments were often from donor organizations.8 Water Sector Reforms introduced through the 2002 Water Act oriented water supply service provision to a private sector model. Ultimately encouraging efficiency but creating different service levels based on disposable incomes. Water Service Providers focused on middle and high-income areas where revenue gains and growth were higher.9
In the wake of the water delivery service gap, unregulated small-scale service providers flourish, filling a critical gap. Often regarded as predatory due to their previously reported exorbitant prices10, the significance of their role is still not clear. However, what is evident is the sizeable population in urban and rural areas relying on their services. For example, a study by the United Nations Human Rights Office of the High Commissioner (UNHROHC) indicates that, depending on the season, at least 33% - 55% of residents of low-income areas in the 3 major cities of Nairobi, Mombasa, and Kisumu rely on private sources (Figure 1).11 For rural areas, the demographic household survey of 2022 indicates that 44.2% rely on private sources.
6.Albert Mumma (2007).
Kenya’s New Water Law: An Analysis of the Implications of Kenya’s Water Act, 2002, for the Rural Poor. https://www. iwmi.cgiar.org/Publications/ CABI_Publications/CA_CABI_ Series/Community_Law/protected/Ch%2010.pdf
7. Githu, I. (2022). Where Community Management Works: The evolution and professional management of piped water supplies in Rural Kenya. A Doctoral Thesis.
8. ibid
9. KMT (2019). The Journey of Changing Water Services Delivery in Kenya. https:// marketshareassociates. com/wp-content/uploads/2020/07/2019-The-Journey-of-Changing-Water-Services-Delivery-in-Kenya.pdf
10. World Bank (2019). Informal Water Markets in an Urbanising World: Some unanswered questions.
Water tanker or car;
11. UN Human Rights (2019). Right to Water in Kenya; Assessment of Access to Water in Informal Settlements. https:// www.ohchr.org/sites/default/ files/Documents/Countries/KE/ Assessment_right_water_Kenya2020.pdf
Figure 1
season Water kiosk; 42% Water kiosk; 27%
tap
standpipe; 23%
18% Piped household water in compound; 19%
Primary source of water in informal settlements in Nairobi, Mombasa, and Kisumu
Dry
Public
or
Public tap or standpipe;
Piped household water in
compound;
17% Borehole; 15% Borehole; 15%
Water tanker or car; 4%
4% Harvested rainwater; 2% Unprotected Surface Water Unprotected surface water Harvested rainwater; 6% 1% 1% Rainy season 0% 100% 90% 80% 70% 60% 50% 40% 30% 20% 10%
1. Introduction 11
1.2
Significance of the Safe Water Enterprise (SWE) models
Whereas traditional centralized service solutions are critical in closing the gap, for most developing countries, the financial investment required to meet the need is often inadequate. Despite a doubling of the investments towards the water and sanitation sector in Kenya between the years of 2012 and 2017, that is, from KES 15 billion to 30 billion – the annual expenditure is less than a third of what is needed (KES 105 billion/year).12 Traditionally these centralized solutions provide access to improved sources, that do not involve treatment at the point of consumption.13
As governments struggle to mobilize enough resources for investment, entrepreneurs, impact investors and donor organizations have experimented with decentralized solution approaches to expand access to safe drinking water. The Safe Water Enterprises (SWE) use market approaches to deliver high-quality water treated at the point of consumption. Often, these solutions offer the full range of services across the value chain – from extraction, treatment, and payment collection.14 In the context of middle- and lowincome countries, these enterprises have installed Water ATMs which increase accessibility and provide affordable safe drinking water.15
Serving more than 3 million people, SWE models are a low-cost solution.16 A 2023 report on the performance of the SWE model in India indicates that at capex costs of about USD 20,000 – USD 30,000 serving about three to five thousand, SWEs offer safe drinking water at approximately USD 1/person/ year or USD 15/person.17 The latter is considerably cheaper than the per capita costs reported for a new piped water connection through a small-scale water service provider in urban – USD 50, and in rural settings – USD 20 in Kenya in 2011.18,19
Despite a doubling of the investments towards the water and sanitation sector in Kenya between the years of 2012 and 2017, that is, from KES 15 billion to 30 billion – the annual expenditure is less than a third of what is needed.
 12. MoWSI (2023). The Kenya National Water and Sanitation Investment and Financing Plan 2022 – 2030.
13. Dalberg Advisors (2017). The Untapped Potential of Decentralized Solutions to Provide Safe, Sustainable Drinking Water at Large Scale. The State of the Safe Water Enterprises Market.
14. ibid
15. Safe Water Network (2023). Sustainable Enterprises for water and health financial and operational performance of safe water enterprises in India.
16. Dalberg Advisors (2017).
17. Safe Water Network (2023).
18. IFC (2011). SSAWA Market Brief No. 1: The Market for Small-Scale Piped Water Systems in Kenya
12. MoWSI (2023). The Kenya National Water and Sanitation Investment and Financing Plan 2022 – 2030.
13. Dalberg Advisors (2017). The Untapped Potential of Decentralized Solutions to Provide Safe, Sustainable Drinking Water at Large Scale. The State of the Safe Water Enterprises Market.
14. ibid
15. Safe Water Network (2023). Sustainable Enterprises for water and health financial and operational performance of safe water enterprises in India.
16. Dalberg Advisors (2017).
17. Safe Water Network (2023).
18. IFC (2011). SSAWA Market Brief No. 1: The Market for Small-Scale Piped Water Systems in Kenya
1. Introduction 12
19. Conversion rate from KES to USD = 87 as per the 2011 report.

Using the SWE per capita cost from India as a proxy to the costs to be expected in Kenya, USD 15/person is ten times cheaper than the USD 155/person (USD 603 per household) for a new urban piped connection through the public utilities in Kenya.20 With the additional benefit of offering high drinking water quality, though granted, it would not be accessible to the households at their premises.
Per capita cost of implementing varied decentralized solutions - piped small scale water supply systems vs. Safe Water Enterprise in urban and rural settings in Kenya and India (EED Advisory, 2023)
Figure 2
Type of system Small scale piped supply Small scale piped supply Safe Water Enterprise Water supply system schematic Public Public Water Source Public Public No. of people served 20,000 5,000 3,000 per capita cost USD 50 USD 20 USD 15 Year 2011 2011 2023 Region Kenya Kenya India Characteristics Urban setting Rural setting Urban or rural setting 13 1. Introduction 20. MoWSI (2023). The Kenya National Water and Sanitation Investment and Financing Plan 2022 – 2030. 13
1.3
About the Safe Water Enterprise (SWE) project in Kenya
Cognizant of the water access challenges in rural and underserved communities, Siemens Stiftung and Sky Juice Foundation Inc. together initiated the Safe Water Enterprise (SWE) Project in Kenya in 2012/13. Further, Siemens Stiftung was motivated by the need to proof-concept the decentralized Water kiosk model as a social entrepreneurial business providing safe water to rural communities at an affordable price. Siemens Stiftung implemented the Safe Water Enterprises (SWE) project, locally labeled and known as Maji Safi kiosks, setting up 16 kiosk sites over 7 years to increase access to a steady supply of clean drinking water in underserved rural and peri-urban communities with limited infrastructure. Figure 3 illustrates the SWE project sites across Kenya, highlighting the 6 sites selected for this assessment.
 Figure 3
1. Introduction 14
SWE / Maji Safi kiosk sites – locations and selection
As the project drew to a close, the Siemens Stiftung team handed over the water kiosks to the respective County governments as per the Water Act 2016 to hold the assets in trust for the community. In line with Kenyan laws, communitybased organizations registered as Water User Associations (WUAs) are to be sub-licensed by the respective county to run a Safe Water Enterprise.
In line with this objective, Siemens Stiftung has commissioned this study to assess i) the extent to which the applied community-led social entrepreneurial kiosk model has been achieved, ii) the technical and business performance goals, iii) financial sustainability, (iv) scalability as well as v) the potential social impacts. The study also aims to identify the i) best practices and success factors, ii) challenges, and weaknesses of the model in order to be able to structure further interventions. The results of this study are expected to inform the development of future strategies and activities by Siemens Stiftung in the WASH sector.

1. Introduction 15
Summary of the approach and methodology
A mixed methodology approach was employed in obtaining the needed data for this study.21 Figure 4 presents a summary of the data collection methods and tools used in obtaining the needed data for this assessment. These methods are comprehensively discussed in Annex 3.
• Kiosk management
• Kiosk operators
Sustainability and scalability assessment
Social and health impact analysis
Identifying lessons learnt
Identifying best practices and key success factors
• Key informants
• Kiosk management and operators
• Households
• Households
• Businesses
• Water vendors
• Key informants
• Key informant interviews (KIIs)(n=27)
• KII guides
• Vendors interviews(n=27)
• Households’ interviews(n=512)
• Kiosk management
• Kiosk operators
• Partners
• Siemens Stiftung team
• Business interviews(n=57)
• Kiosk management
• Key informants
• Observations(n=6)
• HHs questionnaire
• Business questionnaire
• Vendors questionnaire
• Observations checklist
1.4
Figure 4
and business performance evaluation Activity Target respondent Data collection method Data collection tool
Summary of data collection methods used in this study
Technical
1. Introduction 16
21. No single method was used to collect the data required.


 2. The Safe Water Enterprise (SWE) kiosks project in Kenya
2.1
Project implementation process (PIP)
2.1.1
Site identification
• Application for project and water test
• Feasibility study
• Site visits and assessment of needs
• Market potential and technical setup
Conventionally, the process of setting up a kiosk to the point where it is financially independent and entirely owned and operated within a community is considered to take two to three years. However, this is not usually the case due to unprecedented challenges attributed to the technical capability of the operators and their financial standing. Figure 5 summarises Siemens Stiftung’s SWE project implementation process.
The process begins with site identification, visits, and conducting a feasibility study to help analyze and understand the situation on the ground. The purpose is to gain an understanding of the true challenges facing the community/ village and a sense of daily water consumption. It is also at this stage where the project team engages the local regional and local government representatives. The other processes continue sequentially up to the point where the kiosk is handed over to the community to run in consultation with the relevant county department as indicated in the figure below.
Operational preparation
• Stakeholder engagement and committee setup
• Project implementation plan
• Financial sustainability plan and
• Management training
Monitoring & coaching
• Coaching until kiosk runs sustainably
• Monitoring and reporting Opening ceremony
Kick-off and trainings
• Technical and management trainings
• Social marketing plan and activities
• Business and financial plan, Record keeping and recording. Running SWE as a social enterprise
Community gathering
Kiosks construction
• Preparation of technical infrastructure
• Public information, community involvement and awareness raising
• Kiosk construction and technical training
Transfer of ownership
• Future development plans
• Handing over ceremony
Project initiation
2. The Safe Water Enterprise (SWE) kiosks project in Kenya 18
Figure 5:
Figure 5
Project implementation process (PIP)
2.1.2
Components of the SWE project
Siemens Stiftung identified and continuously monitored four components of the Safe Water Enterprise (SWE) model, across the project sites. These components are described below:
1. Technology
The kiosk uses a low-key membrane ultrafiltration unit that works without electricity by using gravity and produces up to 10,000 litres of safe drinking water per day without requiring chemical treatment.
The kiosk is standardized, pre-fabricated modular expandable according to the demands; some use Water ATMs.
2. Social entrepreneurial business model
SWE is designed to become financially self-sustainable, which means the revenues from water sales cover running costs (even though margins are low in the water sector) and, ideally, kiosk operations create a surplus that can either help the kiosk business to grow or contribute to building capital in village savings and loans associations (VSLAs).
3. Community participation
Involving the community is crucial for the buy-in of customers and clients. Social marketing strategies including common pricesetting were conducted.
WASH awareness trainings targeting kiosk operators, water and food vendors, science teachers at Primary schools as well as representatives of the local health care system (PHOs22, CHVs23). Therefore, Siemens Stiftung was working with the Kenya Water for Health Organization (KWAHO).
4. Community-led ownership model
Community-based organizations (CBOs) sign a MoU in order to form a Water Committee which collaborates with WSP and/or County Water Department to get registered as Water Users Associations and sub-licensed as small scale water service providers.
As a related alternative model, some kiosks are attached to a health centre or a resource centre where access to safe water is needed.
 Figure 6:
Components of the SWE project
22. Public Health Officers (PHOs)
23. Community Health Volunteers (CHVs), now called Community Health Promoters (CHPs)
Figure 6:
Components of the SWE project
22. Public Health Officers (PHOs)
23. Community Health Volunteers (CHVs), now called Community Health Promoters (CHPs)
19
2. The Safe Water Enterprise (SWE) kiosks project in Kenya
2.1.3
The project had three main target groups which form part of this assessment. These are highlighted in the Figure 7 below:

General
• Underserved communities in rural, informal and peri-urban areas in Kenya
• Decision makers and relevant stakeholders such as Government Officials and local representatives
SWE Kiosk level
• Water Management Committee / Water Users Associations
• Kiosk operator and assistant
• Kiosk customers and clients (Individuals as well as water and food vendors)
Community level
• Multipliers in health sector: Public Health Officers, Community Health Volunteers
• Multipliers in education sector: Head and science teachers in primary schools

2.
The Safe Water Enterprise (SWE) kiosks project in Kenya
Figure 7: Project's target group
20
SWE project stakeholders (beneficiaries and actors)
Setting up Safe Water Enterprise (SWE) project in Kenya
The provision of basic water services to rural and underserved communities is a responsibility of the county governments under current regulations (Water Act, 2016).24 Section 72(1) as read together with section 94(3) requires WASREB to determine and prescribe national standards and make recommendations on how to provide basic water services to marginalized areas.25 These areas are predominantly places where the formal water utilities have limited or no coverage.
To decentralize water services to underserved communities, WASREB envisions three-pronged steps in the identification of delivery options; situational analysis, selection of delivery options, and stakeholder engagement. At the heart of water service delivery to these areas, is the continued partnership with the county government to among others, establish different water service delivery options based on coverage. The consultations are aimed at obtaining information on the technical, financial, commercial, governance, legal, socioeconomic (willingness and ability to pay for water and sanitation services) and environmental assessments, market research, and commercial viability analysis of the targeted small-scale water utilities or an underserved area.

2.2
Situational analysis
Selection of delivery option
Stakeholder engagement
Figure 8: Components of the SWE project
24. Water Act, 2016. Available at: https://wra.go.ke/download/the-water-act-2016/
25. WASREB. (2019). Sanitation Services in Rural and Underserved Areas in Kenya Guideline; Water
2. The Safe Water Enterprise (SWE) kiosks project in Kenya 21
Services for all for Provision of Water and Sanitation.

WASREB recognizes water kiosks as the most common type of water vending in Kenya26 and are either privately owned, utility-owned, or community-owned. Further, consumers obtain water from the kiosks either directly (using their containers) or indirectly through water vendors who ferry the water to their premises, and or houses. Just like the supply system designed under the SWE project indicated in Table 1 below, WASREB describes water kiosks as having three components highlighted below
# Stakeholder Thematic areas
1 Source The source can be a borehole, river, or piped water into the kiosk
2 Storage The water storage is in most cases an elevated tank mounted on top of the water kiosk
3 Distribution Some kiosks vend water directly to customers through a piping system or wait for customers to come and collect at a central point
The multiplicity of the water vending systems including the establishment of water kiosks calls for a new approach to ensure water safety through better regulations. WASREB recognizes that a participatory, multi-stakeholder approach is necessary to ensure that the kiosks operate within the set regulations. While the Water Act of 2016 mandates utilities to provide safe water to consumers, WASREB regulates the interests and rights. According to WASREB, water utilities are at the grassroots of their authority levels and are better suited to regulate water vending rather than view them as competitors who are out to unmask their inability to ensure adequate water coverage. Specifically to water kiosks, Table 2 highlights some of the regulatory provisions.
26. WASREB. (2019a). Guideline on Water Vending.
Table 1:
Components of a water kiosk according to WASREB's guidelines (2019)
2. The Safe Water Enterprise (SWE) kiosks project in Kenya 22
1–42
2:
Regulatory provisions for water kiosks
1 Kiosk ownership
2 The water kiosk structure
The kiosks shall be owned by either the WSPs, private individuals (including landlords), or community organizations
In cases where the land does not belong to the kiosk owner, she/he/they will be required to have approval or consent or a Memorandum of Understanding from the owner of the land on which the kiosk is built.
The kiosk will typically be a concrete/steel structure capable of supporting an overhead tank of a given capacity with a lockable and secure door.
The floor of the water kiosk and the area around the kiosk should be free-draining so that no water can stagnate.
The kiosk and its surroundings must always be kept in a clean and tidy state.
The SWE kiosks are primarily owned by community-based organizations, but some are owned by the institutions from which they are established that are based in the community. For example, Kangemi water kiosks are owned by the Kangemi Resource Centre.
The majority of the SWE kiosk owners own the land on which they are built. Some have acquired the land through credit like Wath Ong’er to have the kiosk set up.
The design of the SWE kiosk complies with this regulation (Made of a steel structure).
All the SWE water kiosks evaluated have free-draining floors and surroundings.
All the SWE kiosks have water operators who ensure the kiosks and their surroundings are kept clean.
3 Water kiosk operators
4 Business hours
5 Kiosk metering and billing
A kiosk operator must be literate (can read and write) and numerate (can understand and use numbers) i.e. a person who has at least received primary school education.
The operating hours of the kiosks will be determined by the WSPs and will be dependent on the number of clients, the amount of water they require, and their water-fetching habits.
Every water kiosk will have a water meter to monitor water consumption and this will form the basis of billing the kiosk operator.
All the SWE kiosks have literate individuals who understand their roles and responsibilities including safe handling of the filtration system.
The SWE kiosks with ATMs operate 24/7 hence customers can obtain water at their convenience. For kiosks with no ATM, the operating hours are at least 8 hours a day.
With the Water ATMs, the SWE kiosks can monitor sales volumes from the sales records. However, with the reported potentially high non-revenue water from two kiosks (Kangemi and Ngoliba), it will be imperative to have meters installed to track supply and consumption. This would be particularly for the school and hospital respectively.
6 Water retail prices /tariffs
The price will be set in such a way that the water users find it affordable while at the same time, it guarantees a good profit for the kiosk operator after settling his bills.
7 Record keeping, and reporting
The kiosk operator will be required to keep a record of his operations at the kiosk.
Some of the things to be recorded will include the opening and closing meter reading, daily cash collections, bill payment dates and receipts, water outages or poor quality of water, and any other incidences that may occur.
For most of the SWE kiosks evaluated, the tariffs are friendly and affordable with the cost of a 20-litre jerrican ranging between KES 5.00-10.00. Consumers are satisfied with the amount they pay for water at the SWE kiosks which they deem as affordable. This cost only changes and becomes expensive when the customers have to rely on water vendors to supply the water at the household level.
All the kiosks have reported positive growth in their revenues which is sufficient to cover their management and operational needs.
Based on the evaluation, while some records are available – the SWE kiosks are not consistent with their record-keeping with some having limited to no records.
All six kiosks have financial records on sales and bills.
8 Kiosk handover
The regulation requires that the county executive committee member for water in the county, and with advice from the water services director, commission the handing over of the small-scale service providers once the situational assessment and viability analysis are completed, and the agreed service delivery option adopted.
While Siemens Stiftung remained cognizant of this regulatory provision, some counties were not willing to take over the SWE kiosks. For example, in Kiambu County, the officers remained reluctant despite the clear provisions mandating the County Executive Committee member in charge of water affairs to handle the handover processes. Moreover, since the kiosks are located within a health facility, it was not clear whether it would still fall under the Ministry of Water or be placed under the Ministry of Health.
Table
# Area/component Regulatory provision by WASBREB
SWE kiosk approach
2. The Safe Water Enterprise (SWE) kiosks project in Kenya 23
2.3
SWE kiosks profiles and the water supply system
The six SWE kiosks under assessment are located within a community set up across the five counties. In Figure 9 below, we highlight the water supply system across all the SWE kiosks indicating the source of water, storage, filtration/purification, and point of distribution. As illustrated below, some of the kiosks (Kangemi and Ngoliba) supply institutions within the kiosk location. The individual kiosk profiles have been discussed in Annex 3
Source Storage (17,000 litres) Purification Wath Ong’er kiosk Source Storage (11,000 litres) Purification Sondu kiosk Source Storage (22,000 litres) Purification Maragua market kiosk Source Storage (20,000 litres) Purification Korumba kiosk Source Storage (17,000 litres) Purification Ngoliba health centre kiosk Source Storage (50,000 litres) Purification Kangemi resource centre + 2. The Safe Water Enterprise (SWE) kiosks project in Kenya 24
Figure 9: The SWE kiosks water supply system. Source: EED Advisory, 2023
As demonstrated in Figure 9, the six SWE kiosks evaluated in this study are equipped with different water supply set-ups and operate in different contexts including community, social, and business environments hence serving different clients. The SWE kiosks were implemented in partnership with different community partners and have varying governance, and or management structures. Most of the water kiosks are owned and governed by Community-Based Organizations (CBOs) comprising member committees. In Wath Ong’er, the kiosk is governed by a Water User Association (WUA) that was registered in 2022 under the name Lower Nyatike Water Users Association. Similarly, in Kisumu, Korumba recently registered as a Water Users Association. Table 3 below provides more information about the year of establishment, location of the kiosks, surrounding population, sources of water and energy, and storage capacity. Three out of the six water kiosks, including Ngoliba, Wath Ong’er, and Maragua Market, are equipped with a water ATM system hence providing a water supply for 24 hours. The rest of the kiosks range between 8-12 hours of water supply depending on the season.
Site location Kiosk Kangemi Resource Centre Ngoliba Health Centre Maragua Market Korumba Sondu Wath Ong’er Location Kangemi informal settlement, Nairobi County Kiambu County Murang’a County Kisumu County Kisumu County Migori County Characteristics Population of the surrounding community 11,472 households 4,812 households 3,344 households 1,777 households 2,846 households 1,828 households Year of establishment 2014 2014 2014 2015 2017 2019 Source of water Nairobi Water and Sewerage Company and a private borehole Thika river Murang’a Water and Sewerage Company (MUWASCO) Borehole River Sondu River Kuja Source of energy Electricity and solar Electricity Electricity Electricity Electricity Solar Storage capacity (Litres) 50,000 17,000 22,000 20,000 11,000 17,000 Management governance NGO (Kangemi resource centre) Public Institution (Ngoliba health centre) CBO (registration as WUA underway) WUA (Korumba) CBO (registration as WUA underway) WUA (Lower Nyatike Water)
Table 3:
2. The Safe Water Enterprise (SWE) kiosks project in Kenya 25
Summary information on the SWE kiosks evaluated


 3. Technical performance of the SWE kiosks
3.1
Overview and context
This chapter presents the demographic characteristics and an objective technical assessment of six SWE kiosks from the five counties (Nairobi, Kiambu, Muranga, Kisumu, and Migori) to establish their technical viability. The initial sections provide a contextual overview of each kiosk location and the technical information of each water kiosk. The assessment culminates in the scoring and ranking of the water kiosks. The findings are based on the methods and indicators described in Section 1.4 and Annex 3

3. Technical performance of the SWE kiosks 27
Socioeconomic and demographic analysis: Who is using the safe water from the kiosks?

Across all six kiosks under the study, both Maji Safi (households that obtain water from the kiosks) and non-Maji Safi (households that do not obtain water from the kiosks) households are headed by males. Figure 10 highlights the gender distribution of the household heads for Maji Safi users.
3.2
3. Technical performance of the SWE kiosks
Male Female 68 32 Kangemi 64 36 Korumba 67 33 Maragua YES % Households 64 26 Ngoliba 70 30 Sondu 67 33 Wath
28
Figure 10: Gender of household head (Maji Safi users)
Ong'er
Globally, women and girls aged 15 and above are mainly responsible for water collection in 7 out of 10 households that do not have water supplies within their premises.

In Korumba, Maragua, and Sondu, there is a higher number of Maji Safi households headed by females compared to non-Maji Safi users in the same regions. However, in the remaining three kiosk regions, there is a higher percentage of female-headed households using non-Maji Safi compared to the Maji Safi users.
Globally, women and girls aged 15 and above are mainly responsible for water collection in 7 out of 10 households that do not have water supplies within their premises.27 As such, they are more likely to be in charge of selecting the water source for use by the household.28 In another study, it was highlighted that male-headed households are less likely to choose an improved source compared to female-headed households.29 However, from this data, we observe that there is no direct relationship between a higher percentage of households being led by females and the use of Maji Safi. Figure 11 highlights the gender distribution of the household heads for non-Maji Safi Users.
27. UNICEF and WHO (2023). Progress on household drinking water, sanitation and hygiene 2000-2022: Special focus on gender https://data. unicef.org/resources/jmpreport-2023/
28. ibid
3. Technical performance of the SWE kiosks
Figure 11: Gender of household head in non-Maji Safi households
77 60 63 37 23 40 Male
Kangemi 66 34 Korumba Maragua NO % Households Ngoliba 74 26 Sondu 56 44 Wath Ong'er
29. Morakinyo O.M. et. Al (2015). Wealth status and sex differential of household head: implication for source of drinking water in Nigeria.
Female
29
Maji Safi users have a higher percentage of household heads with post-primary education compared to non-Maji Safi users - Kangemi (90.0%), Wath Ong’er (60.0%), and Maragua (78.8%). On the other hand, in Ngoliba, Sondu, and Korumba, there is a higher percentage of non-Maji Safi household heads with post-primary education.
Maji Safi users
A study was conducted in Cameroon to establish the determinants of access, use, and sustainability of improved water sources by households. From the results, the likelihood of households using improved water sources has a positive association with the education level, and wealth, among others.30 A separate study in Bomet, Kenya corroborates these findings, the author aimed to determine the effects of socioeconomic factors on access to improved water sources and sanitation. From their findings, the occupation and education level of the head of the household strongly impact the choice of water source used within the household.31 However, as seen in this research, the household head’s level of education does not correspond with the increased use of Maji Safi.
Figure 12:
3. Technical performance of the SWE kiosks Kangemi Korumba Maragua Ngoliba Sondu Wath Ong'er Masters/PHD Post Sec. Certificate/ Diploma Primary Secondary 49% 40% 46% 29% 21% 31% 31% 69% 2% 48% 38% 30% 9% 1% 5% 12% 12% 14% 8% 25% 22% 21% 18% 19% % of households
Education level of household head in Maji Safi households
30
30. Tankoua L.B. (2021). Determinants of access, use and sustainability of improved water sources by households in Cameroon
31. ibid
Figure 13:
In Kangemi (77.0%), Ngoliba (44.0%), Wath Ong’er (48.0%), and Sondu (37.5%) majority of Maji Safi users earn an average income of between KES 10,000 – 30,000. In Maragua (33.3%) and Korumba (61.5%) majority of Maji Safi users earn an income below KES 10,000. Although the choice to use Maji Safi water, is not only associated with higher incomes, it is worth noting that the median price of a 20-litre Maji Safi jerrican within these regions is either the same or slightly lower than that of nonMaji Safi. It’s only in Maragua where the price of Maji Safi is slightly higher than that of non-Maji Safi. Therefore, the income levels would not determine a household's decision to either use or not use water from the Maji Safi kiosk.
Head of household income ranges (no represents non-Maji Safi users and yes represents Maji Safi users)
3. Technical performance of the SWE kiosks Masters/PHD Post Sec. Certificate/ Diploma Primary Secondary % of households Maji Safi users Kangemi Korumba Maragua Ngoliba Sondu Wath Ong'er 10% 53% 25% 9% 22% 27% 10% 20% 57% 43% 20% 20% 20% 42% 47% 17% 2% 27% 40% 44% 7% 13% 12% 25%
Education level of household head in non-Maji Safi households
Figure 14:
<=10,000 10,001-30,000 30,001-50,000 50,001-70,000 70,001-100,000 More than 100,000 4% 4% 22% 69% 16% 77% 5% 33% 30% 20% 10% 7% 26% 26% 9% 13% 9% 17% 62% 4% 8% 27% 13% 13% 27% 47% 6% 6% 22% 22% 44% 7% 4% 14% 39% 36% 13% 13% 38% 34% 8% 44% 48% 58% 40% 32% 40% 8% 4% 4% 12% Kangemi Korumba Maragua Ngoliba Sondu Wath Ong’er No No No No No No Yes Yes Yes Yes Yes Yes % of households 31 3% 2% 2%
3.3
Water sources and use
To understand the impact of the project on the community, the study targeted both consumers who obtain water from the kiosks and those who do not. Figure 15 below provides a breakdown of the Maji Safi and non-Maji Safi users interviewed across each kiosk site.
The Maji Safi kiosk water is used for drinking, followed by cooking and household cleaning. The least common activities include livestock and crop farming (Table 4). About 3.1% of users in Kangemi use the Maji Safi water for crop farming; this is reportedly for kitchen gardening as Kangemi is an informal settlement. Out of the six kiosks, Korumba has the highest percentage of households (58.3%) using Maji Safi for all their needs. Ngoliba and Maragua have the lowest percentage of households using Maji Safi for all their household needs because they use this water for drinking purposes only. The excessive cost of transportation, river water being available for free, and the presence of a large tank for water harvesting are the other reasons why households in Maragua and Ngoliba report lower usage of Maji Safi for all their household needs.
 Figure 15:
3. Technical performance of the SWE kiosks No. of surveys (r) Maji Safi Non-Maji Safi Kangemi 51 65 Korumba 32 36 Sondu 35 37 Wath Ong’er 67 62 Maragua 30 33 Ngoliba 30 33 32
Distribution of Maji Safi and non-Maji Safi users across the study respondents
Ranking order The consumers ranked the purposes for which Maji Safi is used in order of priority with drinking as the highest1 and crop farming as the lowest6
The alternative sources of water for non-Maji Safi users include hand-pumpoperated wells/boreholes, open wells, public water supply systems, rainwater harvesting, river/stream, solar/diesel-pump-operated boreholes, and water vendors. The majority of non-Maji Safi users in Kangemi (92.0%), Maragua (60.0%), and Sondu (57.0%) get their water from a public water supply system. Ngoliba stands out from the other kiosks with 47% of users sourcing water from water vendors fetching water from the Thika river. Non-Maji Safi users in Wath Ong’er (84.0%) source their water from the river/stream, followed by Sondu (29.0%), and Ngoliba (23.0%). Rainwater harvesting serves as the main source of water for households in Korumba (66.0%) whereas none of the interviewed households in Kangemi and Maragua use harvested rainwater.
Figure 16:
Hand-pump operated well/borehole
Open well
Other
Public water supply system
Rainwater harvesting (tanks)
River/stream
Solar + diesel borehole
Water vendor
3. Technical performance of the SWE kiosks
Table 4:
Kiosk % of households using Maji Safi for all household needs
uses of Maji Safi within the household (multiple choice answer as a percentage of the proportion of the population using Maji Safi) Drinking1 Household cleaning2 Cooking3 Bathing4 Livestock5 Crop farming6 Kangemi 49.2% 93.8% 87.5% 84.4% 81.3% 9.4% 3.1% Korumba 58.3% 100.0% 90.5% 100.0% 100.0% 9.5% 4.8% Maragua 24.2% 100.0% 50.0% 100.0% 62.5% -Ngoliba 14.7% 100.0% 100.0% 100.0% 100.0% 60.0%Sondu 29.8% 100.0% 18.2% 90.9% 36.4% 27.3%Wath Ong’er 49.2% 100.0% 4.0% 44.0% 16.0% - -
Household uses of Maji Safi
Different
Household uses of Maji Safi
% of households
Korumba 6% 6% 3% 3% 16% Sondu 6% 57% 9% 29% Maragua 20% 20% 60% Ngoliba 27% 23% 47% 3% Grand Total 8% 5% 1% 37% 14% 29% 6% Kangemi 6% 2% 92% 66% Wath Ong’er 8% 3% 3% 2% 84% 33

For the non-Maji Safi users, the three top considerations for the selection of their main water sources include cost, distance, and reliability. When selecting their source, households in Wath Ong’er (52.0%), Kangemi (37.0%), and Korumba (22.0%) consider cost as a key factor. Households in Ngoliba (70.0%), Korumba (34.0%), and Maragua (33.0%) place emphasis on reliability when choosing their main water source. Distance to the water point features as a critical consideration for households in Kangemi (55.0%), Sondu (54.0%), and Korumba (25.0%). It is interesting to note that only 2% of Wath Ong’er, 3% of Korumba, and 6% of Kangemi/Sondu households pay attention to water quality when selecting their main source. This is presumably because the households either trust their water vendors or assume the quality is an intangible element. However, the households pay attention to the smell, colour, and taste of the water they consume.
Figure 17:
3. Technical performance of the SWE kiosks % of households
Kangemi Korumba Maragua Ngoliba Sondu Wath Ong’er 3% 52% 54% 13% 13% 17% 16% 37% 55% 22% 25% 33% 34% 17% 13% 13% 70% 26% 21% 23% 2% 2% 3% 6% 6% 6% 3% 3% 3% 3% 3% 3% 34
Reasons for selection of water source among non-Maji Safi households
It is the only source available Cost Distance Reliability Water quality Security Other
3.4
Water access
3.4.1
Distance to the water point and time spent queuing

For this study, accessibility encompasses distance to the water point, time spent to get to the water point and fetch water, and the quantity of water that households can fetch.
Among Maji Safi users, households in Ngoliba cover the longest distance to get to the water point at an average of 8.3km. Consequently, they spend almost one hour to and from the water point, which is the longest duration among all Maji Safi users. Further, the households spend an average of 37.6 minutes at the water point to fetch water, which is almost 9 times longer than users in Kangemi. The extent of this situation is reflected in their satisfaction assessment where 61.77% and 55.58% are dissatisfied with the distance and the duration of queuing at the water point, respectively.
Ngoliba households were furthest to the water kiosk while Kangemi households spent the least amount of time to reach the water point, at 3.0 minutes. In addition, users in Kangemi spend the least amount of time waiting to fill a 20-litre jerrican and this corresponds with their satisfaction with the pressure of water which stands at 96.9%. About 62.2% of Maji Safi users in Sondu are dissatisfied with the considerable amount of time spent queuing to fetch water at almost half an hour.
Among non-Maji Safi users, most households are located at an average distance below 1km, except Ngoliba where the average is 3.9km. Generally, Ngoliba can be regarded as having a challenge with access to water sources across both study groups. This can be attributed to the fact that Athi River, which could have been a potential water source in this community, is highly contaminated and cannot be used for safe water consumption. As a result, there are limited water sources in the area, among them the Thika river.
3. Technical performance of the SWE kiosks 35
Average distance to the water point (km)
Average time taken to water point-one way (minutes)
Average time spent queuing to fetch water at the water point (minutes)
Time spent waiting to fill a 20-litre jerrican
Average distance to the water point (km)
Average time taken to water point-one way (minutes)
Average time spent queuing to fetch water at the water point (minutes)
Time spent waiting to fill a 20-litre jerrican
Figure 18:
3. Technical performance of the SWE kiosks
to
Distance to water point and time
to access water at non-Maji
water points 36 Time (Minutes) Name of Kiosk Name of Kiosk 8 6 10 12 14 16 18 20 4 2 0 Distance (km) 0 1 2 3 4 5 6 7 8 9 Kangemi Korumba Sondu
Maragua
Time (Minutes) 60 50 40 30 20 10 0 Distance (km) 3.5 4 4.5 3 2.5 2 1.5 1 0.5 0 Kangemi
Comparison of distance to water point and collection time among Maji Safi and non-Maji Safi users
Distance
water point and time spent to access water at non-Maji Safi water points
spent
Safi
Wath Ong’er
Ngoliba
Korumba Sondu Wath Ong’er Maragua Ngoliba
19 illustrates the time spent by both Maji Safi and Non-Maji Safi users to get to the kiosk and fetch water. Residents in Ngoliba spend the highest amount of time at the kiosks while Kangemi spends the lowest. These residents live furthest from the kiosk as indicated in Figure 18. It takes much more time to fill a 20-litre jerrican in Wath Ong’er and Ngoliba than the rest of the kiosks due to pressure differences. The findings indicated in the figure below are based on the median values and not average values which did not reflect the actual time estimates.
 Figure
 19: Time spent collecting water among Maji Safi households (minutes)
Figure
Figure 19: Time spent collecting water among Maji Safi households (minutes)
Time
one way (minutes) Time
water at the water point (minutes) Time
to fill a 20-litre jerrican (minutes) Maragua 2 3 10 Ngoliba 3 17.5 15 Wath Ong’er 4 10 15 Sondu 10 2 30 Korumba 2 10 5 Kangemi 2 1 1 37
3. Technical performance of the SWE kiosks
taken to water point-
spent queuing to fetch
spent waiting
The WHO/UNICEF Joint Monitoring Programme for Water Supply, Sanitation, and Hygiene (JMP service ladder is used to compare drinking water service levels across regions. The main parameters considered when assessing service levels include access, affordability, availability, and quality of the main source of water used by households for drinking, cooking, and other domestic uses such as personal hygiene and cleaning. Figure 20 below summarizes these service-level classifications.
Safely managed Drinking water from an improved source that is:
• Accessible on premises
• Available when needed
• Free from faecal and priority chemical contamination
Basic Drinking water from an improved source,provided collection time is more than 30 minutes for a roundtrip including queuing
Limited Drinking water from an unprotected dug well or unprotected spring
Unimproved Drinking water from an improved source for which ollection time exceeds 30 minutes for a roundtrip including queuing
Surface water
Drinking water directly from a river, dam, lake, pond, stream, canal or irrigation canal
According to the JMP ladder, improved sources of water refer to those that have the potential to deliver safe water by nature of their design and construction including piped water, boreholes or tube wells, protected dug wells, protected springs, rainwater, and packaged or delivered water. For this study, we classify the Maji Safi water under basic or limited source because although it should be free from fecal and priority chemical contamination, it is not accessible on premises by households and in some instances, it is not always available when needed. From here we classify the various kiosks under basic or limited service levels as demonstrated in the table below. Only the Kangemi, Korumba, and Maragua kiosks can be considered to provide a basic level of service as the total average collection time is not more than 30 minutes.
Kiosk Average collection time in minutes (roundtrip including queuing) JMP classification32,33 Kangemi 5 Basic access Korumba 25 Basic access Maragua 23 Basic access Ngoliba 50 Limited access Sondu 38 Limited access Wath Ong’er 40 Limited access
Figure 20:
JMP water service levels ladder
3. Technical performance of the SWE kiosks
38
Table 5:
Classification of Maji Safi service level as per the JMP ladder
32. Basic access - Drinking water from an improved source, provided collection time is not more than 30 minutes for a round trip, including queuing
33. Limited Access - Drinking water from an improved source, for which collection time exceeds 30 minutes for a round trip, including queuing
Quantity of water
Although scheduled maintenance is only undertaken periodically, unexpected breakdowns result in long downtimes, and due to the limited supply available, the amount of water available for purchase is restricted.
In Kangemi, none of the households experienced any restrictions and 100.0% of the households are generally satisfied with the amount of water they receive. Similarly, none of the households in Korumba reported any case of restriction with a satisfaction rate of 97.2%. The rest of the kiosks also experienced some restrictions: Sondu (13.5%), Maragua (12.1%), and Ngoliba (5.9%). The situation is different in Wath Ong’er where 31.34% of Maji Safi users interviewed have experienced restrictions as a result of malfunctioning equipment (water pump) (61.90%), higher customer demand (42.86%), low water volumes (19.05%), extended drought (4.76%).
This is despite the Wath Ong’er Maji Safi kiosk recording the highest water volumes sold (2019-2022) compared to the others and sourcing their water from a river, which offers a consistent supply. Based on the operator at Wath Ong’er, water vendors are often prioritized whenever there are any issues in the water supply, leaving some household users dissatisfied. In addition, during the maintenance of equipment, the kiosk shuts off the intake from the river and fills up the storage tank for purchase by buyers. Although scheduled maintenance is only undertaken periodically, unexpected breakdowns result in long downtimes34, and due to the limited supply available, the amount of water available for purchase is restricted.
About 29.9% of Wath Ong’er users reported that the system has broken down over the past 3 months and took an average of 3.6 days to restore services. The months reported to have the most frequent breakdowns include August and September. This offers some insight into the high restriction rate reported in the study. Overall, despite these restrictions, most of the users in Wath Ong’er are satisfied with the amount of water received, with only 10.5% expressing dissatisfaction. The figure below summarizes the satisfaction rate across the Maji Safi users in the six kiosks.
3.4.2
3. Technical performance of the SWE kiosks
34. In Sondu and Wath Ong’er, the operators reported that some times it could take 2-3 days to fix a pump especially when they do not have money for the repairs.
39

Figure 21:
3. Technical performance of the SWE kiosks Kangemi Korumba Maragua Ngoliba Sondu Wath Ong’er Rate of satisfaction Very unsatisfied Very satisfied Unsatisfied Indifferent Satisfied 27% 57% 5% 10% 9% 75% 10% 6% 62% 12% 12% 12% 3% 55% 36% 3% 6% 61% 36% 2% 51% 49% 0% 20% 40% 60% 80% 100% -20% 40
Maji Safi households satisfaction with amount of water received
Affordability
Households in Kangemi reportedly incur the highest average price per 20-litre jerrican at KES 15.9, followed by Ngoliba at KES 12.5 at the household level. Despite the high price in Kangemi, 64.6% of Maji Safi households are satisfied with the price. The kiosk operator at Kangemi reported that they have tried to address the price concerns with no success. This is because the kiosk mostly relies on sales from water vendors who can afford to purchase at the prevailing rate compared to households. On the other hand, 29.4% of respondents in Ngoliba expressed dissatisfaction with the price of Maji Safi water. This could be attributed to the fact that Kangemi is in an informal settlement within an urban region where the cost of living is higher compared to Ngoliba which is in a rural area.
3.4.3
3. Technical performance of the SWE kiosks 41 15.9 8 5 5.8 10 8.8 8.3 12.5 17 6.3 6.7 Maji Safi Non Maji Safi Maji Safi Non Maji Safi Maji Safi Non Maji Safi Maji Safi Non Maji Safi Maji Safi Non Maji Safi Maji Safi Non Maji Safi 11.7
Figure 22: Average price per 20-litre jerrican at household level
Price (KES)
Kangemi Korumba
Maragua Ngoliba Sondu Wath Ong’er
Across the six sites, the average price of non-Maji Safi water per 20-litre jerrican is lower than that of Maji Safi, except for Korumba, Sondu, and Wath Ong’er. The main sources of water for non-Maji Safi users where the price is lower than Maji Safi include Kangemi - public water supply system (96.1%); Maragua - public water supply system (73.3%); Ngoliba - rainwater harvesting (63.3%). In addition, the price of Maji Safi water sold by vendors is higher than at the water kiosk due to the incorporation of additional expenses such as transportation, cleaning of jerricans, and compensation for the vendor. Sondu is the only location where the price of water sold by the vendors is lower than at the kiosk. The majority of the water vendors are reported to be obtaining the water from the river at no cost which they then sell at a friendly price to the households.
Figure 23:
Price (KES) Kangemi Korumba Maragua Ngoliba Sondu Wath Ong’er 15.9 5 10 12.5 19 16 25 19.1 20 6.5 -1.3 10 6 35 6.3 5 16.7 6.7 Average price per 20-litre jerrican at the water point Average price per 20-litre jerrican when using a water vendor Difference 3. Technical performance of the SWE kiosks
Comparison of average price of Maji Safi at the water point vs water vendor
42 Maji Safi Non Maji Safi Maji Safi Non Maji Safi Maji Safi Non Maji Safi Maji Safi Non Maji Safi Maji Safi Non Maji Safi Maji Safi Non Maji Safi
The average price of water per 20-litre jerrican across the Maji Safi and non-Maji Safi households is highlighted in Table 6. For Kangemi, the average cost of a 20-litre jerrican constitutes water obtained by the households either directly from the Maji Safi kiosks or through the water vendors. As indicated in the table below, and cognizant that the households may obtain water either directly or through the water vendors, the median price is the true reflection of the cost of water at the kiosks.
Kangemi Korumba Maragua Ngoliba Sondu Wath Ong’er
35. The average prices at household level do not reflect the cost of a 20-litre jerrican at the kiosks as consumers obtain water either directly from the kiosks or through vendors. The median prices reflects the exact price at the point of collection is most kiosks.
36. As reported by consumers who do not obtain water from the Maji Safi kiosks
Table 6:
Kiosk Average price per 20-litre jerrican at the Water point (KES) - Maji Safi Median price per 20-litre jerrican at the water point (KES) - Maji Safi Average price per 20-litre jerrican at the water point (KES)non-Maji Safi36 Median price per 20-litre jerrican at the water point (KES) non-Maji Safi Kangemi 15.9 5.0 8.0 5.0 Korumba 5.0 5.0 5.8 5.0 Maragua 10.0 10.0 8.8 7.5 Ngoliba 12.5 10.0 15.6 15.0 Sondu 6.3 5.0 17.0 5.0 Wath Ong’er 6.7 5.0 11.7 10.0
Household average price of water per 20-litre jerrican35
Figure 24:
Satisfaction with the price of water among Maji Safi households
Very unsatisfied Very satisfied Unsatisfied Indifferent Satisfied 32% 79% 10% 54% 12% 58% 28% 32% 72% 39% 53% 32% 16% 9% 9% 29% 10% 6% 3% 3% 1% 9% 3. Technical performance of the SWE kiosks 43
Figure 24 highlights the satisfaction rate for Maji Safi users on the price of water per 20-litre jerrican.
0% 20% 40% 60% 80% 100% -20%
By considering the water burden, which is the ratio of water cost to household income37, we measure the affordability of Maji Safi water across the six locations. The water burden across households is determined by assessing the parameters outlined in Table 7. While users in Korumba are generally satisfied with the price of water, they have the highest water burden as their incomes reportedly cannot cover all their needs.
The water burden is calculated as follows:
=
To estimate the water burden, we consider the average monthly household income range where most respondents in that area fall. For example, 77% of Maji Safi users in Kangemi earn between KES 10,000 and 30,000. The midpoint of this range is assumed as the average to establish an indicator of the water burden. Although this method does not account for other income bands, it provides a glimpse of the burden based on most respondents.

# Parameter Data sources Relevance 1 Expenditure on water Household surveys These variables comprise the inputs to the formula calculating the household water burden 2 Household income 3 Affordability threshold United Nations This is the threshold level above which water levels are categorized as unaffordable.
Table 7: Determining the water burden across households
Water burden (%) 100
* Monthly expenditure on
Monthly household income
=
water
3. Technical performance of the SWE kiosks 44
37. Read, J., Attal, N., Betanzo, E., Harrison, R., Stoltenberg, A. (2022). Water Service Affordability in Michigan: A Statewide Assessment. University of Michigan Water Center, Graham Sustainability Institute
The UN recommends that water costs should not exceed 3 – 5% of household income.38 Therefore, in this study, the households were categorized as follows indicated in Table 8
Determining the water burden across the Maji Safi users
Based on these assumptions, the water burden increases when the amount spent on water per month is high, yet the income remains unchanged. The high water burden in Korumba could be attributed to the fact that the respondents recorded the highest percentage of users with an average monthly income of below KES 10,000 (62.0%). As such, this may impact their ability to purchase water from the Maji Safi kiosk. It is worth noting that respondents are often reluctant to disclose information on household incomes. Consequently, this poses a limitation on the accuracy of the water burden estimation, in case the respondents understated or overstated their income levels. The high monthly expenditure on water in Ngoliba can be attributed to the transportation costs incurred by the residents to obtain water from the kiosk which is located far from their households.

Table 8:
Kiosk Household source of water Average monthly expenditure on water (KES) Average household income Water burden (%) Kangemi Maji Safi 452.6 20,000 2.3% Korumba Maji Safi 701.7 5,000 14.0% Maragua Maji Safi 796.2 20,000 3.9% Ngoliba Maji Safi 1673.7 20,000 8.4% Sondu Maji Safi 610.8 20,000 3.1% Wath Ong’er Maji Safi 555.1 20,000 2.8% Rank Criteria Affordable Slightly unaffordable Unaffordable Range 0 – 3% 3 – 5% ≥5%
affordability: a missing element of monitoring of sustainable development
(SDG)
6.1 and 6.2. 3. Technical performance of the SWE kiosks 45
38. World Health Organization. (2021). The measurement and monitoring of water supply, sanitation and hygiene (WASH)
goal
targets
3.5
Water quality
Water quality tests were conducted to analyze the chemical and microbiological parameters based on samples from the Maji Safi kiosks.

The records of water quality testing were reviewed to assess the frequency at which the kiosks carry out water testing and the associated results. We also compare the results available for 2017 and 2023 to identify any trends in water quality and establish if there has been an improvement or a decline. The latest available test results are from Korumba, Sondu, Maragua, and Wath Ong’er (2023), and Kangemi (2022). The latest available water quality test records for Ngoliba are from 2017.
Water quality tests were conducted to analyze the chemical and microbiological parameters based on samples from the Maji Safi kiosks. From the test results, we establish that before the water undergoes filtration using the SkyHydrant Technology installed in the kiosks, there is the presence of either coliforms or e-coli bacteria or both. In the case of Kangemi, Maragua, and Sondu where the presence of coliforms was detected in the filtered water, the cause was linked to poor cleaning of the filters and water storage tanks. As such, recommendations were provided on the regular cleaning of the tanks and filters using chlorine.
Kiosk Does the kiosk carry out regular water testing? (Y/N)
If yes, how often?
9:
Table
Water quality testing frequency for Maji Safi kiosks
When was the last test
Does the kiosk have a record of the water quality report (Y/N) Water quality test results available for which year? Kangemi Yes, twice a year 2022 Yes 2022, 2021, 2017 Ngoliba Yes, every two months 2017 Yes 2017 Maragua Yes, annually 2023 Yes 2023, 2017 Korumba Yes, every few months 2023 Yes 2023, 2017 Sondu Yes, annually 2023 Yes 2023, 2017 Wath Ong’er Yes 2023 Yes 2023, 201739
done?
3. Technical performance of the SWE kiosks 46
39. Year when the pre-test for water was done at Wath Ong’er.
The colour of the water
The
To determine how the water quality within the kiosks compares to the national and global standards, we compare the results against the Kenya Bureau of Standards (KEBS) water quality standards and those of the World Health Organization (WHO).
Figure 25:
Water quality satisfaction rate for Maji Safi users
taste of
the water
The smell of the water Very unsatisfied Very satisfied Unsatisfied Indifferent Satisfied Very unsatisfied Very satisfied Unsatisfied Indifferent Satisfied Very unsatisfied Very satisfied Unsatisfied Indifferent Satisfied Kangemi Kangemi Korumba Maragua Rate of Satisfaction Rate of Satisfaction Rate of Satisfaction Ngoliba Sondu Wath Ong’er Wath Ong’er 50% 49% 66% 22% 55% 33% 58% 65% 10% 12% 8% 5% 6% 6% 6% 15% 19% 7% 5% 44% Kangemi 53% 6% 1% 39% 45% 25% Korumba 68% 4% 1% 25% 3% 5% 2% 4% 2% 3% 75% Maragua 29% 1% 70% Maragua 20% 4% 7% 70% Korumba 44% 6% 13% 31% 6% Wath Ong’er 45% 3% 12% 34% 5% 31% Ngoliba 55% 8% 6% 2% 30% Ngoliba 43% 20% 20% 7% 10% 47% Sondu 47% 6% 3% 43% Sondu 54% 6% 3% 14% 23% 9% 6%
2% 3. Technical performance of the SWE kiosks 47
The relevant parameters and associated standards are summarized in Table 10 below.
3. Technical performance of the SWE kiosks
10:
Table
Parameters KEBS (KS- 1:2007 standards) WHO standards Kangemi Ngoliba Maragua Korumba Sondu Wath Ong’er Date of last test (23/06/ 2017) (25/10/ 2021) (25/10/ 2022) (30/08/ 2017) (07/06/ 2017) (04/09/ 2023) (12/06/ 201 7) (05/08/ 23) (13/06/ 17) (16/10/ 2022) (28/10/ 2023) (28/08/ 2017 40 ) (09/08/ 2023) pH 6.5 –8.5 6.5 –8.5 7.2 7.1 7.2-7.6 7.8 7.6 7.5 6.92 8.1 8.27.67 7.34 Color Max 15 Max 15-7.5 04.01239Turbidity Max 5 Max 5-3.5 0.8 1.48 0.7 1.16162 1.23 ConductivityMax 25006660 363 352 89.3 1103115.4 152.1 Iron Max 0.3 Max 0.30.1-0.1 0.01 0.1 0.012.7 0.03 Total hardness Max 300 Max 500 23-7d 16 23-14d 4-7d 26 3.3 20.7 5.0 1.4814.0 52.0 Calcium hardnessMax 500--0 12.4 1.4 1.267.992 36.0 Total alkalinityMax 5001224 139 139 48.2 5742.2 77.8 Chloride Max 250 Max 250 0 8.0 0 0 1.0-0.823.0Fluoride Max 1.5 Max 1.50.10.2 0.2 0.07 1.6 0.010.449 0.16 Nitrate Max 10 Max 10 0 1.9 10-25 10 1.3 0.20.1 0.420Total suspended solids------Dissolved oxygen------Total dissolved solids Max 1000 Max 15004137 240 232 59.157.7 100 Total coliforms 0 00-42.0- 130.9 3 65.7-15006 Escherichia Coli 0 0 1130 133 2230 3.0-3.100
Maji Safi water quality performance against KEBS and WHO standards
Key Acceptable levels Unacceptable levels
40. Year when the pre-test for water
Ong’er 48
was done at Wath
Comparing the water quality test results for each kiosk, we deduce that the Maji Safi water quality is acceptable across most of the parameters. However, the presence of coliforms and e-coli in the samples tested renders the water unsafe for human consumption unless treated appropriately. Additionally, the latest test from Wath Ong’er in 2023 indicates the presence of coliforms in the water sample, rendering it unfit for consumption. Discussions with the Siemens Stiftung team indicate that the coliforms are likely from the storage devices rather than a failure of the technology. The standard practice for the team on the ground is to carry out a cleaning of tanks after the results are out, unfortunately, they do not do follow-up tests to check the quality. The main limitation here is the cost of the water quality tests. In Korumba, although there is a decline in the total coliforms found in the water sample (2017 versus 2023), there is still a significant presence, rendering it unsafe. On the other hand, there was a significant improvement in Sondu from 2017 to 2023 where the presence of coliforms and e-coli was reduced to 0, which is the acceptable standard for safe human consumption. However, the presence of fluoride in the Sondu water sample is slightly above the cut-off for acceptable fluoride levels.

3. Technical performance of the SWE kiosks 49
3.6 Water supply and demand
Table 11 below summarizes the main and alternative sources of water for each kiosk, how often they receive water from the source, the types of customers served, and number of customers served daily.
Table 11:
Kiosk Water source How often the kiosk receives water from the source Types of customers served by the kiosk
Kangemi Main – Nairobi water Alternativeborehole Nairobi water three times a week but borehole water is consistently available
Maragua Murang’a South Water and Sanitation Company (MUWASCO) -
Ngoliba Thika river During periods of low demand, they pump water from the river once a week and thrice when there is high demand
Sondu River Pump water daily during the dry season and once a week in the wet season
Korumba Borehole Obtain their water daily
Wath Ong’er River Kuja Pump water daily
• Water vendors
• Households
• Water vendors
• Households
• Market vendors
• Restaurants
• Schools
• Water vendors
• Households
• Households
Approximate number of customers served by the kiosk daily
50 per day but most are water vendors who have many containers and come several times a day. In the dry season around 100 people
200 per day in the dry season and 100 in the wet season
50-100 customers daily depending on the season
Approximately 100 customers daily in the dry season and 15 during the wet season
• Households Approximately 200 customers daily
• Households
• Hotels
• Restaurants
• Water vendors
Approximately 200 customers daily
 Water supplied by Maji Safi kiosks across the six sites
3. Technical performance of the SWE kiosks 50
In Kangemi, they used to harvest rainwater but stopped due to rusting of the iron sheets which would have an impact on the quality of the water. Some of the vendors purchase up to 30 20-litre jerricans of water and visit the kiosk more than once a day. In Maragua, the kiosk sells water to market vendors, water vendors, restaurants, and some schools. The peak hours for customers fetching water from the kiosk are morning, noon, and evening hours. The average volume of water sold per day is 3,000-4,000 litres.
The operating hours for the Sondu kiosk also shift depending on the season to facilitate customer demand. In the wet season, they operate for 8 hours, and 15 hours in the dry season. The peak hours of operation include early morning and midafternoon. The Korumba kiosk serves customers for 12.5 hours daily with the peak hours in the early morning and late evening. The ATM system in the Wath Ong’er and Ngoliba kiosks allows customers with tokens to access the kiosk 24 hours a day, but those who do not have one have to wait for the operator. On the consumer demand side, the figure below summarizes the average quantities used per household per day and compares that of Maji Safi and Non-Maji Safi users.
Figure 26:
Average quantity of water consumed per household per day
Kangemi Korumba Maragua Ngoliba Sondu Wath Ong’er
Average quantity of water used per household per (litres) Maji Safi
Quantity (litres) 47.9 44.7 84.6 107.3 75.4 65.3 78.7 81.2 68.5 67.6 102 116.3 3. Technical performance of the SWE kiosks 51
Average quantity of water used per household per (litres) non-Maji Safi
3.7 Non-revenue water
The three main components of non-revenue water are physical (real) losses due to leakages from parts of the system, commercial (apparent) losses caused by illegal connections, and unbilled authorized consumption such as water used by the utility for operational purposes and free provision to certain customer groups.

The Kenya Water Services Regulatory Board (WASREB) considers non-revenue water as a significant indicator for measuring the operational efficiency of water service providers (WSPs). Nonrevenue water refers to the difference between the volume of water produced and put into the distribution systems and the actual volume billed to the consumers. The three main components of non-revenue water are physical (real) losses due to leakages from parts of the system, commercial (apparent) losses caused by illegal connections, and unbilled authorized consumption such as water used by the utility for operational purposes and free provision to certain customer groups.41
To establish the kiosk non-revenue water, which encompasses the percentage amount of water not billed against the total amount of water produced for sale42, we employed the formula below. Available data from the sales and volume of water across each kiosk was utilized for this assessment.
100 = * (Expected Sales based on Litres Sold - Actual Sales)
Expected Sales based on Litres Sold
NRW for Kangemi kiosk was not computed due to data gaps on the volume of water sold and lack of record keeping to differentiate the sales from borehole (KES 5 per 20-litre jerrican) and Nairobi Water (KES 30 per 20-litre jerrican). Across the five kiosks, Korumba has a negative NRW percentage from 2019 to 2021, with the figure increasing to 2% in 2022. The study attributes this to the available records that although, Ngoliba experienced the highest NRW in 2019 at 34%, it has progressively reduced NRW over the years. The case is similar for Maragua which has seen a consistent reduction in NRW. On the other hand, the NRW performance in Sondu stands out with a range of between 15% - 24% across the 4 years under review.
41. WASREB
Causes of Non-Revenue Water https://wasreb. go.ke/causes-of-non-revenue-water/#:~:text=WASREB%E2%80%99s%20 acceptable%20level%20is%20 20%25.%20Non-Revenue%20 Water%20is,both%20commercial%20%28apparent%29%20 losses%20and%20physical%20%28real%29%20losses.
42. WASREB https://wasreb. go.ke/causes-of-non-revenue-water/#:~:text=WASREB%E2%80%99s%20 acceptable%20level%20is%20 20%25.%20Non-Revenue%20 Water%20is,both%20commercial%20%28apparent%29%20 losses%20and%20physical%20%28real%29%20losses.
Water (%)
Non Revenue
(2020).
52
3. Technical performance of the SWE kiosks
Two of the kiosks, Kangemi and Ngoliba, are located within a resource center and health center respectively. Clean and filtered water from the Maji Safi kiosks is provided for use within these premises at no cost and the records for the volume of water consumed are not tracked. This presents a gap in the overall analysis of the NRW for these kiosks. This volume of water is NRW as it could otherwise have been sold to earn revenues for the kiosk.
WASREB provides benchmarks for NRW levels as follows: under 20% - good; 20-25%acceptable; over 25% - not acceptable. The sector benchmark of NRW performance by Kenyan WSPs is thus regarded as 20%. Although Maji Safi kiosks do not fall under the umbrella of water utilities regulated by WASREB, it provides a basis for comparing the performance of the water kiosks on this parameter. On this basis, when considering the average NRW percentage across the 4 years, all kiosks fall within the acceptable range of 20%, with Ngoliba falling right on the threshold at 20% as it provides water to the health facility at no cost.
Figure 27
Maji Safi kiosks non-revenue water (%)
2019 2020 Percentage (%) 2021 2022 -15 -3 -3 -5 2 24 18 9 9 34 15 15 15 7 8 15 24 17 18 14
3. Technical performance of the SWE kiosks 53
Korumba Maragua Ngoliba Sondu Wath Ong’er
3.8
Reliability water service provision in Kenya
This assessment employs three main parameters to determine the reliability of the water kiosk. These include hours of supply, reported frequency of breakdowns in the past three months, and response time taken to restore the system in case of a breakdown. The satisfaction of water users is also highlighted to bring out their perspective on the kiosk operations. These elements are summarized in Table 12
Wath Ong’er, Maragua, and Ngoliba have water ATM systems that enable token holders to access water 24 hours a day. However, those without access to these tokens are limited to accessing the kiosk during normal operating hours. As such, the average operating hours recorded for these kiosks are inclusive of these respondents. Maragua (30.3%) and Wath Ong’er (29.9%) had the highest percentage of respondents reporting a breakdown of the water kiosk system in the past three months. Sondu users reported the highest average response time for the restoration of the kiosk system in case of a breakdown at 15 days. This could be attributed to the fact that they do not have any internal maintenance personnel and upon the breakdown of the pump, it has to be transported to Kisumu for repairs. In cases where they do not have sufficient funds to pay for the transport and repairs, the downtime is prolonged.
3. Technical performance of the SWE kiosks Hours of supply
time
Frequency of breakdowns (past 3 months)
Figure 28: Parameters for assessing reliability
Response
to restore the system
54
The figure below provides an overview of the consumer's satisfaction with the response time taken by the respective kiosks to restore the system in case of a breakdown. Ngoliba has the highest dissatisfaction rate at 33%, followed by Sondu (22%) and then Wath Ong’er (13%). These three kiosks have the highest recorded average response times to restore the system in case of a breakdown. As such, the dissatisfaction rate corresponds with these records. Kangemi (92.0%), Maragua (72.0%) and Korumba (67.0%) kiosk users are generally satisfied with the time taken.
Maji Safi kiosk Average kiosk operating hours % of respondents who reported a system breakdown in the past 3 months Months reported to have frequent breakdowns (Top 3) Average time taken to restore the system in case of a breakdown (Days) Kangemi 11.6 0 None 0 Maragua 10.3 30.3 Jan, May, Aug 2.4 Ngoliba 10.7 11.8 Oct 5.5 Sondu 10.7 24.3 Mar, Apr, Jun 15 Korumba 11.3 16.7 May, Jun, Sep 2 Wath Ong’er 12.4 29.9 Mar, Aug, Sep 3.6
Figure 29:
3. Technical performance of the SWE kiosks 3% 3% 3% 8% 10% 19% 18% 24% 45% 67% 66% 34% 27% 26% 15% 32% -32% 26% 38% 58% 35% 3% 3% 5% Kangemi Korumba Maragua Ngoliba Sondu Wath Ong’er Rate of satisfaction 55
Satisfaction of Maji Safi users with time taken to restore water in case of interruptions
response time Very unsatisfied Very satisfied Unsatisfied Indifferent Satisfied
Table
12: Kiosk operating hours, frequency of breakdowns, and average
3.9
Operation and maintenance
3.9.1
Kiosk infrastructure
3.9.2
General maintenance and repairs
3.9.3
Cleanliness
The water kiosk's physical components should be able to withstand natural and human-induced stresses, including wear and tear, extreme weather events, and changing water quality. Data obtained from the observation checklists indicates that the kiosk infrastructure appears well maintained across all water kiosks. Findings show that all storage systems are functional in all six kiosks, and filtration systems are well maintained. In addition, all water tanks are fully covered. The findings also show that across all kiosks, the water storage systems are finished off correctly to prevent any form of run-off from getting into the system across all six kiosks.
On maintenance and repairs, all kiosks appear well maintained. Maintenance records are available for all six kiosks. KII data revealed that all kiosks apart from the Kangemi, spend a portion of their finances on maintenance and repairs. In Kangemi, the kiosk owner stated, “Siemens Stiftung repairs and maintains the water kiosk. We, however, had a breakdown on the borehole and had to use KSH 85,000/= from the kiosk for the repairs. Davis & Shirtliff did the repairs” {KII- kiosk owner}. Well-maintained infrastructure ensures these kiosks' continuous and efficient functioning, preventing breakdowns and disruptions in water supply. It also guarantees the long-term availability of safe and clean drinking water for communities in need.
Water kiosks' cleanliness directly impacts public health and consumer well-being. Clean water kiosks ensure that the dispensed water remains safe for consumption, free from contaminants, and devoid of harmful pathogens Maintaining cleanliness at these kiosks safeguards against waterborne diseases and fosters trust among the community members who rely on them for their daily water needs. Data obtained through the observation checklists shows that the kiosk environment is cleaned daily across all water kiosks and the filtration system is also cleaned daily apart from one kiosk (Kangemi). Storage tanks are cleaned across all water kiosks but with differing frequencies and the pipes used to serve the customers are also adequately cleaned. The interior and exterior of the water kiosks were properly maintained, owing to the daily cleaning taking place in the various water kiosks.
3. Technical performance of the SWE kiosks
56
Suggestions to improve the operation of Maji Safi kiosks
It is evident that the establishment of another Maji Safi kiosk in each location, excluding Kangemi, is a top priority among the Maji Safi respondents. This finding is consistent with the satisfaction assessment undertaken where many Maji Safi users, especially in Ngoliba, were dissatisfied with the distance and time taken to reach the kiosk. The other two priority areas for Maji Safi users are the addition of more taps and increased storage capacity. In Kangemi, where only 10.8% think establishing another kiosk would be beneficial, most of the respondents prioritize the addition of more taps (50.8%) and increased storage capacity (32.3%). The least concerns across the six Maji Safi kiosk users are the addition of a filtration unit, the use of solar PV to power the pumps, and the addition of a more efficient pump.
3.10
Figure 30:
3. Technical performance of the SWE kiosks 50.8 33.3 50 56.8 58.3 91.2 37.3 32.3 12.1 20.6 18.9 30.6 34.33 4.6 3 2.9 2.7 13.9 11.9 3.1 9.1 50 10.8 5.6 22.4 10.8 66.7 62.2 55.6 18.5 5.9 19.4 1.49 7.7 6.1 20.6 10.8 5.6 14.9 82.1 Respondents (%) Addition of taps Increase storage capacity Addition of filtration unit Improving water pressure Establish another kiosk Use of solar PV to power the pumps Addition of a more efficient pump
Suggestions from Maji Safi users to improve Maji Safi operations
57
Kangemi Korumba Sondu Wath Ong’er Maragua Ngoliba
3.11
Technical performance of the SWE kiosks
To assess the overall technical viability of each water kiosk, we developed a scoring system as shown in Table 13. Indicators such as the water filtration unit maintenance frequency, water quality, water kiosk reliability, presence of alternative water sources, hours of supply, accessibility of the kiosk, and non-revenue water (%) are assessed. Points are allocated to each indicator based on a weighting criterion derived from the priorities of the Maji Safi users. The indicators with higher weighting include water quality, reliability, and accessibility. The individual performance of the water kiosk is ranked as highly, moderately, and not technically viable. Data from the observation checklists, household, business, and water vendor surveys, and key informant interviews with the water operator and kiosk management were used in evaluating the six kiosks.
Table 13:
Indicator Score Performance Points allocated Frequency of maintenance of water filtration unit Daily Good 2 Weekly Moderate 1 Monthly Poor 0 Water quality - Good 4 - Moderate 2 - Poor 0 Reliability of water source Highly reliable Highly reliable 4 Reliable Reliable 2 Unreliable Unreliable 0 Alternative water source Alternative source Yes 2 Alternative source No 1 Hours of supply >12 hours Good 2 7-12 hours Moderate 1 <7 hours Poor 0 Accessibility of the source <30 minutes for a round trip to collect water Good 4 =30 minutes for a round trip to collect water Moderate 2 >30 minutes for a round trip to collect water Poor 1 Non-revenue water (%) Below 20% Good 2 20% Moderate 1 Above 20% Poor 0 Total maximum points - 20 High technical viability: scores 14-20 Total medium score - 13 Moderate technical viability: scores 7-13 Total minimum score - 6 Low technical viability: scores 1-6 3. Technical performance of the SWE kiosks 58
Scoring criteria to determine the technical viability of the water kiosks
In Table 14 below, we highlight the technical performance of the six kiosks under assessment.
Table 14:

Kiosk Frequency of maintenance Water quality Reliability Alternative water sources Hours of supply Accessibility Nonrevenue water (%) Overall rating Kangemi 2 4 3 2 2 3 2 17 Maragua 2 4 3 1 1 1 2 14 Wath Ong’er 2 3 3 1 3 1 2 15 Korumba 2 3 3 1 1 1 2 13 Ngoliba 2 3 3 1 2 1 1 13 Sondu 2 3 3 1 2 1 2 14 3. Technical performance of the SWE kiosks 59
Technical viability rating for the Maji Safi kiosks

From these ratings, all kiosks fall within the moderate to high technical viability range. All the kiosks are ranked as highly viable except Korumba and Ngoliba which fall under the moderate category. Although recent water quality reports are not available for Maragua, Ngoliba, and Sondu, we establish their performance based on the customer satisfaction assessment undertaken as part of the survey. Some of the considerations that Maji Safi kiosks can consider to improve their technical performance include:
Establishing alternative methods to enhance the dependability of their water supply. This could involve exploring options like establishing additional water sources, such as a borehole, or obtaining water from the local water utility.
Initiating measures to tame non-revenue water that results in reduced revenues for water that they otherwise would have sold to consumers.
To enhance their performance on the water quality parameter, kiosks should carry out regular water testing and keep a record of these reports
Improving the time taken to restore water services in case of a breakdown is also a key consideration for improved performance. The water users' satisfaction with the reliability of the water kiosk operations significantly impacts its technical viability.
In cases of dissatisfaction with water quality among consumers, the kiosks should consider establishing their transportation value chain to guarantee the use of clean jerricans and safe handling of the resource during transit to the consumers. This would also contribute to controlled transportation costs that reduce the burden incurred by consumers, for whom transport being expensive is a consideration when selecting whether to use Maji Safi for all their needs.
3. Technical performance of the SWE kiosks 60
By adopting these measures, water kiosks can contribute to making clean, safe water more accessible and affordable, thereby lessening the water burden on the community.
Kiosk Establishing additional kiosk(s)
Kangemi
Maragua
Wath Ong’er
Korumba
Ngoliba
Sondu
Addressing causes of NRW Regular water testing and record keeping of results
Improving time taken to restore water services
Establishment of transportation value chain
 Table 15:
Kiosk-specific interventions to improve their technical viability
Table 15:
Kiosk-specific interventions to improve their technical viability
3. Technical performance of the SWE kiosks 61


 4. Financial performance of the water kiosk
4.1
Overview and context
The SWE model provides a potential market opportunity to serve 3.86 billion unserved and underserved persons globally.
The Safe Water Enterprises (SWE) use market approaches to deliver high-quality water treated at the point of consumption. Often, these solutions offer the full range of services across the value chain – from extraction, treatment, and payment collection.40 In the context of middle- and lowincome countries, these enterprises are referred to as Water ATMs which provide affordable safe drinking water.41 The SWE model provides a potential market opportunity to serve 3.86 billion unserved and underserved persons globally.
In this chapter, we discuss and highlight the financial performance of the six water kiosks under evaluation. To achieve this, we assess their revenues, costs, net financial benefits, customer growth, water demand, and some nonfinancial factors to determine their viability. The assessment is based on the methods described in Annex 3 and the financial records provided.

40 ibid 41 Safe Water Network (2023). Sustainable Enterprises for water and health financial and operational performance of safe water enterprises in India. 4. Financial performance of the water kiosk 63
4.2
SWE project actors implementation cost
The key implementing entities identified in the set-up of the kiosks can be categorized into three as outlined below:
i) Asset developers (financing the infrastructure through capital investments training, managing entities, and carrying out WASH Hygiene Training),
ii) The network operators (operating and maintaining the systems through revenue collection and servicing the infrastructure – entities managing the systems CBO, Healthcare centre, and NGO), and,
iii) The regulator (acting to ensure that rules and guidelines for water service provision are adhered to)
In Annex 2, we present a summary list of kiosks established by Siemens Stiftung in Kenya. A breakdown of the total project investment costs is indicated in Table 16 below.

No Activity Total (EUR) 1 Kiosk construction 52,800 2 Monitoring software 1,200 3 Piping/pumps, containers, water tests, chlorine solution 15,336 4 Total 69,336
Table 16:
4. Financial performance of the water kiosk 64
Breakdown of total budgetary costs for SWE implementation across East Africa
4.3 Revenue analysis
4.3.1
Historical revenue trends
The financial sustainability of SWEs is critical to unlock the potential of offering safe water at scale, especially in lowincome areas.
As of 2022, at least three kiosks - Kangemi, Wath Ong’er, and Maragua had sales volumes of above KES 500,000 while Ngoliba, Sondu, and Korumba sales volumes ranged between KES 150,000 – KES 300,000 (Figure 31).
Kangemi 2019 273 2020 157 2021 545 2022 676 2019 16% 29% 42% 2020 2021 2022 +28% Wath Ong’er 2019 273 2020 615 2021 557 2022 552 2019 -9% -1% 42% 10% 2020 2021 2022 +9% Maragua 2019 295 2020 365 2021 488 2022 510 +20% 2019 24% 34% 5% 20% 2020 2021 2022
Figure 31:
4. Financial performance of the water kiosk Compound annual growth rate (revenue) CAGR > 5+ CAGR > 1-5% CAGR < 0% Amount in KES Thousands Annual revenue growth rate (%) Ngoliba 2019 261 2020 280 2021 242 2022 286 +3% 2019 -13% 18% 7% 0% 2020 2021 2022 Sondu 2019 113 2020 143 2021 176 2022 172 +15% 2019 -3% 26% 24% 2020 2021 2022 Korumba 2019 201 2020 140 2021 187 2022 176 -4% 2019 -30% -6% 33% 2020 2021 2022 65
Revenue trends: yearly revenues, annual growth rate, and the compounded annual growth rate of the SWE kiosks
Over three years, most of the SWEs indicated revenue growth, regardless of the setting. Kangemi and Maragua SWEs had a year-on-year increase in their revenue streams with a compounded annual growth rate of 28% and 20%. Wath Ong’er, Ngoliba, and Sondu had a CAGR of 9%, 3%, and 15%, respectively - with fluctuations in their year-on-year revenue, all notably higher than the industry CAGR indicated by the water utilities (2.9%). With a CAGR of - 4%, Korumba SWE struggled to grow its revenues between 2019 and 2022. Moreover, Wath Ong’er has consistently been able to pay for the loan borrowed to install the water ATM and the land upon which the kiosk is constructed from the revenues collected.
The most consequential driver of revenue growth is a market approach that targets distinct customer groups. Kangemi SWE kiosk, which doubled its revenue stream between the years of 2019 and 2022 has a differentiated pricing mechanism for customer groups. In 2020, when the kiosk started separately tracking sales to vendors and households, the revenue share split was 30% to 70%, respectively. By the end of 2022, the revenue from water vendor sales had increased to account for 67% compared to 33% from households (Figure 32). By offering safe water refills, the kiosk leverages drinking water demand from the middle class through the water vendors. The latter group purchases the same unit of water at a higher price. Therefore, the increase in sales is correlated to the pricing of the water rather than an absolute increase in the volumes of water sold as shown in the figure below.
Figure 32:
4. Financial performance of the water kiosk Household sales Water vendors Pricing mechanism Type of source Type of water vessel Consumer pricing Borehole Utility 20-litres jerrican 18.9 Litres KES 10 mostly households Revenue share per consumer type (%) KES 30 mostly vendors KES 5 Households and pushcart vendors 2019 2020 2021 2022 100% 70% 33% 33% 67% 67% 30% 66
Revenue trends: Yearly revenues, annual growth rate, and the compounded annual growth rate of the SWE kiosks
For kiosks of a similar production capacity and base charge fee, non-revenue water reduces the revenue potential of the SWEs. Sondu, Korumba, and Wath Ong’er SWEs charge a fee of KES 5 per 20-litre jerrican while Maragua and Ngoliba charge KES 10 per 20-litre jerrican. Maragua and Ngoliba SWE cumulative production capacity ranges from 2,269,000 litres to 2,608,000 litres respectively (Figure 33). However, the revenue from water sales is about KES 1,451,000 (Maragua) compared to KES 1,038,000 (Ngoliba). Conversations with the operators at Ngoliba indicate that part of the non-revenue water (20%) supplements the hospital water supply and is used for cooking. The same phenomenon is observed for Korumba and Sondu, with the former indicating higher revenue (0% non-revenue water) compared to Sondu (19% non-revenue). The cause of the latter is unclear but could be attributed to the absence of an automated system (Water ATM) that would enable the tracking of sales and volume sold.
4. Financial performance of the water kiosk
Litres 6,984 3,500 2,000 4,000 6,000 8,000 10,000 12,000 3,000 2,500 2,000 1,500 1,000 500 0 Litres 9,863 Litres 2,269 Litres 2,608 Litres 2,594 Litres 2,940 Revenue 2,994 Revenue 2,138 Revenue 1,451 Revenue 1,038 Revenue 682 Revenue 596
Figure 33: Comparing the cumulative revenue and cumulative volumes of water sold from kiosks with a similar production capacity and base charge. Non-revenue water is observed to affect the revenue potential of Ngoliba and Sondu
Kangemi Korumba Sondu
Wath Ong’er
Revenue KES 000’ Volume of water Litres 000’ 67
Maragua Ngoliba
Where a differentiated pricing mechanism is not employed, both reducing non-revenue water and the right alternative source of revenue will critically grow revenues. This assertion arises from reviewing the revenue growth drivers for Maragua, Sondu, and Korumba SWE kiosks including the number of customers, reliability of kiosks, number of operating hours, and kiosks efficiency. Maragua SWE sequentially reduced non-revenue water from 24% (2019) to 9% (2022). Complementing the kiosk’s water sales revenue is a public restroom and the selling of jerricans. Revenues from the latter doubled from 8% in 2019 to 16% in 2022. Although Sondu SWE also has a public restroom, the impact of the sales from that activity is less pronounced indicating that the location of the restroom is key. Conversations with the kiosk operator reveal that the public restroom has challenges that include vandalization and breakdowns. Maragua’s SWE is in the middle of the town center next to a designated marketplace and a public transportation stage. In the case of Korumba – nonrevenue water is low, the decline in revenue is directly driven by a drop in the revenues from the alternative source of revenue (Figure 34).
4. Financial performance of the water kiosk
Figure 34:
2019 2020 2021 2022 Revenue 000’ KES Nonrevenue water (%) 650 550 450 350 150 250 50 24% Maragua 9% 9% 18% 2019 2020 2021 2022 Revenue 000’ KES Nonrevenue water (%) 250 200 150 100 50 0 2% Korumba -3% -5% -15% Revenue 000’ KES Nonrevenue water (%) 2019 2020 2021 2022 250 200 150 100 50 0 17% 18% 24% 15% Sondu Non-revenue water (%) Non-revenue water Actual sales Other sales 68
Driving revenue growth through increasing sales revenue from alternative sources and decreasing non-revenue water. A comparison of Korumba, Maragua, and Sondu SWE kiosks.
Cost analysis
The SWE costs were noted to increase in four of the six kiosks. Kangemi, Wath Ong’er, and Ngoliba had a CAGR of +35%, + 31.4%, and 25% respectively. Maragua and Sondu SWEs managed to keep the cost increases to a minimum at a CAGR of +1.44% and -6.87%, respectively despite increasing the volumes of water sold. Kangemi SWE experienced a sharp increase in costs from Y2020 to Y2021 (250% increase). The monthly data provided does not provide the breakdown per expense item. However, discussions with the kiosk operators indicate that due to the unreliable supply of bulk water, the kiosk purchases water through Nairobi Water’s Water Trucks (10,000 liters/ KES 6,000). Where the supply is stable, the SWE usually supplements bulk water through the purchase a weekly purchase of 10,000 liters. When the supply is low, the frequency increases to 3 – 5 purchases/week which is a considerable expense to keep up with the demand from their users.
4.4
4. Financial performance of the water kiosk 69
Figure 35:
Kangemi Korumba Sondu
CAGR CAGR < 0% CAGR > 0% 2019 273 2020 157 2021 545 2022 676 2019 129 2020 189 2021 356 2022 291 2019 159 2020 138 2021 138 2022 166 2019 94 2020 104 2021 120 2022 184 2019 87 2020 106 2021 88 2022 70 2019 96 96 2020 96 2021 96 2022 Cost KES thousands Annual cost increase (%) Annual cost increase +35% +31.4% +1.44% +25% -6.87% -0.03% 0% 100% -100% -50% 150% 50% 250% 200% 2019 2020 2021 2022 2019 2020 2021 2022 2019 2020 2021 2022 2019 2020 2021 2022 2019 2020 2021 2022 2019 2020 2021 2022
Wath Ong’er Maragua Ngoliba
Cost trends: Yearly Costs,
Figure 35:
Annual Growth Rate, and the Compounded Annual Growth Rate of the SWE Kiosks.
Except for Kangemi, the kiosks, and the main expense classes are homogeneous and primarily related to the operations across the SWEs. The breakdown of the expenses incurred by all or some of the kiosks is indicated below45 Wages and electricity bills account for the larger expense share across the kiosks. In addition to these, Wath Ong’er is in the process of repaying a loan for infrastructural developments through revenue sales. They took on debt for capital infrastructure and have successfully completed the repayments for the KES 500,000. The payment of the land upon which the kiosk is built is nearly complete with KES 20,000 remaining as of December 2023.
 Figure 36:
4. Financial performance of the water kiosk 45 The kiosks did not have records of all the costs incurred hence the disparity in Figure 35.
The approximate costs incurred per month based on the KII responses from the operators
Amount (KES)
Wages Electricity costs Sourcing of water Transportation Repairs and maintenance
Kangemi
6,000 7,500 12,000 1,750 4,250 2,000 8,400 10,000 4,500 1,000 2,500 5,000 15,000 3,500 2,000 70
Sondu Wath Ong’er Maragua Ngoliba Korumba
To eliminate the need for external financing for operational costs, the kiosks will need to set their tariffs on cost-based pricing, i.e., a pricing strategy that will allow the kiosks to cover their expenses for their production capacity. This study reviews the cost of unit production (cost in KES/litre) against the revenue of unit production to ascertain the adequacy of the tariffs adopted (Figure 37). Maragua, Wath Ong’er, Sondu, and Ngoliba SWEs have consistently kept their cost of production lower than the revenue. Comparing SWEs with the same base charge, Maragua SWE margins of revenue to cost are more than 2x over the four years while Ngoliba SWE margins are slowly eroding as the cost of production continues to increase. The margins are slightly lower than 2x. Wath Ong’er and Sondu SWE margins are also 2x more. Korumba’s margins have fluctuated from year to year. The margin of revenue to cost per unit of production was less than 1 for 2021. Implying that the volumes of water produced in that year were low, while the costs remained the same. The same phenomenon was observed for Kangemi, where the cost of production was high in 2021 due to a drop in the volume of litres sold.
4. Financial performance of the water kiosk
Figure 37:
Unit cost of production (KES)
per unit production
per unit production
Korumba Kangemi Korumba Sondu Wath Ong’er Maragua Ngoliba 2019 2020 2021 2022 0.13 0.07 0.71 0.41 0.14 0.19 1.36 0.13 0.12 0.16 0.22 0.22 0.17 0.15 0.18 0.17 0.01 0.11 0.08 0.08 0.07 0.11 0.12 0.28 71
Comparison of cost and revenue per unit production (KES/litre)
Revenue
for Maragua and Ngoliba Revenue
for Sondu, Wath Ong’er and
Although the tariffs seem to provide adequate cost coverage, Kangemi and Korumba’s fluctuations highlight the need to develop elaborate cost-effective coping strategies for when production is low. These may include introducing additional water storage to ensure a base supply that can allow sufficient revenue collection to cover the usual times of the water supply system. For longer times – lower production than normal, the kiosks will need to be aware of where they can easily reduce their costs.
It is important to note that to be fully independent of external financing, the SWE tariffs will need to be set based on full-cost recovery for providing the service including the operating costs, capital costs, and administrative/regulatory costs46.

4. Financial performance of the water kiosk
72
46. WASREB (2019). Tariff Guidelines. https://wasreb. go.ke/downloads/Tariff%20 guidelines.pdf
Cost benefit analysis
Regardless of the setting, cumulatively each of the kiosks posted a positive net cash balance as indicated in Figure 38
4. Financial performance of the water kiosk
4.5
Figure 38:
KES 000’ Litres 000’
Comparison of revenue, expenses, and net balance across the SWE models.
Kangemi Korumba Sondu
Revenue 2,994 Revenue 1,069 Revenue 704 Revenue 603 Revenue 1,638 Revenue 2,157 Litres Expenses Surplus Revenue Litres 6,894 Litres 2,608 Litres 2,594 Litres 2,940 Litres 2,269 Litres 9,863 1,651 502 384 352 601 965 Surplus 1,342 Surplus 1,342 Surplus 320 Surplus 252 Surplus 1,057 Surplus 1,192 73
Wath Ong’er Maragua Ngoliba
Figure 39:
Cash surplus (KES)
Year-on-year cash surplus per kiosk
Kangemi Korumba
2019 2020 2021 2022 243,476 445,196 228,835 424,893 104,955 44,410 90,644 79,720 167,073 175,605 122,270 101,875 135,415 227,315 350,175 344,125 25,753 36,680 87,965 101,420 303,905 426,005 201,143 260,894
Sondu Wath Ong’er Maragua Ngoliba


 5. Sustainability and scalability of the kiosks
5.1 Overview and context
Sustainable water kiosks must generate enough revenue to cover their operational costs, maintenance, and potential expansion.

The sustainability of a water kiosk is crucial in informing its ability to scale. For example, sustainable water kiosks must generate enough revenue to cover their operational costs, maintenance, and potential expansion. A well-designed revenue model ensures that the kiosk can sustain itself without relying solely on external funding. To scale, a kiosk needs to demonstrate its ability to become financially self-sufficient or attract investors and donors interested in supporting its growth. Sustainability and scalability are not dichotomous variables. To be able to scale, the kiosk must reflect its ability to be sustainable.
The sustainability assessment of the six kiosks involved evaluating their ability to meet current needs without compromising the ability of future generations to meet their own needs. In defining the sustainability of the water kiosks, distinct dimensions have been considered: social sustainability, financial sustainability, and technical sustainability.
5. Sustainability and scalability of the kiosks
Figure 40: Dimensions of sustainability
SUSTAINABILITY Financial Technical Social
75
5.2
Sustainability of the SWE kiosks
5.2.1
Social sustainability
# Factor/indicator Description
1 Operational management and ownership
Social sustainability in the context of this study refers to the ability of the water kiosk's operations and services to meet the present and future needs of the community it serves while promoting social well-being, equity, and resilience. Several factors could negatively or positively affect the social sustainability of the kiosk. This includes the operational management and ownership structures, customer perception, and enterprise development (business establishments e.g. water vending) as a resultant impact of the water kiosk.
All water kiosks, apart from the Ngoliba and Kangemi kiosks, are owned and run by community-based organizations (CBOs).
Social sustainability impacts/findings
• There are some considerable benefits to decentralized systems being owned and run by CBOs, however, there are also proportionate demerits.
• In a key informant interview carried out with members of the CBO in Maragua, it was reported that the former chairperson was responsible for embezzling funds from the kiosk.
2 Local employment and economic benefits
3 Customer perception
Socially sustainable water kiosks may create job opportunities and business growth within the community, contributing to local economic development; this can enhance the social fabric of the area and improve livelihoods.
Customer perception plays a crucial role in the success of businesses in today’s competitive market.
• Data obtained from the survey carried out with water vendors indicated that 70.37% of water vendors highlight that the Maji Safi kiosk has helped them in growing their businesses, compared to 28.63% who indicated that the kiosks have not had any influence in them scaling their businesses.
• In addition, 38% of water vendors attributed their profits to the water kiosks.
• Purchasing decisions are influenced by multiple factors, including social, cultural, personal, and psychological aspects. Affordability was one of the variables used to gauge consumer perception towards the water kiosks.
• Maji Safi kiosk consumers were very satisfied and satisfied with the price of water charged at the kiosk. Across all kiosks, 53.40 % of consumers were satisfied with the price of water charged.
Table 17:
Social sustainability findings
5. Sustainability and scalability of the kiosks 76
5.2.2
Financial sustainability of the SWE kiosks
5.2.3
Technical
sustainability of the SWE kiosks
To ensure the kiosks are financially sustainable, their revenues must be adequate to meet their current operational expenditures as well as a reserve for emergency expenses. Moreover, by design, as a social enterprise, it is envisioned that the kiosks would have alternative revenue sources from running social enterprises. From the findings, the kiosks either have an alternative revenue source in the form of a restroom accessible by the community at a fee or planning to set up a business venture as an alternative.
In the Maragua market kiosk, there is already a restroom accessible at a fee, and Wath Ong’er currently offers phonecharging services and has also ventured into poultry farming and the establishment of tree nurseries. Based on the findings highlighted in Figure 49, each of the kiosks posted a positive net cash balance indicating that they are financially sustainable.
In the context of this study, we define technical sustainability as the long-term ability of the kiosk's infrastructure and operational systems to provide clean and safe drinking water and ensure continued functionality effectively and efficiently. Factors used to assess the technical sustainability of the water kiosks include kiosk infrastructure maintenance, general maintenance and repairs, and cleanliness.
Based on the test results provided and observation. 48 Accessibility encompasses distance to the water point, time spent to get to the water point and fetch water, and the quantity of water that households can fetch.
47
Table 18 below indicates the parameters used in determining the technical and environmental sustainability of the kiosks.
Table 18:
Kiosk Frequency of maintenance Water quality47 Reliability of water source Alternative water sources Hours of supply Accessibility48 Non-revenue water (%) Overall rating Kangemi 1 4 2 2 2 3 2 16 Maragua 2 4 2 1 1 1 2 13 Wath Ong’er 2 2 3 1 2 1 2 13 Korumba 2 2 2 1 1 1 2 11 Ngoliba 1 3 3 1 2 1 1 12 Sondu 2 3 2 1 2 1 2 13 Total maximum points - 20 Highly environmentally and technically sustainable water kiosks: scores 14-20 Total medium score - 13 Moderately environmentally and technically sustainable water kiosk: scores 7-13 Total minimum score - 6 Not Environmental and technical sustainable water kiosk: scores 1-6 5. Sustainability and scalability of the kiosks 77
Technical and environmental sustainability rating for each water kiosk

From this analysis, all the water kiosks are technically and environmentally sustainable with only Korumba and Ngoliba ranked as moderately sustainable and the rest of the kiosks highly sustainable. Although recent water quality reports were not provided for Maragua, Ngoliba, and Sondu, we establish their performance based on the customer satisfaction assessment undertaken as part of the survey. The moderately sustainable kiosks should consider alternative methods to enhance the dependability of their water supply. This could involve exploring options such as establishing additional water sources, like a borehole, or obtaining water from the local water utility.
Table 19 highlights some of the possible suggestions for addressing accessibility challenges, especially for rural kiosks.
19:
Suggestion
Location change
Queue management
Increase in dispensing/ collection points
Prepayment options
Extended operating hours
Implementation strategy
When looking to expand the kiosk operations, the kiosk could choose strategic locations for water kiosks that are easily accessible to the target customer base. Consider proximity to residential areas, schools, markets, and public transportation hubs.
The kiosks could implement an organized queuing system, such as designated waiting areas or queue numbers, to prevent long lines and minimize waiting times, and with time, the kiosk could look to integrate digital software that could inform customers of wait times.
The kiosks could increase the number of water-dispensing points (taps or machines) to serve more customers simultaneously and ensure staff are in multiple stations during peak hours to reduce wait times.
The kiosks could seek to offer prepayment options, such as smart cards to reduce transaction times and streamline the payment process.
The kiosks should consider extending the operating hours of the water kiosk, especially during peak demand times, to spread out the customer flow and reduce congestion.
5. Sustainability and scalability of the kiosks MF
Table
78
Suggested improvements in addressing accessibility challenges
5.2.4
Sustainability potential of the SWE kiosks
49 Cherunya, P.
Decentralized Solutions. Water 2015, Vol. 7, Pages 54375457, 7(10), 5437–5457.
https://doi.org/10.3390/ W7105437
Figure 41 presents the sustainability potential of the six kiosks assessed. The sustainability levels of all water kiosks are ranked in Table 18. From the figure below, we can establish that all the kiosks are presently sustainable based on the three dimensions but will require a few or minor adjustments to ensure long-term sustainability. These adjustments range from increasing hours of supply to improving accessibility and improving the reliability of the water source. It will be important to assess the potential of the kiosks to maintain consistency two to three years after the handover.
Since the kiosks are mostly community-managed (decentralized management), the social sustainability aspect scores high with customers always looking forward to the clean water from the kiosks.49 The only dimension that will require adjustment is the financial aspect; the collection and handling of revenues derived from the kiosks would determine for how long the kiosks can remain active and consistent in their operations. Moreover, with climate variability, water production is affected, hence the kiosks will have to establish coping mechanisms to be able to produce enough water that meets the customers' demand and maintain consistent revenue flows. Consequently, the kiosks may consider a partnership with the county governments and get capital subsidies or operational finance support as a sustainability option.50
Kangemi
Maragua
Ngoliba
Korumba
Sondu
Wath Ong’er
Sustainability and
of the
79
5.
scalability
kiosks
Figure 41: Sustainability ranking of each water kiosk
5. Sustainability and scalability of the kiosks
C., Janezic, C., & Leuchner, M. (2015). Sustainable Supply of Safe Drinking Water for Underserved Households in Kenya: Investigating the Viability of
50 Bhatnagar, N., Lampert, S., Goyal, V., Mehta, R., Rai, R., & Chandrasekhar, A. (2017). The Untapped Potential of Decentralized Solutions to Provide Safe, Sustainable Drinking Water at Large Scale The State of the Safe Water Enterprises Market. January.
Lower
Sustainability potential
adjustments required
adjustments required
Higher
Fewer
More
Scalability of the SWE kiosks
Scalability involves the capacity to expand or adapt the water kiosk infrastructure, services, and resources to meet the growing needs of the community it serves.

Scalability involves the capacity to expand or adapt the water kiosk infrastructure, services, and resources to meet the growing needs of the community it serves. The more scalable the kiosk is, the more likely it is for it to address the increased customer demand while maintaining consistent water quality, accessibility, and affordability. While sustainability will ensure adequate water, scalability would depend on the revenue growth trends. For example, a positive net revenue would indicate a potential to scale while a negative net revenue may well indicate the potential of the kiosk to run down.
From this study, most respondents, especially those residing far from the kiosks expressed the need to have an alternative kiosk nearby. The kiosks can scale in two main ways:
i. Constructing alternative kiosks to address the customer needs and increase customer growth, and
ii. Establishing a distribution system through piping.
To meet the cost of either constructing a new kiosk or establishing a distribution system, a significant financial investment would be required. If the current revenues cannot meet the cost of scaling up, the kiosks may require external support. To establish the sustainability potential of the kiosks, we look at the financial, technical, and social standing respectively position. In Table 20, we highlight the summary of the findings based on the current state of the kiosks. Other factors such as the availability of alternatives were also considered in establishing the scalability potential of the kiosks. For example, in Kangemi, consumers have multiple options to access water at no cost, however, the quality of Maji Safi kiosk water supersedes that of the alternative sources.
5. Sustainability and scalability of the kiosks 80
5.3
None of the kiosks, in their current state, can scale their operations; enhance production capacity, set up satellite and or alternative kiosks, and supply water to high-water consumption facilities consistently. Based on this assessment, the SWE kiosks will require partnerships with institutions that can offer financial and technical assistance. For example, having a routine technician dedicated to the kiosks would assist in reducing losses that occur during breakdowns as such can be fixed in time. Additionally, all the kiosks currently incur considerable amounts of non-revenue water that can be converted into revenues.
One of the ways to scale is to seek financial aid; this can come from either donor partners or banking institutions. In Kenya, multiple financial and micro-financial institutions offer credits for water-related projects. However, accessing credit would require good financial standing, the ability to forecast revenue growth trends, and consistent records. From the assessment, most of the kiosks still require training on bookkeeping and financial management making them currently ‘not ready’. Operating a water kiosk involves various costs. Failing to allocate resources for essential aspects can lead to financial instability and, ultimately, operational failure. Without a wellstructured budget, the kiosks may find themselves struggling to cover their basic expenses, compromising the quality of their services, and invariably affecting the ability of the business to scale. This evaluation, therefore, concludes that the six SWE kiosks currently have a low potential to scale as illustrated in Figure 42 below.
5. Sustainability and scalability of the kiosks
Table 20: Scalability parameters
Figure 42:
Sustainability potential
adjustments required More adjustments required 81
Korumba Sondu
Ong’er Maragua Ngoliba # Kiosk Social standing Financial standing Technical standing Scalability potential 1 Kangemi Good Good Good Minimal 2 Maragua Good Good Good Minimal 3 Wath Ong’er Good Good Good Minimal 4 Korumba Good Satisfactory Good Minimal 5 Ngoliba Good Good Good Minimal 6 Sondu Good Satisfactory Good Minimal
Scalability potential of the SWE kiosks
Lower Higher
Fewer
Kangemi
Wath
A case study in Uganda51 highlights that climate vulnerabilities may not have significance in the ability of the kiosks to scale due to weak management and pump breakdowns. The latter directly affects the ability of the kiosks to function and for the kiosks to be able to scale up, the technical and operational management has to be given priority. In Rwanda, intermittent water supply, high production cost, price sensitivity, and consumer demand affect both the sustainability and scalability of the decentralized kiosks.52 Therefore, it is only when the kiosks have the capacity to address their customer demand issues, production capacity, and water supply challenges that they can be deemed to be ready to scale. Additionally, MajiPlus recognizes that kiosks can maximize their revenues and improve self-sufficiency through innovations like the use of water ATMs53, however, this may not be enough to enable scale-up, hence the need for partner organizations and donors who can fund operational components to ensure sustainability and scalability.

5. Sustainability
of the
and scalability
kiosks
51 Bouman, L., & Eawag, R. M. (2022). Business Case Study : GDM Water Kiosks in Eastern Uganda. 41(July), 0–23
52 Huttinger, A., Brunson, L., Moe, C. L., Roha, K., Ngirimpuhwe, P., Mfura, L., Kayigamba, F., Ciza, P., & Dreibelbis, R. (2017). Small Water Enterprise in Rural Rwanda: Business Development and Year-One
Performance Evaluation of Nine Water Kiosks at Health Care Facilities. International Journal of Environmental Research and Public Health, 14(12). https://doi. org/10.3390/IJERPH14121584
82 5. Sustainability of the
53 MajiPlus. (2021). Accelerating Rural Water Access with MajiPlus featuring the TokenTap.
https://www.projectmaji. org/post/accelerating-ruralwater-access-with-majiplusfeaturing-the-tokentap
Social


 6.
and health impacts of the SWE project
6.
and health impacts of the SWE project
6.1 Overview and context
Decentralized water systems can enhance social equity by reducing disparities in access to clean water, particularly in marginalized communities.

Decentralized water systems can enhance social equity by reducing disparities in access to clean water, particularly in marginalized communities54. Further, they promote local water resource ownership and management, fostering community empowerment55. This approach also promotes social equity by ensuring that marginalized populations have access to clean water, bridging the gap between urban and rural areas and reducing water-related inequalities.
Access to clean water through a water kiosk can profoundly impact a community's health: reportedly, clean and safe drinking water has been associated with numerous health benefits, including a reduction in waterborne diseases like diarrhea, which remains a leading cause of morbidity and mortality worldwide56. Additionally, safe water plays a crucial role in preventing other water-related illnesses, such as cholera and typhoid fever57. The availability of safe water also supports overall well-being by promoting proper hydration and facilitating good hygiene practices58.
In this chapter, we highlight the consumer perception of the significance of the existence of water kiosks in both households and businesses including water vendors that benefit from it.
54 Bakker, K., & Kooy, M. (2003). "Splintered networks: The colonial and contemporary waters of Jakarta." Geoforum, 34(3), 203-219
55 Budds, J., & Hinojosa, L. (2012). "Restructuring and rescaling water governance in mining contexts: The coproduction of waterscapes in Peru." Water Alternatives, 5(1), 119-137.
56 Prüss-Ustün, A., Bartram, J., Clasen, T., Colford, J. M., Cumming, O., Curtis, V., ... & Cairncross, S. (2019). Burden of disease from inadequate water, sanitation and hygiene for selected adverse health outcomes: An updated analysis with a focus on low-
and middle-income countries. International Journal of Hygiene and Environmental Health, 222(5), 765-777.
57 Bartram, J., & Cairncross, S. (2010). Hygiene, sanitation, and water: forgotten foundations of health. PLoS Medicine, 7(11), e1000367.
58 Clasen, T., Pruss-Ustun, A., Mathers, C. D., Cumming, O., Cairncross, S., & Colford Jr, J. M. (2015). Estimating the impact of unsafe water, sanitation and hygiene on the global burden of disease: evolving and alternative methods. Tropical Medicine & International Health, 20(6), 758-764.
6. Social and health impacts of the SWE project 84
6.2
The social impact of SWE kiosks
Data obtained from the household surveys and key informant interviews show significant social impacts arising from the water kiosks. To establish the social impacts, we evaluated key aspects including: reduced waiting times, time taken to walk to the kiosk, and the rise in business establishments.
6.2.1
Reduced waiting times
These statistics reflect variations in queuing time satisfaction across different regions. While some kiosks report high satisfaction with queuing time, others face challenges. The majority of Maji Safi users experienced minimal wait times, with an average wait of 5 minutes or less. In Maragua, for example, 39.39% of Maji Safi users reported being very satisfied, and 39.36% reported being satisfied. This is also seen in Migori, with 61.19% being satisfied with the time it takes them to queue. With an average distance of only 200 meters to the kiosk, it offers convenience, contributing to the 90% satisfaction rate among users. Water kiosks with low satisfaction rates include Ngoliba, with 23.53% of users being very unsatisfied and 32.35% of users being satisfied. In Sondu, 32.43% of users reported being very unsatisfied, and 29.73% reported being unsatisfied.
6. Social and health impacts of the SWE project
Kangemi Very unsatisfied Unsatisfied Satisfied Very satisfied Indifferent Korumba Maragua Ngoliba Sondu Wath Ong’er 33% 32% 32% 24% 3% 3% 21% 39% 67% 49% 42% 15% 14% 39% 6% 30% 22% 8% 61% 1% 85 4% 8% 18% 6% 18% 6%
Figure 43: Time taken queuing satisfaction rates
6.2.2
Rise businesses establishments
Shorter waiting times and distances free up valuable time for individuals, especially women and children, who often bear the responsibility of collecting water. This extra time can be used for education, income-generating activities, or spending quality time with family, contributing to overall well-being. Reduced waiting times alleviate the burden on individuals, particularly women and children, who often spend significant portions of their day collecting water. This, in turn, empowers them to engage in other productive activities, such as education and income-generating work, thereby contributing to poverty alleviation and economic development59. Additionally, shorter queues can enhance community cohesion by reducing tensions and conflicts that may arise during long waiting periods60 Thus, by easing access to clean water, shorter queuing times at water kiosks contribute to communities' overall well-being and development, particularly in regions facing water scarcity challenges.
The specific business establishments supported by the water kiosks vary across the kiosks. While some kiosks mention direct support to water vendors or the emergence of community resource centers and libraries, others focus on the indirect economic benefits of providing the community safe and affordable drinking water. For example, in Ngoliba, the water provided by the kiosks has led to the emergence of small businesses such as butcheries, saloons, and restaurants. According to data obtained from the businesses, we can establish that most businesses are either very satisfied or satisfied with the price of water charged by the Maji Safi kiosks (37.74% & 47.17%, respectively) as shown below. Furthermore, out of the 27 vendors interviewed, 70.37% of vendors indicated that water obtained from the kiosk has helped them grow their businesses whilst 29.63% indicated the kiosks did not contribute to their growth.
6. Social and health impacts of the SWE project
59 Sangamithra, G., Magesh, N. S., & Mohan, V. R. (2018). Impact of water kiosk on women's daily chores and their livelihood: A case study from Cuddalore District, Tamil Nadu, India. Environment, Development and Sustainability, 20(2), 667-685.
86
60 Kjellén, M., & McGranahan, G. (2006). Informal water vendors and the urban poor. IWA Publishing
The equitable pricing at water kiosks has the capacity not only to encourage entrepreneurship and business expansion but also to bolster the community's general welfare and prosperity through job creation and the promotion of economic growth. This notion is evidenced by a study by Smith et al (2019) highlighting how exorbitant water prices charged by decentralized water systems can disproportionately burden small and medium-sized enterprises, hindering their growth and profitability61. In addition, the expansion of water vending businesses through kiosks plays a pivotal role in achieving both social and economic advancements in communities, making it an essential aspect of contemporary entrepreneurship.

6. Social and health impacts of the SWE project
61 Smith, J., Brown, C., & Harris, L. (2019). Water Poverty and the Burden of a Water and Sanitation Service in the Rural
87
Developing World. International Journal of Environmental Research and Public Health, 16 (16),
2842.w
Figure 44:
0% 10% 0% 0% 2% 0% 13% 47% 57% 42% 38% 1% Very Unsatisfied Unsatisfied Indifferent Satisfied Very Satisfied Level of satisfaction Number of households (%) Price of water Frequency of payment 20% 30% 40% 50% 60%
Payment and tariffs satisfaction rates
The health impact of SWE kiosks
6.3.1
Prevalence of waterborne diseases
Across regions, users report a reduction in waterborne diseases, with over 90% of respondents rating the water as clean and safe. These kiosks contribute to lower incidences of illnesses like diarrhea and cholera. Improved water quality, regular testing, and hygiene promotion enhance health outcomes. From the figure below, we can establish that across all water kiosks, households reported reduced waterborne diseases such as diarrhea and typhoid, with Maragua and Ngoliba Maji Safi water users reporting larger health benefits that have resulted due to water usage from the kiosk. In addition, we can also note Maji Safi kiosk users interviewed in Korumba, and Kangemi have reported no health benefits associated with the kiosk.
6.3
6. Social and health impacts of the SWE project
Figure 45:
Health benefits across the six kiosks
Increased bathing Increased laundry % of households Kangemi Korumba Sondu Wath Ong’er Maragua Ngoliba 58 58 85 85 70 65 62 8 5 27 70 88 82 12 11 59 59 53 53 15 15 3 3 54 54 55 55 35 35 40 40 25 25 88
Reduced diarrhea Reduced typhoid Reduced cholera
No health benefit

Water kiosks are crucial in improving public health by providing access to clean and safe drinking water in many communities, particularly in regions with limited access to clean water sources. According to a study by Howard et al (2019), access to clean water through water kiosks significantly reduces the incidence of waterborne diseases such as diarrhea, cholera, and typhoid. These kiosks employ water treatment technologies that effectively remove contaminants and pathogens, ensuring that the water distributed is safe for consumption62. Furthermore, a study by Mukherjee et al (2018) highlights that water kiosks can decrease infant mortality rates by providing mothers with a reliable source of clean water for formula preparation and hygiene practices. Additionally, the convenience of water kiosks reduces the need for individuals to rely on untreated or contaminated water sources, thus reducing the burden of water-related illnesses in these communities63.
6.3.2
Improved hygiene standards
62 Howard, G., Bartram, J., & Fewtrell, L. (2019). Systematic review of health risks associated with consumption of unprocessed or inadequately treated water. Environmental Health Perspectives, 127(6), 066001.
Data obtained from the household survey showed that over 50% of the households across all the water kiosks do not have to worry about water treatment because of the quality of water provided by the kiosks. Across all the kiosks, the households reported that they could now serve their guests drinking water without having concerns about its quality (Figure 46). This positive response shows that the kiosks are offering safe water and have the interest of the community members at heart. This finding is supported by academic literature as a study by Whittington et al (1991) highlighted the proliferation of trusted water kiosks in low-income urban areas has significantly reduced the need for individual water treatment practices, such as boiling or using chlorine tablets, which are often inconsistent and burdensome64.
63 Mukherjee, A., Roy, S., Das, D. K., & Biswas, D. (2018). Water kiosks: A sustainable approach for safe drinking water supply in urban slums of India. Journal of Water, Sanitation, and Hygiene for Development, 8(2), 342-351.
64 Whittington, D., Lauria, D. T., & Mu, X. (1991). A study of water vending and willingness to pay for water in Onitsha, Nigeria. World Bank Policy Research Working Paper No. 4859.
6. Social and health impacts of the SWE project
89
%
Kiosk name
I can now serve my guests drinking water confidently
My family no longer worry about treating drinking water
Other
The distance and amount of time spent on fetching water has reduced
The expenses on purchasing water have reduced
6. Social and health impacts of the SWE project
46:
Figure
90
Positive experiences reported by households
of households
Kangemi Korumba
33% 67% 6% 64% 15% 6% 9% 23% 56% 21% 4% 56% 22% 11% 7% 18% 35% 3% 44% 3% 28% 8% 55% 8%
Sondu Wath Ong’er Maragua Ngoliba
7. Lessons learned and success indicators

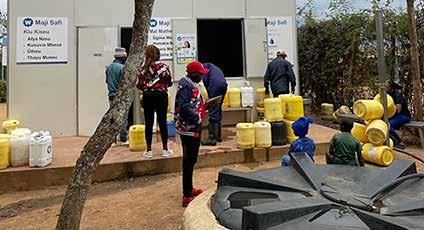

7.1
Overview and context
To determine the potential of the safe water kiosks to scale and be sustainable in the long run, it is imperative to identify key lessons and success factors. It is from the lessons and success factors that the management of these kiosks can identify areas to improve on and those to maintain. Our interaction with different stakeholders and the project beneficiaries (consumers) points to a very impactful project, albeit with some lessons that could be picked for future projects. Consequently, we provide some of the lessons picked during the evaluation of the performance of the kiosk and the success factors.

7. Lessons learned and success indicators
92
7.2 Success indicators
7.2.1
Improved quality water access
Access to safe water not only contributes to better health but also spurs community growth in many aspects. For rural and underserved communities where access to safe water is limited due to the multiplicity of unsafe water sources, the Safe Water Kiosks can be seen as a game changer, and Maji Safi is a popular phrase. The following are some of the success factors identified during the project evaluation.
The interaction with Maji Safi Water consumers reveals that customers are confident about the water they consume. “…I no longer have to worry about treating or boiling drinking water, Maji Safi has been of great help” – Maji Safi kiosk user. Access to unsafe water sources forced a majority of the rural communities to either treat or boil water for drinking, however, things changed when the kiosks were installed as they no longer had to worry about access to clean and safe drinking water.
Further, with the majority of the water kiosks having water ATMs, the customers could access the water at any time. Similar initiatives by other agencies like Oxfam65 suggest that the use of electronic service-based systems ensures the sustainability of these systems especially in rural areas with no or limited piped connections.

 Figure 47:
Lessons learned and success indicators 65 Goodrich, I., & Ogamba, S. (n.d.). Sustainable Solutions to Water Supply in Kenya. https://www.google.com/ url?sa=t&rct=j&q=&esrc=s&source=web&cd=&ved=2ahUKEwix4b2M9v-EAxU1Q_EDHdgADOIQFnoECA4QAQ&url=https%3A%2F%2Foxfamilibrary.openrepository. com%2Fbitstream%2F10546% 2F620300%2F1%2Fcs-sustainable-water-kenya-100717-en. pdf&usg=AOvVaw1kmXhHP4Kt_JTr_NanfuJH&opi=89978449 93
Maji Safi kiosks users queuing for safe drinking water at Ngoliba kiosk – Kiambu County 7.
7.2.2
Shorter waiting time and distances
7.2.3
Entrepreneurial mindset and income generation opportunities
Before the establishment of the kiosks, most households would walk longer distances to fetch water, but this changed when the kiosks were commissioned for operations. This was particularly the case for women and school-going children, who had to rise early, walk longer distances, and in some instances wait and queue for water. As a result, some of the children would be late for school and face punishment.
The safe water kiosks have made it easy for both women and school-going children. Women now have more time at their disposal for other household tasks, while children no longer have to worry about school punishment for arriving late, and more time is available to play and do homework. “..my kids now have more time to play and finish their homework, as I attend to other household chores” – reports a household from Sondu Kiosk.
By design, the safe water kiosks were tailored as social enterprises that support entrepreneurial growth. In most of the kiosks, they have established business ventures which range from community toilets, and poultry farming to retail shops. In Maragua, for example, the kiosk is generating revenues from a toilet, and a retail shop that they own.
The availability of safe water kiosks has attracted business opportunities. Areas that are far from the kiosks are reached by the water vendors, as a result, the growth of the water vending business has been witnessed across all the kiosks evaluated. “… from the water vending business, I have been able to take my son through high school and now enrolled for college studies” – reports Mary, a water vendor at Wath Ong’er.
7.2.4
Reduced waterborne diseases and improved hygiene
For most of the rural kiosks, the motivation for setup was to increase access to safe water and reduce the prevalence of waterborne diseases like cholera and diarrhea. An interview with a health officer at Wath Ong’er indicated that there were reduced cases of diarrhea and cholera in the community thanks to the Maji Safi kiosk. Moreover, the consumers also report reduced cases of diarrhea, especially in children owing to the use of clean and safe water from the kiosk.
7. Lessons learned and success indicators 94
7.3
Lessons learned
7.3.1
Efficient water provision requires reliable technology
This section details key lessons learned from the evaluation of the kiosks as well as key learnings from similar or related projects.
The technology employed by Siemens Stiftung is highly cost-effective. The SkyJuice Foundation’s filter technology is well-suited for groundwater and river water. It can produce up to 10,000 litres of clean water per day for around 1,000 families. The SkyHydrant can be used for up to 10 years with minimal maintenance. The majority of the kiosks have rivers and boreholes as their main and alternative water sources, the technology was well-suited and responded to the needs of the rural and underserved communities. Figure 47 shows the filtration system used in one of the SWE kiosks under evaluation. As opposed to other technologies that use multiple purification66,67 methods to ensure safe water provision, the SkyHydrant filtration is more efficient, reliable, and costeffective. It has 10,000 hair-thin fiber membranes against bacteria and viruses.
It is reported that most rural communities in Sub-Saharan Africa may not have adequate access to electricity68. However, they receive abundant solar irradiation which can be utilized as a source of energy. Consequently, a technology that enhances water production by utilizing solar energy would be ideal for these areas.


doi.org/10.1016/j. watres.2008.10.030
9 (3), e1588. https:// doi.org/10.1002/WAT2.1588
68 REAL-Water. (2022). Technological Innovations for Rural Water Supply in Low-Resource Settings. United States Agency for International Development (USAID) Rural Evidence and Learning for Water Project. Available at: https://www. globalwaters.org/sites/default/ files/4dec_technological_ innovations.pdf
7. Lessons learned and success indicators
Figure 48:
An image of the Sky Hydrant filtration system at Korumba kiosk - Kisumu County
66 Maniam, G., Ain Zakaria, N., Peng Leo, C., Vassilev, V., Banahene Blay, K., Behzadian, K., Eong Poh, P., Hartmann, T., Editor, A., Wright, N., Editor, S., & Jepson, W. (2022). An assessment of technological development and applications of decentralized water reuse: A critical review and conceptual framework. Wiley Interdisciplinary Reviews: Water,
67 Peter-Varbanets, M., Zurbrügg, C., Swartz, C., & Pronk, W. (2009). Decentralized systems for potable water and the potential of membrane technology. Water Research, 43 (2), 245–265. https://
95
7.3.2
Revenues generated from the kiosk may only ensure sustainability but not scalability of the kiosks
7.3.3
Adequate and continued stakeholder engagement is instrumental for the decentralized systems
The safe water kiosks incur operational and management costs monthly due to the growing demand for clean water. To meet this demand, the kiosks would need to enhance their production capacity which translates to huge financial investments. It is evident that for most of the kiosks, the revenues generated if properly managed, can ensure the kiosks meet their operational and management costs. However, the kiosks will have little to no money available to scale up; setting up additional kiosks, including satellite kiosks, and enhancing production and storage capacity. “…we are looking to set up satellite kiosks in Nyakweri and Osiri, but this would require us to seek financial assistance as our current revenues are inadequate to support this initiative” – reports an informant from Wath Ong’er, Migori County. In essence, the kiosk would need to explore alternative revenue sources, or obtain loans and donor support to scale and meet the growing demand for clean and safe water. Further, it would be useful to explore the extent to which the water kiosks can run comfortably with their current revenues, as this is an area that is yet to be explored69.
In implementing the Safe Water Enterprise (SWE) kiosk project, Siemens Stiftung and its partner organization Skyjuice Foundation embraced partnerships with the local CBOs, Counties, Non-Governmental Organizations (NGOs), and implementing partners like KWAHO and SWAP Kenya. From the onset, Siemens Stiftung ensured that the establishment of the kiosks was a community idea. This ensured that the communities owned the project and processes for their success. Different actors were engaged for different purposes: the Public Health Officers (PHOs) and Community Health Volunteers (CHVs) were engaged at the county level alongside KWAHO and SWAP Kenya to assist in capacity building and awareness creation on the use of safe water and hygiene promotion at the community level.
Throughout the project implementation, these actors promoted better hygiene practices. To ensure periodical water testing as required by regulations70, Siemens Stiftung has been supporting all the kiosks; in Western Kenya, SWAP Kenya has been instrumental in conducting the water tests. Moreover, technicians have always been a call away in the event the system encounters technical challenges.
69
7. Lessons learned and success indicators
Huttinger, A., Brunson, L., Moe, C. L., Roha, K., Ngirimpuhwe, P., Mfura, L., Kayigamba, F., Ciza, P., & Dreibelbis, R. (2017). Small Water Enterprise in Rural Rwanda: Business Development and Year-One Performance Evaluation of Nine Water Kiosks at Health Care Facilities. International Journal of Environmental Research and Public Health, 14(12). https://doi.org/10.3390/ IJERPH14121584
WASREB. (2019). Sanitation Services in Rural and Underserved Areas in Kenya Guideline Water Services for All for Provision of Water and Sanitation Services. 96
70
7.3.4
Ultimately, the kiosks can only project what they can track
7.3.5
The Safe Water Enterprise (SWE) project mirrors other projects across the region
Our interactions with the management of these kiosks reveal limited or inadequate knowledge of bookkeeping. The classification of revenues, and recording keeping still require guidance, training and capacity building. As the majority of the kiosks would require financial assistance to be able to scale up, clear records would be necessary to access credit. There is a clear absence of consistent records from the perusal of the documents presented. While the water ATMs proved useful in tracking sales and volumes of water sold, other expenses, and revenues had no clear and consistent records.
From the implementation approach to kiosk operations, the SWE project has major similarities with similar or related projects implemented by different actors. All the actors listed in Table 21 recognized the need for clean and safe water for underserved communities, especially in rural areas. While the entrepreneurial approach by Siemens Stiftung mirrors the Aqua for All work with women enterprises in Senegal and Burkina Faso, other systems did not take a similar approach with a focus mainly on service provision.
Unlimited water access is evident across the selected case studies except one where that is not specified. In most of the systems reviewed, the implementing agency and partners have worked towards providing customers with smart cards, and or water cards that allow them to access water 24/7. Oxfam reports that the integration of the automated system (ATM) has seen water utilities in Wajir County, Kenya record a 400 percent rise in water revenues, and increase transparency71. According to UNICEF – with the smart water kiosks, costs on wages have been reduced as the kiosks do not require an attendant to operate as the system is monitored remotely and they can identify maintenance needs in real-time.
65 Goodrich, I., & Ogamba, S. (n.d.). Sustainable Solutions to Water Supply in Kenya. https://www.google.com/
url?sa=t&rct=j&q=&esrc=s&source=web&cd=&ved=2ahUKEwix4b2M9v-EAxU1Q_EDHdgADOIQFnoECA4QA-
Q&url=https%3A%2F%2Foxfamilibrary.openrepository. com%2Fbitstream%2F10546% 2F620300%2F1%2Fcs-sustain-
able-water-kenya-100717-en. pdf&usg=AOvVaw1kmXhHP4Kt_JTr_NanfuJH&opi=89978449
The system setup is almost identical with water being pumped from the source to an overhead tank(s), filtered through a membrane system, and then supplied to the customers from the kiosks. Water quality remains essential and the UNICEF smart kiosks have adopted monthly collection and testing of samples. While there are no records on the frequency of tests from the other cases reviewed, the Siemens Stiftung’s SWE kiosks test water at least annually. According to World Vision, their system tracks water usage and payments and allows them to quickly identify needed repairs. Such is useful in ensuring timely maintenance and kiosk efficiency albeit with a high capital expenditure that the evaluated SWE kiosks may not afford. 7.
Lessons learned and success indicators 97

Select case studies of related or similar projects
# Item
Implementing entity
Aqua for All 72,73
1 Name of project Supporting safe water enterprise Oshun in Senegal and Burkina Faso
2 Implementation approach Targeting women enterprises Implemented in partnership with Oshun Senegal.
World Vision 74
Oxfam75
Automated water kiosksAQtap water ATM Sustainable WASH in fragile contexts (SWIFT)
World Vision is engaging water committees to take ownership or run the kiosks. This is being implemented in partnership with Grundfos.
Oxfam is working with the private sector and devolved county governments to improve water access.
UNICEF76
Smart water kiosk
UNICEF partnered with the local government to build smart water kiosks.
3 Target area/ population Rural Rural Rural, arid, and semi-arid lands Rural
4 Country(ies)77 Senegal and Bukina Faso Kenya, Zambia, Ghana, Rwanda, Ethiopia Kenya, Democratic Republic of Congo Mongolia
5 Project description and technology
Oshun Senegal offers filtered and disinfected drinking water through an innovative water kiosk franchise model.
The water kiosks are connected to an application that monitors water supply and quality remotely.
Water is pumped up into an overhead storage tank and then the water flows through gravity to kiosks placed throughout the community including near households, in schools, and at healthcare facilities.
Water usage and payments are tracked by the system allowing us to quickly identify potential needed repair.
Both water ATMs and solar pumping technologies address the sustainability of service provision by the water utilities. Solar energy is used for pumping water from the source to the storage tanks and dispensation units.
The smart water kiosk was designed using a shipping container and fitted with water purification filters installed inside the kiosk.
The kiosk is equipped with sensors that monitor water quality and level, and a mobile payment system. Samples are taken and analyzed monthly by the provincial inspection agency.
72 Read more here: https:// aquaforall.org/news/swesupport-oshun-senegal-andburkina-faso/
73 Incofin. (2020). Resilience of safe drinking water models in COVID-19 times - Incofin. https://incofin.com/resilienceof-safe-drinking-watermodels-in-covid-19-times/
74 Read more here: https:// www.wvi.org/stories/cleanwater/automated-waterkiosks-make-life-easier-andsafer-women-and-children
75 Goodrich, I., & Ogamba, S. (2018). Sustainable Solutions to Water Supply in Kenya. file:///G:/Mi unidad/ Water Humanitarian context/ cs-sustainable-water-kenya100717-en.pdf
76 UNICEF. (2022). ‘ Smart ’ water kiosks improve access to drinking water in rural Mongolia. 1–8. Available at: https://clearinghouse. unicef.org/sites/ch/files/ch/ sites-PD-WASH-WASH%20 Knowledge%20unicefFN2723%20Smart%20
Water%20kiosks%20Mongolia2.0.pdf
77 This is restricted to the countries where the case study has been derived from and not all the countries where the entity works in.
Figure 49: Preview of the kiosk systems by World Vision and Siemens Stiftung
Table 21:
6 Operating hours Unspecified 24/7 24/7 24/7 7. Lessons learned and success indicators 98
8. General conclusion and recommendations


Overall project performance and general conclusion
The purpose of this assessment was to share key learnings of the SWE kiosks models. This was to be achieved by analyzing the technical and economic viability and potential social impacts. Specifically, Siemens Stiftung wanted to understand the extent to which the community-led SWE kiosks model has achieved technical and business performance, financial sustainability, scalability, and potential social impact.
Having conducted the research and identified best practices, success factors, challenges, and weaknesses, we make the following conclusion and recommendations.
The overall project performance is described and ranked as follows:
1 Relevance 78
2 Sustainability80
Validity of the project objectives
Alignment of project outputs with the expected outcomes
Alignment of the project outputs with the overall goal of the Siemens Stiftung 79
The extent to which the project benefits would continue after the handover of the kiosks
SWE operates as a social enterprise to provide clean and safe drinking water to the community members.
The project’s logical framework has detailed the Outcomes and Outputs .
For example, Training on business opportunities around SWE provided an opportunity for water vendors and businesses to grow.
Siemens Stiftung was established as an independent nonprofit foundation in 2008. It is committed to sustainable social development and focuses on access to essential services, connected societies and climate and sustainability.
The SWE project targeted:
• Equitable access to affordable and clean water in local proximity for people in rural areas.
• More jobs in rural areas
• A good understanding of the necessity of hygiene by the community.
The water access gap in rural and underserved communities requires urgent and immediate attention. EED-A, therefore, finds the project objectives highly relevant.
Having reviewed the project log frame/logical framework, linked to the findings, EED-A finds the project outputs aligned to the expected outcomes with businesses attributing part of their growth to the existence of the kiosk. Moreover, in Kangemi, sales to the water vendors command the highest share of total sales (30% in 2019 to 67% in 2022).
EED-A finds the SWE project aligned with the overall goal of Siemens Stiftung. SWE is a water kiosk that is placed within the community to provide safe drinking water to the community members. It is operating as a social enterprise which means that the revenues are used to benefit the community.
For example, part of the revenues have been used to establish a fish pond and poultry farm in Wath Ong’er.
The customers are satisfied with access to clean and safe water and the health benefits that come with it. That, notwithstanding, EED-A finds that the kiosks would need to put more effort into ensuring these efforts are enjoyed post-handover.
• A significant financial investment would be needed to scale up the kiosks to reach the target population especially the Wath Ong’er and Sondu kiosks.
• There is a possibility that some of the kiosks could run down in the long term – In Ngoliba, the health center uses part of the revenues.
• The water vendors still require more training on hygiene especially in handling water meant for drinking. Only 37% of the water vendors clean the containers daily with 33% doing so weekly as 15% do not know whether they clean the containers.
8.1
Table 22:
8. Genera conclusion and recommendations
project
Overall rating of the SWE kiosk project
# Criteria Evaluation aspect Provisions based on
documents Findings Rank
78 SWE logical framework 79 SWE kiosks sustainability assessment
100
80 SWE problem analysis tree
Factors influencing the achievement or non-achievement of project sustainability
3 Impact 81 The general result of the project
Distance to the water source Inadequate awareness and technical capacity for safe water provision
Increased demand for clean and safe water by rural communities Competition from similar projects/ Availability of alternatives
Having reviewed the project documents, EED-A finds factors either influencing the achievement or nonachievement of the project sustainability defined. However, the lack of a tracking mechanism for these factors may influence the sustainability of the project.
9 out of 16 sites adequately picked up and were tracked by Siemens Stiftung and the rest were transferred to NGOs who run them without the assistance of Siemens Stiftung.
In Kangemi, there are multiple projects with others providing free water – this may affect the sustainability of the kiosks as some customers would prefer the free water.
Additionally, it is reported that the trend in customer growth at Maragua has been declining as there are alternatives; MUWASCO has already set up a public utility kiosk and more households are continually getting piped water connections.
The SWE impact logic clearly defines the general result of the project; contributing to the achievement of SDG 6 on universal access to safe and adequate water
The difference the SWE project has made to the local community82
Percentage of the population that has benefited from the project 82
4 Coherence Consistency of the SWE intervention with other interventions done by Siemens Stiftung
Linkage between the SWE kiosk model with other actors’ interventions in the project sites
Some of the differences the SWE project envisioned include;
• The kiosk operators being able to operate the kiosks in a business-minded way to benefit the community
• People being able to apply the instructions given during the health and hygiene training (e.g., washing hands and cleaning containers)
• Increase productivity as more time is available for other tasks
The population served. The number of households benefiting from the kiosk and the target area was defined
Siemens Stiftung is involved in the following areas;
• Development of basic services,
• Social entrepreneurship,
• Promotion of education, and
• Enhancement of culture.
The SWE Kiosk model aims to enhance access to clean and safe drinking water in rural and underserved communities.
From the assessment. EED-A finds that,
• More customers continue to demand clean water.
• At least 50% of the consumers have reported general satisfaction with the kiosks and service provision.
• The kiosk has facilitated the growth of businesses and water vendors who can earn a living from the distribution and selling of water.
Already Maragua kiosk is being operated alongside small businesses (operating a sanitation facility – toilet), and the Wath Ong’er kiosk has a poultry farm, customers can charge their phones from the kiosk at 10/-
While the community has embraced handwashing, those who live far from the kiosks and use vendors have lamented that some vendors do not clean the jerricans. More than 60% of the kiosk users report having more time to do other domestic duties due to the availability of the kiosk.
While the original population was originally defined, EED-A finds that a mechanism to track the population that benefits from the kiosks was not defined. This makes it difficult to explicitly report the percentage of the population that benefited or benefitted from the project.
Having reviewed the project documents and further interaction with the project implementation team, EED-A finds the SWE project consistent with other interventions the company does.
Across Africa and globally, Siemens Stiftung projects aim to enhance the livelihood prospects of various communities. The provision of safe water is one aspect of enhancing livelihoods.
In 2023, the national and county governments signed a Sh900 billion National Water and Sanitation Investment Financing Plan (NAWASIP) to tackle ravaging drought. Further, the government aims at enhancing water access at household and community level. This study established that several other organizations are working to improve water access in rural and underserved communities.
SNV Kenya is implementing a Public-PrivateCommunity-Partnership Model to improve water access in the Arid and Semi-Arid Lands of Kenya.
81
82
83
# Criteria Evaluation aspect Provisions based on project documents Findings Rank
(Presentation)
SWE impact logic
SWE logical framework
8. General conclusion and recommendations 101
SWE kiosk sustainbility assessment
5 Effectiveness
6 Efficiency
The extent to which the project objectives were or would be achieved
The goal of the project was to ensure:
• There is affordable access to clean water in local proximity for people in rural areas.
• There are more jobs in rural areas
• People have a good understanding of the necessity of hygiene
• Distance to the water source
Based on the study findings, EED-A finds that the objectives have been achieved but not fully as there are factors that still limit the full achievement of the objectives.
The kiosk operators would still need additional training on record-keeping.
For Kangemi and Ngoliba kiosks, it would be useful to monitor the financial expenses, especially by the hosting institutions (the resource and health centers respectively). The continued use of the finances by the hosting institutions may limit the scalability of the kiosks and their ability to manifest as social enterprises. Factors influencing the achievement of the set objectives
• Inadequate awareness and technical capacity for safe water provision
• Increased demand for clean and safe water by rural communities
• Competition from similar projects resp. availability of alternatives.
• Finances including Capital Expenditure (CapEx)
Some of the kiosks like Wath Ong’er still incur some capital expenditure and would need more time for the objectives to be achieved.
Cost-effectiveness of the activities implemented
Timely achievement of the objectives
The Siemens Stiftung team in partnership with SkyJuice Foundation implemented a cost-effective technology that was cognizant of the main water sources in the project sites.
• The SkyHydrant: 10,000 hairthin fiber membranes against bacteria and viruses.
Capacity Building of communities on access to clean water, health and hygiene practices.
In most cases, it takes two to three years for a Safe Water Enterprise (SWE) to become financially independent and entirely owned and operated within a community84
The technology employed by Siemens Stiftung is highly cost-effective:
• The SkyJuice Foundation’s filter technology is wellsuited for groundwater and river water. It can produce up to 10,000 liters of clean water per day for around 1,000 families. The SkyHydrant can be used for up to 10 years with minimal maintenance.
• Partnerships with the local CBOs, Counties, NGOs, and implementing partners like KWAHO and SWAP Kenya made the awareness creation and training costeffective.
The kiosks have been handed over 8 years from the time of establishment for most of the kiosks. However, since most of the kiosks fully kick-started their operations at least 3 years ago, EED-A still finds the project to have timely achieved its objectives.
The achievement of the objectives at the community level may be gradual but feasible eventually. Efficiency
The communities from the project sites have localized and embraced Maji Safi kiosks as they provide water better than any other, making them more efficient, especially for drinking water.
# Criteria Evaluation aspect Provisions based on project documents Findings Rank
of the project compared to alternatives
clean and safe water for improved health and hygiene conditions in rural and underserved communities.
Provision and
8. General conclusion and recommendations 84 Source: https://www.siemens-stiftung.org/en/projects/ safe-water-enterprises/ 102
8.2 Conclusion
Based on key findings discussed in previous chapters, we conclude as follows:
The SWE kiosks have increased access to clean and safe drinking water for the respective communities in the six sites under assessment. Before the establishment of the Maji Safi kiosks, most households did not have adequate access to clean drinking water and sometimes opted for the available water because they lacked alternatives. Moreover, most users report reduced time in accessing water and availability of time to attend to other household chores.
All the kiosks have high financial sustainability potential. All the kiosks have the greatest potential to be financially sustainable with minimal adjustments needed. Their revenues are currently sufficient to meet the operational and management expenditures.
None of the kiosks can scale without external support. Scalability of the kiosks would require significant financial investments, but in their current state, the kiosks do not have enough surplus to cover the cost of scaling up: for example, setting up satellite kiosks. Moreover, it is not explicitly clear if the kiosks can comfortably run their operations in the longterm, though the handover has already happened two years ago. This is an area that could be assessed in two or three years.
The kiosks have influenced the establishment and growth of businesses and social amenities. In some of the kiosks, restrooms have been constructed to increase access to sanitation facilities; for example, in Maragua, a restroom has been constructed and users can access it at an affordable fee. Further, the number of water vendors obtaining and distributing water from the kiosks is on an upward trajectory. Some of the kiosks are also planning on venturing into other income-generating activities. To increase the kiosk’s revenues and support the local community, Wath Ong’er kiosk has a poultry farm and working on rehabilitating the fish pond.
The technology used in designing the SWE kiosks model is cost-effective and replicable across other rural and underserved communities. The kiosk management and operators report minimum maintenance and simplified procedures for cleaning the filtration system. Moreover, the filter technology is well-suited for groundwater and river water and the filtration process requires no electricity. From the Ngoliba kiosk, some business people have expressed interest in developing similar kiosk designs and or replicating them in other areas.
There is potential to reduce the non-revenue water and increase revenues. All the kiosks recorded some level of non-revenue water that could be exploited to increase their financial performance.
8. General conclusion and recommendations
103
The revenue water arises from multiple sources notably, water that is supplied at no cost to the host institutions especially for Kangemi and Ngoliba kiosks that supply the resource and health centers respectively. While this could be categorized as a social impact, the lack of data on how much is supplied to the institutions makes it difficult to quantify the level of impact.
Access to clean and safe drinking water has led to a reduction in cases of waterborne related illnesses like cholera and typhoid. The interactions with the health centers and households within the communities visited revealed that the number of reported cases of illnesses has been declining since the kiosks were established. Most of the households recognize the taste, color, and smell of the Maji Safi water, and use it primarily for drinking.

8. General conclusion and recommendations
104
8.3
Recommendations
Based on the conclusions above, we recommend the following:
Training and capacity building – there is a greater need to capacity build the kiosk management and operators on fiscal management and maintenance practices. This would go a long way in influencing their potential to scale up and be sustainable. More specifically, it would be important to educate the management about revenue classification so they can get a sense of their financial sustainability. Well Aware85 works with community water systems in East Africa to improve their technical and operational efficiency through training and capacity building. It therefore positions itself among other organizations as a potential partner for training and capacity building.
Partnership and collective action – for the kiosks to be scalable, there is a need for the local administrations especially the county government to support the communitybased social enterprise models. Interest groups and other private sector actors could support the scaling up of this model to improve water access to the underserved communities where most of the public water utilities have limited coverage.
Adoption of a guaranteed service model to cover the operation and maintenance (O&M) needs. The evaluation has established that the majority of the kiosks especially those in rural areas struggle with their operation and maintenance needs due to inadequate technical capacity and the absence of a reliable technician. A guaranteed service model like that previously employed by Fundifix86 in which the entity is granted a portion of the operating costs to cover infrastructural maintenance based on annual contractual agreements. This is similar to a Delegated Management Model (DMM) model87 in which the kiosk would assign a number of its water service delivery functions ( for example operations, maintenance, and or revenue collection) to an external party like FundiFix.
Rationalization of the tariffs – there is a disparity in water tariffs across the six kiosks. With the growing number of alternatives, especially for kiosks in the peri-urban areas, there is a threat of decreased customer growth. In Kangemi, most Maji Safi kiosks users have lamented the higher tariffs as a hindrance to accessing clean and safe drinking water.
Hygiene and sanitation awareness – based on the study findings, there is a positive correlation between the usage of Maji Safi and the decreased prevalence of waterborne diseases. Consequently, it would be important for the kiosk management to partner with local health centers, dispensaries and other interest groups to facilitate awareness creation on the importance of using safe water for drinking and improve their hygiene practices. This activity should also target the water vendors who distribute water to the households.
8. General conclusion and recommendations 85 Read more here: https:// wellawareworld.org/successmodel/
Nyaga, C. (2020). Maintenance Approaches to Improve the Sustainability of Rural Water Supplies. University of Colorado Boulder.
WSTF. (2017). Service Delivery Model Toolkit for Sustainable Water Supply. 105
86
87
Annexes


# Name of stakeholder engaged / interviewed Affiliation Position 1 Christine Meinhardt Siemens Stiftung Senior Project Manager 2 Rhett Butler SkyJuice Foundation CEO and Founder 3 Stephen Njuguna Siemens Stiftung Project Consultant (external) 4 Paul Mwariri Siemens Stiftung Project Consultant (external) 5 Petronilla Musonye Kenya Water for Health Organization (KWAHO) Project Officer for Health and Hygiene Training and Social Marketing 6 Linah Rugabelah Kenya Water for Health Organization (KWAHO) Project Manager 7 June Samo Millenium Water Alliance (MWA) Water Intervention Manager and Market Systems Development Specialist 8 Ida Githu World Bank Consultant 9 Alie Eleveld Safe Water and AIDS Project (SWAP) Kenya Technical Advisor 10 Eden Mati Water & Sanitation for the Urban Poor (WSUP) Country Manager 11 Isaac Gichuki Murang’a County Director County Water Department 12 Ann Kombija Kisumu County WASH Coordinator 13 Silvester Gumo Migori County Sub-county Water Officer 14 James Kimani Nduati Maragua Kiosk - Murang’a Kiosk Owner 15 Susan Wambui Maragua Kiosk -Murang’a Kiosk Operator 16 Paul Ouma Ogutu Korumba Kiosk- Kisumu Kiosk Owner 17 Latif Adha Korumba Kiosk- Kisumu Kiosk Operator 18 George Nyanji Sondu Kiosk - Kisumu Kiosk Owner 19 Joel Otieno Onyango Sondu Kiosk - Kisumu Kiosk Operator 20 Hezron Olem Wath Ong’er Kiosk - Migori CBO Secretary (LAVISO) 21 Joshua Ojwang’ Wath Ong’er Kiosk - Migori CBO Vice Chairperson (LAVISO) 22 Margaret Ondoche Wath Ong’er Kiosk - Migori Kiosk Attendant 23 Moses Rangile Wath Ong’er Kiosk - Migori Clinical Officer - Wath Ong’er Dispensary 24 Kevin King’ori Mwangi Ngoliba Kiosk - Kiambu Health Facility Manager 25 Simon Ndere Ngoliba Kiosk - Kiambu Kiosk Operator 26 Esther Wanjiru Ndirangu Kangemi Resource Centre - Nairobi Kiosk Manager 27 Vincent Ogot Kangemi Resource Centre - Nairobi Kiosk Operator 28 Susan Murithi Kangemi Resource Centre - Nairobi Kiosk Attendant 29 Hilda Katunge Ngusya Kangemi Resource Centre - Nairobi Finance/ Admin manager 30 Joyce Atieno Wath Ong’er –Migori Technical personnel
Annex 1 List of key informants interviewed
Table
23:
Annexes 107
List of key informants interviewed
Annex 2
Siemens Stiftung SWE project established in Kenya
Table 24:
No. Kiosk name Location Est. Implementing Partner Legal ownership 1 Watoto Wenye Nguvu Kiambu County 2012 Global Nature Fund Boarding school 2 Maragua Ridge Muranga County 2012 Global Nature Fund Health Center 3 Githembe Muranga County 2013 Skyjuice/Pure Flow CBO 4 Ngoliba Kiambu County 2014 Skyjuice/Pure Flow Health Center 5 Maragua Market Muranga County 2014 Skyjuice/Pure Flow WUA 6 Kangemi Nairobi 2014 Skyjuice/Pure Flow Resource Center 7 Kudho Kisumu County 2014 SOS Childrens villages Kudho PRY School 8 Soko Kogweno Kisumu County 2014 SOS Childrens villages CBO 9 Korumba Kisumu County 2015 SOS Childrens villages WUA 10 Kitui Kitui County 2015 Amref Amref Kenya 11 HowaMwana Kwale County 2016 County Government WUA 12 Vitsangalaweni Kwale County 2017 County Government WUA 13 Sondu Kisumu County 2017 Safe Water and AIDS Project (SWAP) WUA 14 Nyagoro Homabay County 2017 Health Center 15 Tinderet Nandi County 2017 Tachwasco Tachwasco WSP 16 Wath Onger Migori County 2019 Lake Victoria Aids Support Organization WUA Annexes 108
SWE kiosk projects in Kenya
Annex 3 Research methodology
Study approach
Activity
Inception
• Kick off meeting
• Stakeholder mapping
• Development data collection tools
• Development of draft inception report
In response to the research objectives, six sequential steps were employed to conduct the research. These steps are highlighted below.
Desk review
Field research
• Desk review
Methods
• Reconnaissance visit to the SWE project sites
• Development of SWE Case Methodology
• Development of literature review report
• Development of final inception report
• Field visit
• Desk review
• Key informant interviews
• Observation checklist
• Household and business surveys
Data analysis & synthesis
• Data cleaning
• Data analysis
• Data synthesis
Reporting & dissemination
• Development of draft and final report with case studies of all sites assessed
• Delivery of dissemination workshop
• Online interviews
• Computer aided personal interviews
• Online interviews
• Computer aided personal interviews
• Hybrid or online workshop
Deliverables
• Key informant interview guides
• Draft inception report
• Literature review report
• Final inception report
• Raw qualitative data
• Raw quantitative data
• Clean and analyzed qualitative data
• Clean and analyzed quantitatived data
• Draft and final report in word in PPT
• Workshop summary
Annexes 109
Figure 50: Study approach
SWE
Siemens Stiftung SkyJuice Foundation
An inception meeting was held virtually on July 10, 2023, to clarify the objectives of the assignment and finalize contractual agreements. During the project inception, a number of activities were carried out that led to the drafting and submission of the draft and final inception report. The key activities carried out during the inception phase are highlighted below;

ACTIVITY 1 Stakeholder

ACTIVITY 2 Reconnaissance field
Stakeholder mapping

ACTIVITY 3
Preparation of data collection tools
From conversations with Siemens Stiftung and the implementing teams on the ground, EED-A mapped the key stakeholders and project beneficiaries as indicated below:
Stakeholder mapping
Government
Community
Health centers
Water User Associations (WUAs)
Anchor organizations e.g.,KRC,SWAP, Amref
Consumers
Households Businesses
project implementation team & partners
Figure 51: Activities conducted during the inception phase
mapping
visit
SWE kiosk management & operation
Kenya Water for Health Organization (KWAHO)
County Water Department
Water Service Providers (WSPs)
Categories Stakeholders
Annexes 110
Figure 52: Stakeholder Mapping
Desk review
Reconnaissance field visit
EED-A in consultation with the Siemens Stiftung team, carried out reconnaissance visits to the kiosks between July 24 and July 28, 2023. The two main aims of the visit were:
i. To introduce the consulting team to the community and create a rapport for the key informant interviews and surveys that were to be implemented.
ii. To request relevant technical and financial documentation that was to be used to undertake the evaluation.
Development of data collection tools
In preparation for the data collection exercise, a number of data collection tools were developed in response to the study objectives and stakeholders mapped. These have been summarized in the table below;
Table 25:
A list of data collection tools
# Tool Description
1 Key informant interview (KII) guides
2 An observation checklist
3 Survey questionnaires (households’, business’ and water vendors’ questionnaire)
Different KII guides were developed to reflect the key data points to be obtained from the categories of stakeholders. The aim of using these guides is to ensure that the discussions are structured and time-bound.
The observation checklist was developed to guide the observation around the kiosk including the infrastructure in line with the technical parameters.
The survey questionnaires, which included qualitative and quantitative questions, were developed to reflect the expected data points, including themes that were explored during the feasibility phase of setting up the kiosks and the customer profiling exercises.
Further, in compliance with the laws governing research in Kenya, EED-A obtained a research permit from the National Commission for Science, Technology, and Innovation (NACOSTI). This permit was also used to seek county permits that were shared with local government administrators during data collection.
Following the conclusion of the inception phase, a critical review of existing literature was conducted with a focus on social entrepreneurial business solutions and community-led approaches to bridge the water access gap. Specifically, the review aimed to unravel the efforts towards implementing community-led approaches to safe water provision through government or donor-led programs, the political or cultural enablers in these contexts, and the sources of financing/donor trends. Although the study focused mainly on the East African context owing to the SWE program scope, the review also analyzed similar initiatives in comparable contexts within Sub-Saharan Africa and emerging economies and Benin was used as a case study.
Annexes 111
Evaluation of technical viability
Based on the Terms of Reference, EED-A conducted an in-depth review of qualitative and quantitative data available on water kiosk models to identify gaps in the literature. Through these reviews, EED-A sought to determine the best practices, trends, and correlating factors for providing safe drinking water and the current opportunities and challenges.
EED-A evaluated the technical viability of the water kiosks based on the technical key performance indicators (KPIs) outlined in terms of reference and the WASREB Guidelines on water vending in Kenya. The table below summarises some of these parameters and the data collection methods.
# Technical KPIs
1 Water filtration system
Parameters assessed
Reliability of the system
Performance of the filters and cost of filter replacements
Safe water supply in liters per day
Challenges in using the system by kiosk operators
2 Water supply Source of water
3 Demand for water by consumers
Data collection method
• KIIs with kiosk operators.
• KIIs with the SWE project team.
• KIIs with kiosk operators and WSPs. Reliability of water source(s) used
Kiosk hours of operation per day
The average number of customers per day/month
Average consumption in liters per day/month
Common water uses among consumers
4 Water quality Water quality provision (results and frequency of water tests – covering Physical, Chemical, and Biological parameters)
5 Kiosk infrastructure Water source casing/cover
Storage tank hygiene
Storage tank material and cover
The accuracy of the water meter
Performance of the valve and pressure adequacy Kiosk and operator hygiene
Location of the water kiosk and proximity to animals
Cleanliness of the water pipes/systems used to fetch water by consumers; any leaks, bursts, or external contamination of the pipe and overall system
The presence of a lockable and secure door
Drainage within the kiosk and its surroundings
• KIIs with kiosk operators.
• Review of water sales records.
• Surveys with consumers.
• Review of water quality reports obtained from the water kiosks.
• Observation checklist
6 Level of compliance
Use of approved water sources
Licenses from water utility and public health unit
Regular water quality testing and reporting
Use of personal protective equipment (PPE) by kiosk operators
Use of approved water tariffs
Record keeping and reporting on sales, water outages, poor water quality, and any other incidences
7 Legal ownership model Ownership of the water kiosks and land on which It is constructed
• Review of water kiosk licenses and approvals.
• Review of water quality reports.
• Observation checklist.
• KIIs with kiosk operators.
• KIIs with the SWE project team.
• KIIs with county water department/WSPs.
Table 26: Technical Viability Assessment Parameters
Annexes 112
Evaluation of financial viability
The evaluation of the financial viability of the kiosks followed key parameters adapted from various sources including the Siemens Stiftung business Key Performance Indicators (KPIs), the Water Sector Trust Service Delivery Model Toolkit for Sustainable Water Supply, and the Toolkit for Urban Water Supply Projects. The latter toolkit focuses on guiding principles and project planning for kiosk systems. The table below highlights these parameters and the associated data collection method that was employed to obtain the necessary data.
# Business KPIs Parameters assessed Data collection method
1 System performance
2 Service quality
• Sources of water
• The volume of water produced
• Water system loss
• Population in the service area
• Population served
• Percentage population served
• Average hours of supply
• Number of complaints
• Number of breakdowns (monthly)
• Average response time
3 Operating and maintenance expenses
4 Revenues
• Administrative costs
• Salaries
• Electricity consumption cost
• Type, number, and cost of breakdowns
• Type, number, and cost of repairs
• Type, number, and cost of spare part replacements
• Other expenses e.g., licenses
• Total costs of operations
• The average number of jerricans sold per day
• Cost per jerrican
• Number of days per month
• Collection efficiency
Evaluation of social impact
• KIIs with kiosk operators.
• KIIs with the SWE project team.
• KIIs with county water department/WSPs.
• KIIs with kiosk operators.
• Surveys with consumers.
• Review of water kiosk records, bills, etc.
• Review of water kiosk sales records.
The evaluation focused on assessing the parameters outlined in Siemens Stiftung’s Theory of Change (ToC) on the social impact KPIs. These are summarized below.
Table 27:
Financial viability assessment parameters
Annexes 113
Table 28:
Social
# Social impact KPIs – kiosk operators Parameters assessed
1 Satisfaction with kiosk management Kiosk operations include:
• training
• consulting
• sales and revenues
• generated income (improved capacities and more income)
Data collection method
Key informant interviews with kiosk operators
2 Belief in own ability to operate and maintain the technology
Technical skills and know-how
# Social impact KPIs - Consumers Parameters assessed
1 Satisfaction of customers and community members (especially women) with kiosk services
2 Increased productivity because of time savings
• Perceptions of Water Quality
• Affordability
• Availability
• Distance
• Trust (access to safe water)
The average time taken to collect water
3 Improved health and well-being The former and current prevalence of waterborne diseases in the community
4 Economic impact on local businesses
Data collection
• Number of businesses that have emerged because of water availability from the kiosk (where possible, names and types)
• The kind of activities the businesses are engaged in
• Nature of relationship with the kiosk
• Percentage (%) of the growth attributed to the availability of the kiosk
Key informant interviews with kiosk operators
Data collection method
Surveys and focus group discussions
Surveys and focus group discussions
Surveys and focus group discussions
Interview with kiosk management
A mixed methodology approach was employed in obtaining the needed data for this study88. The table below represents a summary of the data collection methods and tools used in obtaining the needed data for this assessment. 88
Annexes 114
impact assessment parameters for kiosk operators and consumers
No single method was used to collect the data required
Technical and business performance evaluation
• Kiosk management
• Kiosk operators
Sustainability and scalability assessment
Social and health impact analysis
• Key informants
• Kiosk management and operators
• Households
• Households
• Businesses
• Water vendors
• Key Informants
Identifying lessons learnt
Identifying best practices and key success factors
• Key informant interviews (KIIs)(n=27)
• KII guides
• Vendors interviews(n=27)
• Households’ interviews(n=512)
• Kiosk management
• Kiosk operators
• Partners
• Siemens Stiftung team
• Business interviews(n=57)
• Kiosk management
• Key informants
• Observations(n=6)
• HHs questionnaire
• Business questionnaire
• Vendors questionnaire
Key informant interviews (KIIs) and observations
• Observations checklist
Throughout the project implementation, key actors were engaged. These actors supported the project implementation either directly or indirectly. To understand the technical, and business performance, and identify best practices, success factors, and challenges and weaknesses of the kiosk model, EED-A engaged different actors mapped previously. Further, experts in the sector drawn from both public and private sectors were interviewed to help in understanding the sustainability and scalability of the decentralized kiosk models.
The informants were purposively selected. Most of the interviews especially with the county water officers, kiosks management, and operators were conducted in person. However, the project team, implementation partners, and key experts in the sector were conducted virtually, through Microsoft Teams, Zoom, and Google Meet, depending on the informant’s preference. Annex 1 presents a summary of the key informants interviewed during this study.
Annexes 115
Activity Target respondent Data collection method Data collection tool
Figure 53:
Summary of data collection methods used in this study

During the key informant interviews with the kiosk operators, EED-A observed the kiosk infrastructure and surrounding environment using the observation checklist. This exercise was aimed at among other things, assessing the potential of hazardous events occurring within a water kiosk vending system. An observation checklist was prepared to aid this activity.
Households, businesses and water vendors’ surveys
The surveys were tailored to obtain primary data. Before the data collection exercise, a study design was developed, the sample size was determined and distributed proportionately across the six kiosks, and the tools were coded. These have been discussed below:
i. Study design
Based on deliberations during the inception meeting and findings from the reconnaissance visits, the study employed a Randomized Control Trial (RCT) study design. Respondents were randomly allocated to either experimental or control groups to establish the viability of the decentralized kiosk models and their potential social impacts. An equal number of households were targeted from both the experimental group (those that obtain water from the kiosk) and the control group (those that do not obtain water from the kiosk)
Sample population (per site/kiosk) n=x
Outcome (technical and business performance, social impact)
Outcome (impact)
Where n represents the sample size calculated as indicated in the subsequent section.
Annexes 116
Figure 54:
A representation of the RCT study design
Group 1 - Experimental (Obtaining water from the kiosk) n-(x/2)
Group 2 - Control (obtaining water elsewhere) n=(x/2)
ii. Sample size calculation
Upon deliberations and additional information obtained during the reconnaissance field visits, the sample size was decided on in light of two main considerations, i) representativeness and ii) the budget availability.
The six sites depict various dynamics in lieu of their settings (peri-urban, rural, and urban informal settlements). In consultation with the Siemens Stiftung team, EED-A opted to get a reliable, allowable number of at least 30 interviews.89 Consequently, from each group, a minimum of 30 respondents were targeted giving a total sample size of 60 households per site (Total=360). However, due to the varying population density across the six sites, two sites were oversampled. Kangemi was oversampled by 20 and Wath Ong’er by 30. This gives a total sample size of n= 460.
The table below outlines the sample distribution across the six sites.
In addition to the household surveys, 10 businesses that benefit directly from the Safe Water Enterprise program were interviewed. The water vendors were included as part of the business interviewees. The businesses to be interviewed were randomly selected onsite in consultation with kiosk management and operators. The table below highlights the categories of businesses that were targeted during this study.
Annexes 117
Table 29:
Sample distribution
Table 30:
A non-exhaustive list of businesses Interviewed
89 Dalenius, T. (1964).
# County Name of kiosk Number of respondents Experimental group Control group 1 Nairobi Kangemi resource center, Kangemi informal settlement 50 50 2 Murang’a Maragua market 30 30 3 Kiambu Ngoliba health centre 30 30 4 Kisumu Korumba Community water project 30 30 5 Kisumu Sondu water project 30 30 6 Migori Wath Ong’er water project 60 60 Total 230 230
William G. Cochran, Sampling Techniques. The Annals of Mathematical Statistics, 35(3), 1381-1382.
# Description of sites 1 Retail shops that use water for cleaning 2 Water vendors (either using bikes, tuk-tuks, carts, etc.) 3 Hotels/Kibandaski/restaurant
Individual vendors especially those operating on market days in areas where the kiosks exist in a peri-urban area
4
iii. Coding of household, business/vendors questionnaire, and observation checklist
The household and business surveys were administered through computer aided personal interviewing (CAPI) using the ODK collect platform. The data collection tools were developed, reviewed, finalized, and coded in English. Further, minor modifications were made to the tool during the pre-test before the actual data collection began. The ODK Collect data platform was prepared for the real-time submission of data. All the questionnaires were uploaded onto Android-based tablets.
iv. Survey implementation
Each kiosk was built to serve the immediate population estimated in the feasibility studies. Using the household population density updated after the 2019 Kenya National and Housing Census and satellite imagery, EED-A mapped out the residential areas around the kiosks. A geospatial technique was employed to randomly identify households from these areas. The enumerators were taught to coordinate such that they interview at least 30 Maji Safi kiosk users (experimental group) and 30 non-users (control group) per site and oversample as guided in Kangemi and Wath Ong’er. This strategy meant that everyone in the area who was targeted by the kiosk had an equal chance of being part of the study.
These pre-selected households were pre-loaded onto the SW maps platform. SW Map is an Android-based geospatial application that allows real-time navigation using GPS and the Global Navigation Satellite System (GLONASS). EED-A has used this tool in multiple surveys in the past to help enumerators navigate their way within the enumeration areas. Each household was labeled with a unique number for ease of identification by the enumerators. A demonstration of SW maps is provided in the figure below. The red icon represents the location of the kiosk while the yellow icons represent the preselected households. Further, the blue line represents the boundary of the enumeration area.
Annexes 118

Enumerators captured household geo-coordinates during the interview process using Survey CTO collect to an accuracy of between four and 12 meters. All enumerators were encouraged to aim for an accuracy of four meters. These geo-coordinates were compared against the pre-selected coordinates to ensure that enumerators visited the correct households. The verification process is conducted in real-time by the data verification team while the enumerators are in the field so that enumerators interviewing wrong households can be called and corrected.
Figure 55:
SWP map interface for the Sondu kiosk
Annexes 119
v. Preparation of training manuals
The field data collection team included the enumerators and local supervisors working under the coordination and supervision of the core EED-A team. The EED supervisory team ensured that the target number of interviews was met within the stated timelines while maintaining the quality of the outputs. An enumerator and supervisor’s training manual 90 was developed to guide the training, data collection, and quality control processes under this exercise.
Field data collection
The data collection exercise was conducted simultaneously across the six sites between September 6th and 10th, 2023. Various activities took place to enable the data collection. Among these were i) recruitment and training of the local supervisors and the enumerators, ii) pre-testing and finalizing the survey instruments, and iii) data collection and quality control process.
Pretesting of tools
Recruitment and training of enumerators Data collection
• All enumerators (main and backup) were recruited from the EED-A database for each of the County kiosk sites.
• The enumerators were trained on the objectives of the assignment, how to conduct the household surveys, the questions in the observation checklist, etiquette, and ethics of data collection, and emergency and quality control protocols.
• The pretest was conducted outside the enumeration area.
• The pretesting of the data collection was conducted on the second day of fieldwork (8/9/2023)
• This exercise was used to gauge the flow of the questions and identify any outliers.
• Based on the findings from the pretest - the tools were modified accordingly.
• The data collection was conducted on the third and 4th day of fieldwork.
• During the same period, the EED-A team were able to conduct interviews with the kiosk management and operators.
• The EED-A also administered the observation checklist.
• Enumerators and supervisors were tasked to interview households and conduct business interviews respectively.
Annexes 120
Figure 56: Field data collection activities
Data cleaning and analysis
Data cleaning
Primary data was collected and transmitted electronically to the ODK Cloud server. These were then downloaded and cleaned before the commencement of the analysis. The cleaning process aimed to identify typos, outliers, incorrect inputs, omissions, data anonymization, translation, transcription, audio review, and transcript review in line with the nature of the data collected.
Qualitative data analysis
All the audio recordings and notes taken from the Key Informant Interviews (KIIs) were uploaded into a secure folder in preparation for the transcription process. Thereafter, a data analyst examined the KII guides and developed a Standard Operation Procedure (SOP) for the transcription of the audio. The transcripts were reviewed to ensure the quality standard of the transcription was met. Thereafter a master code/ codebook for analysis based on the themes subthemes was developed as highlighted below. The data was analyzed using NVivo software. This software is used to organize and analyze qualitative data to identify themes and uses visualization tools to uncover richer insights
# Stakeholder
1 Kiosk operators and committees
Thematic Areas
Technical and business KPIs
Social impact KPIs
Best practices
Success factors
Challenges and weaknesses of the model
Lessons learned and recommendations
2 County Water Department/ WSP representatives
3 Project Implementation partners including KWAHO
4 SWE project implementation team (SkyJuice Foundation and Siemens Stiftung)
5 Subject matter authorities (experts and consultants)
Water access status
Water service provision
Water access challenges
Plans and strategies
Social Impact
Social Innovation
Best Practices
Success Factors
Challenges and weaknesses of the model
Lessons learned and recommendations
Project innovation
Best practices and success factors
Challenges and weaknesses of the model
Lessons learned and recommendations
Best practices and success factors
Challenges and weaknesses of the model
Lessons learned and recommendations
Annexes 121
Table 31: Contents of the thematic analysis
Quantitative data analysis
Quantitative data analysis was conducted mainly in Stata statistical software and was targeted at addressing the objectives of this study. Descriptive statistics and predictive models were deployed to extract more insights from the data. The categorical findings were presented in tables, charts, and graphs, while the numerical data was presented as mean, median, minimum, maximum, and standard deviation. The quantitative analysis involved assessing the financial records obtained from the field and some of the information obtained from the key informant interviews.
i. Determination of cost
A determination of the core costs needed to run the water kiosk with a special focus on operation and maintenance costs, was established. These costs included electricity or fuel, chemicals, materials, and overheads. In relation to the costs, the reserves mainly set aside for emergencies, capital expenditures, or other critical financial needs were reviewed.
ii. Determination of revenue
Both operating and non-operating revenue was established through interviewing the kiosk owners and operators. These included sales records and operation expenses incurred by the kiosk monthly. A decision tree was adopted to aid the financial analysis.
2 kiosks
4 kiosks
Compounded annual growth
Sales volume & customer growth
Estimated revenue & cost analysis
Compounded annual growth
Sales volume & customer growth
Net benefits/ losses
Forecasting ability, value for investment and historical trends
Positive/ Negative trends
Net benefits/ losses
Forecasting ability, value for investment and historical trends
Positive/Negative trends
Revenue & cost analysis
Annexes 122
Figure 57:
have financial data?
A decision tree for the financial analysis Does
the kiosk
Yes: Stored in a digital system Yes: Records available in soft and hard copy
In addition, a demand analysis was conducted to determine: the quantity of water demanded, the quantity of water produced, the kiosk’s production capacity, and the current pricing for the water being produced and sold. The demand analysis was enriched through the KIIs that sought to gain more insight into consumption levels, water usage, and capacity needs.
iii. Determination of the net financial benefits/surplus
Consideration, of whether the water kiosk was generating a financial benefit and surplus, was determined upon review of the sales records. A positive or surplus financial benefit meant that the water kiosk was generating revenues that were sufficient to cover the operation and maintenance expenses. A water system was considered self-sustaining if it was also able to cover all its capital expenditure requirements.
Determining scalability and sustainability of the kiosks
To determine scalability and sustainability, emphasis was laid on key variables whose outcome would inform the recommendations to the Siemens Stiftung. To further understand how sustainable, the kiosks are, the variables were classified to answer three main sustainability aspects. The aspects and respective variables are highlighted in Figure 16 below.
Financial sustainability
• Customer growth trends
• Sales/Revenue trends
• Sources of revenue
• Kiosk infrastructure and maintenance Waterkiosk
Social sustainability
• Customer perception
• Businesses and vendors perspective on the kiosk
Environmental & technical sustainability
• Type of water source
• Quality of water
Annexes 123
Figure 58:
A decision tree for the financial analysis
The sustainability indicators informed the scalability in three ways: the financial standing of the kiosks, customer growth trends, and the social standing of the kiosks based on customer perception.
Overall project performance analysis
In assessing the overall performance of the project, EED-A employed the Organisation for Economic Co-operation and Development (OECD) criteria for monitoring and evaluation. This entailed an assessment of the results achieved relative to the set targets in the project TOC log frame. The objective of the evaluation is to assess the project implementation successes and milestones by investigating the project's relevance, effectiveness, efficiency, sustainability, and impact drawn from the OECD criteria. These criteria are used to provide a framework for determining the merits of a policy, strategy, program, or project intervention.91 The figure below highlights the six criteria and the sample aspects of evaluation customized to reflect the SWE project. 91
RELEVANCE
• To what extent are the objectives of the project valid?
• Are the outputs of the project consistent with the overall goal of the development organization?
• Are outputs of the project aligned with the expected impacts?
SUSTAINABILITY
• To what extent are the benefits of the project expected to continue after development funding is stopped?
• What are the major factors influencing the achievement or non achievement of sustainability of the project?
IMPACT
• What happened as a result of the project?
• What difference has the activity made to beneficiaries?
• How many people have been affected?
COHERENCE
• Is the SWE intervention consistent with other interventions by Siemens Stiftung?
• To what extent is the SWE model interlinked with other actors’ interventions in the project sites?
EFFECTIVENESS
• To what extent were the objectives achieved or likely to be achieved?
• What are the factors influencing the achievement of the objectives?
EFFICIENCY
• Were activities cost efficient?
• Were objectives achieved on time?
• Was the project implemented in the most efficient way compared to alternatives?
Annexes 124
OECD, (2023). Evaluation Criteria. Retrieved from https:// www.oecd.org/dac/evaluation/
opmentassistance.htm#relevance-block
daccriteriaforevaluatingdevel-
Figure 59:
Application of OECD Criteria to Synthesize Project Findings
To conclude on the SWE project performance, a traffic light system was adopted to rate the water kiosk models’ technical, financial, and social impact performance against the project targets, highlighting areas that require attention for future improvement. The figure below illustrates how this system was utilized to rate progress.
Figure 60:
RED
Project targets not achieved
AMBER
Project targets partially achieved
GREEN
Project targets achieved

Annexes 125
Illustration of the RAG rating system
Annex 4
Individual kiosk profiles
A. Kangemi resource centre, Kangemi informal settlement, Nairobi County
Kangemi resource centre (KRC) is a two-person operation, with an operator and attendant manning the kiosk. The kiosk has four above-ground water tanks (one 4,000 litres and two 1,000 litres) dealing with Nairobi Water and two other above-ground tanks (5,000 litres) dealing with borehole water, as well as two underground tanks for borehole water (29,000 litres). The community primarily relies on water vendors, to supply water from their facilities. The cost of water is Ksh. 30 for Nairobi Water and Ksh. 5 for borehole water, paid in cash or via Mpesa. Maintenance for the units is done every three months.
Category Description
Year of establishment
Ownership structure
Implementing partners and roles
Main sources of water in the community
Location of the water kiosk
Population of the surrounding community
Technical setup of the water kiosk
• Built in 2014
• Decals on Kiosk renewed in February 2022
• Kangemi resource centre (KRC)
• KRC is responsible for day-to-day operations.
• Siemens Stiftung consults on operations and maintenance, repairs, and provides technical support, if required.
• SkyJuice Foundation provided the filtration system.
• Nairobi Water and Sewerage Company and a borehole
• Kangemi resource centre (KRC), Nairobi County, Kangemi Sub-County, Kangemi Location, Gichagi Sub-Location
• 11,472 households
• KRC invested in storage tanks, and these tanks have a collective capacity of holding up to 50m3 of water.
• The kiosk is equipped with a single ultrafiltration system, which can purify an average of 1m3 of water per hour. Kiosk management
• The water kiosk is managed by KRC with overall oversight by a project manager.
• The project manager is supported by an administrator/ accountant who handles financial and administrative aspects.
• The day-to-day operations of the kiosk are supervised by one full-time kiosk operator.
• The kiosk operator reports to both the project manager and the administrator/accountant, ensuring smooth coordination of activities.
Licenses/permits
• Holds a business license issued by Nairobi County Government.
• Possesses a water abstraction permit granted by the Water Resource Authority (WRA).
• Expected to sign a service provision agreement with Nairobi Water and Sanitation Company to authorize the sale and supply of water.
Annexes 126
Table 32:
Kangemi resource centre kiosk profile
B. Ngoliba Health Centre, Kiambu County
This water kiosk is managed by one operator with six years of experience. Customers, including water vendors and community members, count between 50 to 100 per day. Water is sold at KES 10 per 20-litres jerrican, generating daily revenues ranging from KES 2000 to 2500. Payments are made in cash and Mpesa, with tokens generated by the operator. Additional income is generated from selling 20-litres water jerricans. There are occasional electricity outages, but a generator ensures water pumping for treatment during such times.
Category Description
Year of establishment
Ownership structure
• 2014
• Connected with a dedicated pipeline from Thika river in 2019
• Owned by Ngoliba health centre Implementing partners and roles
Main sources of water in the community
Location of the water kiosk
Population of the surrounding community
Technical setup of the water kiosk
• Siemens Stiftung
• Thika river
• Thika East Sub-county, Ngoliba location in Ngoliba sub-location.
• 4,812 households
• Raw water is sourced from the Thika River.
• A 2km pipeline was installed in 2018 to transport the raw water from the river to the kiosk.
• The kiosk is outfitted with two ultrafiltration systems known as sky hydrants.
• These ultrafiltration systems can purify up to 1,500 liters of water per hour.
• The kiosk has substantial storage capacity, including 11,000 liters of storage tanks for raw water.
• Additionally, there are 6,000 liters of storage tanks dedicated to safe drinking water.
Kiosk management
Licenses/permits
• The kiosk is managed by a Board of Management (BOM).
• The BOM also manages the hospital in the area.
• Members of the BOM are elected by the community, representing various villages around Ngoliba.
• The BOM consists of community representatives.
• The chair of the BOM, along with the doctor in charge of the hospital, actively oversees the management of the kiosk.
• The doctor in charge of the hospital also serves as the secretary to the BOM.
• N/A
Table 33:
Ngoliba health centre kiosk profile
Annexes 127
C. Maragua market, Murang’a County
This water kiosk is managed by one main operator with two years of experience, assisted by a temporary worker who comes in on weekends. Customer numbers vary, around 200 during dry seasons and 100 during wet seasons per day. Water is sold at KES 10 per unit, with payment options including cash and Mpesa paybill. The kiosk generates revenue from water sales, operating a washroom, and selling water jerricans.
Category
Year of establishment
Ownership structure
Implementing partners and roles
Main sources of water in the community
Location of the water kiosk
Population of the surrounding community
Technical setup of the water kiosk
Description
• Built in 2014
• 2 Skyhydrant filters installed in 2014.
• Both Filter Membranes replaced in Nov 2022
• Started as a Community-Based Organization (CBO) with an 8-member committee.
• Now operating as Korumba Water Association since 2023
• Committee leadership consists of a Chairman, Secretary, and Treasurer.
• Siemens Stiftung, KWAHO
• MUSWASCO
• Murang’a County, Maragwa Sub-County, Nginda Location in Rurago Sub-Location
• 3,344 households
• The water kiosk is managed by a Community-Based Organization (CBO) consisting of 14 members.
• The CBO elects officials to oversee the organization's management for a term of three years.
• These officials typically include a chairman, secretary, and treasurer.
• The day-to-day operations of the water kiosk are carried out by the kiosk operator.
• The kiosk operator operates under the supervision and guidance of the CBO's executive committee.
Kiosk management
• SWAP up to 2018 then local CBO since Licenses/permits
• N/A
Table 34:
Annexes 128
Maragua market kiosk profile
D. Korumba, Kisumu County
This water kiosk is operated by a single individual with eight months of experience. The kiosk has five water tanks of various sizes and four pumps, all powered by Kenya Power and Lighting Company (KPLC) with a post-paid meter. Operating daily for 12.5 hours with service hours mainly in the early morning and late evening, the kiosk primarily serves students from RIAT College, with around 200 customers per day. Water is sold at KES 5 per unit and payments are made in cash.
Category Description
Year of establishment
Ownership structure
Implementing partners and roles
Main sources of water in the community
Location of the water kiosk
Population of the surrounding community
Technical setup of the water kiosk
• 2015
• The water kiosk is owned by the Korumba Development Group, which operates as a Community-Based Organization (CBO).
• The Korumba Development Group consists of 60 members who are part of the community
• Siemens Siftung, SOS CV-Kisumu, Kisumu County Government, KWAHO
• Korumba SWE
• Kisumu West Sub-county, East Kisumu Location, and Dago Sub-location
• 1,777 households
• The kiosk is supplied with water from a borehole, initially drilled and equipped by the municipal council.
• The borehole has been a reliable source of water for the community, except during drought seasons when it may not meet the demand.
• To purify the borehole water, the kiosk is equipped with an ultrafiltration system, specifically the SkyHydrant system.
• Storage capacity includes 14,000 liters of raw water and 6,000 liters of safe drinking water.
• Customers collect water directly from the kiosk using jerricans.
• A few water vendors also utilize the kiosk as a source for resale, typically using motorbikes for transportation. Kiosk management
• Started as a Community-Based Organization (CBO) comprising 60 members; now registered as Korumba Water Users Association (KWUA)
• 12 officials are elected to oversee CBO activities.
• The executive committee is composed of a Chairman, Secretary, Treasurer, and Internal Auditor.
Licenses/permits
• The kiosk has a business license from the Kisumu County Government.
• They possess a water abstraction permit issued by the Water Resource Authority (WRA).
• They are seeking to sign a service provision agreement with Kisumu Water and Sanitation Company.
Table 35: Korumba kiosk profile
Annexes 129
E. Sondu, Kisumu County
Operated by a single individual with two years of experience, this water kiosk sometimes needs assistance from the operator's wife. Operating daily in the dry season and weekly in the wet season, the kiosk serves the entire area due to inconsistent tap water supply. During the dry season, they cater to around 100 clients daily, dropping to 15 during the wet season. Water is sold at KES 5 per unit and payments are made in cash, though Mpesa is also accepted.
36:
Category
Year of establishment
Ownership structure
Implementing partners and roles
Main sources of water in the community
Location of the water kiosk
Population of the surrounding community
Technical setup of the water kiosk
Description
• 2017
• Sondu Maji Safi CBO
• Siemens Stiftung, SWAP, KWAHO
• River Sondu, shallow wells, water kiosk by Nyanas WSP, Maji Safi Kiosk, and water harvesting
• Sondu town
• 2,846 households
• Uses an electric pump
• Has 1 ultrafiltration system (Skyhydrant)
• Filtration capacity is about 700 liters per hour
• Safe drinking water storage tank is 6,000 liters
• Raw water storage tank is 5,000 liters Kiosk management
• SWAP up to 2018 then local CBO since Licenses/permits
• Business license from Kisumu County Government.
• Water abstraction permit from the Water Resource Authority (WRA).
• Sign a service provision agreement with Nyakach Water and Sanitation Company (Nyakach WSC) upon registration as a Water Users Association (WUA).
Table
Sondu kiosk profile
Annexes 130
F. Wath Ong’er, Migori County
The water kiosk has been operated by two attendants since 2019, primarily responsible for issuing water and maintaining cleanliness. The two attendants alongside CBO members have received adequate training on kiosk operation and filtration technology, but not on business planning, budgeting, or customer relations. The main water source is river Kuja, with no alternative source. Regular water testing records are stored in the Water ATM documentation. The kiosk operates 24/7 for token holders, while non-token holders need to call for service. Customers include domestic and commercial users, with pricing at KES 5 per 20-litre jerrican.
Category Description
Year of establishment
Ownership structure
Implementing partners and roles
Main sources of water in the community
Location of the water kiosk
Population of the surrounding community
Technical setup of the water kiosk
• 2019
• Is owned by the local CBO
• Siemens Stiftung and Lake Victoria Aids Support Organization (LAVISO), KWAHO
• River Kuja, rainwater harvesting, and shallow wells
• Nyatike Sub-county, God Bondo Lower Kanyarwanda Location in West Kanyarwanda Sub-location
• 1,828 households
• An electric pump is used to transport the water to the kiosk, located approximately one kilometer away.
• The kiosk is equipped with three ultrafiltration systems known as Skyhydrants.
• These Skyhydrants collectively have a filtration capacity of approximately 2,100 litres per hour.
• The kiosk has a raw water storage tank with a capacity of 11,000 litres.
• Additionally, there is a storage tank for safe drinking water with a capacity of 6,000 litres.
Kiosk management
Licenses/permits
• Managed by the Lower Nyatike Water Users Association comprising 25 members
• Obtain a business license from the Migori County Government.
• Secure a water abstraction permit from the Water Resource Authority (WRA).
Table 37:
Wath Ong'er kiosk profile
Annexes 131
ANNEX 5: HOUSEHOLD QUESTIONNAIRE
ANNEX 6: KEY INFORMANT INTERVIEW GUIDES
ANNEX 7: BUSINESS QUESTIONNAIRE
ANNEX 8: OBSERVATION CHECKLIST
ANNEX 9: DATA QUALITY CONTROL PROTOCOL
ANNEX 10: ENUMERATORS & SUPERVISORS’ TRAINING MANUAL
Annexes 132

80801 Munich Germany
Siemens Stiftung
Kaiserstrasse 16
siemens-stiftung.org
