

The Journal of Sport and Exercise Science, Vol. 9, Issue 2, 1-7 (2025)
www.jses.net
Repeatability of tidal expiratory flow limitation during peak exercise
Ryan
Welch1,2*, John Kolbe1, Kevin Ellyett1,2
1Department of Medicine, The University of Auckland, New Zealand
2Respiratory Department, Te Whatu Ora Te Toka Tumai Auckland, New Zealand
A R T I C L E I N F O A B S T R A C T
Received: 05.03.2025
Accepted: 19.05.2025
Online: 31.10.2025
Keywords:
Exercise
Reproducibility
Ventilatory patterns
1. Introduction
ISSN: 2703-240X
The presence and degree of tidal expiratory flow limitation (EFLT) during exercise are usually determined from single observations and it is assumed that EFLT is a repeatable phenomenon. This study aimed to determine the repeatability of the presence and degree of EFLT and breathing patterns during peak exercise in healthy, young, athletic subjects. Fifteen subjects (9 males, 6 females; mean age of 23 ± 3 years) completed two maximal cardiopulmonary exercise tests (CPET) seven days apart. Coefficient of variation (CoV) were calculated for continuous variables and the Cohen’s kappacoefficientwasdetermined for the presence of EFLT. There were no significant differences in CPET variables between visits. The presence or absence of EFLT agreed in 14 out of 15 subjects (Cohen’s kappa coefficient = 0.76, p = 0.007, indicating moderate agreement). The degree of EFLT showed high variability (CoV = 32.9%). Variability was low (CoV ranged between 2.8–6.1%) for end-inspiratory lung volume, tidal volume (VT), VT relative to forced vital capacity, inspiratory capacity, breathing frequency, and for end-expiratory lung volume the CoV = 10.9%. In conclusion, the presence or absence of EFLT showed good agreement and breathing patterns are highly repeatable observations in healthy subjects during peak exercise suggesting that reliable inferences can be made from single observations.
Tidal expiratory flow limitation (EFLT) occurs at a given lung volume when maximal flow is achieved and cannot be increased irrespective of increased expiratory effort. EFLT is the consequence of ventilatory demand (determined by minute ventilation and breathing patterns) approaching and/or reaching ventilatory capacity (determined by lung volumes and expiratory flows) (Molgat-Seon, Dominelli, Peters, Kipp, Welch, Parmar, Rabbani, Mann, Grift, Guenette, & Sheel, 2022). During peak exercise, EFLT has been linked with increased end-expiratory and end-inspiratory lung volumes, shifting the tidal breath towards total lung capacity and the steeper portion of the pressure-flow curve (Pellegrino, Brusasco, Rodarte, & Babb, 1993), greater respiratorymusclework (Dominelli,Render,Molgat‐Seon, Foster, Romer, & Sheel, 2015), and exercise-induced arterial hypoxemia (Derchak, Stager, Tanner, & Chapman, 2000; Dominelli, Foster, Dominelli, Henderson, Koehle, McKenzie, & Sheel, 2013). The identification and quantification of EFLT during exercise provides
valuable information regarding mechanical ventilatory limitation during exercise for both clinical and research purposes. The presence or absence and degree of EFLT during exercise are usually determined from a single observation and assumes that EFLT is a repeatable phenomenon (Molgat-Seon et al., 2022).
The tidal breath overlap method is commonly used to identify and quantify EFLT (Johnson, Weisman, Zeballos, & Beck, 1999)
Briefly, the FVC loop, obtained either pre or at one-minute post exercise, is the reference flow-volume loop and is considered to represent one’s maximal breathingboundary. Duringexercise, the tidal breaths are recorded, and an inspiratory capacity (IC) manoeuvre is performed. The IC manoeuvre is used to position the tidal breath within the FVC loop and EFLT is inferred if the tidal breath intersects the forced vital capacity (FVC) flowvolume loop (Johnson et al, 1999). While simple and feasible, the primary limitation of this technique is concerned with accurately defining the FVC loop boundary, which may be affected by exercise-induced bronchoconstriction or bronchodilation, and thoracic gas compression (Guenette, Dominelli, Reeve, Durkin,
*Corresponding Author: Ryan Welch, Department of Medicine, The University of Auckland, New Zealand, RWelch@adhb.govt.nz
Eves, & Sheel, 2010). Additionally, this method compares physiologically different flow-volume loops (i.e., tidal breath and FVC), which differ in lung mechanics, the sequential emptying of lung regions with different time-constants, and the volume and time history of lung parenchyma and airways from the preceding breath (Green & Mead, 1974). In recognition of these limitations, we developed a modification of the tidal breath overlap method using vector-based analysis (VBA), which quantifies the conformity of the tidal breath to the FVC loop (Welch, Francis, Babbage, Lardenoye, Kolbe, & Ellyett, 2021). We consider EFLT as present when the tidal breath tracks parallel and conforms to the trajectory of the FVC loop due to the two-independent flowvolume loops experiencing the same expiratory flow-limiting conditions. The VBA method addresses many of the limitations of the tidal breath overlap method by relieving the FVC flowvolume loop of its role in determining the upper boundary for expiratory flow and rather uses the FVC flow-volume loop to establish a flow limited contour (Welch et al., 2021).
The test-retest repeatability of a limited number of cardiopulmonary exercise test (CPET) variables have been assessed in healthy subjects (Bingisser, Kaplan, Scherer, Russi, & Bloch, 1997; Covey, Larson, Alex, Wirtz, & Langbein, 1999; Decato, Bradley, Wilson, & Hegewald, 2018; Garrard & Emmons, 1986; Nordrehaug, Danielsen, Stangeland, Rosland, & Vik-Mo, 1991; Skinner, Wilmore, Jaskolska, Jaskolski, Daw, Rice, Gagnon, Wilmore, Rao, & Bouchard 1999). In a cohort of healthy subjectsDecatoetal(2018)reported lowco-efficientofvariations (CoV) at peak exercise for workload (2.7%), exercise duration (2.7%), peak oxygen uptake (VO2peak) (4.9%), minute ventilation (VEpeak) (7.4%), heart rate (HR) (1.8%), oxygen pulse (4.6%), and systolic (7.2%) and diastolic (10.5%) blood pressures (Decato et al, 2018). More recently, in a cohort of healthy adults, Dunsford et al (2024) found that the repeatability of EFLT at peak exercise when expressed as a binary variable was ‘minimal’ (Cohen’s kappa coefficient = 0.337) and ‘poor’ when expressed as a continuous variable (intraclass correlation coefficient = 0.338; Dunsford, Dhaliwal, Grift, Pryce, Dominelli, & Molgat‐Seon, 2024). Collectively these studies suggest low variability of markers of peak exercise capacity and cardiac response; however, the test-retest repeatability of the presence or absence of EFLT and breathing patterns is poorly understood (Molgat-Seon et al., 2022)
The primary aim of this study was to determine the repeatability of the presence and degree of EFLT during peak exercise in healthy, young, athletic subjects. Based on the repeatability of other CPET variables, we hypothesized high repeatability of the presence or absence of EFLT.
2. Methods
2.1.
Participants
Healthy subjects aged 20–30 years who were participating in a concurrent study investigating breathing patterns during exercise were invited to participate in this test-retest repeatability study. Participants were physically fit, healthy, active, non-smokers, none-cigarettes users and participated in at least 4 hours of organised physical activity/sport per week. Subjects were required to have a body mass index (BMI) < 95th percentile adjusted for age. Subjects
completed a screening questionnaire and were excluded if they had known respiratory, metabolic, cardiovascular, or musculoskeletal comorbidities that may limit exercise performance. Individuals receiving current inhaled therapy for asthma were excluded; however, subjects with a past diagnosis of asthma from a general practitioner based on self-reported symptoms were included.
2.2. Ethics
Institutional approval from the Auckland District Health Board research review committee (A+8144) and ethics approval from the Health and Disability Ethics Committees (18/NTB/94) were obtained. Subjects provided written informed consent.
2.3. Protocol
Subjects attended two study visits, at the same time of the day, seven days apart. Before each study visit subjects were asked to refrain from performing vigorous activity within two-days and avoid heavy meals or caffeine within two-hours prior to testing. On each occasion tests were performed in the following order: baseline spirometry, a maximal CPET, and spirometry at one-minute postexercise.Alltestswereperformedinintheafternoonbetween4and 7 pm, in an air-conditioned respiratory physiology laboratory 70 m above sea level. Ambient conditions were maintained at a temperature of 22 ± 1.5 degrees Celsius and 50 ± 10% humidity.
2.4. Spirometry
Spirometry was performed using a digital volume transducer turbine (Vyaire Medcial, Vyntus CPX system) in the seated position via a mouthpiece (SureGard filter, Bird Healthcare) whilst wearing a nose peg (Grip Nose Clips, Bird Healthcare) in accordance with the American Thoracic Society/European Respiratory Society guidelines (Graham, Steenbruggen, Miller, Barjaktarevic, Cooper, Hall, Hallstrand, Kaminsky, McCarthy, McCormack, Oropez, Rosenfeld, Stanojevic, Swanney, & Thompson, 2019). Z-scores were determined by the global lung initiative reference equations (Quanjer, Stanojevic, Cole, Baur, Hall, Culver, Enright, Hankinson, Ip, Zheng, & Stocks, 2012).
2.5. Cardiopulmonary exercise test
Subjects performed a maximal CPET to volitional exhaustion using a stepped standardised exponential exercise protocol (STEEP) on a cycle ergometer (Ergoline Via Sprint 150p) (Northridge et al., 1990). The protocol was identical for each study visit and began with a 3-minute baseline period to collect resting data (Northridge, Grant, Ford, Christie, McLenachan, Connelly, McMurray, Ray, Henderson, & Dargie, 1990) Followed by stepped stages, one-minute in duration, initially starting at a relatively low workload of two metabolic equivalents of task (VO2 = 7 mL·min-1·kg-1) and increasing by 15% of the previous stage every minute as determined by body weight (Northridge et al., 1990). Stepped protocols are recommended over ramped protocols when studying EFLT as they allow the subject to establish a stable breathing pattern after each increase in workload (Johnson et al, 1999)
Breath-by-breath data were obtained by a Vyntus CPX metabolic cart (Vyaire Medical, SentrySuite software, CareFusion) via a facemask held in place by a head strap (Hans Rudolph 7450 series V2 mask) and averaged over 8 breaths. Cadence was selfselected however the CPET was stopped if the subject could not maintain a cadence of 50 rpm. Peak exercise data were averaged over the final 30 seconds of exercise.
2.6. EFLT analysis
The FVC flow-volume loop obtained at one-minute post exercise was used for the reference loop for EFLT analysis. IC manoeuvres were performed to determine the placement of the tidal flowvolume loop within the reference FVC loop. IC manoeuvres were practiced during baseline and were performed each minute after 80% of target heart rate was achieved: this ensured that EFLT analysis could be performed within the last minute of exercise. The average of the ten tidal breaths prior to the IC manoeuvre were used to digitally construct the reference tidal flow-volume loop.
EFLT was determined by the vector-based analysis technique describedbyWelchetal(2021).Usingbespokesoftwaredeveloped in LabView (National Instruments, Austin Texas, USA) the flow reserve vector (FRV; measure of how close the tidal breath is to the FVC loop) and the tangential angle (quantifies the conformity of the tidal breath to the FVC loop) were determined. The VBA technique infers the presence of EFLT as a segment of the tidal breath that demonstrates the same expiratory flow limiting conditionsbyconformingtothetrajectoryofthe FVCflow-volume loop (Welch et al., 2021). The VBA technique defines the presence of EFLT as a segment of the tidal breath where FRV is < 0.2 and tangential angle is within ± 18 degrees for ≥ 5% of the tidal breath (Welch et al., 2021). The degree of EFLT was quantified as the percent of the tidal breath fulfilling these criteria.
2.7. Breathing patterns
The IC was subtracted from FVC to determine end-expiratory lung volume (EELV), and inspiratory reserve volume was subtracted from FVC to determine end-inspiratory lung volume (EILV). EELV and EILV were presented as a percentage of FVC.
2.8. Statistics
Subject demographics and lung function data presented as mean and standarddeviation.CPETdatapresentedasmean±SDandrangefor each test. The paired Student’s t-test compared the group means between visits. Coefficient of variation was calculated as the withinsubjectSDdividedbythewithin-subjectmeanmultipliedby100:the group mean CoV was presented (Keteyian, Brawner, Ehrman, Ivanhoe, Boehmer, & Abraham, 2010). The Cohen’s kappa coefficient was determined for the presence of EFLT between visits. AsproposedbyMcHugh(2012)thestrengthoftheagreementforthe Cohen’s kappa coefficient were classified as: 0.00–0.20 = none; 0.21–0.39 = minimal; 0.40–0.59 = weak; 0.60–0.79 = moderate; 0.80–0.90 = strong; and > 0.91 = almost perfect (Landis & Koch, 1977; McHugh, 2012). Alpha level was set at 0.050.
3. Results
Fifteensubjects(9males,6females;meanageof23±3years; BMI of 22.9 ± 2.1) completed this study. Subjects exercised for an averageof7(range4–12)hoursperweekon5(range2–7)daysper week. Forced expired volume within one second (FEV1), FVC, and FEV1/FVC z-scores were within the normal range for all subjects. The mean days between CPETs were 7 ± 1 days. All CPETs were deemed maximal as subjects achieved a respiratory exchange ratio > 1.1; > 85% maximum predicted HR; and > 85% predicted VO2peak. All subjects stated leg fatigue as the main reason for stopping the CPET. There were no statistically significant differences for any CPET variables between CPET1 and CPET2 (Table 1 and Table 2). The repeatability of markers of peak exercise capacity and cardiac response were high, with CoV ranging between 1.3–5.3% (Table 1).
DuringCPET1, n =13subjectsdemonstrated EFLT andduring CPET2 n = 12 of these subjects again demonstrated EFLT (Table 2). One subject was classified as demonstrating EFLT over 32% of the tidal breath during CPET1 but did not demonstrate EFLT during CPET2, and two subjects did not demonstrate EFLT at either visit. The presence or the absence of EFLT agreed in n = 14 out of 15 subjects with a Cohen’s kappa coefficient of 0.76 indicating ‘moderate’ agreement (Figure 1).
CPET 1
(range)
Note: VO2peak, peak oxygen uptake; HR, heart rate; RER, respiratory exchange ratio; VEpeak, minute ventilation; VE/VCO2, ventilatory equivalent for CO2; VE/VO2, ventilatory equivalent for O2; PetCO2, end tidal partial pressure of carbon dioxide; PetO2, end tidal partial pressure of oxygen.
Table 2: Repeatability of ventilatory response during peak exercise.
Note: EFLT (%VT), degree of tidal expiratory flow limitation as a percent of tidal volume; EELV (%FVC), end expiratory lung volume as a percent of forced vital capacity; EILV (%FVC), end inspiratory lung volume as a percent of forced vital capacity; VT/FVC, tidal volume as a percent of forced vital capacity; IC, inspiratory capacity; VT, tidal volume; RR, respiratory rate.
Figure 1: Expiratory flow limited segment. The figures plot the group average FVC loop (solid black line) and peak exercise tidal breath (black dotted line) for visit 1 (left column) and visit 2 (right column). The thick red in each figure indicates the proportion of the tidal breath that is classified as demonstrating EFLT using our vector-based analysis technique (i.e., FRV < 0.2 and tangential angle within ± 18°). Visit 1
On average, there was no difference in the degree of EFLT between CPET1 and CPET 2 (33 ± 23 vs 35 ± 28 % of VT, p = 0.572) (Table 2 and Figure 2). The CoV for the degree of EFLT was 32.9%. The CoV were low and ranged between (2.8–6.1%) for EILV, IC, VT, VT/FVC and respiratory rate, and the CoV was higher for EELV (10.9%) (Table 2).
Figure 2: Degree of EFLT. Note: This figure illustrates the high within subject variability of the degree of EFLT between CPET 1 and CPET 2. The grey dashed lines represent individual subjects, and the thick red line is the group mean.
4. Discussion
This study describes the test-retest repeatability of the presence and degree of EFLT and breathing patterns during peak exercise in healthy, athletic subjects exercising on a cycle ergometer. There were no significant differences in CPET variables between study visits which suggests that no learning or training effect occurred between visits. The main finding was that the agreement of the presence (or absence) of EFLT during peak exercise was ‘moderate’ when treated as a binary variable but when treated as a continuous variable (i.e., the degree of EFLT) the variability was high. Furthermore, we generally found low between visit variability for markers of breathing patterns during peak exercise.
Establishing the repeatability of CPET variables is important when comparing measures at different times; for monitoring disease progression ordetermining the response to treatmentor an exercise training program. Additionally, establishing the testretest repeatability of the presence (or absence) of EFLT during exercise provides confidence of its presence when observed in a single diagnostic test. Like DeCato et al (2018) we found higher repeatability than previously reported for markers of exercise capacity and cardiac response (Decato et al, 2018). In contrast to Dunsford et al (2024) our study found that the presence of EFLT, when expressed as a binary variable, is a highly repeatable phenomenon in healthy subjects during peak exercise (Dunsford et al., 2024). In keeping with Dunsford et al. (2024), when expressing EFLT as a continuous variable to assess the degree of EFLT, high variability was observed (CoV = 32.9%) which contrasts with other CPET parameters and routine respiratory measures such as FVC, FEV1, and diffusion capacity of the lungs
for carbon monoxide which have reported CoV < 4% in healthy subjects (Becker, Blonshine, Bialek, Moran, & Blonshine, 2022; Punjabi, Shade, Patel, & Wise, 2003). The difference in findings of the presence (or absence) of EFLT at peak exercise between our study and Dunsford et al. (2024) likely reflects the smaller sample size of our cohort and the method used to determine EFLT. Our sample size was relatively small, and most subjects demonstrated EFLT which by chance may have reduced the variability in our cohort and partly explain the higher Cohen’s kappa coefficient found in our study. We determined the degree of EFLT using a vector-based analysis technique which quantifies the conformity of the tidal breath to the FVC loop whereas Dunsford et al (2024) used the tidal breath overlap method (Welch et al., 2021). As summarised by Haverkamp et al (2025) in a recent review, the tidalbreathoverlapmethodhasmanylimitationswhichmayoveror under- estimate the presence and degree of EFLT (Haverkamp, Petrics, & Molgat-Seon, 2025). The VBA technique used in our studyassumesthatwhen thetidalbreathtracksparalleltotheFVC loop that both these independent flow-volume loops are demonstrating the same flow-limiting conditions which addresses many of the limitations of the tidal breath overlap method (Welch et al., 2021). Due to the limitations of quantifying the degree of EFLT (Johnson et al, 1999), many authors opt to report EFLT as a binary and not a continuous variable (Molgat-Seon et al., 2022). The repeatability of the breathing patterns during peak exercise in healthy subjects has received little attention. VEpeak is the most reported ventilatory variable with CoV ranging between 7–28%(Bingisser etal,1997;Decato etal,2018;Garrard & Emmons, 1986; Nordrehaug et al, 1991; Skinner et al., 1999) Our study found a lower than previously reported CoV for VEpeak (5.3%). Furthermore, we reported low CoV (< 7%) for respiratory rate, VT, EILV, IC and VT/FVC, and a slightly higher CoV of 10.9% for EELV. These data suggest low variability of breathing patterns in healthy subjects during peak exercise on a cycle ergometer, which is in keeping with the findings of Dunsford et al (2024). Furthermore, our results support the findings of Hedge et al (2022) who used respiratory inductance plethysmography and showed that the thoracic-abdominal compartmental contributions to VT are repeatable during heavy exercise on a cycle ergometer (Hedge, Hughson, & Dominelli, 2022).
There are several limitations of our study that should be acknowledged. Although consistent with other studies assessing the repeatability of CPET parameters in healthy subjects (Bingisser et al, 1997; Covey et al, 1999; Garrard & Emmons, 1986; Nordrehaug et al, 1991) our study had a low sample size. The low number of female participants meant that we could not assess sex-based differences, however there is no indication in the literature or from a physiological basis that sex would be a cofounding factor in the repeatability of ventilatory response during exercise. Self-selection bias may have occurred as our inclusion criteria likely attracted highly motivated and physically fit subjects more likely to give maximal effort during each CPET. Our study used the cycle ergometer; it is unknown if exercise modality influences the repeatability of the ventilatory response at peak exercise. The repeatability of ventilatory patterns and constraints at peak exercise should also be established for the treadmill: the treadmill and cycle ergometer are commonly used exercise modalities both clinically and for research. The STEEP protocol was used for this study; it is possible that the exercise
protocol may have influenced the presence and degree of EFLT. However, given our study analysed the presence and degree of EFLT at peak exercise, assuming different exercise protocols result in a maximal test, it is unlikely that the exercise profile leading to the achievement of peak exercise influenced our findings.
Due to these points, our findings are representativeof ayoung, athletic population and may not be generalizable to non-athletic, older, or chronically ill subjects, or different exercise modalities. Future studies should focus on clinical populations, children, older adults and use other CPET protocol such as a standardised ramp test.
In conclusion, in healthy subjects exercising on a cycle ergometer this study showed that the presence of EFLT and breathing patterns are repeatable during peak exercise however the degree of EFLT is variable. This study suggests that in young healthy subjects exercising on a cycle ergometer, reliable inferences regarding the presence of EFLT and breathing patterns can be made from single observations.
Conflict of Interest
The authors declare no conflict of interests.
Acknowledgment
This research was supported by an award from The Green Lane Research and Education Fund. We would like to thank the subjects who volunteered their time to be involved in our study.
References
Becker, E. A., Blonshine, J. M., Bialek, K., Moran, E. M., & Blonshine, S. B. (2022). Variations in FVC and FEV1 biological control measures in a global multi-center clinical trial. Respiratory Care, 67(6), 702–708. https://doi.org/10.4187/respcare.09518
Bingisser, R., Kaplan, V., Scherer, T., Russi, E. W., & Bloch, K. E. (1997). Effect of training on repeatability of cardiopulmonary exercise performance in normal men and women. Medicine and Science in Sports Exercise, 29(11), 1499–1504.
Covey, M. K., Larson, J. L., Alex, C. G., Wirtz, S., & Langbein, W. E. (1999). Test-retest reliability of symptom-limited cycle ergometer tests in patients with chronic obstructive pulmonary disease. Nursing Research, 48(1), 9–19. Decato, T. W., Bradley, S. M., Wilson, E. L., & Hegewald, M. J. (2018). Repeatability and meaningful change of CPET parameters in healthy subjects. Medicine and Science in Sports Exercise, 50(3), 589–595. https://doi.org/10.1249/mss.0000000000001474
Derchak, P. A., Stager, J. M., Tanner, D. A., & Chapman, R. F. (2000). Expiratory flow limitation confounds ventilatory response during exercise in athletes. Medicine and Science in Sports Exercise, 32(11), 1873–1879. https://doi.org/10.1097/00005768-200011000-00009
Dominelli, P. B., Foster, G. E., Dominelli, G. S., Henderson, W. R., Koehle, M. S., McKenzie, D. C., & Sheel, A. W. (2013). Exercise induced arterial hypoxaemia and the mechanics of
breathing in healthy young women. TheJournalofPhysiology, 591(12), 3017–3034. https://doi.org/10.1113/jphysiol.2013.252767
Dominelli, P. B., Render, J. N., Molgat-Seon, Y., Foster, G. E., Romer, L. M., & Sheel, A. W.(2015). Oxygen cost of exercise hyperpnoea is greater in women compared with men. The Journal of Physiology, 593(8), 1965–1979. https://doi.org/10.1113/jphysiol.2014.285965
Dunsford,J.R.,Dhaliwal,J.K.,Grift,G.O.,Pryce,R.,Dominelli, P. B., & Molgat-Seon, Y. (2024). Assessing the repeatability of expiratory flow limitation during incremental exercise in healthy adults. Physiological Reports, 12(19), e70068. https://doi.org/10.14814/phy2.70068
Garrard, C. S., & Emmons, C. (1986). The reproducibility of the respiratory responses to maximum exercise. Respiration, 49(2), 94–100. https://doi.org/10.1159/000194865.
Graham, B. L., Steenbruggen, I., Miller, M. R., Barjaktarevic, I. Z., Cooper, B. G., Hall, G. L., Hallstrand, T. S., Kaminsky, D. A., McCarthy, K., McCormack, M. C., Oropez, C. E., Rosenfeld, M., Stanojevic, S., Swanney, M. P., Thompson, B. R. (2019). Standardization of spirometry 2019 update. an official american thoracic society and european respiratory society technical statement. American Journal of Respiratory and Critical Care Medicine, 200(8), e70–e88. https://doi.org/10.1164/rccm.201908-1590ST
Green, M., & Mead, J. (1974). Time dependence of flow-volume curves. Journal of Applied Physiology, 37(6), 793–797. https://doi.org/10.1152/jappl.1974.37.6.793
Guenette, J. A., Dominelli, P. B., Reeve, S. S., Durkin, C. M., Eves, N. D., & Sheel, A. W. (2010). Effect of thoracic gas compression and bronchodilation on the assessment of expiratory flow limitation during exercise in healthy humans. Respiratory Physiology & Neurobiology, 170(3), 279–286. https://doi.org/10.1016/j.resp.2010.01.017
Haverkamp, H., Petrics, G., & Molgat-Seon, Y. (2025). Geometric analyses of the expiratory Flow–Volume curve to identify expiratory flow limitation during exercise. Fluids (Basel), 10(4), 94. https://doi.org/10.3390/fluids10040094
Hedge, E. T., Hughson, R. L., & Dominelli, P. B. (2022). Repeatability and reproducibility of changes in thoracoabdominal compartmental volumes and breathing pattern during low-, moderate- and heavy-intensity exercise. European Journal of Applied Physiology, 122(5), 1217–1229. https://doi.org/10.1007/s00421-022-04917-3
Johnson, B. D., Weisman, I. M., Zeballos, R. J., & Beck, K. C. (1999). Emerging concepts in the evaluation of ventilatory limitation during exercise: The exercise tidal flow-volume loop. Chest, 116(2), 488–503. https://doi.org/10.1378/chest.116.2.488
Keteyian, S. J., Brawner, C. A., Ehrman, J. K., Ivanhoe, R., Boehmer, J. P., & Abraham, W. T. (2010). Reproducibility of peak oxygen uptake and other cardiopulmonary exercise parameters. Chest, 138(4), 950–955. https://doi.org/10.1378/chest.09-2624
Landis,R.J.,&Koch,G.G.(1977).Themeasurementofobserver agreement for categorical data. Biometrics, 33(1), 159–174. https://doi.org/10.2307/2529310
McHugh, M. L. (2012). Interrater reliability: The kappa statistic. Biochemia Medica, 22(3), 276–282. https://doi.org/10.11613/bm.2012.031
Welch et al. / The Journal of Sport and Exercise Science, Journal Vol. 9, Issue 2, 1-7 (2025)
Molgat-Seon,Y., Dominelli, P. B., Peters, C.M., Kipp,S., Welch, J. F., Parmar, H. R., Rabbani, T., Mann, L. M., Grift, G. O., Guenette, J. A., Sheel, A. W. (2022). Predictors of expiratory flow limitation during exercise in healthy males and females. Medicine and Science in Sports and Exercise, 54(9), 1428–1436. https://doi.org/10.1249/MSS.0000000000002938
Nordrehaug, J. E., Danielsen, R., Stangeland, L., Rosland, G. A., & Vik-Mo, H. (1991). Respiratory gas exchange during treadmill exercise testing: Reproducibility and comparison of different exercise protocols. Scandinavian Journal of Clinical Laboratory Investigation, 51(7), 655–658. https://doi.org/10.1080/00365519109104577
Northridge, D. B., Grant, S., Ford, I., Christie, J., McLenachan, J., Connelly, D., McMurray, J., Ray, S., Henderson, E., Dargie, H. J. (1990). Novel exercise protocol suitable for use on a treadmill or a bicycle ergometer. British Heart Journal,64(5), 313–316. https://doi.org/10.1136/hrt.64.5.313
Pellegrino, R., Brusasco, V., Rodarte, J. R., & Babb, T. G. (1993). Expiratory flow limitation and regulation of end-expiratory lung volume during exercise. Journal of Applied Physiology 74(5), 2552–2558. https://doi.org/10.1152/jappl.1993.74.5.2552
Punjabi, N. M., Shade, D., Patel, A. M., & Wise, R. A. (2003). Measurement variability in single-breath diffusing capacity of the lung. Chest, 123(4), 1082–1089. https://doi.org/10.1378/chest.123.4.1082.
Quanjer, P., Stanojevic, S., Cole, T. J., Baur, X., Hall, G. L., Culver, B. H., Enright, P. L, Hankinson, J. L., Ip, M. S. M., Zheng, J. P, Stocks, J. (2012). Multi-ethnic reference values for spirometry for the 3-95-yr age range: The global lung function 2012 equations. The European Respiratory Journal, 40(6), 1324–1343. https://doi.org/10.1183/09031936.00080312
Skinner, J. S., Wilmore, K. M., Jaskolska, A., Jaskolski, A., Daw, E. W., Rice, T., Gagnon, J., Wilmore, J. H., Rao, D.C., Bouchard, C. (1999). Reproducibility of maximal exercise test data in the HERITAGE family study. MedicineandSciencein Sports Exercise, 31(11), 1623–1628.
Welch, R., Francis, A., Babbage, T., Lardenoye, M., Kolbe, J., & Ellyett, K. (2021). Quantifyingtidal expiratory flow limitation using a vector-based analysis technique. Physiological Measurement, 42(11), 115003. https://doi.org/10.1088/13616579/ac3f96
The Journal of Sport and Exercise Science, Vol. 9, Issue 2, 8-18 (2025) www.jses.net
Self-identifiedandobservedcoachingstylesofAustralianjuniorcommunitycricketcoaches
Brendan SueSee1* , Shane Pill 2 , Mitch Hewitt 3
1School of Education, University of Southern Queensland, Australia
2College of Education, Psychology & Social Work, Flinders University, Australia
3Tennis Australia, Australia
Received: 16.05.2025
Accepted: 01.10.2025
Online: 05.12.2025
Keywords:
Cricket
Coaching styles
Spectrum of coaching
Thispaperaddressesthequestion:Weretheobservedcoachingstylesofcommunitycricket coaches in alignment with their self-reported use of coaching styles of the Game Sense approach (GSA)? Coaches practice was observed and analysed using the Spectrum of Coaching Styles (Pill et al., 2022). Five styles were observed: Coaching by Task – Style B, Individual Programming – Style D, Guided Discovery – Style F, Problem Solving – Style G and Creativity – Style H. In the Spectrum of Coaching Styles, Style B and D are regarded as coaching for reproduction of the knowledge, skills and understanding described and prescribed by the coach, whilst Style F, G and H necessitate participants to solve problems created by the coachand theyare the styles most often associated with a GSA. The coaches self-identified coaching practice as a GSA did not align with the observed coaching styles during this study. Contextual to this study, Cricket Australia’s (CA) principles of coaching espouse principles associated with a game-based approach such as the GSA. The ideas coachesespousedregardingtheircoachingandtheirobservedcoachingsuggestsimproved pedagogical knowledge is required.
1. Introduction
This project investigated junior community cricket coaches coaching styles. In this paper,coaching styles is synonymouswith pedagogies which some may also call instructional strategies (Hewitt et al. 2016). Community cricket coaches are usually (if not always) volunteers who receive no renumeration for theirtime and effort and voluntarily participate in introductory and more advanced coaching accreditation courses (Pill et al., 2022). As the governing body of cricket in Australia, Cricket Australia (CA) provides free online courses for coaches (Cricket Australia, 2022a). CA’s principles of coaching espouses a pedagogical expression recognisable as a game-based approach (GBA) (Cricket Australia, 2022b); however, unlike some other sports (like Australian football/AFL) there is no requirement for community coaches to have completed coaching accreditation to coach junior cricket at community clubs.
CA’s junior coaching framework emphasises player problem solving and playing games (Cricket Australia, 2022b). Since 1996, the Game Sense approach (GSA) has been promoted by the
Australian Sport Commission (ASC) as the GBA to coaching junior sport (Australian Sport Commission, 1996; 2023). In contrast to directive instruction for specific reproduction of coach prescribed movement explanations and demonstrations, a GSA requires a coach to use questioning strategies in preference to direct instruction (Australian Sport Commission, 1996) to position the player as an active constructor of their understanding (i.e., the coach developing thinking players; den Duyn, 1997).
Aligned with the key precepts of a GSA as a GBA emphasising coach use of questions to engage players cognitive construction ofunderstanding,CA suggeststheuse ofacoaching approach that fosters player problem solving and game form practice, and suggests this approach is motivational to young players continued participation (Cricket Australia, 2022b).
Some have suggested that a GSA is frequently misunderstood by coaches orremains an innovation to most (Pill, 2021). Coaches observed coaching styles during practice sessions have been foundinsomesportstonotmatchtheirintentiontobegame-based coaches (Hewitt et al., 2016). Coaches may attempt to create game-like practice scenarios but have been found to fail to
*Corresponding Author: Brendan SueSee, University of Southern Queensland, Australia, Brendan.SueSee@usq.edu.au
position the player as actively thinking about the game as the coach is using directive pedagogy (Light, 2012) whereby the coach tells the player ‘what’ to do, ‘how’ to do it’ and ‘when’ to do it, which may be called Coaching by Task or practice style pedagogy (Pill et al., 2022). In this study, we refer to a coaching style as those identified in The Spectrum of Coaching Styles section that follows. Research with junior cricket coaches found another GBA, Teaching Games for Understanding (Bunker & Thorpe, 1982), challenging, particularly the use of questioning strategies. The research reasoned that this may be a consequence of insufficient pedagogical content knowledge and the inability to access appropriate support material (Roberts, 2011). Impacting coaches understanding of a GBA, Culver et al. (2019) research on coach education found coach educators design courses emphasising learner centred approaches to be used to coach participants but lack the knowledge to design for learner-centred approaches themselves. Furthermore, both coach developers and coaches found a constructivist approach to learning too different to the traditional lecture format of learning.
1.1. Game Based Coaching
Cricket coaches may struggle with the identification and implementation of coaching styles that reflect CA’s goals of practice as problem solving in game-like practice. Australian community cricket training has recently been reported as consisting of training practices that are ‘outdated, restrictive and monotonous’ (Lascu et al., 2021, p. 1), and that attempts to use GBAs so practice can more closely resemble the requirements of the game of cricket have proven difficult for cricket coaches (Lascu at al., 2020b). This suggests little has changed since Low et al. (2013) found players spending most of their time in training form or drill like activities typical of common ‘net’ practice sessions, rather than in playing form or game-like activities. Low and colleagues suggested that players participating in drill like activitiestypicalofcommon‘net’practicesessions weretherefore being perceptually, cognitively and motor skill underdeveloped due to the lack of representativeness of practice to the game. Exemplifying this idea about net sessions, Lascu et al. (2020a) showed that in net sessions, batters had little opportunity to view consequences of bat-ball contact or shot selection as would occur in a game, and bowlers frequently did not get the opportunity to bowl 6 balls in a row or practice manipulating the batter as would happeninagame.Lascuetal.(2021)suggestedtheneedforcoach development focused practice that represented to players the demands of the game (i.e., representative learning). To date, little research has examined the impact of game-like or representative designs of cricket training environments.
Representative learning requires practice based on realistic learning contexts that simulate the demands of the performance environment (O’Connor et al., 2020; Hodges & Lohse, 2022), or in other words, provide representation of the action logic (Gréhaigne, Godbout, & Bouthier, 1999) of the play. In the context of cricket, a representation of the action logic would require the same movements (i.e., shot play) and decision-making processes (i.e., hitting away from the fielders, deciding when to run) that would occur during match play, and achieved by simulating the key sources of information available to the players (i.e., where the ball is bowled, where fielders are standing). To this end, Vickery et al.
(2013) trialled a small-sided game format called ‘Battlezone’ concluding that it provided suitable training replication of the physiological, physical and technical demands of one-day cricket. Connor et al. (2016) and Connor et al. (2018) used representative training scenarios with professional, amateur and junior level cricketeers to assess the emergence of skilled batting over a 12weekperiod.Battersweregivenascenario(e.g.,scoreasmanyruns as possible without being dismissed) and mannequins were placed on the field to create an environment requiring players to hit to places where fielders are not. This external outcome focus of players resulted in improved run scoring ability, bat-ball contact, and technical efficiency (Connor et al., 2018).
1.2. Player retention
A premise of this research is that ‘good coaching’ is imperative to player learning and retention (Agnew & Pill, 2023). It is argued good coaching entails creating practice tasks which are congruent with the needs of the player as a learner (Pill et al., 2021) to ‘connect learners in consequential goal-orientated activities with the aim of achieving instructional outcomes specific to an individual lesson or group of lessons’ (Hewitt et al. 2017, p. 1). Furthertothis,wesuggestgoodcricketcoachingwould alignwith CA’s goals of creating environments which foster problem solving in game like environments or game forms.
1.3. The Spectrum of Coaching Styles
This study used The Spectrumof Coaching Styles (The Spectrum: Table 1) to assess coaches observed coaching behaviour. The Spectrum is an adaptation of The Spectrum of Teaching Styles to sport coaching (Pill et al., 2022). Here, coaching styles is synonymous with teaching styles in the belief that the sport coach is an educator (Jones, 2006). The Spectrum contains two clusters of coaching styles, the Reproduction cluster where the coaching style requires the player/s to reproduce requirements prescribed by the coach, and the Production cluster where players have greater ownership for thinking and enacting practice as independent or self -regulated learners. The Spectrum has been used in Australian sport coaching research by others to observe coaches and their coaching styles used during practice sessions with players (e.g., Hewitt et al., 2016; Pill et al., 2016) and with physical education teachers (Cothran et al., 2005; SueSee et al., 2018; SueSee & Barker, 2019) recording self-reported teaching styles. The studies of The Spectrum with sport coaches report that coaches predominantly use Coaching by Task – Practice Style B from The Spectrum, despite coaches self-reporting that they use a range of styles congruent with the ASC advice to be game-based in their coaching. Reasons given for the lack of congruence were coaches lack of understanding of GBA teaching/coaching styles, lack of coach development support in GBA’s and the influence of previous experiences. Researchers (Hewitt, 2015; Pill et al.,2022) suggested that The Spectrum could assist improving alignment between the coaching styles used by coaches and with that desired by relevant bodies for junior coaching to be game-based by identifying ‘how and what learning the coach pedagogy facilitates during practice sessions and enable dialogue with coaches about the application of teaching styles during practice sessions for purposeful outcomes’ (Pill et al., 2022, p. 143).
Table 1: Spectrum of Coaching Styles (Pill et al., 2022)
Coaching Style Description
CoachingbyCommand:StyleA Thecoachselectsthetaskthattheplayer/sperforminaunison,choreographedorprecisionperformance image following the exact pacing and rhythm (cues) set by the coach.
CoachingbyTask(Practice) StyleB
ReciprocalCoaching(Peer Coaching):StyleC
CoachingbyIndividual Programming(Self-Check): StyleD
SmallGroupCoaching (Inclusion):StyleE
CoachingbyGuidedDiscovery: StyleF
CoachingbyProblemSolving (ConvergentDiscovery): StyleG
CoachingforCreativity (DivergentDiscovery):Style H
PlayerDesigned Coach
Supported:StyleI
PlayerInitiated Coach
Supported:StyleJ
PlayerSelf-Coaching:StyleK
The coach selects the subject matter tasks, the quantity, and the time limits so that player/s can practice individually and privately. The coach circulates among all player/s and offers private feedback. The player/s learn to set a pace to practice tasks within an allocated time frame.
The coach selects the subject matter tasks and presents the expectations for player/s to work with a partner. One player (the doer) practices the task, while the other player (the observer) uses coach prepared criteria (checklist) to offer immediate feedback about the performance to the doer. When thefirstsetoftasksarefinished, theplayers switchroles andcontinue tothe secondsetoftasks. The coach interacts with the observer to affirm the use of the criteria and the accuracy of the feedback comments and/or to redirects the observer’s focus to specific performance details on the criteria.
The coach selects the subject matter tasks and designs the criteria (performance checklist) for player/s. Player/s individually practice the tasks and check their own performance using the checklist. The coach privately communicates with player/s to listen to their self-assessment comments and either reinforcestheplayer’suseofthecriteriaorredirectstheplayer’sfocustospecificperformancedetails on the criteria.
Thecoachselectsthesubjectmattertasksanddesignsmultiplelevelsofdifficultyforeachtask.Player/s select the level of difficulty that is appropriate to their performance. If inappropriate level decisions are made, the player may change the level choice. Players check their performance using the coach preparedperformancechecklist(criteriasheet).Thecoachcirculatestoacknowledgethechoicesthe players have made and to ask questions for clarification to affirm the accuracy of the player’s assessment process and/or to redirect the learner’s focus to specific performance details on the criteria.
Thecoachasksoneplayeraseriesofspecificquestions;eachquestionhasonlyonecorrectanswer.The questions are sequenced in a logical pattern so that each answer leads the player step by step to discover the anticipated concept, principle, relationship or solution.
The coach designs a situation or one question that has only one specific correct response the situation or question is new, and the response is not previously known to the player/s. The players are given individual and private time to use their thinking and questioning skills to sequentially and logically discover the anticipated answer.
The coach designs a single or series of problems, situations or questions that seek multiple solutions to the same problem. The task is new to the player/s; therefore, each player is invited to discover new possibilities, as they produce multiple responses to the specific problem. The coach acknowledges the production of multiple ideas, rather than any singular idea.
The coach designates a broad subject matter/topic. Within that topic each player is responsible for producing an individual learning program that includes setting goals and the process for accomplishing the goals. The player/s design, implement, refine the program, and create performancecriteriafortheirindividuallearningprograms.Thecoachacknowledgestheproduction of ideas and asks questions for information or clarification about the learning program.
A player initiates a request to the coach to plan his/her own learning experience. In this experience the player makes all the decisions: selects the subject matter intent, designs, executes, and identifies the assessment criteria for the learning experience. The coach participates when and how the player requests. The coach acknowledges the learner’s successful implementation oftheplans andinitiates questions where discrepancies emerge between the learner’s intent and actions. It is not the coach’s jobtoevaluate,rathertoactasareferencesourcebetweentheindicatedintentandactionwhenasked by the player.
The learner takes the role of both student and coach setting all learning objectives. The learner makes decisions about subjectmatterintent, design, execution,andassessmentof the learningexperiences. This style is independent of a coach and not initiated by a coach. Feedback from others occurs only IF the learner seeks it.
In our study, The Spectrum was used to view the coaching practices as it provided a common pedagogical language for coaching styles and helped give the behaviours and deliberate decisions of the coach and players clarity (Pill et al., 2022). It did this by describing ‘who is doing what’ and what the cognitive intentions or behaviours are of both the players and coach during the observed practice session.
This paper makes a distinctive contribution to the literature by developing understanding of the congruence between the everyday pedagogical endeavour (Jones, 2007) of the community sport coach and this alignment with advocacy of a GBA by the national body of the sport. It also highlights the need to question the likelihood of coaches using GBA’s if the content of coaching courses does not reflect these coaching styles and on-going coach development in a GBA is not available to the coaches.
2. Methods
The paper aimed to address the research question - Were the observed coaching styles of community cricket coaches in alignment with the coaches self-reported belief about their use of coaching styles? This investigation used a mixed methods approach to collect data. Three 1-hour interviews were used to generate data about how often a sample of community cricket coaches reported using coaching styles to coach their participants. Coding of three 1-hour coaching sessions (three coaches times three 1-hour sessions n = 9 sessions) was used for the second part of the investigation. The value of observational research of coaches practice sessions to enrich our understanding of the coaching process and to identify the teaching styles of coaches within practice environments have been demonstrated by others (Potrac et al., 2000; Hewitt et al., 2016). The use of observation has been acknowledged as a valuable tool for delivering quantitative descriptions of coaching behaviour (Darst et al., 1989; DeMarco et al., 1996) as observation can provide data of demonstrated coaching styles in the authentic or ‘natural’ coaching environment.
2.1. Participants and setting
2.1.1. Ethics
The research project followed the ethical guidelines outlined by the University of Southern Queensland and ethics approval code H21REA162. Consent for the research was obtained from the participants. Any player who did not wish to be filmed was not filmed. Confidentiality was assured to all participants with anonymity guaranteed. All videos are stored on a passwordprotected computer and deleted after the coding were completed for the second time.
Coaches from a community cricket club in a large Australian city were sent an email from the club president asking if any were interested in being participants in a study titled ‘Making Net Sessions more game-like’. Convenience sampling was used, and numerous coaches (n = 9) expressed interest, and three coaches were purposively selected from the initial group to represent a range of variables including age of participants being coached, years coaching and ability level, and the time available for the study. The three coaches chosen represented novice, intermediate
and experienced and the age groups coached included u/12 club team, u/16 representative team and u/17 club team. This sample represented a range of player abilities, range of reasons for coaching (competitive, representative and social) and a range of experience (in terms of years and qualifications) with coaching. Participant 1 was a Level 1 coach, Participant 2, a Level 2 Coach and Participant 3 a Level 3 coach. A Level 1 qualification (or Junior Cricket Course) prepares the coach for junior coaching at a community or club level, whilst a Level 2 course is Representative Coaching for representative teams (such as state team). The Level 3 course, or High-Performance Coach is an invitationonlycourseforaspiringhigh-performancecoaches.The participantsself-identifiedasinterestedandwere‘biased’towards making net sessions more game-like and working to improvetheir coaching.
2.2. Data collection
Themixed methodsapproachused interviewstoestablishtheselfreported styles of the coach and observations being analysed to determine congruence of the self-reported coaching styles and the coach's observed coaching styles. All interviews and coaching sessions were video recorded with a GoPro digital video camera. For the interviews the camera was placed on a surface and the conversation was recorded along with the dictation function on the researcher’s computer. For the three 1-hour coaching sessions a chest strap was attached to the GoPro and the participants wore the camera. This method of recording proved sufficient for the codingprocess. The GoPro worn by the coach showed the coach’s view of the coaching sessions. The researcher was positioned approximately five metres from the coach during most of the session. All video recording began with the first instruction by the coach about the session activities and purpose. These procedures have been used by others (SueSee & Barker, 2019; Hewitt et al., 2016) to observe teaching styles in physical education and coaching.
2.3. Procedure
Interview: The 1-hour interviews recorded the three coach’s beliefs about their coaching styles and were done after three 1hour coaching sessions (9 sessions in total) were completed and recorded. Firstly, participants were asked questions to confirm their coaching experience, qualifications, age group and level or grade. The participants were asked to describe their coaching philosophy in terms of what they were trying to achieve, how they would achieve these goals and to describe examples of what a session looks like, and what are the players doing? The three 1hour coaching sessions that were completed before the interviews were used as scenarios to ask the participants what they were doing in specific situations and to confirm if these were ‘usual’ coaching sessions for them. In comparison to others (Hewitt et al., 2016;SueSee &Barker,2019)whohaveused a specificSpectrum questionnaire, the researchers decided not to use The Spectrum specific coaching styles definitions during the interviews for two reasons. Firstly, the researchers did not wish to influence the participants answers in any way by suggesting specific styles. The secondreasonwastheresearchersdidnotwishtocreateconfusion as the participants potentially did not know specific coaching
styles. The participants did know that the title of the research project was ‘Making Net Sessions more game-like’ and that the purpose of this pilot was to establish a baseline of their coaching styles. Interviews were chosen as a method of data collection based on the research question and as the researchers was attempting to establish the coaching styles community cricket coaches identified using and the coaching styles they were observed using. Therefore, the interviews were not analysed, or themes identified. The responses to what the coaches said were recorded and accepted. If the researchers were unsure of answers or required more information for clarification, they would ask the participants to elaborate or explain in more detail.
Observation: Observations of a coach’s practice session can be a means through which to understand a coach’s coaching process and to identify the coaching style of the coach (Hewitt et al., 2016; Potrac et al., 2000). Observation assessment is acknowledged as a method providing quantitative descriptions of coaching behaviour (Hewitt et al., 2016). Observation provides baselinedataofactual(demonstrated inthecoachingenvironment) instructional strategies used by the coach, which provides insights into their coaching style. We acknowledge that observational tools can only measure what the tool is designed to ‘see’ (Hewitt et al., 2016). Observational research was used to collect the data to establish the coaching styles used by the coaches.
2.4. Data analysis
Nine coachingsessions (threesessions per participant) werevideo recorded with the coaches wearing a GoPro so that instructions and images were collected. Two coders were used. Both coders had extensive knowledge of The Spectrum with regards to The Spectrum styles and both have extensive experience coding PhysicalEducationTeachers. Theresearchersused TheSpectrum styles to define 11 coaching styles (Table 1).
2.5. Coding instruments and procedures
Previous studies (Cothran et. al., 2005; Hewitt & Edwards, 2015; Hewitt et al., 2016; SueSee et al., 2019; SueSee & Barker, 2019) recorded teacher self-reported teaching (physical education) styles, sport coaching styles and the observed teaching (physical education) and coaching (sport) styles used. In this case the researchers were attempting to observe the coaching behaviour of community cricket coaches and record if this aligned to their selfreported beliefs regarding their coaching styles. The video recordings of sessions were reviewed and coded using four tools: (1) Ashworth’s (2002) Identification of Classroom Teaching LearningStyles (see also Hewitt & Edwards,2011; SueSee,2012); (2)theIdentificationofClassroomTeachingLearningStyle(Byra et al., 2014; Hewitt et al., 2016; SueSee & Edwards, 2011); (3) Sherman’s (1982) Style analysis checklist for Mosston and Ashworth’s spectrum of teaching styles (Byra et al., 2014); and (4) the Style analysis checklists for Mosston’s spectrum of teaching styles (Sherman, 1982).
Twocodersused terminologyfromTheSpectrumofCoaching Styles (Pill et al., 2022) as a basis to identify the observed styles being used by the coaches. Coding involved using the Instrument for Identifying Coding Sheet (IFITS), which involved a ten second observation followed by a ten second recording of this
observation (i.e., a decision every 20 seconds). The decisions the coders were making involved determining which coaching style was being used in the previous ten second period. This process has successfully been used by others using The Spectrum to code coaching behaviour and teaching behaviour (SueSee et al., 2019; SueSee & Barker, 2019; Hewitt et al., 2016) and the use of a similar protocol allows comparison between research with similar methods. The coders used the four tools to make the decision (based on the coaches’ and students’ behaviour) about which coaching style was being used. Where two or more coaching styles were employed in a period of observation, the style would be coded as the style closest to the production end of the Spectrum. Research by others (SueSee & Barker, 2019; Hewitt et al., 2016) have coded in the same manner when observing physical education teachers and tennis coaches. The application of this procedure allows comparison between this research and others. Reliability of coding is important when decisions are being made based on observations. Inter-observer reliability was calculated using the formula:
Inter-observer agreement = Agreements (Agreements + Disagreements) ×100
By using this formula, inter-observer agreement was calculated across the six observed sessions using the three tools and coding sheet. 100% agreement was the highest agreement recorded; the lowest was 94.8%. Researchers have suggested that 85% or higher needs to be achieved to be considered an appropriate level of reliability (Rushall, 1977; van der Mars, 1989).
3. Results
Participant One’s coaching philosophy indicated a desire to improve both physical and social skills:
I suppose my coaching philosophy is around fun and getting them engaged with the game so they come back again next year… yeah making them that little bit better than the year before and making them better human beings than teammates.
He suggested he achieved that through:
a lot of game play around where we discuss the scenarios if we set a challenge of a certain amount of runs to score or do we take the run or where do we throw the ball shouldn't we be back up all of that will be discussed at the time yeah so that people get a better picture of what we are trying to achieve.
Participant Two suggested:
I want to see the kids improve with me it is trying to work on their strengths rather than their weaknesses.
Participant Two suggested the players he was coaching (15 years of age) were at a level of ability that further improvement was not required:
…with the 15-yearoldsyou'rea batsman andwe will focus on you as a batsman. I don't need you bowling in again because we've got plenty of other kids to bowl so therefore you don't have to practice bowling. We're not going to pick up on your technical abilities with bowling unless we see
something. You'll always be a bowler; you're just a hack as a batsman sort of thing so… and I try to do that in the games as well.
Participant Two appeared quite traditional (Low et al., 2013) in the ways they tried to develop teamwork when fielding: we work as a unit when fielding and they suffer the consequences of fielding as a unit. So now it's when they drop a catch in the catching drills everybody does five pushups not just one person drops the catch everyone does it and it's amazing how the focus and the distractions disappear when they work as a team when they're all suffering together.
Participant Two valued the incorporation of competition into drills and was very positive towards net sessions: I think the nets are fantastic in the way of if I can do one on one with the batsman. I will get them working on their footwork, not necessarily their technique, it doesn't matter. It's all about footwork and body position for me. …The volume is the key thing right. Like I (don’t) have a pop-up net and a pop-up cricket net where I can set up on a centre wicket and (also) we just haven’t got the time to set that up.
Conversely, Participant Two did not believe net sessions were great for bowlers, attributing this belief to something he read: because they're intimidated by the claustrophobic feel of it particularly spinners…I read a book by Ashley Mallet on Clary Grimmet, Australian leg spinner. He refused to bowl to batsman in the nets because it never replicated a match situation, because batsman in the nets have more bravado, no repercussions, just whacking the ball, so therefore they never played him properly as if they were out in the centre wicket.
Participant Three’s philosophy was specific about his goals with an emphasis on cognition, reflection and learning. the one underlying theme or philosophy is that you know the best coach you need or are going to ever have is the one that's inside your head. It's about them being able to be reflective and thinking cricketers and that's probably more the goal of everything I try and do is that you know provide an environment that's safe and supportive but allow them to challenge themselves with their learning regarding cricket so being reflective.
Participant Three emphasised the need for player autonomy. When they were asked to elaborate on how they developed these reflective and thinking cricketers Participant Three suggested: setting up new environment for your group of kids and really, it's doing that… setting it up and getting out of the way and letting you know I try to let the players run both the drills and the scenarios themselves….so really, it's setting up the scenario or the drill he's still being clear with the constraints and then getting out of the way and letting it unfold and then jumping in for you know when there's those teachable moments or they reflective questions and try and get them to debrief it at the end
To summarise, Participant One suggested they used a lot of game play and scenarios with an emphasis on fun, engagement and improvement. Participant Two also desired improvement through working on strengths rather than weaknesses and valued drills (training form), volume of practice, and one-on-one opportunities
with players where possible. Participant Two believed net sessions were great for batters in terms of volume but not as beneficial for bowlers. Participant Two did use centre-wicket scenario type training in their coaching practice. They did, however, express a view that they valued net sessions due to the volume of practice you couldget with batters. Finally, Participant Three emphasized the importance of developing each participant’s ‘inner coach’ andcoaching in a way that required the players to develop their own player-centered goals through gamelike practice experiences and reflection on what has happened during play. This belief seems informed by constructivist views and valuing of learner autonomy during practice.
3.1. Coach observations
The results in this section describe the observed coaching styles of the three coaches during their three 60-minute coaching sessions (three coaches times three 60-minute observations = 540 minutes total observation time). All three coaches, when observed throughthelensoftheSpectrum,werecoded asCoachingbyTask (Practice) Style B as the dominant coaching style with Participant Two exclusively using Style B. While Style B may be thought of as closed skills or drills practice under control of the coach, we argue that this is not the only case. Style B is from the reproductionclusterandcanrequiretheparticipanttousememory of the coach demonstration and explanation as the cognitive operation. An example of Style B being used in a game like environmentwasused byParticipantThree.ParticipantThreetold the batter his target was 16 runs off 6 deliveries. Participant Three’s questioning is below:
Participant Three: ‘What’s the field?’
Bowler: ‘Normal ring field.’
Participant Three: ‘What’s a normal ring field’? ‘So, everyone’s up?’
Bowler: ‘Yeah…a mid-wicket.’
Participant Three: ‘He’s got everyone up…and you need 16 off the over.’
These are examples of how open-ended questioning can require the participant to recall known knowledge and is therefore not Guided Discovery – Style F. We are not arguing recalling knowledge is not valuable, we are merely suggesting open-ended questioning in this form is not requiring the learner to discover knowledge and would not meet the CA coaching goal of solving a problem. Coaching by Guided Discovery Style F was minimally used by Participant1(1.5% ofthe time)andParticipant Three(2.7% of the time) when coaching.
ParticipantOnewasalsoobserved usingCoachingbyProblem Solving(ConvergentDiscovery)StyleG(0.8%)withtheirplayers, meaning in the observed sessions they used three coaching styles (Styles B, F and G). Participant Two used one coaching style throughout – Coaching by Task (Practice) – 86%. Participant Three used four coaching styles during the observations, creating learning experiences for their players using Coaching by Individual Programming (Self-Check) Style D (0.4% of the time), Coaching for Creativity (Divergent Discovery) Style H (1.7% of the time) when coaching, Coaching by Guide Discovery Style F –2.7% and Coaching by Task (Practice) Style B – 82.6%.
Table 2: Coaches observed coaching styles.
Participant Coaching style used during three 60-minute coaching sessions
Participant 1
Participant 2
Participant 3
Coaching by Task (Practice) Style B – 82.2%
Coaching by Guided Discovery Style F – 1.5%
Coaching by Problem Solving (Convergent Discovery) Style G – 0.8%
Management – 15.5%
Coaching by Task (Practice) Style B – 86% Management – 14%
Coaching by Task (Practice) Style B – 82.6%
Coaching by Individual Programming (Self-Check) Style D – 0.4%
Coaching by Guide Discovery Style F – 2.7%
Coaching for Creativity (Divergent Discovery) Style H – 1.7% Management – 12.6%
From the nine 1-hour observations (three coaching sessions perparticipant)thecoachingstylesused indescendingorderwere, Style B, Style F, Style H, Style G and Style D (Table2). However, whilst a range of styles were observed, the dominant style observed being used by all three participants was Style B. Further, Style B dominated all nine sessions observed being observed between 82–86% of the time.
4. Discussion
Consistent with CA’s desire for gameplay as acoaching approach that fosters player problem solving using game forms (CA, 2022), from the participants’ interviews there was a general description of game play being evident in all their self-reported philosophies of coaching. Even though Participant Two indicated a valuing of net sessions, they still made a point of emphasising centre-wicket practice which generally could be assumed to resemble game-like scenarios. Including a lot of game play or game like environments in practice sessions were included in the common coaching philosophy of the coaches. However, there was no mention in the interviews of CA’s coaching philosophy of using game play to solve problems, nor of a GSA to coaching. Participant One used words such as scenario and challenge, and Participant Three mentioned using reflection and thinking but not specifically the phrase problem solving. The failure by all three participants to mention CA’s philosophy influencing their coaching may reflect coaches not being cognisant of their coach education programs influencing their coaching (Ferner et al., 2023).
Whilst a range of coaching styles were observed, thedominant style observed by all three participants was Style B, observed between 82–86% of the time. Style B requires participants to use the cognitive operation of memory in the reproduction of movement demonstrated and explained by the coach. Research (Hewitt et al., 2016; Pill et al., 2015) has shown that Style B is the most used sport coaching style. Style B is termed Coaching by Task (Practice) and it is not limited to closed or isolated movement skills practice as it may take the form of a game if the players are being asked to replicate known movements and strategies (Pill et al., 2022); that is, practice in context existing skills, knowledge and understanding. The dominant use of Style B in this study is similar to Low et al. (2013) findings that traditionally coaching in cricket involved players spending most
of their time in training form or drill like activities typical of common ‘net’ practice sessions, reproducing existing skills, knowledge and understanding in a relatively stable practice context rather than practicing in the dynamic and more contextually variable situation of playing form or game-like activities. Training Form activities are described ‘as activities practised in isolation or in small groups that were devoid of a game play context’ (Low et al., 2013, p 1244) whilst match form is game like or match like conditions. The Spectrum differs from Low et al. categorisation in that it bases the coaching styles definitions around the cognitive requirements of the coaching style. In particular, participants being asked to reproduce skills or knowledgeor are they being asked to produce new knowledge (by creativity or discovery) to a problem they have not previously encountered. Participants in Low et al.(2013)research werebeing perceptually, cognitively and motor skill underdeveloped because most of the coaching activities were training form activities. While in our study, Participants One and Three were observed using some games which required problem solving, some other games were coded as Style B as the participants were not directed to solve a problem or the game required the recall of already known movements to play (memory) the game and not solve an unknown problem.
While Style B coaching dominated in our study, Participant Two was the only coach to use Style B the entire time of their three 1-hour observed coaching sessions. Participant One used three styles (B, F and G) and Participant Three used the most styles (B, D, F and H) of the three coaches involved. The dominant use of Style B may have been influenced by Participant Two ’s desire for volume and seemingly valuing time and efficiency. However, the view that volume can only be achieved through traditional cricket coaching may be a misconception. Vickery et al. (2014) suggested game-like environments (Battlezone) have a similar or greater training load to traditional training methods. Participant Two’s view that efficiency and volume can only be achieved through net sessions (and not CA suggested approaches) maybe an example of what Jones (2007) described as an everyday coaching philosophy and that coaches are aware of where to find coaching knowledge but fail to see its relevance in their everyday coaching.
Style F (used by Participants One and Three – see Table 1 for definition) was the second most frequently used coaching style
observed being used. However, at other times, Participant One and Three also used open ended questions (a characteristic of Style F) with their participants where the players were retrieving or recalling knowledge or answers previously known, meaning by Spectrum definition, Style B.
Divergent Discovery Style – H was only used by Participant Three. Divergent Discovery Style – H learning episodes are created with the intention for ‘players to discover or generate multiple possibilities that satisfy a question or situation’ (Pill et al., 2022, p. 80). That is, the coach sets a problem or scenario for the player to solve that has multiple solutions. The player will use creativity or discovery (not recall or memoryof a known solution) to produce two or more solutions. Divergent thinking requires idea generation where more than one solution is workable. Divergent thinking is often applied to ‘open’ problems and challenges where creative solutions are sought (Benedek et al., 2014; Pill et al., 2022). An example of a Divergent Discovery Style – H used by Participant Three was a challenge called ‘Hit the clock’. An area was set up on a synthetic cricket pitch with targets (1 o’clock, 3 o’clock, 5 o’clock) represented with markers. One player would under-hand toss a ball which would bounce once before reaching the batter. The batter was tasked with the problem of hitting the targets which they nominated. The coach instructed the batters to ‘solve the problem of hitting the target even if the ball is not exactly where you want it. What can you do?’ This situation is an example of the researchers seeing that this could be also an example of Coaching by Task (Practice)Style B if the players already possessed the skill to solve this problem or had solved this problem before. Despite this, the researchers coded this coaching episode as a Production Cluster style as when two styles emerged, the one closest to the Production Cluster was recorded.
Considering all nine hours observed, 6.7% of the coaching styles (Styles F, G and H) required learners to use discovery or creativity as the cognitive operation. Using discoveryor creativity is in line with CA’s desire for players to learn through problem solving. This 6.7% would represent 36 minutes total time where coaches (Participant One and Three) used coaching styles that required problem solving to be used by the players. We argue that this does not represent a significant amount of time and that the coaches are not meeting CA desired outcomes. CA does not specifically suggest an amount of time that coaches should use a coaching style encouraging player problem solving, nor would we suggest that there is a specific or ‘right’ number. However, considering Participant Two went the entire time using one style (Practice Style B), it is hard to believe that this would meet CA’s desire for coaches to be game-based in their coaching (Cricket Australia, 2022).
The discrepancy between the coaches self-reported coaching styles and what was observed (dominance of Style B) is similar to findings by others (Hewitt et al., 2016; Pill et al., 2016; SueSee & Barker, 2019; SueSee et al., 2019). This suggests that the tenets of GBA coaching, in the Australian context a GSA, may have recognition but lack wide-spread understanding despite being continually being asserted as the underpinning pedagogical expressionforjuniorsportcoachingandplayingforlife(Australia Sport Commission, 2023). Whilst the researchers observed games frequently, what they did not see as often (6.7% problem solving) were games requiring the solving of unknown problems and the use of questioning to encourage players into thinking (reflecting)
on their practice. CA’s coaching philosophy values solving problems through games however it does not speak about the role questioningplays in a GSA. Others (Ferner et al.,2023) suggested many current coaching education programs speak about coaching styles or methods, however, they fail to show coaches how to effectively implement a coaching philosophy congruent in practice with the coaching styles they promote for coaches.
Another factor that may have influenced the styles used was pedagogical coaching knowledge. Participant Three was the highest qualified (Level 3) coach and a high school teacher. This participant used the greatest number of coaching styles (n=4), had the lowest amount of time coded as management, and spent the most time using coaching styles that required players to solve problems. Whilst the sample size is too small to make causative claims, we suggest this participant’s pedagogical content knowledge (PCK) was the highest given their qualifications and may have had some effect. This is in line with others (Roberts, 2011) who recorded cricket coaches desiring more support to implement Teaching Games for Understanding in the United Kingdomwhen attemptingto implementplayer-centred coaching. The ASC suggests a GSA is a way to modify game strategies and concepts so there are opportunities to develop both skills and an understanding of the tactics of the game’ congruently and thereby help develop thinking players (Australia Sport Commission, 2023). The use of inquiry strategies by coaches using a GSA is accordant to coaches creating practice episodes that include using Coaching by Guided Discovery – Style F, Coaching by Problem Solving (Convergent Discovery) – Style G and Coaching for Creativity (Divergent Discovery) – Style H from The Spectrum of Coaching Styles (Pill et al., 2022). The three coaches in this research self-reportedusing Playing Form (O’Connor et al., 2020) type activities at times (or game-like environments), and in some cases the learning experiences were game-like where participants were required to use perceptual motor skills. However, this is where The Spectrum positions learning episodes differently by defining the coaching styles used based on decision making between the coach and participant to help define the coaching style. We argue that The Spectrum can provide the knowledge, skills and language to assist coaches in creating learning episodes which reflect the tenets of GBA’s. This research did not set out to prove that coaches lacked knowledge to implement a GSA, rather than to confirm if their coaching philosophies aligned with their coaching practice. As all three participants, in some capacity, verbalized a valuing of a GSA then it may be presumed, they would use a GSA where and when appropriate. Based on this premise, knowledge of The Spectrum could assist with greater alignment between the assumed coaching style and enacted coaching style (Hewitt, 2015). The Spectrum can provide an integration of declarative (what needs to be done) and procedural knowledge (how it needs to be done) which links back to the coach’s pedagogical judgement and decision-making intentions towards implementing a GBA (Pill et al., 2021).
While suggesting supporting coaches’ development and improving PCK may assist coaches alignment procedural knowledge relative to using a GBA with declarative knowledge relative to implementation, we note the multi-dimensional nature of coaching children in community cricket. If a coach was using any coaching style, but they believed a participant was not engaged, they very likely would change the coaching episode in the hope of re-engaging the participant. To put this in a context,
CA has its intentions that coaches be game-based, the coach may attempt to apply a version of that through coaching (pedagogical) style and the participant has their own agenda for participating in community cricket –which may or may not align and lead coaches to utter the ‘it’s fine in theory, but…’ (Jones, 2007) disposition towards a GBA. Other research has suggested barriers to coaches’ using GBA’s include a reluctance to ‘let go’ of direction and control (Light & Evans, 2010), lack of clarity in coach education as to what a GBA is inpractice(Reid & Harvey,2014),challenges adapting their session plans to the format of a GBA (Thomas et al., 2013), and under-developed PCK regarding questioning skills (O’Leary, 2014), a tenet of a GBA. Specific to cricket coaching, a factor which has been suggested is the excessive reliance on reproductive or direct teaching methods due to the traditional culture associated with the sport (Cassidy et al., 2008; Williams & Hodges, 2005). This includes cricket training frequently occurring in enclosed nets (Low et al., 2103). These factors must also be considered as potential influences on the pedagogical choices of participants in this study.
Conclusion
This research aimed to identify the coaching styles used by three community cricket coaches and if they aligned with their own beliefs about the styles they used, and the goals suggested by Cricket Australia of coaching using an approach that requires problem solving through games. Style B was the most used style and used by all participants in this study. All three participants used Style B over 80% of their coaching time. All the participants reported using games and problem solving (which are suggested components of GBA’s) during interviews but only two participants were observed using coaching styles that could create learning episodes that may lead to discovery and problem solving. The results indicate that in some cases, coaching style alignment was observed indicating congruence with self-reported coaching stylesorphilosophiesbetweenParticipantsOneandThree.Whilst Cricket Australia does not stipulate the amount of time coaches should use GBA’s, the researchers suggest that 6.7% of the time using a GBA (to create learning experiences requiring problem solving - approximately 36 minutes) out of 9 hours of coaching, will most likely not achieve the aims of player problem solving games (Cricket Australia, 2022). What can be claimed with certainty is that the majority of time players with the coaches in this study were not in environments representing the suggested coaching approach of CA. A lack of alignment exists with Cricket Australia’s stated coaching preference (problem solving) and the coaching stylesobservedduringthisresearch.Whilstthisresearch is not a critique of CA’s suggested coaching desires, perhaps what is needed is more specific and common language used to describe the coaching styles CA desires community coaches to use. For example, no one coaching style can achieve all aims and some scholars (SueSee et al., 2016; SueSee & Pill, 2018; Pill & SueSee, 2021) have argued that GBA’s are more than one style, and a common language is required to diminish confusion. We suggest the Spectrum can play a part in providing coaches with coaching knowledge that assists in alignment of coaching intention and coaching style. Pedagogical content knowledge (PCK) may predict the quality of teaching and the quality of student learning (Baumert et al., 2010; Iserbyt et al., 2020; Meier, 2021). Further,
we arguethis knowledgemayassist coaches toconstructcoaching episodes that others (Lascu at el., 2021; Low et al., 2013) have suggested are required for the development of cricketers. The Spectrum has been suggested as a way of providing this common language to help understand ‘that broad terminology such as GBAs and Direct Instruction do not adequately describe the teaching-learning decisions being made by the coach and player/s’ (SueSee & Pill, 2022, p. 132). Currently, CA’s ‘The Australian Way’ does not provide this common language to help coaches see the complexities of being a GBA coach and CA’s approach to coaching needs to be revisited if they wish to achieve the outcomes they state.
AI Acknowledgement
Generative AI or AI-assisted technologies were not used in any way to prepare, write, or complete essential authoring tasks in this manuscript.
Conflict of Interest
The author declares that there is no conflict of interest.
Acknowledgment
Acknowledge your institute/ funder/personal connections
References
Agnew, D., & Pill, S. (2023). The role of the coach in player retention and attrition. In M. Toms & R. Jeanes (Eds.), Routledge handbook of coaching children in sport (pp. 102–110). Taylor & Francis.
Ashworth, S. (2002). Identification of classroom teachinglearning styles [Unpublished manuscript]. https://spectrumofteachingstyles.org/index.php?id=52# Australian Sport Commission. (1996). Game sense: Perceptions and actions research report. Australian Sport Commission. (2023). Playing for life. https://www.sportaus.gov.au/p4l
Baumert, J., Kunter, M.,Blum,W., Brunner, M.,Voss, T., Jordan, A., Klusman, U., Krauss, S., Neubrand, M., & Tsai, Y.-M. (2010). Teachers’ mathematical knowledge, cognitive activation in the classroom, and student progress. American Educational Research Journal, 47(1), 133–180. https://doi.org/10.3102/0002831209345157
Benedek, M., Jauk, E., Fink, A., Koschutnig, K., Reishofer, G., Ebner, F., & Neubauer, A. C. (2014). To create or to recall? Neural mechanisms underlying the generation of creative new ideas NeuroImage, 88, 125–133. https://doi.org/10.1016/j.neuroimage.2013.11.021
Bunker, D., & Thorpe, R. (1982). A model for the teaching of games in the secondary school. BulletinofPhysicalEducation, 10, 9–16.
Byra, M., Sanchez, B., & Wallhead, T. (2014). Behaviors of students and teachers in the command, practice, and inclusion styles of teaching: Instruction, feedback, and activity level. European Physical Education Review, 20(1), 3–19. https://doi.org/10.1177/1356336X13495034
SueSeee et al. / The Journal of Sport and Exercise Science, Journal Vol. 9, Issue 2, 8-18 (2025)
Cassidy, T., Potrac, P., & Jones, R. (2008). Understanding sports coaching:Thesocial,culturalandpedagogicalfoundationsof coaching practice. Routledge. Collins, L., Carson, H. J., & Collins, D. (2016). Metacognition and professional judgment and decision making in coaching: Importance, application and evaluation. International Sport Coaching Journal, 3(3), 355–361. https://doi.org/10.1123/iscj.2016-0082
Connor, J., Renshaw, I., & Farrow, D. (2016). Evaluating a 12week games-based training program to improve cricket batting skill. Research Quarterly for Exercise and Sport, 87(S1), S30.
Connor, J. D., Farrow, D., & Renshaw, I. (2018). Emergence of skilled behaviors in professional, amateur and junior cricket batsmen during a representative training scenario. Frontiersin Psychology, 9, Article 2012. https://doi.org/10.3389/fpsyg.2018.02012
Cothran, D. J., Kulinna, P. H., Banville, D., Choi, E., AmadeEscot, C., MacPhail, A., Macdonald, D., Richard, J.-F., Sarmento, P., & Kirk, D. (2005). A cross-cultural investigation of the use of teaching styles.ResearchQuarterly for Exercise and Sport, 76(2), 193–201. https://doi.org/10.1080/02701367.2005.10599280
Cricket Australia. (2022a). Courses. https://www.community.cricket.com.au/coach/courses
Cricket Australia. (2022b). The Australian Cricket junior coaching principles. https://www.community.cricket.com.au/coach/coachingcricket/junior-coaching-principles
Culver, D. M., Werthner, P., & Trudel, P. (2019). Coach developers as ‘facilitators of learning’ in a large-scale coach education programme: One actor in a complex system. International Sport Coaching Journal, 6(3), 296–306. https://doi.org/10.1123/iscj.2018-0050
Darst, P. W., Zakrajsek, D. B., & Mancini, V. H. (1989). Analysing physical education and sport instruction (2nd ed.). Human Kinetics.
Davids, K., Button, C., & Bennett, S. (2008). Dynamics of skill acquisition: A constraints-led approach. Human Kinetics.
DeMarco, G. M. P., Mancini,V. H., Wuest, D. A., & Schempp, P. G. (1996). Becoming reacquainted with a once familiar and still valuable tool: Systematic observation methodology revisited. International Journal of Physical Education, 32(1), 17–26.
den Duyn, N. (1997). Game sense: Developing thinking players workbook. Australian Sports Commission.
Ferner, K., Ross-Stewart, L., & Dueck, D. (2023). The role of coach education in coaching philosophy development and implementation: A dual case study. The Sport Journal, 24.
Gardner, L. A., Magee, C. A., & Vella, S. A. (2017). Enjoyment and behavioral intention predict organized youth sport participation and dropout. Journal of Physical Activity & Health, 14(11), 861–865. https://doi.org/10.1123/jpah.20160613
Gréhaigne, J.-F., Godbout, P., & Bouthier, D. (1999). The foundations of tactics and strategy in team sports. Journal of Teaching in Physical Education, 18(2), 159–174. https://doi.org/10.1123/jtpe.18.2.159
Hewitt, M. (2015). Teaching styles of Australian tennis coaches: An exploration of practices and insights using Mosston and
Ashworth’s Spectrum of teaching styles [Unpublished doctoral dissertation]. University of Southern Queensland. Hewitt, M., & Edwards, K. (2011). Self-identified teaching styles of junior development and club professional tennis coaches in Australia. ITF Coaching and Sport Science Review, 55, 6–8. Hewitt, M., & Edwards, K. (2015). Self-identified teaching styles of junior development and club professional tennis coaches in Australia.InK.Larkin,M.Kawka,K.Noble,H.van Rensburg, L. Brodie, & P. A. Danaher (Eds.), Empowering educators: Proven principles and successful strategies (pp. 127–154). Palgrave Macmillan.
Hewitt, M., Edwards, K., Ashworth, S., & Pill, S. (2016). Investigating the teaching styles of tennis coaches usingTheSpectrum. SportScienceReview,25(3–4),350–373.
Hewitt, M., Edwards, K., Ashworth, S., & Pill, S. (2017, June 8–11). Observed teaching styles of Australian junior tennis coaches using Mosston and Ashworth’s Spectrum of Teaching Styles [Paper presentation]. AIESEP International Conference, Laramie, WY, United States.
Hodges, N. J., & Lohse, K. R. (2022). An extended challengebased framework for practice design in sports coaching. Journal of Sports Sciences, 40(7), 754–768. https://doi.org/10.1080/02640414.2021.2015917
Iserbyt, P., Coolkens, R., Loockx, J., Vanluyten, K., Martens, J., & Ward, P. (2020). Task adaptations as a function of content knowledge: A functional analysis. Research Quarterly for Exercise and Sport, 91(4), 539–550. https://doi.org/10.1080/02701367.2019.1687809
Jones, R. L. (Ed.). (2006). The sports coach as educator: Reconceptualising sports coaching. Routledge.
Jones, R. L. (2007). Coaching redefined: An everyday pedagogical endeavour. Sport, Education and Society, 12(2), 159–173. https://doi.org/10.1080/13573320701252729
Lascu, A., Spratford, W., Pyne, D. B., & Etxebarria, N. (2020a). Evaluating task design for skill development in an amateur female cricket team. PhysicalEducationand Sport Pedagogy, 26(4), 362–376. https://doi.org/10.1080/17408989.2020.1752648
Lascu, A., Spratford, W., Pyne, D. B., & Etxebarria, N. (2020b). Practical application of ecological dynamics for talent development in cricket. International Journal of Sports Science & Coaching, 15(2), 227–238. https://doi.org/10.1177/1747954120908816
Lascu, A., Spratford, W., Pyne, D. B., & Etxebarria, N. (2022). ‘Train how you play’: Using representative learning design to train amateur cricketers. Journal of Sports Sciences, 40(5), 498–508. https://doi.org/10.1080/02640414.2021.1923013
Light, R. L. (2012). Game sense: Pedagogy for performance, participation and enjoyment. Routledge.
Light, R. L., & Evans, J. R. (2010). The impact of game sense pedagogy on Australian rugby coaches’ practice: A question of pedagogy. Physical Education and Sport Pedagogy, 15(2), 103–115. https://doi.org/10.1080/17408980902729117
Low, J. C.-Y., Williams, A. M., McRobert, A. P., & Ford, P. R. (2013). The microstructure ofpractice activities engaged in by elite and recreational youth cricket players. Journal of Sports Sciences, 31(11), 1242–1250. https://doi.org/10.1080/02640414.2013.778419
Meier, S. (2021). Pedagogical content knowledge in students majoring in physical educationvs. sport science. The same but
SueSeee et al. / The Journal of Sport and Exercise Science, Journal Vol. 9, Issue 2, 8-18 (2025)
different? German Journal of Exercise and Sport Research, 51, 269–276. https://doi.org/10.1007/s12662-021-00725-7
O’Connor, D., Larkin, P., & Höner, O. (2020). Coaches’ use of game-based approaches in team sports. In S. Pill (Ed.), Perspectives on game-based coaching (pp. 117–126). Routledge.
O’Leary, N. (2014). Learning informally to use teaching games for understanding: The experiences of a recently qualified teacher. European Physical Education Review, 20(3), 367–384. https://doi.org/10.1177/1356336X13519502
Pill, S. (2015). Using appreciative inquiry to explore Australian footballcoaches’experiencewithgamesensecoaching. Sport, Education and Society, 20(6), 799–818. https://doi.org/10.1080/13573322.2013.824578
Pill, S., Agnew, D., & Abery, L. (2022). Analysis of a community club coach developer project. Physical Education and Sport Pedagogy, 28(5), 585–598. https://doi.org/10.1080/17408989.2022.2057912
Pill, S., Hewitt, M., & Edwards, K. (2016). Exploring tennis coaches’ insights in relation to their teaching styles. Baltic Journal of Sport and Health Sciences, 3(102), 30–43. https://doi.org/10.33607/bjshs.v3i102.66
Pill, S., & SueSee, B. (2021). The game sense approach as play with purpose. In S. Pill (Ed.), Perspectives on game-based coaching (pp. 1–10). Routledge.
Pill, S., SueSee, B., Rankin, J., & Hewitt, M. (2022). The spectrum of sport coaching styles. Routledge.
Potrac, P., Brewer, C., Jones, R., Armour, K., & Hoff, J. (2000). Toward an holistic understanding of the coaching process. Quest, 52(2), 186–199. https://doi.org/10.1080/00336297.2000.10491709
Reid, P., & Harvey, S. (2014). We’re delivering game sense . . . aren’t we? Sports Coaching Review, 3(1), 80–92. https://doi.org/10.1080/21640629.2014.941551
Roberts, S. J. (2011). Teaching games for understanding: The difficulties and challenges experienced by participation cricket coaches. Physical Education and Sport Pedagogy, 16(1), 33–48. https://doi.org/10.1080/17408980903412185
Rushall, B. S. (1977). Two observational schedules for sporting and physical education environments. Canadian Journal of Applied Sports Sciences, 2(1), 15–21.
Sherman, M. A. (1982). Style analysis checklists for Mosston’s spectrum of teaching styles [Unpublished manuscript]. University of Pittsburgh.
SueSee, B. (2012). Incongruence between self-reported and observed senior physical education teaching styles: An analysis using Mosston and Ashworth’s Spectrum [Doctoral dissertation, Queensland University of Technology]. QUT ePrints. https://eprints.qut.edu.au/55581/
SueSee, B., & Barker, D. (2019). Self-reported and observed teaching styles of Swedish physical education teachers.
Curriculum Studies in Health and Physical Education, 10(1), 34–50. https://doi.org/10.1080/25742981.2018.1518534
SueSee, B., & Edwards, K. (2011, April 18–20). Self-identified and observed teaching styles of senior physical education teachers in Queensland schools [Paper presentation]. 27th Australian Council for Health, Physical Education and Recreation (ACHPER) Conference, Adelaide, SA, Australia.
SueSee, B., Edwards, K., Pill, S., & Cuddihy, T. (2018). Selfreported teaching styles of Australian senior physical education teachers. Curriculum Perspectives, 38(1), 41–54. https://doi.org/10.1007/s41297-018-0040-0
SueSee, B., Edwards, K., Pill,S., & Cuddihy,T. (2019).Observed teaching styles of senior physical education teachers in Australia. Curriculum Perspectives, 39(1), 47–57. https://doi.org/10.1007/s41297-018-0059-2
SueSee, B., & Pill, S. (2018). Game-based teaching and coaching as a toolkit of teaching styles. Strategies, 31(5), 21–28. https://doi.org/10.1080/08924562.2018.1490226
SueSee, B., & Pill, S. (2022). Game-based and direct instruction coaching through a Spectrum of Teaching Styles lens. In S. Pill, B. SueSee, J. Rankin, & M. Hewitt (Eds.), The spectrum of sport coaching styles (pp. 123–133). Routledge.
SueSee, B., Pill, S., & Edwards, K. (2016). Reconciling approaches: A game-centred approach to sport teaching and Mosston’s spectrum of teaching styles. European Journal of Physical Education and Sport Science, 2(4), 69–96.
Thomas, G., Morgan, K., & Mesquita, I. (2013). Examining the implementation of a teaching games for understanding approach in junior rugby using a reflective practice design. Sports Coaching Review, 2(1), 49–60. https://doi.org/10.1080/21640629.2013.837113
van der Mars, H. (1989). Introduction to systematic observation. In P. W. Darst, D. B. Zakrajsek, & V. H. Mancini (Eds.), Analyzing physical education and sport instruction (2nd ed., pp. 3–19). Human Kinetics.
Vickery, W., Dascombe, B., Duffield, R., Kellett, A., & Portus, M. (2013). The influence of field size, player number and rule changes on the physiological responses and movement demands of small-sided games for cricket training. Journal of Sports Sciences, 31(6), 629–638.
https://doi.org/10.1080/02640414.2012.740875
Vickery, W., Dascombe,B., &Duffield, R.(2014).Physiological, movement and technical demands of centre-wicket Battlezone, traditional net-based training and one-day cricket matches: A comparative study of sub-elite cricket players. Journal of Sports Sciences, 32(8), 722–737.
https://doi.org/10.1080/02640414.2013.847526
Williams, A. M., & Hodges, N. J. (2005). Practice, instruction, and skill acquisition in soccer: Challenging tradition. Journal of Sports Sciences, 23(6), 637–650. https://doi.org/10.1080/02640410400021328
The Journal of Sport and Exercise Science, Vol. 9, Issue 2, 19-29 (2025) www.jses.net
ISSN: 2703-240X
Investigating the effects of rapid weight-loss and weight regain on neuromuscular performance prior to an international-level championship fight in an elite, professional boxer – A case study
Freddy Brown1*, Rhys Morris2
1School of Life Sciences, Coventry University, UK
2Department of Sport Sciences, Nottingham Trent University, UK A R T I C L E I N F O A B S T R A C T
Received: 14.10.2024
Accepted: 01.08.2025
Online: 05.12.2025
Keywords: Boxing
Rapid weight-loss
Power
Professional boxing is a weight-categorised combat sport in which strength and power are key determinants of success. Coupled with the use of day-before weigh-in schedules, these demands encourage fighters to undergo rapid weight-loss (RWL - from hypohydration and energy restriction) to “make weight” before refuelling and rehydrating before competition. However, no research has investigated the effects of RWL and subsequent recovery on precompetition performance. This case study therefore assessed neuromuscular performance in a 25-year-old professional super-welterweight boxer (154 lb or 69.9 kg) immediately before an “intercontinental” championship fight, comparing performance indices to those recorded over the preceding six-week “training camp.” Isometric mid-thigh pull, and anthropometry were monitored weekly for 5 weeks, along with countermovement (CMJ) and squat jump performance (SJ), which were quantified from jump heights, propulsive power and impulse, then used to construct 95% confidence intervals (CIs). Subsequently, performance and salivary hormones (cortisol and IgA) were quantified at the competition venue throughout 5 days of RWL, and pre-competition. Dietary intakes were confirmed from menus and ingredient lists. The boxer reduced body mass from 80.3 to 75.9 kg over 5 weeks of training, before losing a further 6 kg (7.9% body mass) from RWL to make the championship limit. All neuromuscular performance measures declined below CIs immediately before RWL, other than CMJ height and SJ impulse. Conversely, only CMJ and SJ impulse declined before weigh-in. After 36 h refeeding and rehydration (~10 g·kg-1·d-1 carbohydrate), the boxer increased body mass to 79.4 kg, re-establishing performance in all metrics before competition. Salivary IgA and cortisol concentrations peaked immediately before weigh-in and competition, respectively. These are the first data reporting the effects of RWL and subsequent regain on pre-competition performance in an elite boxer, and suggest that deficits in neuromuscular performance may be ameliorated by 36 h rehydration and refeeding.
1. Introduction
Professional boxing is a full-contact combat sport where victory is earned by landing “clean and effective” punches to achieve a knockout, technical knockout, or a points decision. Bouts are scored by awarding completed rounds according to the power and number of punches landed, as well as the judges’ perceptions of
“effective aggression”, “ring generalship”, and defensive ability (Association of Boxing Commissions, 2005). Strength and power are therefore key determinants of success (Chaabène et al., 2015; Halperin, Hughes, & Chapman, 2016; Ruddock, Wilson, Thompson, Hembrough, & Winter, 2016). Importantly, boxing is a weight categorised sport, with professional bouts contested in 17 weight classes to avoid extreme disparities in size and strength (Association of Boxing Commissions, 2005). Accordingly,
*Corresponding Author: Freddy Brown, Ph.D. School of Life Sciences, Coventry University, UK, ad1385@coventry.ac.uk
boxers frequently aim to compete in a weightcategory belowtheir natural weight (“making weight”) to avoid conceding physical advantages (Halperin et al., 2016; Morton, Robertson, & Sutton, 2010; Pettersson, Ekström, & Berg, 2013) for the purpose of this article ‘weight’ is being used colloquially for ‘body mass’ in keeping with SI units). As well as striving to optimise body composition throughout training, boxers commonly undertake an additional period of rapid weight-loss (RWL) in the days before weigh-in (Langan-Evans, Close, & Morton, 2011; Morton et al., 2010; Reale, Slater, & Burke, 2017b), involving the deliberate depletion of muscle glycogen, total body water and gut-weight (Reale, Slater, & Burke, 2017a; Reale et al., 2017b). As weighins for championship boxing matches are conducted ~36 h before competition (Association of Boxing Commissions, 2005), aggressive rehydration and carbohydrate replenishment strategies may permit boxers to regain 5–10% of their weight before the enter the ring (Baribeau et al., 2023). However, the extreme levels of hypohydration (~10% body mass; Coswig, Fukuda, & Del Vecchio,2015)andenergyrestriction(multipledays ≤500kcal·d1; Castor-Praga et al.,2023) commonly associated with RWL pose serious risks to both health and performance (Barley, Chapman, & Abbiss, 2018; Kasper et al., 2019). Indeed, whilst exercising in the heat is a common method used to facilitate hypohydration and RWL (Park, Alencar, Sassone, Madrigal, & Ede, 2019; Reale, Slater, & Burke, 2018a), instances of heat injury are not uncommon (Barley, Chapman, & Abbiss, 2019), with rare accounts of resulting fatalities providing a sobering reminder of the risks involved (Control & Prevention, 1998; Zhuo, Li, & William, 2019). There is no consensus on what degree of RWL may be carried out safely (Burke, Slater, Matthews, LanganEvans, & Horswill, 2021; Linden, 2021; Peacock et al., 2022)
To date, few studies have investigated the effects of RWL and subsequent regain on professional boxing performance (Baribeau et al., 2023; Daniele, Weinstein, Wallace, Palmieri, & Bianco, 2016). In first instance, Daniele et al. (2016) reported no differences in body mass between winners and losers at a mandatory second weigh-in (+24 h) in 142 professional boxers (126 men, 16 women) competing in IBF World Championship bouts. Conversely, a recent study on 1392 male professional boxers by Baribeau et al. (2022) reported that winners regained significantly more body mass than losers (8.0% ± 3.0% vs 6.9% ± 3.2%, p < 0.01), prior to a second weigh-in on arrival at the competition venue. However, neither prior RWL, nor body mass immediately pre-competition was quantified in either paper. Moreover, as decisions in boxing depend upon judges’ subjective perceptions of skill and dominance (Dunn, Humberstone, Iredale, Martin, & Blazevich, 2017), analysis of winning/losing only is insufficient to describe the physiological effects of RWL.
As the generation of punch force originates in the lower-body (Lenetsky et al., 2020; Stanley, Thomson, Smith, & Lamb, 2018), measures of lower-limb neuromuscular function may offer noninvasive/non-fatiguingperformancemarkersforuseatcompetition. Indeed, the analysis of force-time data from vertical jumps and isometric lower-limb contractions is common for monitoring adaptation and fatigue in team sports (Bishop et al., 2022; Harper, Cohen, Rhodes, Carling, & Kiely, 2022). Furthermore, the increased availability and affordability of portable hormonal assays (Coad,Mclellan, Whitehouse, &Gray,2015),offersmorepotential insight for competition readiness. For example, salivary measures of cortisol (elevations of which are associated with a catabolic
environment and impaired recovery status) and immunoglobulin A (sIgA; a marker of immune function and exercise-induced physiological stress) have been validated for monitoring athletic recovery (Lee et al., 2017; Turner, Loosemore, Shah, Kelleher, & Hull, 2021). Due to the limited research on the impact of RWL and subsequent recovery immediately pre-competition, the present case study aimed to assess the effects of RWL, and subsequent weight regain on neuromuscular performance and hormonal markers in an elite professional boxer before a championship bout. Additionally, as all food was provided in the competition venue/hotel throughout RWLandrecovery,performancechangeswith RWL wereassessed in the context of a rigorous dietary analysis.
2. Methods
2.1. Design
Following institutional ethics approval (P121420) a 25 year-old, elite-level (McKay et al., 2021), male professional super welterweight boxer (competition weight 154 lb or 69.9 kg; habitualweight~81kg;stature183cm)wasmonitored throughout a six-week “training camp.” Subsequently, he competed for an “intercontinental title” over 10 × 3 min rounds (Table 1). Vertical jump performance, lower-body strength in the isometric midthigh pull (IMTP), and anthropometry were monitored weekly in the UK for 5 weeks (“block A”), with averages and SDs used to construct 95% confidence intervals (CI), using a t-distribution (Smithson, 2003). The final week involved travel to competition (Dallas, Texas), and 5 days’ RWL (“block B”), during which performance was assessed and compared to derived 95% CIs using what is known as an A-B research design (Figure 1; Kinugasa, 2013; Kinugasa, Cerin, & Hooper, 2004). The final weekly monitoring session of the boxer’s training camp (6 days before competition) also served to quantify performance at the start of RWL (D-6), from which point urinary measures of hydration, sIgA, and cortisol were also assessed. The day before weigh-in (D-2), the boxer commenced deliberate hypohydration from the early evening, after which jump performance was assessed. Jump performance and hydration were then evaluated immediately before the weigh-in (D-1), and on the day of competition (D0). Performance changes during RWL were deemed significant if mean values crossed the 95% CI. Due to logistical constraints, and perceived injury-risk, IMTP was not measured during RWL.
2.2. Procedures
Resting metabolic rate (RMR) was determined at baseline (MetaLyzer 3B System; Cortex, Leipzig, Germany) and used as a lower threshold for planned energy intake throughout training (Morton et al., 2010). Lower body performance was monitored throughout training camp from countermovement jump (CMJ) and squat jump (SJ) force-time indices, using the in-built software of a commercially available force plate sampling at 1000 Hz (Hawkins Dynamics, Westbrook, ME). Jump heights (cm), as well as peak and mean propulsive power (W) were derived from the impulsemomentum relationship. These metrics were deemed important, consideringtheirutilityformonitoringperformanceinsportswhere athletesmaynotbeexperiencedortechnicallyproficientinjumping,
Table 1: Weekly performance scores and anthropometric data over training camp.
Note: Days D-6 to D-1 indicate days until competition, with D0 (Box) indicating competition day; CMJ = Countermovement jump height; CMJimp = Countermovement jump propulsive impulse; CMJimpNet = Countermovement jump net propulsive impulse CMJPP = Countermovement jump peak propulsive power; NCMJPP = Countermovement jump normalised peak propulsive power; CMJMP = Countermovement mean propulsive power; NCMJMP = Countermovement jump mean normalised peak propulsive power; CMJFpk = Countermovement jump peak propulsive force; CMJFpkNet = Countermovement jump peak net propulsive force; CMJVpk = Countermovement jump peak velocity; SJ = Squat jump height; SJimp= Countermovement jump propulsive impulse; SJimpNet = Squat jump net propulsive impulse; SJPP = Squat jump peak propulsive power; NSJPP = Squat jump normalised peak propulsive power; SJMP = Squat mean peak propulsive power; NSJMP = Squat jump normalised mean propulsive power; SJFpk = Squat jump peak propulsive force; SJFpkNet = Squat jump peak net propulsive force; SJVPk = Squat jump peak velocity; IMTP = Isometric mid-thigh pull peak force; NIMTP = Normalised IMTP; Week 3 data missing due to the boxer travelling for sparring.
| https://doi.org/10.36905/jses.2025.02.03
Brown et al. / The Journal of Sport and Exercise Science, Journal Vol. 9, Issue 2, 19-29 (2025)
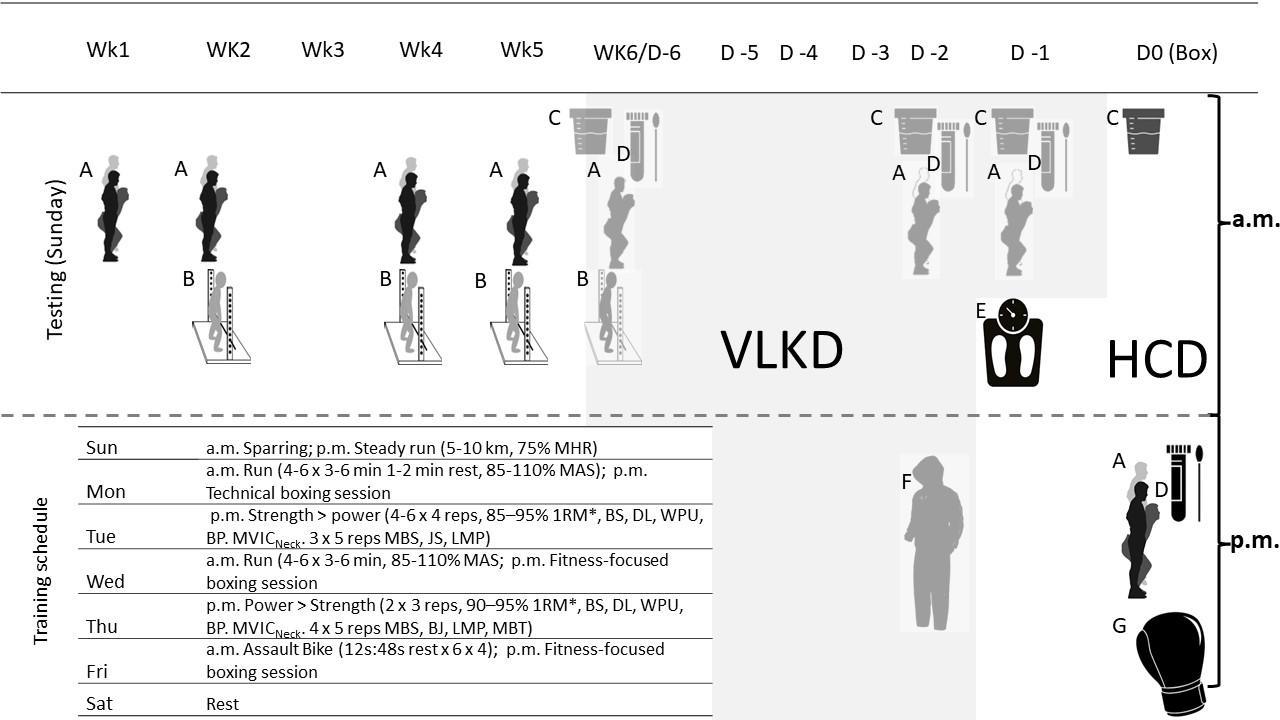
Figure 1: Study design. Note: MHR = Maximal heart rate; MAS = Maximum aerobic speed; Reps = repetitions; 1RM* = Predicted 1 repetition-maximum; BS = Back squats; DL = Deadlift; WPU = Weighted pull-up; BP = Bench-press; MVICNeck = Maximal isometric voluntary contraction of the neck (flexion, side flexion left and right); MBS = Medicine-ball slams; JS = Jump squats; LMP = Landmine-press; BJ = Box jump; VLKD = Very low calorie diet and water loading (8L D-6/D-5/D-4; 4L D-2; 1L D-1). HCD = High carbohydrate diet. (A) Countermovement jump and squat jump testing; (B) Isometric mid-thigh pull testing; (C) Urinary hydration testing (specific gravity and osmolarity); (D) Salivary hormonal assays (cortisol and IgA); (E) Championship weigh-in; (F) Hypohydration protocol (athlete’s own) consisting of exercise in plastic clothing, bathing, and towel wrapping; (G) Competition (intercontinental title bout over 10 × 3 min rounds.
JSES | https://doi.org/10.36905/jses.2025.02.03
with the use of both CMJ and SJ chosen to assess muscle function bothwithandwithouttheuseofthestretch-shorteningcycle(Gross & Lüthy, 2020; Loturco et al., 2016). Additionally, impulse (N⋅s) was calculated as the integral offorceovertime, as commonlyused to assess physiological capacity for high intensity sports specific actions, such as throwing or punching performance (Bartonietz, 1996; Lenetsky et al., 2020; Zaras et al., 2014). Jumps were performed with arms akimbo following 4 s quiet standing and reported as mean ± SD from three attempts. Throughout training, IMPT (peak force; N) was assessed from a 5 s maximal effort. The athlete was familiar with all performance tests from previous training camps, as evident from between-session coefficients of variationfrom2.3–4.6%forallmetrics,comparingperformancefor eachrepetitionbetweentwomeasurementstakenatsimilarweights. Skinfolds (Σ8; mm) were assessed by an experienced level 1 anthropometrist using a Harpenden skinfold caliper (British IndicatorsLtd.,West Sussex, UK),havingdemonstratedCVs <5%. Body mass (kg) was taken following a morning void (Seca 880, Digital Scales, Seca Ltd, Birmingham, UK). Hydration was assessed from urine osmolarity (Vitech Scientific, West Sussex; mOsm·L-1)andspecificgravity (9SA-BR32TRefractometer, ColeParmer Instruments, St Neots, Cambridgeshire, UK), from the first morning void, as commonly reported in combat athletes (Matthews & Nicholas, 2017; McDermott et al., 2017)
Physiological stress was monitored further throughout RWL from salivary hormones at the start and completion of RWL (two days, at either end) of RWL, as well as immediately precompetition. Cortisol (nmol/L) and immunoglobulin A (sIgA; µg/mL) were assessed using portable, lateral-flow immunochromagraphic assays (IPRO Interactive, Wallingford, UK), as described previously (Coad et al., 2015). These tests demonstrated excellent reliability and validity compared to existing point-of-care methods (r = 0.98; 95% CI [0.96, 0.99]; Dunbar, Jehanli and Hazell, 2015), whilst reliability was also assessed by taking duplicate samples at baseline, which demonstrated a within-day precision of 2.4% for sIgA and 4.3% forcortisol.Subsequentmeasures weretaken fromsinglereadings due to financial and logistical constraints
2.3.
Nutritional strategy
Based on prior competitive experience, the athlete and his coach targeted a morning weight of 75 kg for the week of competition, before losing the rest through RWL. This degree of RWL (< 7%) has previously been reported in combat athletes (Kasper et al., 2019; Kirk, Langan-Evans, & Morton, 2020; Matthews & Nicholas, 2017), necessitating the loss of 5 kg in 5 weeks. Energy requirements were estimated from predictive equations derived from boxers (Ismail, WD, & Zawiah, 1997) and nutritional guidance based on a deficit of 1100 kcal per day, assuming an energyrequirementofapproximately 7700kcalper1kgreduction in body mass (Heymsfield et al., 2012). The intakes initially prescribed would have provided energy in excess of RMR at all points before RWL (Langan-Evans et al., 2011; Morton et al., 2010) However, to account for the possibilities of underreporting (Ferraris, Guglielmetti, Trentani, & Tagliabue, 2019) or energy restriction leading to a subsequent reduction in energy expenditure (Betts et al., 2014; Lebron, Stout, & Fukuda, 2024) the athlete was advised to adjust intake (by first looking to reduce sources of fat
from the day’s intake, before adjusting portions/frequency of starchy carbohydrates) to achieve weekly/daily weight targets. A highproteindiet(≥1.8g·kg-1)wasprescribedtooptimiseleanmass throughout energy restriction (Aragon et al., 2017; Helms, Zinn, Rowlands, & Brown, 2014). A low/moderate carbohydrate intake of 2–4 g·kg-1 was made necessary by the required energy deficit, with the athlete consuming higher carbohydrate meals and snacks between training sessions on days of high-intensity training (Figure 1), to optimise carbohydrate availability (Marquet et al., 2016). To aid monitoring throughout training (Evenepoel et al., 2020),theboxerweighed foodbeforecooking,thenrecordedfood intake using a mobile phone application (MyFitnessPal, San Francisco, California, USA).
During RWL, the athlete consumed a very low carbohydrate (120 g·d-1, declining to 20 g·d-1) and sodium intake (500–1000 mg·d-1) and increased fluid intake to 4–8 L·d-1 as part of their habitual “water-loading” protocol, with the aim of reducing water retention (Kasper et al., 2019; Reale, Slater, Cox, Dunican, & Burke, 2018b). This strategy was based upon the boxer’s own acquired knowledge, with the support team recording physiological responses with the aim of assessing the efficacy and safety of RWL. The athlete consumed 8 L·d-1 from D-6 to D-4, and 4 L on D-3, before reducing intake to only 1 L on D-2, prior to commencing deliberate hypohydration in the evening. This started with the boxer skipping and shadow-boxing wearing a combination of a plastic “sweat suit” and tracksuit, before undertaking a combination of hot water immersion (as hot as the athlete could tolerate for 10 min), alternating with periods of being wrapped in towels (5 min) while hot water was replaced (Kasper et al., 2019). The athlete got to within 1 kg of the target weight before sleep, completing the weight-cut (skipping) the following morning (D-1). Fluid intake over this phase was confirmed by the athlete drinking known volumes from a marked bottle. Following weigh-in, the boxer was instructed to rehydrate by drinking a volume of 40 mM sodium solution (SOS Hydration, London, UK) which exceeded measured fluid losses (Merson, Maughan, & Shirreffs, 2008), before subsequently resuming his habitual intake of ~3–4 L day (a minimum of 3L, or 40 ml·kg-1·d-1 , drinking more according to thirst; Vivanti, 2012) Over the 36 h between weigh-in and competition, the athlete was advised to consume an intake of ~10 g·kg·d-1 carbohydrates to replenish muscular glycogen (Morton et al., 2010). Food was provided in known quantities at the competition venue, with detailed ingredient lists provided by the head chef for analysis. Additional food bought at a local supermarket was analysed using the nutritional information on food packets.
3. Results
At baseline, the athlete’s body mass, stature, and RMR were 80.3 kg, 1.82 m, and 2042 kcal·d-1, respectively, with all other performance and anthropometric data reported in Table 1. Body mass was reduced to 75.9 kg over the initial 5-week camp (block A), alongside a reduction in skinfolds from 49.6 mm to 37.1 mm (Table 1). Confirming the suitability of the A-B design employed, all performance measures appeared to plateau over this phase (Table 1). Descriptive improvements in jump metrics from weeks 1–4 (6.4–9.8%) were followed by declines over the following 2 weeks, with all values falling to -10.1 to -0.7% immediately
before RWL commenced, except for a significant 7.1% improvement in SJ impulse. Conversely, IMPT declined from baseline,reachingaminimumof2915N(-8.5%)whichfellbelow the 95% CI at week 6. Conversely, descriptive declines (40 to 38 N·kg-1, or -4.3%) in normalised IMTP performance were maintained within the 95% CI (38–42 N·kg-1).
The water-loading phase resulted in a 1.4 kg (1.8%) reduction in body mass over 5 days (75.9–74.5 kg), before a further 4.6 kg (6.2%) was lost following exercise and hot water immersion. The boxer subsequently made championship weight (Figure 2). Average daily fluid and sodium intakes over the 5 days were 5.28 L and 815 mg, respectively (Table 2). Performance throughout RWLispresentedinFigure2.WiththeexceptionofCMJheightand SJimpulse,allneuromuscularperformancemeasuresdeclinedbelow the 95% confidence interval by the final testing session of camp (D6;Figure1),priortothecommencementofrapidweightloss(RWL). Conversely, both SJ and CMJ height were significantly higher than average training performance at D-2 (the evening before the weigh
in),aswellasSJpeakpower,asmeasuredimmediatelyafteranacute body mass reduction from 74.5 kg to 72 kg. Propulsive impulse for both CMJ and SJ then declined before weigh-in. In the 36 h following weigh-in, the boxer consumed 5453 kcal·d-1 (80.9 kcal·kg-1·d-1), consisting of 140 g·d-1 protein (2 g·kg-1·d-1) 728 g·d1 carbohydrate (10.4 g·kg-1·d-1) and 242 g·d-1 fat (3.5 g·kg-1·d-1), with 14827 mg·d-1 sodium (Table 2). Body mass increased by 9.5 kg (13.6%), with the athlete entering the ring at 79.4 kg. Urine osmolarity and SG increased from the day before weigh-in (560 mOsmol·kg-1, 1.016 kg m-3) to the morning of the weigh-in (1020 mOsmol·kg-1, 1.027 kg m-3), and was 970 mOsmol·kg-1/1.026 kg m-3 on the morning of competition. Following the pre-fight warmup, neuromuscular performance was restored to baseline levels for all measures, other than a significant improvement in SJpropulsive impulse(Figure2).HormonalmarkersvariedoverRWL,withsIgA peaking before weigh-in, and the maximum cortisol concentration recorded immediately pre-competition.
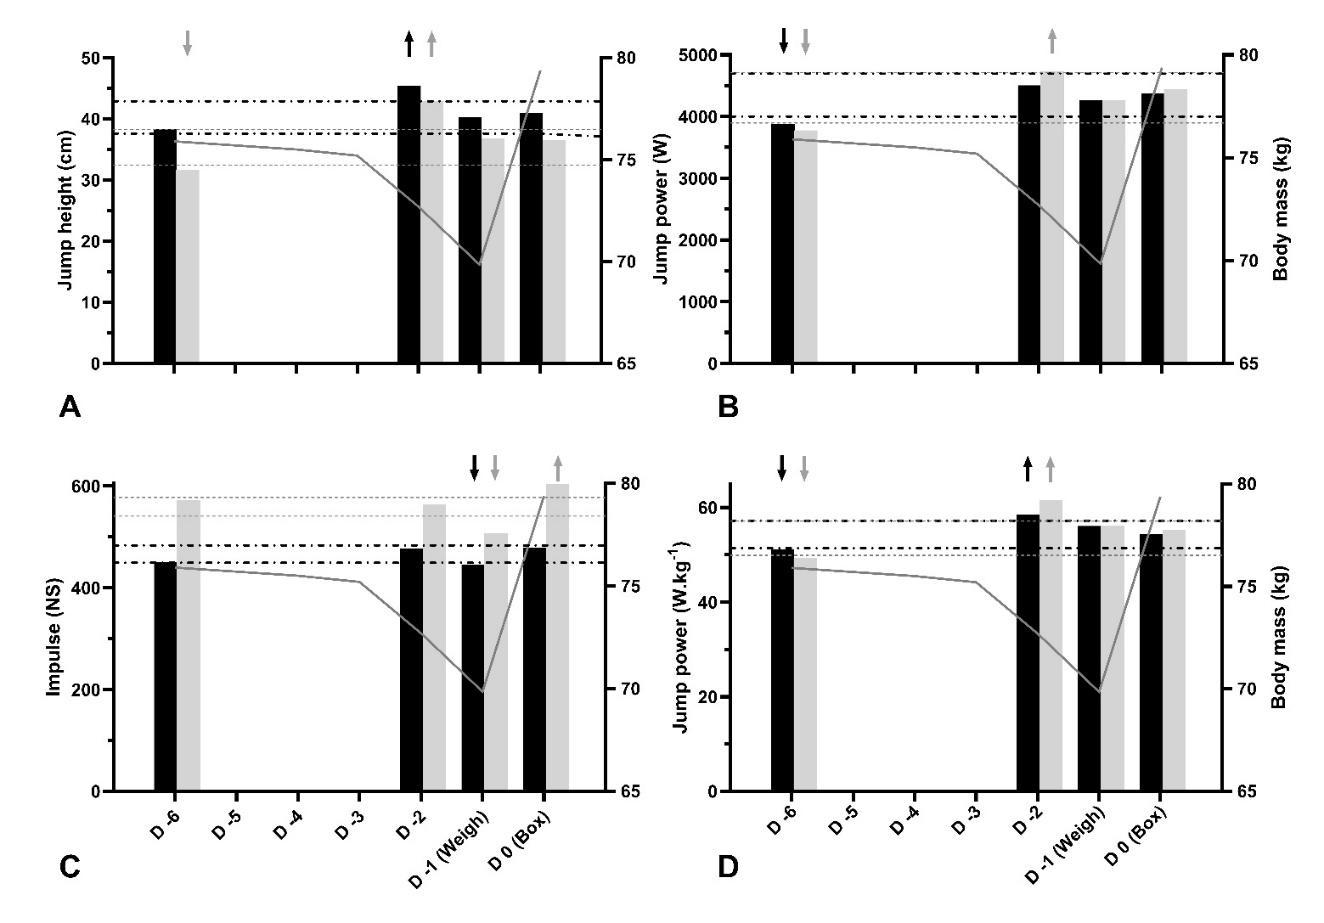
Figure 2: Countermovement and squat jump performance throughout rapid weight-loss, alongside changes in body mass. Note: A = Jump height; B = Peak propulsive power; C = Propulsive impulse; D = Normalised peak propulsive power; Days numbered as D-6 to D0, with D0 (Box) indicating competition day; Weigh = weigh-in; Black solid bars = Countermovement jumps; Grey solid bars = Squat jumps;Black andgreydashedlinesrepresentupperandlower95%confidencelimitsforsquatjumpandcountermovementjumpmetrics, respectively, with arrows representing significant elevations above, or declines below confidence limits.
Table 2: Daily nutritional intakes, body mass and hormonal changes throughout RWL
Note: EI = Energy intake; Pro = protein; CHO = carbohydrates; Na = sodium; Weigh = weigh-in; Box = Competition day; Urine mOsm·kg-1 = Urine osmolarity; Urine SG = Urine specific gravity; sIgA = Salivary immunoglobulin-A concentration; *Nutrition on fight-day was only recorded up to competition, and excludes post-fight nutrition; *Baseline sIgA concentration before training camp recorded as 21.5 ug·ml-1; **Baseline cortisol concentrations before training camp recorded as 4.5 ng·ml-1
4. Discussion
This is the first study to report the effects of RWL and subsequent regain on pre-competition performance in an elite boxer. Importantly, our findings suggest that this boxer was able to reestablish lower-body neuromuscular performance when RWL of 7.9% body mass over the final week before weigh-in (6.2% body mass in the preceding 24 h) was followed by a 36 h rehydration and refeeding strategy. These findings are made all the more significant considering the level of the participant. As punch performance depends upon force generation in the lower-body (Lenetsky et al., 2020; Loturco et al., 2016; Stanley et al., 2018), these findings have important implications for elite boxers undertaking RWL.
Despite weighing-in at the competition limit of 154 lb (69.9 kg), the boxer averaged 78.2 kg over camp, entered the ring at 79.4 kg, and displayed normalised performance scores exceeding those from the limited data on high-performance boxers. The boxer’s absolute IMTP performance appears at least equal to that of an elite Australian super-middleweight (competition limit of 168 lb or 76.2 kg), reported previously (Halperin et al., 2016), who recorded values of ~3170, or 40 N·kg-1 (mean of the best two attempts), seven weeks pre-competition (when 80 kg). These values fall within the 95% CI calculated in the present study and are comparable to our boxer’s baseline scores of 3186 ± 66 (3116 to 3247 N, or 39 to 41 N·kg-1) five weeks before competition, despite him competing two weight-classes below. Similarly, his normalised scores greatly exceed those recorded in national/international-level amateurs (34 ± 4 kg-1) (Dunn, Humberstone, Franchini, Iredale, & Blazevich, 2022). Regarding the boxer’s lower-body power, his mean (40.2 ± 2.2 cm) and best (43.5 ± 2.2 cm at four weeks, ranging from 41–45.1 cm over three
attempts) CMJ performance throughout camp also compare favourably with those from Halperin’s case study (~40 cm), as well as the Brazilian national amateur squad (Loturco et al., 2016). Loturco and colleagues reported descriptively lower CMJ values of 37 ± 5 cm, although they reported peak (rather than average) jump heights, which were calculated from flight time a method known to provide a significant overestimate (Wade, Lichtwark, & Farris, 2020).Whilst strong and powerfulfor hisweight, theRWL phase allowed the boxer to compete in an even lower category to maximise his physiological advantages.
Despite demonstrating impressive levels of strength and power, neuromuscular performance appeared to decline at the end of the initial training block. Most jump metrics and absolute peak IMPT force declined below the 95% CI by week 6 (Table 1). Taken alongside the fact that descriptive declines (40 to 38 N·kg1, or -4.3%) in normalised IMTP performance were maintained within the 95% CI (38–42 N·kg-1) it is likely that observed performance changesreflect the effects of weight-making, and the cumulative physiological stress associated with training with insufficient energy availability (Garthe, Raastad, Refsnes, Koivisto, & Sundgot-Borgen, 2011).
The current findings support previous research reporting inconsistent effects from hypohydration on maximal strength and power (Judelson et al., 2007; Montain et al., 1998; Pallarés et al., 2016; Savoie, Kenefick, Ely, Cheuvront, & Goulet, 2015; Schoffstall, Branch, Leutholtz, & Swain, 2001). Lower body isometric strength and jump performance can withstand as much as 4.8 ± 0.4% body mass reduction (Judelson et al., 2007), while combat athletes classified as moderately hypohydrated at weighin (urine osmolarity 701–1080 mOsm·kg-1) showed no improvement in any metric of strength or power in bench press, CMJ or grip-strength tests following rehydration of 1.2 ± 0.2%
body mass (Pallarés et al., 2016). Furthermore, it is likely boxers familiar with RWL have a high tolerance for hypohydration, with even club-level amateurs being observed to withstand fluid losses of 4% body mass without affecting punch force during simulated bouts (Smith et al., 2001; Smith, Dyson, Hale, Harrison, & McManus, 2000). Whilst the boxer in the current study suffered greater acute fluid losses (6.2% body mass), he then regained almost twice the weight lost before competing, suggesting a meaningful improvement inhydration status (Figure2).However, it must be acknowledged that body mass variation represents an indirect and imprecise measure of hydration (Barley, Chapman, & Abbiss, 2020), likely influenced by sizeable contributions from glycogen replenishment and gut weight (Reale et al., 2017a, 2018a). Importantly, however, it is well established that hypohydration is more detrimental to endurance compared to neuromuscular performance (Kasper et al., 2019; Montain et al., 1998), while the studies of Smith et al. focused on amateurs competing over 11 min, as opposed to the 39 min undertaken by the boxer inthe current study.Future research is required toassess the effects of large magnitudes of RWL and rehydration on endurance and boxing-specific performance.
The current findings may serve to highlight appropriate indices for monitoring performance throughout RWL. For example, whilst measures of force and impulse remained stable mid-way through the boxer’s hypohydration protocol (D-2, following the loss of 2.5 kg fluids, or 3.3% body-mass), significant improvements were observed (somewhat counterintuitively) for CMJ and SJ jump heights, as well as for measures of peak velocity and power (Figure 2). Personal bests (PBs) were recorded for the heights and peak velocitiesofbothjumps,aswellasforbothabsoluteandnormalised peak CMJ power, and normalised SJ power (Table 1; Figure 2). These outcomes were maintained even on the morning of the weigh-in, with only absolute CMJ and SJ impulse values deteriorating below the 95% CI (Figure 2). Before competition, impulse values for CMJ and SJ then recovered and exceeded established 95% CIs, respectively. Such findings are likely explained by considering the technical and load-bearing nature of jumping. Body mass reductions from RWL will have reduced the work the boxer was required to perform against gravity, explaining observed improvements in velocity-based metrics (Savoie et al., 2015). This phenomenon is more commonly observed in well trained athletes, who may be better able to tolerate the negative impacts of hypohydration (Savoie et al., 2015). It is also possible that utilizing jump height as a discrete performance outcome may be insensitive to subtle changes in neuromuscular function, with athletes potentially able to preserve performance via compensatory technical changes (Kennedy & Drake, 2017; Spencer et al., 2023). In contrast to jump heights and power metrics, impulse was sensitive to RWL and recovery (Figure 2). This measure is particularly important, with impulse being mathematically equivalent to a change in momentum and therefore a commonly used measure of performance in punching (Lenetsky, Nates, Brughelli, & Schoustra, 2016; Stanley et al., 2018), and explosive movements such as throwing (Bartonietz, 1996; Lenetsky et al., 2020; Zaras et al., 2014). Impairments may have been related to neuromuscular deficits from hypohydration, which originatefrom electrolyte losses disrupting electrochemical gradients, subsequently impairing membrane conductivity, calcium metabolism and motor-unit recruitment (Uddin, Tallent, & Patterson, 2022a). However, it is likely that reductions in CMJ/SJ
impulse were predominantly mediated by changes in total mass, with net impulse unaffected in either jump (Table 1). Similarly, no reductions in either total, or net propulsive forces were observed throughout in response to RWL. It would therefore appear that RWL had little effect on neuromuscular indices of jump performance, although monitoring impulse may provide a measure of absolute force application, which is sensitive to RWL.
Observed changes in hormonal markers do not immediately suggest any utility for monitoring the effects of RWL (Table 2). In contrast to previous observations that declines in sIgA indicate physiological stress andapotentialimpairmentofimmunefunction (Turneretal.,2021;Uchinoet al.,2024),theboxer’ssalivarylevels descriptively increased from baseline over RWL, peaking before weigh-in. It is likely that the extreme levels of hypohydration observed reduced saliva flow-rates to increase relative concentrations of this marker (Fortes, Diment, Di Felice, & Walsh, 2012). Furthermore, whilst the observation that peak cortisol concentrations were recorded immediately before competition supports observations of this marker being sensitive to precompetition arousal (Filaire, Sagnol, Ferrand, Maso, & Lac, 2001; van Paridon, Timmis, Nevison, & Bristow, 2017) this measure was not sensitive to the stresses imposed by RWL (Table 2).
The current study is unique in reporting the performance impacts of RWL in situ, before elite, international competition and can inform practitioners and researchers in formulating and monitoring RWL strategies. However, findings must be contextualised alongside several important limitations; not least of which is the lack of generalisability of a study on a single participant. No measures of punch performance, or endurance were taken, while the urinarymeasures of hydration analysed may be unreliable in the face of large, acute changes in fluid intake (Maughan & Shirreffs, 2010). For example, despite the 13.6% increase in body mass over 36 h recovery and rehydration, urine osmolarity and specific gravity did not decline to levels typical of adequate hydration commonly taken as osmolarity 500–700 mOsm/kg, or specific gravity < 1.02 (Maughan & Shirreffs, 2010; Table 2). Furthermore, whilst energy and macronutrient intake throughout RWL were closely monitored in person, the accuracy of dietary monitoring throughout camp is uncertain, considering the propensity of athletes with weight-loss targets to underreport (Ferraris et al., 2019). Accordingly, this study focused on the principal research question of the effect of RWL on physiological parameters over the final week’s build-up to competition. Perhaps most importantly for the boxer’s safety, no evidence was obtained on the boxer’s reaction time or cognitive function following RWL (Uddin, Waldron, Patterson, Winter, & Tallent, 2022b), which likely influence boxers’ abilities to defend themselves (Clark & Sirois, 2020; Teramoto, Cross, Cushman, & Willick, 2018; Uddin et al., 2022b). The effects of RWL and subsequent recovery on endurance performance, punch performance and cognitive functionremaintobeexplored.Finally,sincenotrainingloaddata was collected, it is plausible that training volume and intensity influenced the reported outcomes. The initial reductions in jump performance during the weight cut could have been a result of overreaching following 6 weeks of intense training with limited energy availability (Garthe, Raastad, Refsnes, Koivisto, & Sundgot-Borgen, 2011), with the subsequent recovery in these variables likely reflecting a reduction in training volume and the compensatory phase of recovery.
Brown et al. / The Journal of Sport and Exercise Science, Journal Vol. 9, Issue 2, 19-29 (2025)
Conclusion
The current evidence indicates that 36 h was sufficient time to restore lower-body muscle function when RWL was followed with a dietary strategy comprising of a high carbohydrate diet and rehydration with high sodium solutions. Future research assessing endurance and boxing specific performance is required.
Conflict of Interest
The authors declare no conflict of interests.
Acknowledgment
We owe a debt of thanks to the coach and boxer involved in this study, along with Dr. Jason Talis for technical guidance, and Chef Mouhssine Benhamacht (“Moose”) from the Loews Hotel, Arlington, Texas for liaising over the boxer’s dietary needs.
References
Aragon, A. A., Schoenfeld, B. J., Wildman, R., Kleiner, S., VanDusseldorp, T., Taylor, L., Earnest, C. P., Arciero, P. J., Wilborn, C., & Kalman, D. S. (2017). International society of sports nutrition position stand: Diets and body composition. Journal of the International Society of Sports Nutrition, 14(1), 1–19.
Association of Boxing Commissions. (2005). Regulatory guidelines. Retrieved from https://www.abcboxing.com/abcregulatory-guidelines/
Baribeau, V., Kirk, C., Le, D. Q., Bose, A., Mueller, A., French, D., Sarge, T., Langan-Evans,C., Reale, R., & Murugappan,K. R. (2023). Rapid weight gain and weight differential predict competitive success in 2100 professional combat-sport athletes. International Journal of Sports Physiology and Performance, 18(1), 85–94.
Barley, O. R., Chapman, D. W., & Abbiss, C. R. (2018). Weight Loss Strategies in Combat Sports and Concerning Habits in Mixed Martial Arts. The International Journal of Sports Physiology and Performance, 13(7), 933–939.
Barley, O. R., Chapman, D. W., & Abbiss, C. R. (2019). The current state of weight-cutting in combat sports. Sports, 7(5), 123–133.
Barley, O. R., Chapman, D. W., & Abbiss, C. R. (2020). Reviewing the current methods of assessing hydration in athletes. Journal of the International Society of Sports Nutrition, 17(1), 52–64.
Bartonietz, K. (1996). Biomechanical aspects of the performance structure in throwing events. Modern Athlete and Coach, 34, 7–11.
Betts, J. A., Richardson, J. D., Chowdhury, E. A., Holman, G. D., Tsintzas, K., & Thompson, D. (2014). The causal role of breakfast in energy balance and health: A randomized controlled trial in lean adults. The American Journal of Clinical Nutrition, 100(2), 539–547.
Bishop, C., Turner, A., Jordan, M., Harry, J., Loturco, I., Lake, J., & Comfort, P. (2022). A framework to guide practitioners for selecting metrics during the countermovement and drop jump tests. Strength and Conditioning Journal, 44(4), 95–103.
Burke, L. M., Slater, G. J., Matthews, J. J., Langan-Evans, C., & Horswill, C. A. (2021). ACSM expert consensus statement on weight loss in weight-category sports. Current Sports Medicine Reports, 20(4), 199–217.
Castor-Praga, C., Sanchez-Lopez, J., Lopez-Walle, J. M., Enríquez-Reyna, M. C., Garrido-Esquivel, A., & MedinaCorrales, M. (2023). Effect of rapid weight loss in combat sports: Systematic review. Archives of Budo Science of Martial Arts, 19, 83–94.
Chaabène, H., Tabben, M., Mkaouer, B., Franchini, E., Negra, Y., Hammami, M., Amara, S., Chaabène, R. B., & Hachana, Y. (2015). Amateur boxing: Physical and physiological attributes. Sports Medicine, 45(3), 337–352.
Clark, J. E., & Sirois, E. (2020). The possible role of hydration in concussions and long-term symptoms of concussion for athletes. A review of the evidence. Journal of Concussion, 4, 1–15.
Coad, S., Mclellan, C., Whitehouse, T., & Gray, B. (2015). Validity and reliability of a novel salivary immunoassay for individual profiling in applied sports science. Research in Sports Medicine, 23(2), 140–150.
Control, C. f. D., & Prevention. (1998). Hyperthermia and dehydration-related deaths associated with intentional rapid weight loss in three collegiate wrestlers North Carolina, Wisconsin,andMichigan,November-December1997. MMWR. Morbidity and Mortality Weekly Report, 47(6), 105–108.
Coswig, V. S., Fukuda, D. H., & Del Vecchio, F. B. (2015).Rapid weight loss elicits harmful biochemical and hormonal responses in mixed martial arts athletes. International Journal of Sport Nutrition Exercise Metabolism, 25(5), 480–486.
Daniele, G., Weinstein, R. N., Wallace, P. W., Palmieri, V., & Bianco, M. (2016). Rapid weight gain in professional boxing and correlation with fight decisions: Analysis from 71 title fights. The Physician and Sportsmedicine, 44(4), 349–354. Dunbar, J., Hazell, G., Jehanli, A., & Wallingford, U. (2015). Evaluation of a new point of care quantitative cube reader for salivary analysis in premier league soccer clubs. Paper presented at the International Sports Science and Sports Medicine Conference.
Dunn, E. C., Humberstone, C. E., Franchini, E., Iredale, K. F., & Blazevich, A. J. (2022). Relationships between punch impact force andupper-andlower-body Muscularstrength andpower in highly trained amateur boxers. Journal of Strength and Conditioning Research, 36(4), 1019–1025.
Dunn, E. C., Humberstone, C. E., Iredale, K. F., Martin, D. T., & Blazevich, A. J. (2017). Human behaviours associated with dominance in elite amateur boxing bouts: A comparison of winners and losers under the Ten Point Must System. PLoS One, 12(12), e0188675–e0188686.
Evenepoel, C., Clevers, E., Deroover, L., Van Loo, W., Matthys, C., & Verbeke, K. (2020). Accuracy of nutrient calculations using the consumer-focused online app MyFitnessPal: Validation study. Journal of Medical Internet Research, 22(10), e18237–e18245.
Ferraris, C., Guglielmetti, M., Trentani, C., & Tagliabue, A. (2019). Assessment of dietary under-reporting in Italian college team sport athletes. Nutrients, 11(6), 1391–1402.
Filaire, E., Sagnol, M., Ferrand, C., Maso, F., & Lac, G. (2001). Psychophysiological stress in judo athletes during
Brown et al. / The Journal of Sport and Exercise Science, Journal Vol. 9, Issue 2, 19-29 (2025)
competitions. Journal of Sports Medicine and Physical Fitness, 41(2), 263–268.
Fortes,M.B.,Diment,B. C.,DiFelice,U.,& Walsh,N.P.(2012). Dehydration decreases saliva antimicrobial proteins important for mucosal immunity. Applied Physiology, Nutrition, and Metabolism, 37(5), 850–859.
Garthe, I., Raastad, T., Refsnes, P. E., Koivisto, A., & SundgotBorgen, J. (2011). Effect of two different weight-loss rates on body composition and strength and power-related performance in elite athletes. International Journal of Sport Nutrition and Exercise Metabolism, 21(2), 97–104.
Gross, M., & Lüthy, F. (2020). Anaerobic power assessment in athletes: Are cycling and vertical jump tests interchangeable? Sports (Basel), 8(5), 60–73.
Halperin, I., Hughes,S., &Chapman,D. W.(2016).Physiological profile of a professional boxerpreparing for Title Bout: A case study. Journal of Sports Sciences, 34(20), 1949–1956.
Harper, D. J., Cohen, D. D., Rhodes, D., Carling, C., & Kiely, J. (2022). Drop jump neuromuscular performance qualities associated with maximal horizontal deceleration ability in team sport athletes. European Journal of Sport Science, 22(7), 1005–1016.
Helms, E. R., Zinn, C., Rowlands, D. S., & Brown, S. R. (2014). A systematic review of dietary protein during caloric restriction in resistance trained lean athletes: A case for higher intakes. International Journal of Sport Nutrition and Exercise Metabolism, 24(2), 127–138.
Heymsfield, S. B., Thomas, D., Martin, C. K., Redman, L. M., Strauss, B., Bosy-Westphal, A., Müller, M. J., Shen, W., & Nguyen, A. M. (2012). Energy content of weight loss: kinetic features during voluntary caloric restriction. Metabolism, 61(7), 937–943.
Ismail, M., WD, W. N., & Zawiah, H. (1997). Energy expenditure studies to predict requirements of selected national athletes. Malaysian Journal of Nutrition, 3(1), 71–81.
Judelson, D. A., Maresh, C. M., Farrell, M. J., Yamamoto, L. M., Armstrong,L.E.,Kraemer,W.J.,Volek,J.S.,Spiering,B.A., Casa,D.J.,&Anderson,J.M.(2007).Effectofhydrationstate on strength, power, and resistance exercise performance. Medicine & Science in Sports & Exercise, 39(10), 1817–1824. Kasper,A.M.,Crighton,B.,Langan-Evans,C.,Riley,P.,Sharma, A., Close, G. L., & Morton, J. P. (2019). Case study: Extreme weight making causes relativeenergydeficiency,dehydration, and acute kidney injury in a male mixed martial arts athlete. International Journal of Sport Nutrition and Exercise Metabolism, 29(3), 331–338.
Kennedy, R., & Drake, D. (2017). The effect of acute fatigue on countermovement jump performance in rugby union players during preseason. Journal of Sports Medicine and Physical Fitness, 57(10), 1261–1266.
Kinugasa, T. (2013). The application of single-case research designs to study elite athletes’ conditioning: An update. Journal of Applied Sport Psychology, 25(1), 157–166.
Kinugasa, T., Cerin, E., & Hooper, S. (2004). Single-subject research designs and data analyses for assessing elite athletes’ conditioning. Sports Medicine, 34(15), 1035–1050.
Kirk, C., Langan-Evans, C., & Morton, J. P. (2020). Worth the weight? Post weigh-in rapid weight gain is not related to winning or losing in professional mixed martial arts.
International Journal of Sport Nutrition and Exercise Metabolism, 30(5), 357–361.
Langan-Evans, C., Close, G. L., & Morton, J. P. (2011). Making weight in combat sports. Strength & Conditioning Journal, 33(6), 25–39.
Lebron,M.A.,Stout,J.R.,&Fukuda,D.H.(2024).Physiological perturbations in combat sports: Weight cycling and metabolic function a narrative review. Metabolites, 14(2), 83–96.
Lee, E. C., Fragala, M. S., Kavouras, S. A., Queen, R. M., Pryor, J. L., & Casa, D. J. (2017). Biomarkers in sports and exercise: Tracking health, performance, and recovery in athletes. The Journal of Strength & Conditioning Research, 31(10), 2920–2937.
Lenetsky, S., Brughelli, M., Nates, R. J., Neville, J., Cross, M. R., & Lormier, A. V. (2020). Defining the phases of boxing punches: A mixed-method approach. The Journal of Strength & Conditioning Research, 34(4), 1040–1051.
Linden, H. (2021). A cross-sectional performance analysis and projection of the UFC athlete volume two. from UFC Performance Institute
Loturco, I., Nakamura, F. Y., Artioli, G. G., Kobal, R., Kitamura, K., Abad, C. C. C., Cruz, I. F., Romano, F., Pereira, L. A., & Franchini, E. (2016). Strength and power qualities are highly associated with punching impact in elite amateur boxers. The Journal of Strength & Conditioning Research, 30(1), 109–116.
Marquet, L.-A., Hausswirth, C., Molle, O., Hawley, J. A., Burke, L. M., Tiollier, E., & Brisswalter, J. (2016). Periodization of carbohydrate intake: Short-term effect on performance. Nutrients, 8(12), 755–787.
Matthews, J. J., & Nicholas, C. (2017). Extreme rapid weight loss and rapid weight gain observed in UK mixed martial arts athletes preparing for competition. International Journal of Sport Nutrition and Exercise Metabolism, 27(2), 122–129. Maughan,R., & Shirreffs, S. (2010). Dehydrationandrehydration in competative sport. Scandinavian Journal of Medicine & Science in Sports, 20, 40–47.
McDermott, B. P., Anderson, S. A., Armstrong, L. E., Casa, D. J., Cheuvront, S. N., Cooper, L., Kenney, W. L., O'Connor, F. G., & Roberts, W. O. (2017). National athletic trainers' association position statement: Fluid replacement for the physically active Journal of Athletic Training, 52(9), 877–895.
McKay, A. K., Stellingwerff, T., Smith, E. S., Martin, D. T., Mujika, I., Goosey-Tolfrey, V. L., Sheppard, J., & Burke, L. M. (2021). Defining training and performance caliber: A participant classification framework. International Journal of Sports Physiology and Performance, 17(2), 317–331.
Merson, S. J., Maughan, R. J., & Shirreffs, S. M. (2008). Rehydrationwithdrinksdifferinginsodiumconcentrationand recovery from moderate exercise-induced hypohydration in man. European Journal of Applied Physiology, 103(5), 585–594.
Montain, S. J., Smith, S. A., Mattot, R. P., Zientara, G. P., Jolesz, F. A., & Sawka, M. N. (1998). Hypohydration effects on skeletal muscle performance and metabolism: A 31P-MRS study. Journal of Applied Physiology, 84(6), 1889–1894.
Morton, J. P., Robertson, C., & Sutton, L. (2010). Making the weight: A case study from professional boxing. International Journal of Sports Nutrition and Exercise Metabolism, 20(1), 80–85.
Brown et al. / The Journal of Sport and Exercise Science, Journal Vol. 9, Issue 2, 19-29 (2025)
Pallarés, J., Martínez-Abellán, A., López-Gullón, J., MoránNavarro, R., De la Cruz-Sánchez, E., & Mora-Rodríguez, R. (2016). Muscle contraction velocity, strength and power output changes following different degrees of hypohydration in competitive olympic combat sports. Journal of the International Society of Sports Nutrition, 13(1), 1–9.
Park, S., Alencar, M., Sassone, J., Madrigal, L., & Ede, A. (2019). Self-reported methods of weight cutting in professional mixed-martial artists: How much are they losing and who is advising them? Journal of the International Society of Sports Nutrition, 16(1), 52–59.
Peacock, C. A., French, D., Sanders, G. J., Ricci, A., Stull, C., & Antonio, J. (2022). Weight loss and competition weight in Ultimate Fighting Championship (UFC) athletes. Journal of Functional Morphology and Kinesiology, 7(4), 115–120.
Pettersson, S., Ekström, M. P., & Berg, C. M. (2013). Practices of weight regulation among elite athletes in combat sports: a matter of mental advantage? Journal of Athletic Training, 48(1), 99–108.
Reale, R., Slater, G., & Burke, L. M. (2017a). Acute-Weight-Loss Strategies for Combat Sports and Applications to Olympic Success. The International Journal of Sports Physiology and Performance, 12(2), 142–151.
Reale, R., Slater, G., & Burke, L. M. (2017b). Individualised dietary strategies for Olympic combat sports: Acute weight loss, recovery and competition nutrition. European Journal of Sport Science, 17(6), 727–740.
Reale, R., Slater, G., & Burke, L. M. (2018a). Weight Management Practices of Australian Olympic Combat Sport Athletes. The International Journal of Sports Physiology and Performance, 13(4), 459–466.
Reale, R., Slater, G., Cox, G. R., Dunican, I. C., & Burke, L. M. (2018b). The effect of water loading on acute weight loss following fluid restriction in combat sports athletes. International Journal of Sport Nutrition and Exercise Metabolism, 28(6), 565-573.
Ruddock, A. D., Wilson, D. C., Thompson, S. W., Hembrough, D., & Winter, E. M. (2016). Strength and conditioning for professional boxing: Recommendations for physical preparation. Strength & Conditioning Journal, 38(3), 81–90.
Savoie, F.-A., Kenefick, R. W., Ely, B. R., Cheuvront, S. N., & Goulet, E. D. B. (2015). Effect of hypohydration on muscle endurance, strength, anaerobic power and capacity and vertical jumping ability: A meta-analysis. Sports Medicine, 45(8), 1207–1227.
Schoffstall, J. E., Branch, J. D., Leutholtz, B. C., & Swain, D. P. (2001). Effects of dehydration and rehydration on the onerepetition maximum bench press of weight-trained males. The Journal of Strength & Conditioning Research, 15(1), 102–108.
Smith, M., Dyson, R., Hale, T., Hamilton, M., Kelly, J., & Wellington, P. (2001). The effects of restricted energy and fluid intake on simulated amateur boxing performance. International Journal of Sport Nutrition and Exercise Metabolism, 11(2), 238–247.
Smith, M., Dyson, R., Hale, T., Harrison, J., & McManus, P. (2000). The effects in humans of rapid loss of body mass on a
boxing-related task. European Journal of Applied Physiology, 83(1), 34–39.
Smithson, M. (2003). Confidence intervals: Sage.
Spencer, R., Sindall, P., Hammond, K. M., Atkins, S. J., Quinn, M., & McMahon, J. J. (2023). Changes in body mass and movement strategy maintain jump height immediately after soccer match. Applied Sciences, 13(12), 7188–7198.
Stanley, E., Thomson, E., Smith, G., & Lamb, K. L. (2018). An analysis of the three-dimensional kinetics and kinematics of maximal effort punches among amateur boxers. International Journal of Performance Analysis in Sport, 18(5), 835–854.
Teramoto, M., Cross, C. L., Cushman, D. M., & Willick, S. E. (2018). Boxing fatalities in relation to rule changes in Japan: Secondary data analysis. The Physician and Sportsmedicine, 46(3), 349–354.
Turner, S. E. G., Loosemore, M., Shah, A., Kelleher, P., & Hull, J. H. (2021). Salivary IgA as a potential biomarker in the evaluation of respiratory tract infection risk in athletes. The Journal of Allergy and Clinical Immunology: In Practice, 9(1), 151–159.
Uchino, T., Uchida, M., Ito, R., Fujie, S., Iemitsu, K., Kojima, C., Nakamura, M., Shimizu, K., Tanimura, Y., Shinohara, Y., Hashimoto, T., Isaka, T., & Iemitsu, M. (2024). Effects of different exercise intensities or durations on salivary IgA secretion. European Journal of Applied Physiology, 124(9), 2687–2696.
Uddin, N., Tallent, J., & Patterson, S. D. (2022a). Corticospinal and peripheral responses to heat-induced hypo-hydration: Potential physiological mechanisms and implications for neuromuscular function. European Journal of Applied Physiology, 122(8), 1797–1810.
Uddin, N., Waldron, M., Patterson, S. D., Winter, S., & Tallent, J. (2022b). A survey of combat athletes' rapid weight loss practices and evaluation of the relationship with concussion symptom recall. Clinical Journal of Sport Medicine, 32(6), 580-587.
van Paridon, K. N., Timmis, M. A., Nevison, C. M., & Bristow, M. (2017). The anticipatory stress response to sport competition; a systematic review with meta-analysis of cortisol reactivity. BMJ Open Sport & Exercise Medicine, 3(1), e000261– e000271.
Vivanti, A. P. (2012). Origins for the estimations of water requirementsinadults. European Journal of Clinical Nutrition, 66(12), 1282–1289.
Wade, L., Lichtwark, G. A., & Farris, D. J. (2020). Comparisons of laboratory‐based methods to calculate jump height and improvements to the field‐based flight‐time method. Scandinavian Journal of Medicine & Science in Sports, 30(1), 31–37.
Zaras, N. D., Angeliki-nikoletta, E. S., Krase, A. A., Methenitis, S. K., Karampatsos, G. P., Georgiadis, G. V., Spengos, K. M., & Terzis, G. D. (2014). Effects of tapering with light vs. heavy loads on track and field throwing performance. The Journal of Strength & Conditioning Research, 28(12), 3484–3495.
Zhuo, M., Li, J., & William, J. H. (2019). Sauna-induced fatal rhabdomyolysis. Kidney International Reports, 4(1), 171–173
The Journal of Sport and Exercise Science, Vol. 9, Issue 2, 30-39 (2025)
www.jses.net
2703-240X
Does early specialisation improve drop jump and Y-balance performance in junior football players?
Anja
Zoellner1* , Chris Whatman1 , Paul Read2,3,4 , Kelly Sheerin1
1 Sports Performance Research Institute New Zealand (SPRINZ), Auckland University of Technology, New Zealand
2 School of Sport and Exercise, University of Gloucestershire, United Kingdom
3 Division of Surgery and Interventional Science, University College London, United Kingdom
4 Faculty of Sport, Allied Health and Performance Science, St Marys University, United Kingdom A R T I C L E I N F O
Received: 25.11.2024
Accepted: 30.09.2025
Online: 15.12.2025
Keywords:
Sport specialisation
A B S T R A C T
Sport specialisation has been defined as the intense involvement in a single sport to the exclusion of all other sports. Previous research has raised questions about potential negative consequences of specialising at a young age. The purpose of this study was to examine differences in drop jump and y-balance performance in junior football players based on level of specialisation. This was a cross-sectional observational study involving 35 male footballers aged 10.2 ± 1.1 years. Participants were grouped as high, moderate, and low specialised. Level of specialisation was determined using a survey on their sports participation history. Tests included anterior Y-balance test and drop jumps assessed using the Landing Error Scoring System (LESS). Between-group differences were analysed using one-way analysis of variance and chi-squared analysis with an a priori statistical significance level of p ≤ 0.05. Hedge’s g effect sizes were reported for all results. High specialised playersdisplayed greater left leg relative reach than moderate (mean diff = 10.9% LL; 95% CI [2.2, 19.6]; p = 0.013; Hedge’ s g = 0.78) but not low (mean diff = 5.0% LL; 95% CI [-4.0, 14.1]; p = 0.218; Hedge’ s g = 0.39) specialised players. No other significant differences were observed in Y-balance performance. High specialised players displayed fewer LESS errors than moderate (mean diff = 2.75 errors; 95% CI [0.05, 5.48]; p = 0.009; Hedge’ s g = -0.90), but not low (mean diff = 2.20 errors; 95% CI [-5.05, 0.65]; p = 0.101; Hedge’ s g = -0.57) specialised players. ‘Knee flexion displacement’ was the only LESS criterion that differed significantly between groups, with errors more common in moderately specialised players (n = 9) than both high (n = 0) and low (n = 5) specialised players (p = 0.003). These results suggest early specialised junior football players may perform better in the drop jump and y-balance tests than their less specialised counterparts. Results suggest all players may benefit from participation in injury prevention programmes such as the FIFA 11+, in particular moderately specialised players.
1. Introduction
Sport specialisation has been defined as focused, intentional training, year-round, in a single sport (Bell et al., 2021). High rates of specialisation have been consistently reported in young athletes across a number of sports (Bell et al., 2016; Post et al., 2017a; Post etal.,2017b;Zoellneretal.,2022).Proposedreasonsforthisinclude a desire to increase chances of future selection, scholarships and opportunities to play professionally (Normand et al., 2017; Post et al.,2019).However,anumberofstudiesindicatethatinmost sports, athletes do not need to specialise at a young age in order to achieve
elite-levelperformancelaterinlife(Kliethermesetal.,2020;Murata et al., 2022). More so, delayed specialisation has been reported as more common in adult elite-level performers, compared to their sub-elitecounterparts(Hornig etal.,2016;Kliethermesetal.,2020).
While some level of specialisation is needed to reach elite and/or professional levels, ‘early’ sport specialisation has been associated with negative long-term outcomes for youth athletes, including burnout, dropout, and increased risk of injury (Beese et al.,2015;Brenner,2007;Jayanthietal.,2015;Wall&Côté,2007). Various published international consensus statements have discouraged early specialisation (Bergeron et al., 2015; DiFiori et
*CorrespondingAuthor:AnjaZoellner,SportsPerformanceResearchInstituteNewZealand(SPRINZ),AucklandUniversityofTechnology,NewZealand,anja.zoellner@aut.ac.nz
al., 2014; LaPrade et al., 2016), but no agreement has been reached on the appropriate age for specialisation, and indeed what constitutes ‘early’. Current evidence suggests that specialisation should be delayed until after physical maturation or late adolescence (Jayanthi et al., 2019; LaPrade et al., 2016). Later specialisation promotes exposure to the varied movement and coordination demands needed for young athletes to optimise skill learning (Côté, et al., 2009). Additionally, pre-puberty is the optimal time to learn fundamental, broad motor skillsto maximise future potential due to increased neural plasticity (Myer et al., 2011). Thus, delaying specialisation is advised to allow moretime for young athletes to develop enhanced competence in a broad rangeofmovementskills(Jayanthietal.,2019;Myeretal.,2015). In adolescence, young athletes also undergo rapid growth with alterations in neuromuscular control (Beese et al., 2015; DiCesare et al., 2019; DiStefano et al., 2018; Miller et al., 2017). These developmental periods heighten injury risk (van der Sluis et al., 2014), especially if combined with increases in training load and intensity often associated with early specialisation (Brenner & Council On Sports Medicine and Fitness, 2016).
Exposure to varied movements, and being able to respond to a varietyofsituationaldemands,isvitalinpreparingyoungathletesfor future sports performance (Côté et al., 2009). Recent research indicates that following injury and return to sport, football athletes develop movement strategies that allow them to achieve the same outcomes as non-injured players, despite their physical limitations (Hart et al., 2019). Movement strategies will emerge under constraintsfromdifferenttasks andenvironments, thus exposuretoa greater variety may allow athletes to develop a wider range of movement solutions (Côté & Hancock, 2014; Rudd et al., 2020). When specialising in a single sport, there is a potential reduction in thenumberofconstraintsyoungathletesareexposedto.Specifically, footballplayersfavourkicking with theirpreferredleg,whichresults in increased stability in the support leg (Atkins et al., 2016). Jumplanding performance may also be enhanced on the non-preferred leg (Readetal.,2018a;Readetal.,2018b),leadingtoimbalancesinforce transfer, muscle activation, and motor control (Atkins et al., 2016; Readetal.,2016).However,morestudiesareneededtoelucidatethe relationship between early specialisation and movement development, and to examine if movement strategies emerge that may predispose these young athletes to a heightened risk of injury. Due to the importance of the pre-pubertal period on the development of diverse movement strategies (Myer et al., 2013), more research is required to ensure youth are benefiting from positive development experiences. Additionally, given the high proportion of youth players specialising ‘early’ in football, and the potential for this to impact on movement skill development, the aim of this study was to investigate if differences exist in the performance of drop jumps (DJ) and Y-balance tests of prepubertal football players based on their level of specialisation. Considering existing research, we hypothesised that highly specialised players would demonstrate poorer outcomes than those who were low specialised.
2. Methods
This cross-sectional study included two movement tests and a survey of current and past sport participation. Institutional ethical approval was granted prior to recruitment and data collection. All
participants provided written informed assent, and their parents or caregivers gave informed consent. The movement tests included the Y-balance anterior reach distance (absolute and relative to leg length) and DJ assessed using the Landing Error Scoring System (LESS) due to their known associations with injury risk youth populations (Padua et al., 2009; Plisky et al., 2006; Read et al., 2020). Testing took place in the evenings, during normal training times, with participants performing their normal training warmup prior to testing. As participants were in the same teams, it could reasonably be assumed that they performed the same warmup. At each session, the tests were explained to the participants, and they were given time to familiarise themselves to ensure they completed the task as instructed. Familiarisation involved participants practising each test at least four times to minimise variation due to any learning effect (Munro & Herrington, 2011).
1.1. Participants
Thirty-five boys aged 10.2 ± 1.1 years (height: 140.7 ± 8.7 cm; body mass: 36.6 ± 8.6 kg) volunteered to take part. Participants were recruited from a football academy in Auckland, New Zealand (NZ) during the competitive season. Participants were required to be at least 1-year pre-peak height velocity (PHV), and currently free from injury, to minimise maturational and/or injury effects on movement. Additionally, all participants were less than 12 years of age, the most commonly reported chronological agebased threshold for defining early specialisation (Mosher et al., 2020). Limb preference for players was 46% right, 6% left, 48% not reported. A male-only sample was selected to eliminate any differences in movement based on gender, given that differences in knee valgus control during jump landings have been evidenced at all maturational levels (Holden et al., 2019).
The sample for this study was drawn from a broader planned project, with recruitment governed primarily by feasibility. While an a priori power analysis was conducted during the early stages of the wider research program, subsequent changes to the study design and analytic focus rendered it no longer applicable. Nonetheless,asensitivityanalysis(viapwr;Champely,2020)was performed to determine the smallest effect size that the study was adequately powered to detect. This was based on the primary statistical models being built, given the total sample size of 35, an alpha error rate of 0.05, and 80% power. This analysis indicated that the study was powered to detect Cohen’s f ≥ 0.55 (etasquared ≥ 0.23), which corresponds to a threshold of a medium to largeeffectaccordingtoconventionalbenchmarks(Cohen,1992). Accordingly, readers are encouraged to interpret the results in consideration of the reported effect sizes and confidence intervals as indicators of magnitude and precision of the observed effects.
1.2. Procedure
1.2.1. Maturity assessment
Maturationoffsetswerecalculatedusingavalidatedsomaticequation (Mirwald et al., 2002). All estimates were based on measures of standing and sitting heights, body mass, and leg length (measured whilststandinginanatomicalposition,fromtheanteriorsuperioriliac spine to the medial malleolus) (Miller et al., 2017). This data was used for inclusion/exclusion only, not for any analyses.
1.2.2.
Level of specialisation
Sport history questionnaires (Supplementary Material A) were used todeterminethecurrentlevelofspecialisation,andwhichsportsboys participated in, at each age since they began football. Questionnaires were completed with thehelpof aparentand wereusedtodetermine howlongparticipantshadbeenspecialised(Moeschetal.,2011).The levelof specialisation was determined based on their answers to four questions: (1) Is football more important than any other sport?; (2) Do you train more than 8 months of the year in football?; (3) Have you quit other sports to focus on football?; and (4) Have you only everplayedfootball?’ Players whoanswered ‘yes’ to threequestions were classified as highly specialised. Those who answered ‘yes’ to two questions were classified as moderately specialised, and ‘yes’ to one or fewer were classified as low specialised. Classification of players was determined after data collection to ensure researchers were blinded to the level of specialisation during testing.
1.2.3.
Movement tests
Y-Balance tests were performed on a custom-made Y-balance test kitconsistingofasmallwoodenboxwiththreepolesattachedina‘y’ shape. A block was placed on each pole that could easily slide along the pole to indicate reach distance. Participants adopted a single-leg stanceontheboxinthemiddlewiththeirtoesbehindaline,andtheir
Table 1: Landing Error Scoring System criteria
Timepoint Criterion
Initialcontact
Kneeflexionmorethan30°
Hipsareflexed
Trunkisinfrontofhips
Ankleplantarflexion:landstoeto heel
Kneevalgus:patellaisnot medialtomidfoot
Nolateraltrunkflexion
Stancewidth
Feetlandsymmetrically
Betweeninitialcontactand maximumkneeflexion Footrotation
Knees flex45°ormore
Hipflexionincreases
Trunkflexionincreases
Pointofmaximummedial kneedisplacement
Midpointofpatelladoesnotmovemedialto midfoot
Overall Amountoftrunk,hip,andkneejoint displacementthroughout
Overallimpressionofsoftnessoflanding andfrontal-andtransverse-plane movement
handsontheirhips.Theyweretheninstructedtopushtheblockalong thepoleasfaraspossiblewhilemaintainingbalance,withoutputting weight on the block or placing their foot on the ground. When participants had pushed the block as far as possible, they returned their foot to the centre without touching down. If any of these instructions were not adhered to, participants were asked to repeat that trial. The reach distance was recorded from the box to the back oftheblock.Onlytheanteriorreachwastestedforlogisticalreasons, and due to its stronger associations with injury risk compared to the posterior medial and lateral directions (Plisky et al., 2006). Limb orderwasrandomised,withthreetrialsoneachleg.Absoluteanterior reach distances were compared, as well as reach distance relative to leg length (%LL). Reach asymmetry was also calculated, as the percentage difference between legs ([absolute difference between legs ÷ greatest reach distance] × 100).
Drop jumps were performed from a 30cm box with a cross on the floor at a distance half the participant’s standing height. Instructions were to drop down, land on the cross with both feet, and perform a vertical jump for maximum height while minimising ground contact time.
Frontal and sagittal plane video (25 frames per second; HDRCX130, Sony, NY, USA) was recorded (3 m from the front and side of the cross on the floor at a height of 1 m). Cameras were set to record in portrait orientation. Three trials were completed by each participant. Jump-landings were rated using the 17-item scoring system developed by Padua et al. (2015) (Table 1).
Rating
0=Yes
1=No
0=Yes
1=No
0=Yes
1=No
0=Yes
1=No
0=Yes
1=No
0=Yes
1=No
0=Feetshoulderwidthapart
1=Feetwiderthanshoulderwidthornarrowerthanshoulderwidth
0=Yes
1=No
0=Feetnotinternallyorexternallyrotatedmorethan30°
1=Feetinternallyorexternallyrotatedmorethan30°
0=Yes
1=No
0=Yes
1=No
0=Yes
1=No
0=Yes
1=No
0=Large(softlanding)
1=Some(averagelanding)
2=Verylittle(stifflanding)
0=Excellent(soft,nofrontalortransverseplanemotion)
1=Average
2=Poor(stiffand/orlargefrontal-ortransverse-plane motion)
Individuals were given a score that equated to a count of errors displayed during the trial. A lower score indicated fewer errors and thus better technique. Videos were rated independently by two individuals who were experienced in movement analysis and blinded to the specialisation classification of participants. Intrarater reliability was assessed using a different data set (ICC = 0.92). Videos were viewed in freely available analysis software (Kinovea v0.9.3),pausedatthe time pointofinterest (e.g., initial contact)and replayed as many times as necessary to be confident of the score. Onescore wasgivenbasedonthethreetrials. Anerrorwascounted if it was displayed in two or more of the trials. Scores were compared between raters and any differences were discussed. Videos were then reviewed until a consensus was reached. Jump-landing competence was classified based on previous research (Beese et al., 2015; Padua et al., 2009), as ‘excellent’ (03 errors), ‘good’ (4-5 errors), ‘moderate’ (6 errors), or ‘poor’ (≥ 7 errors). DJ data for some participants were excluded due to technical issues. Participant numbers included in each group for each analysis are reported in the relevant tables.
1.3. Statistical approach
Mean, standard deviations (SD) and 95% confidence intervals (95% CI)arereportedforcontinuousdata.Asignificancelevelof p ≤0.05 wassetaprioriandusedthroughout.Statisticalanalysiswascarried out using R statistical software (R Core Team). One-way analysis
Table 2: Summary descriptive data (mean ± SD [95% CI]).
of variance (ANOVA) was used to analyse between-group (high, moderate, low) differences in Y-balance and total Landing Error Scoring System (LESS) scores. Normality and homogeneity of variance were checked to ensure assumptions were met. Tukey post-hoc analyses were conducted where appropriate to compare each pair of groups, and outcomes were presented as mean difference and 95% CI. Effect sizes (ES) were calculated from estimated means from the post-hoc analyses, and corresponding standard errors, reported as Hedge’s g, and classified as ‘small’ (> 0.20), ‘medium’ (> 0.50), or ‘large’ (> 0.80) (Cohen, 1988). The frequency of individual errors in the LESS between groups was analysed for each criterion using chi-squared analysis. Due to the numberofcomparisonsusedtocomparetheindividualerrorsofthe LESS, a Bonferroni correction was used (0.05/17), resulting in an alpha level of p ≤ 0.003 for the chi-squared results.
2. Results
Descriptive statistics are presented in Table 2. Participants were grouped as ‘high’ (n =11),‘moderate’ (n = 13), and ‘low’ (n = 11) specialised. There were no significant differences in age (p = 0.329), height (p = 0.208), body mass (p = 0.140), or maturation offset (p = 0.116) among groups. The high group had been specialised for an average of 2.0 ± 1.2 years, and themoderateand low specialised groups participated in an average of 2.4 ±1.4 and 2.1 ± 0.8 sports, respectively.
There were no significant differences in the left (p = 0.268) or right (p = 0.656) absolute reach distances during the Y-balance test (Table 3). There was a significant difference in relative reach distance on the left leg (p = 0.015). Post-hoc analysis showed significantly greater left relative reach in the highly specialised group compared to the moderately specialised group (mean diff = 10.9% LL; 95% CI [2.2, 19.6]; p = 0.013; ES = 0.78), but not the
low specialised group (mean diff = 5.0% LL; 95% CI [-4.0, 14.1]; p = 0.218; ES = 0.39). There was also a significantly greater relative reach on the left leg in low, compared to moderate specialised groups (mean diff = 5.8% LL; 95% CI [0.56, 11.1]; p = 0.032; ES = 0.66). Right leg relative reach (p = 0.105), absolute (p = 0.597), and percentage (p = 0.462) asymmetry were not significantly different between groups.
Table 3: Between-group comparisons of Y-balance test and LESS total score performance (mean ± SD [95% CI])
± 4.4 [49.7,
(cm) 3.38 ± 1.8 [2.21, 4.56] 2.79 ± 2.1 [1.71, 3.87] 2.58 ± 1.9 [1.40–3.76] 0.597 0.18
Percent asymmetry (%) 6.48 ± 3.6 [4.29, 8.67] 5.24 ± 3.9 [3.22, 7.25] 4.60 ± 3.1 [2.42, 6.79] 0.462 0.21
LESS total score 7.20 ± 3.1 [5.58, 8.82] 7.75 ± 2.1 [6.27, 9.23] 5.00 ± 2.3 [3.29, 6.71] 0.051 -0.13
Note: *significant difference between the three groups (p ≤ 0.05), %LL = percentage leg length
There was a trend towards a significant difference in total LESS score between groups (p = 0.051) (Table 3). Post-hoc analysis showed fewer errors in the highly specialised group, compared to the moderately (mean diff = 2.75 errors; 95% CI [0.05, 5.48]; p = 0.009; ES = -0.90), but not the low specialised group (mean diff = 2.20 errors; 95% CI [-0.65, 5.05]; p = 0.101; ES = -0.57). There was no significant difference between the moderately and low specialised groups (mean diff = 0.55 errors;
Table 4: Categorisation of LESS performance by specialisation level.
specialised (n = 10)
95% CI [-2.11, 3.21]; p = 0.625; ES = -0.15). The highest frequency of poor LESS classification was recorded in the moderate specialisation group, and the lowest in those who were in the high specialised group. The greatest frequency of excellent and good scores were also recorded in high specialised players (Table 4), indicating this group displayed greater competence in the DJ task.
(n = 12)
(n = 9)
(0–3 errors)
(4–5 errors)
(6 errors)
Counts of individual errors between groups did not indicate any significant differences for most criteria (Table 5). A significant difference between groups was only found for ‘knee flexion displacement’. Significantly fewer high specialised
players (n = 0) received an error for knee flexion displacement (indicating they exhibited a greater range of knee flexion throughout their landing), than in the moderate (n = 9) or low specialised (n = 5) groups (p = 0.003).
Table 5: Counts of errors scored in individual LESS criteria by specialisation level (n and %).
Note: *significant difference (p ≤ 0.003), X2 = Chi-squared
3. Discussion
The aim of this study was to investigate if differences exist in the performance of DJ and Y-balance tests in pre-pubertal football players based on their level of specialisation. Given that the most
commonly reported age cut-off for ‘early’ specialisation is 12 years (LaPrade et al., 2016), all highly specialised players in this study would be classified as ‘early specialised’. Improved jumplanding strategies were observed in those who were highly specialised, with most players graded as ‘excellent’ or ‘good’.
Highly specialised players also displayed landing strategies associated with reduced injury risk and better Y-balance left leg normalised reach distances. Cumulatively, these findings could suggest that pre-pubertal players who are highly specialised, develop improved jump-landing mechanics and enhanced dynamic stability.
The Y-balance test is an indicator of dynamic balance and active mobility (Plisky et al., 2009; Read et al., 2020). Anterior reach asymmetries have previously been associated with an increased risk of lower limb injury (Plisky et al., 2006; Smith, et al., 2015). Relative reach distance is often used in preference to absolutedistanceduetovariationsinlimblengthbetween players. In this study, the highly specialised players demonstrated better relative reach on the left leg than the moderately specialised players. Additionally, while not statistically significant, based on the estimated difference and 95% CI (mean diff = 8.1%; 95% CI [-1.0, 17.1]), it is more likely than not that they also had better relative reach on the right leg. These results are contrary to previous evidence in older-aged, specialised youth, where no differences in reach distance based on level of specialisation were found (Miller et al., 2017). These participants were likely postPHV, while the participants in our study were all pre-PHV, which may explain the difference in results (Read et al., 2020). Age- and maturation-related improvements in balance and postural control are expected in active youths (Nolan, et al., 2005; Read et al., 2020). In our younger (pre-PHV, early specialised) players, increased exposure to activities requiring single-leg balance (such as kicking a ball) may have led to earlier adaptation and stability in unilateral activities, and thus improved performance in those who were highly specialised, however more research is needed to confirm this. Although there were no significant differences in anterior reach asymmetry between groups, the estimated asymmetries for all groups have the potential to exceed 4cm. This is worthy of note given an asymmetry of 4cm or higher in the anterior direction has previously been associated with an increased risk of lower limb injuries in football players, and thus should be considered in designing training programmes to reduce these between-limb differences (Plisky et al., 2006; Smith, et al., 2015).
Previous research has shown an increased risk of ACL injury in youth football players displaying inferior landing mechanics characterised by a higher LESS score (Padua et al., 2015). Contrary to previous research in specialised youth athletes (Beese et al., 2015; DiStefano et al., 2018), the results of our study suggest highly specialised junior (pre-PHV) football players exhibit fewer errors when performing a drop jump landing than moderately specialised players. Additionally, our findings also suggest the highly specialised players had fewer errors than the lowspecialised players,butthesedifferenceswerenotstatistically significant (mean diff = 2.20; 95% CI [-0.65, 5.05]). Previous research has shown either more errors in youth who were highly specialised (DiStefano et al., 2018), or no difference between groups of varying specialisation status (Beese et al., 2015; Peckham et al., 2018). Conflicting findings could be a result of the younger, less mature participants in our study, compared with those in many of the existing studies, who were mostly postpubertal in their mid- to late-teens (Beese et al., 2015; Peckham et al., 2018). Differences in landing mechanics have previously been observed in athletes at different chronological ages and levels of maturation (Read, et al., 2018a; Read, et al., 2018b).
Additional confounding factors could include differences in exposure to quality coaching and/or injury prevention programmes at different levels of specialisation.
Most football coaching in NZ at a junior (under 13) club level is conducted on avolunteer basis, meaning the qualityof coaching is likely variable, with little or no formal coach training. In contrast, most if not all academy coaches have undergone some level ofcoachingqualification. Thus,typically,only whenplayers join academies, or play at higher levels, are they exposed to coaches who may have more experience and qualifications. Thus, many of the young footballers in the current study may have spent considerable time playing football without specific coaching on movement and skill development from a qualified professional. It has previously been suggestedthat highly specialised players may have better access to quality coaching, potentially greater parental support, and drive to join training academies (McGowan, et al., 2020). This may explain why the highly specialised players performed better in the drop jump task. All participants in the current study were pre-PHV; however, the increased volume of structured training may have led to a synergistic adaptation in utilising the potent stimulus provided by training inplayers whose neural plasticity is heightened (Read et al., 2021). Muscle preactivation and reflex control enhance with maturation, but it can also be improved through greater exposure to plyometric training (Read et al., 2021). Given the young age of this cohort, and the relatively short time the high specialised group has focused specifically on football, the benefit of higher-level coaching may emerge quickly (Lloyd et al., 2014; Myer et al., 2013) while the potential negative impacts of specialisation (e.g., repeated movement patterns leading to overuse) may take longer to emerge. It would be interesting to observe this cohort longitudinally to examine how movement competence develops throughout adolescence in a high specialisation sporting pathway.
The poor jump-landing mechanics exhibited by a high percentage of both moderately (83%) and low (50%) specialised players are of concern due to the potential for increased risk of injury. This suggests a greater focus on foundation movement patterns is warranted in this younger age group. Previous research has shown that jump-landing mechanics in pre-pubertal youth are inferior to those post-puberty, in part due to increased strength development and muscle pre-activation in post-pubertal boys (Read, et al., 2018a). Additionally, poorer landing mechanics have been observed in youths with no structured strength and plyometric-training programmes (Noyes et al., 2005). Thus, the moderate and low specialised groups may not be receiving consistent enough training stimuli. While the incidence of injury in pre-PHV cohorts is low, the greater neural plasticity should be considered, and training programmes commencing pre-puberty should be encouraged to take advantage of this with scope to optimise movement strategies later in adolescence where injury risk is higher. This also highlights the importance of the uptake of injury prevention programmes in community-level football (with limited qualified coaches), where many youth football players are getting the majority of their football exposures. Programs like the FIFA11+ have shown promising results in these environments as well as in higher-level programs (Gomes Neto et al., 2017).Injury prevention has been a focus for NZ Football over recent years (New Zealand Football, 2016), which, anecdotally, has led to increased use of FIFA11+. However, there may be a need for more education of community-level coaches to increase
adherence, which is critical to optimise effectiveness and to ensure all players are benefitting from these programmes.
When evaluating the individual criteria in the LESS (Table 5), the main group differences were observed in ‘knee flexion displacement’ (i.e., the change in knee flexion angle between initial contact and maximum knee flexion). This error (i.e., reduced knee flexion) was more commonly seen in the moderate (75%) and low specialised groups (50%), compared to the high specialised group (0%). There was also a trend for moderate and low specialised players to record errors in ‘joint displacement (stiff)’. Stiffer landings are associated with decreased leg extensor strength, and lower muscle pre-activation prior to ground contact, resulting in reduced ability to attenuate ground reaction forces on landing (Cormie, et al., 2010; Read, et al., 2018b). It is plausible that the highly specialised players represent the better athletes who may have joined academies earlier due to their superior physical ability. Regardless, using a stiff landing strategy will result in larger ground reaction forces, and players displaying these jump strategies may be at an increased risk of injury (Pedley et al., 2020). Targeted strength and conditioning programmes focused on plyometric skills, and maturation-appropriate strength training considering the individual’s training age and technical competency, could be beneficial.
The high frequency of ‘poor’ LESS scores in the moderately specialised group was unexpected. While it is beyond the scope ofthisstudytoprovidemechanisticinsightstoexplainthisfinding, it could be that the moderately specialised players were in the early stages of a specialised pathway, playing a high volume of football, all year-round,but still playing another sport. Competing in two sports can result in a high overall training load and time commitment, as well as the potential for inconsistencies in training stimuli. Players will also have decreased time available for unstructured free play, and this has previously been reported as an important contributing factor for the development of movement competence in a diverse range of skills and tasks (Barreiro & Howard, 2017; Bergeron et al., 2015).
A strength of this study is that we assessed players who were considered ‘early’ specialisers, involving children under the age of 12 (> 1 year pre-PHV). Most existing studies have investigated the effects of sport specialisation in participants during their midto late-teens, with only some including assessment or control of maturation. Including younger, pre-pubertal players allowed for the examination of potential differences that are occurring as players begin to specialise, minimising the effects of growth and maturation on movement skill. It is common in existing research to investigate sport specialisation across a range of sports (McGuine et al., 2017; Miller et al., 2017; Peckham et al., 2018); however, the effects of specialisation are likely sport-specific. It may be more relevant to investigate individual sports, which we consider an additional strength of this study. The main limitations of this study are the cross-sectional design and relatively small sample size. We observed some significant differences based on the level of specialisation, but the absence of longitudinal data means any causation cannot be established. Additionally, the lack of female participants limits the generalisability of the findings. Further limitations include the reliance on self- and parentreported sport participation to rate levels of specialisation, potentially introducing recall bias the lack of data on potential confounding factors (training load and exposure to injury prevention programmes), and the lack of kinetic data to give
mechanistic insight into LESS data. Additionally, while we have inferred some potential associations with increased injury risk based on movement strategies displayed, more research is needed to prospectively monitor sport specialisation and injuries concurrently.
The results of this study suggest early specialised youth football players may be more competent movers than their less specialised counterparts pre-puberty. Contrary to existing evidence, the boys that were highly specialised displayed superior movement patterns during a drop jump task and better relative anterior reach during the Y-balance test. However, given the number of results that showed no significant difference, it could be argued that there is no disadvantage to being involved in multiple sports at a young age. Results suggest all players may benefit from participation in injury prevention programmes such as the FIFA 11+, in particular moderately specialised players.
Conflict of Interest
The authors declare no conflict of interests.
References
Atkins, S. J., Bentley, I., Hurst, H. T., Sinclair, J. K., & Hesketh, C. (2016). The presence of bilateral imbalance of the lower limbs in elite youth soccer players of different ages. Journal of Strength & Conditioning Research, 30(4), 1007–1013. https://doi.org/10.1519/JSC.0b013e3182987044
Barreiro, J. A., & Howard, R. (2017). Incorporating unstructured free play into organized sports. Strength & Conditioning Journal, 39(2), 11–19. https://doi.org/10.1519/SSC.0000000000000291
Beese, M. E., Joy, E., Switzler, C. L., & Hicks-Little, C. A. (2015). Landing error scoring system differences between single-sport and multi-sport female high school-aged athletes. Journal of Athletic Training 50(8), 806–811. https://doi.org/10.4085/1062-6050-50.7.01
Bell, D. R., Post, E. G., Trigsted, S. M., Hetzel, S., McGuine, T. A., & Brooks, M. A.(2016). Prevalence ofsportspecialization in high school athletics: A 1-year observational study. American Journal of Sports Medicine, 44(6), 1469–1474. https://doi.org/10.1177/0363546516629943
Bell, D. R., Snedden, T., Biese, K., Nelson, E., Watson, A., McGuine, T., Brooks, M. A., Brown, R., & Kliethermes, S. A. (2021). Consensus definition of sport specialization in youth athletes using a delphi approach. Journal of Athletic Training, 56(11), 1239–1251. https://doi.org/10.4085/1062-60500725.20
Bergeron, M. F., Mountjoy, M., Armstrong, N., Chia, M., Cote, J., Emery, C. A., Faigenbaum, A., Hall, G., Kriemler, S., Leglise, M., Malina, R. M., Pensgaard, A. M., Sanchez, A., Soligard, T., Sundgot-Borgen, J., van Mechelen, W., Weissensteiner, J. R., & Engebretsen, L. (2015). International Olympic Committee consensus statement on youth athletic development. British Journal of Sports Medicine, 49(13), 843–851. https://doi.org/10.1136/bjsports-2015-094962
Brenner, J. S. (2007). Overuse injuries, overtraining, and burnout in child and adolescent athletes. Pediatrics, 119(6), 1242–1245. https://doi.org/10.1542/peds.2007-0887
Zoellner et al. / The Journal of Sport and Exercise Science, Journal Vol. 9, Issue 2, 30-39 (2025)
Brenner, J. S.,& Council On Sports Medicine and Fitness. (2016). Sports specialization and intensive training in young athletes. Pediatrics, 138(3), e20162148. https://doi.org/10.1542/peds.2016-2148
Champely, S. (2020). pwr: Basic Functions for Power Analysis_. R package version 1.3-0. https://CRAN.Rproject.org/package=pwr.
Cohen, J. (1988). Statistical power analysis for the behavioural sciences (2 ed.). Routledge. https://doi.org/10.4324/9780203771587
Cohen, J. (1992). Statistical Power Analysis. Current Directions in Psychological Science, 1(3), 98–101. https://doi.org/10.1111/1467-8721.ep10768783
Cormie, P., McGuigan, M. R., & Newton, R. U. (2010). Changes in the eccentric phase contribute to improved stretch-shorten cycle performance after training. Medicine & Science in Sports & Exercise, 42(9), 1731–1744. https://doi.org/10.1249/MSS.0b013e3181d392e8
Côté, J., & Hancock, D. J. (2014). Evidence-based policies for youth sport programmes. International Journal of Sport Policy and Politics, 8(1), 51–65. https://doi.org/10.1080/19406940.2014.919338
Côté, J., Lidor, R., & Hackfort, D. (2009). ISSP position stand: To sample or tospecialize? Seven postulates aboutyouthsport activities that lead to continued participation and elite performance. International Journal of Sport & Exercise Psychology, 7(1), 7–17. https://doi.org/10.1080/1612197X.2009.9671889
DiCesare, C. A., Montalvo, A., Barber Foss, K. D., Thomas, S. M., Ford, K. R., Hewett, T. E., Jayanthi, N. A., Stracciolini, A., Bell, D. R., & Myer, G. D. (2019). Lower extremity biomechanics are altered across maturation in sportspecialized female adolescent athletes. Frontiers in Pediatrics, 7. https://doi.org/10.3389/fped.2019.00268
DiFiori, J. P., Benjamin, H. J., Brenner, J. S., Gregory, A., Jayanthi, N., Landry, G. L., & Luke, A. (2014). Overuse injuries and burnout in youth sports: A position statement from the American Medical Society for Sports Medicine. British Journal of Sports Medicine, 48(4), 287–288. https://doi.org/10.1136/bjsports-2013-093299
DiStefano, L. J., Beltz, E. M., Root, H. J., Martinez, J. C., Houghton, A., Taranto, N., Pearce, K., McConnell, E., Muscat, C., Boyle, S., & Trojian, T. H. (2018). Sport sampling is associated with improved landing technique in youth athletes. Sports Health, 10(2), 160–168. https://doi.org/10.1177/1941738117736056
Gomes Neto, M., Conceicao, C. S., de Lima Brasileiro, A. J. A., de Sousa, C. S., Carvalho, V. O., & de Jesus, F. L. A. (2017). Effects of the FIFA 11 training program on injury prevention and performance in football players: A systematic review and meta-analysis. Clinical Rehabilitation, 31(5), 651–659. https://doi.org/10.1177/0269215516675906
Hart, L. M., Cohen, D. D., Patterson, S. D., Springham, M., Reynolds, J., & Read, P. (2019). Previous injury is associated with heightened countermovement jump force‐time asymmetries in professional soccer players. Translational Sports Medicine, 2(5), 256–262. https://doi.org/10.1002/tsm2.92
Holden, S., Doherty, C., Boreham, C., & Delahunt, E. (2019). Sex differences in sagittal plane control emerge during adolescent
growth: A prospective investigation. Knee Surgery Sports Traumatology Arthroscopy, 27(2), 419–426. https://doi.org/10.1007/s00167-018-5069-1
Hornig, M., Aust, F., & Güllich, A. (2016). Practice and play in the development of German top-level professional football players. European Journal of Sport Science, 16(1), 96–105. https://doi.org/10.1080/17461391.2014.982204
Jayanthi, N. A., LaBella, C. R., Fischer, D., Pasulka, J., & Dugas, L. R. (2015). Sports-specialized intensive training and the risk of injury in young athletes: A clinical case-control study. American Journal of Sports Medicine, 43(4), 794–801. https://doi.org/10.1177/0363546514567298
Jayanthi, N. A., Post, E. G., Laury, T. C., & Fabricant, P. D. (2019). Health consequences of youth sport specialization. Journal of Athletic Training, 54(10), 1040–1049. https://doi.org/10.4085/1062-6050-380-18
Kliethermes, S. A., Nagle, K., Cote, J., Malina, R. M., Faigenbaum, A., Watson, A., Feeley, B., Marshall, S. W., LaBella, C. R., Herman, D. C., Tenforde, A., Beutler, A. I., & Jayanthi, N. (2020). Impact of youth sports specialisation on career and task-specific athletic performance: A systematic review following the American Medical Society for Sports Medicine (AMSSM) Collaborative Research Network's 2019 youth early sport specialisation summit. British Journal of Sports Medicine, 54(4), 221–230. https://doi.org/10.1136/bjsports-2019-101365
LaPrade, R. F., Agel, J., Baker, J., Brenner, J. S., Cordasco, F. A., Cote, J., Engebretsen, L., Feeley, B. T., Gould, D., Hainline, B., Hewett, T., Jayanthi, N., Kocher, M. S., Myer, G. D., Nissen, C. W., Philippon, M. J., & Provencher, M. T. (2016). AOSSM Early Sport Specialization Consensus Statement. Orthopaedic Journal of Sports Medicine, 4(4), 2325967116644241. https://doi.org/10.1177/2325967116644241
Lloyd, R. S., Oliver, J. L., Faigenbaum, A. D., Myer, G. D., & De Ste Croix, M. B. A. (2014). Chronological age vs. biological maturation: Implications for exercise programming in youth. Journal of Strength & Conditioning Research, 28(5), 1454–1464. https://doi.org/10.1519/JSC.0000000000000391
McGowan, J., Whatman, C., & Walters, S. (2020). The associations of early specialisation and sport volume with musculoskeletal injury in New Zealand children. Journal of Science and Medicine in Sport, 23(2), 139–144. https://doi.org/10.1016/j.jsams.2019.09.002
McGuine,T.A.,Post,E.G.,Hetzel,S.J.,Brooks,M.A.,Trigsted, S., & Bell, D. R. (2017). A prospective study on the effect of sport specialization on lower extremity injury rates in high school athletes. American Journal of Sports Medicine, 45(12), 2706–2712. https://doi.org/10.1177/0363546517710213
Miller, M. M., Trapp, J. L., Post, E. G., Trigsted, S. M., McGuine, T. A., Brooks, M. A., & Bell, D. R. (2017). The effects of specialization and sex on anterior Y-balance performance in high school athletes. Sports Health, 9(4), 375–382. https://doi.org/10.1177/1941738117703400
Mirwald, R. L., Baxter-Jones, A. D. G., Bailey, D. A., & Beunen, G. P. (2002). An assessment of maturity from anthropometric measurements. Medicine & Science in Sports & Exercise, 34(4), 689–694. https://doi.org/10.1097/00005768200204000-00020
Zoellner et al. / The Journal of Sport and Exercise Science, Journal Vol. 9, Issue 2, 30-39 (2025)
Moesch, K., Elbe, A. M., Hauge, M. L., & Wikman, J. M. (2011). Late specialization: The key to success in centimeters, grams, or seconds (cgs) sports. Scandinavian Journal of Medicine & Science in Sports, 21(6), e282–e290. https://doi.org/10.1111/j.1600-0838.2010.01280.x
Mosher, A., Fraser-Thomas, J., & Baker, J. (2020). What defines early specialization: A systematic review of literature. Frontiers in Sports and Active Living, 2, 596229. https://doi.org/10.3389/fspor.2020.596229
Munro, A. G., & Herrington, L. C. (2011). Between-session reliability of four hop tests and the agility T-test. Journal of Strength & Conditioning Research, 25(5), 1470–1477. https://doi.org/10.1519/JSC.0b013e3181d83335
Murata, A., Goldman, D. E., Martin, L. J., Turnnidge, J., Bruner, M. W., &Côté, J.(2022). Samplingbetween sports and athlete development: A scoping review. International Journal of Sport and Exercise Psychology, 20(6), 1752–1776. https://doi.org/10.1080/1612197x.2021.1995021
Myer, G. D., Faigenbaum, A. D., Ford, K. R., Best, T. M., Bergeron, M. F., & Hewett, T. E. (2011). When to initiate integrative neuromuscular training to reduce sports-related injuries andenhancehealth inyouth? Current Sports Medicine Reports, 10(3), 155–166. https://doi.org/10.1249/JSR.0b013e31821b1442
Myer, G. D., Jayanthi, N., Difiori, J. P., Faigenbaum, A. D., Kiefer, A. W., Logerstedt, D., & Micheli, L. J. (2015). Sport specialization, Part I: Does early sports specialization increase negative outcomes and reduce the opportunity for success in young athletes? Sports Health, 7(5), 437–442. https://doi.org/10.1177/1941738115598747
Myer, G. D., Kushner, A. M., Faigenbaum, A. D., Kiefer, A., Kashikar-Zuck, S., & Clark, J. F. (2013). Training the developing brain, Part I: Cognitive developmental considerations for training youth. Current Sports Medicine Reports, 12(5), 304–310. https://doi.org/10.1097/01.CSMR.0000434106.12813.69
New Zealand Football. (2016). Youth Framework https://www.nzfootball.co.nz/asset/downloadasset?id=32dde a4a-674c-4f55-8f90-78037105caab
Nolan, L., Grigorenko, A., & Thorstensson, A. (2005). Balance control: Sex and age differences in 9- to 16-year-olds. Developmental Medicine & Child Neurology, 47(7), 449–454. https://doi.org/10.1111/j.1469-8749.2005.tb01170.x
Normand, J. M., Wolfe, A., & Peak, K. (2017). A review of early sport specialization in relation to the development of a young athlete. International Journal of Kinesiology & Sports Science, 5(2), 37–42. https://doi.org/10.7575/aiac.ijkss.v.5n.2p.37
Noyes, F. R., Barber-Westin, S. D., Fleckenstein, C., Walsh, C., & West, J. (2005). The drop-jump screening test: Difference in lower limb control by gender and effect of neuromuscular training in female athletes. American Journal of Sports Medicine, 33(2), 197–207. https://doi.org/10.1177/0363546504266484
Padua, D. A., DiStefano, L. J., Beutler, A. I., de la Motte, S. J., DiStefano, M. J., & Marshall, S. W. (2015). The landing error scoring system as a screening tool for an anterior cruciate ligament injury-prevention program in elite-youth soccer athletes. Journal of Athletic Training, 50(6), 589–595. https://doi.org/10.4085/1062-6050-50.1.10
Padua, D. A., Marshall, S. W., Boling, M. C., Thigpen, C. A., Garrett, W. E., Jr., & Beutler, A. I. (2009). The landing error scoring system (LESS) is a valid and reliable clinical assessment tool of jump-landing biomechanics: The JUMPACL study. American Journal of Sports Medicine, 37(10), 1996–2002. https://doi.org/10.1177/0363546509343200
Peckham, K., Distefano, L., Root, H., Post, E., Lepley, L., Trigsted, S., Brooks, A., Scarneo, S., & Bell, D. (2018). The influence of sport specialization on landing error scoring system scores in high school athletes. Athletic Training & Sports Health Care, 10, 253–259. https://doi.org/10.3928/19425864-20180830-02
Pedley, J. S., Lloyd, R. S., Read, P. J., Moore, I. S., De Ste Croix, M., Myer, G. D., & Oliver, J. L. (2020). Utility of kinetic and kinematic jumping and landing variables as predictors of injury risk: A systematic review. Journal of Science in Sport and Exercise, 2(4), 287–304. https://doi.org/10.1007/s42978020-00090-1
Plisky, P. J., Gorman, P. P., Butler, R. J., Kiesel, K. B., Underwood, F. B., & Elkins, B. (2009). The reliability of an instrumented device for measuring components of the star excursion balance test. North American Journal of Sports Physical Therapy, 4(2), 92–99. https://pubmed.ncbi.nlm.nih.gov/21509114
Plisky, P. J., Rauh, M. J., Kaminski, T. W., & Underwood, F. B. (2006). Star excursion balance test as a predictor of lower extremity injury in high school basketball players. Journal of Orthopaedic & Sports Physical Therapy, 36(12), 911–919. https://doi.org/10.2519/jospt.2006.2244
Post, E. G., Rosenthal, M. D., & Rauh, M. J. (2019). Attitudes and beliefs towards sport specialization, college scholarships, and financial investment among high school baseball parents. Sports, 7(12). https://doi.org/10.3390/sports7120247
Post, E. G., Thein-Nissenbaum, J. M., Stiffler, M. R., Brooks, M. A., & Bell, D. R. (2017a). High school sport specialization patterns of current Division I athletes. Sports Health, 9(2), 148–153. https://doi.org/10.1177/1941738116675455
Post, E. G., Trigsted, S. M., Riekena, J. W., Hetzel, S., McGuine, T. A., Brooks, M. A., & Bell, D. R. (2017b). The association of sport specialization and training volume with injury history in youth athletes. American Journal of Sports Medicine, 45(6), 1405–1412. https://doi.org/10.1177/0363546517690848
Read, P. J., Oliver, J. L., De Ste Croix, M. B., Myer, G. D., & Lloyd, R. S. (2016). Neuromuscular risk factors for knee and ankle ligament injuries in male youth soccer players. Sports Medicine, 46(8), 1059–1066. https://doi.org/10.1007/s40279016-0479-z
Read, P. J., Oliver, J. L., De Ste Croix, M. B. A., Myer, G. D., & Lloyd, R. S. (2018a). Landing kinematics in elite male youth soccer players of different chronologic ages and stages of maturation. Journal of Athletic Training, 53(4), 372–378. https://doi.org/10.4085/1062-6050-493-16
Read, P. J., Oliver, J. L., Dobbs, I. J., Wong, M. A., Kumar, N. T. A., & Lloyd, R. S. (2021). The effects of a four-week neuromuscular training program on landing kinematics in preand post-peak height velocity male athletes. Journal of Science in Sport and Exercise, 3(1), 37–46. https://doi.org/10.1007/s42978-020-00097-8
Read, P. J., Oliver, J. L., Myer, G. D., De Ste Croix, M. B. A., Belshaw, A., & Lloyd, R. S. (2018b). Altered landing
Zoellner et al. / The Journal of
and Exercise Science, Journal Vol. 9, Issue 2, 30-39 (2025)
mechanics are shown by maleyouth soccer players at different stages of maturation. Physical Therapy in Sport, 33, 48–53. https://doi.org/10.1016/j.ptsp.2018.07.001
Read, P. J., Oliver, J. L., Myer, G. D., Farooq, A., De Ste Croix, M., & Lloyd, R. S. (2020). Utility of the anterior reach Ybalance test as an injury risk screening tool in elite male youth soccer players. Physical Therapy in Sport, 45, 103–110. https://doi.org/10.1016/j.ptsp.2020.06.002
Rudd, J. R., Pesce, C., Strafford, B. W., & Davids, K. (2020). Physical Literacy - A Journey of Individual Enrichment: An Ecological Dynamics Rationale for Enhancing Performance and Physical Activity in All. Frontiers in Psychology, 11, 1904. https://doi.org/10.3389/fpsyg.2020.01904
Smith, C. A., Chimera, N. J., & Warren, M. (2015). Association of Y balance test reach asymmetry and injury in Division I
athletes. Medicine & Science in Sports & Exercise, 47, 136–141. https://doi.org/10.1249/MSS.0000000000000380
van der Sluis, A., Elferink-Gemser, M. T., Coelho-e-Silva, M. J., Nijboer, J. A., Brink, M. S., & Visscher, C. (2014). Sport injuries aligned to peak height velocity in talented pubertal soccer players. International Journal of Sports Medicine, 35(4), 351–355. https://doi.org/10.1055/s-0033-1349874
Wall, M., & Côté, J. (2007). Developmental activities that lead to dropout and investment in sport. Physical Education & Sport Pedagogy, 12(1), 77–87. https://doi.org/10.1080/17408980601060358
Zoellner, A., Whatman, C., Sheerin, K., & Read, P. (2022). Prevalence of sport specialisation and association with injury history in youth football. Physical Therapy in Sport, 58, 160–166. https://doi.org/10.1016/j.ptsp.2022.10.013
The Journal of Sport and Exercise Science, Vol. 9, Issue 2, 40-50 (2025) www.jses.net
No home team bias in elite football referees:Assessing correctness of refereeing decisions in the English Premier League
Stuart
C. Carrington1* , Joshua M. Adie2,3 , Patrick Oxenham4
1Faculty of Sport, Technology, and Health Science, St Mary’s University, United Kingdom
2School of Health, University of the Sunshine Coast, Moreton Bay, Australia
3Centre for Health Research, University of Southern Queensland, Australia
4Fulham Football Club, United Kingdom A R T I C L E I N F O
Received: 21.06.2025
Accepted: 05.11.2025
Online: 16.12.2025
Keywords: Sports officials
Decision-making
Social bias
Crowd influence
Territoriality model
1. Introduction
B S T R A C T
It is unclear whether referee decisions contribute to home advantage in football. This ambiguity stems from significant advancements in the development and training of officials, methodological limitations, such as the use of regression models to provide estimates, in extant research, and team behaviours. Thus, there may appear to be a bias when there is none. This study aimed to establish whether referees contribute to home advantage in elite football. Decisions (N = 4,201) from 172 games from the English Premier League 2022/23 season were analysed by 43 qualified football referees, with two officials allocated to each fixture. The referees independently assessed free-kicks, yellow cards, red cards, penalty kicks, and non-whistled penalty kicks given by the on-field official using clips from WyScout. Decisions were recorded as ‘correct’ or ‘incorrect’ in unanimous cases, or ‘disputed’ if the two officials did not agree. Data from the free-kick and yellow card categories were considered suitable for analysis and compared using a series of linear mixed-effects models. There were no significant differences found between home and away teams for correct, disputed, and incorrect decisions, showing that neither team were differentially favoured by the referee, and therefore their decisions could not contribute to home advantage. Findings support the efficacy of referee development and the territoriality model’s explanation of home advantage in professional football.
The home advantage is a universal phenomenon in sports, with no organised sporting contest showing greater success for teams and individuals in away venues compared to home venues (Allen & Jones, 2014; Gómez-Ruan & Pollard, 2021). Paradoxically, while research investigating home advantage has significantly increased over the previous three decades (Prieto, 2022), the exact contribution to home advantage of various factors remains, as Pollard (2008) previously exclaimed, an ‘unsolved puzzle’. In football (i.e., soccer), this ambiguity lies in the numerous possible antecedents to home advantage, such as tactical approaches of home and away teams (Fernandez-Navarro et al., 2018; Gollan et al., 2020; Lago-Peñas & Lago-Ballestaros, 2011), biological and
physical effects of playing at home (Aquino et al., 2017; Teixeira et al., 2021), and satisfaction with different game outcomes (Staufenbiel et al., 2015). These variables are evident in models that attempt to explain home advantage.
The territoriality model (Neave & Wolfson, 2003) states that home advantage is a result of physiological and behavioural responses regarding the protection of territory. For example, players exhibit increased testosterone levels before home games in ice hockey (Carré et al., 2006), football (Neave & Wolfson, 2003), rugby (Terry et al., 1998), and field hockey (Bray et al., 2002). Additionally, a long-term study of home advantage found that football teams Bastia and Ajaccio, who both play on the island of Corsica, were two of only three French teams who reported a home advantage of over 70%, while Sicilian teams
*Corresponding Author: Stuart Carrington, Faculty of Sport, Technology, & Health Science, St Mary’s University, United Kingdom, stuart.carrington@stmarys.ac.uk
Catania and Palermo, had the highest home advantagevalue in the Italian league (Pollard& Gómez, 2009). Thecultural traditions on bothislandsthatpromoteunityandresistancetomainlandidentity contribute to the notion of territoriality, with these qualities identified as the cause of enhanced home advantage reported by those teams (Pollard & Gómez, 2009). While the alternative ‘classical model’ (Allen & Jones, 2014) postulates factors related to territoriality (e.g., home support, familiarity with venue and travel fatigue of the opposition) contribute to home advantage, it also identifies officiating as a factor, a contention supported elsewhere (e.g., Bilalić et al., 2024; Courneya & Carron; 1992). As the role of officials is to provide impartial and fair judgements (Russell et al., 2019; Webb, 2022), this purpose combined with the increased financial implications of a team’s success or failure (Jamieson, 2010) and potential impact of success and failure on supporter well-being (Dohmen & Sauermann, 2016), establishing if and how they contribute to home advantage is worthwhile.
Football is the sport that reports the highest value of home advantage (Jamieson, 2010), and therefore analysis of officiating decisions in this sport is justified to ascertain whether, and how, game location influences referees’ actions. A systematic review of referee bias identified five factors that contribute to inaccurate decision-making in football referees: stake size, crowd size and composition, crowd proximity, material rewards, and refereespecific effects (e.g., age and experience; Dohmen & Sauermann, 2016). Twenty-seven studies were reviewed with bias being manifested in time allowed (e.g., increased stoppage time), goals awarded, penalty kicks awarded, and/or disciplinary sanctions. For example, Dohmen (2008) reported that, when controlling for disciplinary actions and substitutions, events that typically increase the amount of time added on, officials added an average of 22 more seconds when the goal differential was one. This finding was attributed by Dohmen and Sauermann (2016) to the impact of social pressures (e.g., the desire to be seen as impartial), as similar studies reported a greater effect when it was the home team that was losing by a one-goal margin (see Rickman & Witt, 2008; Scoppa, 2008), thus supporting the classical model’s identification of the official as an antecedent to home advantage.
This support extends beyond time played, with referees in the English Premier League being reported to have a significant effect on the number ofgoals home teams scored, the number of goals the away team scored, penalising away team players with more yellow and red cards than home team players and being significantly more likely to award penalties to the home team than the visitors (Boyko et al., 2007). While other studies support these findings, such as legitimate penalties being more likely awarded to the home team than the away team (Sutter & Kocher, 2004), caution is advised when attributing home advantage to refereeing decisions.
The first reason to exercise caution when considering the impact of officials on home advantage is evidence to the contrary found in extant literature. For example, Adie et al. (2022a) report no bias towards the home team in cricket regarding leg-beforewicket (LBW) decisions, while similar studies refute the impact of the referee on home advantage found in football. Dohmen and Sauermann’s review, for instance, did not include Riedl et al.’s (2015) investigation into injury time and home advantage. This analysis of archival data from the German Bundesliga between 2000 and 2011 found that while referees did allow more injury time when either team was trailing by a goal, even after accounting for alternative explanations for increased injury time
(e.g., disciplinary sanctions, substitutions, etc.), this was the same for both teams and did not significantly affect goals scored. Consequently, while officials may have demonstrated a systematic bias towards avoiding narrow victories, this bias did not influence home advantage. Further, some studies that were included have questionable conclusions. For example, the findings of Boyko et al. (2007) that support the classical model were attributable to one official who accounted for the apparent home advantage as, once their data was removed, no effect was found (see Strauss et al., 2009, for a discussion). Therefore, individual differences such as experience may mediate the impact of game location on officiating performance, a conclusion supported elsewhere (Page & Page, 2010).
A second reason to question the officials’ role in home advantage is technological and training advances, that have been identified as a significant cause of reduced home advantage in professional football over theprevious century (Nevill et al.,2013; Webb et al., 2018). Technological developments, such as the introduction of microphones in 2006 that allow officials to communicate throughout the match, may help insulate elite officials from crowd influence by reducing conformity (see Asch, 1955). The introduction of video assistant referees (VAR) in 2018, has been reported to have enhanced the decision-making accuracy of officials from 92.1% to 98.3% (Spitz et al., 2021). However, while VAR has been reported as reducing home team bias (Gasparetto et al., 2023), investigation of the initial, on-field decision is recommended due to the time taken for VAR intervention and to develop the traditionally ‘practice poor’ environment of professional officiating (Spitz et al., 2021). Additionally, a contemporary assessment of elite officials’ decision-makingiswarrantedtoevaluatewhetherinitial,‘on-field’ decision-making accuracy has been helped or hindered by technological support, with previous research indicating an error rate of 6.9% within this population (Hossner et al., 2019).
Furthermore, the development of strategies to enhance decision-making borne from experience and/or training may have helped elite officials insulate themselves from external factors such as game location. For example, gaze behaviours of elite football referees are associated with higher search rates of shorter durations than sub-elite officials (van Biemen et al., 2022). Consequently, adaptive strategies may explain why elite officials are not influenced by game location, with social pressure reported as not influencing red cards shown in the English Premier League (Reilly & Witt, 2013). Ergo, the development of technology, coupled with the improved training of football referees (see Webb, 2017; 2022) may explain a decrease in home advantage value found in European football (Nevill et al., 2022; Pollard & Gómez, 2009; Webb et al., 2018). Therefore, assessing the extent of officials’ contribution to home advantage may indicate the success of such developments.
Determining whether and, if so, to what extent officials contribute to home advantage is challenging considering methodological limitations present in extant studies, giving the impression of referee bias when there may be none. For example, to calculate expected goals for home and away teams, Boyko et al. (2007) used a regression model, which Dohmen and Sauermann (2016) claimed is less effective than assessing whether decisions are correct or not. This method was also applied to conclude that away team players are more likely to be shown a yellow card than home players, with a regression model estimating the number of
free kicks and cautions (Picazo-Tadeo et al., 2017). While such research is welcome, previous research has identified that football teams adopt different strategies depending on game location, such as home teams’ greater use of offensive players due to increased dissatisfaction with a tied score at half-time, higher ball possession, and implementation of proactive (e.g., attacking) strategies (Carron etal.,2005;Collet,2013;Lago-Peñasetal.,2017;Staufenbieletal., 2015). Such strategies may result in away teams being more likely toconcedefoulsleadingtodisciplinarysanctions,suchasfreekicks, yellowcards,andpenalties,andthereforethereisaneedtoconsider whether officials’ decisions are correct or not. The failure to assess decision correctness constitutes a methodological limitation of studies analysing descriptive statistics to conclude game location promotes referee bias (e.g., home teams receive fewer yellow cards when spectators are present; Pettersson-Lidbom & Priks, 2010), as well as studies that claim there is no referee bias when crowds are absent (e.g., no difference in number of cards between home and away teams; Sors et al., 2021). To address this methodological gap inextantresearchthereisaneedforananalysisoffootballreferee’s decisions by assessing their correctness.
Analysing the correctness of decisions to determine whether previously held assumptions of bias were accurate has been accomplished in other sports. Adie et al. (2022b) concluded that while lower-order batters in elite cricket, that are not expected to be as competent as higher-order batters, were more likely to be judged as LBW by the umpire, this was not due to expectation bias (where decisions are influenced by irrelevant criteria such as previous outcomes or order of performance; see Plessner, 1999), but to correctness. In short, lower order batters are more likely to begiven LBW because they are actually out LBW. Although this study providesajustificationforassessingcorrectnessofdecisionsbefore assuming the presence of social or other bias in sports officials, LBW decisions are both reactive and objectively verifiable (e.g., theumpiredecideswhethertheballhitthebatfirstaftertheincident) and predictive (e.g., judging whether the ball have gone on to hit the stumps). While decisions made by football officials are mostly reactive(e.g.,determiningwhetherafoulwascommitted),thereare also occasions when officials switch from a rule-based approach to a proactive ‘game management’ approach (see Raab et al., 2020). This method compromises accuracy for adequacy, reflecting game conventions(e.g.,whatthegame‘expects’)andpromotingtheflow of the contest (see Harper, 2022; Mascarenhas et al., 2002; Unkelbach & Memmert, 2008), but may also promote sensitivity to external influences (Plessner & Betsch, 2001; Praschinger et al., 2011). Additionally, many decisions made are ambiguous in that they not objectively verifiable (e.g., assessing whether a foul was careless, reckless, or used excessive force).
Research into correctness of decision within sports that require the official to make reactive decisions that are not objectively verifiable, while limited, have shown no support for the classical model. For instance, Corrigan et al. (2019) assessed correctness of decisionsmadebyAustralianFootballLeague(AFL)officials,with no evidence that decisions were influenced by game location. However, game location has been found to influence ambiguous decisions in favour of the home team in football, particularly regarding punitive action (e.g., yellow cards shown; Cohen et al., 2024). However, this study used fans and not referees to assess decisions and therefore, given the importance of experience in officiating performance, assessing correctness of decisions in footballofficialsshouldbemadeviaconsensusamongrefereeswho
are familiar with the laws of the game and conventions of the sport. This approach is justified to determine the influence of game location as, if there is no difference in correctness of decision between home and away teams, increased win percentages at home are attributable to player and coach behaviour.
This study sought to meet two objectives. First, to determine whether decisions made by elite football referees in England are influenced by match location by ascertaining if the home team received more errors in their favour than the away team, and if the away team received less correct calls in their favour. Second, if any difference is found, to determine how any influence is manifested by assessing decisions in categories that have been identified as significant for officiating performance. It was hypothesised that, due to the experience of the officials operating in top tier football, enhanced training methods and the introduction of technology, previously identified as causes for a decrease in home advantage in football (see Webb et al., 2018), no bias would be found regarding decision-making accuracy between home and away teams.
2. Methods
2.1. Participants and procedure
Ethical approval was granted by the lead author’s university. To assess correctness of decisions the research team agreed that a panel of officials should be used. This decision rejects the positivist perspective of truth, with a panel judging that what is accepted as truth, is the truth. Further, it reflects the pragmatist view of the researchers, in that to overcome the methodological limitations of existing studies assessing the referee’s role in home advantage, correctness of decisions would need to be considered (see Giacobbi et al., 2005). Forty-two qualified football referees were recruited (Mage = 33.7 years; SD = 11.54). Thirty-five participants were from Great Britain and Ireland, six from North America (United States of America and Canada) and one from Latvia (although a practicing official in England). Participants were recruited via email invitations to relevant agents (e.g., Referee Development Officers, Referee Associations) andadverts placed on social media. Participants were also given the opportunity to attend an online information session regarding the aims of the study and what participation would require. Participants had to be over 18 years of age and a qualified football referee (Myears’ experience = 10.5 years, SD = 9.85). While classification systems across nations makes calibrating officiating level difficult (see Webb et al., 2021), referees ranged from Level 7 (local level) to Level 1 (professional) in the UK (M Level = 4.91, SD = 1.53) and reported both ‘regional’ and ‘national’ levels in the United States and Canada. None of the officials were current or previous English Premier League officials and a breakdown of officiating classification can be found in Table 1. Officials were informed that the aim of study was to evaluate correctness of refereeing decisions, but not that decisions between home and away teams would be compared, and that they would be asked to view video clips from an English Premier League fixture every week for the duration of the season to assess correctness. Video clips were uploaded to a designated folder for each participant, which also contained a tutorial video for officials to view, providing guidance on how to access their clips and record their
assessments. The tutorial video was constructed by the authors of the study to ensure a consistent data collection approach across all referees and all games and contained information to assist participants completing their task (e.g., when clips would be uploaded to their folder, how to complete the decision assessment sheet, who to contact should they have any questions etc).1
Table 1: Classification of participants’ officiating level.
1 25 1 (Referees on English Premier League, English Football League)
1 10 2 (Referees on National League, Step 1 and/or Step 2 of NLS)
1 12 3 (Referees on Steps 3 & 4 of NLS)
10 9.13 ± 6.45 4 (Referees on Steps 5 & 6 of NLS)
11 13.43 ± 14.84 5 (Referees on Step 7 of the NLS & Senior County football)
4 5 ± 4.36 6 (Referees on County League Football)
6 2.25 ± 1.25 7 (Referees on County League Football)
6 18.33 ± 10.50 Regional (USA/Canada)
2 7.50 ± 3.54 National (USA/Canada)
Note: Classification descriptions taken from The Football Association (The Football Association, 2025); Level 1 participant for this study operated in the English Football League. NLS = National League System.
Followingrecruitment,everyfixturefromthe2022/23English Premier League was assigned to four officials at random. Four officials were chosen per game in anticipation that some officials would either withdraw from the study or fail to record their assessment of the allocated game. Consequently, each game had two ‘primary referees’, whose decisions would be used for analysis, and two ‘back up’ officials, to be used if the primary officials did not complete their assessment. At the conclusion of each game week, video clips of actions involving the referee were taken from WyScout(Chiavari, Italy) anduploaded tothat game’s allocated officials’ folder.
WyScout clips are uniformed in time per incident (10 second of footage before and after event), with cumulative length of clips dependent on the number of incidents in each game). Further, inter-operator reliability of clips collated by WyScout is 0.70, considered good agreement between operators (Pappalardo et al., 2019; Viera & Garrett, 2005). Video clips involved foul decisions
given,yellow cards given,redcards given,penaltykicks awarded, and penalty kicks not awarded (definitions of these events are taken from the International Football Association Board’s Laws of the Game, and can be found in the Wyscout Glossary: https://dataglossary.wyscout.com). These referee actions are justified for investigation regarding officials’ contribution to home advantage based on previous studies applying these criteria without accounting for correctness (e.g., Dohmen & Sauermann, 2016; Goumas, 2014; Sors et al., 2021). Noneoftheclipsincludedanyslow-motionfeatures,meaningthat participants were unable to adjust the playback speed of the footage as reviewing clips in slow motion has been shown to influence assessment of decisions (Pizzera et al., 2022). Clips included some contextual information (e.g., teams playing, time, and score), as this has been reported to increased decision-making accuracy over the use of randomised clips provided without context, possibly due to qualified officials understanding the importanceofgamemanagement(Raabetal.,2020;Samueletal., 2019). All clips were viewed from a camera perspective of an elevated position level with the halfway line, a position that reports significantly improved accuracy of decision-making assessment when compared to other perspectives (e.g., coaches’ viewpoint from pitch side; Pizzera et al., 2022). Although assessment of decisions via the referee’s perspective may have improved ecological validity, this was not a viable option as, at time of writing, officials were prohibited from wearing recording equipment (The Football Association, 2024).
Officials were asked to complete a spreadsheet, also located in their folder, per game where they were required to: (a) record the namesoftheteamscompeting,(b)selectwhatthedecisionwas(e.g., free kick, yellow card, penalty) by using a drop-down box, (c) state whether they agreed or disagreed with the on-field referee’s decisionforeacheventshown,and(d)attheirowndiscretion,make notes should they wish to add any further information for each decision. For example, referees could state whether they felt a yellow or red card should, or should not, have been administered following a free kick. Only the on-field referee’s decision was assessed. If a decision was made that resulted in VAR intervention, then the result of this intervention was not assessed. This was due totheVARofficialsnotbeingpresentinthestadiumand,therefore, any decision cannot be attributed to crowd presence, noise, or proximity, previously identified as factors contributing to home team bias in referees (Dohman & Sauermann, 2016), and the importance of assessing the original decision to minimise VAR intervention (Spitz et al., 2021).
In anticipation of participant withdrawal or incomplete samples due to time commitment (5 of the original 42 participants withdrew from the study throughout the season), two primary officials were assigned to each game, with another two assigned in reserve should one or both primary referees fail to complete their allocated game. As the video clips evaluated by the participants are subjective decisions, correctness was determined by having agreement from both referees appointed to each match. Use of panels consisting of qualified officials to evaluate decisions have previously been used to evaluate on-field referee decisions (e.g., Nevill et al., 2017) and so for a decision to be considered correct or incorrect, both referees had to agree.
1Tutorial video available upon request by contacting the corresponding author.
However, for this study, the subjective nature of the laws of football (see Bordner, 2019, for a discussion) was considered, with ‘disputed’ decisions recorded when no consensus between referees was reached. There was no temporal constraint on when participants could complete their review of the clips, however they were encouraged to do so as soon as possible to minimise outside influence (e.g., media analysis of on-field referee performance).
Upon completion of the English Premier League season 2022/23, footage from each game assessed by two officials was reviewed, and every on-field decision labelled as ‘against home team’or‘againstawayteam’bythelead researcher,with‘against’ determinedbywhichteam concededpossession orreceived acard following the incident. The decisions were categorised as one of the following for both home and away teams: correct foul given against; correct yellow for; correct red for; correct penalty for; correct ‘un-whistled’ penalty for; disputed foul given against; disputed yellow given for; disputed red given for; disputed penalty given for; disputed ‘un-whistled’ penalty given for; missed yellow for; missed red for; error foul against; error yellow for; errorred for; errorpenaltyfor; error‘un-whistled’penalty for. Spreadsheets submitted for each game were compared and decisions classified as ‘correct’, ‘disputed’ or ‘erroneous’.
2.2. Data analysis
Decisions from 172 games, representing 45% of the English Premier League2022/23season, were assessed in their entirety by two officials, resulting in a total of 4,237 decisions reviewed for correctness. Thirty-six decisions were excluded from analysis due to participants reporting that either the on-field decision was not identifiable from thefootage,or that theirview of theincidentwas not clear, thus making assessment impossible. The removal of these incidents resulted in a final sample of 4,201 decisions analysed. The number of games evaluated from each team can be seen in Table 2.
Table 2: Number of games analysed per team. Team
Arsenal 15 Leicester City 16
Aston Villa 16 Liverpool 16
Bournemouth 23 Manchester City 17
Brentford 11 Manchester United 15
Brighton 21 Newcastle United 16
Chelsea 19 Nottingham Forest 17
Crystal Palace 14 Southampton 18
Everton 17 Tottenham Hotspur 19
Fulham 20 West Ham United 18
Leeds United 17 Wolverhampton W. 14
A validity check was performed to ensure that the sample was representative of the entire season. The sample consisted of 48%
of home wins, 30% of away wins, and 22% of draws. This was deemed an accurate representation of the entire season, which reported 48% of matches as home wins, 29% as away wins, and 23% as draws.
Referee decision events were coded by type and were then coded for accuracy. Decision events included fouls (correct, incorrect, disputed, missed yellow), yellow cards (correct, incorrect, disputed), and red cards (correct, incorrect, disputed). A series of linear mixed effects models predicting decision event frequencies were conducted in R (Version 4.4.2) using the lme4 package (Bates et al., 2015). Each mixed model included the team (Home v Away) as a fixed effect, and the referee as a random effect. We included the referee as a random effect to account for the unequal representation of the 19 referees assessed across matches,wheresomerefereesofficiated morematchesthanothers (the highest number of matches officiated by an observed referee was 13, whereas the lowest number of matches officiating by a referee was one). Degrees of freedom were calculated using a Satterthwaite approximation. Marginal and conditional R2 values were calculated as measures of effect size using the MuMin package (Bartoń, 2024). We did not compare red cards as only 9 red cards were awarded in this dataset.
3. Results
3.1. Descriptive statistics
A visual analysis of descriptive statistics (Table 3) indicated away teams committed more fouls than home teams (1,703 to 1,667 respectively). Furthermore, away team players were shown more yellow cards than home team players (240 to 224), with these decisions being deemed correct. Away team players had more disputed fouls against them than hometeam players (90 to 74)and received more disputed yellow cards than home team players (16 to 7). Home team players had more fouls awarded against them incorrectly than away team players (29to23), with bothhome and away team players receiving the same amount of incorrect yellow cards in the opinion of the officiating panel (3 each). The officiating panel believed that while both teams should have received more yellow cards, the number of ‘missed’ yellow cards benefitted the home team (33 to 21). If these yellow cards are included as incorrect decisions, then the officiating panel judged the on-field referees as getting 3,891 decisions correct and 117 incorrect, meaning officials got 2.92% of decisions wrong. This does not include ‘disputed’ decisions, where the officiating panel could not agree whether the on-field judgement was correct or incorrect. If the disputed decisions are considered incorrect, this study reports an error rate of 7.38%, consistent with results reported elsewhere (Spitz et al., 2021). If half of the disputed decisions are considered incorrect, and the other half correct, then accuracy rate is 94.9%.
Results showed that home teams were awarded 22 penalty kicks, with 14 penalty kicks awarded to away teams. Two of these decisions, favouring the home team, were disputed. Neither home nor away teams were awarded a penalty kick that the officiating panel felt was in error. Home teams were more likely than away teamstohaveappealsforpenaltykicksturneddown(12to4),while
Table 3: Descriptive statistics.
Category of decision
Notes: Games N = 172; total decisions N = 4201; ‘Correct’ = officiating panel agreed with decision; ‘disputed’ = no consensus among officiating panel; ‘incorrect’ = officiating panel disagreed with decision.
both home teams and away teams received two penalty kicks in error. Due to limited sample size, thus casting doubt over reliability of any subsequent analysis, penalty kick decisions and red card decisions (of which there were nine), were not included in further analysis.
3.2. Awarded fouls
In total, 3,586 fouls were awarded at an average of 20.85 (SD = 5.20) fouls per match (Figure 1). On average, the home team reported 10.29 (SD = 3.51) fouls per match, while the away team reported an average of 10.56 (SD = 3.41) fouls per match, resulting in an average total foul differential score of -0.27 (SD = 4.45). This equates to one additional foul awarded against the away team every 3.7 matches. A linear mixed effects model revealed that this difference was not significant, F(1, 324.21) = 0.53, p = 0.468. The model explained <1% of the variance when considering the fixed effect of team alone (R2 M = .001) and 2.7% of the variance when considering both the fixed effect of team and the random effect of referee (R2 C = 0.027).
reported 0.17 (SD = 0.42) fouls incorrectly per match, while the awayteamreportedanaverageof0.13(SD=0.40)foulsincorrectly per match, resulting in an average incorrect foul differential score of0.04(SD=0.57).Thiscanbeinterpretedas1additionalincorrect foul awarded against the away team every 25 matches. A linear mixed effects model revealed that this difference was not significant, F(1, 342) = 0.62, p = 0.433. The model explained <1% ofthevariancewhenconsideringboththefixedeffectofteamalone (R2 M =.002)andwhenconsideringboththefixedeffectofteamand the random effect of referee (R2 C = 0.002).
A total of 164 fouls were coded as disputed, at an average of 0.95 (SD = 1.13) decisions per match. On average, the home team reported 0.43 (SD = 0.71) disputed fouls, while the away team reported an average of 0.52 (SD = 0.80) disputed fouls, resulting in average disputed foul differential score of -0.09 (SD = 1.00). This can be interpreted as 1 additional disputed foul awarded against the away team every 11.11 matches. A linear mixed effects model revealed thatthis difference was not significant, F(1, 342) = 1.30, p = 0.254. The model explained <1% of the variance when considering both the fixed effect of team alone (R2 M = 0.004) and when considering both the fixed effect of team and the random effect of referee (R2 C = 0.004).
A total of 54 fouls were coded as missed yellow cards, at an average of 0.31 (SD = 0.64) missed yellow cards per match. On average,0.19(SD=0.48)yellowcardsweremissedforhometeam, while an average of 0.12 (SD = 0.38) yellow cards were missed for the away team, resulting in an average missed yellow card differential score of 0.07 (SD = 0.58). This can be interpreted as 1 additional missed yellow against the home team every 14.29 matches. A linear mixed effects model revealed that this difference was not significant, F(1, 342) = -2.27, p = 0.133. The model explained <1% of the variance when considering both the fixed effect of team alone (R2 M = 0.007) and when considering both the fixed effect of team and the random effect of referee (R2 C = 0.007).
3.3. Awarded yellow cards
Figure 1:Correct,disputed,and incorrectfouldecisions permatch average for home and away teams (2022/2023 Premier League season).
A total of 52 fouls were rated as incorrect, at an average of 0.30 (SD = 0.59) decisions per match. On average, the home team
In total, 493 yellow cards were awarded at an average of 2.87 (SD = 1.68) yellow cards per match (Figure 2). On average, the home team received 1.36 (SD = 1.10) yellow cards per match, while the away team received an average of 1.51 (SD = 1.2) yellow cards per match, resulting in an average yellow card differential score of -0.15 (SD = 1.54). This can be interpreted as 1 additional
yellow card awarded against the away team every 6.67 matches. A linear mixed effects model revealed that this difference was not significant, F(1, 326.59) = 1.40, p = 0.238. The model explained <1% of the variance when considering the fixed effect of team alone (R2M = 0.004) and 2.4% of the variance when considering both the fixed effect of team and the random effect of referee (R2C = 0.024).
difference in the data between home and away teams and, therefore, the errors are attributed to human error and not social bias. This conclusion is strengthened by the ecological validity of the sample, in that if half of the ‘disputed’ decisions are considered correct and the other half incorrect, the accuracy rate of 94.9% reflects the 95% of officials’ decision-making accuracy using the same criteria (e.g., fouls, yellow cards, penalty kicks) reported by the Premier League (Premier League, 2014).
Correct yellow cards against per match
Disputed yellow cards against per match
Home team Away team
Incorrect yellow cards against per match
Figure 2: Correct, disputed, and incorrect yellow card decisions per match average for home and away teams (2022/2023 Premier League season).
Atotalof6yellowcardswerecoded asincorrect,atanaverage of 0.03 (SD = 0.21) incorrect yellow cards per match. We did not conduct further analyses regarding incorrect yellow cards, as both the home and away teams received three incorrect yellow cards each at an average of 0.02 (SD = 0.13) per match.
Atotalof23yellowcardswere codedasdisputed,atanaverage of0.13(SD=0.37)permatch. Onaverage,thehometeamreceived 0.04 (SD = 0.23) disputed yellow cards per match, while the away teamreceivedanaverageof0.09(SD=0.31)disputedyellowcards, resulting in a disputed yellow card differential score of -0.05 (SD = 0.39). This can be interpreted as 1 additional disputed yellow card awarded against the away team every 20 matches. A linear mixed effects model revealed that this difference was not significant, F(1, 322.7) = 3.39, p = 0.067. The model explained <1% of the variance when considering the fixed effect of team alone (R2 M = 0.009) and 7.3%ofthevariancewhenconsideringboththefixedeffectofteam and the random effect of referee (R2 C = 0.073). This suggests that the individual referee is a better predictor of thenumberof disputed yellow cards in our dataset, however this should be interpreted with caution given the unequal number of games officiating by the individual referees as referees with fewer matches may have unreliable variance estimates.
4. Discussion
The study makes a unique and important contribution to solving the ‘unsolved puzzle’ (Pollard, 2008) of what is responsible for home advantage in elite football. Specifically, this is achieved by concluding that although away teams accumulate more fouls, yellow cards, and concede more penalty kicks, these decisions are correct. Furthermore, while approximately 3% of decisions in these categories are erroneous, there is no statistically significant
As findings were derived from real data with ‘correctness’ analysed, this study has addressed methodological limitations (e.g., predictive modelling) extant in previous studies (see Dohmen & Sauermann, 2016). In doing so, it has provided support for studies that suggest variance in officiating decisions between home and away teams is attributable to behavioural differences (e.g., proactive approach to games, increased dissatisfaction with not winning etc) between home and away teams, not match officials (see Carron et al., 2005; Collet, 2013; Lago-Peñas et al., 2017; Staufenbiel et al., 2015). The descriptive statistics (Table 3) further support the findings for these studies as, although the data sample was not large enough for statistical analysis, home teams received more correct penalties than away teams (12 to 4 respectively). In short, away teams foul more than home teams, an expected outcome when a more proactive and possession-based approach is typically taken by the home team and a more defensive strategy adopted by the away team (Fernandez-Navarro et al., 2018; Gollan et al., 2020; Lago-Peñas & Lago-Ballestaros, 2011). Ergo, the study supports the territoriality model (Neave & Wolfson, 2003) over the classical model (Allen & Jones, 2014), with a possible explanation for its results being elite officials’ ability to insulate themselves from the physiological and psychological mediators to performance found in the Home Advantage Mediation model (Bilalić et al., 2024).
Although referees did occasionally favour the home side in ambiguous situations, this occurred rarely and was not significant, in contrast with the findings ofCohen et al (2024). Thedifference equates to one disputed foul against the away team every 6.67 matches, and one disputed yellow card against the away team every 12.5 matches, and therefore we found no support for the classical model. It is vital, however, to acknowledge that while data provides evidence to suggest that referees do not support the home team by erroneously awarding fouls & yellow cards against the awayteam, andthat thestudy makes an important contribution to the literature by exploring differences in ‘disputed’ decisions, we did not assess whether there was bias in un-whistled fouls. That is, the dataset did not include decision events where the referee did not blow the whistle, and therefore it remains possible that referee bias may contribute to home advantage, but only in un-whistled fouls (e.g., potential ‘missed foul’ errors). This possiblywarrantsfurtherexplorationgiven previousevidencethat more referee errors are made regarding action not taken, rather than sanctions given (Hossner et al., 2019).
Further, the findings cannot suggest that previous attribution of home advantage to officiating decisions was erroneous. For example, several studies that have investigated home bias in referees were conducted prior to technological developments, such as microphones, as well as being close to, or prior to, the professionalisation of officials in football (e.g., Boyko et al., 2007; Courneya & Carron, 1992; Nevill et al., 2002). Thus, these findings support conclusions that enhanced training and development of elite officials has decreased their contribution to
homeadvantage(e.g.,Nevilletal.,2013),notthatitneverexisted. Therefore, the pattern of results in the present study may be explained by enhanced training and development of elite officials as suggested by Nevill et al. (2013).
This study addressed methodological in extant studies investigating home advantage in sports, such as the use of predictive statistics, thus making a valuable and unique contribution to research on home advantage in elite football, with the use of clips provided with context promoting accuracy in assessment (Samuel et al., 2019). For example, participants noted that, in isolation, a transgression may not be worthy of a yellow card, but due to persistent offending was justified on that occasion. This afforded participants the opportunity to acknowledge ‘adequate’ decisions based on game management, rather than the robust application of law (see Mascarenhas et al., 2022; Raab et al., 2020), promoting the ecological validity of results. However, it should be noted that the results analyse the aggregate of all decisions made which assumes that all decisions are equal. For example, an incorrect penalty decision is likely to have more impact on the result than an incorrect free kick or yellow card. Further,whileparticipantsassessed decisionswithcontext,results were analysed without it. In other words, it is unknown whether officials made errors against the home team once the game was already won, a finding reported within basketball officiating to appease visiting teams without influencing the outcome (MacMahon & Mildenhall, 2012). the sequence of decisions was not considered. As approximately 70%-75% of games in the Premier League result in less than 3 goals being scored, scoring first increases the likelihood of winning to 78% (Anderson & Sally, 2014; Lago-Peñas et al., 2016), this may be a worthwhile avenue of future research.
In addition to investigation of any temporal bias (e.g., favouring one team or another based on time played) towards the home team, future research regarding the impact of referees on home advantage should incorporate the use of VAR as a potential antecedent to bias. This study only assessed the on-field referee’s decision, whereas the increased potential for decision-making reinvestment and social pressure (Picazo-Tadeo et al., 2017) justifies this avenue of research. Regarding assessment, while one Level 1 official (UK) and two National level (USA/Canada) participated as assessors, this study predominantly used non-elite officials to assess decisions which may differ from the views of professional referees, with previous literature suggesting increased training and experience enhances officiating practice and decision-making assessment performance (see Carrington et al., 2022; Pizzera et al., 2022). Therefore, it is possible that the evaluators used in this study perceived an on-field error when there was none (or vice-versa). However, as officiating performance is not always evaluated via formulism (e.g., the robust application of law) but conventionalism (e.g., making decisions on what the game expects; see Harper, 2022; Mascarenhas et al., 2002; Plessner & Betsch, 2001; Simon, 2014) arangeofofficialsmayhaveprovidedamoreaccurateassessment of performance than would have been provided with elite officials alone. In fact, using non-experts to assess fouls is an approach encouraged in extant literature to establish criteria for comparative judgments (Christodoulou, 2024). Therefore, this study can be considered as proof of concept regarding its methodology to assess decision-making accuracy and referee bias, with replication using an expert sample, or to compare decision-
making evaluation across varied levels of officials, recommended as well as assessing reliability of the panel’s judgments prior to testing to establish consistency.
A final consideration that may guide future studies is that previous research has suggested expectancy bias may influence officiating decisions in sports that require subjective and reactive decision-making. For example, figure skaters who competed later in the competition, where more accomplished athletes are placed, were scored higher than when they were judged earlier in the running order, when less accomplished skaters compete (Findlay & Ste-Marie, 2004). Additionally, biases in subjective officiating judgements have been influenced by memories of prior performance (Ste-Marie et al , 2001). While these studies involved closed activities (e.g., those performed in stable and consistent environments), extant research supports these conclusions in open activities (e.g., unpredictable and dynamic environments). For example, Jones et al. (2002) concluded that referees are more likely to penalise teams with yellow cards when informedoftheiraggressivereputation.Consideringthisevidence that subjective judgement may be influenced by previous actions and anticipation of future performance, it is possible that football officials are not influenced by game location, but by the team playing. For example, Constantinou et al. (2014) reported a bias in penalty kick decisions in favour of certain teams (e.g., Manchester United and Manchester City) but not others, regardless of game location. This conclusion is supported by Erikstad et al. (2020) who assessed correctness of penalty kick decision and reported a bias towards more successful teams. Therefore, future research may wish to explore whether certain teams, based on status (e.g., Manchester United), cultural identity (e.g., Athletic Bilbao), and geographical position (e.g., Cagliari in Sardinia), report differences in the metrics used in this study.
Conclusion
By assessing correctness of decisions, this study addressed a methodological limitation of extant research regarding referee bias in football, and results harvested from a large and representative sample found minimal evidence of home bias in the English Premier League. Consequently, the study provides support for the territorialitymodelto explain homeadvantage insports, suggesting that crowd influence and game location is more likely to impact player and coach behaviour than elite officials. A possible explanation as to why officials were not influenced by game location is their resistance to the physiological and psychological influences found in the Home Advantage Mediation (HAM; Bilalić et al., 2024) model, therefore it is recommended that research focus on minimising errors in decision-making, such as the promotion of adaptive emotions to mediate stimulus response (see Kostrna & Tennenbaum, 2022) and promotion of support strategies to buttress referees’ well-being. Finally, given the importance of contextual information on decision-making accuracy, the use of frameworks that enhance accuracy of event perception (e.g., predictive processing, see O’Brien et al., 2023), may be fruitful for stakeholders in referee development.
Conflict of Interest
The authors declare no conflict of interests.
Acknowledgment
The authors would like to thank Dr Martin Turner (Manchester Metropolitan University) for providing feedback on the initially submitted manuscript.
References
Adie, J. M., Renshaw, I., Rolman, R., & Mann, D. L. (2022a). Home advantage and LBW decisions: The contribution of umpiring to the home-ground (dis)advantage in cricket. Journal of Science & Medicine in Sport, 25(6), 520–523.
Adie, J. M., Renshaw, I., Polman, R., & Mann, D. L. (2022b). No expectation bias in elite-level cricket umpires’ leg-beforewicket (LBW) decisions according to batting order position. Psychology of Sport & Exercise, 60, 1–4.
Allen, M. S., & Jones, M. V. (2014). The “home advantage” in athletic competitions. Current Directions in Psychological Science, 23(1), 48–53.
Anderson, C., & Sally, D. (2014). The numbers game. Penguin. Aquino, R., Martins, G. H. M., Vieira, L. H. P., & Menezes, R.P. (2017). Influence of match location, quality of opponents, and match status on movement patterns in Brazilian professional football players. The Journal of Strength & Conditioning Research, 31(8), 2155–2161.
Asch, S. E. (1955). Opinions and social pressure. Scientific American, 193(5), 31–35.
Bartoń, K. (2024). MuMIn: Multi-Model Inference R package version 1.48.4
Bates, D., Mächler, M, Bolker, B., & Walker, S. (2015). “Fitting Linear Mixed-Effects Models Using lme4.” Journal of Statistical Software, 67(1), 1–48. https://doi.org/ 10.18637/jss.v067.i01
Bilalić, M., Gula, B., & Vaci, N. (2024). Revising home advantage insport–homeadvantage mediation (HAM) model. International Review of Sport & Exercise Psychology, 18(2), 1096–1122. https://doi.org/10.1080/1750984X.2024.2358491
Bordner, S.S. (2019). Why you don’t have to choose between accuracy and human officiating (but you might want to anyway). Philosophies, 4(2), 33.
Boyko, R., Boyko, A., & Boyko, M. (2007). Referee bias contributes tohome advantage in English Premiership football. Journal of Sports Sciences, 25(11), 1185–1194.
Bray, S. R., Jones, M. V., & Owen, S. (2002). The influence of competition locationonathletes’ psychological states. Journal of Sport Behaviour, 25, 231–242.
Carré, J., Muir, C., Belanger, J., & Putnam, S. K. (2006). Precompetition hormonal and psychological levels of elite hockey players: Relationship to the “home advantage”. Physiology & Behaviour, 89(3), 392–398.
Carrington, S. C., North, J. S., & Brady, A. (2022). Utilising experiential knowledge of elite match officials: Recommendations to improve practice design for football referees. International Journal of Sport Psychology, 53(3), 242–266.
Carron, A. V., Loughhead, T.M., & Bray, S. R. (2005). Thehome advantage in sport competitions: Courneya and Carron’s (1992) conceptualframework a decade later. Journal of Sports Sciences, 23(4), 395–407.
Christodoulou, D. (2024). I can’t stop thinking about VAR. Swift. Cohen, A., Neeman, Z., & Auferoth, F. (2024). Judging under public pressure. Review of Economics & Statistics, 106(1), 151–166.
Collet, C. (2013). The possession game? A comparative analysis of ball retention and team success in European and international football, 2007-2010. Journal of Sports Sciences, 31(2), 123–678.
Constantinou, A. C., Fenton, N. E., & Pollock, L. J. H. (2014). Bayesian networks for unbiased assessment of referee bias in association football. Psychology of Sport & Exercise, 15(5), 538–547.
Corrigan, S. L., Dwyer, D. B., Harvey, B., & Gastin, P. B. (2019). The influence of match characteristics and experience on decision-making performance in AFL umpires. Journal of Science & Medicine in Sport, 22(1), 112–116.
Courneya, K. S., & Carron, A. V. (1992). The home advantage in sport competitions: A literature review. Journal of Sport & Exercise Psychology, 14(1), 13–27.
Dohmen, T. J. (2008). The influence of social forces: Evidence from the behaviour of football referees. Economic Inquiry, 46(3), 411–424.
Dohmen, T., & Sauermann, J. (2016). Referee bias. Journal of Economic Surveys, 30(4), 679–695.
Erikstad, M. K., & Johansen, B. T. (2020). Referee bias in professional football: Favoritism toward successful teams in potential penalty situations. Frontiers in Sports & Active Living, 27(2), 19.
The Football Association. (2024). Law 5: The Referee. https://www.thefa.com/football-rulesgovernance/lawsandrules/laws/football-11-11/law-5 thereferee.
The Football Association. (2025). Overview of English refereeing. https://www.thefa.com/-/media/thefacom-new/files/rulesand-regulations/asian-inclusion/overview-of-englishrefereeing.ashx
Fernandez-Navarro, J., Fradua, L., Zubillaga, A., & McRobert, A. (2018). Influence of contextual variables on styles of play in soccer. International Journal of Performance Analysis in Sport, 18(3), 423–436.
Findlay, L. C., & Ste-Marie, D. M. (2004). A reputation bias in figure skating judging. Journal of Sport & Exercise Psychology, 26(1), 154–166.
Gasparetto, T., Loktionov, K., & Hochman, G. (2023). Does the video assistant referee (VAR) mitigate referee bias on professional football? PLoS One, 18(11), https://doi.org/10.1371/journal.pone.0294507
Giacobbi, P. R., Poczwardowski, A., & Hager, P. (2005). A pragmatic research philosophy for applied sport psychology. The Sport Psychologist, 19(1), 18–31.
Gollan, S., Bellenguer, C., & Norton, K. (2020). Contextual factors impact styles of play in the English Premier League. Journal of Sports Science & Medicine, 19(1), 78–83.
Gómez-Ruan, M. A., & Pollard, R. (2021). Home advantage phenomenon in sport: History and development. In M. A. Gómez-Ruan, R. Pollard., & C. Lagos-Peñas (Eds.), Home advantage in sport: Causes and the effect on performance (pp. 204–210). Routledge.
Goumas,C.(2014). Homeadvantageandreferee biasinEuropean football. European Journal of Sport Science, 14(1), 243–249.
Harper, A. (2022). Sport realism: A law-inspired theory of sport. Lexington Books.
Hossner, E-J., Schnyder, U., Schmid, J., & Kredel, R. (2019). The role of viewing distance and viewing angle on referees’ decision-making performance during the FIFA World Cup 2014. Journal of Sports Sciences, 37(13), 1481–1489.
Jamieson, J. P. (2010). The home field advantage in athletics: A meta-analysis. Journal of Applied Social Psychology, 40(7), 1819–1848.
Jones, M., Paull, G. C., Erskine, J. (2002). The impact of a team’s aggressive reputation on the decisions of Association Football referees. Journal of Sports Sciences, 20(12), 991–1000.
Kostrna, J., & Tenenbaum, G. (2022). Developing and testing the Expanded Sport Official’s Decision-Making Model. International Journal of Sport & Exercise Psychology, 20(2), 586–611.
Lago-Peñas, C., Gomez, M.-Á., & Pollard, R. (2017). Home advantage in elite soccer matches. A transient effect? International Journal of Performance Analysis in Sport, 17(12), 86–95.
Lago-Peñas, C., & Lago-Ballesteros, J. (2011). Game location and team quality effects on performance profiles in professional soccer. Journal of Sports Science & Medicine, 10(3), 465–471.
Lago-Peñas, C., Gómez-Ruano, M. A., Megías-Navarro, D., & Pollard, R. (2016). Home advantage in football: Examining the effect of scoring first on match outcome in the five major European leagues. International Journal of Performance Analysis in Sport, 16(2), 411–421.
MacMahon, C., & Mildenhall, B. (2012). A practical perspective on decision making influences in sports officiating. International Journal of Sports Science & Coaching, 7(1), 153–165.
Mascarenhas, D. R. D., Collins, D., & Mortimer, P. (2002). The art ofreason versus the exactness of science inelite refereeing: Comments on Plessner and Betsch (2001). Journal of Sport & Exercise Psychology, 24(3), 328–333. https://doi.org/10.1123/jsep.24.3.328
Neave, N., & Wolfson, S. (2003). Testosterone, territoriality, and the ‘home advantage’. Physiology & Behaviour, 78(2), 269–275.
Nevill, A. M., Balmer, N., & Williams, A. M. (2002). The influence of crowd noise and experience upon refereeing decisions in football. Psychology of Sport & Exercise, 3(4), 261–272.
Nevill, A. M., Hemingway, A., Greaves, R., Dallaway, A., & Devonport, T. J. (2017). Inconsistency of decision-making, the Achilles heel of referees. Journal of Sports Sciences, 35(22), 2257–2261.
Nevill, A., Pearson, A., & Webb, T. (2022). No crowds, no home advantage in football during the COVID-19 season: Are crowds able to manipulate all but the best referees’ behaviour? Journal of Global Sport Management, 9(3), 527–544. https://doi.org/10.1080/24704067.2022.2136102
Nevill, A., Webb, T., & Watts, A. (2013). Improved training of football referees and the decline in home advantage postWW2. Psychology of Sport & Exercise, 14(2), 220–227.
O’Brien, K. A., Kennedy, A., & O’Keeffe, M. (2023). The element of surprise: How Predictive Processing can help coach practitioners understand and develop skill movement in
sport settings. International Sport Coaching Journal, 11(2), 298–307.
Pappalardo, L., Cintia, P, Ferragina, P., Massucco, E., Pedreschi, D., & Giannotti, F. (2019). PlayeRank: Data-driven performance evaluation and player ranking in soccer via a machine learning approach. ACM Transactions on Intelligent Systems & Technology (TIST), 10(5), 1–27.
Pettersson-Lidbom, P., & Priks, M. (2010). Behaviour under social pressure: Empty Italian stadiums and referee bias. Economics Letters, 108(2), 212–214.
Picazo-Tadeo, A.J., González-Gómez, F., &Guardiola, J. (2017). Does the crowd matter in refereeing decisions? Evidence from Spanish soccer. Journal of Sport & Exercise Psychology, 15(5), 447–459.
Pizzera, A, Marrable, J., & Raab, M. (2022). The video review system in association football: Implementation and effectiveness for match officials and referee education. Managing Sport & Leisure. https://doi.org/10.1080/23750472.2022.2147856
Plessner, H. (1999). Expectation biases in gymnastics judging. Journal of Sport & Exercise Psychology, 21(2), 131–144.
Plessner, H., & Betsch, T. (2001). Sequential effects in important referee decisions: The case of penalties in soccer. Journal of Sport & Exercise Psychology, 23(3), 254–259. https://doi.org/10.1123/jsep.23.3.254
Pollard, R. (2008). Home advantage in football: A current review ofanunsolved puzzle. The Open Sports Sciences Journal, 1(1), 12–14.
Pollard, R., & Gómez, M. A. (2009). Home advantage in football in South-West Europe: Long-term trends, regional variation, and team differences. European Journal of Sport Science, 9(6), 341–352.
Praschinger, A., Pomikal, C., & Stieger, S. (2011). May I curse a referee? Swear words and consequences. Journal of Sports Science & Medicine, 10(2), 341–345.
The Premier League. (June, 2014). Premier League Season Review 2013/2014.
Prieto, J. (2022). Science mapping: A bibliometric analysis of the home advantage phenomenon in sport. In M. A. GómezRuano, R. Pollard., & C. Lago-Peñas (Eds.). Home advantage in Sport: Causes and the effect on performance (pp. 24–30). Routledge.
Raab, M., Avugos, S., Bar-Eli, M., & MacMahon, C. (2020). The referee’s challenge: A threshold process model for decision making in sport games. International Review of Sport & Exercise Psychology, 14(1), https://doi.org/10.1080/1750984X.2020.1783696
Reilly, B., & Witt, R. (2013). Red cards, referee home bias and social pressure: Evidence from English Premiership Soccer. Applied Economics Letters, 20(7), 710–714.
Rickman, N. & Witt, R. (2008). Favouritism and financial incentives: A natural experiment. Economica, 75(298), 296–309.
Riedl, D., Strauss, B., Heuer, A., & Rubner, O. (2015). Finale furioso: Referee-biased injury times and their effects on home advantage in football. Journal of Sports Sciences, 33(4), 327–336.
Russell, S., Renshaw, I., & Davids, K. (2019). How interacting constraints shape emergent decision-making of national-level
et al. / The Journal of Sport and Exercise Science, Journal Vol. 9, Issue 2, 40-50 (2025)
football referees. Qualitative Research in Sport, Exercise and Health, 11(4), 573–588.
Scoppa, V. (2008). Are subjective evaluations biased by social factors or connections? An econometric analysis of soccer referee decisions. Empirical Economics, 35(1), 123–140.
Simon, R. L. (2014). Fair play: The ethics of sports. Westview Press.
Sors, F., Grassi, M., Agostini, T., & Murgia, M. (2021). The sound of silence in association football: Home advantage and referee bias decrease in matches played without spectators. European Journal of Sport Science, 21(12), 1597–1605.
Spitz, J., Wagemans, J., Memmert, D., Williams, A. M., & Helsen, W. F. (2021). Video assistant referees (VAR): The impact of technology on decision making in association football referees.
Journal of Sport Sciences, 39(2), 147–153.
Staufenbiel, K., Lobinger, B., & Strauss, B. (2015). Home advantage in soccer – A matter of expectations, goal setting and tactical decisions of coaches? Journal of Sports Sciences, 33(18), 1932–1941.
Ste-Marie, D. M., Valiquette, S. M., Taylor, G. (2001). Memoryinfluenced biases in gymnastic judging occur across different prior processing conditions. Research Quarterly for Exercise & Sport, 72(4), 420–426.
Strauss, B., Hagemann, N., & Loffing, F. (2009, June). Do referees influence the home advantage in football? International Society of Sport Psychology (ISSP) Conference. Marrakesh, Morocco.
Sutter, M. & Kocher, M. G. (2004). Favouritism of agents – the case of referees’ home bias. Journal of Economic Psychology, 25(4), 461–469.
Teixeira, J. E., Leal, M., Ferraz, R., Ribeiro, J., Cachada, J. M., Barbosa, T. M., Monteiro, A. M., & Forte, P. (2021). Effects of match location, quality of opposition and match outcome on match running performance in a Portuguese professional football team. Entropy, 23(8), 973.
Terry, P. C., Walrond, N., & Carron, A. V. (1998). The influence of game location on athletes’ psychological states. Journal of Science & Medicine in Sport, 1(1), 29–37.
Unkelbach, C., & Memmert, D. (2008). Game management, context effects, and calibration: The case of yellow cards in soccer. Journal of Sport & Exercise Psychology, 30(1), 95–109.
Van Biemen, T., Oudejans, R. R. D., & Mann, D. L. (2022). Into the eyes of the referee: A comparison of elite and sub-elite football referees’ on-field visual search behaviour when making foul judgements. International Journal of Sports Science & Coaching, 18(1), https://doi.org/10.1177/17479541411069469
Viera, A. J., & Garrett, J. M. (2005). Understanding interobserver agreement: The kappa statistic. Family Medicine, 37(5), 360–363.
Webb, T. (2017). Elite soccer referees: Officiating in the Premier League, La Liga and Serie A Routledge.
Webb, T. (2022). The evolution of referees in the English Premier League. Soccer & Society, 23(4-5), 400–410.
Webb, T., Dicks, M., Thelwell, R., & Nevill, A. (2018). The impact of referee training: Reflections on the reduction of home advantage in association football. Soccer & Society, 19, 1027–1037.
Webb, T., Rayner, M., Cleland, J., & O’Gorman, J. (2021). Referees, match officials and abuse. Routledge.
The Journal of Sport and Exercise Science, Vol. 9, Issue 2, 51-59 (2025) www.jses.net
Exploring Motivation in the Indigenous Sport of Kī-o-Rahi: The Importance of Te Ao Māori
Patrick Boudreau1,2,3* , Tyson Huia1,4 , Heperi Harris5 , Helen Marshall1 , Peter Olsen1
1Department of Applied Sciences and Social Practice, Ara Institute of Canterbury, Aotearoa New Zealand
2Department of Health, Kinesiology, and Applied Physiology, Concordia University, Canada
3Montreal Behavioural Medicine Centre, Centre Integré Universitaire de Santé et Services Sociaux du Nord-de-l’Île-de-Montréal, Canada
4Faculty of Health, University of Canterbury, Aotearoa New Zealand
5Sport Canterbury, Aotearoa New Zealand A R T I C L E I N F O A B S T R A C T
Received: 01.09.2025
Accepted: 08.12.2025
Online: 17.12.2025
Keywords:
Indigenous self-determination Hauora Wellbeing
1. Introduction
Sport participation has the potential to improve physical and psychological wellbeing for individuals and communities. Yet these benefits are not always realised equitably, particularly when activities do not reflect Indigenous values or cultural needs. This study sought to understand what motivates people to begin and continue participating in Kī-oRahi, a traditional Māori sport deeply embedded in Māori cultural values. This rangahau (research) was grounded in Māori research principles and collaborative inquiry. For instance, the study’s central question was co-developed by Kī-o-Rahi organisers from across Te Waipounamu, Aotearoa (South Island, New Zealand). Thirteen players (7 women, 6 men; 7 Māori, 6 New Zealand European/Pākehā) took part in three focus groups. Based on a reflexive thematic analysis, four interconnected motivational themes were developed. First, whakawhanaungatanga (relationship-building) was central. Second, participants described the importance of pride in te ao Māori (Māori worldview). Third, participants emphasised how wairua (spirituality) infused the sport with deeper meaning. Finally, participants appreciated how Kī-o-Rahi afforded a balance between competition and fun. Findings indicate that participants are motivated to play Kī-o-Rahi because it is a culturally grounded practice that fosters social cohesion and cultural affirmation. Future efforts to promote Kī-o-Rahi could therefore focus not only on its ability to enhance physical health but also its potential for facilitating social connections, cultural revitalisation, and a sense of community.
Sport participation is widely acknowledged for its benefits to physical and mental wellbeing (Bengtsson et al., 2025; Panza et al., 2020). However, most of the existing research has adopted a Western paradigm that often overlooks the relational, spiritual, and collective aspects central to Indigenous conceptions of wellbeing (e.g., Boudreau et al., 2025). Moreover, research exploring Indigenous sports (e.g., Kī-o-Rahi, waka ama) remains scarce (Campbell et al., 2024; Severinsen & Reweti, 2021). There has been international research on Indigenous games (e.g., Fabian & Giles, 2023; Thomsen et al., 2018), and research on Māori
athletes participating in colonial sports (e.g., rugby; Arellano & Downey, 2019; Hinemoa et al., 2023). However, there is limited empiricalresearch thatexploreshowtraditionalMāorigamesmay contribute to wellbeing.
Originating in Aotearoa New Zealand and shaped by Māori culturalprinciples,Kī-o-Rahiisattractinggrowinginterest(Smith & Smith, 2023). Kī-o-rahi is a ball sport played on a circular field that combines features of tag, handball, and rugby. It embodies principles of whakawhanaungatanga, wairua, and multigenerational engagement, acting as a living expression of Māori identity and cultural continuity. Considering that Indigenous wellbeing is deeply interconnected with culture,
*Corresponding Author: Patrick Boudreau, Department of Health, Kinesiology, and Applied Physiology, Concordia University, Canada, Patrick.Boudreau@Concordia.ca
community, and spirituality (McHugh et al., 2019), Indigenous scholars (e.g.,Biles et al., 2024; Muriwai et al.,2023)haveargued that research on sport and wellbeing should not be separated from cultural identity, ancestral connection, and social cohesion. The cultural relevance of Kī-o-Rahi underscores a gap in understanding how cultural, spiritual, and relational dimensions are lived within Aotearoa New Zealand’s distinctive sporting and cultural landscape.
Furthermore, the lack of research on Indigenous sports and health-related outcomes that is inclusive of Māori epistemologies (Ka'ai-Mahuta, 2011) highlights the need for methodologies that privilege Indigenous voices, knowledge systems, cultural protocols, and wellbeing frameworks. In the context of Aotearoa New Zealand, Māori wellbeing models such as Te Whare Tapa Whā (Durie, 1998; Rochford, 2004) can provide a research framework that is culturally relevant. Te Whare Tapa Whā articulates a holistic model of wellbeing that integrates: wairua (spiritual), hinengaro (mental), tinana (physical), whenua (roots), and whānau (family) dimensions. In addition, Sport New Zealand ihi Aotearoa (2023), provides a sport-specific model, Te Whetū Rehua (The Guiding Star), which emphasises how a sport initiative can be more culturally responsive to Māori individuals. Te Whetū Rehua emphasises, for example, the importance of ensuring that sport activities take place in culturally significant physical spaces and that sport programs are delivered by Māori leadership in te reo Māori (the Indigenous language of Aotearoa). By employing a kaupapa Māori (Māori values-based) research framework, Māori participants can express, in their own voices, the potential meaning and significance of Kī-o-Rahi. This approach further challenges dominant Western models that often compartmentalise health and sport, proposing instead a holistic and culturally grounded space for supporting Indigenous Tino rangatiratanga (self-determination). Research on Kī-o-Rahi may highlight how this sport embeds Māori narratives and cultural protocols within the sport and, in the process, can serve as a powerful site for addressing health inequities, cultural resurgence, and intergenerational healing.
Overall, despite growing recognition of the cultural, spiritual, and wellbeing benefits of Indigenous sport, there remains limited understanding ofthe specific factors that motivate Māori andnonMāori participants to engage with Kī-o-Rahi. The current study addresses thematic and methodological research gaps by exploring motivations for participating in Kī-o-Rahi through principles of kaupapa Māori.
2. Methods
2.1.
Procedures
This rangahau (research) was grounded in principles of kaupapa Māori, whakawhanaungatanga (relationship-building), and collaborative inquiry, recognising the importance of relationships and community voice in shaping meaningful research. The research process began with a hui (meeting) involving Kī-o-Rahi organisers from across Te Waipounamu (South Island), where the kaupapa of the study was discussed collectively. From this shared kōrero (discussion), the overarching research question was codeveloped: What motivates participants to start and continue to play Kī-o-Rahi?
Informed consent was obtained prior to data collection, where the study’s purpose, risks, and potential benefits were explained. To compensate participants for their time, the chance to be included in a draw for two gift cards was offered. Participants were invited to ask questions and reflect before signing written consent forms and filling out demographic information. Ethical approval was granted byAra Institute’s Ethics Board (#APS1899). The process prioritised participant autonomy and upheld tikanga Māori (appropriate Māori protocols) throughout the research engagement. For instance, a mihimihi (the sharing of culturally significant aspects of oneself) took place at the start of each focus group. To guide kōrero during the focus groups, a series of openended promptswerecreated,grounded inthethemesraisedduring the initial hui. These prompts encouraged reflective and relational discussion, for example: (1) What about Kī-o-Rahi inspires you to play? (2) What initially motivated you to start playing Kī-oRahi, and (3) how has your motivation changed over time?
Focus groups took place during rest periods between games. Overall, three focus groups, lasting between 47 and 73 minutes, were held with 4–5 participants. The group format fostered collective meaning-making and shared storytelling, in alignment with kaupapa Māori research practices that value dialogue, relational knowledge, and co-construction of insights.
2.2. Participants
Participants were recruited during a regional community Kī-oRahi tournament held in Ōtautahi Christchurch, Aotearoa New Zealand. This setting was intentionally chosen to honour the kaupapa of the sport and to meet participants in a context that was both meaningful and familiar. A total of 13 players (7 women, 6 men) took part in the study. Seven identified as Māori and six as New Zealand European/Pākehā, with ages ranging from 18 to 54 years (M = 33.6, SD = 14.1).
2.3. Analysis
The audio-recorded kōrero were transcribed verbatim and analysed using Braun and Clarke’s (2019) reflexive thematic analysis. This approach was chosen for its flexibility and alignment with kaupapa Māori-informed qualitative inquiry, allowing for rich, contextual interpretation of meaning across participant experiences. We adopted an inductive approach, allowing patterns and themes to be generated from the data rather than applying a predetermined coding framework. The analysis was recursive and iterative, involving repeated engagement with the transcripts to ensure depth and reflexivity. Familiarisation began with close, active reading of each transcript, noting early impressions and potential points of interest. From there, initial codes were generated to capture compelling features of the data, with attention to both semantic content and underlying meaning. Codes were gathered to form subthemes and overarching major themes.
Rather than striving for code consistency or reliability across researchers, coding was understood as an interpretive act, shaped by the positionality of the researchers. We engaged in ongoing reflexivity throughout the process, recognising how our cultural standpoint, values, and relationships with the participants informed the development of meaning. Themes were developed
through an iterative process of grouping, refining, and deepening interpretive engagement with the coded data. Emphasis was placed on themes that not only recurred but also spoke powerfully to the research question and broader cultural context. NVivo (Version 15) was used to assist with the organisation, searching, and visualisation of codes and themes across the dataset.
3. Results
Based on the reflexive thematic analysis, four interconnected major themes were created that explore the participants’ motivation for playing Kī-o-Rahi: Whakawhanaungatanga, Pride in Te Ao Māori, Wairua, and Balance Between Competition and Fun
3.1. Whakawhanaungatanga
A central theme created from participant accounts was whakawhanaungatanga, which incorporates the process of building and nurturing relationships. Participants described how Kī-o-Rahi acted as a catalyst for connection that spread beyond one’s own demographic (e.g., age, background, and ability). Through shared play, participants formed meaningful and often immediate relationships that resembled the bonds of whānau, in ways that contrasted sharply with more hierarchical or competitive sport environments. Three interwoven subthemes collectively highlight the social and relational essence of the sport: whānau-like bonds form quickly, multigenerational participation, and a non-judgmental, welcoming culture.
3.1.1. Whānau-like bonds form quickly
Across narratives, participants emphasised the speed and depth with which they formed bonds through playing Kī-o-Rahi. Participants entering the tournament without knowing many people expressed surprise at the rapid development of whānaulike relationships. As one participant shared, “You come in and you don’t know each other but by the end you kind of feel like you’re family.” This comment highlighted the collective spirit fostered through the game and affirms the relational values underpinning te ao Māori, where kinship is both literal and metaphorical.
For individuals newly arrived in a city or disconnected from their existing Māori networks, Kī-o-Rahi served as a bridge to community. One participant reflected, “I came to Christchurch and I don’t know anybody yet. So that’s a cool way to meet some of the Māori community.” This highlights the sport’s role notonly in physical engagement but in cultural connection, which allows for identity-affirming spaces through casual and playful means. Participants also spoke about the ways in which teams formed on the day, often without preexisting affiliations, yet still took on the character of whānau. “We created two teams from random … someone’s auntie, someone’s cousin.” Even in randomised groupings, the relational logic of whakawhanaungatanga prevailed, and newcomers were absorbed into a familial environment.
3.1.2. Multigenerational participation
Participants repeatedly highlighted the unique intergenerational quality of Kī-o-Rahi as a defining aspect of its appeal. According to participants, the Kī-o-Rahi tournament offered a rare opportunityformultiplegenerationstoplayalongsideoneanother, reinforcing whānau cohesion and the passing of cultural knowledge through a playful atmosphere. One participant observed, “It’s cool to see our tamariki [children] playing alongside their grandparents. That’s rare in sport.” This was echoed in another reflection: “We’ve got a 60-year-old playing today, and she’s still out there having fun with the kids.” These insights illustrate how Kī-o-Rahi disrupted conventional age norms found in mainstream sport, where participants are typically separated by developmental stage.
Moreover, participants described the event as a gathering point for wider whānau, where shared activity transcended generational divides. “It’s the fact that we’re doing it as a whānau… even the little ones are getting a go.” In this way, the game became a living enactment of an important aspect of kaupapa Māori, where intergenerational learning and participation are central. Another participant noted, “We’ve come together as a family team, cousins, aunties… it’s all about that connection.” The phrase “all about that connection” captures a deeper intent beyond the surface-level physical aspects of the game: a deliberate effort toward relational wellbeing. Furthermore, the sport’s format enabled informal mentorship and modelling between age groups. “We got young kids playing with adults. That’s the beauty of it.” One participant distilled the essence clearly: “You can play with your kids, your cousins –everyone.” This spirit of inclusivity and intergenerational exchange not only supported community-building but reinforced the holistic values of Māori sport.
3.1.3. Non-judgmental, welcoming culture
Another significant dimension of whakawhanaungatanga was the welcoming, non-judgmental culture describedby participants. Kīo-Rahi was framed as a spacewhere people of all levels of fitness, background, and ability could feel safe and included. “You could play this and walk it if you couldn’t run… You don’t have to be super fit to play this.” This low barrier to entry not only promoted access, but also reframed success as participation and presence, rather than skill or speed. The game was also praised for its cultural inclusiveness. “We’ve had so many different cultures in our [team]… it’s still all of us getting together… having fun.” Here, Kī-o-Rahi became a space for intercultural connection, without requiring assimilation into a dominant norm. Moreover, some participants spoke candidly about initial hesitations rooted in fear of exclusion or not belonging. One Pākehā participant noted, “I was a little worried about like being too white… but it's not like that at all. Super welcoming… it’s a real friendly environment.” Another shared, “It’s notlike netballorrugby.You don’t get looked down on for not knowing.”
The casual and relational nature of the sport also mitigated financial or logistical barriers, further enhancing its accessibility. For instance, one participant mentioned: “We wouldn’t have come if we had to pay like some other sports.” Others affirmed this sentiment: “It’s free, it’s fun, and anyone can join. That’s the best part.” For many, the affordability and openness of Kī-o-Rahi was integral to its appeal, enabling wider community engagement
and ensuring participation was driven by relational instead of transactional values. As one participant succinctly put it, “Everyone’s just happy that you came.” This simple expression of gratitude reflects the spirit of manaakitanga (hospitality) that infused the event: a generous welcome that extended to all, regardless of ethnicity, knowledge, or ability.
3.2. Pride in te ao Māori
A second key theme to be created was a profound pride in te ao Māori, expressed through engagement with Kī-o-Rahi as a living cultural practice. Participants described feelings of validation, ownership, and cultural connection when engaging in a sport that originated from and actively reflected Māori traditions and worldview. This theme comprised two related subthemes: authentic Māori spaces and reclaiming traditional practices.
3.2.1. Authentic Māori spaces
Many participants expressed a deep appreciation for the authenticity of the cultural space created by Kī-o-Rahi. Unlike tokenistic or superficial incorporations of Māori symbols into Pākehā-dominated environments, the game was experiencedas an expression of cultural sovereignty. One participant succinctly captured this sentiment: “You get to be Māori in a way that’s not tokenistic.” This statement reflects both a critique of performative biculturalism and an endorsement of Kī-o-Rahi as a space where Māori identity could be expressed meaningfully and on Māori terms. Participants expressed pride in participating in a sport that was not merely inclusive of Māori culture but rooted in it. One participant affirmed:“This is our space,ourgame.We madethis.” This declaration of ownership speaks to participants’ sense of belonging, and, perhaps, resistance against a history of marginalisation within New Zealand’s sporting institutions. For many, the pride stemmed from the opportunity to be immersed in a sport that reflects and celebrates Māori values, narratives, and history: “It’s Māori, so we’re here for that. It’s who we are.” This sense of alignment between identity andactivity was central to the experience for both Māori and non-Māori participants who wished to engage respectfully with te ao Māori. For Māori participants especially, the event was not just recreational but affirmational, offering a space to “exist unapologetically as Māori.” Kī-o-Rahi was also described as an opportunity to enhance cultural continuity. One participant reflected: “It feels like we’re not just playing but keeping something alive.”
3.2.2. Reclaiming traditional practices
Closely related to the notion of authenticity was the theme of reclamation of traditional practices through Kī-o-Rahi. For some participants, particularly those raised in predominantly Pākehā environments, playing Kī-o-Rahi evoked a sense of returning to cultural roots. “We were raised playing Pākehā sports. This one feels like coming home.” This comment reveals a deeper emotional resonance: for these individuals, participation was not simply playing a sport but a deep personal reconnection to ancestral traditions.
Participants also emphasised that the kaupapa of the sport drew them in. One noted, “What interested me was probably like
the kaupapa around it… And just being a part of that.” The appeal was not limited to physical play but extended to the embedded cultural meanings, protocols, and values that gave the game depth and context. These cultural elements offered a richer sporting experience, which differed fundamentally from the more performance-driven objectives of mainstream sport. This contrast wasarticulatedexplicitlybyoneparticipant:“Thatwasreallycool because no other sport I’ve really played symbolized anything really… Rugby you want to get a try … it doesn’t mean anything. But there’s more to it [with Kī-o-Rahi].” Here, the participant acknowledges how most conventional sports are separated from cultural narrativeor spiritual significance, whereas Kī-o-Rahiwas infused with meaning and drew on pūrākau (trasitional story), whakapapa (genealogy), and tikanga.
3.3. Wairua
A third core theme developed through analysis was the wairua dimension of playing Kī-o-Rahi. For many participants, the game carried a deeper resonance. It was not simply a sport, but a practice grounded in wairua. This dimension transcended the physical aspects of play, anchoring it in ancestral connection and the unseen forces that shape and guide Māori experiences. Two interrelated subthemes were identified: Ancestral presence and guidance and representing tūpuna (ancestors) through play.
3.3.1. Ancestral presence and guidance
Participants frequently described Kī-o-Rahi as an activity that incorporates the presence of participants’ ancestors. The wairua of the game was felt both on and off the field, and this spiritual connection added weight and meaning to their participation. One participant reflected, “It feels like wairua’s part of the game … like our ancestors are watching us.” This expression highlighted how participants experienced the game as a potential spiritual window, one that linked them to those who had come before. For some, Kī-o-Rahi evoked a sense of kaitiakitanga (guardianship of cultural practices passed down through generations). One participantnoted,“Ourtūpunaused toplayit…it’snotjustagame, it’s a wairua thing too.” This acknowledgment of lineage positioned the game as a form of cultural continuation, where players were not only engaging for fun but taking part in the preservation of ancestral knowledge. Furthermore, participants described a tangible emotional and spiritual connection to their ancestors while playing. As one shared, “You feel them with you when you’re on the field, like you’re doing it for them.” This suggests that participation in Kī-o-Rahi was an act of remembrance and respect. In these moments, players were not only athletes. They also became vessels through which ancestral presence could be felt, honoured, and carried forward. This experience reflects a distinctly Indigenous worldview, in which the physical and spiritual realms are interwoven, and ancestral influence continues to shape the present. Rather than viewing sport as separate from culture or spirituality, participants saw Kīo-Rahi as a powerful site of reconnection.
3.3.2. Representing tūpuna through play
Beyond sensing the presence of ancestors, participants described feeling a responsibility to represent them through their actions on the field. This dimension added a sense of purpose and accountability to their participation. One participant stated, “You’re not just playing, you’re representing your tūpuna.” This notion of representation speaks to a deeper relational ethic, which is grounded in whakapapa and honouring those who paved the way. The weight of this reference to tūpuna elevated the game beyond recreation. It became a platform for enacting values and for continuing legacies.
3.4. Balance between competition and fun
A final theme constructed during the interpretive process discusses how participants engaged with Kī-o-Rahi with a distinctive balance between competition and fun. Unlike many conventional sports where performance and winning are central, participants described Kī-o-Rahi as a socially rich, low-pressure environment where relationality, enjoyment, and learning were prioritised. This balance supported both individual wellbeing and collective cohesion. Two subthemes captured this dynamic: competitive spirit with respectful limits and a safe learning environment.
3.4.1. Competitive spirit with respectful limits
Participants frequently acknowledged that competition was present, but not overwhelming. Instead of intense rivalry, the focus remained on social connection, emotional wellbeing, and collective fun. Many participants noted how this atmosphere offered relief from the stress of demanding work or traditional sports. One shared, “What we do [for work] is around like mental health, addiction, violence… so doing something like this and getting out and having fun and socialising outside of that mahi [work], that’s an exciting thing for me.” The comment speaks to the restorative role of the sport in supporting Hauora (holistic health outcomes), particularly hinengaro.
Several participants emphasised that the appeal of Kī-o-Rahi was less about the game itself, and more about the opportunity to be together. One participant noted, “I was mainly just pulled in by the social element… I enjoy my colleagues… just a chance to hang out.” Others described the joy and levity the game brought: “We’ve just had laughs and laughs… that’s partof the fun.” These accounts reflect the joys of whanaungatanga as central to the sporting experience. While competition existed, participants consistently described it as secondary to enjoyment. “We’re competitive, but it’s not the main thing.” This comment illustrates how competitive energy could exist without undermining the inclusive and social environment. Another participant explained, “You still want to win, but you don’t take it home with you.” This healthy relationship with competition, which was focused on engagement rather than ego, helped reduce pressure and made the event feel open and welcoming to all levels of ability.
3.4.2. Safe learning environment
Alongside the balanced competitive spirit, participants described Kī-o-Rahi as a safe and encouraging place to learn, particularly for those new to the game. The absence of harsh judgment or
performance pressure created psychological safety, which allowed players to make mistakes. One participant captured this clearly: “You don’t feel dumb if you make a mistake. Everyone helps you out.” This emphasis on collective encouragement was echoed by another: “You weren’t laughed at, you were encouraged.” Rather than being corrected or ridiculed, new players were met with support, reflecting a deeply Māori ethic of manaakitanga.
Positive reinforcement took precedence over critique, reinforcing trust and comfort. Participants appreciated the freedom to learn without the pressure to master the game. “I like that I’m learning, but I’m not expected to know it all.” The removal of perfectionist expectations created a more inclusive experience where the process of learning was valued over performance outcomes. One player shared, “I knew that it was social, not real competitive, which made me feel comfortable to come and learn.” Knowing that the environment was social and welcoming gave new participants the confidence to show up and try. This safe space for learning reflects kaupapa Māori that emphasizes relationality, humility, and experiential learning.
Overall, participants appreciated that while Kī-o-Rahi allowed for healthy competition, it was always held within the boundaries of respect and connection. The emphasis on encouragement and safety, especially for newcomers, underscored Kī-o-Rahi’s role as a culturally grounded learning environment. Through its balance of playfulness and competitiveness, Kī-o-Rahi embodied Māori approaches to sport that prioritise people over outcomes.
4. Discussion
The results of this study highlighted the multifaceted motivations that underpin participation in Kī-o-Rahi. It appears that Kī-o-Rahi is experienced by participants as more than just a competitive sport. It is a culturally grounded practice that fosters social connection, cultural affirmation, and spiritual connection. Taken together, the findings suggest that Kī-o-Rahi holds unique potential as a culturally grounded, socially cohesive, and spiritually meaningful Māori sport. Its emphasis on whakawhanaungatanga, cultural pride, spiritual connection, and inclusivity contrasts with the values often ascribed to mainstream sport, which often prioritise competition and individualism (Rai et al., 2024). For Māori and Pākehā, Kī-o-Rahi may offer a restorative and affirming space that bridges generations, affirms identity, and supports holistic dimensions of wellbeing.
4.1. Comparison of Indigenous and Western sports
Several Western sports (e.g., hockey, football), have strongly beenassociatedwithafocusonperformanceandcompetition(Rai et al., 2024). There are notable exceptions, both in Aotearoa New Zealand and abroad, of sport initiatives that placed a focus on balancing performance and opportunities to enjoy the sport (e.g., Balance is Better; Taylor et al., 2024). Nevertheless, participants in the current study highlighted how they felt Kī-o-Rahi placed comparatively less emphasis on competition and instead celebrated aspects such as multigenerational presence and whanaungatanga instead of sport performance. These findings reflect similar themes that have been found in recent research on Kī-o-Rahi (Campbell et al., 2024). Furthermore, the elements of
inclusivity and intergenerational exchange not only supported community-building but reinforced the holistic values of Māori sport, which are values often lost in age-banded, competitiondriven sports environments such as rugby. Furthermore, the game held space for difference without othering, which appeared to reduce the hierarchies of knowledge, ability, or ethnicity. These findings are consistent with that of Palmer et al. (2009), who found that Kī-o-Rahi catered to a wide range of skill and fitness levels, provided an opportunity for interaction between ethnicities, genders, age, and peer groups, and allowed the expression of Māori identityand pride.These accounts reflect someof thebroad values of Kī-o-Rahi. Namely, newcomers are embraced rather than assessed, and cultural humility is encouraged.
Furthermore, participation in Kī-o-Rahi was understood as an act of cultural stewardship, which helped to revitalise practices that had once beendiminishedor displaced. These findings reflect previous Canadian research, which suggested that sport can offer Indigenous youth opportunities to strengthen community ties and deepen cultural connections (McHugh et al., 2019). This process could in turn help contribute to the intergenerational survival of mātauranga Māori (Māori knowledge). Even for those who were still learning or reconnecting with their Māori identity, Kī-o-Rahi provided a non-threatening, embodied way to engage with te ao Māori. The game offered more than just physical activity. It also offered participants an evolving sense of who one could be as Māori. In doing so, Kī-o-Rahi acted as a subtle yet powerful decolonial practice, which may have the potential of restoring cultural relevance to physical activity and challenging the dominance of colonial sporting models. Namely, Pride in te ao Māori highlighted how Kī-o-Rahi is more than a sport. Kī-o-Rahi offered authentic Māori spaces where culture was honoured and supported the reclamation of traditional practices.
4.2. More than a sport
Based on the results of the current study, Kī-o-Rahi functioned as more than a sport and lead to a multitude of holistic benefits. Previously, Akbar et al. (2020) conducted a systematic review on wellbeing and traditional Indigenous sports that took place in Canada, the United States of America, New Zealand, and Australia. Akbar et al. (2020) found numerous emotional, mental, and spiritual benefits of traditional physical activity. Similarly, in the current study, Kī-o-Rahi was described as prioritising connection over competition, belonging over performance, and togetherness over hierarchy. Overall, Kī-o-Rahi was described as functioningnotonlyas aformof recreationbutas asite ofcultural resurgence and identity affirmation. For instance, participating in Kī-o-Rahi was accompanied by a claim of belonging, and, perhaps, resistance against a history of marginalisation within New Zealand’s sporting institutions.
Based on the current study, Kī-o-Rahi acted as a vehicle for whakawhanaungatanga. The tournament allowed participants to create relational networks that resembled, reflected, or became whānau.Thesport’sinclusivestructure,multigenerationalformat, and relational focus collectively fostered a culturally grounded, community-affirming experience. This connection was at a deeper level than typified in western sport, where, playing Kī-oRahi was not just about movement or strategy, it was also about connection to one’s tūpuna. Kī-o-Rahi became a space where
wairua could be lived, rather than simply talked about. The theme of Wairua revealed the depth of spiritual meaning participants found in playing Kī-o-Rahi. For many, the game served as a bridge between worlds. It helped link the past and present, physical and spiritual, self and ancestors. Participants described feeling guided by their tūpuna and compelled to represent them through play. These findings reflect earlier research in the context of Aotearoa New Zealand. Namely, Griffiths et al. (2023) in a review of social benefits of sports in Aotearoa New Zealand, found that for Māori athletes, participating in sport helped strengthened their sense cultural identity. Indeed, according to Moon (2012), “while sport can be an instrument of ‘cultural suppression and cultural hegemony on the one hand’, it can paradoxically serve as a force for ‘…cultural regeneration and cultural survival on the other’” (p.29).
Furthermore, findings of the current study reinforce those from a scoping report by Palmer et al. (2009), that found Kī-oRahi to be a way of passingdown beliefs, traditions, and protocols from one generation to the next. Similarly, in the context of another traditional Māori sport, called waka ama, Severinsen and Reweti (2021), found that when participants were afforded opportunities to connect to their culture, their wellbeing improved. Internationally, the review by McHugh et al (2019) also found that sport and recreation may provide valuable opportunities for Indigenous youth in Canada to connect with their communities and access role models. In summary, participants in the current study, expressed that Kī-o-Rahi functioned not only as a form of sport or recreation but as a site of cultural resurgence and identity affirmation, where the game was accompanied by a claim of belonging.
4.3. Implications
From a policy perspective, there is a compelling case for increasing structural and financial support for traditional Indigenous sports such as Kī-o-Rahi. Kī-o-Rahi can be supported not only as a recreational activity to promote physical wellbeing but as atoolfor supportingbroadergoals aroundMāori wellbeing. Incorporating games like Kī-o-Rahi into schools, community centres, and health initiatives may help strengthen cultural identity and foster community connection. Importantly, such initiatives should be led by Māori and embedded in kaupapa Māori approaches, to ensure authenticity and uphold the cultural integrity of the game.
For instance, Kī-o-Rahi could be included in school curricula, not just as physical activity, but as a culturally rich learning tool that connects students to mātauranga Māori. In community contexts, funding Kī-o-Rahi-related efforts could help support intergenerational engagement and whānau connectedness. Local government, regional sporting organisations, and community development agencies could prioritise fundingforMāori-led sport and recreation initiatives, especially those that use Indigenous games, such as Kī-o-Rahi, for strengthening identity and community wellbeing. Finally, Kī-o-Rahi, could be used to support national level health promoting strategies such as He Korowai Oranga (New Zealand’s Māori Health Strategy). Particularly, Kī-o-Rahi, may be used to foster whānau ora (family health) and culturallyrelevantpathways to wellness. Publichealth agencies can collaborate with iwi (Māori tribes) to implement Kī-
o-Rahi-based programmes thataddress physical inactivity,mental health, and social disconnection, which are key determinants of Māori wellbeing outcomes.
4.4. Strengths and limitations
This study offers valuable insights into Kī-o-Rahi, a culturally significant sport in Aotearoa New Zealand that is gaining in popularity but remains underrepresented in academic literature. Throughout this study, cultural integrity and tikanga was upheld throughout the process. For instance, focus groups were conducted in a familiar and meaningful context, which fostered participant comfort and supported the authenticity of responses. Furthermore, the research question emerged collaboratively through a hui with Kī-o-Rahi organisers, grounding the inquiry in lived experience and community priorities.
Nevertheless, a key limitation of this study lies in the contextspecific nature of its data collection. Because all focus groups were conducted during a single regional Kī-o-Rahi tournament in Ōtautahi Christchurch, the findings may overly reflect the enthusiasm that was present during the heightened social, emotional, and cultural atmosphere of the event. Furthermore, the perspectives of younger participants and Kī-o-Rahi participants from Te Ika-a-Māui (the North Island) were not included in the current study. In addition, there was a lack of negative findings or challenges expressed byKī-o-Rahi participants. This can likely be explained by the tournament’s context, which emphasised connection and cultural pride, and may have amplified relational or spiritual reflections and underrepresented other aspects of motivation (e.g., health, routine) that might emerge in day-to-day Kī-o-Rahi practices. Consequently, future research may benefit from establishing data collection on a longitudinal basis or taking place in non-tournament settings. Moreover, an exploration of motivation from the point of view of people discontinuing participating in Kī-o-Rahi could be warranted.
Conclusion
Theoverallfindingsofthisstudyrevealthatthemotivationtotake part in Kī-o-Rahi incorporates the deeply relational, cultural, and spiritual dimensions of the game. Kī-o-Rahi is a site where whakawhanaungatanga flourishes, where cultural identity is reclaimed and celebrated, and where ancestral presence is honoured through collective play. For many, it is not just a sport, it is a lived expression of kaupapa Māori, offering pathways for connection, competition, spirituality, safety, cultural resurgence, and te ao Māori.
Conflict of Interest
The authors declare no conflict of interests.
References
Akbar, L., Zuk, A. M., & Tsuji, L. J. (2020). Health and wellness impacts of traditional physical activity experiences on indigenous youth: A systematic review. International Journal of Environmental Research and Public Health, 17(21), 8275.
Arellano, A., & Downey, A. (2019). Sport-for-development and the failure of aboriginal subjecthood: Re-imagining lacrosse as resurgence in indigenous communities. Settler Colonial Studies, 9(4), 457–478.
Bengtsson, D., Svensson, J., Wiman, V., Stenling, A., Lundkvist, E., & Ivarsson, A. (2025). Health-related outcomes of youth sport participation: A systematic review and meta-analysis. International Journal of Behavioral Nutrition and Physical Activity, 22(89), 1–10. https://doi.org/10.1186/s12966-02501792-x
Boudreau, P., Huia, T., Harris, H., Olsen, P., & Marshall, H. (2025). Reducing health inequities through Kī-o-Rahi: The role of intrinsic motivation. Scope: Health & Wellbeing, 9, 22–29. https://doi.org/10.34074/scop.3009005
Biles, B. J., Serova, N., Stanbrook, G., Brady, B., Kingsley, J., Topp, S. M., & Yashadhana, A. (2024). What is Indigenous cultural health and wellbeing? A narrative review. The Lancet Regional Health–Western Pacific, 52. Braun, V., & Clarke, V. (2019). Reflecting on reflexive thematic analysis. Qualitative Research in Sport, Exercise and Health, 11(4), 589–597.
Campbell, M., Parata, N., Eastwood, C., & Hapeta, J. (2024). Teaching games for whakawhānaukataka: Doubling down on ‘understanding’ that Kī-o-Rahi is more than just a game Emphasising whakawhānaukataka to promote the importance of hauora (wellbeing). Junctures: The Journal for Thematic Dialogue, 1(24), 25–41 Durie, M. (1998). Whaiora: Māori health development (2nd ed.). Oxford University Press.
Fabian,T.,&Giles,A.R.(2023).Revivingcultureandreclaiming youth: Representations of traditional Indigenous games in mainstream Canadian and Indigenous media. Journal of Sport for Development, 11(1).
Griffiths, K., Davies, L., Savage, C., Shelling, M., Dalziel, P., Christy, E., & Thorby, R. (2023). The value of recreational physical activity in Aotearoa New Zealand: A scoping review of evidence and implications for social value measurement. International Journal of Environmental Research and Public Health, 20(4), 2906.
Hinemoa, W., Hapeta, J., & Jackson, A. (2023). "Whakamana te tuakiri o ngā wāhine Māori i te ao whutuporo: Flourishing wāhine Māori identities in rugby: A literature review." Junctures: The Journal for Thematic Dialogue, 23, 36–54. https://doi.org/10.34074/junc.23005
Ka'ai-Mahuta, R. (2011). The impact of colonisation on te reo Māori: A critical review of the State education system. Te Kaharoa, 4(1), 195–225.
McHugh,T.L.F.,Deal,C. J., Blye,C. J.,Dimler,A. J.,Halpenny, E. A., Sivak, A., & Holt, N. L. (2019). A meta-study of qualitative research examining sport and recreation experiences of indigenous youth. Qualitative Health Research, 29(1), 42–54.
Moon, P. (2012). Links between Maori cultural well-being and participation in sports: A literature review. Te Kaharoa, 5(1).
Muriwai, E., Manuela, S., Cartwright, C., & Rowe, L. (2023). Māori exercise professionals: Using indigenous knowledge to connect the space between performance and wellbeing. Journal of Applied Sport Psychology, 35(1), 83–109.
Palmer, FR., Graham, M., & Mako, N. (2009). Ki-o-Rahi evaluation and scoping project. [Commissioned Report]. Panza, M. J., Graupensperger, S., Agans, J. P., Doré, I., Vella, S. A., & Evans, M. B. (2020). Adolescent sport participation and symptoms of anxiety and depression: A systematic review and meta-analysis. Journal of Sport and Exercise Psychology, 42(3), 201–218. https://doi.org/10.1123/jsep.2019-0235
Rai, J. S., Cho, H., Itani, M., & Singh, A. (2024). The impact of social media-related motivation on fantasy sport users’ playing skills, sense of competition and performance expectancy. Asia Pacific Journal of Marketing and Logistics, 36(11), 2931–2952. Rochford, T. (2004). Whare Tapa Wha: A Māori model of a unified theory of health. Journal of Primary Prevention, 25(1), 41–57.
Severinsen, C., & Reweti, A. (2021). Waiora: Connecting people, well-being, and environment through waka ama in Aotearoa New Zealand. Health Promotion Practice, 22(4), 524–530.
Smith G.H. & Smith L.T. (2023) Foreword: Indigenous sport and development– Decolonising sport in Aotearoa New Zealand. Journal of Sport for Development 11(1), 1–10. Sport New Zealand Ihi Aotearoa. (2023). Te Whetū Rehua. https://sportnz.org.nz/kaupapa-maori/e-tu-maori/te-wheturehua/
Taylor, L. A., Lander, P., & Rayner, R. (2024). Youth basketball in New Zealand: Establishing performance norms in the context of 'Balance is Better'. Journal of Sport and Exercise Science, 8(1), 65–73.
Thomsen, R. C., Ren, C., & Mahadevan, R. (2018). “We are the Arctic”: Identities at the Arctic Winter Games 2016. Arctic Anthropology, 55(1), 105–118.
Appendix A: Glossary of Kupu Māori (Māori words)
Te Reo Māori English
Hauora Holistic health outcomes
He Korowai Oranga New Zealand’s Māori Health Strategy
Hinengaro Mental
Hui meeting
Iwi Māori tribes
Kaitiakitanga Guardianship of cultural practices passed down through generations Kaupapa Māori values-based
Kōrero Discussion
Manaakitanga Hospitality
Mātauranga Māori Māori knowledge
Mihimihi
Sharing an introduction about oneself, which is used to establish links with other people present and let people know who you are, and where you come from
Ngā taonga tākaro Indigenous sports
Pākehā New Zealand European Pūrākau Traditional stories
Rangahau Māori research methodologies
Tamariki Children
Te ao māori Māori worldview
Te reo Māori The Indigenous language of Aotearoa
Te Waipounamu South Island, New Zealand
Te Whare Tapa Whā Māori model of wellbeing
Te Whetū Rehua The Guiding Star
Tikanga Appropriate Māori protocols
Tinana Physical
Tino rangatiratanga Indigenous self-determination
Tūpuna Ancestors
Wairua Spiritual
Whakapapa Genealogy
Whakawhanaungatanga Relationship-building
Whānau Family/community
Whānau ora Family health
Whenua Roots, land
Appendix B: Focus Group Interview Guide
• Tell me about your experiences with sport or exercise.
• Can you tell me about how you got started with Kī-o-Rahi?
• What about Kī-o-Rahi inspires you to play?
• What initially motivated you to start playing Kī-o-Rahi, and how has your motivation changed over time?
• What has made you want to come to this tournament?
• How does training for kī-o-Rahi compare to this type of tournament?
• How would you describe the feeling of playing in a competitive setting like this?
• What keeps you involved in Kī-o-rahi over time?
• Can you tell me about any challenges or obstacles you have faced?
• What support or resources have helped you continue playing?
• How do relationships with teammates or coaches influence your participation?