
fixed bar while adopting the second pull position (the upward extension of the body to accelerate and elevate the barbell from about mid-thigh to the full extended position) of the clean, has been reported to behighlycorrelated to weightliftingperformance (r = 0.80 – 0.91) (Beckham et al., 2013; Ben-Zeev et al., 2022; Haff et al., 2005; Joffe et al., 2021). Significant correlations between IMTP RFD, early force development, and weightlifting performance has also been observed (r = 0.65 – 0.80; Beckham et al., 2013). Based on these findings, weightlifting coaches may use IMTP as an assessment tool to monitor the force generation capability of their athletes to monitor adaptations to training.
While the IMTP is a feasible option for monitoring weightlifting athletes, Ben-Zeev et al. (2022) and Joffe et al. (2021) reported higher correlations (r = 0.81 – 0.96) between isometric force and weightlifting performance when isometric peak force was obtained from the first pull position of clean (IFP) as compared to IMTP (r = 0.60 – 0.91). These findings support the suggestionthat isometricforcehas a strongerrelationship with a dynamic movement when the test is performed in the position where concentric force is initiated for that movement (Lum et al., 2020). Hence, this finding suggests that IFP serves as another option for weightlifting coaches to use for monitoring their athletes. However, despite the findings by Ben-Zeev et al. (2022) and Joffe et al. (2021), only Ben-Zeev et al. (2022) compared the relationship between RFD and early force development obtained from the IFP and IMTP with weightlifting performance. As rapid force production obtained during the IMTP (e.g., RFD and force at early time-points [i.e., 100-, 150-, 200-, 250-ms)]) has previously found to be an important determinant of weightlifting performance (Beckham et al., 2013; Haff et al., 2005), and there is a lack of data on rapid force development obtained from IFP, this warrants further investigation.
Although researchers have shown high correlation between weightlifting performance with measures of IFP and IMTP (Beckham et al., 2013; Ben-Zeev et al., 2022; Haff et al., 2005; Joffe et al., 2021), the researchers did not perform long-term monitoring of weightlifters’ performance using these two isometric strength assessments. Considering that the changes in dynamic and isometric strength performance were shown to be disproportional (James et al., 2023), it is likely that the correlation between weightlifting performance with measures of IFP and IMTP would changeovertime.Indeed,resultsfromapreviousstudyshowedthat the relationship between isometric strength measures and dynamic movementperformancemaychangeafteraperiodoftraining(Lum & Joseph, 2020). This outcome may also be observed for the relationship between weightlifting performance measures with IFP and IMTP measures, hence, altering the ability of IFP and IMTP force-time characteristics in predicting weightlifting performance. In view of this, the purpose of the study was to determine the relationship between weightlifting performance with force-time characteristics obtained from IFP and IMTP over several mesocycles.Inlinewithpreviousfindings, it was hypothesizedthat (1) weightlifting performance, as determined by the mean power and peak power during SN and CN at 85% of season best, would demonstrate stronger correlations with RFD and early force developmentobtainedfromIFPthanIMTP;and(2)therelationship between weightlifting performance with measures obtained from IFP and IMTP will be affected by the training that athletes undergo during each mesocycle
2. Methods
An observational repeated measures design was used to determine the relationships between the force-time characteristics of the IFP and IMTP with weightlifting performance including competition best snatch (SN) and clean (CN) at week 0, and peak power and mean power at 85% best SN and CN (based on their best clean and jerk load) in national male and female weightlifters over a period of 16 weeks. For each testing session, participants performed the IFP, IMTP, and SN and CN at 85% of their competition best. This intensity was selected to minimize any disruption to athletes’ training as they trained within this intensity most of the time. Participants performed three testing sessions in total at week 0, 8, and 16
2.1. Participants
Aconveniencesampleofsixmale(age:28.7±2.0years,bodymass: 73.2 ± 11.4 kg, height: 1.72 ± 0.05 m) and four female (age: 26.0 ± 1.4 years, body mass: 57.5 ± 3.7, height: 1.61 ± 0.04 m) weightliftersfromthenationaltrainingsquadwererecruitedforthis study.Inclusioncriteriaincluded:(1)18–35yearsold;(2)hadbeen participating in competitive weightlifting for more than 2 years; (3) is currently in the national training squad; and (4) was free from injuryatthepointofrecruitment.Studycommencedafterobtaining the approval from the institutional review board of the Singapore Sport Institute (SC-EXP-029). All participants were briefed on the procedure of the study and signed an informed consent form.
2.2. Procedure
Participants were asked to avoid the consumption of heavy meals 2 hours before each testing session. All testing sessions were conducted at similar time between sessions (within 1 hour) to avoid diurnal effect. To ensure that participants were able to perform at their best during each session, participants performed their individual competition warm up regime during each session. Participants performed the tests in the following order each separated by 5 minutes, IFP, IMTP, SN, and CN.
2.3.
Isometric strength tests
Both IFP and IMTP were performed on the dual force plates (Force Decks, VALD Performance, FD4000, Queensland, Australia) sampling at 1000 Hz. The commercially available ForceDecks software (VALD Performance, ForceDecks, Queensland, Australia) was used to analyze all force-time data obtained during the tests, using raw unfiltered data. For the IFP, participants were asked to adopt a posture that reflected the start of the first pull of a clean (Figure 1A). The bar height (22.2 cm off the ground) was based on the height of a weightlifting bar when loaded with standard weightlifting weight plates of 45 cm in diameter. Therefore, the body position of each participant varied slightly due to individual anthropometric and mobility characteristics. However, key technical criteria of the set-up position for the clean was followed (Joffe et al., 2021). This was visually inspected by the weightlifting coach prior to the commencement of the test. For the IMTP, participants adopted a posture that reflects the start of the second pull of the clean
resulting in a knee flexion angle of 125 – 145˚, and hip flexion angle of 140 – 150˚ (Comfort et al., 2019) (Figure 1B). A handheld goniometer was used to ensure that athletes adopt the required knee and hip angles and that these were replicated across testing sessions. For both tests, participants were required to hold on to the bar with elbows fully extended, using lifting straps to ensure that grip strength was not a limiting factor. Prior to each test, participants performed a3 s submaximalIFP orIMTP at50%, 70%, and 90% perceived maximal effort. Each repetition was separated by 60 s (Comfort et al., 2019).
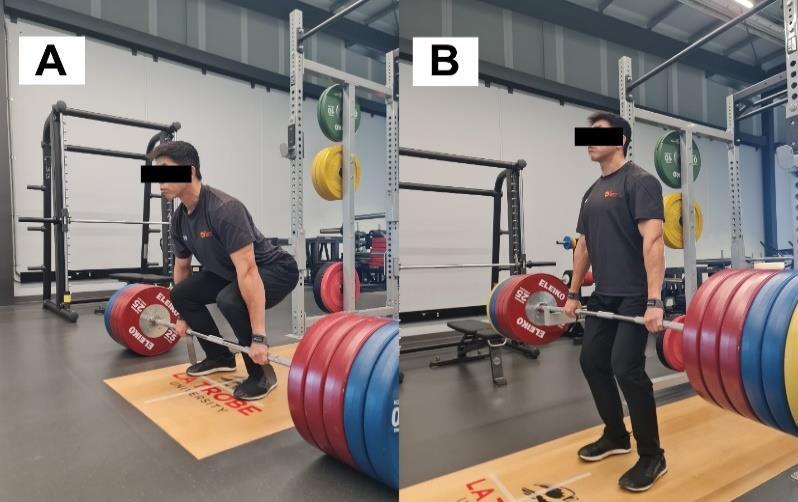
1: Posture adopted for (A) isometric first pull, and (B) isometric mid-thigh pull.
During the test, participants were asked to drive their feet into the ground “as fast and as hard possible” following a “3, 2, 1pull” countdown from the tester. During the first two attempts, participants maintained the tension for a period of 1 s with each repetition separated by 20 s (Guppy et al., 2022). Force at 100, 150, and 200 ms (Force100, Force150, and Force200, respectively) and mean rate of force development at 0-100, 0-150, 0-200 and 0250 ms (RFD0-100, RFD0-150, RFD0-200 and RFD0-250, respectively) from the onset of pull were determined for each trial. The average of the two trials were recorded and analyzed. Participants rested for 2 minutes before performing 2 more attempts in which they maintained the tension for a period of 5 s with acceptable trials demonstrating no countermovement and peak force between trials demonstrating a difference < 250 N. Each repetition was separated by 2 minutes (Comfort et al., 2019). The average of the peak force generated by the two trials was recorded and analyzed. The onset of pull was determined based on an increase of > 5 standard deviation (SD) of participants body mass during a period of quiet standing prior to the pull (Dos’ Santos et al., 2017). This setting is available in the ForceDecks software. A 20 kg stiff powerlifting barbell (Eleiko, Sweden) was used for all testing. The barbell was loaded with sufficient weight plates to ensure that participants were not able to move the bar.
2.4. Snatch and clean
The SN and CN performance were determined as the mean power (MP) and peak power (PP) obtained when lifting 85% of individual’s season’s best. The reason for using the using the
submaximal load is firstly, to avoid disruption to participants’ training, and the 85% load is a commonly used load during training. Secondly, assessing power output is suggested to be a good predictor of weightlifting performance (Garhammer, 1980; Garhammer, 1993). Specifically in the current study where the weight lifted was kept constant throughout the 16-week period, a higher power measured would indicate an improvement in performance. This would allow the athletes to be aware of their progression without the need to perform a maximal lift. During the SN and CN, participants began their build up to 85% of their season’s best by performing 3 repetitions at 40% and 50%, 2 repetitions at 60% and 70%, and 1 repetition at 80% of their season’s best. Each repetitionwas separated by 30 s and each load intensity by 3 min. Participants performed the 85% for two attempts, each separated by 3 min. A linear position transducer (LPT; GymAware, Kinetic Performance Technology, Canberra, Australia) was used to determine the peak and mean velocity of the barbell. The mean and peak power was determined as the instantaneous product between the net force applied to the barbell (i.e., barbell mass × vertical barbell acceleration, based on the displacement time data from the LPT) and vertical barbell mean and peak velocity. The average of both attempts was used for further analysis. Participants lifted the same testing load for SN and CN during subsequent testing sessions.
2.5. Statistical analyses
Statistical analysis was performed using the JASP version 0.18.3.0. All tested variables were expressed by Mean (± 1 SD). Within session test-retest reliability was assessed using two-way, mixed intraclass correlation coefficients (ICC) and coefficient of variation (%CV) for all measured variables. ICC values were deemed as poor, moderate, good, or excellent if lower bound 95% confidence interval (CI) of ICC values were < 0.50, 0.50 – 0.74, 0.75 – 0.90, or > 0.90, respectively (Koo & Li, 2016). Acceptable within-sessionvariabilitywas classifiedas≤ 10%(Cormacketal., 2008). All assumptions torunANOVA were checked beforehand, including normality and sphericity. A one-way ANOVA with Tukey post-hoc analysis was used to determine the differences in all variables measured at different time points (p ≤ 0.05). To reduce the incidence of bias due to the small sample size, Hedges’ g was computed, where the following descriptors were used: (i) trivial effect size if g < 0.20; (ii) small effect size if g = 0.20 –0.49; (iii) moderate effect size if g = 0.50 – 0.80; and (iv) large effect size if g > 0.80 (Cohen, 1988).
Pearson correlation coefficients (r) and the associated 95% CI was used to determine the interrelationships among isometric assessment and weightlifting performance measures. The strength of all correlations was interpreted using the following criteria: trivial (< 0.10), small (0.10 – 0.29), moderate (0.30 – 0.49), large (0.50 – 0.69), very large (0.70 – 0.90), or near perfect (> 0.90) (Hopkins et al., 2009). Fisher r-z transformation was performed to compare the magnitude of correlation between isometric assessment and weightlifting performance measures at different time points (Raghunathan et al., 1996).An apriori alpha levelwas set at p < 0.05, and p-values associated with the correlations were subsequently adjusted for familywise error rates, based on the multiple correlations (adjusted p = p ÷ 4).
3. Results
The reliability analysis of all measured variables is displayed in Table 1. Excellent reliability was observed for MP and PP obtained from SN and CN, as well as PF obtained from IFP and IMTP (ICC = 0.977 – 0.997, 95% CI = 0.933 – 1.00, %CV = 1.1 – 3.7, 95% CI = 0.9 – 5.2). Good reliability was observed for IFP Force50, Force200, RFD0-200, and RFD0-250, and IMTP Force50,
Force150, RFD0-200, and RFD0-250 (ICC = 0.852 – 0.939, 95% CI = 0.750 – 0.968, %CV = 5.2 – 7.1, 95% CI = 4.1 – 8.8). Moderate reliability was observed for IFP Force100 and Force150, and IMTP Force100 and Force200 (ICC = 0.783 – 0.847, 95% CI = 0.645 –0.918, %CV = 4.7 – 6.9, 95% CI = 3.7 – 9.6). The IFP and IMTP RFD0-50, RFD0-100,and RFD0-150 showed unacceptable %CV (ICC = 0.686 – 0.850, 95% CI = 0.509 – 0.919, %CV = 11.6 – 19.7, 95% CI = 9.0 – 28.3)
Table 1: Reliability analysis of snatch, clean, and isometric force measures.
Snatch
Notes: Bold font denotes good to excellent reliability. ICC = intraclass correlation, CI = confidence interval, CV = coefficient of variation, IFP = isometric first pull, IMTP = isometric mid-thigh pull, Force50 = force at 50 ms, Force100 = force at 100 ms, Force150 = force at 150 ms, Force200 = force at 200 ms, RFD0-50 = rate of force development from 0 to 50 ms, RFD0-100 = rate of force development from 0 to 100 ms, RFD0-150 = rate of force development from 0 to 150 ms, RFD0-200 = rate of force development from 0 to 200 ms, RFD0-250 = rate of force development from 0 to 250 ms
Measures obtained from snatch, clean, IFP, and IMTP across 16 weeks are displayed in Table 2. No significant difference between weeks was observed from all measured variables (p = 0.151 –0.975). At week 0, significant and near perfect correlations were observed between IFP and IMTP PF with snatch and clean PP and MP (r = 0.967 – 0.989, p < 0.001) (Table 3).
Significant and very large correlations were observed between IFP Force200, IFP RFD0-200 and RFD0-250 with snatch and clean PP and MP (r = 0.753 – 0.852, p = 0.006 – 0.010) (Table 3). At week 8, significantandnearperfectcorrelations wereobserved between IFP and IMTP PF with snatch and clean PP and MP (r = 0.966 –0.991, p <0.001)(Table4).Significantandverylargecorrelations
were observed between IFP Force50 and Force200 with snatch and clean PP and MP (r = 0.777 – 0.840, p = 0.002 – 0.008) (Table 4). At week 16, significant and near perfect correlations were observed between IFP and IMTP PF with snatch and clean PP and MP (r = 0.954 – 0.977, p < 0.001) (Table 5). Significant and very large correlations were observed between IFP Force50 and Force200 with snatch and clean PP and MP (r = 0.803 – 0.865, p = 0.002 –0.02) (Table 5). Fisher r-z transformation analysis showed no significant change in correlation magnitude between snatch and clean PP and MP with all isometric variables across 16 weeks (p = 0.053 – 0.497) (Supplementary Table 1 – 4).
Table 2: Snatch, clean and isometric test measures across 16 weeks expressed as mean (SD).
Snatch
(N) 1367.3 (194.9) 1370.7 (347.4) 1551.6 (273.5) 0.975
0.89]
1.65]
[-0.34, 1.45] Force200 (N) 1551.6 (273.5) 1601.4 (317.7) 1610.5 (428.5) 0.920 0.16 [-0.72, 1.04] 0.16 [-0.72, 1.03] 0.02 [-0.85, 0.9] RFD0-50 (N·s-1) 1869.9 (960.7) 2108.6 (1009.3) 2023.5 (1159.3) 0.875 0.23 [-0.65, 1.11] 0.14 [-0.74, 1.02] -0.07 [-0.95, 0.8]
RFD0-100 (N·s-1) 4187.2 (1736.8) 4433.5 (1752.8) 4192.6 (1981.1) 0.943 0.14 [-0.74, 1.01] 0.00 [-0.87, 0.88] -0.12 [-1, 0.75] RFD
-150 (N·s-1) 4229.1 (1107.7) 4628.3 (1389.9) 4397.8 (2072.0)
RFD0-200 (N·s-1) 4162.3 (1324.9)
RFD0-150 (N.s-1) 5975.5 (2318.4) 6833.5 (2613.3) 7989.1 (2372.5)
RFD0-200 (N·s-1) 6043.9 (1972.4) 6878.0 (2371.4) 7542.0 (1963.5) 0.299
RFD0-250 (N·s-1) 5652.5 (1618.8) 6358.6 (1841.6) 6519.6 (1703.3) 0.498 0.39 [-0.49, 1.27] 0.50 [-0.39, 1.39] 0.09 [-0.79, 0.96]
Notes: PP = peak power, MP = mean power, IFP = isometric first pull, PF = peak force, IMTP = isometric mid-thigh pull, Force50 = force at 50 ms, Force100 = force at 100 ms, Force150 = force at 150 ms, Force200 = force at 200 ms, RFD0-50 = rate of force development from 0 to 50 ms, RFD0-100 = rate of force development from 0 to 100 ms, RFD0-150 = rate of force development from 0 to 150 ms, RFD0-200 = rate of force development from 0 to 200 ms, RFD0-250 = rate of force development from 0 to 250 ms
Table 3: Correlation between snatch and clean power measures with isometric test measures at Week 0 expressed as r [95% CI]. Snatch PP
PF 0.983 [0.929, 0.996]** 0.987 [0.945, 0.997]**
Force50 0.293 [-0.413, 0.779] 0.254 [-0.447, 0.762]
Force100 0.371 [-0.338, 0.811] 0.405 [-0.302, 0.824]
[0.953, 0.998]** 0.985 [0.938, 0.997)**
[-0.405, 0.783] 0.318 [-0.390, 0.789]
[-0.268, 0.836] 0.427 [-0.277, 0.833]
Force150 0.611 [-0.030, 0.896] 0.618 [-0.019, 0.898] 0.654 [0.042, 0.909]* 0.651 [0.037, 0.908]*
Force200 0.793 [0.327, 0.949]* 0.792 [0.325, 0.949]* 0.815 [0.381, 0.955]* 0.813 [0.377, 0.954]*
RFD0-50 0.120 [-0.551, 0.967] 0.143 [-0.535, 0.709] 0.179 [-0.541, 0.727] 0.170 [-0.515, 0.722]
RFD0-100 0.049 [-0.602, 0.656] 0.118 [-0.552, 0.696] 0.134 [-0.541, 0.704] 0.110 [-0.558, 0.692]
RFD0-150 0.450 [-0.250, 0.841] 0.510 [-0.176, 0.863] 0.525 [-0.156, 0.868] 0.503 [-0.186, 0.860]
RFD0-200 0.753 [0.234, 0.938]* 0.768 [0.267, 0.942]* 0.776 [0.286, 0.944]** 0.767 [0.266, 0.942]*
RFD0-250 0.827 [0.412, 0.958]* 0.847 [0.466, 0.963]** 0.852 [0.480, 0.964]** 0.844 [0.458, 0.962]**
IMTP
PF
0.969 [0.869, 0.993]** 0.971 [0.880, 0.993]**
0.970 [0.873, 0.993]** 0.967 [0.862, 0.992]**
Force50 0.706 [0.137, 0.925] 0.738 [0.202, 0.934] 0.740 [0.207, 0.934] 0.731 [0.188, 0.932]
Force100 0.276 [-0.428, 0.772] 0.378 [-0.330, 0.814]
0.340 [-0.368, 0.799] 0.306 [-0.40, 0.785]
Force150 0.364 [-0.345, 0.808] 0.450 [-0.251, 0.841] 0.407 [-0.299, 0.825] 0.379 [-0.329, 0.814]
Force200 0.545 [-0.129, 0.875] 0.614 [-0.025, 0.897] 0.585 [-0.071, 0.888] 0.563 [-0.103, 0.880]
RFD0-50 0.139 [0.538, 0.707] 0.236 [-0.462, 0.754] 0.226 [-0.471, 0.749] 0.190 [-0.499, 0.732]
RFD0-100 -0.147 [0.532, 0.711] -0.040 [-0.653, 0.605] -0.081 [-0.676, 0.578] -0.119 [-0.696, 0.552]
RFD0-150 0.120 [-0.551, 0.697] 0.212 [-0.482, 0.742] 0.166 [-0.518, 0.720] 0.135 [-0.541, 0.705]
RFD0-200 0.358 [-0.350, 0.806] 0.431 [-0.273, 0.834] 0.399 [-0.307, 0.822] 0.375 [-0.334, 0.813]
RFD0-250 0.626 [0.006, 0.901] 0.676 [0.082, 0.916] 0.654 [0.041, 0.909] 0.637 [0.012, 0.904]
Notes: *p < 0.05. **p < 0.01. IFP = isometric first pull, IMTP = isometric mid-thigh pull, PF = peak force, Force50 = force at 50 ms, Force100 = force at 100 ms, Force150 = force at 150 ms, Force200 = force at 200 ms, RFD0-50 = rate of force development from 0 to 50 ms, RFD0-100 = rate of force development from 0 to 100 ms, RFD0-150 = rate of force development from 0 to 150 ms, RFD0-200 = rate of force development from 0 to 200 ms, RFD0250 = rate of force development from 0 to 250 ms
Table 4: Correlation between snatch and clean power measures with isometric test measures at Week 8 expressed as r (95%CI).
Snatch PP
IFP
PF
Snatch MP Clean PP Clean MP
0.982[0.924, 0.996]** 0.987 [0.944, 0.997]**
[0.960, 0.998]** 0.980 [0.914, 0.995]**
Force50 0.777 [0.289, 0.945]* 0.780 [0.295, 0.945]* 0.777 [0.288, 0.944]* 0.795 [0.332, 0.949]*
Force100 0.360 [-0.348, 0.807] 0.370 [-0.339, 0.811]
[-0.326, 0.815] 0.379 [-0.329, 0.814]
Force150 0.641 [0.019, 0.905] 0.646 [0.028, 0.907] 0.649 [0.033, 0.908] 0.653 [0.039, 0.909]
Force200 0.836 [0.436, 0.960]* 0.837 [0.439, 0.961]* 0.833 [0.429, 0.960]* 0.840 [0.446, 0.961]*
RFD0-50 0.178 [-0.509, 0.726] 0.184 [-0.504, 0.729]
0.202 [-0.490, 0.738] 0.217 [-0.478, 0.745]
RFD0-100 -0.129 [-0.702, 0.545] -0.120 [-0.697, 0.551] -0.101 [-0.687, 0.564] -0.111 [-0.692, 0.557]
RFD0-150 0.349 [-0.360, 0.802] 0.356 [-0.353, 0.805] 0.368 [-0.340, 0.810] 0.354 [0.354, 0.805]
RFD0-200 0.664 [0.059, 0.912]* 0.667 [0.063, 0.912]* 0.666 [0.063, 0.913]* 0.665 [0.061, 0.912]*
RFD0-250 0.739 [0.205, 0.934]* 0.741 [0.210, 0.935]* 0.744 [0.215, 0.935]* 0.740 [0.208, 0.934]*
IMTP
PF 0.970 [0.875, 0.993]** 0.976 [0.898, 0.994]** 0.979 [0.909, 0.995]** 0.966 [0.858, 0.992]**
Force50 0.638 [0.013, 0.904] 0.637 [0.013, 0.904] 0.633 [0.006, 0.903] 0.665 [0.061, 0.913]
Force100 0.336 [-0.373, 0.797] 0.339 [-0.369, 0.798] 0.341 [-0.367, 0.799] 0.356 [-0.353, 0.805]
Force150 0.417 [-0.289, 0.829] 0.420 [-0.285, 0.830] 0.424 [-0.281, 0.832] 0.422 [-0.282, 0.831]
Force200 0.605 [-0.039, 0.894] 0.606 [-0.038, 0.894] 0.611 [-0.031, 0.896] 0.614 [-0.026, 0.897]
RFD0-50 -0.096 [-0.684, 0.568] -0.095 [-0.684, 0.568] -0.094 [-0.683, 0.570] -0.068 [-0.669, 0.587]
RFD0-100 0.016 [-0.620, 0.639] 0.019 [-0.618, 0.641] 0.022 [-0.616, 0.643] 0.033 [-0.609, 0.649]
RFD0-150 0.185 [-0.503, 0.730] 0.189 [-0.500, 0.731] 0.194 [-0.496, 0.734] 0.187 [-0.502, 0.731]
RFD0-200 0.458 [-0.241, 0.844] 0.459 [-0.243, 0.844] 0.464 [-0.234, 0.846] 0.465 [-0.233, 0.847]
RFD0-250 0.670 [0.07, 0.914] 0.669 [0.068, 0.914] 0.673 [0.076, 0.915] 0.678 [0.084, 0.916]
Notes: *p < 0.05. **p < 0.01. IFP = isometric first pull, IMTP = isometric mid-thigh pull, PF = peak force, Force50 = force at 50 ms, Force100 = force at 100 ms, Force150 = force at 150 ms, Force200 = force at 200 ms, RFD0-50 = rate of force development from 0 to 50 ms, RFD0-100 = rate of force development from 0 to 100 ms, RFD0-150 = rate of force development from 0 to 150 ms, RFD0-200 = rate of force development from 0 to 200 ms, RFD0250 = rate of force development from 0 to 250 ms
importance on the success of SN and CN performance than RFD at later phases of the lifts.
Interestingly, while IFP RFD0-50 showed no significant correlation to both SN and CN performance, IFP Force50 at week 8 and 16 showed significant and large correlations to all SN and CN measures (r = 0.777 – 0.844). One possible reason could be due to the poor reliability of the IFP RFD0-50 measure. Thus, resulting in low correlation to SN and CN. While this finding suggests that early force development may be a determinant of weightlifting performance, the IFP Force50 obtained during week 0 showed insignificant and small correlation with SN and CN performance. The reason for this observation is unknown as the data for IFP Force50 showed good reliability, and there was no major change in training program across the 16 weeks. Conversely, IFP Force200 was observed to have a very large and significant correlation with SN and CN performance across the 16 weeks (r = 0.792 – 0.865). This was consistent with the observationonIFPRFD0-200 andRFD0-250,thus,furtherindicating the importance of force development around the 200 ms timeframe on SN and CN performance. It has been observed that the duration of the first pull forboth SN and CN is around the 400 ms timeframe (Gourgoulis et al., 2000; Sorenson et al., 2022). Considering the short distance travelled with this period, weightlifters would need to have generated sufficient amount of force to overcome the inertial to lift the weight off the ground within the 200 ms timeframe. Hence, the significant correlation observed between IFP Force200, RFD0-200 and RFD0-250 with SN and CN performance observed.
Several limitations should be taken into consideration when interpreting the current results. Firstly, the weightlifting performance in this study was determined by the mean and peak power during SN and CN at 85% season’s best instead of a 1RM. This differs from the previous two studies by Ben-zeev et al. (2022) and Joeffe et al. (2021). Hence, direct comparison of data may not be accurate. However, the use of power measurement at submaximal load provides relevance to the daily training environment, and such measure has been determined to be agood predictor of weightlifting performance (Garhammer, 1993). Secondly, the current sample size of participants did not allow for subgroup comparison, although the sample size was limited by using the national training squad. Hence, future studies may consider filling this gap in the current literature.
In conclusion, the results of this study show that peak force in the first and second pull positions exhibit a near perfect correlation with weightlifting performance. Furthermore, the current findings also showed the importance of early force development and RFD at 200 ms at the first pull position on weightlifting performance The results of this study also suggest that the force generation capabilities at both first and second pull positions should be equally addressed during training.
Conflict of Interest
The authors declare no conflict of interest.
Acknowledgment
The authors would like to thank all participants for their participation in the study.
References
Beckham, G., Mizuguchi, S., Carter, C., Sato, K., Ramsey, M., Lamont, H., Hornsby, G., Haff, G., Stone, M. (2013). Relationships of isometric mid-thigh pull variables to weightlifting performance. Journal of Sports Medicine and Physical Fitness, 53(5), 573–581.
Ben-Zeev, T., Sadres, E., & Hoffman, J. R. (2022). Comparison of force measures between start position, transition phase, and midthigh pull with weightlifting performance during israel national competition. Journal of Strength & Conditioning Research, 37(11), 2200–2205.
Brady, C. J., Harrison, A. J., & Comyns, T. M. (2020). A review of the reliability of biomechanical variables produced during the isometric mid-thigh pull and isometric squat and the reportingofnormativedata. Sportsbiomechanics,19(1),1–25.
Chavda, S., Comfort, P., Lake, J. P., Bishop, C., & Turner, A. N. (2023). Predicting weight category–specific performance zones for Olympic, World, and European Weightlifting Competitions. The Journal of Strength & Conditioning Research, 37(10), 2038–2045.
Cohen, J. (1988). Statistical power analysis for the behavioral sciences (2nd ed.). Hillsdale, Erlbaum.
Comfort. P., Dos’Santos, T., Beckham, G., Stone, M., Guppy, S., Haff, G. (2019). Standardization and methodological considerations for the isometric midthigh pull. Strength and Conditioning Journal, 41(2), 57–59.
Cormack, S. J., Newton, R. U., McGuigan, M. R., Doyle, T. L. A. (2008). Reliability of measures obtained during single and repeated countermovement jumps. International Journal of Sports Physiology and Performance, 3(2), 131–144.
Dos' Santos, T., Jones, P. A., Comfort, P., Thomas, C. (2017). Effect of different onset thresholds on isometric midthigh pull force-time variables. Journal of Strength and Conditioning Research, 31(12), 3463–3473.
Drake, D., Kennedy, R., & Wallace, E. (2018). Familiarization, validity and smallest detectable difference of the isometric squat test in evaluating maximal strength. Journal of Sports Sciences, 36(18), 2087–2095.
Fry, A. C., Ciroslan, D., Fry, M. D., LeRoux, C. D., Schilling, B. K., Chiu, L. Z. (2006). Anthropometric and performance variables discriminating elite American junior men weightlifters. Journal of Strength and Conditioning Research, 20(4), 861–866.
Garhammer, J. (1980). Power production by Olympic weightlifters. Medicine and Science in Sports and Exercise, 12(1), 54–60.
Garhammer, J. (1993). A review of power output studies of Olympic and powerlifting: Methodology, performance prediction, and evaluation tests. Journal of Strength & Conditioning Research, 7(2), 76–89.
Gourgoulis, V., Aggelousis, N., Mavromatis, G., & Garas, A. (2000). Three-dimensional kinematic analysis of the snatch of elite Greek weightlifters. Journal of Sports Sciences, 18(8), 643–652.
Guppy, S. N., Kotani, Y., Brady, C. J., Connolly, S., Comfort, P., & Haff, G. G. (2022). The reliability and magnitude of timedependent force-time characteristics during the isometric midthighpullareaffectedbybothtestingprotocolandanalysis
Supplementary Table 1: Comparison of correlations to snatch peak power (p).
0 vs 8
0 vs 16
Notes: IFP = isometric first pull, IMTP = isometric mid-thigh pull, PF = peak force, Force50 = force at 50 ms, Force100 = force at 100 ms, Force150 = force at 150 ms, Force200 = force at 200 ms, RFD0-50 = rate of force development from 0 to 50 ms, RFD0-100 = rate of force development from 0 to 100 ms, RFD0-150 =rateofforcedevelopment from0to150ms, RFD0-200 =rateof forcedevelopmentfrom0 to200 ms, RFD0-250 =rateofforcedevelopment from 0 to 250 ms
Supplementary Table 2: Comparison of correlations to snatch mean power (p).
Notes: IFP = isometric first pull, IMTP = isometric mid-thigh pull, PF = peak force, Force50 = force at 50 ms, Force100 = force at 100 ms, Force150 = force at 150 ms, Force200 = force at 200 ms, RFD0-50 = rate of force development from 0 to 50 ms, RFD0-100 = rate of force development from 0 to 100 ms, RFD0-150 = rate of force development from 0 to 150 ms, RFD0-200 = rate of force development from 0 to 200 ms, RFD0-250 = rate of force development from 0 to 250 ms.
Supplementary Table 3: Comparison of correlations to clean peak power (p-value).
Week 0 vs 8
Week 0 vs 16 Week 8 vs 16
Notes: IFP = isometric first pull, IMTP = isometric mid-thigh pull, PF = peak force, Force50 = force at 50 ms, Force100 = force at 100 ms, Force150 = force at 150 ms, Force200 = force at 200 ms, RFD0-50 = rate of force development from 0 to 50 ms, RFD0-100 = rate of force development from 0 to 100 ms, RFD0-150 = rate of force development from 0 to 150 ms, RFD0-200 = rate of force development from 0 to 200 ms, RFD0-250 = rate of force development from 0 to 250 ms.
Supplementary Table 4: Comparison of correlations to clean mean power (p-value).
Notes: IFP = isometric first pull, IMTP = isometric mid-thigh pull, PF = peak force, Force50 = force at 50 ms, Force100 = force at 100 ms, Force150 = force at 150 ms, Force200 = force at 200 ms, RFD0-50 = rate of force development from 0 to 50 ms, RFD0-100 = rate of force development from 0 to 100 ms, RFD0-150 = rate of force development from 0 to 150 ms, RFD0-200 = rate of force development from 0 to 200 ms, RFD0-250 = rate of force development from 0 to 250 ms
has emerged as to the role of long chain omega-3 polyunsaturated fatty acids (LCn-3PUFA) intake in athletic populations (Lewis et al., 2020), especially eicosapentaenoic acid (EPA) and docosahexaenoic acid (DHA) in ‘physically trained’ cohorts according to dose, duration and physiological outcomes (Anthony, et al., 2024b; Anthony et al., 2021). For athletes in general, LCn-3PUFA have been listed as a potential benefit in terms of ‘supporting’ effective training and competition (Rawson et al., 2018) although the vast majority of research on this topic has not included elite athletes (Thielecke & Blannin, 2020). Nonetheless, in the case of elite contact sport, supplementing with high doses of combined DHA and EPA has been reported to reduce exercising heart rate of Australian Football League athletes (Buckley et al., 2009), alleviate muscle soreness of rugby union athletes (Black et al., 2018) and attenuate the seasonal brain inflammation markers of college football players (Heileson et al., 2021; Heileson et al., 2024). These observations support a theory of multi-cellular nutritional preconditioning for physiological strain, especially in the context of recovery such as delayed onset muscle soreness (Anthony et al., 2021).
Nutritional intake of preformed EPA and DHA is the most effective way of increasing cell membrane incorporation in the context of physical training (Peoples & McLennan, 2016). Yet, athletes generally exhibit low to moderate levels of membrane EPA and DHA, as measured via a blood biomarker known as the Omega-3 Index (O3I) (Harris & Polreis, 2016). The O3I is derived from a measurement of the erythrocyte membrane phospholipid content and specifically the relative quantification of EPA and DHA that comprise the bilipid layer. An ideal target of > 8% based on cardiovascular outcomes is also reflective of consistent LCn-3PUFA intake (Harris, 2010) and therefore also relevant in cohorts such as athletes to describe and affirm membrane incorporation (Anthony, et al., 2024b). In practice, a recent study reported only 15% of North American college football athletes regularly use LCn-3PUFA supplements, resulting in low O3I levels in this cohort (Ritz et al., 2020). Earlier studies confirm this tendency, with only 33% of male and 20% of female athletes having adequate LCn-3PUFA intake, leading to generally low overall O3I in these North American centric groups (Wilson & Madrigal, 2016). In fact, specific to this current study, a Canadian Rugby 7s squad was reported to have a group mean O3I < 5% (Armstrong et al., 2021) and therefore deemed to be below the daily recommendations for LCn-3PUFA intake for healthy adults (~500 mg / day EPA + DHA; Vannice & Rasmussen, 2014). In turn, Armstrong et al. (2021) also reported an elevated whole blood arachidonic acid (AA) to EPA ratio (AA/EPA), which is a marker of inflammation potential and ideally should be < 11. Excessively high AA/EPA has also been previously reported in a cohort of college NFL athletes by Larkin et al. (2024), which was underpinned by a combination of elevated whole blood AA (omega-6) and low EPA (Larkin et al., 2024).
Australia is also categorised with a population O3I range from 4–6% (Schuchardt et al., 2024) and therefore indicative of partially meeting recommendations, such as the European Food Safety Authority, of a minimum 250 mg of DHA per day (European Food Safety Authority, 2012). Reflecting the disperse range of current guidelines, the population level intake is more likely equivalent to the Australian and New Zealand adequate
intake (medium) values for summed EPA, DHA and docosapentaenoic acid (DPA) which is 90 mg / day for females and 160 mg /day for males (National Health and Medical Research Council, 2006). In contrast, the International Olympic Committee has previously recommended 2000 mg per day of ‘omega-3 fatty acids’, which may be interpreted to includealphalinoleic acid (ALA) alongside EPA and DHA (Maughan et al., 2018). Notably, there are limited Australian studies describing the omega-3 status of young, healthy and physically active individuals (Sullivan et al., 2006) and include a cohort of Australian military recruits that returned a mean O3I between 5–6% (Peoples et al., 2022). Furthermore, there is currentlyonly one Australian study of elite male Australian Rules Football athletes, published more than a decadeearlier, that also reported avery low meanO3Iof3.6%(Buckleyetal.,2009).Itisthereforereasonable to hypothesise that an elite rugby professional football cohort, including both males and females, residing in Australia would also have an O3I reflective of a low LCn-3PUFA intake, but with a scarcity of O3I data of elite athletes residing in Australia, this has yet to be confirmed.
While these findings highlight a suboptimal omega-3 status in athletes of both sexes, the increasing participation and professional opportunities for female athletes in elite rugby football reaffirm that understanding the intake LCn-3PUFA should have equal representation of males and females. Importantly, the dose (or intake) of LCn-3PUFA explains 68% of the final O3I status in response to an omega-3 supplement containing EPA and DHA. In contrast sex, body mass, baseline O3I, age and physical activity together account for 10% of the O3I response to an LCn-3PUFA intervention (Flock et al., 2013). Certainly, body mass is likely to be lower on average in female rugby athletes compared to their male equivalents, and this would in theory favour females to be higher in omega-3 status, for the same given nutritional exposure or intake of LCn-3PUFA. Notwithstanding this theoretical advantage, it is predicted that usual intake over the longer period (whole food or supplement) will be the primary determinant of difference and not sex or anthropometry per se and this may indeed result in differences between males and females depending on their performance environment. The second objective of this study was to consequently have an equal and equivalent representation of male and female rugby football athletes with the aim of being able to describe both the sexes.
Therefore, this cross-sectional study of elite professional rugby athletes in Australia, aimed to evaluate the O3I which is indicative of sustained EPA and DHA intake and therefore membrane incorporation of these LCn-3PUFAs. As this cohort resided in Australia, it was hypothesised that their overall omega-3 status would be reflective of the background population with only a minority of the athletes achieving an O3I > 8% and furthermore there would be no difference between the males and females.
2. Methods
2.1. Study design and participants
The study was a cross-sectional design completed during 2023. The volunteer participants were professional athletes as part of
Rugby Australia (RA) and the National Rugby League (NRL), which represented the national and international status of the playing group. Male and female athletes were recruited from within their training environment, prior to or just at the commencement of their competition period specific to their team. The study details were presented to the entire squads with exclusion criteria set for those that were currently not competing due to injury. The study was reviewed and approved by the University of Wollongong Human Research Ethics Committee (HE_2023/147) and was conducted in accordance with the Declaration of Helsinki. Accordingly, each participant provided informed written consent.
2.2. Fatty acid profile and Omega-3 Index
Each athlete provided a blood sample (non-fasted) using the finger prick method. They were instructed not to consume any form of omega-3 supplement on the day of blood collection. A drop of blood was spotted onto the commercially available collection card for independent analysis (Fatty Acid Labs, Victoria, Australia). Each fatty acid in this whole blood sample was individually identified using high quality standards and then described as a relative percentage (%) of all the fatty acids. The O3I, a marker of heart muscle, skeletal muscle and brain membrane incorporation, was then calculated according to a validated algorithm (r = 0.96) (Harris & Polreis, 2016). Furthermore, the AA/EPA ratio was calculated from whole blood, with the premise of reducing this ratio to < 11 and in turn the production of inflammatory prostanoids (Wada et al., 2007), most commonly linked to reduced systemic inflammation (Rupp et al., 2004).
2.3. Diet survey
Each athlete was asked to independently respond to several questions regarding usual LCn-3PUFA intake in the 3 months prior to the blood sample. These survey questions were sent directly the participant using and electronic survey tool (REDcap, project-redcap.org) to limit influence from performance team expectations. These were derived from a previously validated Australian survey (Dickinson et al., 2015) and consisted of two components which sought to capture LCn3PUFA intake from; (i) dietary supplementation, and (ii) dietary food intake. The first component on supplement intake included additional questions on supplement brand, duration of supplementation, frequency of consumption and quantity consumed. From these questions, a daily intake of mg EPA + DHA was calculated. The second component on dietary food intake asked about how many portions of fish were consumed per week and included a follow up question on most common type of fish consumed (multiple selections were allowed). The EPA + DHA content of each serve (85 g) of fish type was obtained from the Australian Food Composition Database. Where multiple fish types were selected by participants, the EPA + DHA content was averaged. Finally, the total daily intake of mg EPA + DHA from supplementation and food intake was determined for each participant.
2.4. Statistical analysis
It was determined that a total sample size of n = 32 would allow comparison based upon equal representation of rugby code and sex (50/50), whereby a minimum detectable difference in the O3I of 2.0% (population mean O3I = 4.8%; SD = 1.0%) would be detectable (power calculation0.80; p <0.05). Atwo-way repeated measures analysis of variance (ANOVA) was used, with sex (male, female) and code (NRL, RA) main effects, and sex × code interaction (α = 0.05; Prism 10.3, GraphPad). Where a significant interaction was established, a post hoc Tukey analysis was conducted for comparisons of individual means.
The relationship between EPA + DHA intake (mg/d) and blood fatty acid levels were analysed categorically and continuously by simple linear regression. Self-reported intake categories were defined as; (i) < 100 mg/d; (ii) 100–500 mg/d and (iii) > 500 mg/d, corresponding to common descriptions of (i) not meeting the Australian Adequate Intake (medium) recommendations (National Health and Medical Research Council, 2006); (ii) meeting the Australian Adequate Intake (medium) recommendations but not exceeding the Academy of Nutrition and Dietetics (Vannice & Rasmussen, 2014) and (iii) exceeding recommendations for healthy adults proposed by most authoritative bodies, including Academy of Nutrition and Dietetics. A one-way ANOVA was used for categorical analysis (α = 0.05). Where a significant difference was established, a post hoc Tukey analysis was conducted for comparisons of individual means. Data are reported as means (95% confidence intervals).
3. Results
3.1. Participants
A total of 100 athletes (NRL, n = 53, 45% female; RA, n = 47, 64% female) were recruited (90% recruitment rate) into the study and included in the analysis. There was no difference in the age of the male (25 years; 95% CI [24, 26]) and the female participants (24 years; 95% CI [23, 25]), p = 0.324. However, the males were heavier in body mass (103 kg; 95% CI [100, 106]) compared to the females (78 kg; 95% CI [75, 81], p < 0.001.
3.2. Fatty acid profile and Omega-3 Index
The combined cohort O3I mean was 5.38% (95% CI [5.15, 5.60]) and the median O3I was 5.16% (95% CI [4.92, 5.51]). In addition, the whole blood mean and median AA:EPA ratio was 13.21 (95% CI [12.28, 14.14]) and 13.50 (95% CI [11.60, 14.40]), respectively. Independent of sex, there were no significant differences between rugby codes for O3I (NRL 5.58%; 95% CI [5.20, 5.76] vs. RA 5.25%; 95% CI [4.90, 5.61], p = 0.983) or AA/EPA ratio (NRL 12.57; 95% CI [11.34, 13.80] vs. RA 13.94; 95% CI [12.51, 15.37], p =0.375) Notably, only two athletes (2%) in the entire cohort returned anO3I above 8%. In terms of specific individual fatty acids, a main effect of sex was evident for linoleic acid(LA),AA,alpha-linolenicacid(ALA),EPAandDHA(Table 1). As a consequence, this main effect of sex included the total sum of omega-6 and omega-3 fatty acids but not saturated fatty acids or monounsaturated fatty acids (Table 1)
et al. / The Journal of
Table 1: Whole blood fatty acids (abbreviation, chemical notation) of National Rugby League (n = 53, 45% female) and Rugby Australia (n = 47, 64% female) athletes according to sex.
National Rugby League
Rugby Australia
Omega-6 fatty acids
acid (LA, 18:2n6)
[33.19, 35.14]
Arachidonic acid (AA, 20:4n6) 9.25 [8.90, 9.61] 8.88 [8.33, 9.43] 9.98 [9.06, 10.91] 9.19 [8.79, 9.59] 0.024
[6.22,
Omega-3 ratio 5.30 [5.00, 5.61] 6.93 [6.46, 7.40] 5.68 [5.02, 6.33] 6.99 [6.70, 7.28] <
With rugby codes combined, male athletes had a significantly higher O3I compared to female athletes (male, 6.06%; 95% CI [5.89, 6.23]; female, 4.79%; 95% CI [4.56, 5.02], p < 0.001) and the male athletes had a significantly lower AA/EPA ratio compared to female athletes (male, 11.44; 95% CI [1.48, 21.40]; female, 14.90; 95% CI [14.76, 15.04], p = 0.001) (Figure 1).
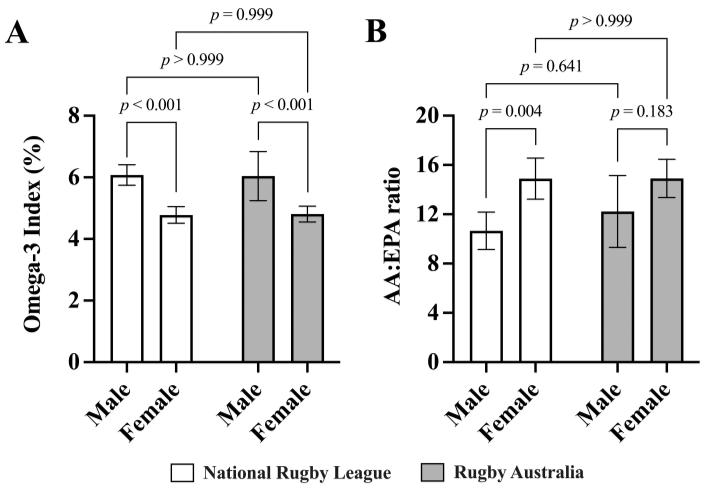
Figure 1: The Omega-3 Index (A) and whole blood Arachidonic acid to Eicosapentaenoic acid (AA/EPA) ratio (B) of elite National Rugby League (n = 53; 45% female) and Rugby Australia (n = 47; 64% female) athletes. Two-way repeatedmeasures ANOVA (corrected for multiple comparisons using the Tukey procedure). Bar graphs represent means. Error bars indicate the upper and lower limits of the 95% confidence intervals (CI).
3.3. Self-reported omega-3 intake and supplement use
Four participants did not successfully complete the omega-3 intake survey, resulting in n = 96 (56% female) for self-reported analysis. During the 3 months prior to the blood sample, 36% of male athletes and 28% of female athletes self-reported consuming fish on a weekly basis, whereas 74% of male athletes and 4% of female athletes self-reported consuming an omega-3 supplement, also on a weekly basis.
Self-reported EPA + DHA intake (mg/d) was correlated with O3I (R2 = 0.458, p < 0.001), whole blood EPA % (R2 = 0.463, p < 0.001) and whole blood DHA % (R2 = 0.353, p < 0.001), but not with whole blood AA % (R2 = 0.005, p = 0.513). Independent of rugby code, the self-reported daily intake of LCn-3PUFA (median, inter-quartile range [IQR]) was higher in males (median = 493 mg/day; IQR = 343,1095) compared to females (median = 18 mg / day; IQR = 1,180) (p < 0.001). When blood values were compared to self-reported intake according to recommendation categories, there were no significant differences between the < 100 mg/d (n = 42) and 100–500 mg/d (n = 30) categories for any fatty acid (Figure 2). O3I, whole blood EPA % and whole blood DHA % were significantly higher in the > 500 mg/d (n = 24) category compared to < 100 mg/d and 100–500 mg/d (Figure 2). There were no differences in whole blood AA across any of the intake categories.
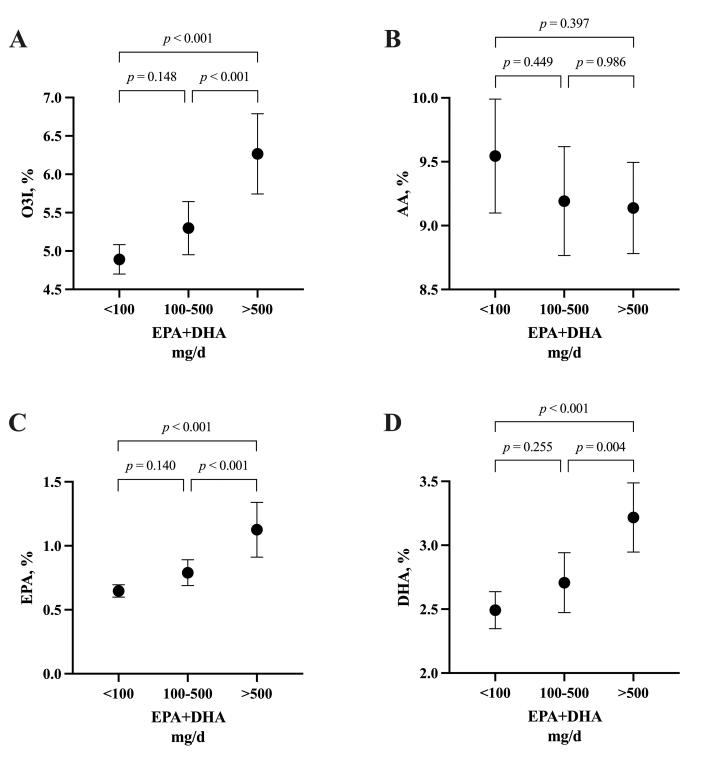
Figure 2: The Omega-3 Index (A) and Arachidonic acid (B), Eicosapentaenoic acid (C) and Docosahexaenoic acid (D) according to self-reported EPA+DHA intake categories (< 100 mg/day; n = 42, 100–500 mg/day; n = 30, > 500 mg/day; n = 24) from a total of n = 96 elite National Rugby League and Rugby Australia athletes. One-way ANOVA (corrected for multiple comparisons using the Tukey procedure). Filled dots represent means. Error bars indicate the upper and lower limits of the 95% confidence intervals (CI).
4. Discussion
This is the first observational study to describe the omega-3 status of Australian elite rugby football athletes which included an equivalent representative sample of female players. The fatty acid profile of this cohort was representative of the LCn-3PUFA dietary intake in the 3 months to when blood sampling took place at the commencement of their competition cycle. There were several key themes to emerge from this cross-sectional study that are contextually important for physiological durability and health requirements of these contact sport athletes.
Regardless of rugby football code, this study revealed that these elite Australian athletes had a suboptimal O3I of 5.38% (mean) and 5.16% (median) where the recognised target, in terms of cardiac tissue is > 8% (Harris, 2010) and also indicative of consistent LCn-3PUFA intake over the long term (Anthony et al., 2024b).
In line with our first hypothesis, it was clear from the O3I biomarker that only a small proportion of these professional athletes were consuming LCn-3PUFA as recommended by Academy of Nutrition and Dietetics (Vannice & Rasmussen, 2014). Notwithstanding, the Australian and New Zealand adequate intake values for summed EPA, DHA and docosapentaenoic acid (DPA) is much lower at 90 mg / day for
incorporate LCn-3PUFA to much higher levels in the tissues, highlights the need for educating these athletes about whole food and supplemental sources of EPA and DHA to support their physiological health, particularly female athletes. Of note, we have recently piloted and omega-3 education session for elite female rugby players, which included advice for daily intake and ad libitum fish oil supplement access with target EPA + DHA goals. As a team, there was significant overall improvements in both the O3I and the AA/EPA over the season; however, some athlete’s omega-3 status was not modified, most likely due to consistency of intake (Anthony, et al., 2024a). This highlights the challenge of translating optimal LCn-3PUFA intake into professional athletes’ diets, most likely attested to compliance factors linked to individual dietary and supplementation preferences.
There are several limitations to this study that deserve acknowledgment. First, our study is focused on elite rugby football athletes which limits the generalisability of the findings to other elite athlete groups residing in Australia. Given that there was a tendency for the O3I in this current study to be higher on average that those studies from North America, there is a valid reason for screening a large cohort Australian athletes across a wide range of sports to confirm this current observation. Second, we had to rely upon self-reported dietary data from a series of validated although brief questions, that may increase the potential for recall and reporting biases where our outcomes are related to diet and supplement behaviour. Although our choice of questions were derived from validated questionnaires, there is some opportunity to explore these questions relative to athlete populations in a Delphi-style analysis or indeed food records. Finally, our sample was collected at only one time point in the competition year, albeit at an equivalent period of the competition cycle, meaning that there may be some further variation to the overall omega-3 status if they were sampled, for example, in the off-season and this would provide opportunity for sports dietitians to time the duration of the omega-3 program to ensure sustained incorporation over the season.
In conclusion, using blood biomarker testing, it has been revealed that elite Australian rugby football athletes, including an equivalent representation of females, typically are suboptimal for their LCn-3PUFA intake, reflective of the wider Australian population. Most importantly, the increasing participation and professional opportunities for female athletes across the globe, coupled with the physical demands of high-intensity contact sports like rugby football, underscore the necessity of engaging both male and female athletes in a program that emphasises EPA and DHA intake via whole food and/or supplementation. For all athletes, monitoring of the O3I blood biomarker is a unique and emerging opportunity in the performance nutrition environment to support their long-term physiological durability and health.
Conflict of Interest
The authors declare no conflict of interests.
Acknowledgment
The authors thanktheathletesand team supportstaff for theirtime and contribution to this study.
References
Anthony, R., Jaffrey, N., Byron, C., Peoples, G. E., & Macartney, M. J. (2024a). Omega-3 status evaluation in Australian female rugby league athletes: Ad libitum fish oil provision results in a varied Omega-3 Index. International Journal of Sport Nutrition and Exercise Metabolism, 34(4), 218–222. https://doi.org/10.1123/ijsnem.2023-0257
Anthony, R., Macartney, M. J., Heileson, J. L., McLennan, P. L., & Peoples, G. E. (2024b). A review and evaluation of study design considerations for omega-3 fatty acid supplementation trials in physically trained participants. Nutrition Research Review, 37(1), 1–13. https://doi.org/10.1017/S095442242300001X
Anthony, R., Macartney, M. J., & Peoples, G. E. (2021). The Influence of long-chain omega-3 fatty acids on eccentric exercise-induced delayed muscle soreness: Reported outcomes are compromised by study design issues. International Journal of Sport Nutrition and Exercise Metabolism, 31(2), 143–153. https://doi.org/10.1123/ijsnem.2020-0238
Anzalone, A., Carbuhn, A., Jones, L., Gallop, A., Smith, A., Johnson, P., Swearingen, L , Moore, C , Rimer, E , McBeth, J , Harris, W , Kirk K M , Gable, D , Askow, A , Jennings, W , Oliver, J. M. (2019). The Omega-3 Index in National Collegiate Athletic Association division I collegiate football athletes. Journal of Athletic Training, 54(1), 7–11. https://doi.org/10.4085/1062-6050-387-18
Armstrong, A., Anzalone, A. J., Pethick, W., Murray, H., Dahlquist, D. T., Askow, A. T., Heileson, J. L., Hillyer, L. M., Ma, D W L , Oliver, J. M. (2021). An evaluation of omega-3 status and intake in Canadian elite rugby 7s players. Nutrients, 13(11), 1–10 https://doi.org/10.3390/nu13113777
Black, K. E., Hindle, C., McLay-Cooke, R., Brown, R. C., Gibson, C., Baker, D. F., & Smith, B. (2019). Dietary intakes differ by body composition goals: An observational study of professional rugby union players in New Zealand. American Journal of Mens’ Health, 13(6), 1557988319891350. https://doi.org/10.1177/1557988319891350
Black, K. E., Witard, O. C., Baker, D., Healey, P., Lewis, V., Tavares, F., Christensen, S , Pease, T , Smith, B. (2018). Adding omega-3 fatty acids to a protein-based supplement during pre-season training results in reduced muscle soreness and the better maintenance of explosive power in professional rugby union players. European Journal of Sport Science, 18(10), 1357–1367. https://doi.org/10.1080/17461391.2018.1491626
Buckley, J., Burgess, S., Murphy, K., & Howe, P. (2009). DHArich fish oil lowers heart rate during submaximal exercise in elite Australian Rules footballers. Journal of Science and Medicine in Sport, 12, 503–507.
Craddock, J. C., Probst, Y. C., Neale, E. P., & Peoples, G. E. (2022). A cross-sectional comparison of the whole blood fatty acid profile and Omega-3 Index of male vegan and omnivorous endurance athletes. Journal of the American College of Nutrition, 41(3), 333–341. https://10.1080/07315724.2021.1886196
Decsi, T., & Kennedy, K. (2011). Sex-specific differences in essential fatty acid metabolism. American Journal of Clinical
Peoples et al. / The Journal of Sport and Exercise Science, Journal Vol. 9, Issue 1, 12-20 (2025)
Nutrition, 94(6 Suppl), 1914s–1919s. https://doi.org/10.3945/ajcn.110.000893
Dickinson, K. M., Delaney, C. L., Allan, R., Spark, I., & Miller, M. D. (2015). Validation of a brief dietary assessment tool for estimating dietary EPA and DHA intake in Australian adults at risk of cardiovascular disease. Journal of the American College of Nutrition, 34(4), 333–339. https://doi.org/10.1080/07315724.2014.962191
Drobnic, F., Rueda, F., Pons, V., Banquells, M., Cordobilla, B., & Domingo, J. C. (2017). Erythrocyte omega-3 fatty acid content in elite athletes in response to omega-3 supplementation: A dose-response pilot study. Journal of Lipids, 1–7. https://doi.org/10.1155/2017/1472719
European Food Safety Authority. (2012). Scientific opinion on the tolerable upper intake level of eicosapentaenoic acid (EPA), docosahexaenoic acid (DHA) and docosapentaenoic acid (DPA). EFSA Journal, 10(7), 1–48 https://doi.org/10.2903/j.efsa.2012.2815
Flock, M., Skulas-Ray, A., Harris, W., Etherton, T., Fleming, J., & Kris-Etherton, P. (2013). Determinants of erythrocyte omega-3 fatty acid content in response to fish oil supplementation: A dose–response randomized controlled trial. Journal of American Heart Association, 2, 1–13
Harris, W. S. (2010). The Omega-3 Index: Clinical utility for therapeutic intervention. Current Cardiology Reports, 12(6), 503–508. https://doi.org/10.1007/s11886-010-0141-6
Harris, W. S., & Polreis, J. (2016). Measurement of the Omega-3 Index in dried blood spots. Annals of Clinical and Laboratory Research, 4(4), 1–7
Harris, W. S., & von Schacky, C. (2004). The Omega-3 Index: A new risk factor for death from coronary heart disease? Preventive Medicine, 39(1), 212–220. http://doi.org/10.1016/j.ypmed.2004.02.030
Heileson, J. L., Anzalone, A. J., Carbuhn, A. F., Askow, A. T., Stone, J. D., Turner, S. M., Hillyer, S. M., Ma, D. W. L., Luedke, J. A., Jagim, A. R., Oliver, J. M. (2021). The effect of omega-3 fatty acids on a biomarker of head trauma in NCAA football athletes: A multi-site, non-randomized study. Journal of the International Society of Sports Nutrition, 18(1), 65. https://doi.org/10.1186/s12970-021-00461-1
Heileson, J. L., Macartney, M. J., Watson, N. L., Sergi, T. E., Jagim, A. R., Anthony, R., & Peoples, G. E. (2024). Nutritional optimization for brain health in contact sports: a systematic review and meta-analysis on long-chain ω-3 fatty acids and neurofilament light. Current Developments in Nutrition, 8 (1), 1–13 https://doi.org/10.1016/j.cdnut.2024.104454
Hooks, M. P., Madigan, S. M., Woodside, J. V., & Nugent, A. P. (2023). Dietary intake, biological status, and barriers towards omega-3 intake in elite level (Tier 4), female athletes: Pilot study. Nutrients, 15(13), 1–12. https://doi.org/10.3390/nu15132821
Larkin, T. A., McKay, B., Sampson, J. A., Delaney, J., Murray, A., Pedlar, C. R., Lewis, N. A., Peoples, G. E. (2024). A low Omega-3 Index and high AA/EPA ratio in American College football players are both improved following 5 weeks of DHA-rich algae oil supplementation. Journal of Science in Sport and Exercise https://doi.org/10.1007/s42978-02300272-7
Lewis, N. A., Daniels, D., Calder, P. C., Castell, L. M., & Pedlar, C. R. (2020). Are there benefits from the use of fish oil supplements in athletes? A Systematic Review. Advances in Nutrition, 11(5), 1300–1314. https://doi.org/10.1093/advances/nmaa050
Macartney, M. J., Hesseling, M., Ortolano, R., McLennan, P. L., & Peoples, G. E. (2023). Assessing the Omega-3 Index of a professional cycling team and the influence of ad libitum provision of fish oil during the competitive season. The Journal of Sport and Exercise Science, 7(2), 38–45. https://doi.org/10.36905/jses.2023.02.05
Macartney, M. J., Peoples, G. E., Treweek, T. M., & McLennan, P. L. (2019). Docosahexaenoic acid varies in rat skeletal muscle membranes according to fibre type and provision of dietary fish oil. Prostaglandins Leukotrienes and Essential Fatty Acids, 151, 37–44. https://doi.org/10.1016/j.plefa.2019.08.006
Maughan, R. J., Burke, L. M., Dvorak, J., Larson-Meyer, D. E., Peeling,P.,Phillips,S.M., Rawson,E S ,Walsh,N P ,Garthe, I., Geyer, H., Meeusen, R., van Loon, L., Shirreffs, S. M., Spriet, L L , Stuart, M , Vernec, A , Currell, K , Ali, V M , Budgett, R. G. M., Ljungqvist, A., Mountjoy, M., Pitsiladis, Y , Soligard, T , Erdener, U , Engebretsen, L. (2018). IOC consensus statement: Dietary supplements and the highperformance athlete. British Journal of Sports Medicine, 52(7), 439–455. https://doi.org/10.1136/bjsports-2018-099027
McGlory, C., Galloway, S. D. R., Hamilton, D. L., McClintock, C., Breen, L., Dick, J. R., Bell, J. G., Tipton, K. D. (2014). Temporal changes in human skeletal muscle and blood lipid composition with fish oil supplementation. Prostaglandins Leukotrienes and Essential Fatty Acids, 90(6), 199–206. https://doi.org/10.1016/j.plefa.2014.03.001
National Health and Medical Research Council. (2006). Nutrient reference values for Australia and New Zealand: Executive summary Australian Government, Department of Health and Ageing https://www.nhmrc.gov.au/sites/default/files/images/Nutrient -reference-aus-nz-executive-summary.pdf
Peoples, G. E., Larsen, P., Bowes, H. M., Coombes, J., Drain, J. R., Groeller, H., & McLennan, P. L. (2022). The influence of a basic military training diet on whole blood fatty acid profile and the Omega-3 Index of Australian Army recruits. Applied Physiology, Nutrition, and Metabolism, 47(2), 151–158. https://doi.org/10.1139/apnm-2021-0459
Peoples, G. E., & McLennan, P. L. (2016). Fish oil for physical performance in athletes. In S. Raatz, & D. Bibus (Eds.), Fish and Fish Oils in Health and Disease (pp. 119–136). Elsevier Inc.
Rawson, E. S., Miles, M. P., & Larson-Meyer, D. E. (2018). Dietary supplements for health, adaptation, and recovery in athletes. International Journal of Sport Nutrition and Exercise Metabolism, 28(2), 188–199. https://doi.org/10.1123/ijsnem.2017-0340
Ritz, P. P., Rogers, M. B., Zabinsky, J. S., Hedrick, V. E., Rockwell, J. A., Rimer, E. G.,Kostelnik, S. B., Hulver, M.W., Rockwell, M. S. (2020). Dietary and biological assessment of the omega-3 status of collegiate athletes: A cross-sectional analysis. PLoS ONE, 15(4), 1–16. https://doi.org/10.1371/journal.pone.0228834
Peoples et al. / The Journal of Sport and Exercise Science, Journal Vol. 9, Issue 1, 12-20 (2025)
Rupp, H., Wagner, D., Rupp, T., Schulte, L. M., & Maisch, B. (2004). Risk stratification by the "EPA+DHA level" and the "EPA/AA ratio" focus on anti-inflammatory and antiarrhythmogenic effects of long-chain omega-3 fatty acids. Herz, 29(7), 673–685. https://doi.org/10.1007/s00059-0042602-4
Schuchardt, J. P., Beinhorn, P., Hu, X. F., Chan, H. M., Roke, K., Bernasconi, A., Hahn, A , Sala-Vila, A , Stark, K D , Harris, W. S. (2024). Omega-3 world map: 2024 update. Progress in Lipid Research, 1–17 https://doi.org/10.1016/j.plipres.2024.101286
Sullivan, B. L., Williams, P. G., &Meyer,B. J.(2006). Biomarker Validation of a Long-chain omega-3 polyunsaturated fatty acid food frequency questionnaire Lipids, 41(9), 845–850. Thielecke, F. & Blannin, A. (2020). Omega-3 fatty acids for sport performance are they equally beneficial for athletes and amateurs? A Narrative Review. Nutrients, 12(12), 1–28 https://doi.org/10.3390/nu12123712
Vafai, Y., Yeung, E., Roy, A., He, D., Li, M., Hinkle, S. N., Grobman, W. A., Newman, R., Gleason, J. L., Tekola-Ayele, F , Zhang, C , Grantz, K. L. (2023). The association between first-trimester omega-3 fatty acid supplementation and fetal
growth trajectories. American Journal of Obstetrics and Gynecology, 228(2), 224 e1–224.e16 https://doi.org/10.1016/j.ajog.2022.08.007
Vannice, G., & Rasmussen, H. (2014). Position of the Academy of Nutrition and Dietetics: Dietary fatty acids for healthy adults. Journal of the Academy of Nutrition and Dietetics, 114(1), 136–153. https://doi.org/10.1016/j.jand.2013.11.001
Wada, M., DeLong, C. J., Hong, Y. H., Rieke, C. J., Song, I., Sidhu, R. S., Yuan, C., Warnock, M., Schmaier, A. H., Yokoyama, C , Smyth, E M , Wilson, S J , FitzGerald, G A , Garavito, R. M.,Suide, X.,Regan, J.W., Smith, W. L.(2007). Enzymes and receptors of prostaglandin pathways with arachidonic acid-derived versus eicosapentaenoic acidderived substrates and products. Journal of Biological Chemistry, 282(31), 22254–22266. https://doi.org/10.1074/jbc.M703169200
Wilson, P. B., & Madrigal, L. A. (2016). Associations between whole blood and dietary omega-3 polyunsaturated fatty acid levels in collegiate athletes. International Journal of Sport Nutrition and Exercise Metabolism, 26(6), 497–505. https://doi.org/10.1123/ijsnem.2015-0316