2022 Annual market report

Senné presents its 2022 Annual Market Report. As your trusted real estate advisory firm resource, this comprehensive report includes a retrospective of the unique attributes of the urban and suburban neighborhoods within Boston and the Greater Boston area; Cambridge, Somerville, Arlington, and surrounding towns.
Header
2022 presented a fluctuating year for real estate in Massachusetts. To start, year-over-year price appreciation was at 19.2%, the highest rate to start a year in recorded history according to the US House Price Index. Bidding wars were at record highs, up to 70% of transactions in some markets, and 30% of buyers were cash buyers. The robust real estate market continued at a fast pace due to our strong economy, high rate of growth, higher wages, higher employment and higher spending allowing the housing market to continue to skyrocket during the 1st half of 2022.
During the second half of 2022, interest rates rose at an unprecedented clip from 3% to 6% in one year, additionally we experienced a volatile stock market, rising inflation and supply chain issues which all contributed to a slow down in the market. The Freddie Mac 30 year fixed rate closed out 2022 at 6.42% in stark contrast to January 2022 where rates were at 3.2%. This led to decreased affordability and poor consumer sentiment. As a result demand began to wane and supply increased leading to a shift in our market. While the significant mortgage rate increases have altered Buyers’ desire to buy and Sellers have chosen to remain in their homes as it is unclear where they would go next, we continue to observe strong trends across most market segments.
On a macro scale, the Massachusetts market, especially the Greater Boston region, is healthier than it has been in a long time. As Eastern Massachusetts remains at the forefront of the healthcare and technology industries, we have seen continued growth of new homeowners and interested parties to our region of Eastern Massachusetts, In addition, the continued strength of both the education and university sector has always been a foundation of the Greater Boston market. WIth the increased focus for homeowners on quality of life, we have seen and anticipate continued growth in the broader New England market.
Because trends vary significantly from town to town, we invite you to reach out to one of our knowledgeable Associates who have in-depth knowledge and connections in your neighborhood. At Senné, we look forward to continuing to be your valued real estate advisor at every stage of your real estate journey. Whether you are just starting out and looking to rent, ready to buy that first home, your next home, or investment property, our team is here to help you!
Stacey Reifer Managing Director, Residential Brokerage

Table of Contents
Boston
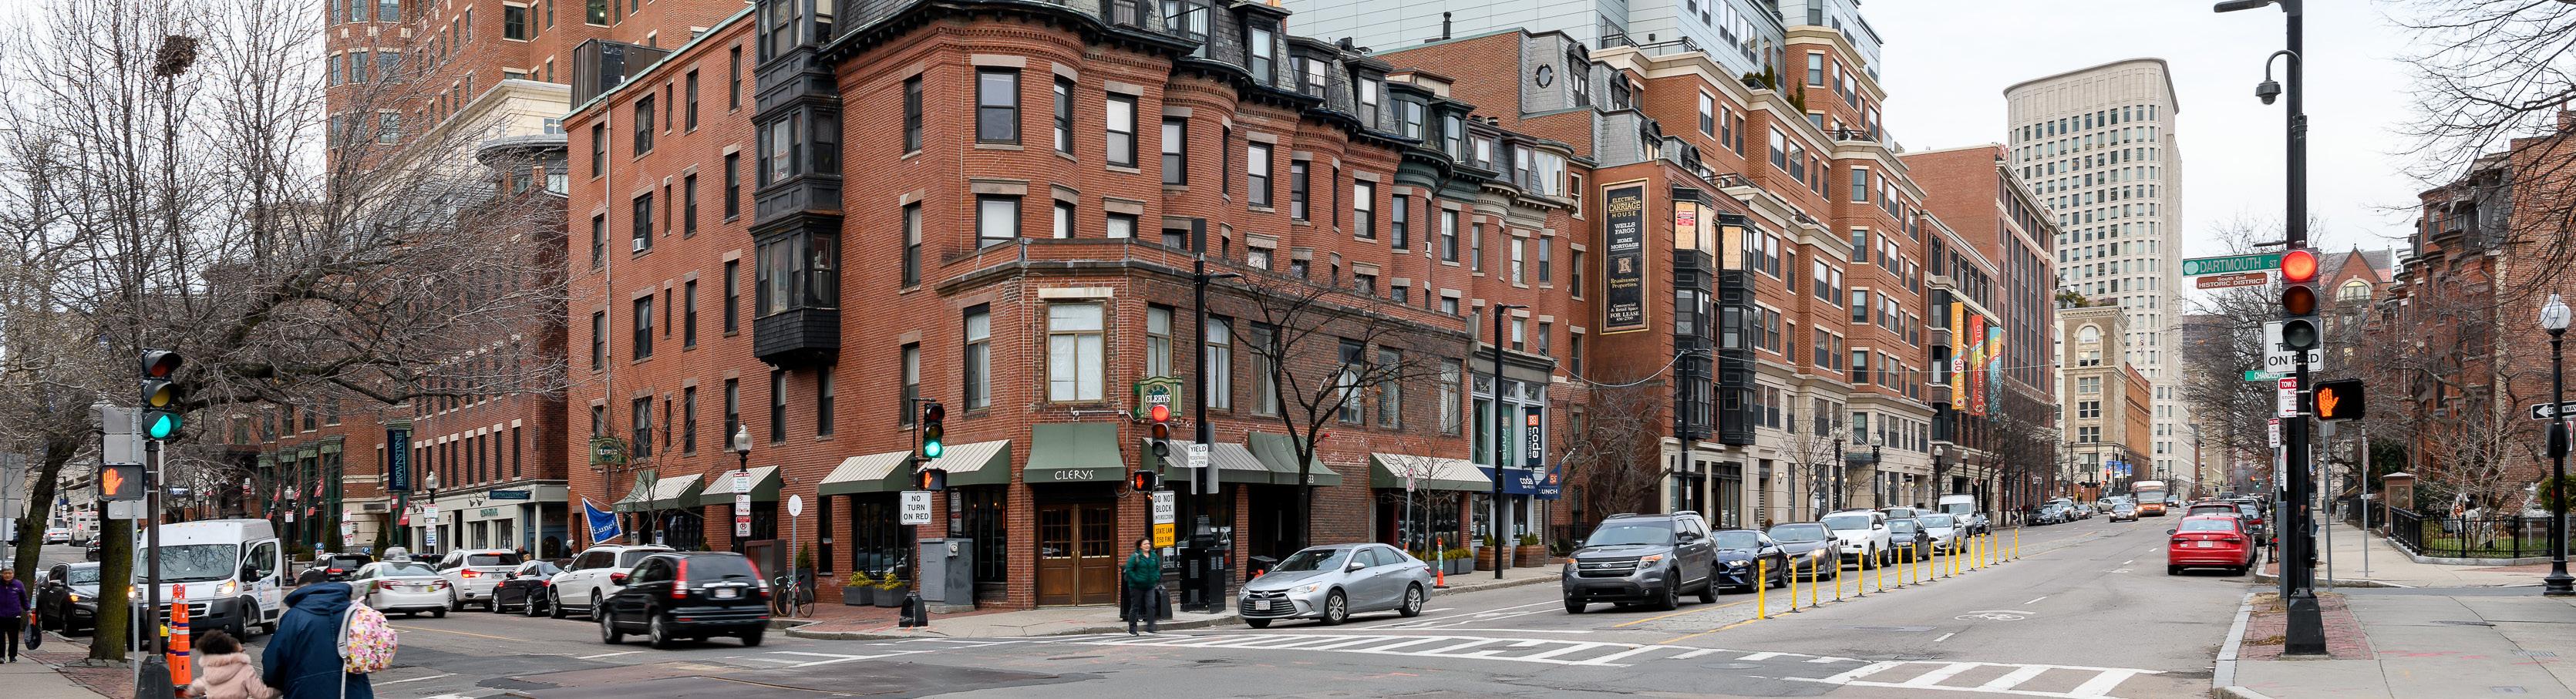
Back Bay
Beacon Hill

Charlestown
Dorchester
East Boston
Jamaica Plain
Midtown
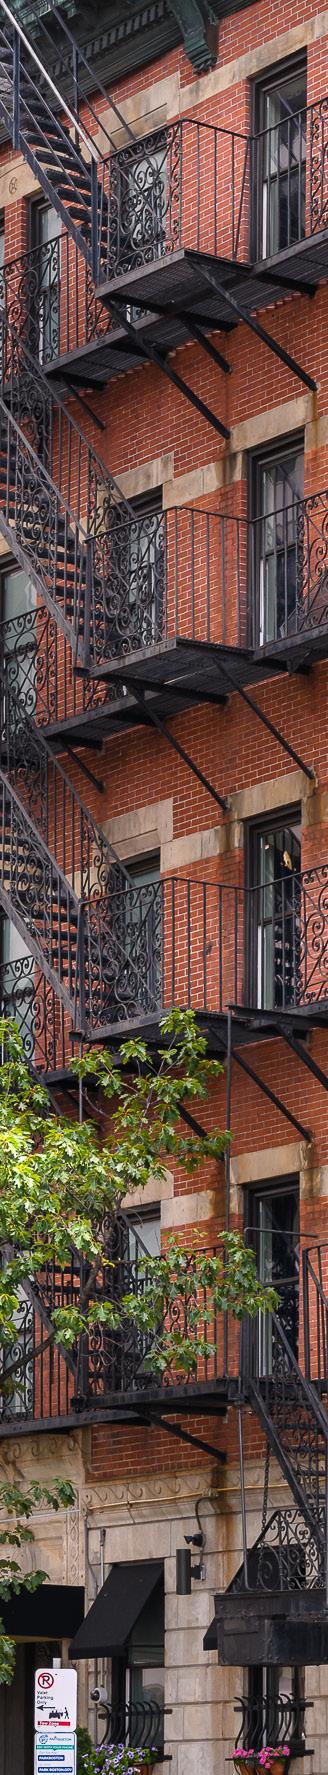
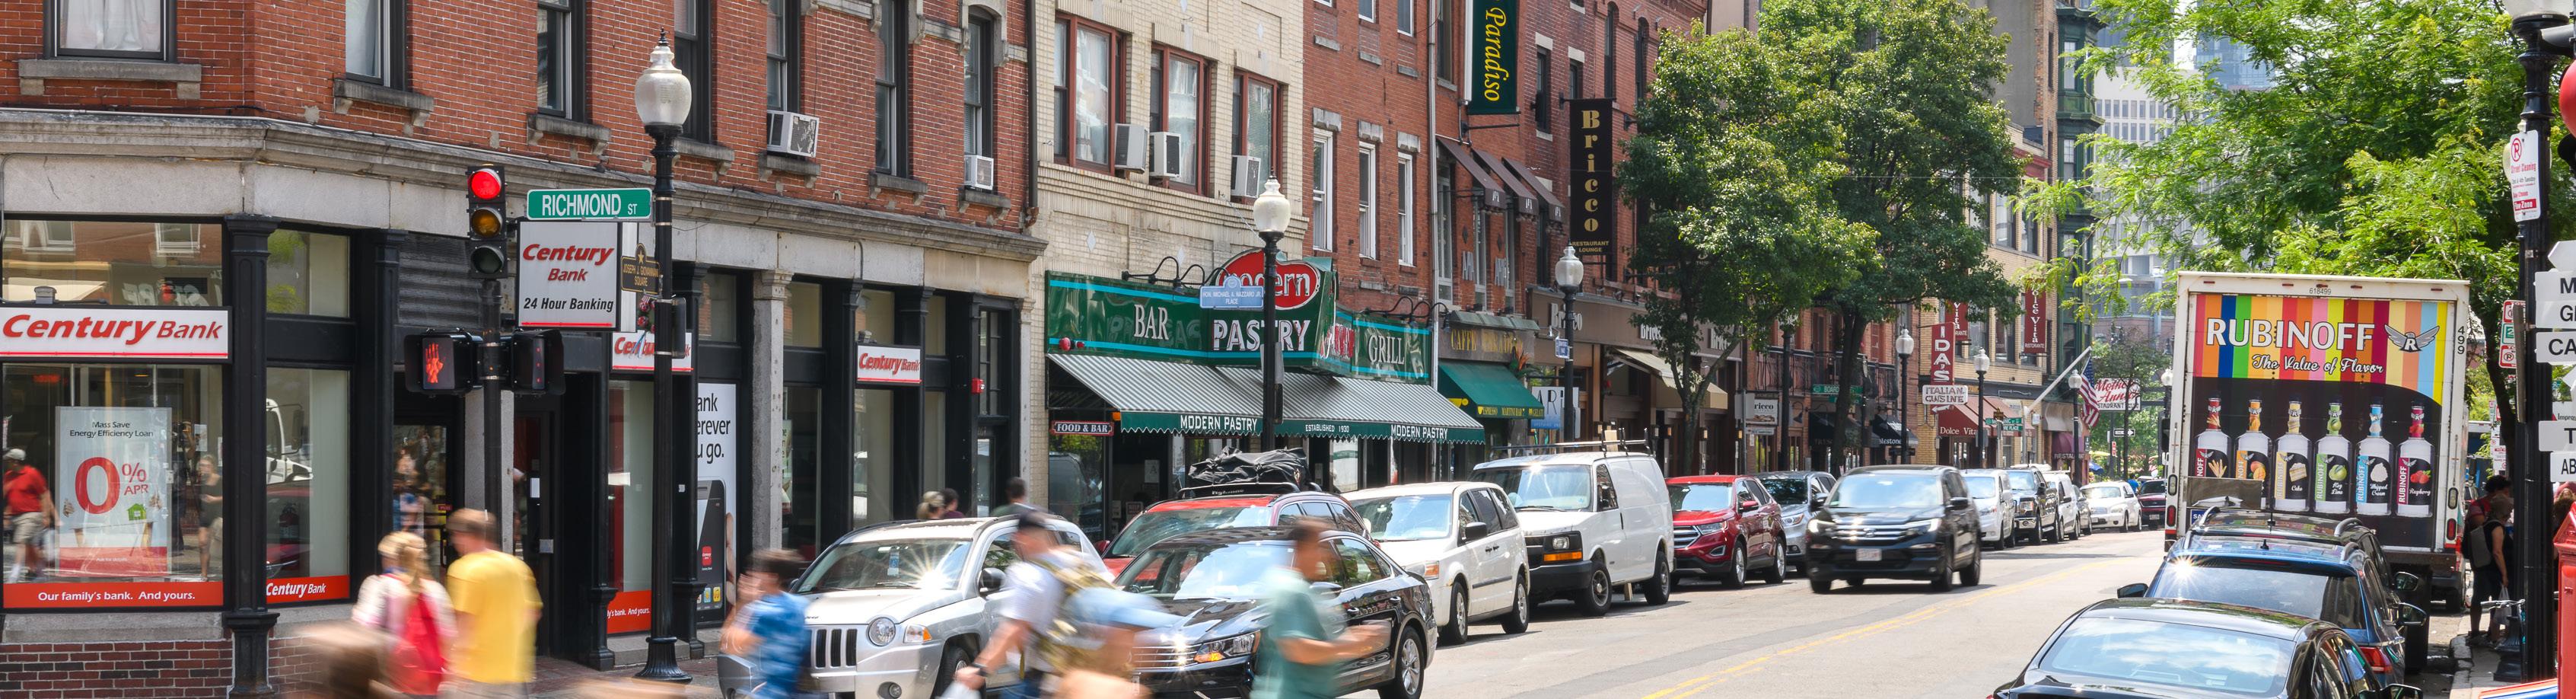
North End
Seaport
South Boston
South End
Waterfront
Greater Boston
Arlington
Belmont
Brookline
Cambridge
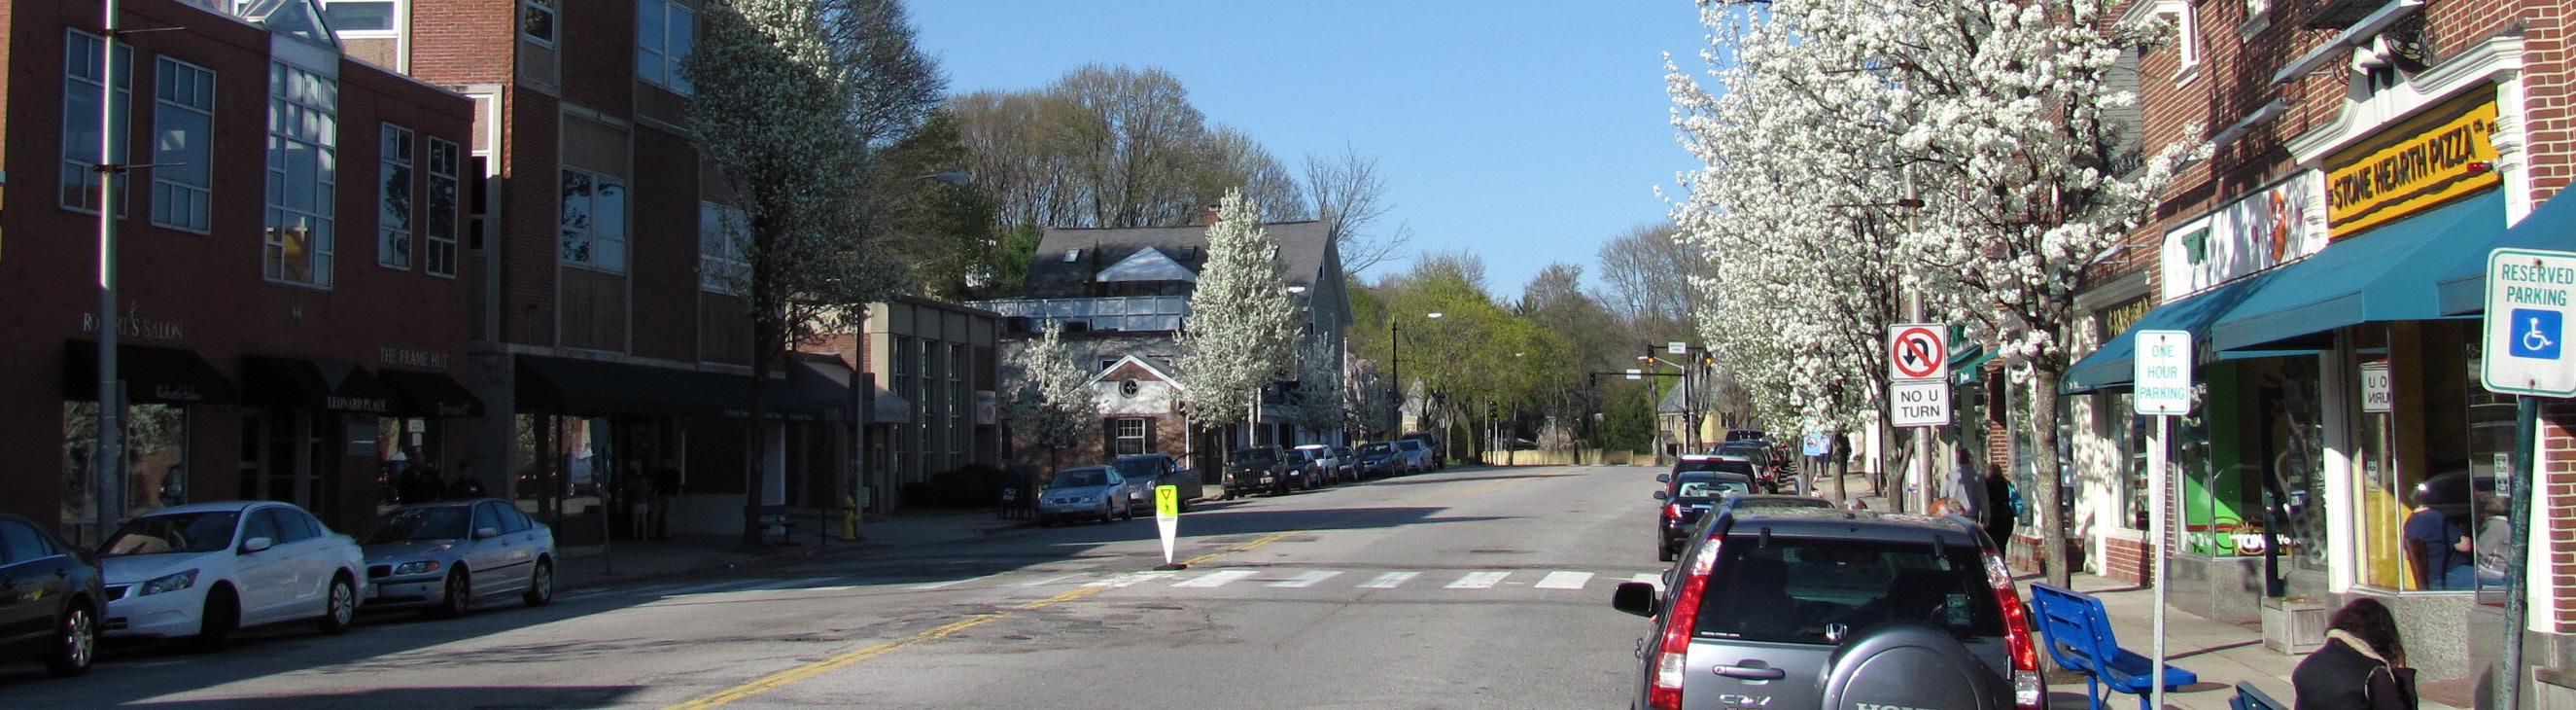
Concord
Lexington
Newton
Somerville
Sudbury
Waltham
Watertown
Wayland
Wellesley
Weston
Boston
A majority of Boston’s neighborhoods saw a decline in the number of transactions and an increase in sales prices. Citywide, the number of units sold decreased by roughly 12%. On the flip side, the median sales price increased roughly 5% and now sits at $725,000 while the average number of days on market decreased by one week, year-over-year. Keeping with the trends that we have been seeing for the past few years, the most competitive price point for buyers remains condos priced between $700,000 - $800,000. Homes sold on average in 24 days and for 100% of their asking price, leaving next to no room to negotiate.
As we look ahead to the coming year, experts are predicting a dynamic housing market in 2023, as the frenzied pace continues to slow down. Industry experts forecast a decline in long-term mortgage rates, but not a drop in asking prices. With median home prices in Boston well above the national average ($725,000 v. $428,000) investors were hardpressed to find bargains.
While buyers from all generations face the challenges of a tight real estate market, younger generations face steeper hurdles to homeownership.
Nationally, Millennials make up the largest share of homebuyers. In 2022, Millennials accounted for 67% of mortgage applications in the U.S. for first-home purchases (we expect this trend to continue) and 37% of those for repeat purchases.
However, in the Boston area, Millennials may feel the effects of the home-buying crunch. Millennial homebuyers place a premium on location, particularly a location that minimizes their commute to work.
Many in Generation Z have entered the home-buying market and home ownership is important to them. However, student loan burdens and early-career salaries often don’t keep pace with the rising cost of housing, so many will have to defer homeownership. Instead, they will turn to rentals.
According to National Association of Realtors, 74% of those aged 22 to 30 cited “convenience to the workplace” as the most important reason for choosing a particular neighborhood, and 65% of those buyers said that the quality of the neighborhood influenced their purchase.
This generation prioritizes amenities, especially those of the communal type, such as co-working spaces and fitness centers.
Individual communities experienced variations in the housing trends we’ve discussed above. We will explore the various communities within the Greater Boston area in more detail throughout this report.
According to a report from the National Association of


6 Real estate. Real results. Sennere.com Single Family 2022 2021 Var % Listed 10 12 -16.67% Sold 3 7 -57.14% DOM 117 114 2.63% Sales Price $4,787,500 $5,050,000 -5.20% Sales $ Per SqFt $1,029 $1,257 -18.12% Condo 2022 2021 Var % Listed 513 538 -4.65% Sold 324 386 -16.06% DOM 31 47 -34.04% Sales Price $1,320,000 $1,295,000 1.93% Sales $ Per SqFt $1,255 $1,187 5.73% Multi-Family 2022 2021 Var % Listed 23 23 0.00% Sold 7 9 -22.22% DOM 99 22 350% Sales Price $4,660,000 $5,800,000 -19.66% Sales $ Per SqFt $980.79 $993 -128%
2022 Annual market report
Boston Back Bay

7 Real estate. Real value. Sennere.com Single Family 2022 2021 Var % Listed 25 45 -44.44% Sold 28 29 -3.45% DOM 66 127 -48.03% Sales Price $3,562,500 $3,450,000 3.26% Sales $ Per SqFt $1,186 $1,265 -6.24% Condo 2022 2021 Var % Listed 223 250 -10.80% Sold 144 182 -20.88% DOM 30 35 -14.29% Sales Price $1,007,675 $910,000 10.73% Sales $ Per SqFt $1,204 $1,165 3.36% Multi-Family 2022 2021 Var % Listed 13 27 -51.85% Sold 5 8 -37.50% DOM 29 15 93.33% Sales Price $4,200,000 $4,041,360 3.93% Sales $ Per SqFt $940 $839 12.07%
Annual
Boston Beacon Hill 2022
market report

8 Real estate. Real results. Sennere.com Single Family 2022 2021 Var % Listed 78 79 -1.27% Sold 59 65 -9.23% DOM 14 17 -17.65% Sales Price $1,400,000 $1,300,000 7.69% Sales $ Per SqFt $741 $741 -0.04% Condo 2022 2021 Var % Listed 259 300 -13.67% Sold 205 266 -22.93% DOM 19 20 -5.00% Sales Price $835,000 $749,500 11.41% Sales $ Per SqFt $828 $777 6.53% Multi-Family 2022 2021 Var % Listed 17 29 -41.38% Sold 17 20 -15.00% DOM 23 25 -8.00% Sales Price $1,445,000 $1,312,500 10.10% Sales $ Per SqFt $620 $528 17.50%
Annual market
Boston Charlestown 2022
report

9 Real estate. Real people. Sennere.com Single Family 2022 2021 Var % Listed 83 92 -9.78% Sold 59 69 -14.49% DOM 23 22 4.55% Sales Price $775,000 $691,000 12.16% Sales $ Per SqFt $411 $351 17.03% Condo 2022 2021 Var % Listed 266 352 -24.43% Sold 216 253 -14.62% DOM 22 23 -4.35% Sales Price $559,500 $557,000 0.45% Sales $ Per SqFt $486 $484 0.38% Multi-Family 2022 2021 Var % Listed 185 129 43.41% Sold 105 87 20.69% DOM 22 23 -4.35% Sales Price $1,000,000 $1,025,000 -2.44% Sales $ Per SqFt $303 $296 2.46%
Boston Dorchester 2022 Annual market report

10 Real estate. Real results. Sennere.com Single Family 2022 2021 Var % Listed 15 23 -34.78% Sold 14 19 -26.32% DOM 26 21 23.81% Sales Price $652,500 $650,000 0.38% Sales $ Per SqFt $401 $472 -15.11% Condo 2022 2021 Var % Listed 239 333 -28.23% Sold 141 369 -61.79% DOM 31 49 -36.73% Sales Price $614,000 $680,900 -9.83% Sales $ Per SqFt $644 $788 -18.38% Multi-Family 2022 2021 Var % Listed 60 75 -20.00% Sold 47 40 17.50% DOM 30 23 30.43% Sales Price $932,500 $890,000 4.78% Sales $ Per SqFt $353 $322 9.84%
2022 Annual market report
Boston East Boston
Boston Jamacia Plain 2022
Annual market report

11 Real estate. Real solutions. Sennere.com Single Family 2022 2021 Var % Listed 80 96 -16.67% Sold 66 79 -16.46% DOM 18 15 20.00% Sales Price $1,187,500 $1,000,000 18.75% Sales $ Per SqFt $601 $566 6.27% Condo 2022 2021 Var % Listed 459 525 -12.57% Sold 364 470 -22.55% DOM 19 19 0.00% Sales Price $703,500 $679,475 3.54% Sales $ Per SqFt $617 $590 4.56% Multi-Family 2022 2021 Var % Listed 67 56 19.64% Sold 38 48 -20.83% DOM 33 23 43.48% Sales Price $1,352,500 $1,260,000 7.34% Sales $ Per SqFt $415 $427 -2.64%


12 Real estate. Real results. Sennere.com Single Family 2022 2021 Var % Listed 0 0 0% Sold 0 1 -100.00% DOM 0 91 -100.00% Sales Price $0 $1,050,000 -100.00% Sales $ Per SqFt $0 $562 -100.00% Condo 2022 2021 Var % Listed 181 151 19.87% Sold 79 85 -7.06% DOM 56 74 -24.32% Sales Price $1,367,500 $1,230,000 11.18% Sales $ Per SqFt $1,137 $1,059 7.37%
2022 Annual market report
Midtown Boston
13 Real estate. Real value. Sennere.com Single Family 2022 2021 Var % Listed 1 2 -50% Sold 0 2 -100% DOM 0 16 -100% Sales Price $0 $1,275,000 -100% Sales $ Per SqFt $0 $937 -100% Condo 2022 2021 Var % Listed 100 108 -7.41% Sold 70 89 -21.35% DOM 38 33 15.15% Sales Price $697,500 $637,000 9.50% Sales $ Per SqFt $993 $890 11.53% Multi-Family 2022 2021 Var % Listed 21 12 75.00% Sold 10 7 42.86% DOM 39 42 -7.14% Sales Price $2,452,500 $2,300,000 6.63% Sales $ Per SqFt $637 $566 12.49%
Boston North End 2022 Annual market report

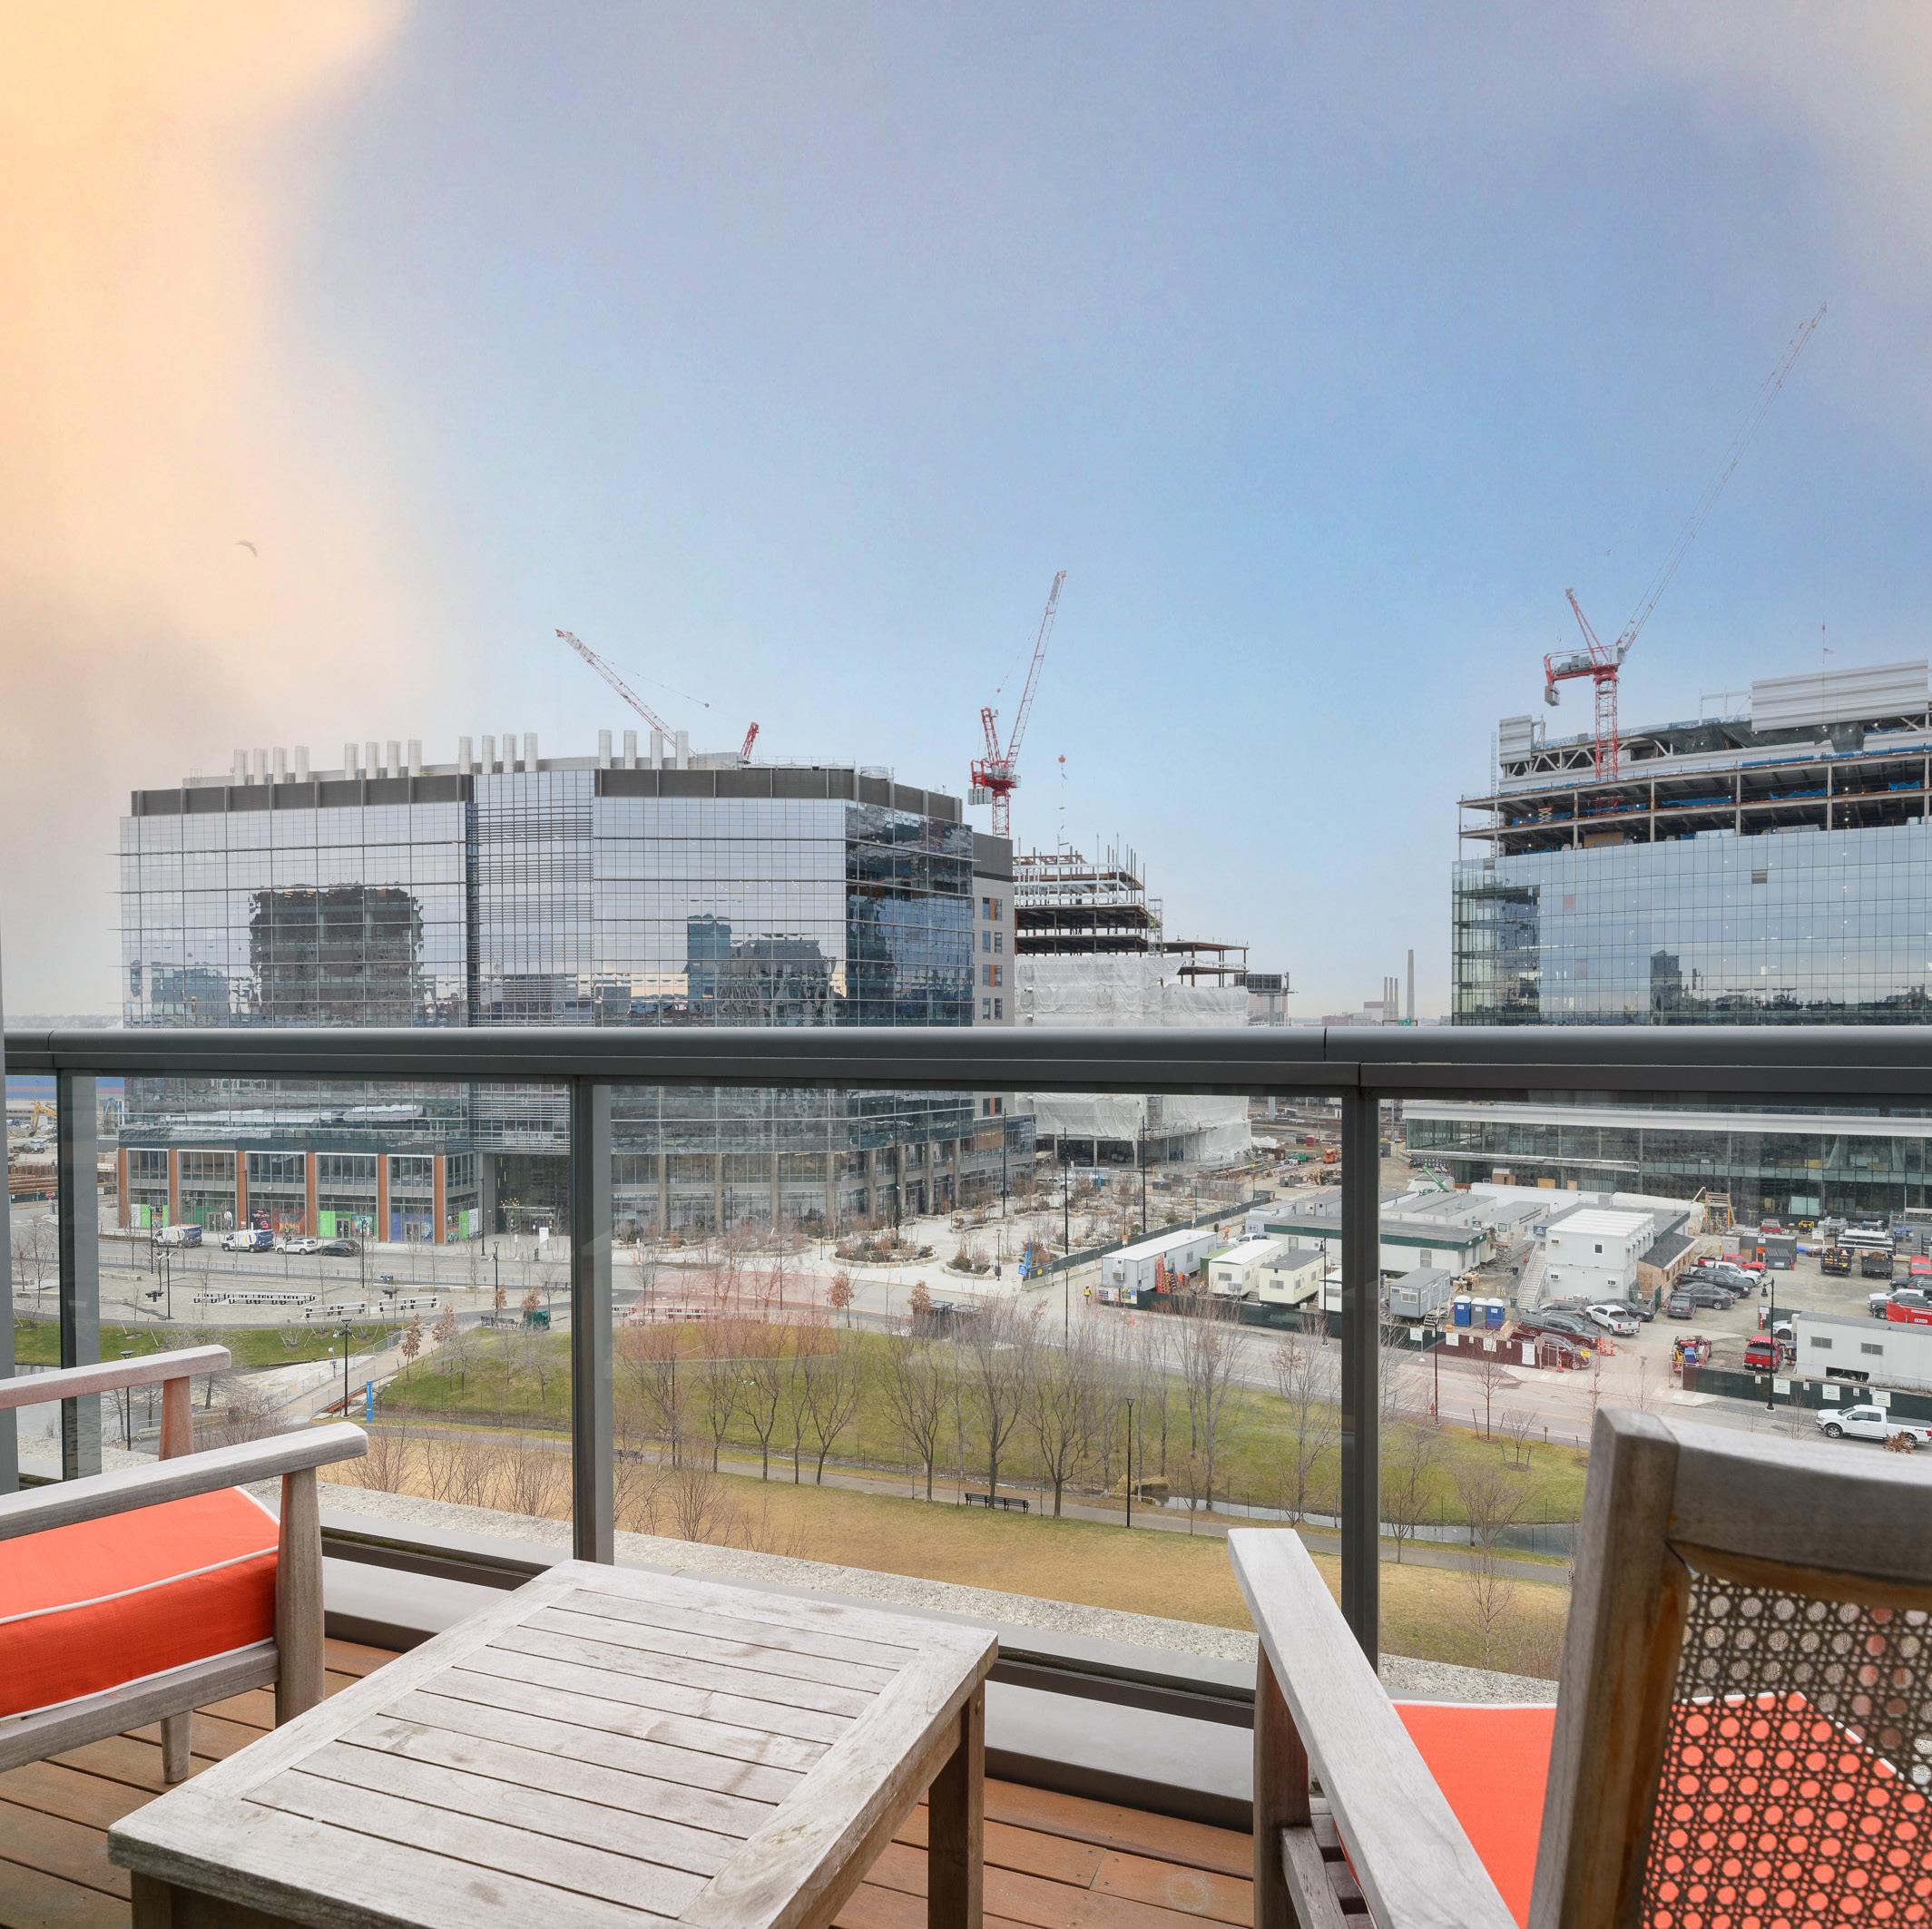
14 Real estate. Real results. Sennere.com Condo 2022 2021 Var % Listed 193 325 -40.62% Sold 117 198 -40.91% DOM 37 22 68.18% Sales Price $1,273,588 $1,615,250 -21.15% Sales $ Per SqFt $1,595 $1,611 -0.97% Seaport Boston 2022 Annual market report

15 Real estate. Real service. Sennere.com Single Family 2022 2021 Var % Listed 67 70 -4.29% Sold 41 55 -25.45% DOM 21 30 -30.00% Sales Price $1,050,000 $1,025,000 2.44% Sales $ Per SqFt $627 $601 4.30% Condo 2022 2021 Var % Listed 579 828 -30.07% Sold 440 698 -36.96% DOM 23 30 -23.33% Sales Price $822,500 $773,450 6.34% Sales $ Per SqFt $814 $769 5.94% Multi-Family 2022 2021 Var % Listed 62 59 5.08% Sold 32 43 -25.58% DOM 22 30 -26.67% Sales Price $1,400,000 $1,395,000 0.36% Sales $ Per SqFt $594 $540 9.99%
2022 Annual
Boston South Boston
market report
16 Real estate. Real results. Sennere.com Single Family 2022 2021 Var % Listed 30 58 -48.28% Sold 22 45 -51.11% DOM 88 40 120.00% Sales Price $3,272,500 $3,475,000 -5.83% Sales $ Per SqFt $1,122 $1,108 1.31% Condo 2022 2021 Var % Listed 846 791 6.95% Sold 520 583 -10.81% DOM 21 24 -12.50% Sales Price $1,049,500 $930,450 12.79% Sales $ Per SqFt $1,129 $1,058 6.71% Multi-Family 2022 2021 Var % Listed 33 20 65.00% Sold 18 9 100.00% DOM 32 64 -50.00% Sales Price $3,297,500 $3,100,000 6.37% Sales $ Per SqFt $816 $861 -5.34%
2022 Annual market report
Boston South End


17 Real estate. Real people. Sennere.com Condo 2022 2021 Var % Listed 178 229 -22.27% Sold 124 160 -22.50% DOM 40 60 -33.33% Sales Price $1,240,000 $1,150,000 7.83% Sales $ Per SqFt $1,031 $969 6.39%
Annual market report
Boston Waterfront 2022
Greater Boston
For anyone who is involved in real estate, the year 2022 came in like a lion and went out like a lamb. As has been widely discussed and analyzed, the Federal Reserve’s interest rate hikes in response to inflation has put a dampening effect on investment as the market tries to make heads or tails of underwriting and valuations. For over a decade, the market could rely on predictability, making the job of all of us real estate professionals a little less complicated.
As we enter 2023, the toughest part about our job is unpredictability. To that end, we all have to work a little harder, and we all have to listen a little more to what the market is telling us. But, like any situation which requires hard work and attentiveness, there should be a measure of success for the work, like a pot of gold at the end of a rainbow.
Comparing 2022 to the prior year, the number of homes available for sale was lower by 6.3%. There were 5,730 active listings at the end of 2022. New listings decreased by 12.1% to finish the year at 77,655.
Home prices were up compared to last year. The overall median sales price increased 7.4% to $553,000 for the year. Single-family home prices were up 8.5% compared to last year, and Condo/Townhome prices were up 6.3%.
If you’re looking to make a move or are just curious about what is going on in your town, our expert Associates are here to help.

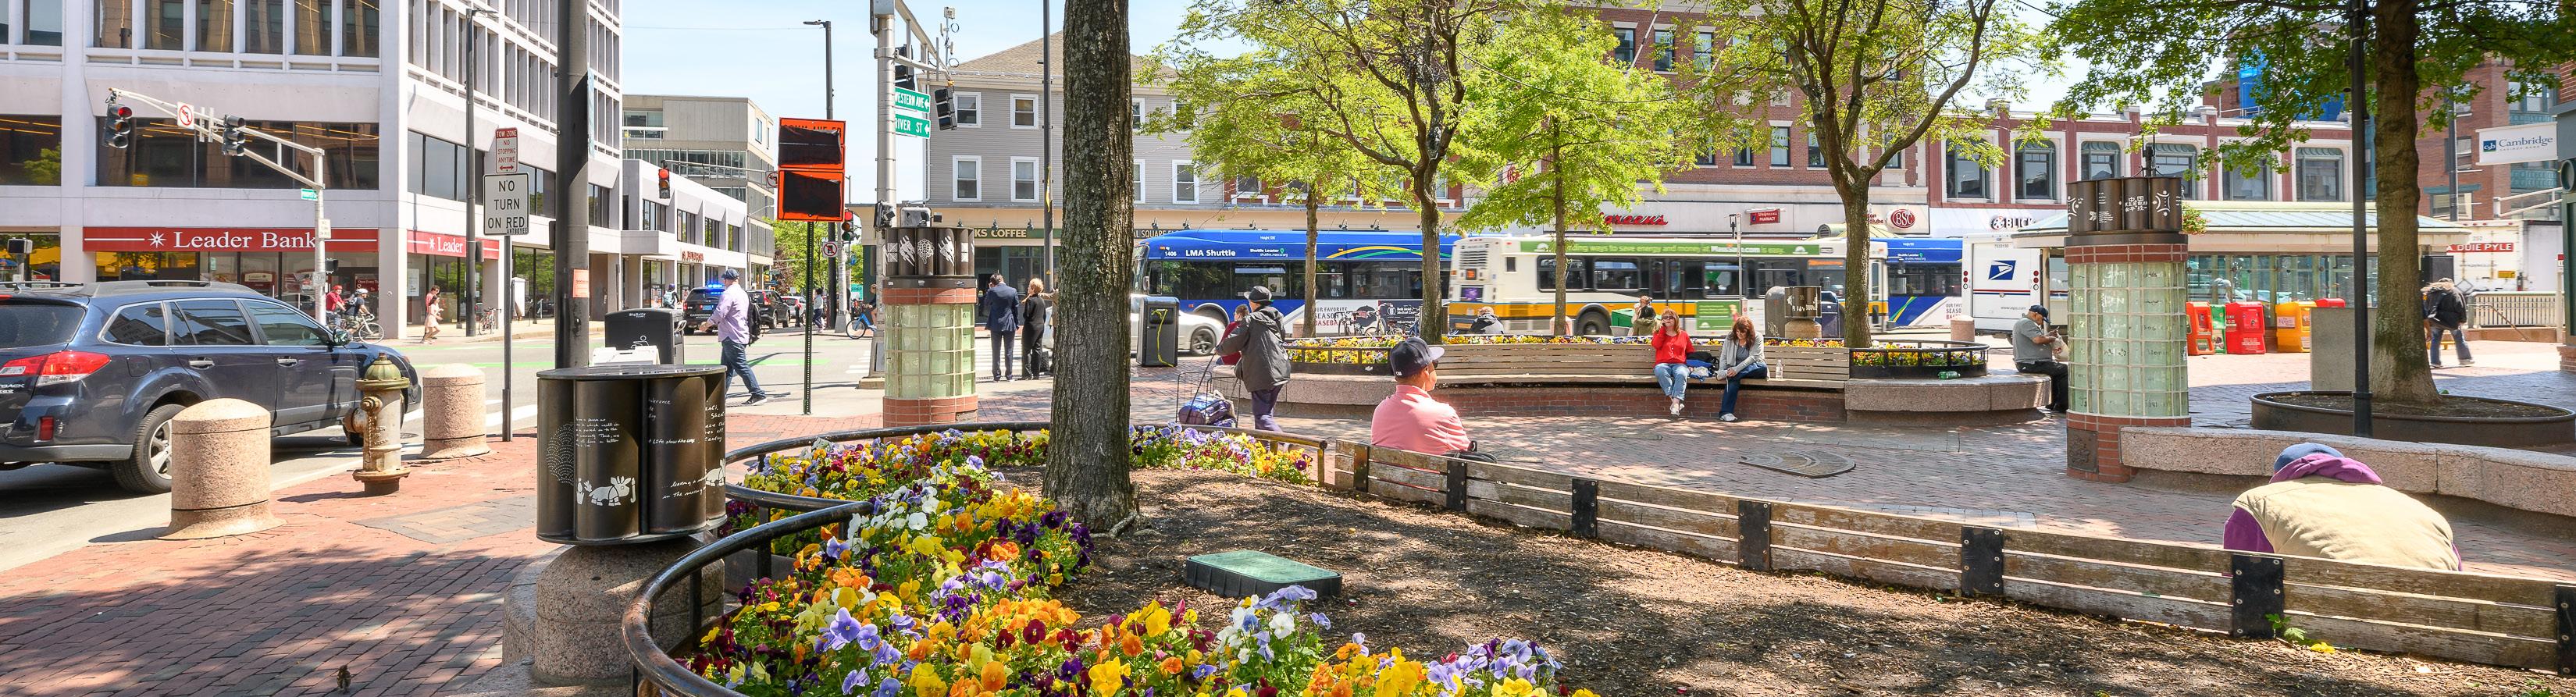
20 Real estate. Real results. Sennere.com Single Family 2022 2021 Var % Listed 200 197 1.52% Sold 113 148 -23.65% DOM 15 15 0.00% Sales Price $1,870,000 $1,800,000 3.89% Sales $ Per SqFt $955 $860 11.02% Condo 2022 2021 Var % Listed 803 865 -7.17% Sold 592 741 -20.11% DOM 19 21 -9.52% Sales Price $907,500 $825,000 10.00% Sales $ Per SqFt $906 $858 5.62% Multi-Family 2022 2021 Var % Listed 134 149 -10.07% Sold 102 84 21.43% DOM 24 21 14.29% Sales Price $1,887,500 $1,717,500 9.90% Sales $ Per SqFt $571 $558 2.29%
Cambridge 2022 Annual market report
Greater Boston
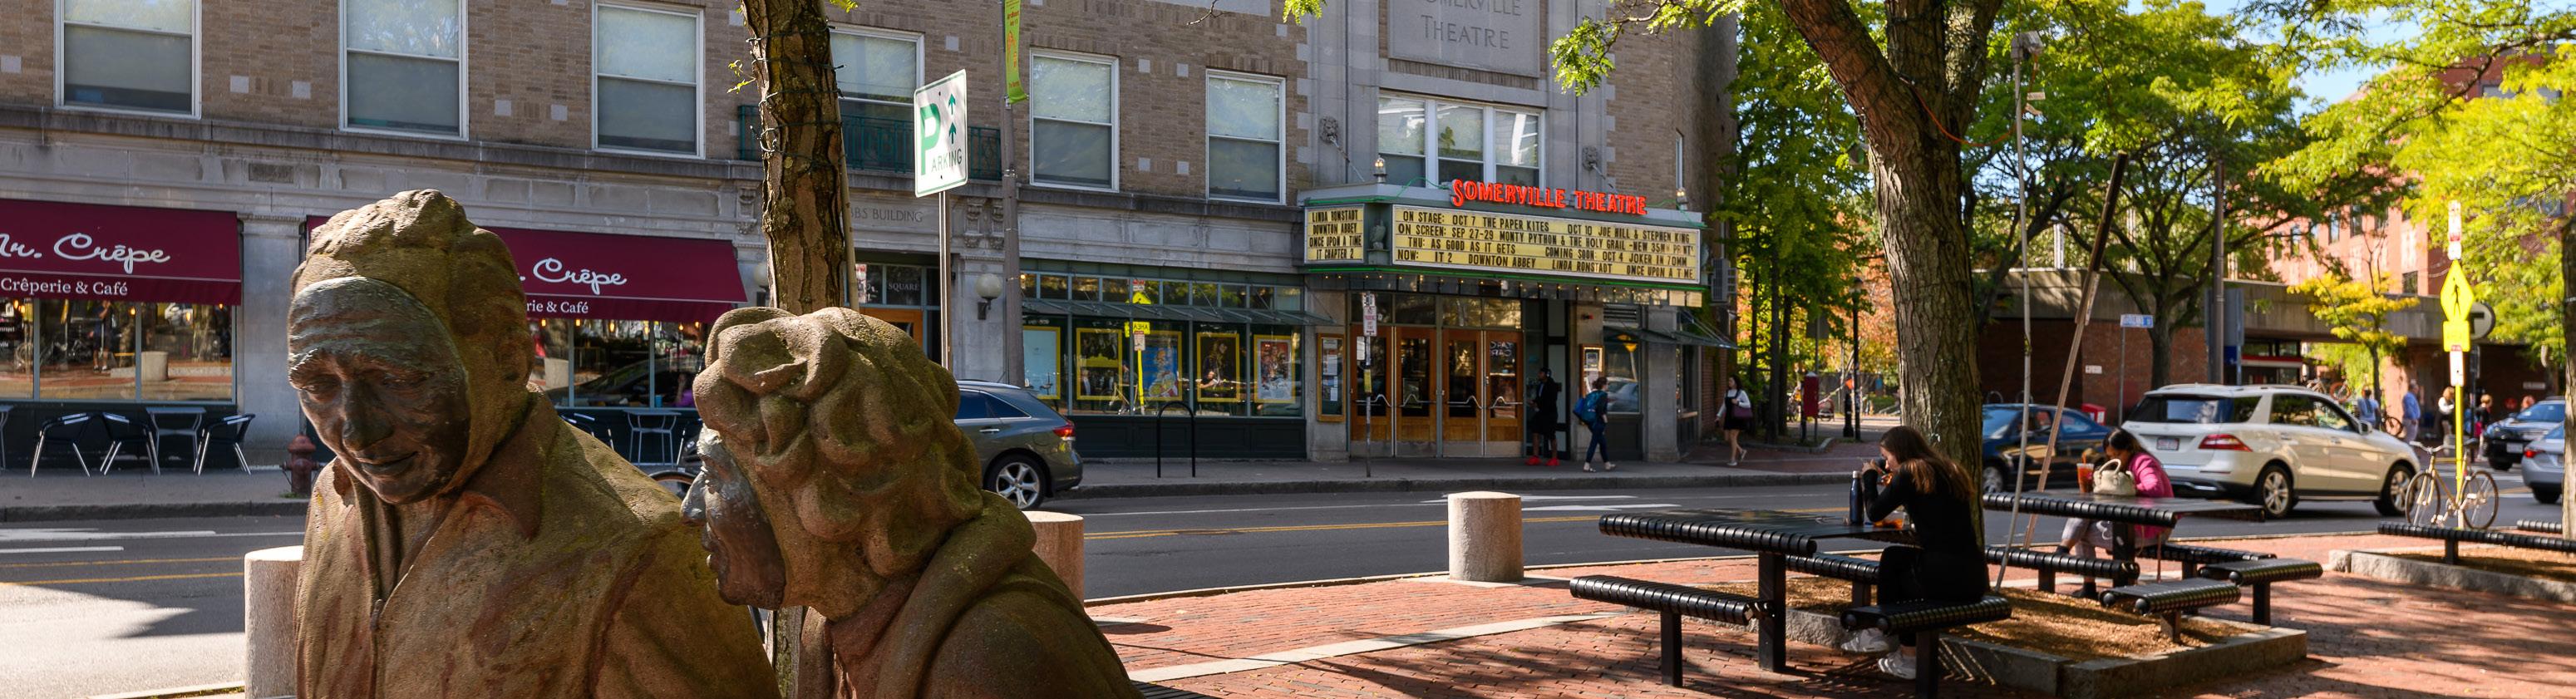
21 Real estate. Real value. Sennere.com Single Family 2022 2021 Var % Listed 124 120 3.33% Sold 78 89 -12.36% DOM 20 20 0.00% Sales Price $1,100,000 $965,000 13.99% Sales $ Per SqFt $649 $583 11.30% Condo 2022 2021 Var % Listed 663 737 -10.04% Sold 469 636 -26.26% DOM 20 21 -4.76% Sales Price $810,000 $785,000 3.18% Sales $ Per SqFt $701 $669 4.88% Multi-Family 2022 2021 Var % Listed 239 305 -21.64% Sold 168 226 -25.66% DOM 20 22 -9.09% Sales Price $1,250,000 $1,200,000 4.17% Sales $ Per SqFt $871 $425 2.35%
Annual market report
Greater Boston Somerville 2022
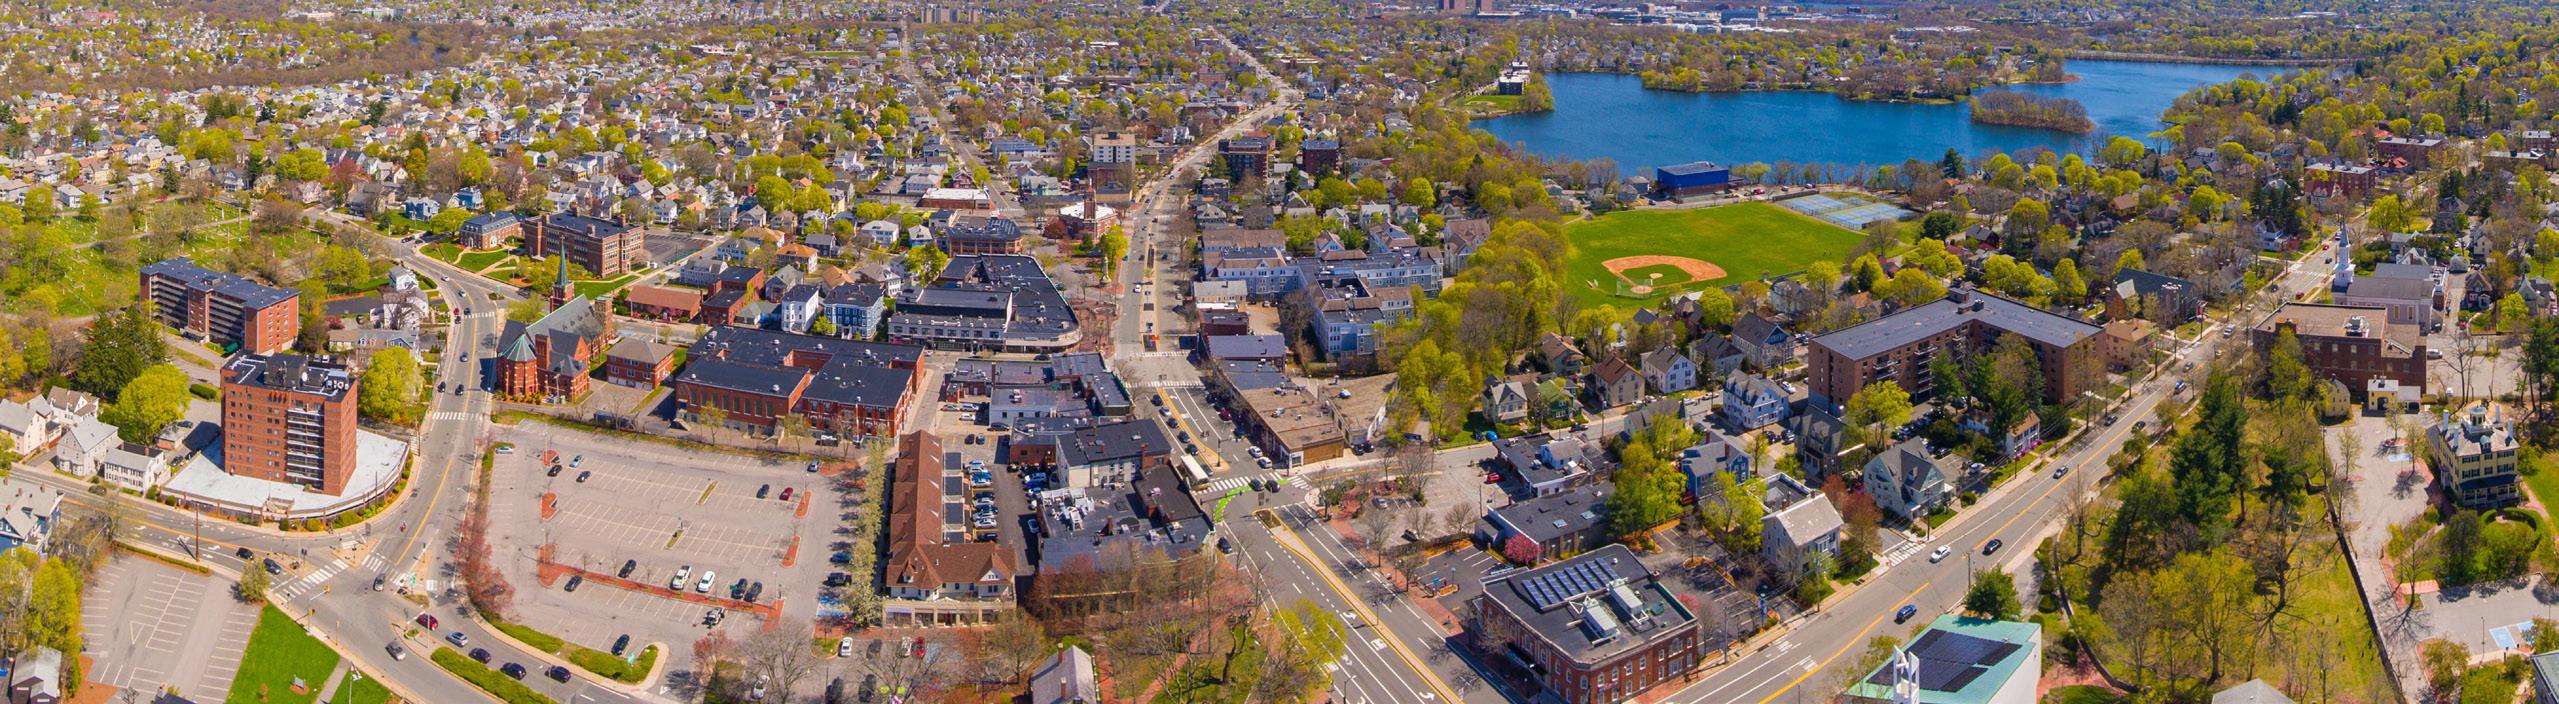
Real estate. Real results. Sennere.com 22 Arlington Single Family 2022 2021 Var % Listed 335 312 7.37% Sold 288 307 -6.19% DOM 10 9 11.11% Sales Price $1,153,000 $950,000 21.37% Sales $ Per SqFt $540 $509 6.24% Condo 2022 2021 Var % Listed 293 324 -9.57% Sold 229 293 -21.84% DOM 16 15 6.67% Sales Price $735,000 $695,000 5.76% Sales $ Per SqFt $542 $499 8.52% Multi-Family 2022 2021 Var % Listed 55 62 -11.29% Sold 37 54 -31.48% DOM 15 14 7.14% Sales Price $1,150,000 $1,200,000 -4.17% Sales $ Per SqFt $439 $421 4.23%
2022 Annual market report
Greater Boston
Real estate. Real solutions. Sennere.com 23 Single Family 2022 2021 Var % Listed 157 192 -18.23% Sold 134 172 -22.09% DOM 14 11 27.27% Sales Price $1,560,000 $1,430,000 9.09% Sales $ Per SqFt $621 $593 4.80% Condo 2022 2021 Var % Listed 97 138 -29.71% Sold 82 125 -34.40% DOM 16 19 -15.79% Sales Price $731,000 $740,000 -1.22% Sales $ Per SqFt $530 $499 6.19% Multi-Family 2022 2021 Var % Listed 45 71 -36.62% Sold 41 59 -30.51% DOM 19 14 35.71% Sales Price $1,200,000 $1,205,000 -0.41% Sales $ Per SqFt $469 $441 6.26%
Belmont Greater Boston 2022 Annual market report

Real estate. Real results. Sennere.com 24
Single Family 2022 2021 Var % Listed 165 195 -15.38% Sold 118 150 -21.33% DOM 18 21 -14.29% Sales Price $2,387,500 $2,026,712 17.80% Sales $ Per SqFt $748 $664 12.73% Condo 2022 2021 Var % Listed 613 725 -15.45% Sold 455 581 -21.69% DOM 21 22 -4.55% Sales Price $910,000 $851,250 6.90% Sales $ Per SqFt $774 $726 6.66% Multi-Family 2022 2021 Var % Listed 35 42 -16.67% Sold 16 29 -44.83% DOM 19 22 -13.64% Sales Price $2,440,000 $1,870,000 30.48% Sales $ Per SqFt $533 $517 3.12%
Greater Boston Brookline
2022 Annual market report

25 Real estate. Real people. Sennere.com Single Family 2022 2021 Var % Listed 243 211 15.17% Sold 185 197 -6.09% DOM 19 20 -5.00% Sales Price $1,450,000 $1,475,000 -1.69% Sales $ Per SqFt $494 $433 13.93% Condo 2022 2021 Var % Listed 43 52 -17.31% Sold 30 44 -31.82% DOM 16 15 6.67% Sales Price $745,000 $568,750 30.99% Sales $ Per SqFt $467 $440 6.22% Multi-Family 2022 2021 Var % Listed 9 10 -10.00% Sold 7 7 0.00% DOM 19 20 -5.00% Sales Price $925,000 $820,000 12.80% Sales $ Per SqFt $446 $371 20.45%
Concord Greater Boston 2022 Annual market report

Real estate. Real results. Sennere.com 26 Single Family 2022 2021 Var % Listed 385 421 -8.55% Sold 319 387 -17.57% DOM 16 14 14.29% Sales Price $1,590,000 $1,549,500 2.61% Sales $ Per SqFt $538 $474 13.58% Condo 2022 2021 Var % Listed 71 92 -22.83% Sold 65 77 -15.58% DOM 19 19 0.00% Sales Price $872,500 $760,000 14.80% Sales $ Per SqFt $506 $472 7.27% Multi-Family 2022 2021 Var % Listed 5 9 -44.44% Sold 0 4 -100.00% DOM 0 21 -100.00% Sales Price $0 $975,000 -100.00% Sales $ Per SqFt $0 $452 -100.00%
2022 Annual market report
Greater Boston Lexington

27 Real estate. Real value. Sennere.com Single Family 2022 2021 Var % Listed 706 782 -9.72% Sold 538 655 -17.86% DOM 17 18 -5.56% Sales Price $1,617,500 $1,510,000 7.12% Sales $ Per SqFt $571 $517 10.58% Condo 2022 2021 Var % Listed 469 492 -4.67% Sold 320 432 -25.93% DOM 20 22 -9.09% Sales Price $900,000 $825,425 9.03% Sales $ Per SqFt $528 $485 8.82% Multi-Family 2022 2021 Var % Listed 86 111 -22.52% Sold 57 89 -35.96% DOM 20 21 -4.76% Sales Price $1,249,000 $1,135,000 10.04% Sales $ Per SqFt $436 $394 10.68%
Newton Greater Boston 2022 Annual market report
Greater Boston Sudbury


Real estate. Real results. Sennere.com 28 Single Family 2022 2021 Var % Listed 294 286 2.80% Sold 241 261 -7.66% DOM 19 18 5.56% Sales Price $1,150,000 $1,024,500 12.25% Sales $ Per SqFt $368 $324 13.59% Condo 2022 2021 Var % Listed 73 31 135.48% Sold 33 19 73.68% DOM 21 27 -22.22% Sales Price $792,035 $625,000 26.73% Sales $ Per SqFt $416 $289 43.82%
2022
Annual market report
Greater Boston Waltham

Real estate. Real solutions. Sennere.com 29 Single Family 2022 2021 Var % Listed 341 360 -5.28% Sold 293 332 -11.75% DOM 19 17 11.76% Sales Price $740,036 $706,000 4.82% Sales $ Per SqFt $410 $386 6.32% Condo 2022 2021 Var % Listed 238 312 -23.72% Sold 211 317 -33.44% DOM 19 20 -5.00% Sales Price $550,000 $545,000 0.92% Sales $ Per SqFt $447 $410 9.10% Multi-Family 2022 2021 Var % Listed 57 79 -27.85% Sold 37 60 -38.33% DOM 21 20 5.00% Sales Price $905,000 $895,000 1.12% Sales $ Per SqFt $341 $310 10.01%
2022 Annual market report
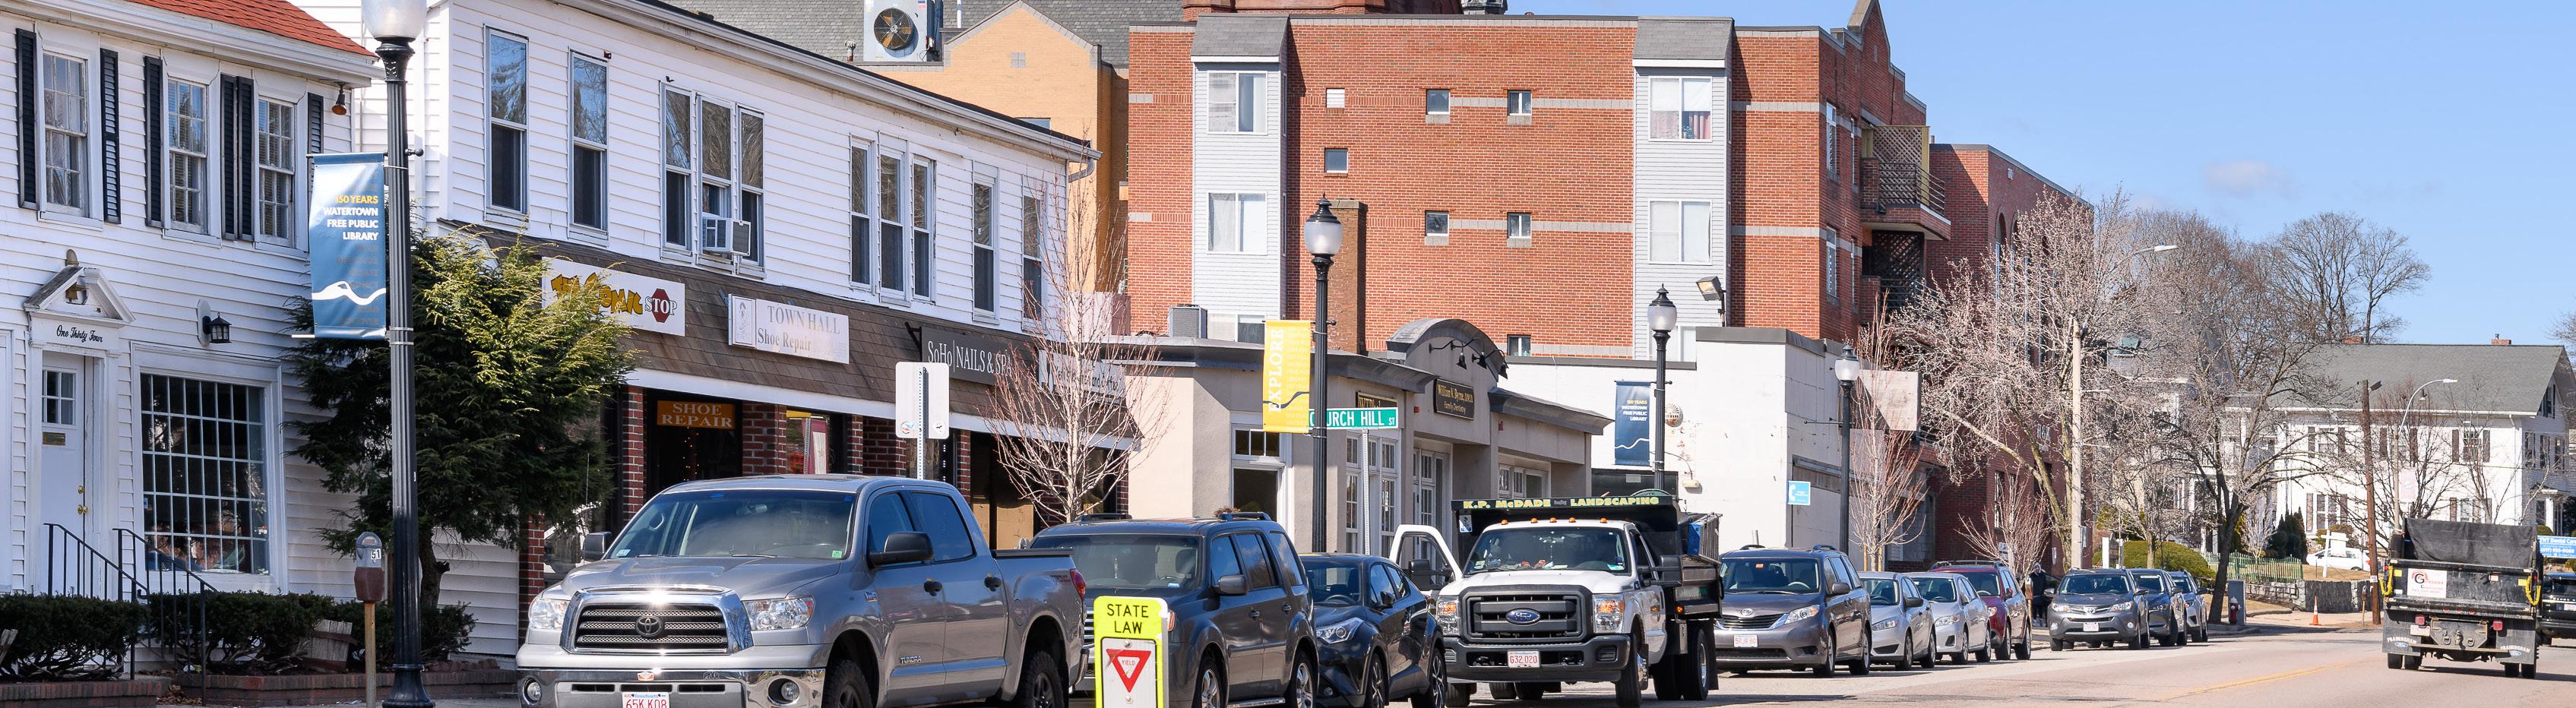
Real estate. Real results. Sennere.com 30 Single Family 2022 2021 Var % Listed 100 119 -15.97% Sold 75 89 -15.73% DOM 15 16 -6.25% Sales Price $850,000 $785,000 8.28% Sales $ Per SqFt $495 $457 8.20% Condo 2022 2021 Var % Listed 252 316 -20.25% Sold 220 269 -18.22% DOM 20 19 5.26% Sales Price $675,000 $610,000 10.66% Sales $ Per SqFt $521 $460 13.26% Multi-Family 2022 2021 Var % Listed 79 83 -4.82% Sold 59 69 -14.49% DOM 19 16 18.75% Sales Price $990,000 $940,000 5.32% Sales $ Per SqFt $376 $367 2.66%
Watertown Greater Boston 2022 Annual market report
31 Real estate. Real service. Sennere.com Single Family 2022 2021 Var % Listed 160 185 -13.51% Sold 141 180 -21.67% DOM 17 17 0.00% Sales Price $1,047,000 $1,000,000 4.70% Sales $ Per SqFt $420 $371 13.40% Condo 2022 2021 Var % Listed 44 41 7.32% Sold 36 40 -10.00% DOM 16 13 23.08% Sales Price $772,500 $733,000 5.39% Sales $ Per SqFt $380 $362 5.02% Multi-Family 2022 2021 Var % Listed 4 2 100.00% Sold 2 2 0.00% DOM 20 31 -35.48% Sales Price $794,950 $790,000 0.63% Sales $ Per SqFt $253 $254 -0.48%
Annual market report
Wayland Greater Boston 2022

Real estate. Real results. Sennere.com 32 Single Family 2022 2021 Var % Listed 347 390 -11.03% Sold 304 331 -8.16% DOM 11 13 -15.38% Sales Price $1,886,500 $1,653,000 14.13% Sales $ Per SqFt $599 $550 8.96% Condo 2022 2021 Var % Listed 91 55 65.45% Sold 47 42 11.90% DOM 20 30 -33.33% Sales Price $1,050,000 $877,500 19.66% Sales $ Per SqFt $576 $527 9.40% Multi-Family 2022 2021 Var % Listed 3 4 -25.00% Sold 2 2 0.00% DOM 12 140 -91.43% Sales Price $1,600,500 $1,782,500 -10.21% Sales $ Per SqFt $433 $413 4.88%
2022
Wellesley Greater Boston
Annual market report

33 Real estate. Real people. Sennere.com Single Family 2022 2021 Var % Listed 206 216 -4.63% Sold 129 181 -28.73% DOM 17 24 -29.17% Sales Price $2,434,000 $2,105,000 15.63% Sales $ Per SqFt $539 $454 18.58% Condo 2022 2021 Var % Listed 27 13 107.69% Sold 17 14 21.43% DOM 21 29 -27.59% Sales Price $759,000 $767,500 -1.11% Sales $ Per SqFt $515 $385 33.63%
2022 Annual market report
Weston Greater Boston

Our residential locations 1 Lewis Wharf, Boston, MA 02110 84 Atlantic Avenue, Boston, MA 02110 75 Park Avenue, Arlington, MA 02476 1675 Massachusetts Ave, Cambridge, MA 02138 21 Cochituate Road, Wayland, MA 01778 senne.co
