2023
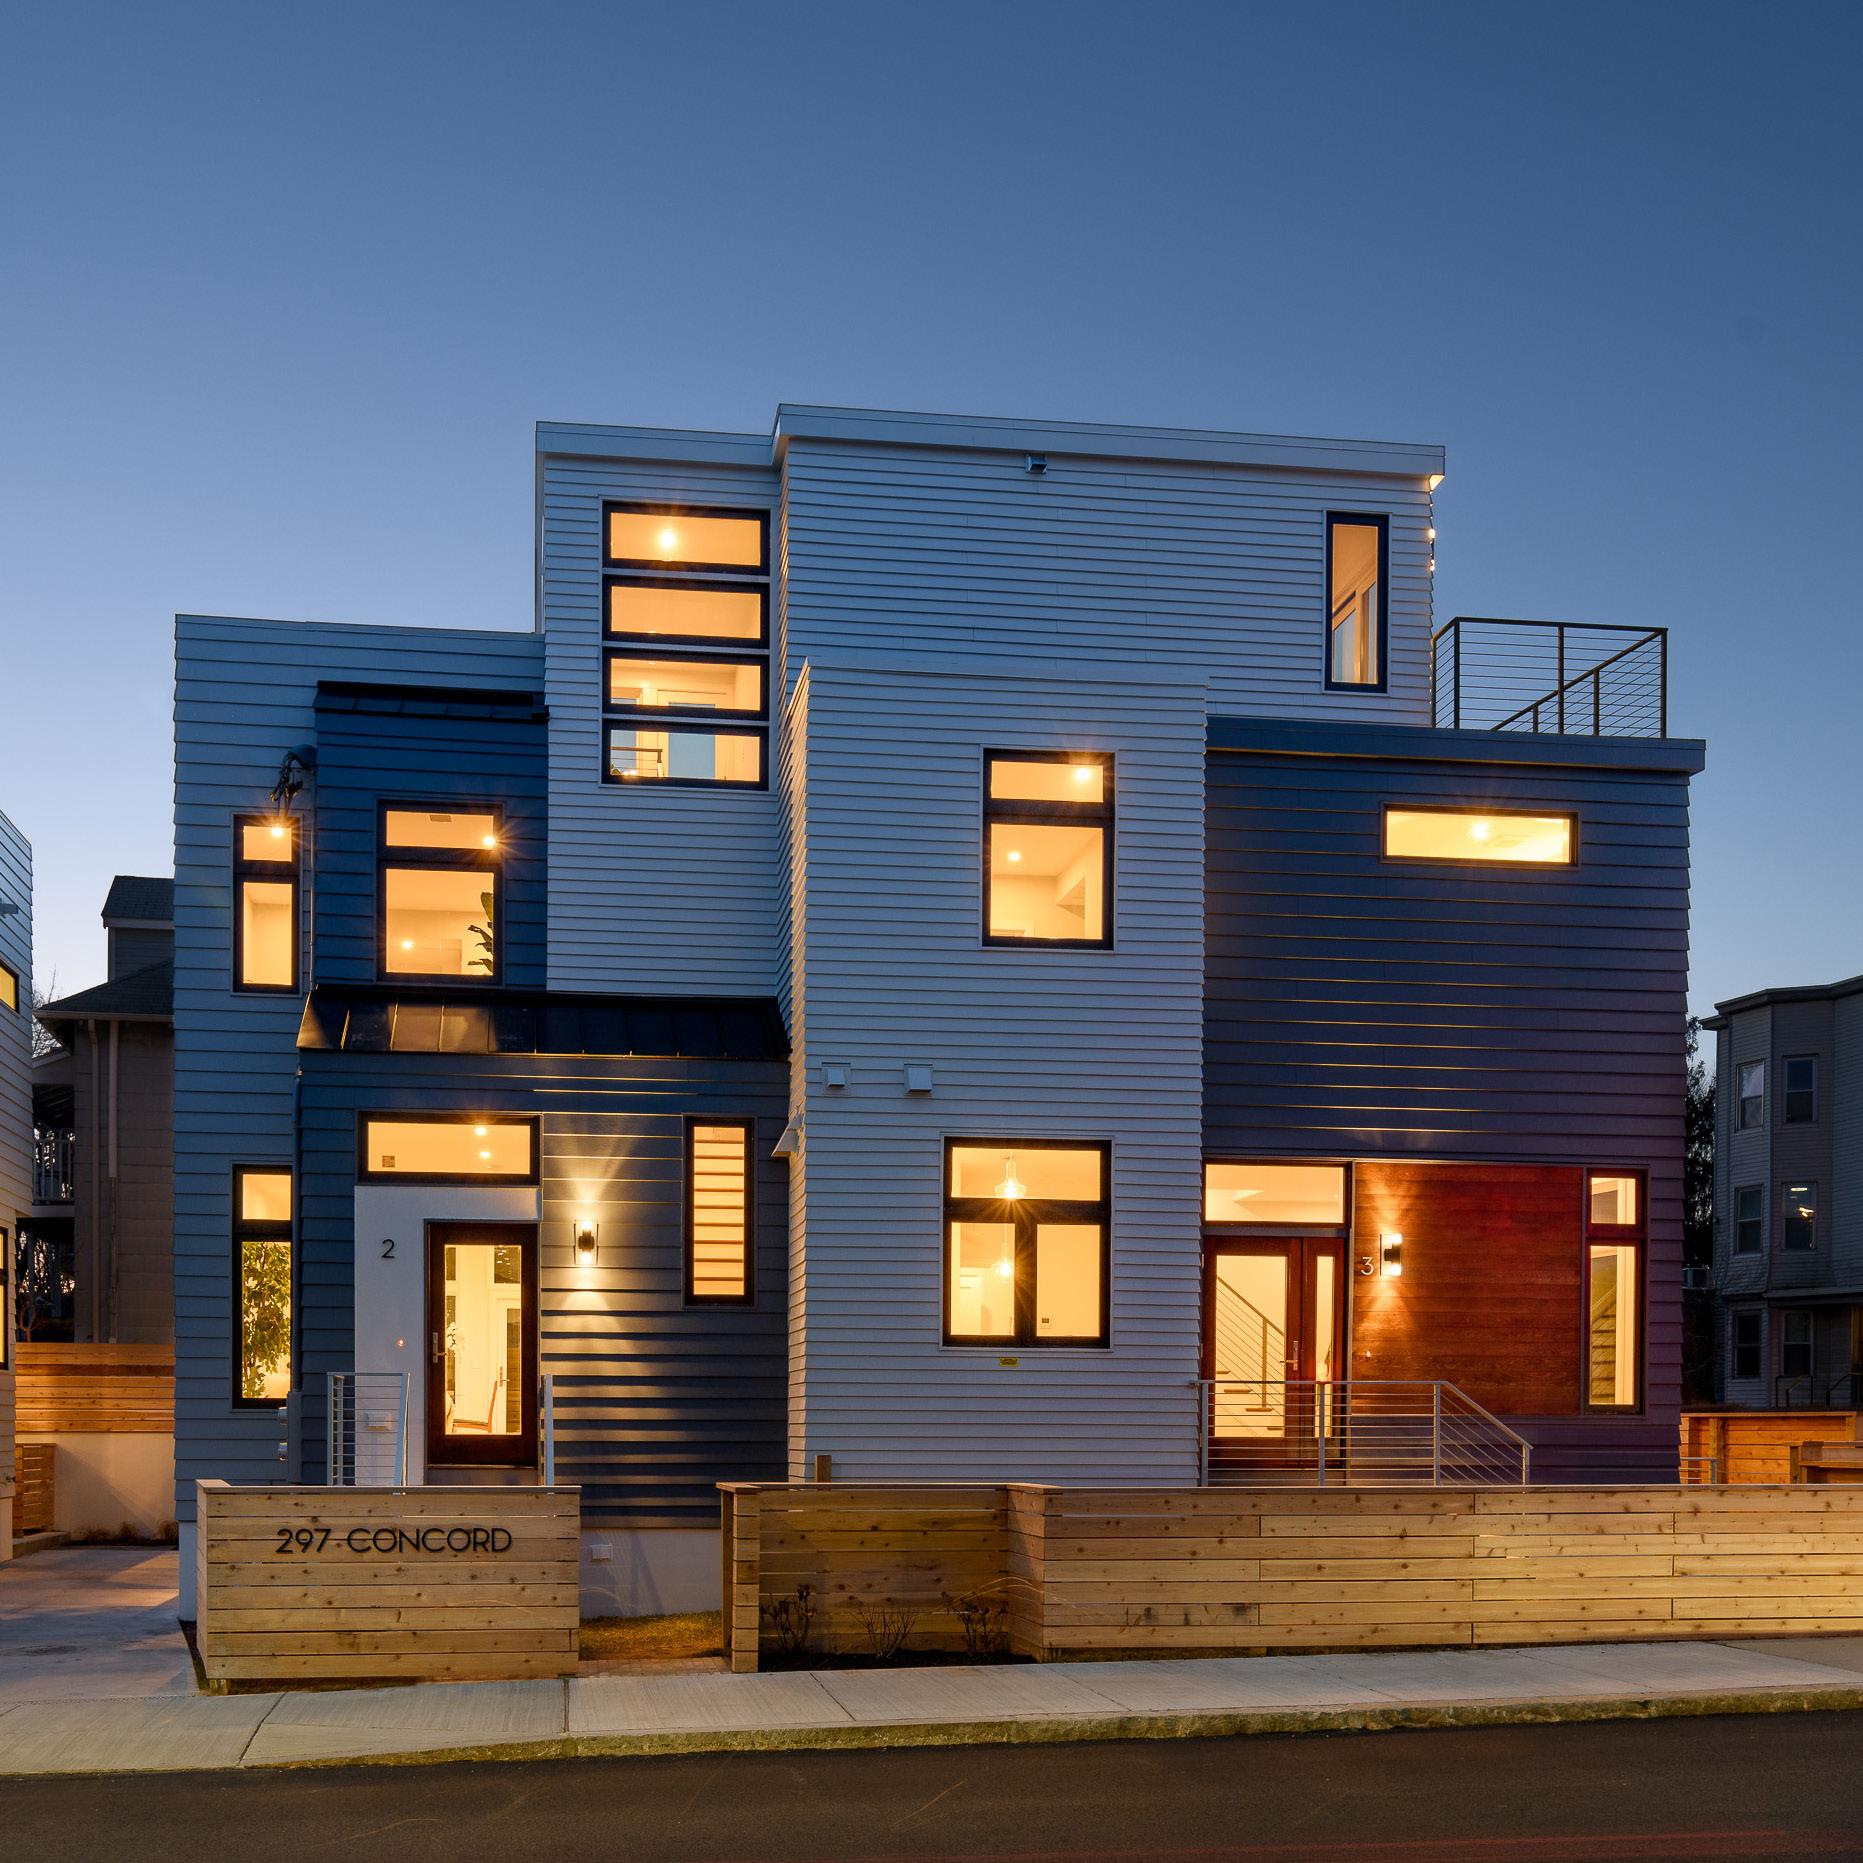
Q2 Market Overview
Executive Summary
The Boston/Greater Boston real estate markets are cooling, but prices are still high. This is due to a number of factors, including the strong job market, limited inventory, and the high cost of construction. It remains to be seen how the market will perform in the coming months, but it is likely to remain competitive. It is important to note that the Boston/Greater Boston real estate market is cyclical, so it is possible that the market could heat up again in the future. However, for the time being, it appears that the market is cooling.
Here are some predictions for the Boston/ Greater Boston real estate markets in the coming months:
• Sales are likely to continue to decline. The trend of declining sales is likely to continue in the coming months, as the inventory of homes for sale remains low and prices remain high.
• Prices are likely to remain high. The limited inventory of homes for sale and the strong demand for housing are likely to keep prices high in the coming months.
• The market is likely to remain competitive. The competitive nature of the market is likely to continue in the coming months, as buyers compete for a limited number of homes.
It is important to note that these are just predictions, and the actual performance of the market could vary. However, based on the current trends, it seems likely that the Boston/ Greater Boston real estate markets will remain cool in the coming months.

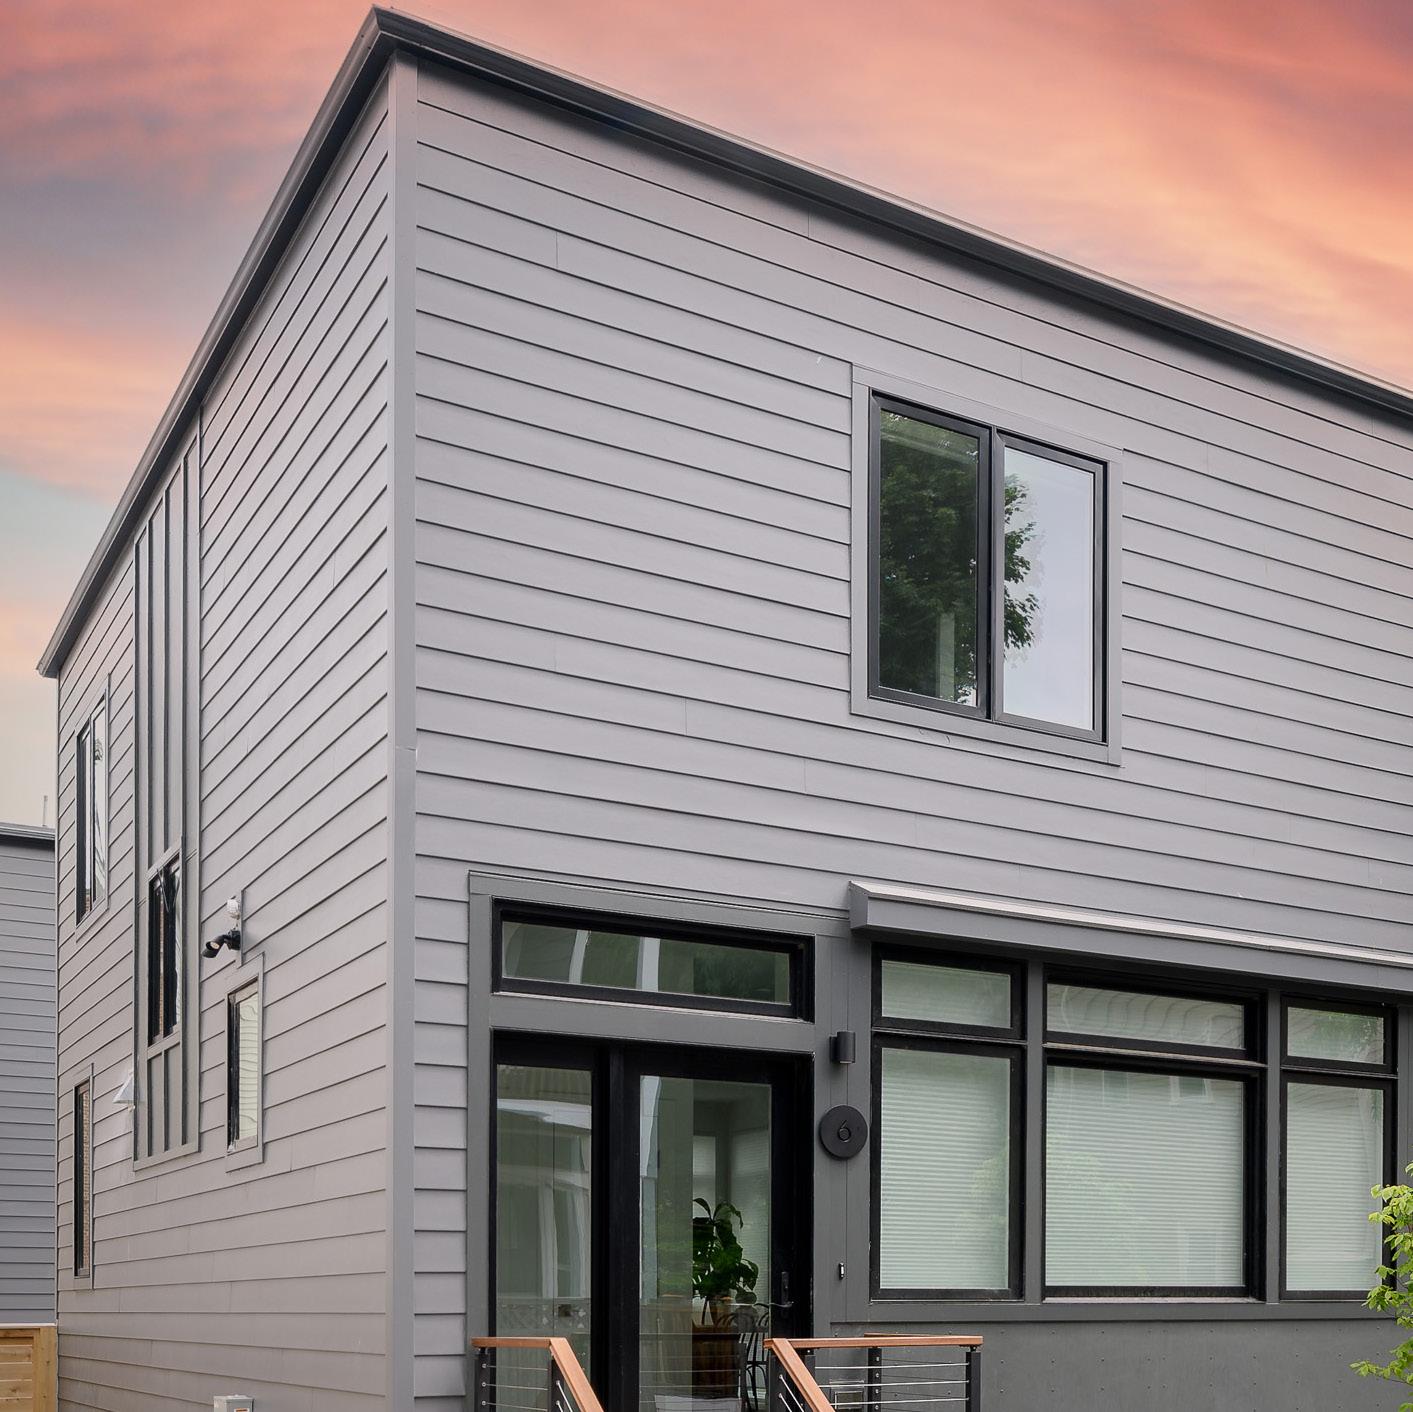
Greater Boston Single - Family
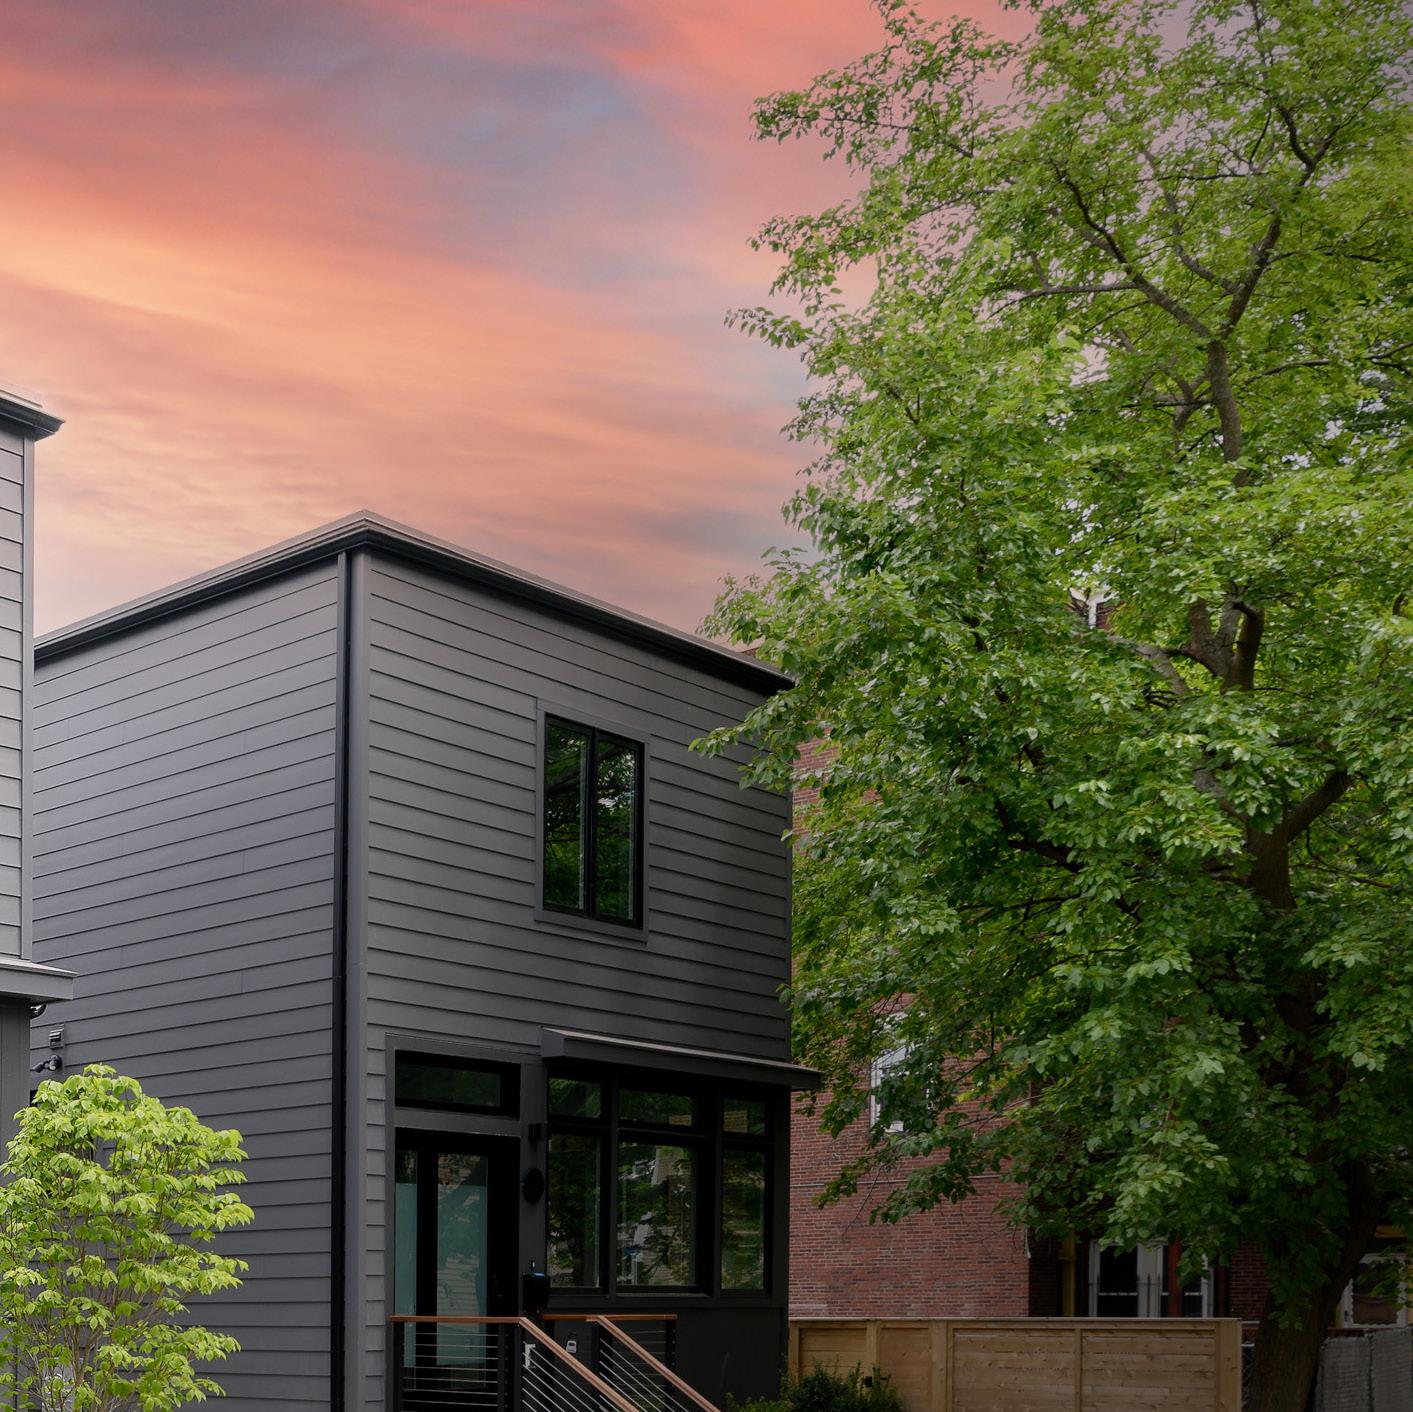
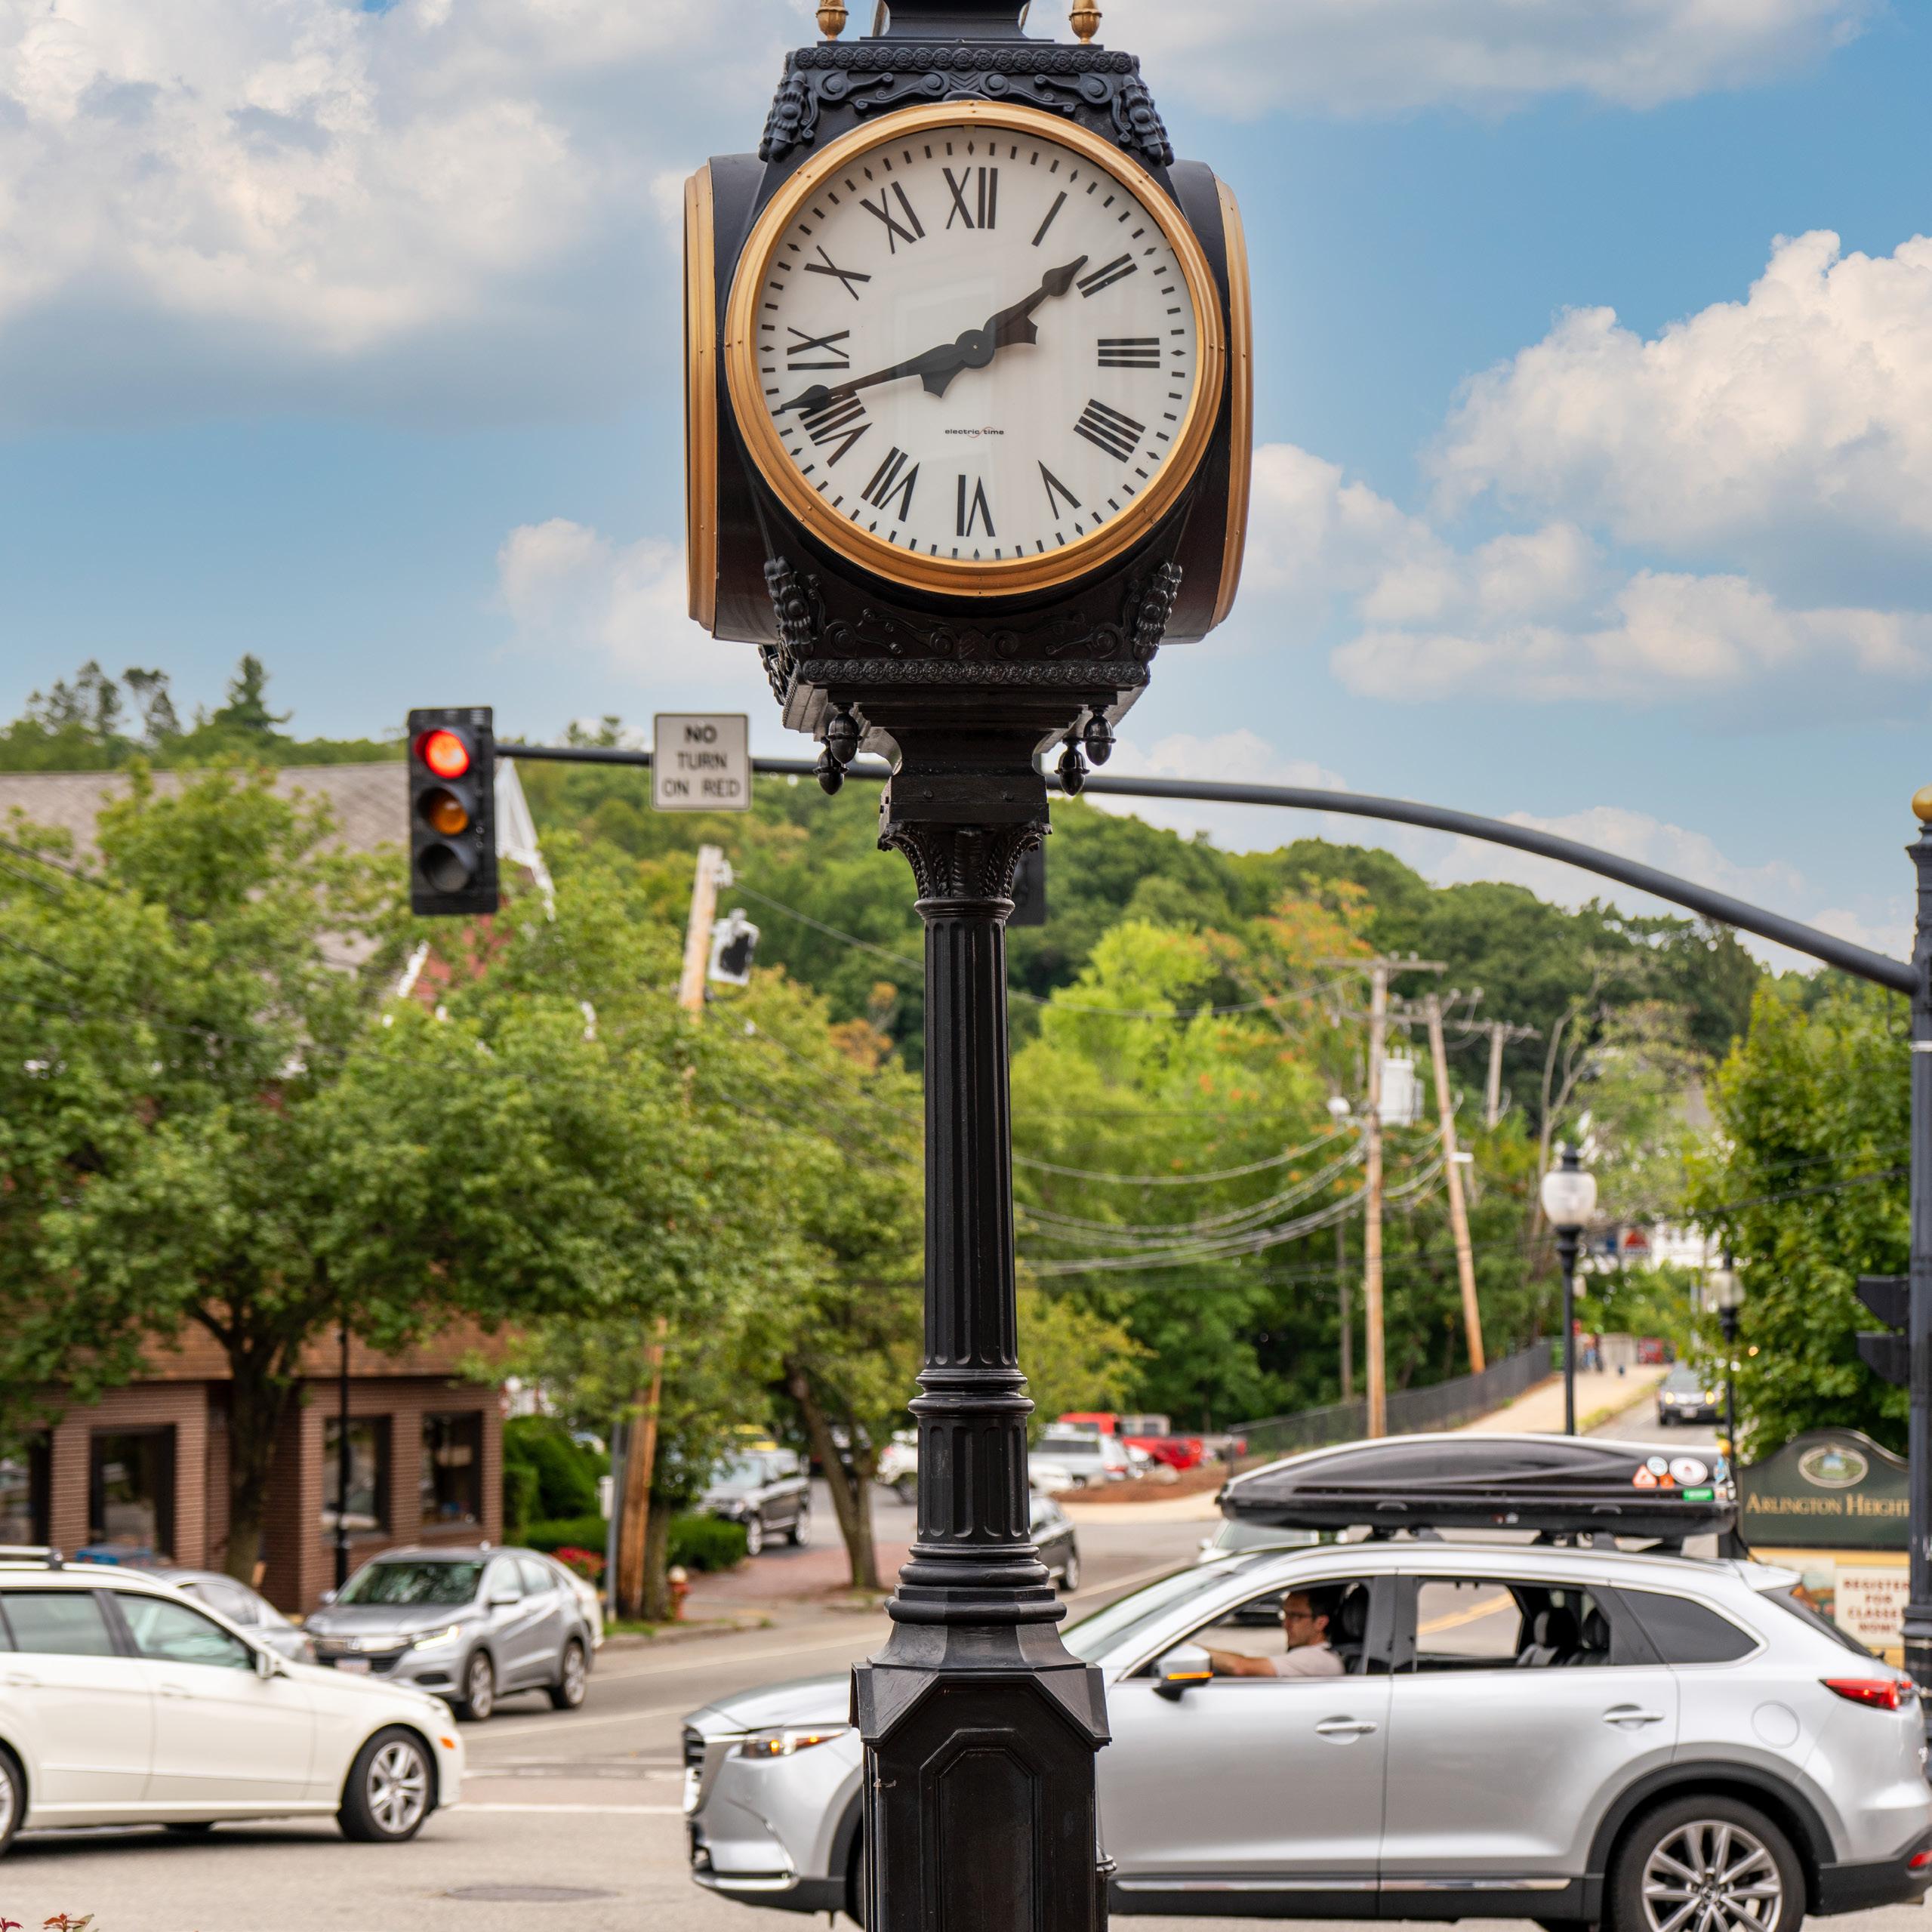
Arlington
Greater Boston | Single - Family Arlington Change from 2022 to 2023 2019 2020 2021 2022 2023 Active 41 16 9 18 15 New 131 97 114 121 87 Sold 72 52 92 92 59 Pending 100 83 107 113 73 Average Days on Market 19 24 11 12 18 Median Sold Price $880,000 $855,000 $1,037,500 $1,270,500 $1,110,000
-16.67% -28.10% -35.87% -33.63% 50.00% -12.63%
Cambridge

Change from 2022 to 2023
Cambridge 2019 2020 2021 2022 2023 Active 20 20 11 18 28 New 50 44 75 61 56 Sold 29 21 43 25 30 Pending 40 33 64 41 38 Average Days on Market 33 42 25 34 46 Median Sold Price $1,500,000 $1,525,000 $1,850,000 $2,100,000 $2,150,000 55.56% -8.20% 20.00% -7.32% 35.29% 2.38%
Greater Boston | Condominiums
Somerville
Change from 2022 to 2023
|
-
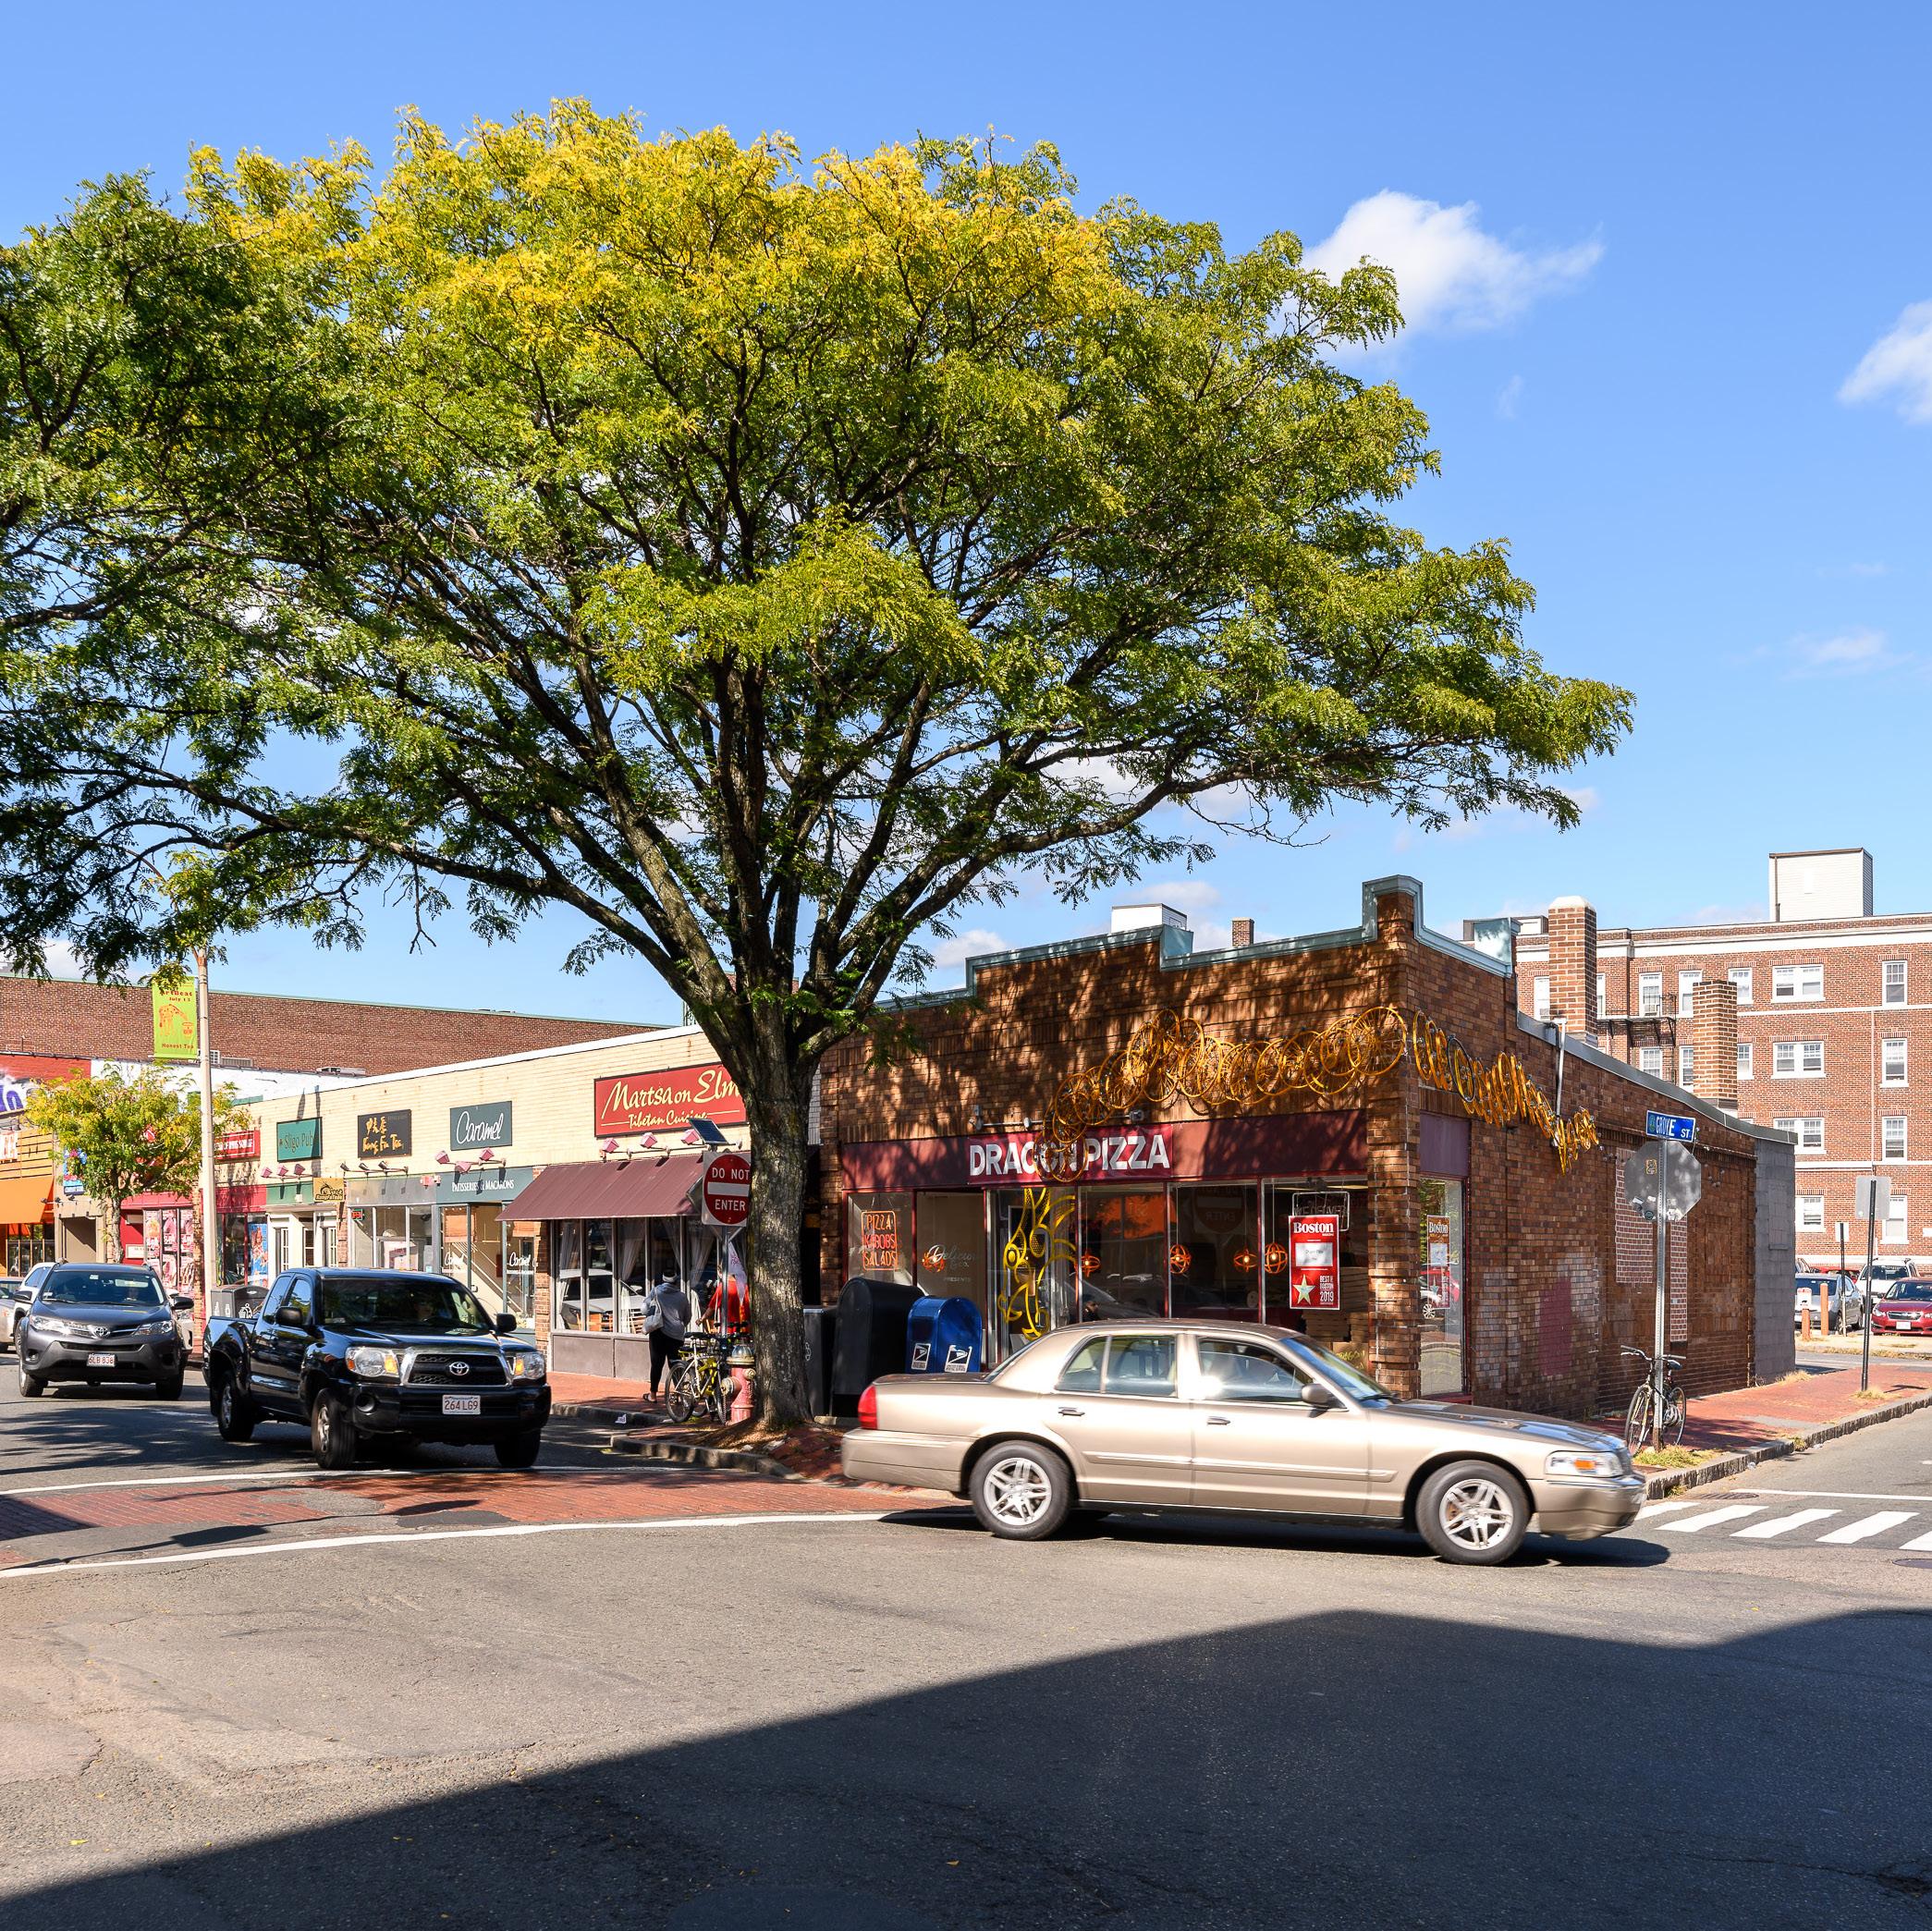
Somerville 2019 2020 2021 2022 2023 Active 13 7 8 15 13 New 32 31 36 45 38 Sold 20 18 21 14 18 Pending 23 29 32 28 23 Average Days on Market 30 20 36 25 31 Median Sold Price $777,500 $1,042,500 $910,000 $1,279,750 $1,364,250 -13.33% -15.56% 28.57% -17.86% 28.57% 6.60%
Greater Boston
Single
Family
Wayland

Change from 2022 to 2023 Greater Boston | Single - Family
2019 2020 2021 2022 2023 Active 42 24 5 9 14 New 70 63 57 74 54 Sold 48 54 53 37 29 Pending 54 67 62 72 43 Average Days on Market 51 47 36 20 22 Median Sold Price $815,500 $792,500 $1,010,000 $1,095,000 $1,150,000 55.56% -27.03% -21.62%
10.00%
Wayland
-40.28%
5.02%

Greater Boston Condominiums


Arlington
Greater Boston | Condominiums Arlington Change from 2022 to 2023 2019 2020 2021 2022 2023 Active 14 14 11 29 12 New 88 71 96 92 63 Sold 71 47 95 79 61 Pending 85 72 86 66 66 Average Days on Market 18 17 21 17 24 Median Sold Price $600,000 $715,500 $662,500 $807,000 $835,500
-58.62% -31.52% -22.78% 0.00% 41.18% 3.53%
Cambridge

Change from 2022 to 2023
Cambridge 2019 2020 2021 2022 2023 Active 81 92 74 93 78 New 266 207 307 292 273 Sold 175 107 239 216 183 Pending 231 133 261 231 217 Average Days on Market 30 20 36 25 31 Median Sold Price $810,000 $780,000 $849,000 $981,000 $950,000 -16.13%
Greater Boston | Condominiums
-6.51% -15.28% -6.06% 24.00% -3.16%
Somerville
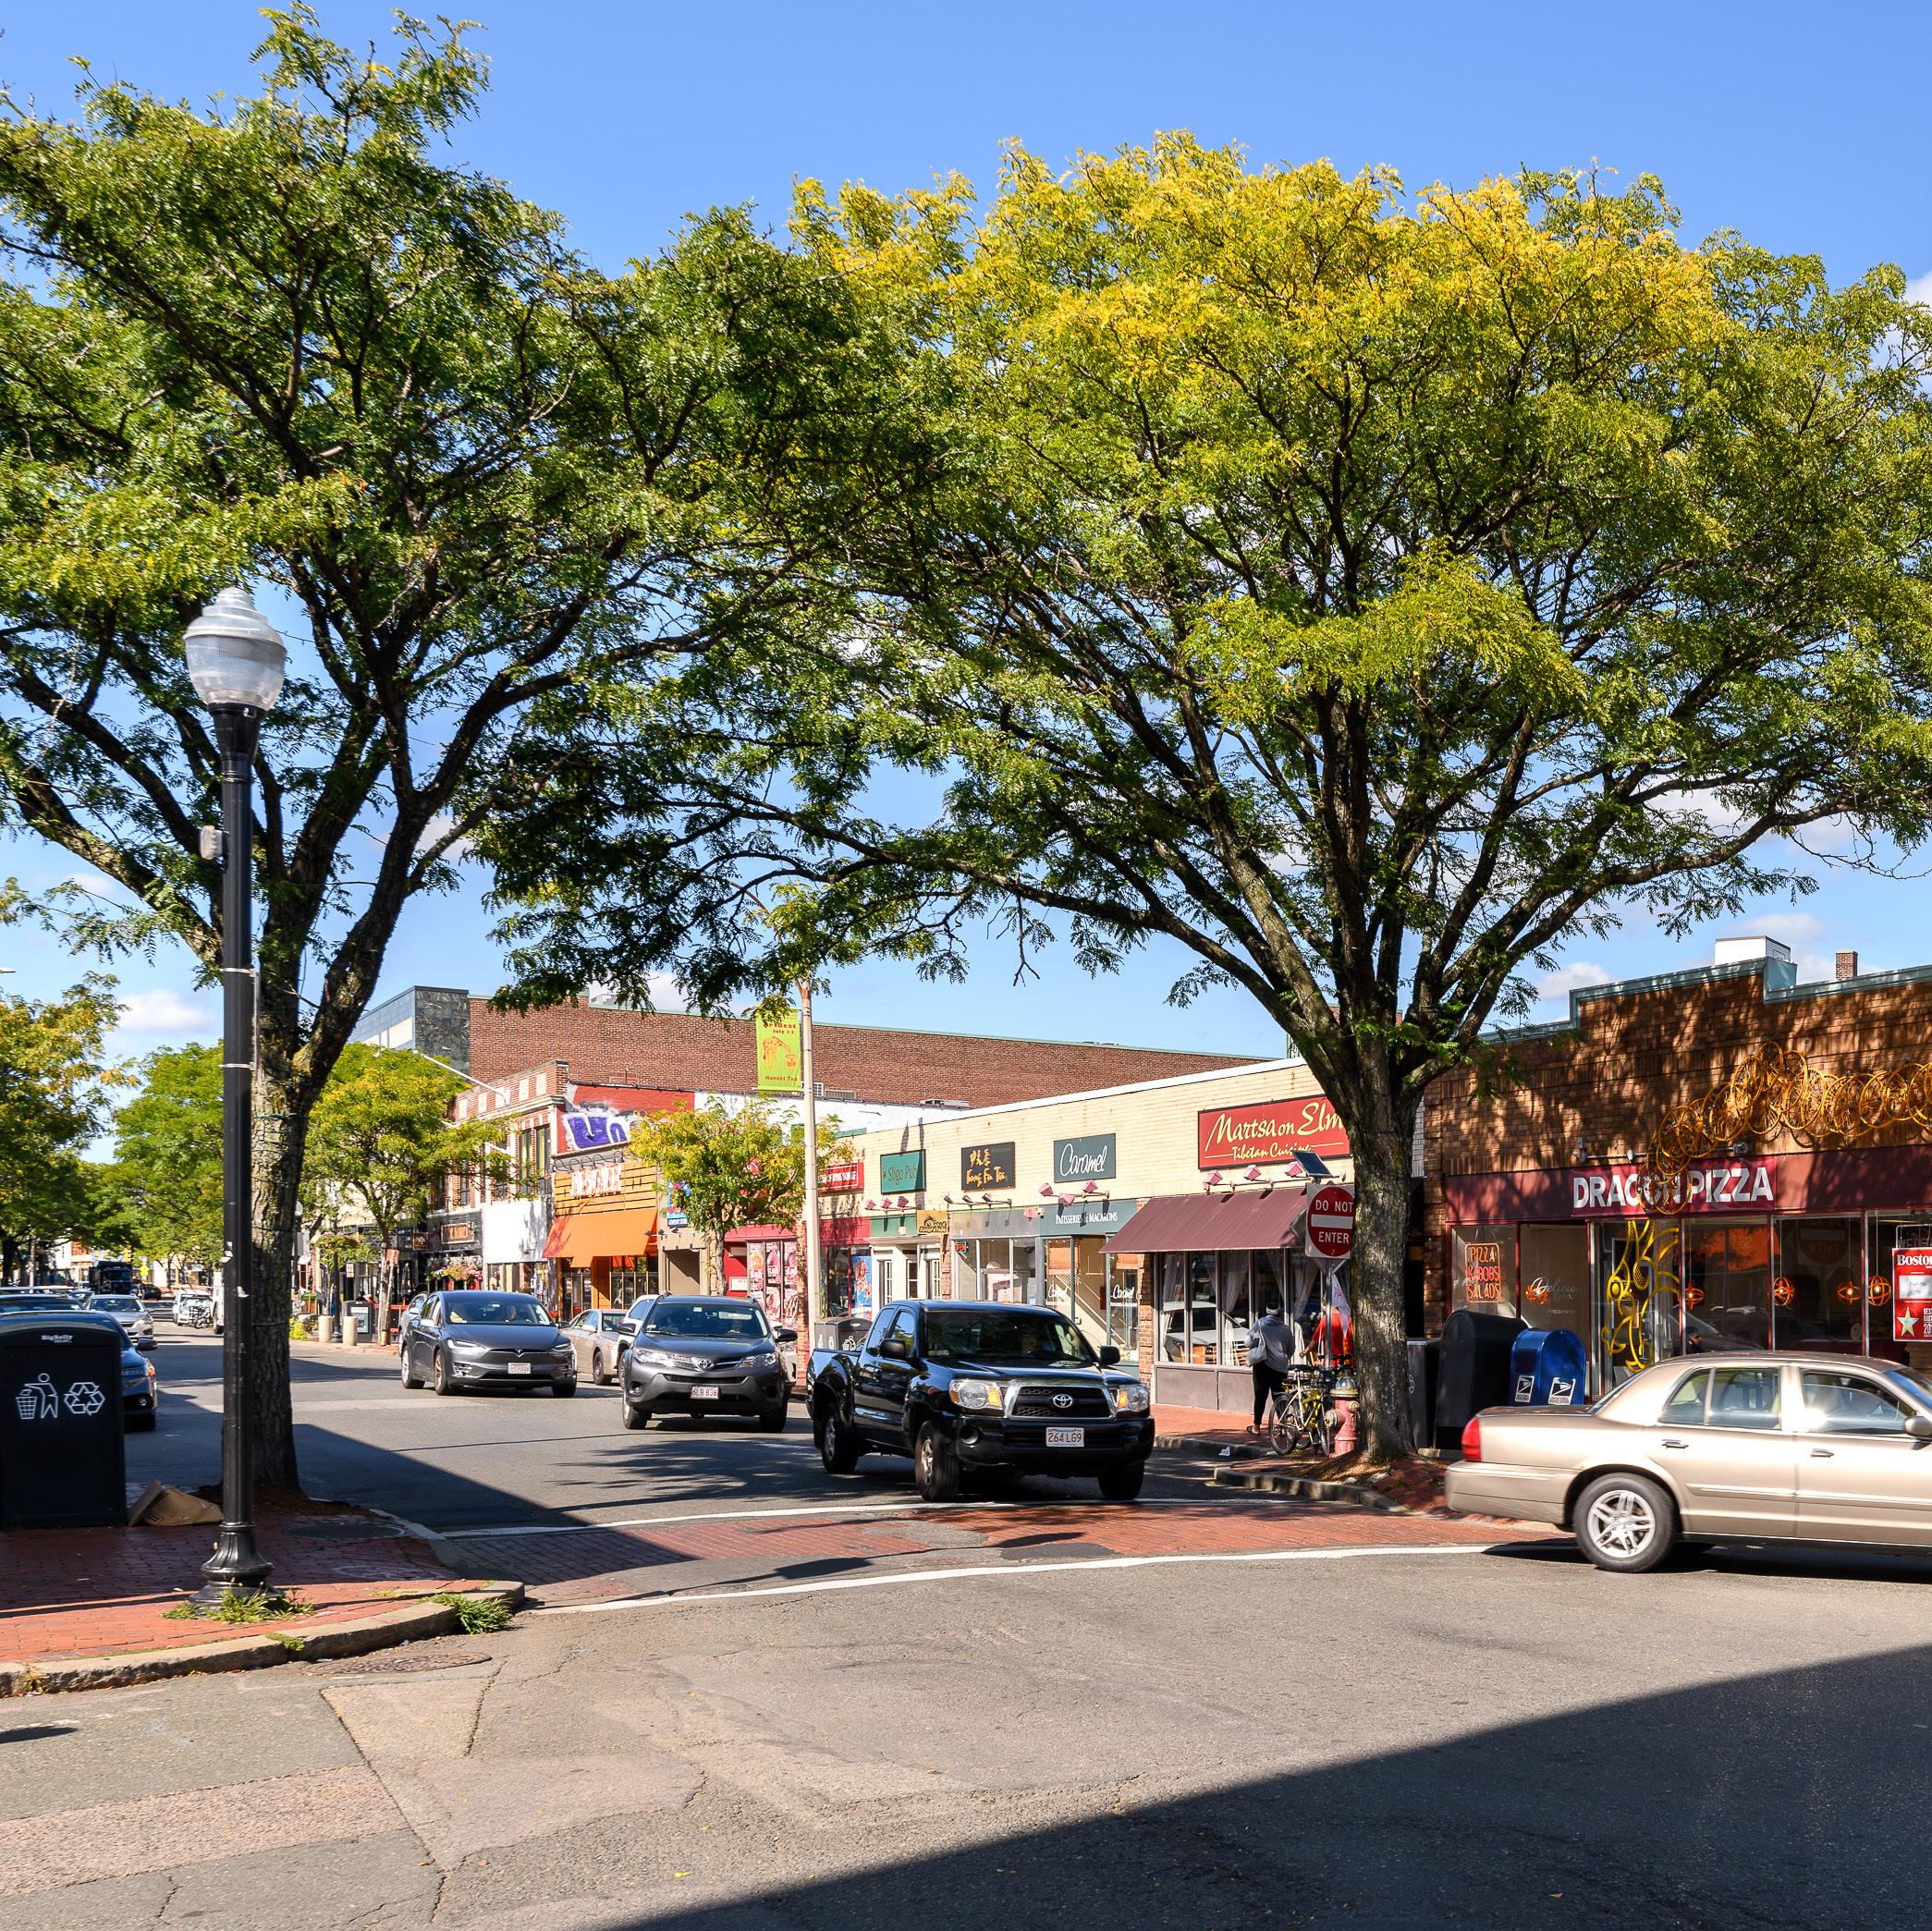
2019 2020 2021 2022 2023 Active 89 67 65 110 93 New 236 156 254 250 190 Sold 170 88 206 138 131 Pending 197 119 221 182 174 Average Days on Market 42 38 42 33 45 Median Sold Price $700,000 $742,450 $794,750 $822,500 $928,400
Greater Boston | Condominiums Somerville
Change from 2022 to 2023 -15.45% -24.00% -5.07% -4.40% 36.36% 12.88%
Wayland
Wayland
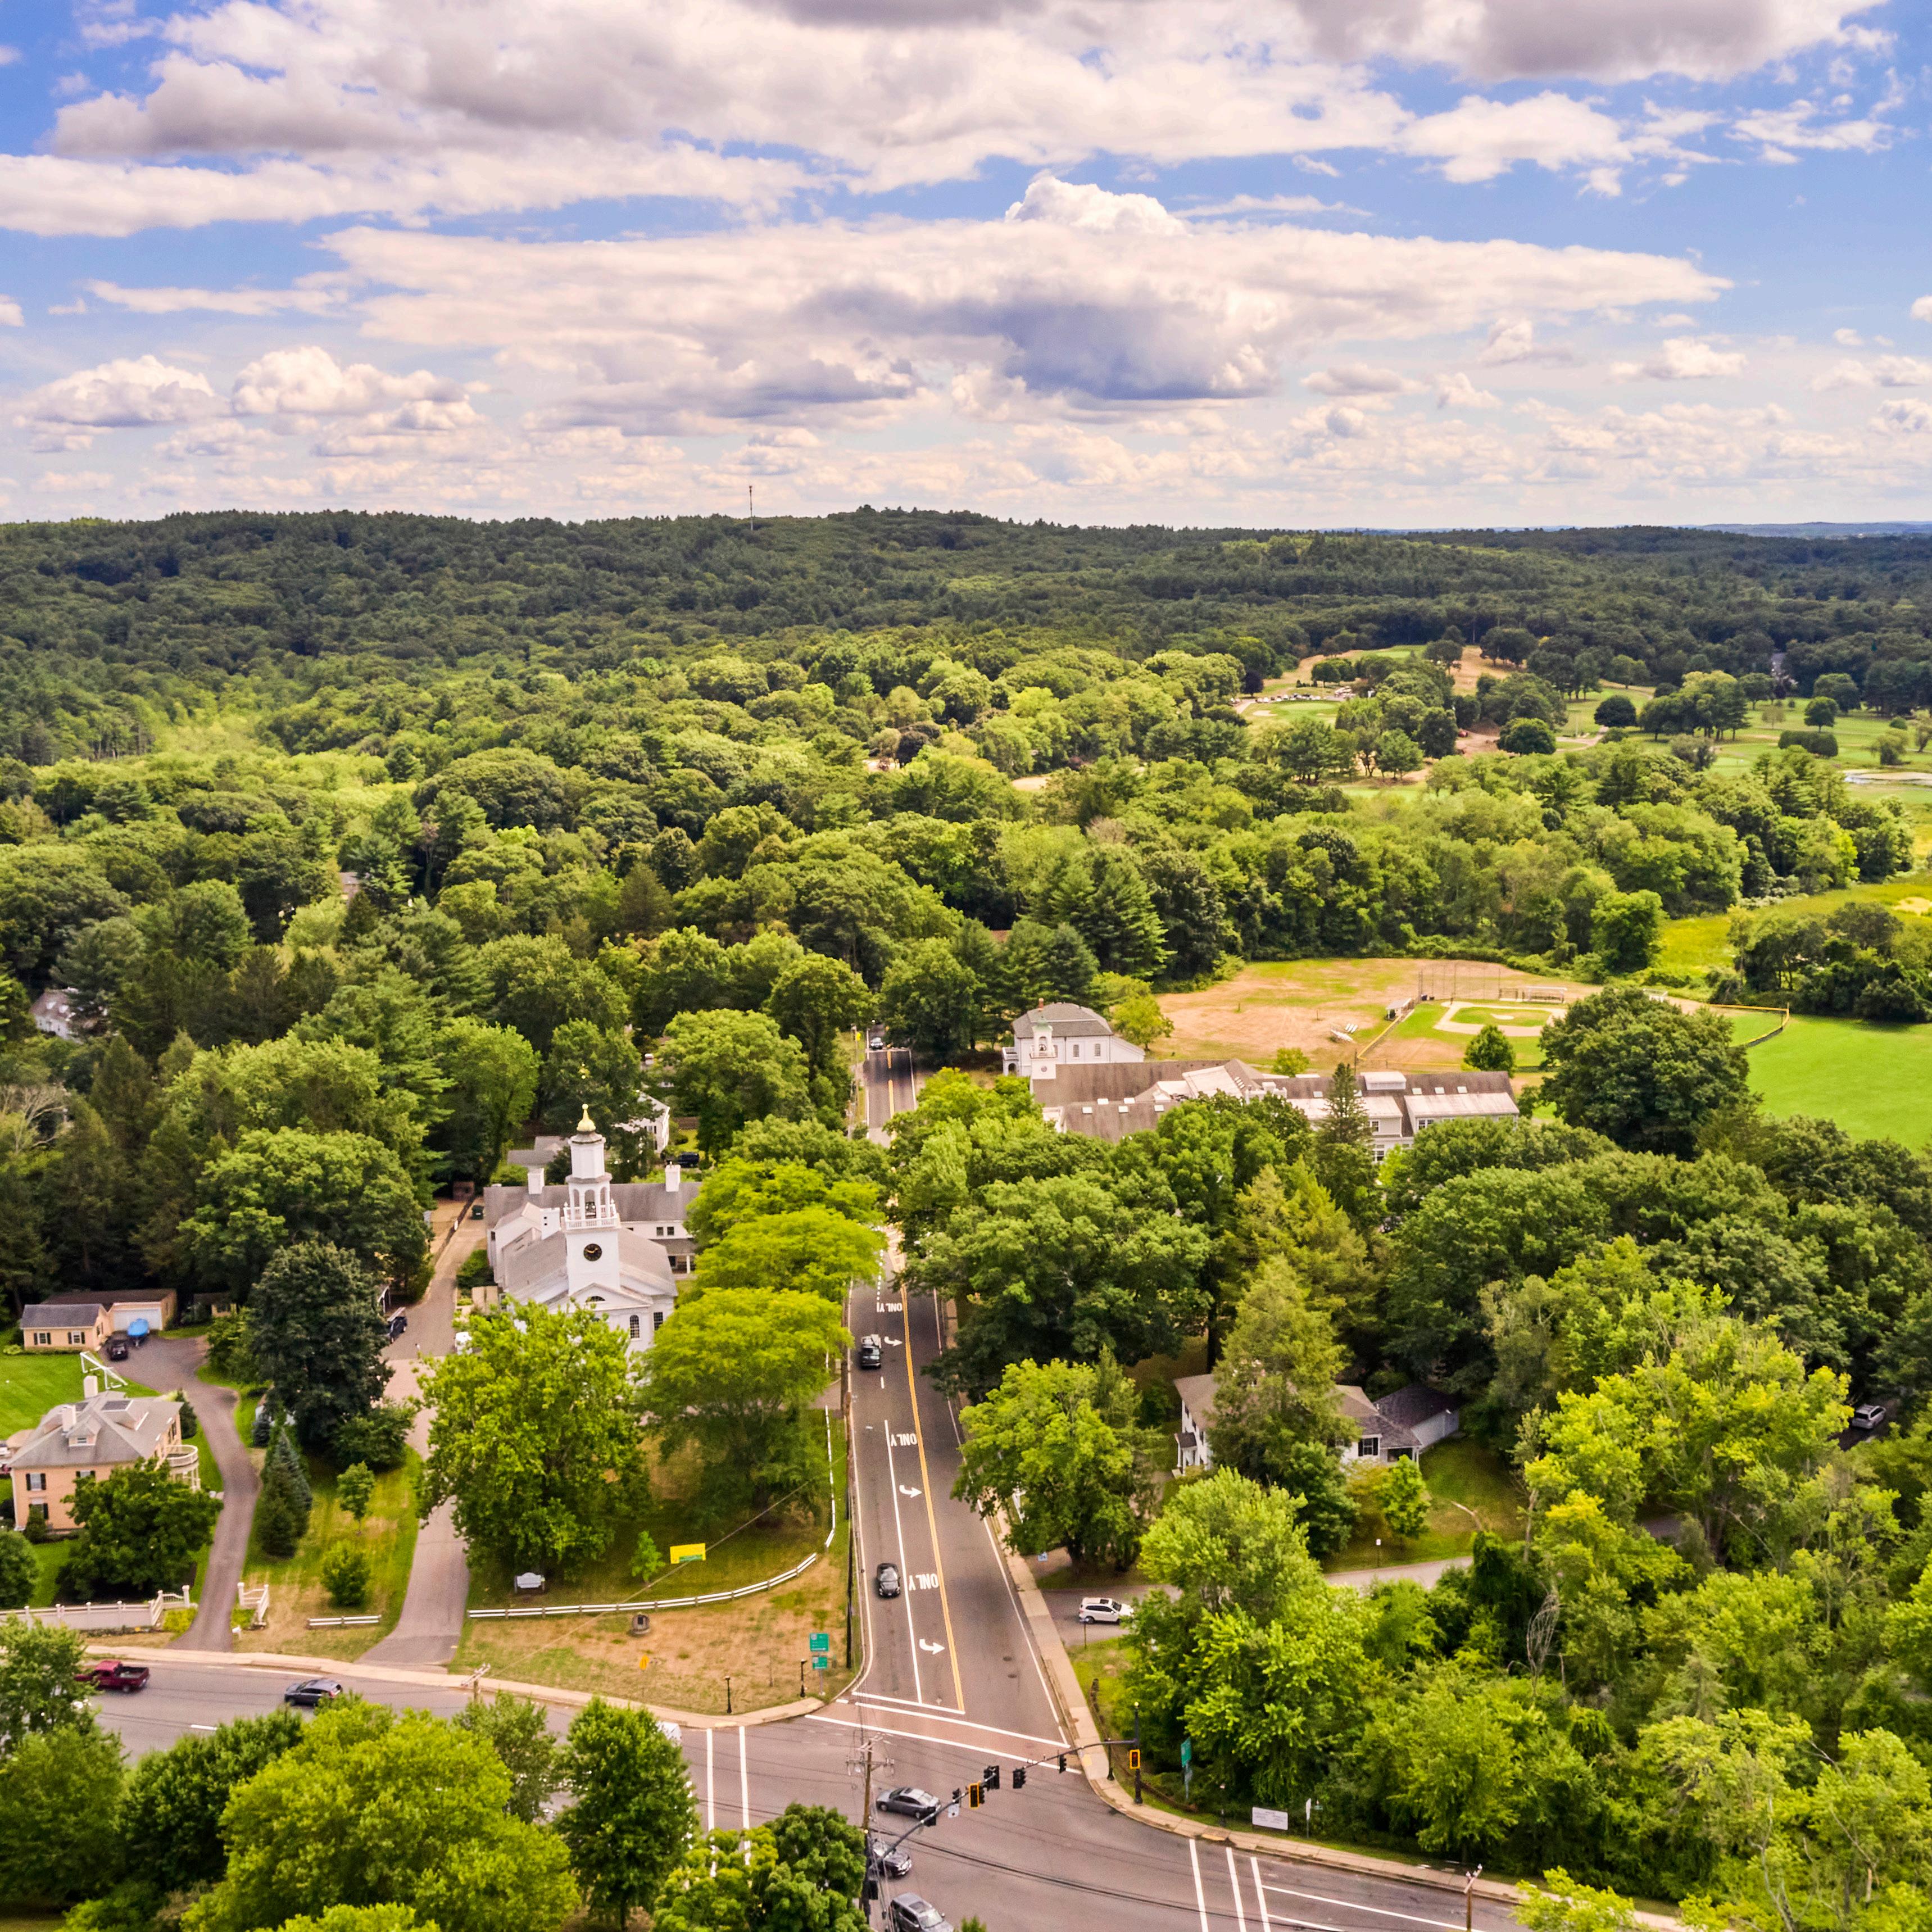
2019 2020 2021 2022 2023 Active 5 4 1 3 1 New 15 10 19 17 7 Sold 10 13 15 13 6 Pending 14 8 20 16 8 Average Days on Market 40 48 24 16 48 Median Sold Price $669,750 $645,000 $715,000 $1,100,000 $1,022,450
Greater Boston | Condominiums
from 2022 to 2023 -66.67% -58.82% -53.85%
200.00%
Change
-50.00%
-7.05%

Greater Boston Multi-Family


Arlington
Greater Boston | Multi-Family Arlington Change from 2022 to 2023 2019 2020 2021 2022 2023 Active 7 7 1 3 2 New 18 15 17 17 14 Sold 11 7 5 9 10 Pending 11 11 16 16 14 Average Days on Market 11 13 13 16 22 Median Sold Price $951,000 $1,115,000 $1,020,000 $1,349,000 $1,340,000 -33.33% -17.65% 11.11%
37.50%
-12.50%
-0.67%
Cambridge

Change from 2022 to 2023 Greater Boston | Multi-Family Cambridge 2019 2020 2021 2022 2023 Active 18 14 20 21 15 New 39 26 44 50 44 Sold 22 9 20 22 16 Pending 28 19 30 43 31 Average Days on Market 54 40 31 51 48 Median Sold Price $1,775,000 $1,575,000 $1,800,000 $1,825,000 $1,855,000
-28.57% -12.00% -27.27% -27.91% -5.88% 1.64%
Somerville

2019 2020 2021 2022 2023 Active 34 34 32 30 32 New 79 54 117 74 73 Sold 43 38 64 54 29 Pending 74 34 90 55 52 Average Days on Market 53 22 37 23 43 Median Sold Price $1,128,888 $1,235,000 $1,227,500 $1,271,250 $1,295,000
Somerville
Greater Boston | Multi-Family
Change
from 2022 to 2023 6.67% -1.35% -46.30% -5.45% 86.96% 1.87%

Boston Condominiums

Back Bay
Back Bay
Boston | Condominiums
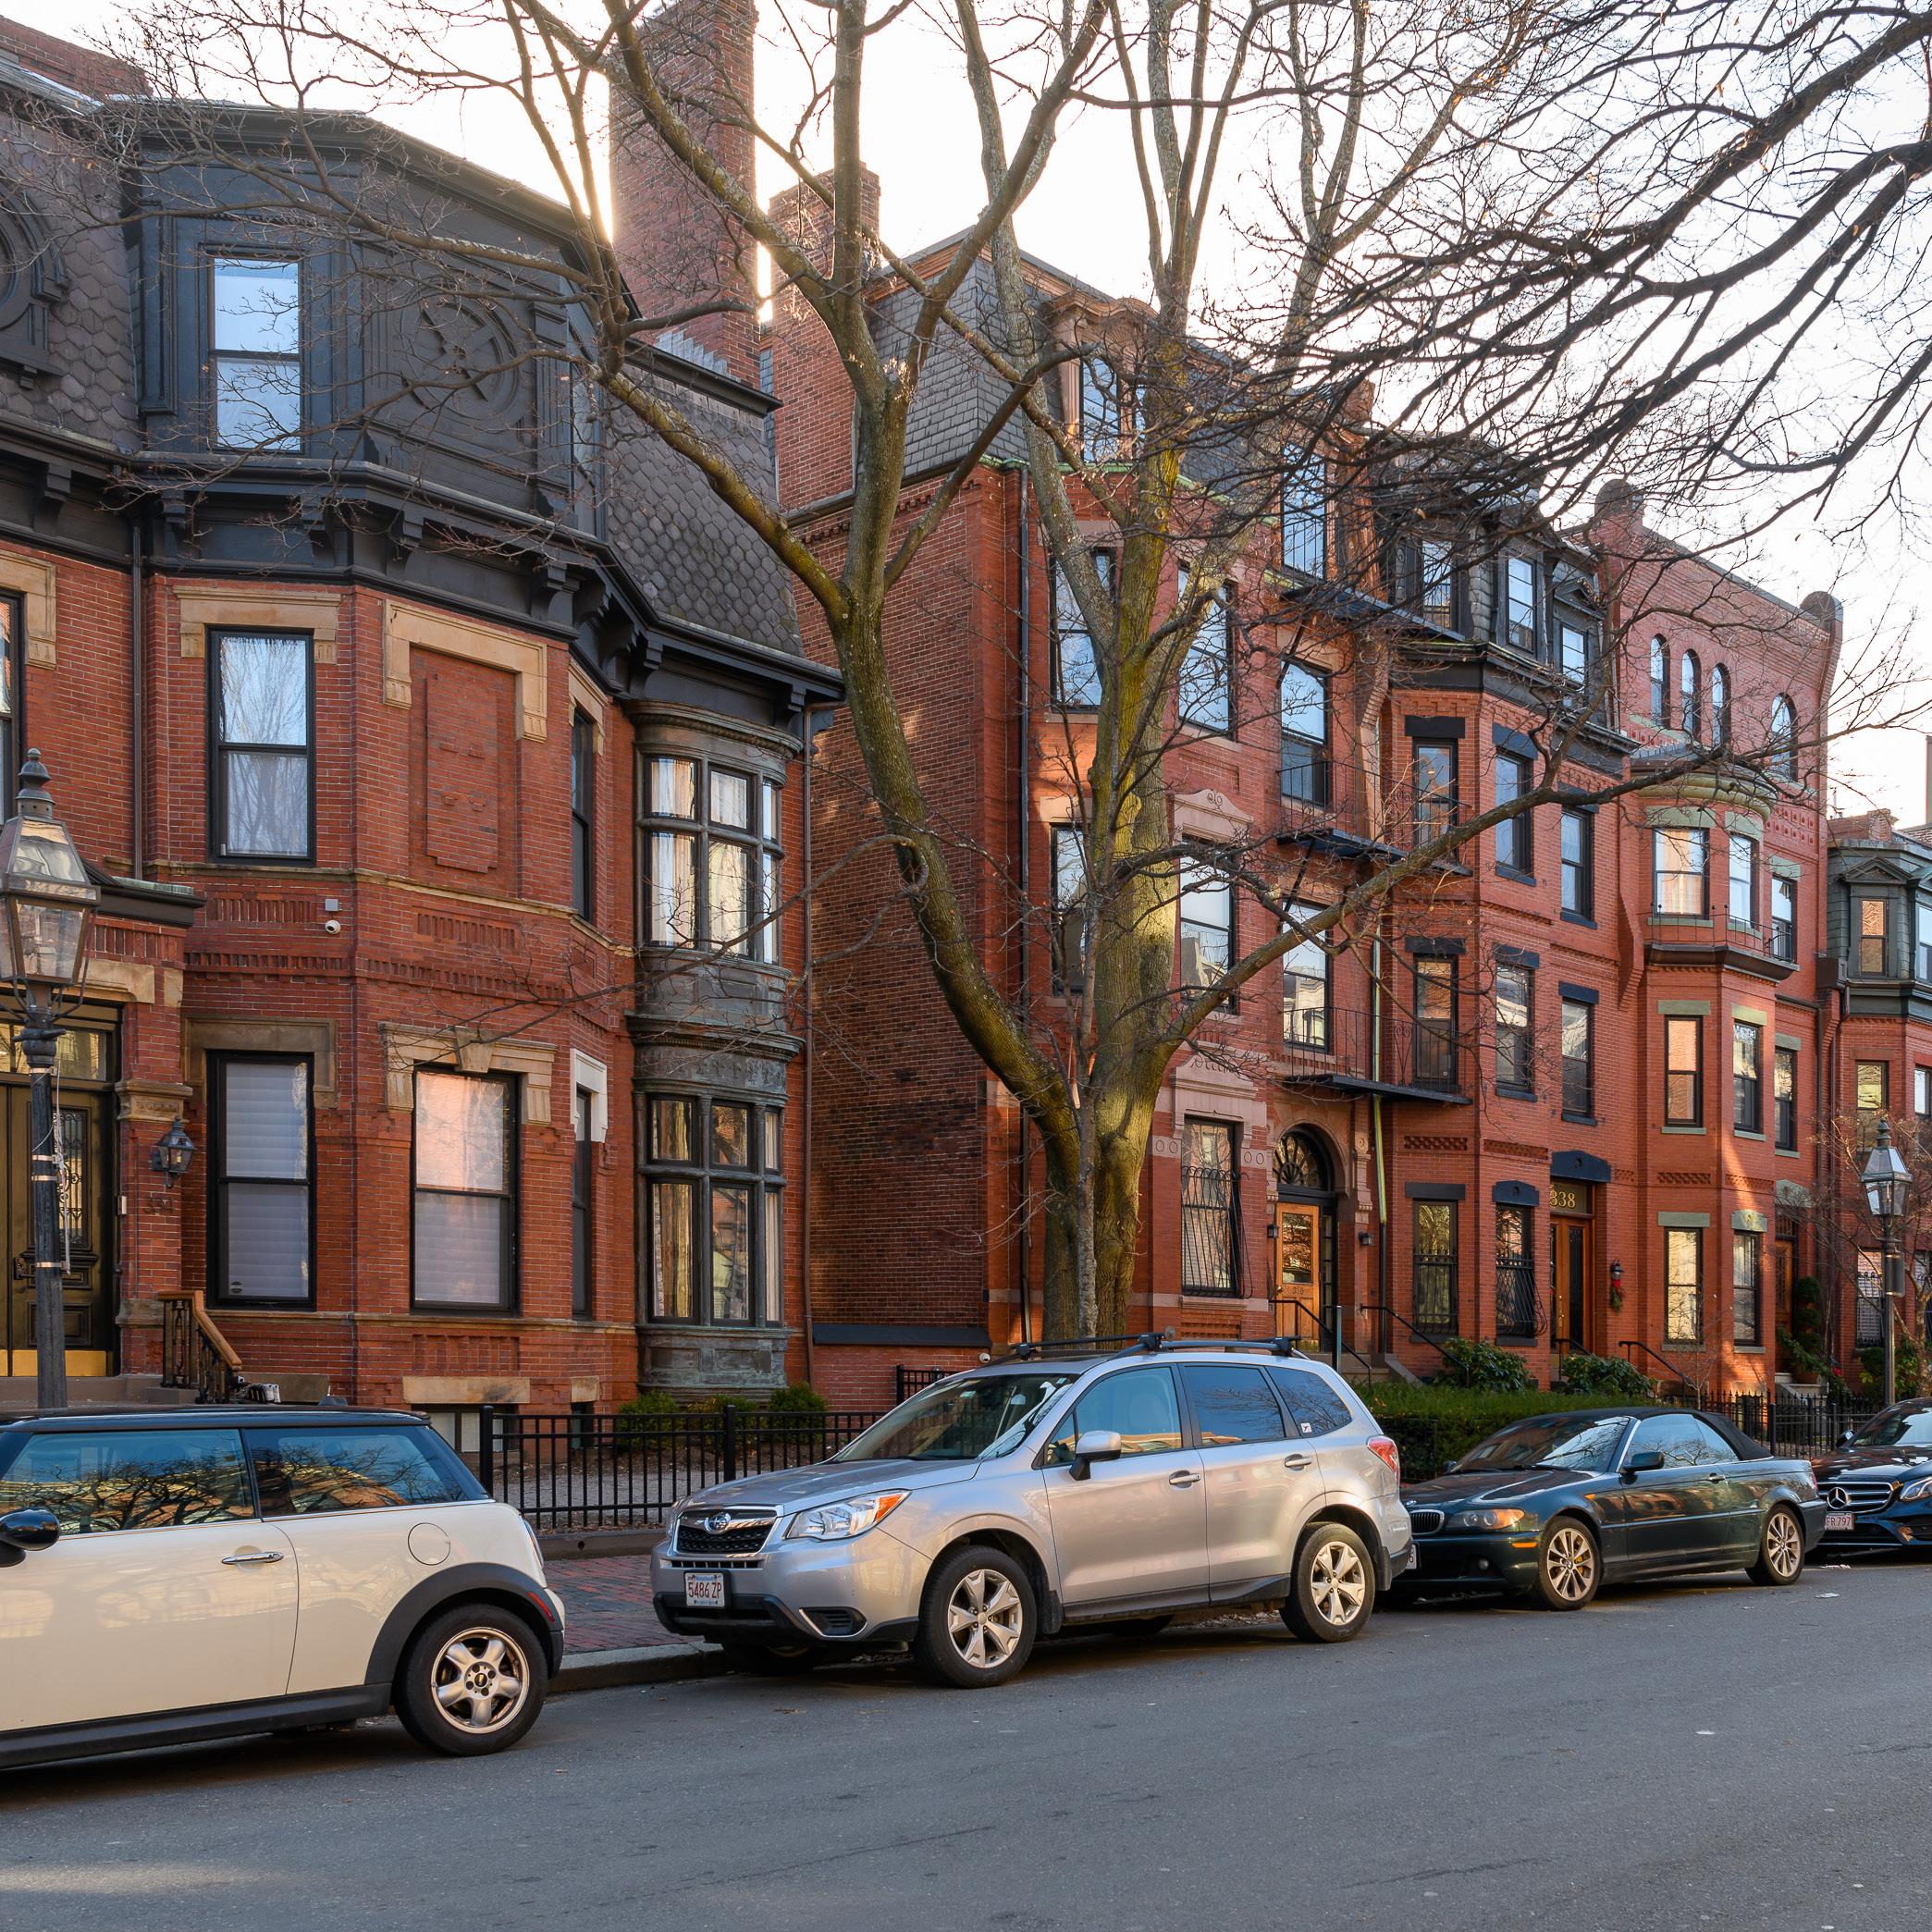
Change from 2022 to 2023 2019 2020 2021 2022 2023 Active 125 113 140 118 120 New 194 119 191 199 163 Sold 104 50 126 104 101 Pending 130 52 140 121 123 Average Days on Market 65 76 90 47 71 Median Sold Price $1,168,750 $1,100,500 $1,270,500 $1,415,500 $1,275,000
1.69% -18.09% -2.88% 1.65% -51.06% -9.89%
Beacon Hill
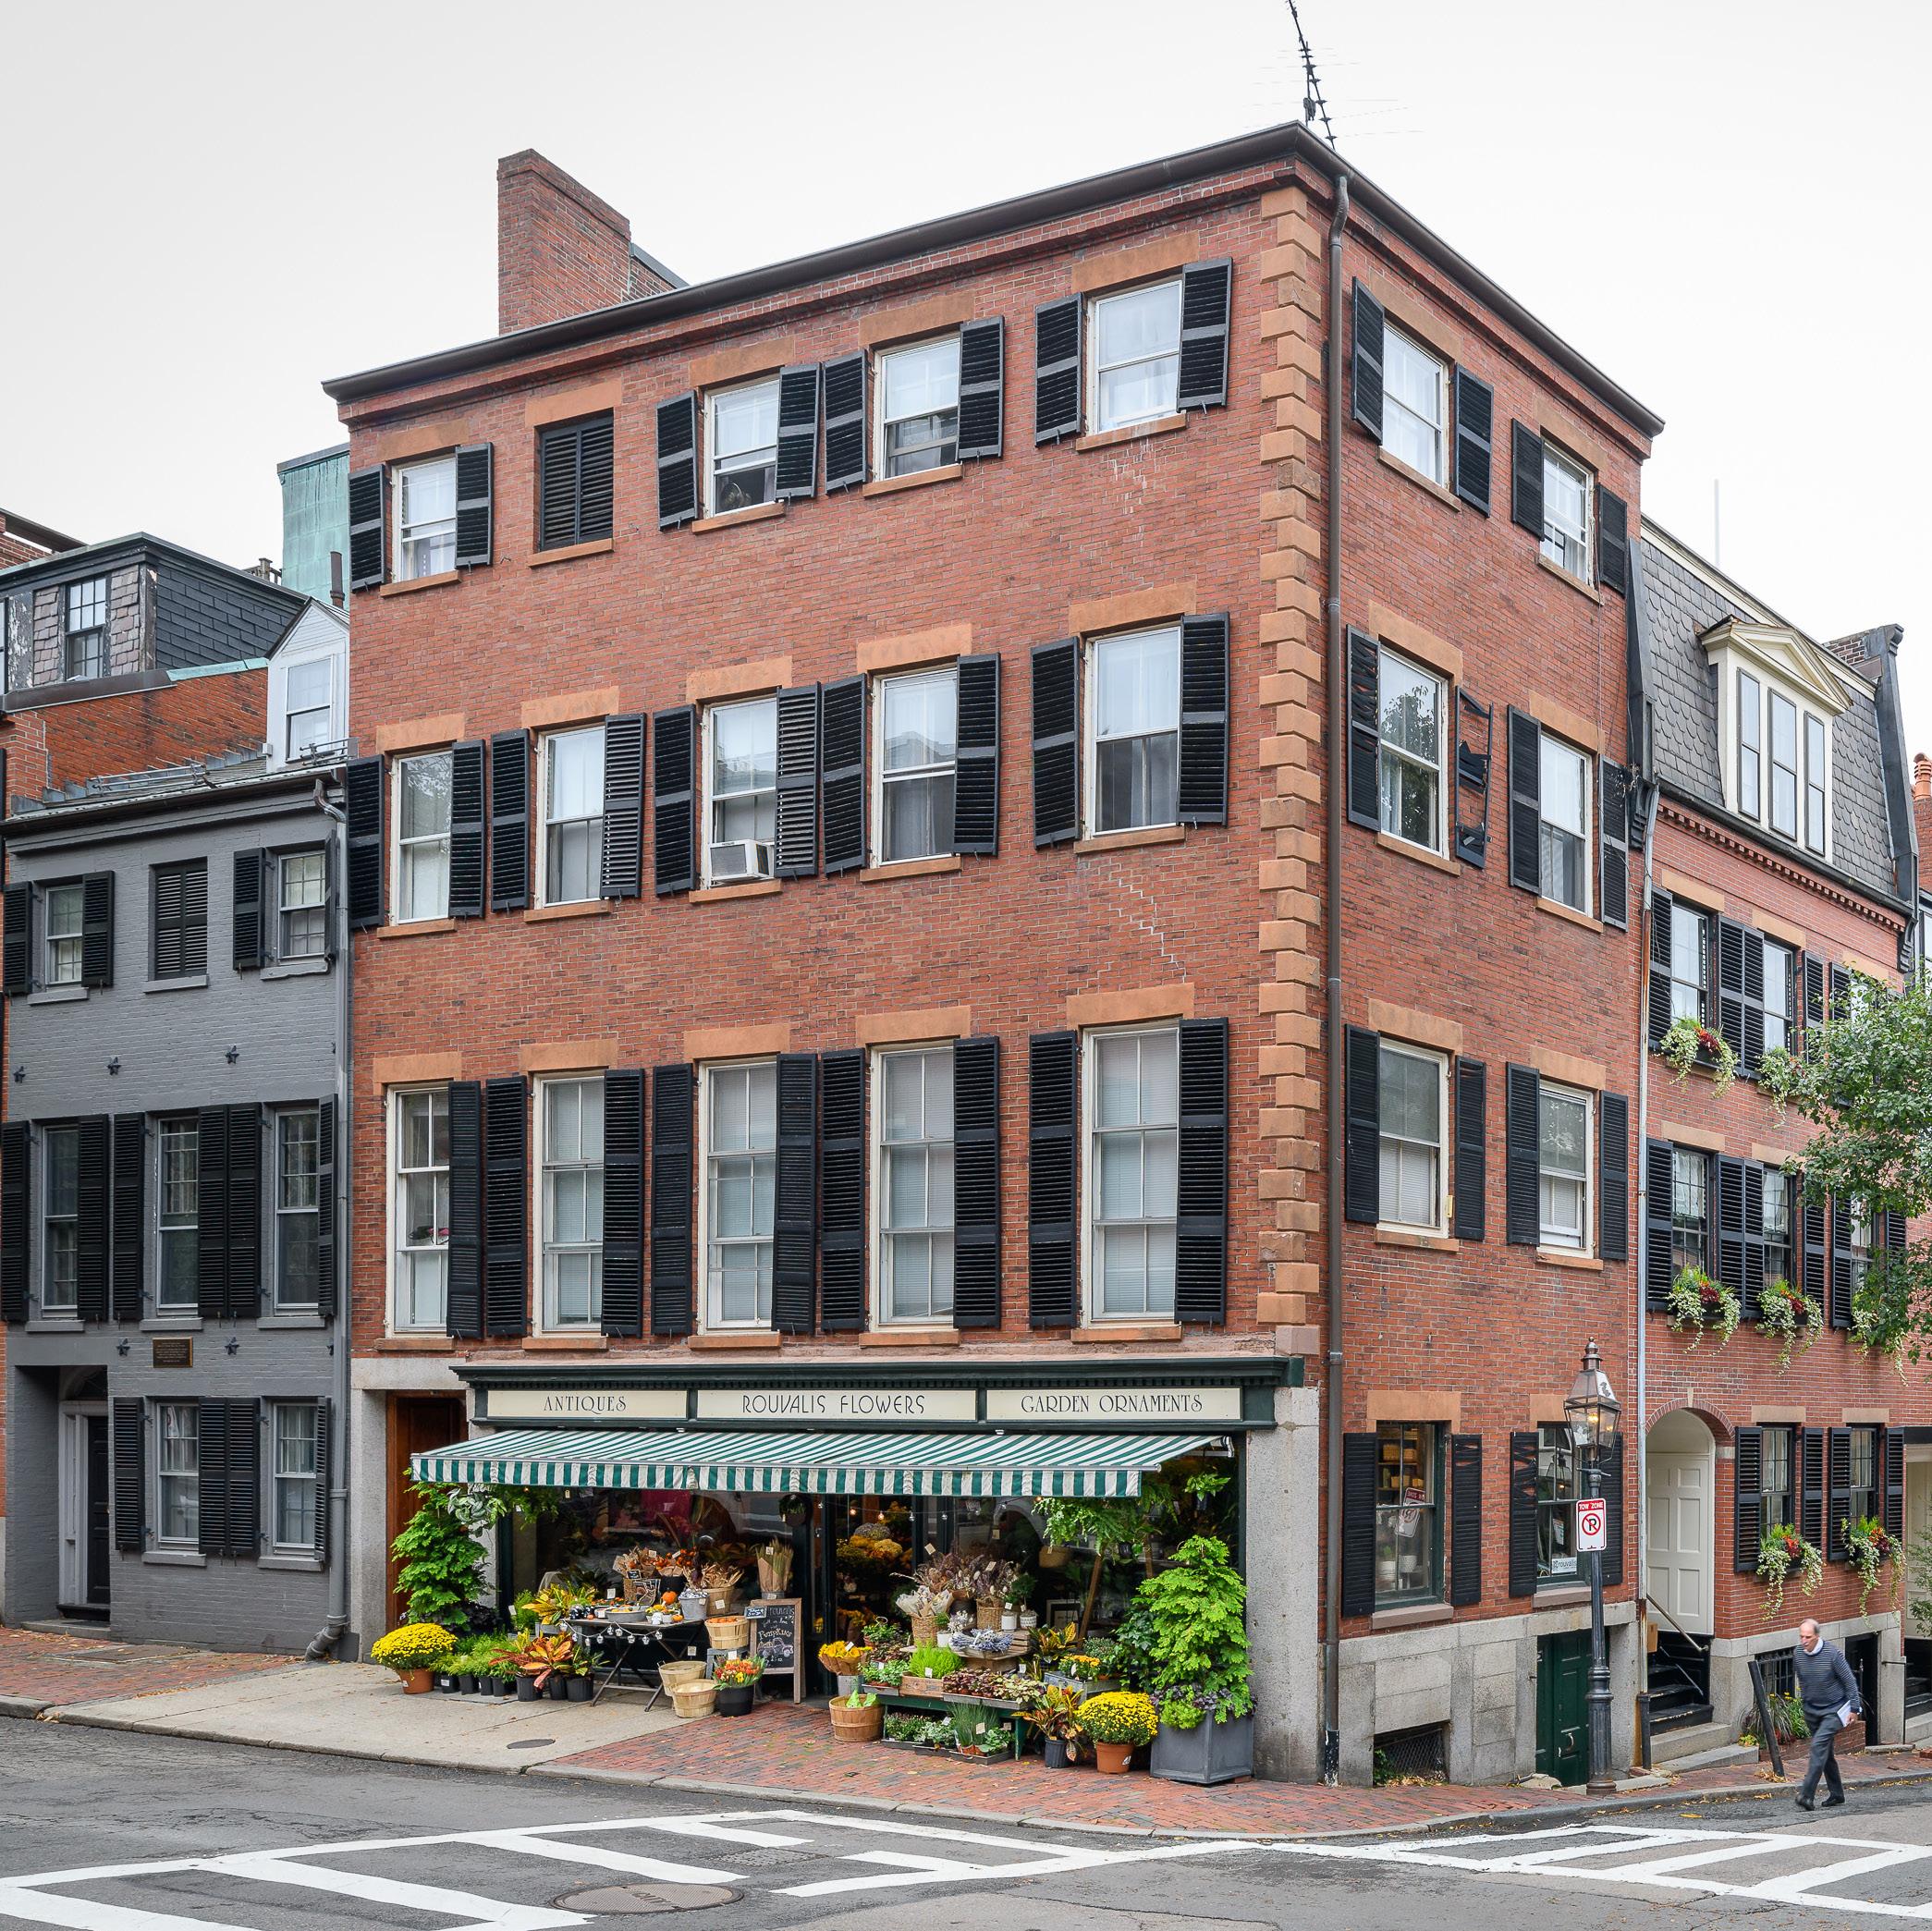
Beacon Hill
2019 2020 2021 2022 2023 Active 42 52 56 49 29 New 76 60 78 76 43 Sold 55 25 56 58 32 Pending 64 28 60 50 44 Average Days on Market 51 56 59 29 35 Median Sold Price $900,000 $791,000 $949,000 $1,210,000 $814,500 Boston | Condominiums
from 2022 to 2023
Change
-40.82% -43.42% -44.83% -12.00% 20.69% -32.69%
Bay Village

Bay Village
Change from 2022 to 2023 Boston | Condominiums
2019 2020 2021 2022 2023 Active 5 2 3 3 1 New 7 2 18 4 1 Sold 2 4 3 3 1 Pending 4 1 15 1 0 Average Days on Market 14 132 10 9 157 Median Sold Price $725,000 $1,300,000 $1,235,000 $1,250,000 $875,000 -66.67% -75.00% -66.67% -100.00% 1644.44%
-30.00%
Charlestown

2019 2020 2021 2022 2023 Active 41 52 40 31 22 New 128 125 140 125 84 Sold 69 51 113 104 65 Pending 112 92 118 111 77 Average Days on Market 43 27 32 27 30 Median Sold Price $710,000 $800,000 $845,000 $809,750 $905,500 Boston | Condominiums
Charlestown
Change from 2022 to 2023 -29.03% -32.80% -37.50% -30.63% 11.11% 11.76%
Midtown

2019 2020 2021 2022 2023 Active 72 64 50 50 70 New 67 46 43 51 73 Sold 33 16 28 29 43 Pending 43 15 32 25 47 Average Days on Market 114 86 147 87 42 Median Sold Price $1,235,000 $1,145000 $1,502,500 $1,300,000 $1,805,000 Boston | Condominiums
Midtown
from 2022 to 2023 40.00% 43.14% 48.28% 88.00%
38.85%
Change
-56.70%
North End
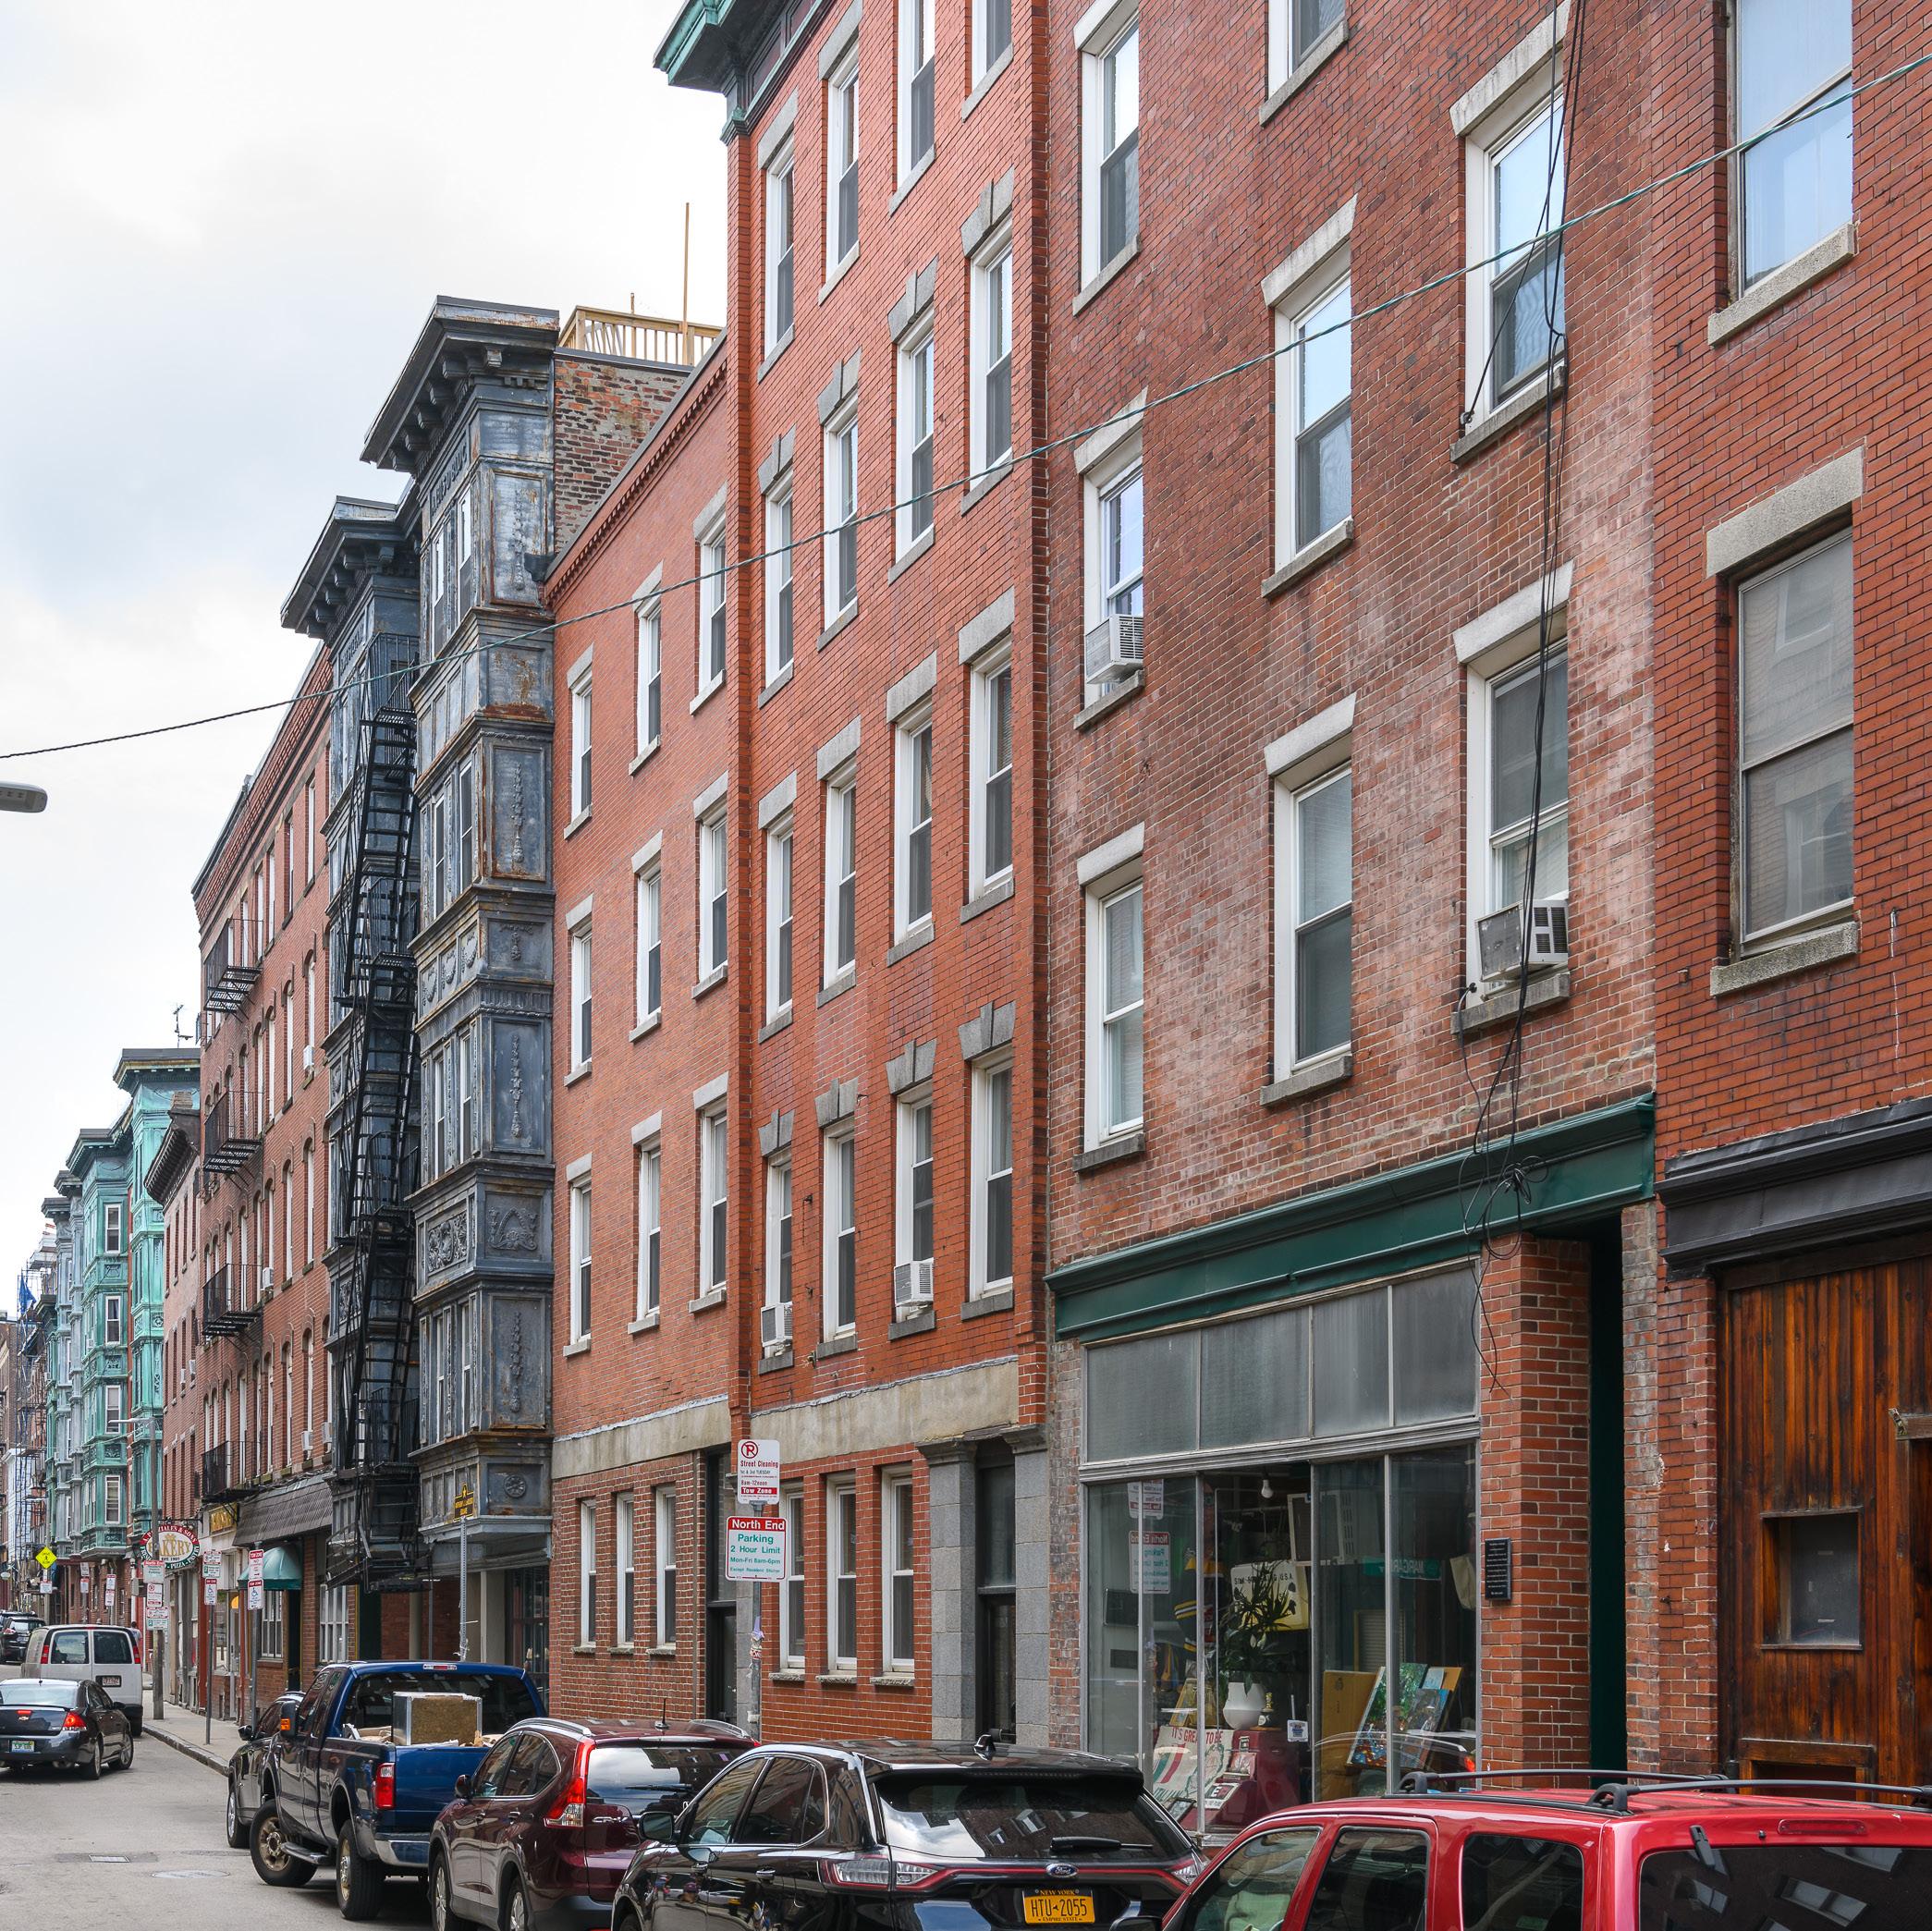
North End
Boston | Condominiums
Change from 2022 to 2023 2019 2020 2021 2022 2023 Active 33 17 14 17 10 New 45 33 39 34 26 Sold 13 17 34 20 11 Pending 20 23 33 25 19 Average Days on Market 49 56 47 49 23 Median Sold Price $700,00 $610,000 $685,000 $647,500 $635,000 -41.18%
-23.53% -45.00% -24.00% -53.06% -1.93%
Seaport District

Seaport District
Boston | Condominiums
Change from 2022 to 2023 2019 2020 2021 2022 2023 Active 46 44 49 46 60 New 108 45 83 53 51 Sold 87 29 56 39 23 Pending 84 16 61 33 22 Average Days on Market 27 49 58 102 57 Median Sold Price $2,300,000 $1,495,000 $1,637,000 $1,279,000 $1,295,000 30/43%
-3.77% -41.03% -33.33% -44.12% 1.25%
South Boston
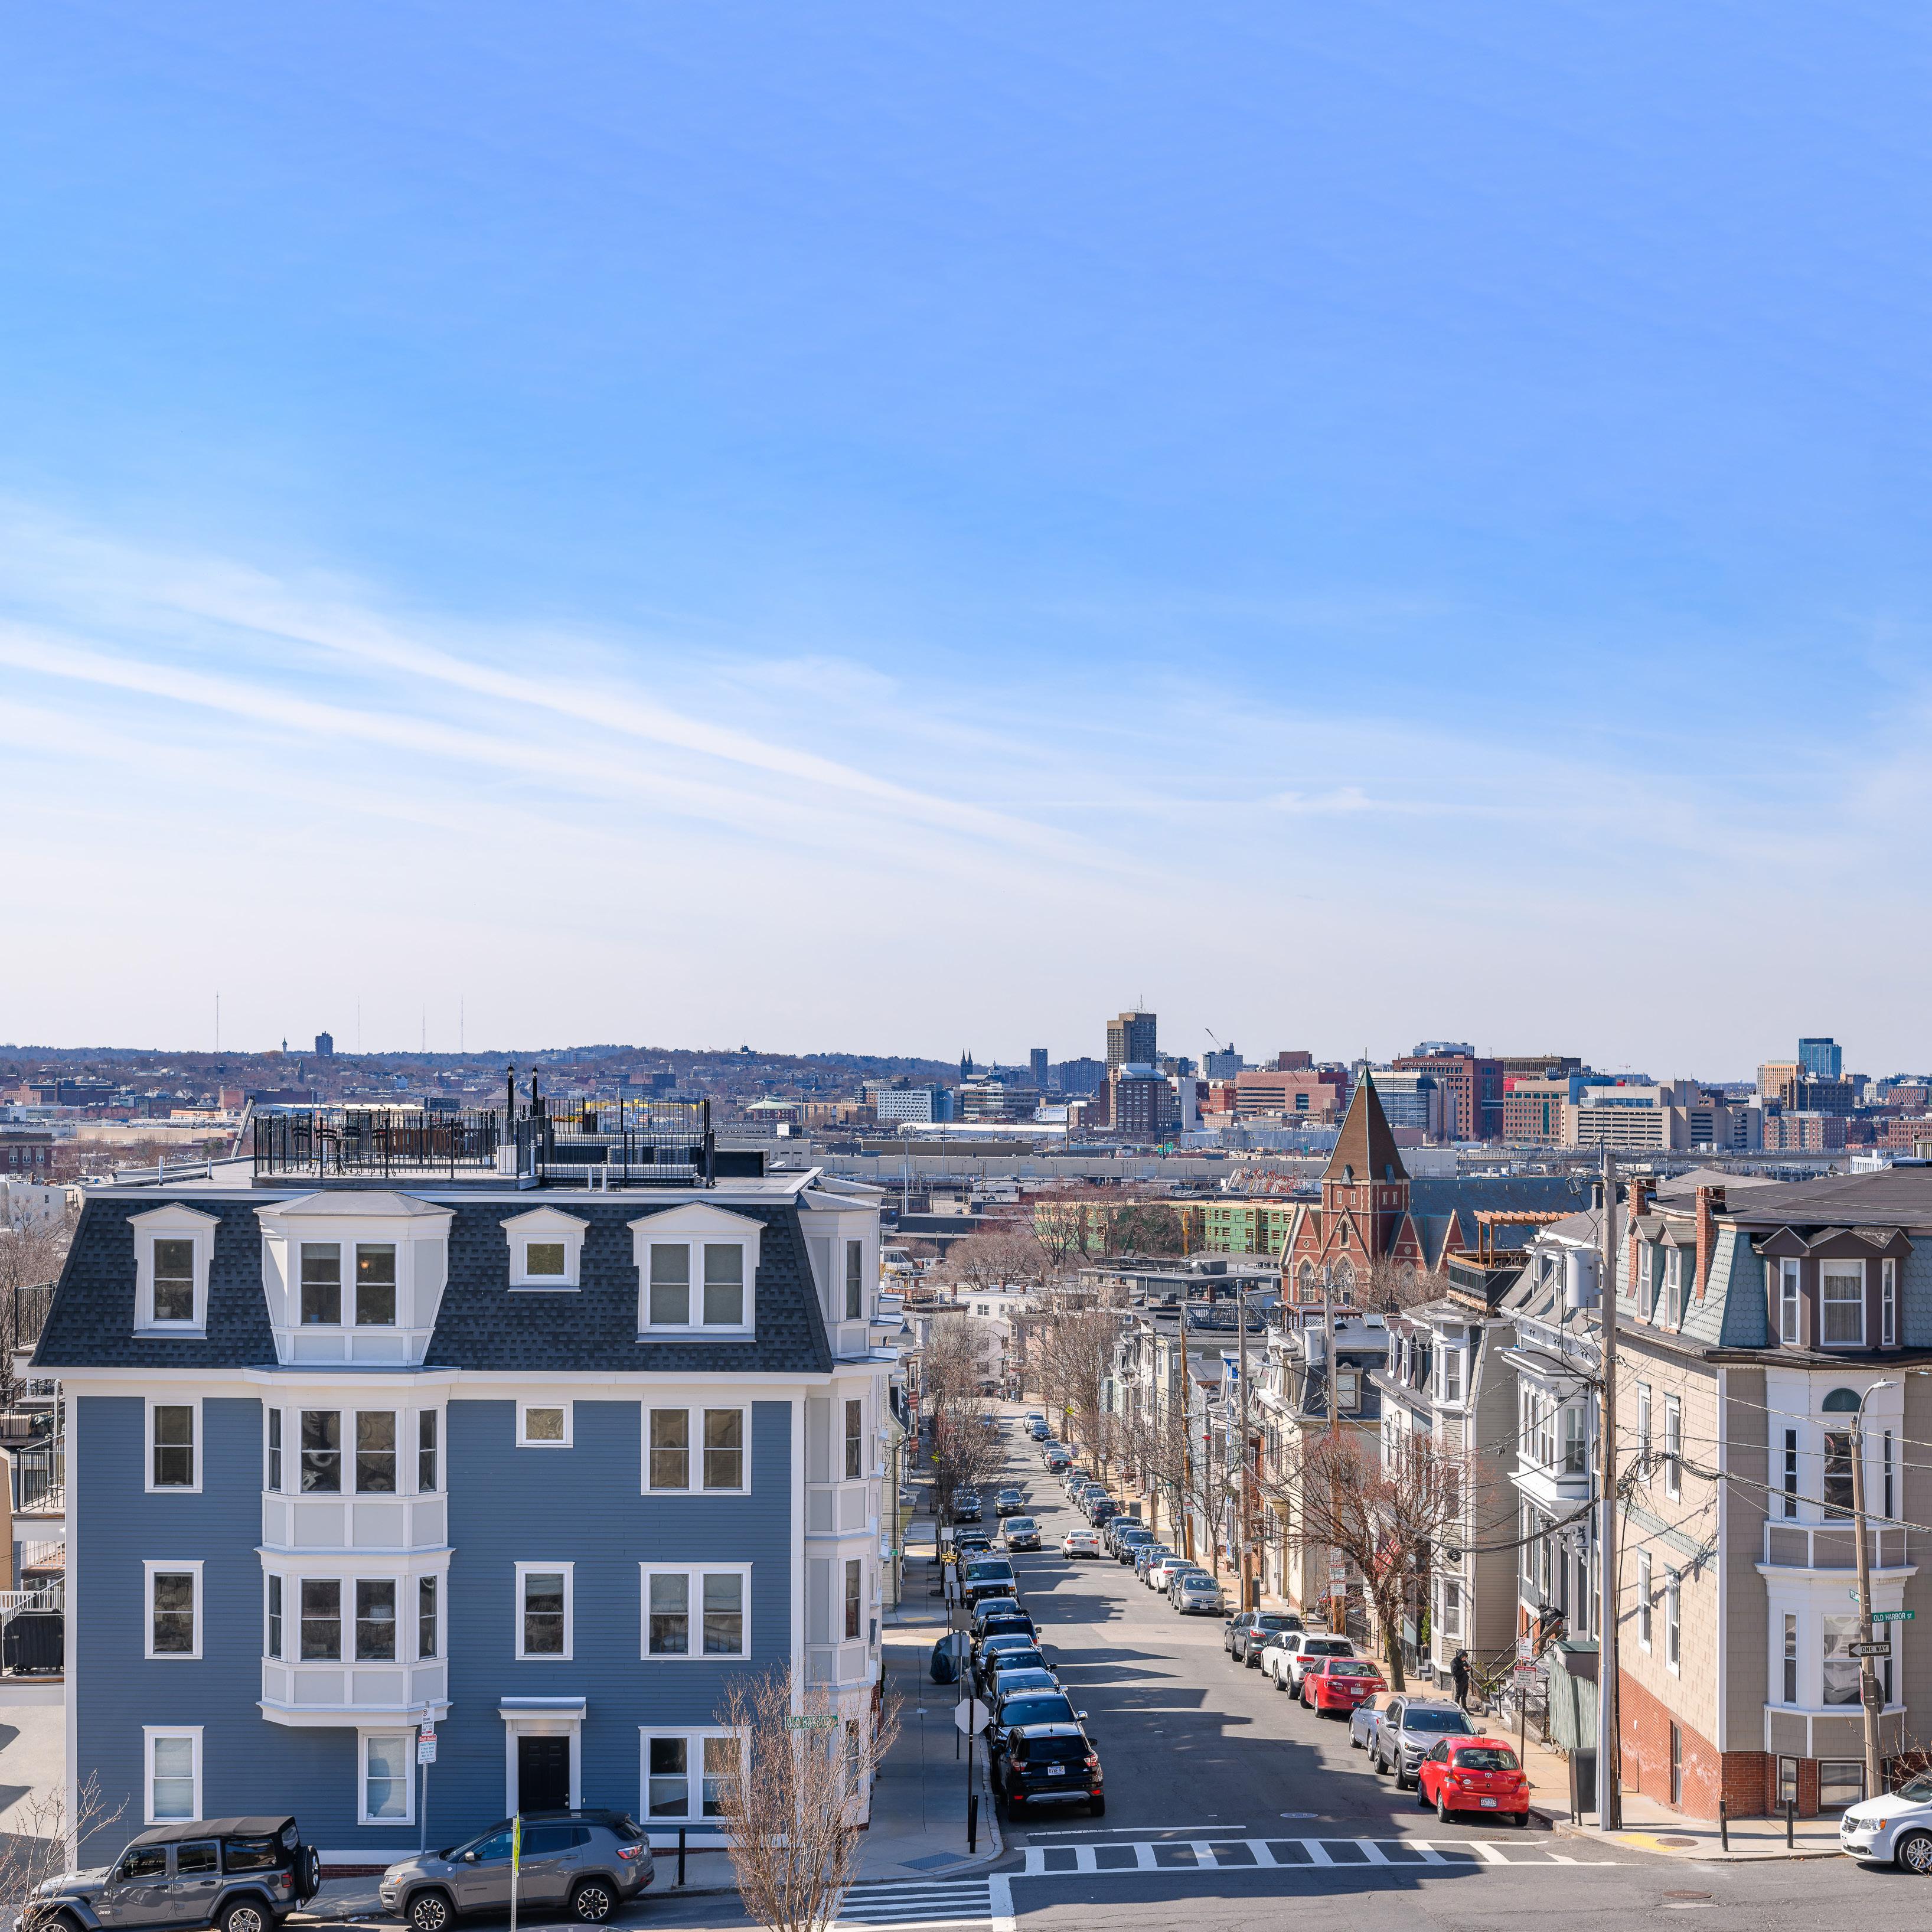
South Boston
-44.94%
-21.30% 11.43%
-7.96%
Boston | Condominiums
2019 2020 2021 2022 2023 Active 149 164 99 90 84 New 320 281 321 228 183 Sold 187 115 254 178 98 Pending 226 164 259 169 133 Average Days on Market 58 52 47 35 39 Median Sold Price $802,500 $780,000 $777,400 $867,500 $798,450
from 2022 to 2023
Change
-6.67% -19.74%
South End
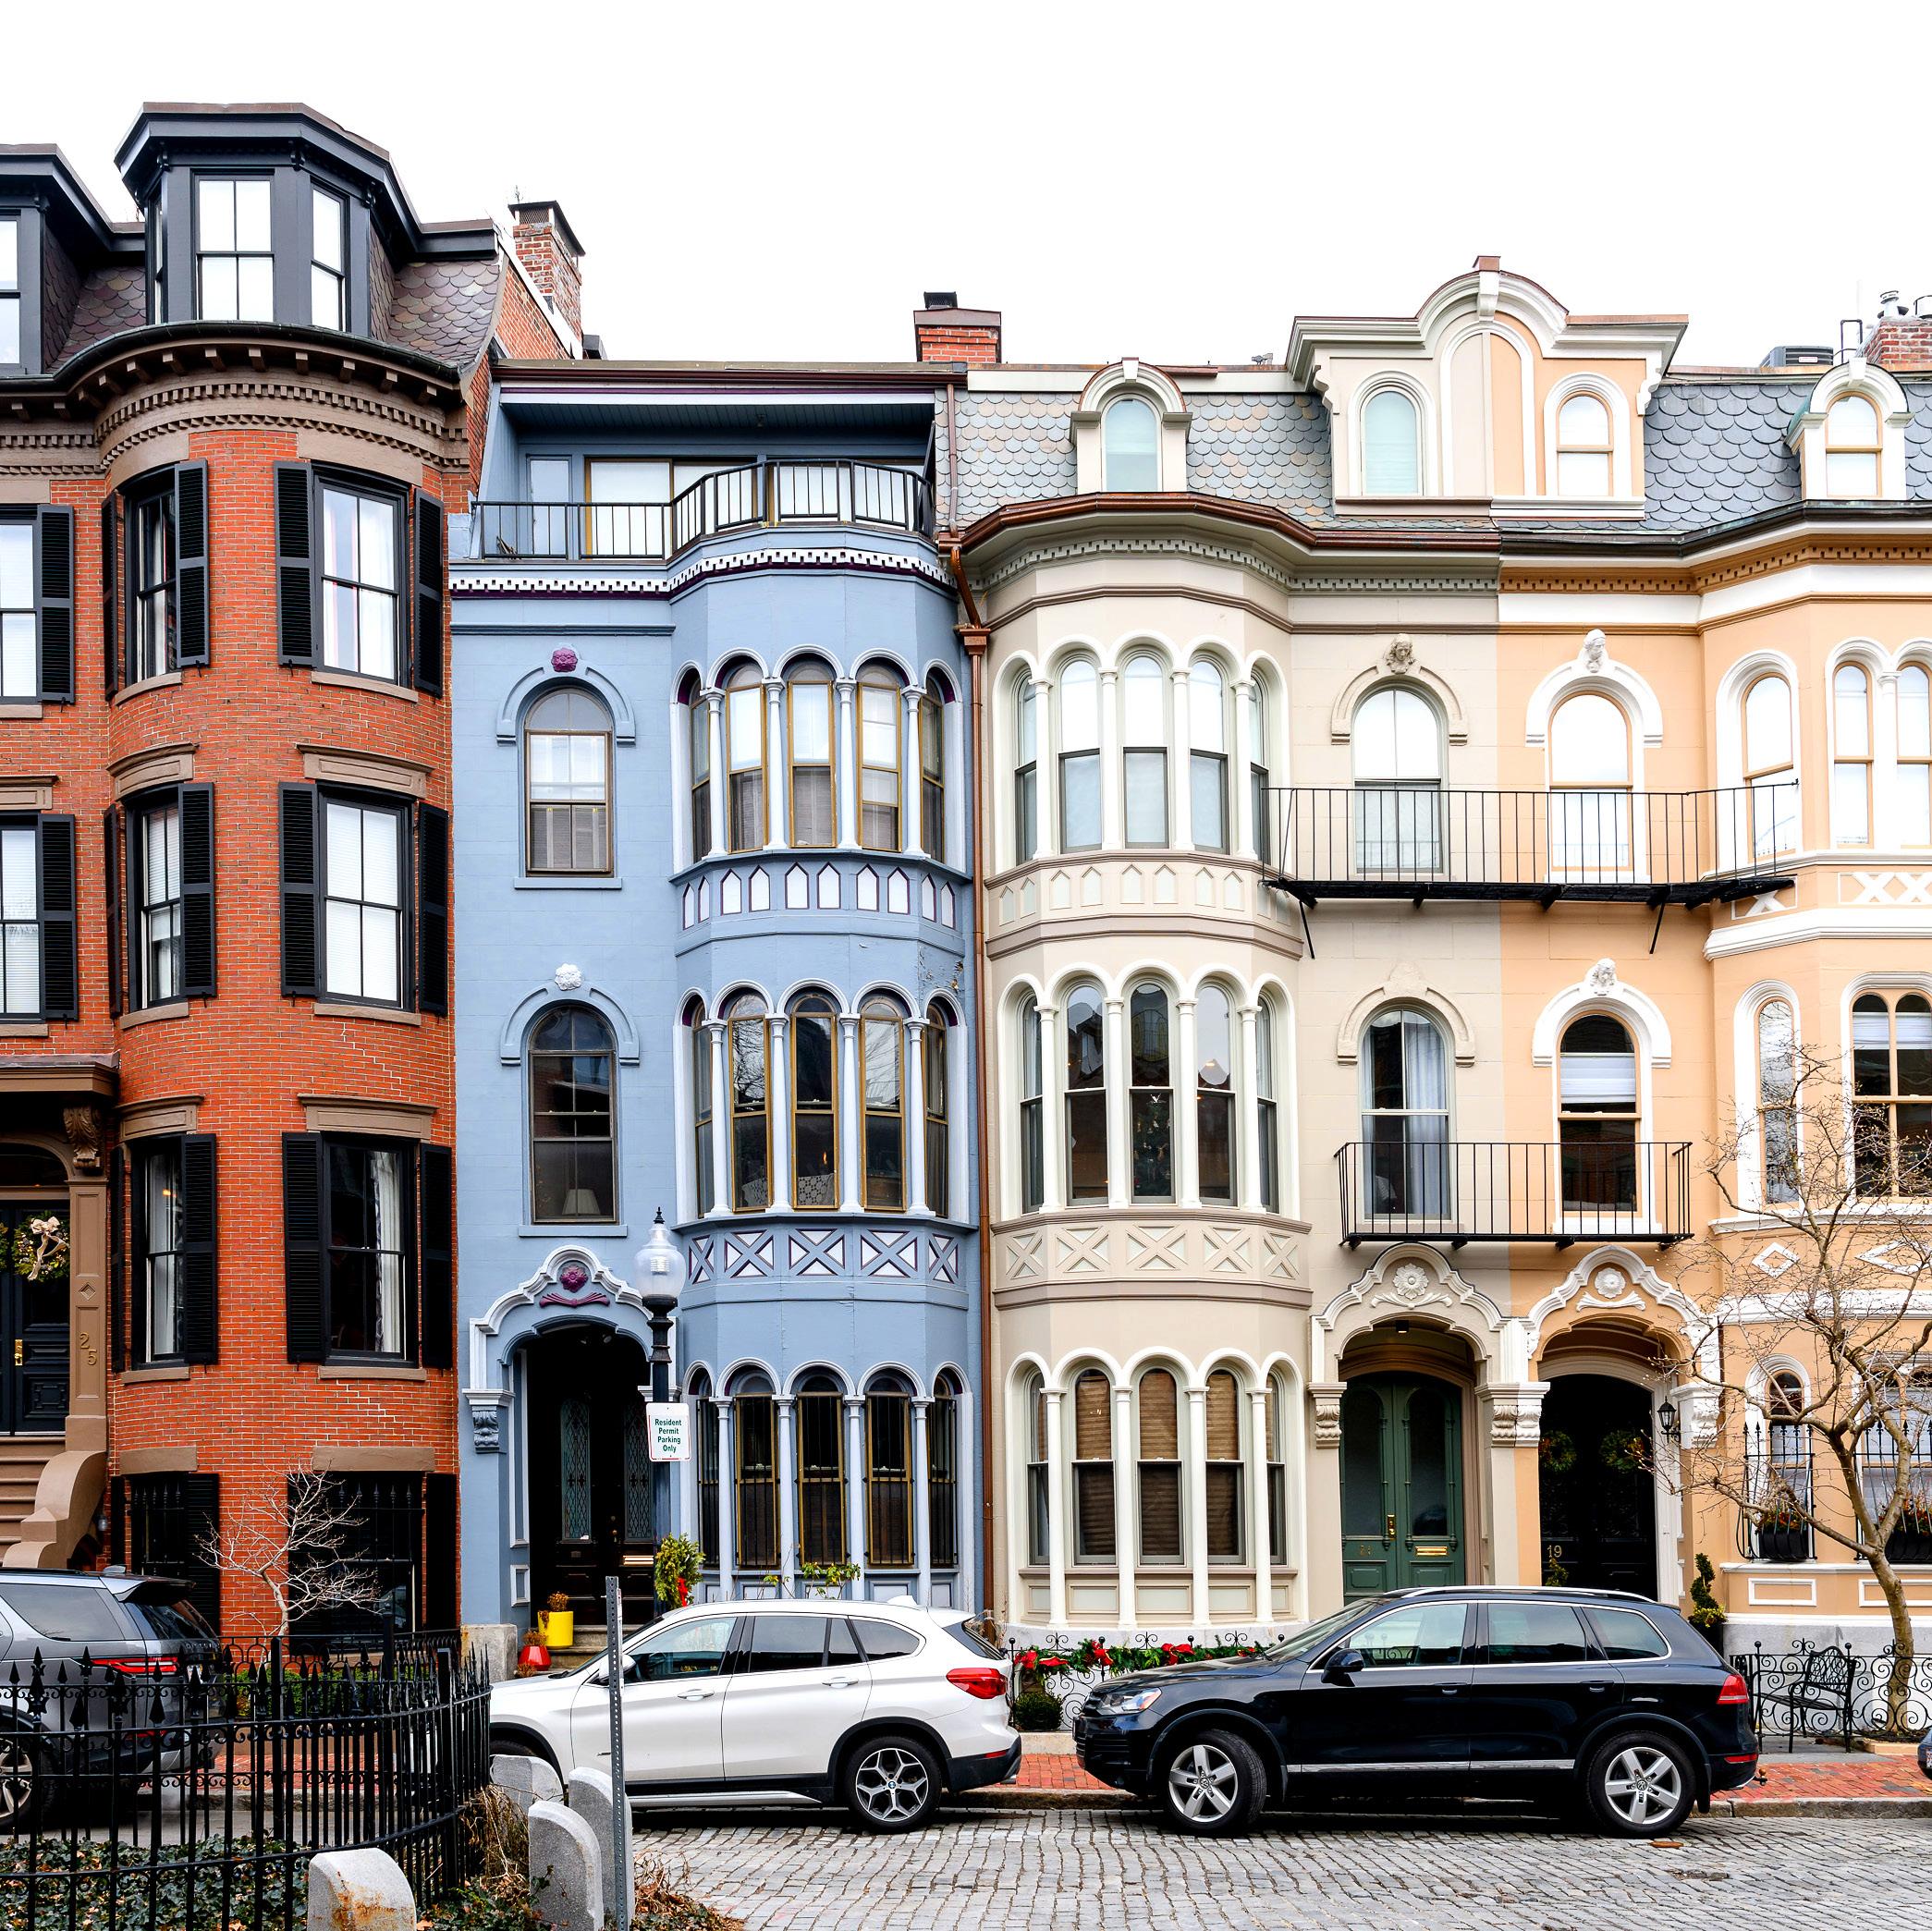
South End
2019 2020 2021 2022 2023 Active 66 170 123 134 95 New 169 256 266 296 201 Sold 129 80 215 210 106 Pending 148 120 198 214 146 Average Days on Market 46 35 48 32 42 Median Sold Price $955,500 $1,102,500 $915,950 $1,082,000 $1,150,500 Boston | Condominiums
Change
from 2022 to 2023 -29.10% -32.09% -49.52% -31.78% 31.25% 6.33%
Waterfront

2019 2020 2021 2022 2023 Active 82 70 64 49 47 New 84 73 84 69 45 Sold 29 24 46 48 28 Pending 40 28 50 43 27 Average Days on Market 82 81 93 63 46 Median Sold Price $1,455,000 $1,103,750 $1,077,500 $1,447,500 $1,172,500 Boston | Condominiums Waterfront
Change
from 2022 to 2023 -4.08% -34.78% -41.67% -37.21% -26.98% -19.00%
West End

West End
2019 2020 2021 2022 2023 Active 8 8 11 18 11 New 16 11 17 15 9 Sold 9 5 9 14 12 Pending 12 8 11 13 11 Average Days on Market 80 62 49 43 140 Median Sold Price $565,000 $600,500 $547,000 $515,000 $456,500 Boston | Condominiums
from 2022 to 2023
Change
-38.89% -40.00% -14.29% -15.38% 225.58% -11.36%


Our residential locations 1 Lewis Wharf, Boston, MA 02110 84 Atlantic Avenue, Boston, MA 02110 1675 Massachusetts Avenue, Cambridge, MA 02138 75 Park Avenue, Arlington, MA 02476 21 Cochituate Road, Wayland, MA 01778 Our residential locations 1 Lewis Wharf, Boston, MA 02110 84 Atlantic Avenue, Boston, MA 02110 1675 Massachusetts Avenue, Cambridge, MA 02138 75 Park Avenue, Arlington, MA 02476 21 Cochituate Road, Wayland, MA 01778


