2022 Luxury market overview

Executive Summary
The Boston luxury real estate market is a highly competitive and dynamic market that offers a range of high-end properties, including luxury apartments, condominiums, townhouses, and single-family homes with prices typically in the millions of dollars. The market is driven by a mix of local demand, international investors, and luxury buyers from other parts of the United States.
Some of the most desirable neighborhoods for luxury real estate in Boston include Back Bay, Beacon Hill, the South End, Seaport, and the Waterfront. These areas offer a mix of historic and modern architecture, as well as proximity to high-end shopping, dining, and cultural attractions, as well as top-rated schools and universities.
The prices for luxury properties in Boston vary widely depending on factors such as location, size, amenities, and views. The market for luxury real estate is affected by various factors, such as economic conditions, political stability, and consumer confidence. In general, luxury properties in Boston can range from several million dollars to tens of millions of dollars.
One trend that has emerged in recent years is the increasing demand for sustainable luxury properties. Many high-end buyers are now looking for properties that incorporate eco-friendly features, such as energy-efficient systems, renewable energy sources, and ecofriendly materials. Another trend in the luxury real estate market is the growing popularity of smart homes. Many luxury properties now come equipped with the latest home automation systems, which allow owners to control everything from lighting and heating to security and entertainment systems.
The Boston luxury real estate market has remained relatively strong, despite fluctuations in the overall housing market. However, like any real estate market, it is subject to economic and other external factors that can influence demand and prices. Overall, the Boston luxury real estate market remains a desirable investment for both individuals and corporations seeking to diversify their portfolios and secure long-term wealth and is expected to continue to grow in the coming years, as more high-end buyers invest in properties that offer both luxury and sustainability.
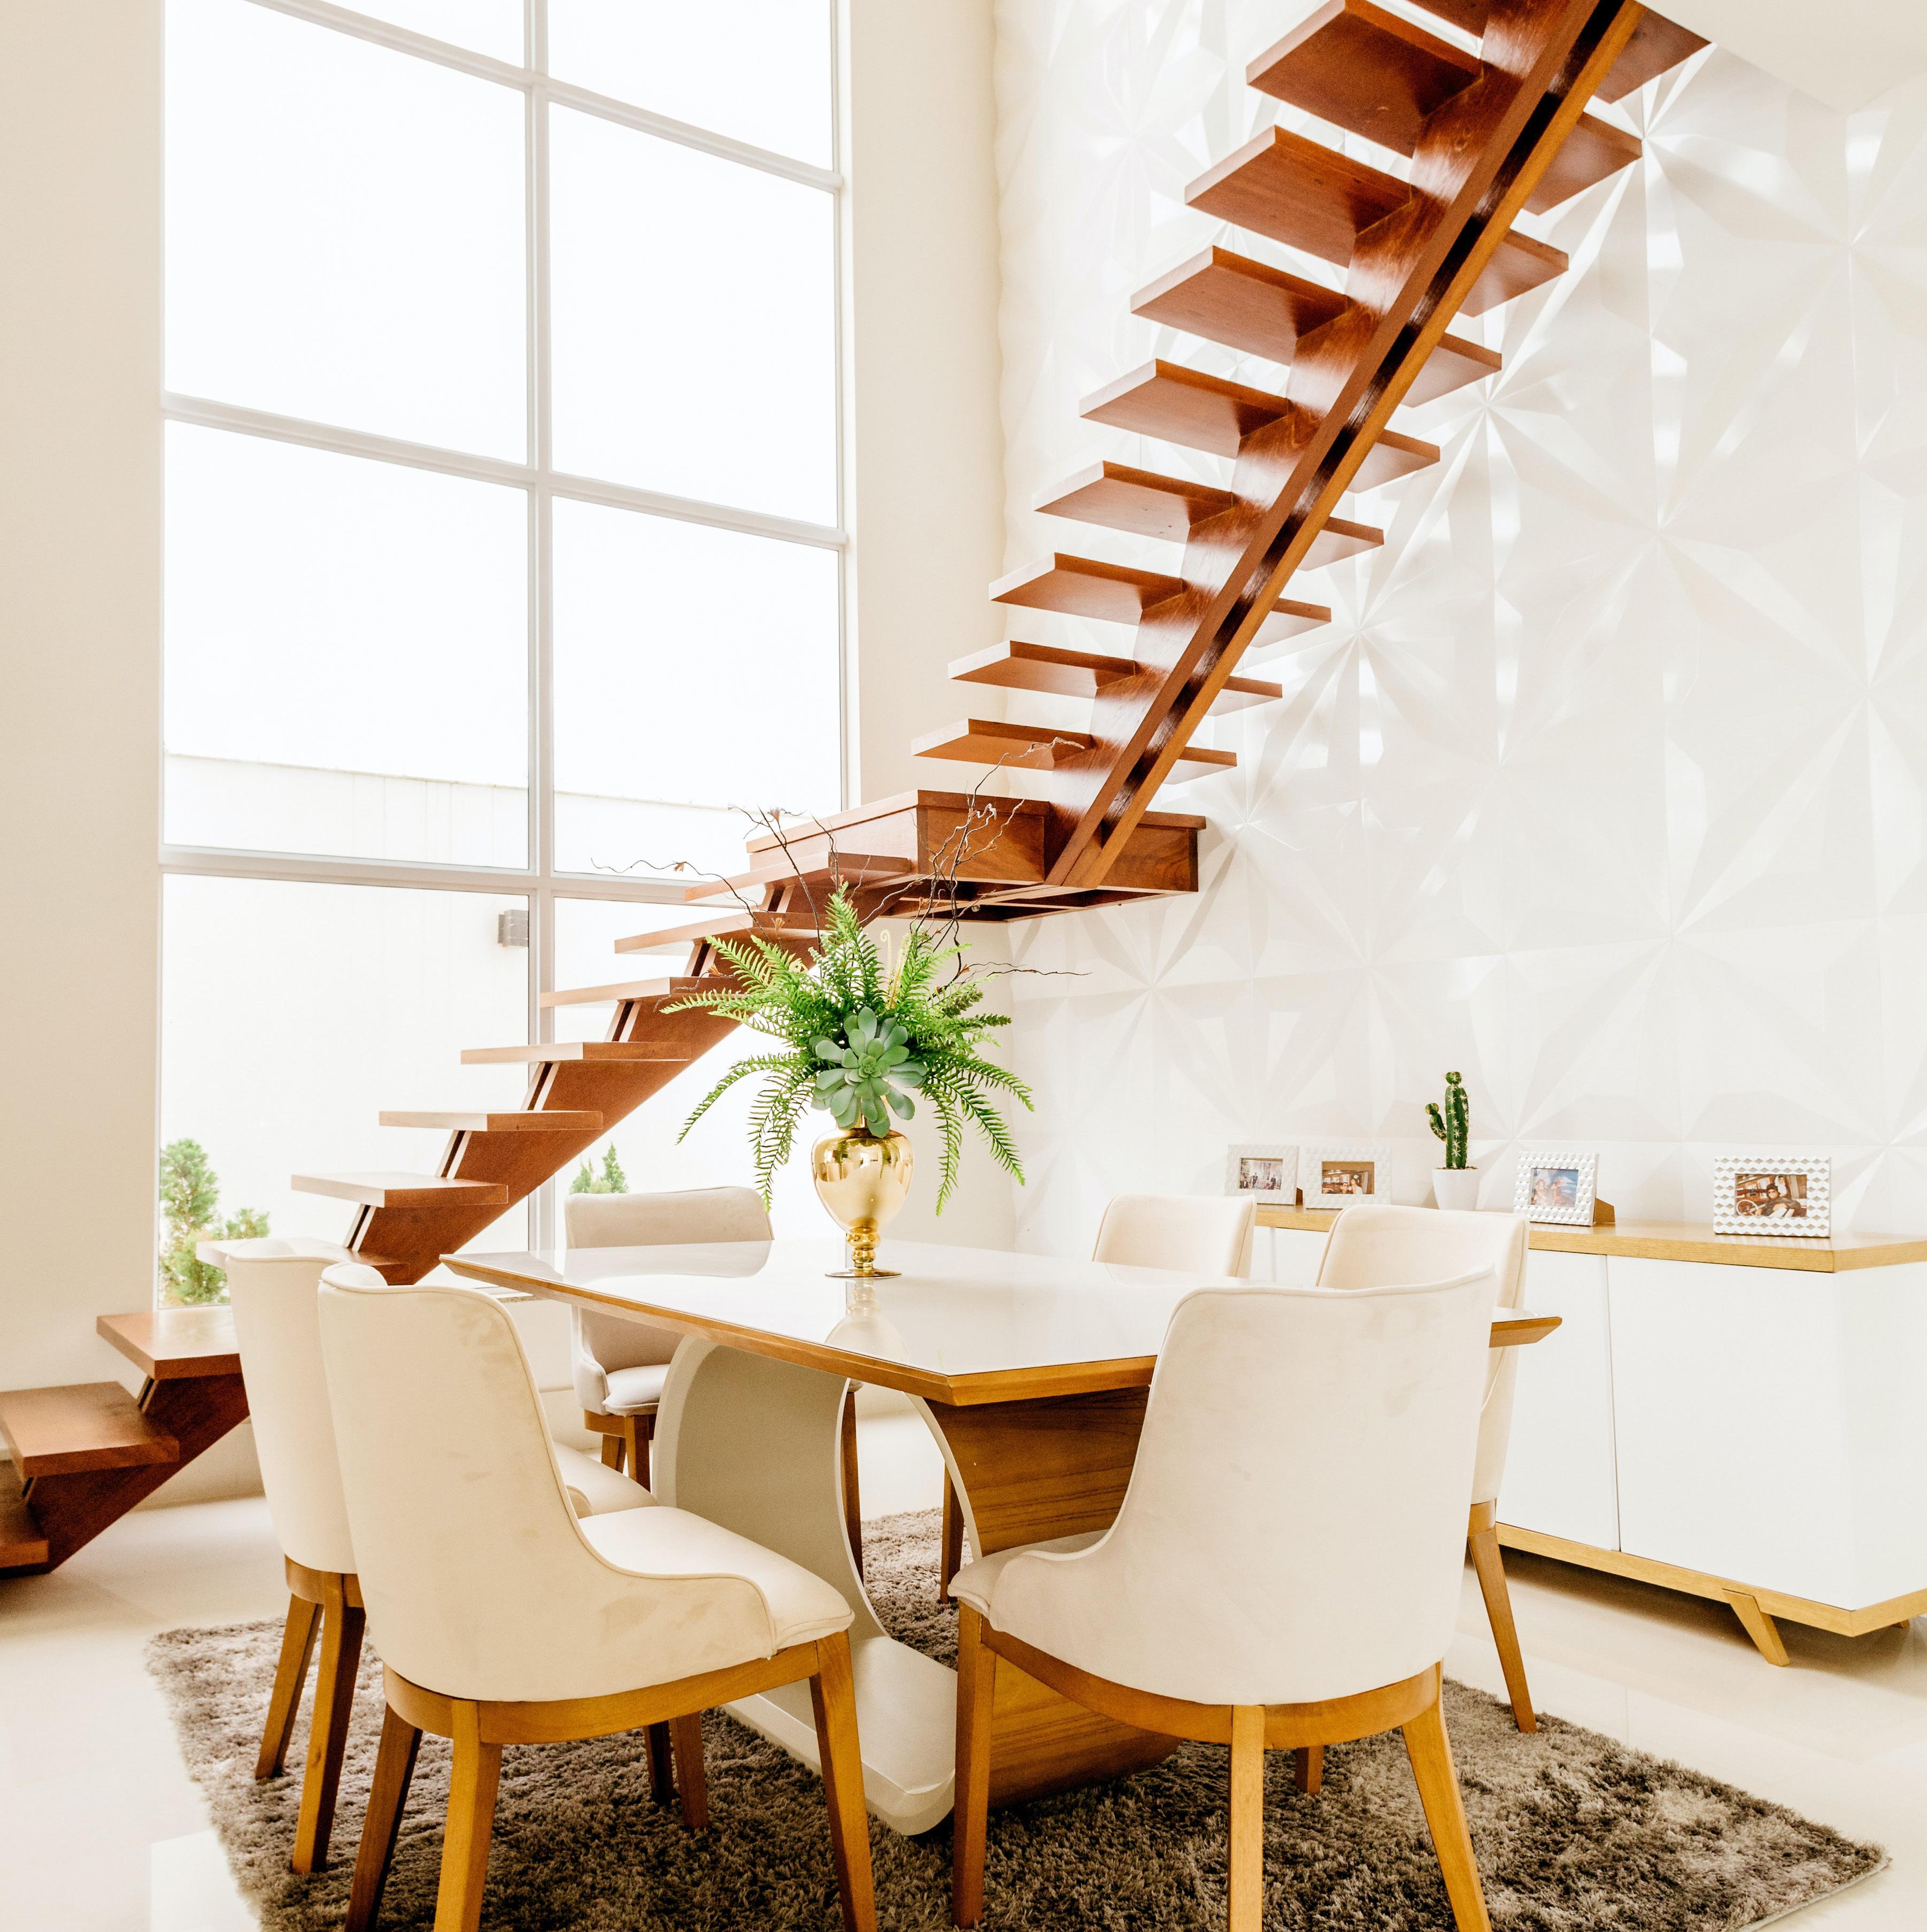
Back Bay

Back Bay
-14.48%
Single Family Homes, Condominiums, $2M+
34.21% -15.75%
2.88% -23.91%
Change from 2021 to 2022 2018 2019 2020 2021 2022 Active 35 47 60 38 51 New 148 188 168 208 214 Sold 103 81 74 127 107 Pending $102 $103 73 138 105 Average Days on Market 105 98 97 120 78 Median Sold Price $2,950,000 $2,865,000 $2,930,000 $3,625,000 $3,100,000
-35.00%
Bay Village
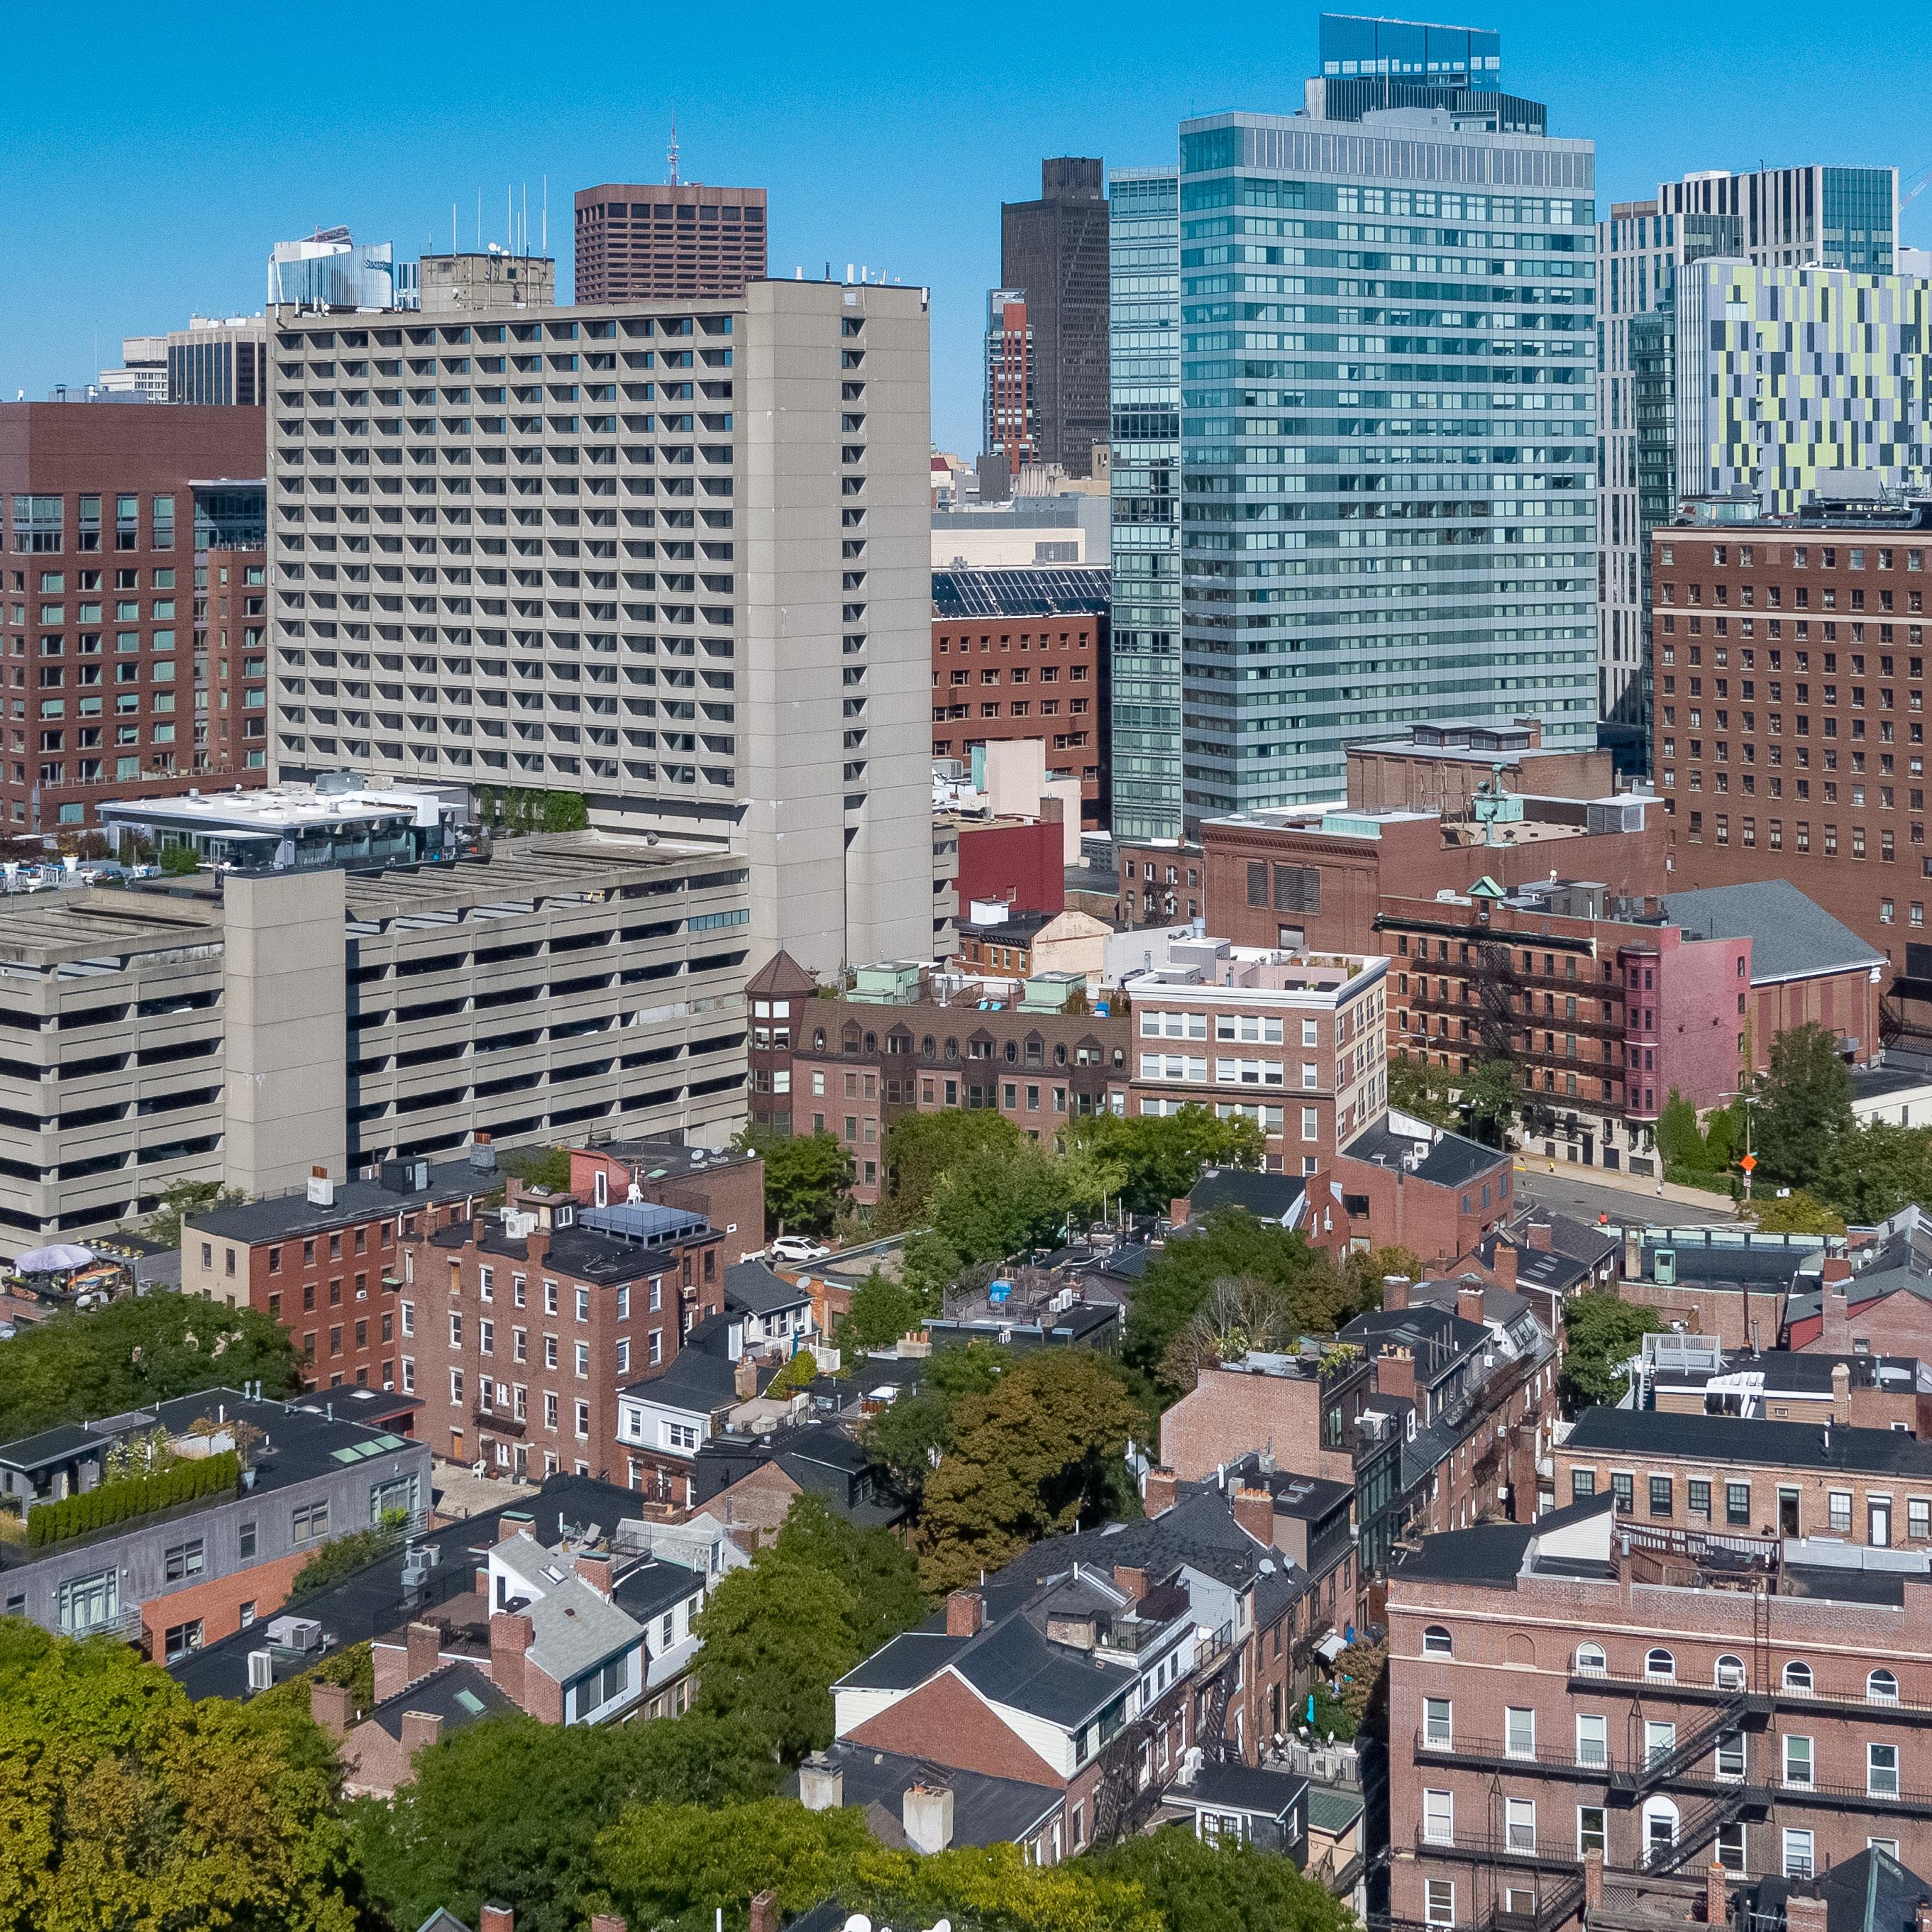
Bay Village
Change from 2021 to 2022
Condominiums,
Single Family Homes,
$2M+
0% 350%
-36.36% -90.91%
2018 2019 2020 2021 2022 Active 2 1 0 0 0 New 10 11 1 11 7 Sold 4 2 3 2 9 Pending 5 3 2 11 1 Average Days on Market 114 23 258 13 16 Median Sold Price $2,200,000 $2,312,500 $2,335,000 $2,443,000 $2,950,000
23.08%
20.75%
Beacon Hill
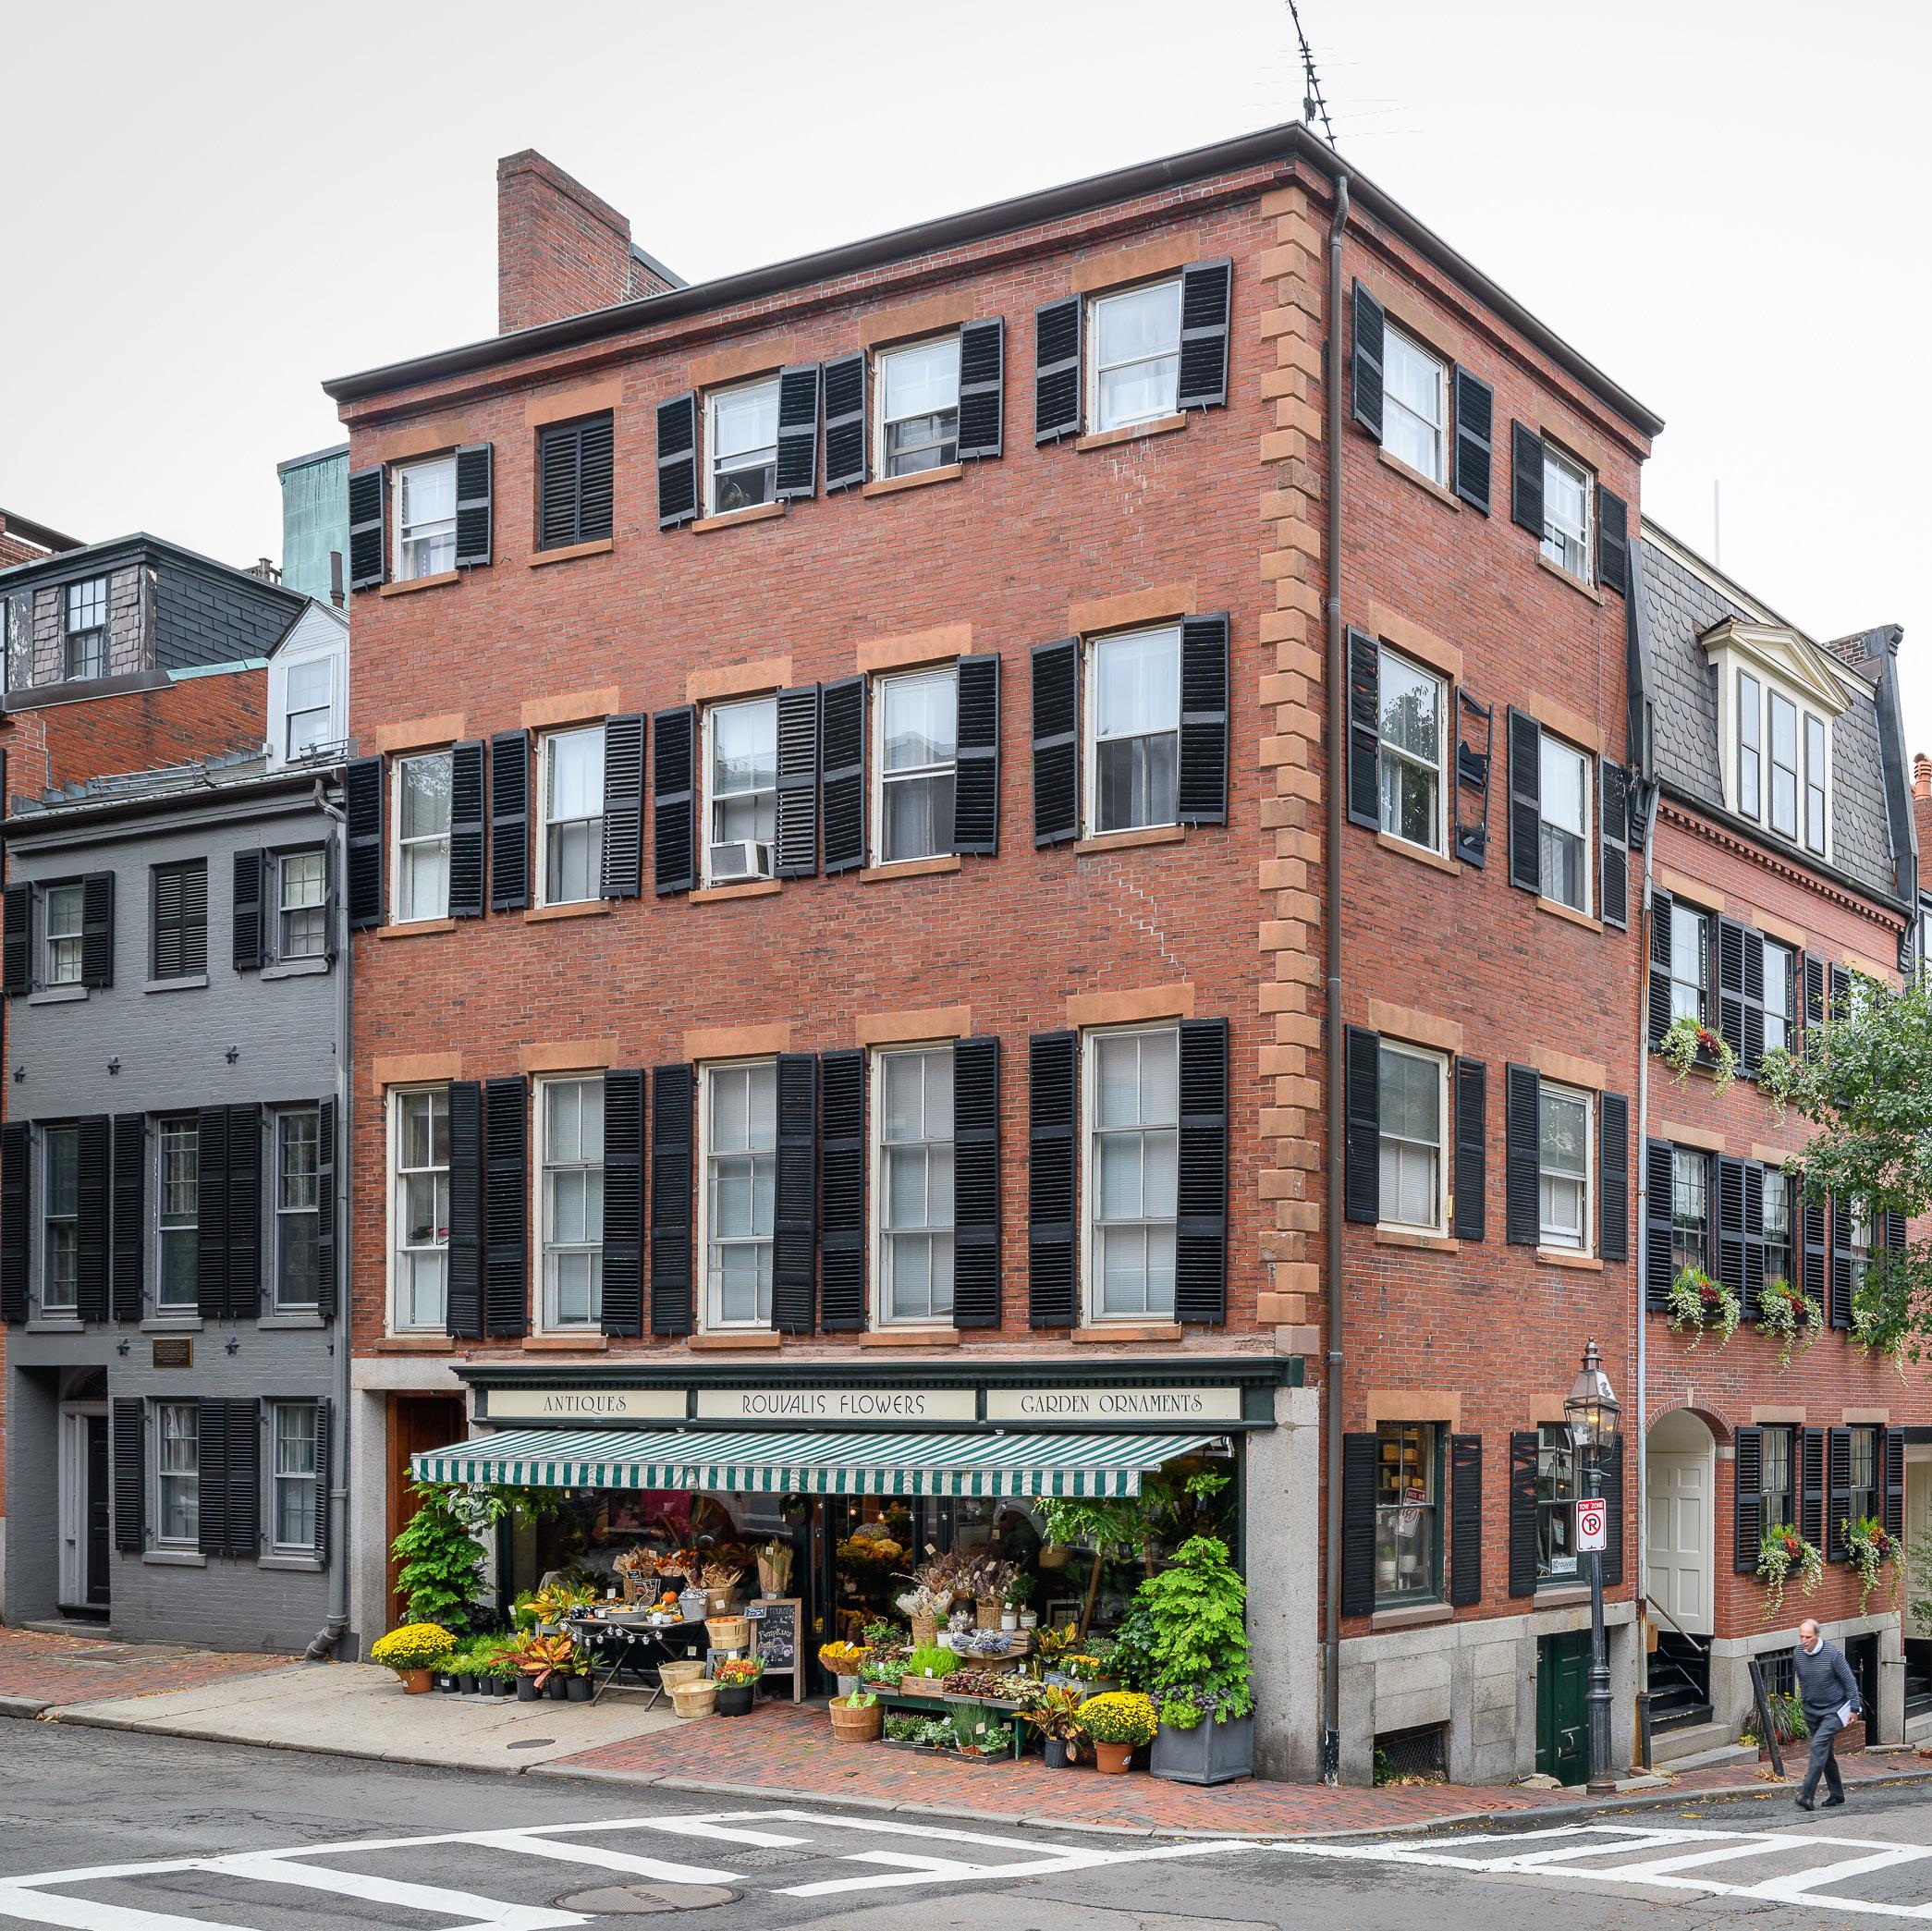
Change from 2021 to 2022
2018 2019 2020 2021 2022 Active 21 20 40 27 18 New 70 95 94 113 102 Sold 37 50 38 62 64 Pending 36 60 34 66 62 Average Days on Market $143 $125 93 134 80 Median Sold Price $3,230,000 $3,225,000 $3,975,000 $3,237,500 $3,352,500
Single Family Homes, Condominiums, $2M+
Beacon Hill -33.33% 3.23% -40.30% -9.73% -6.06% 3.55%
Charlestown

2018 2019 2020 2021 2022 Active 1 0 1 0 5 New 8 5 7 9 23 Sold 4 5 3 6 15 Pending 4 5 6 8 15 Average Days on Market 83 118 23 41 35 Median Sold Price $2,044,375 $2,500,000 $2,180,000 $2,300,000 $2,500,000
Family Homes, Condominiums, $2M+ Charlestown
Single
155.56% 150% -14.63% 0% 87.50% 8.70% Change from 2021 to 2022
Midtown
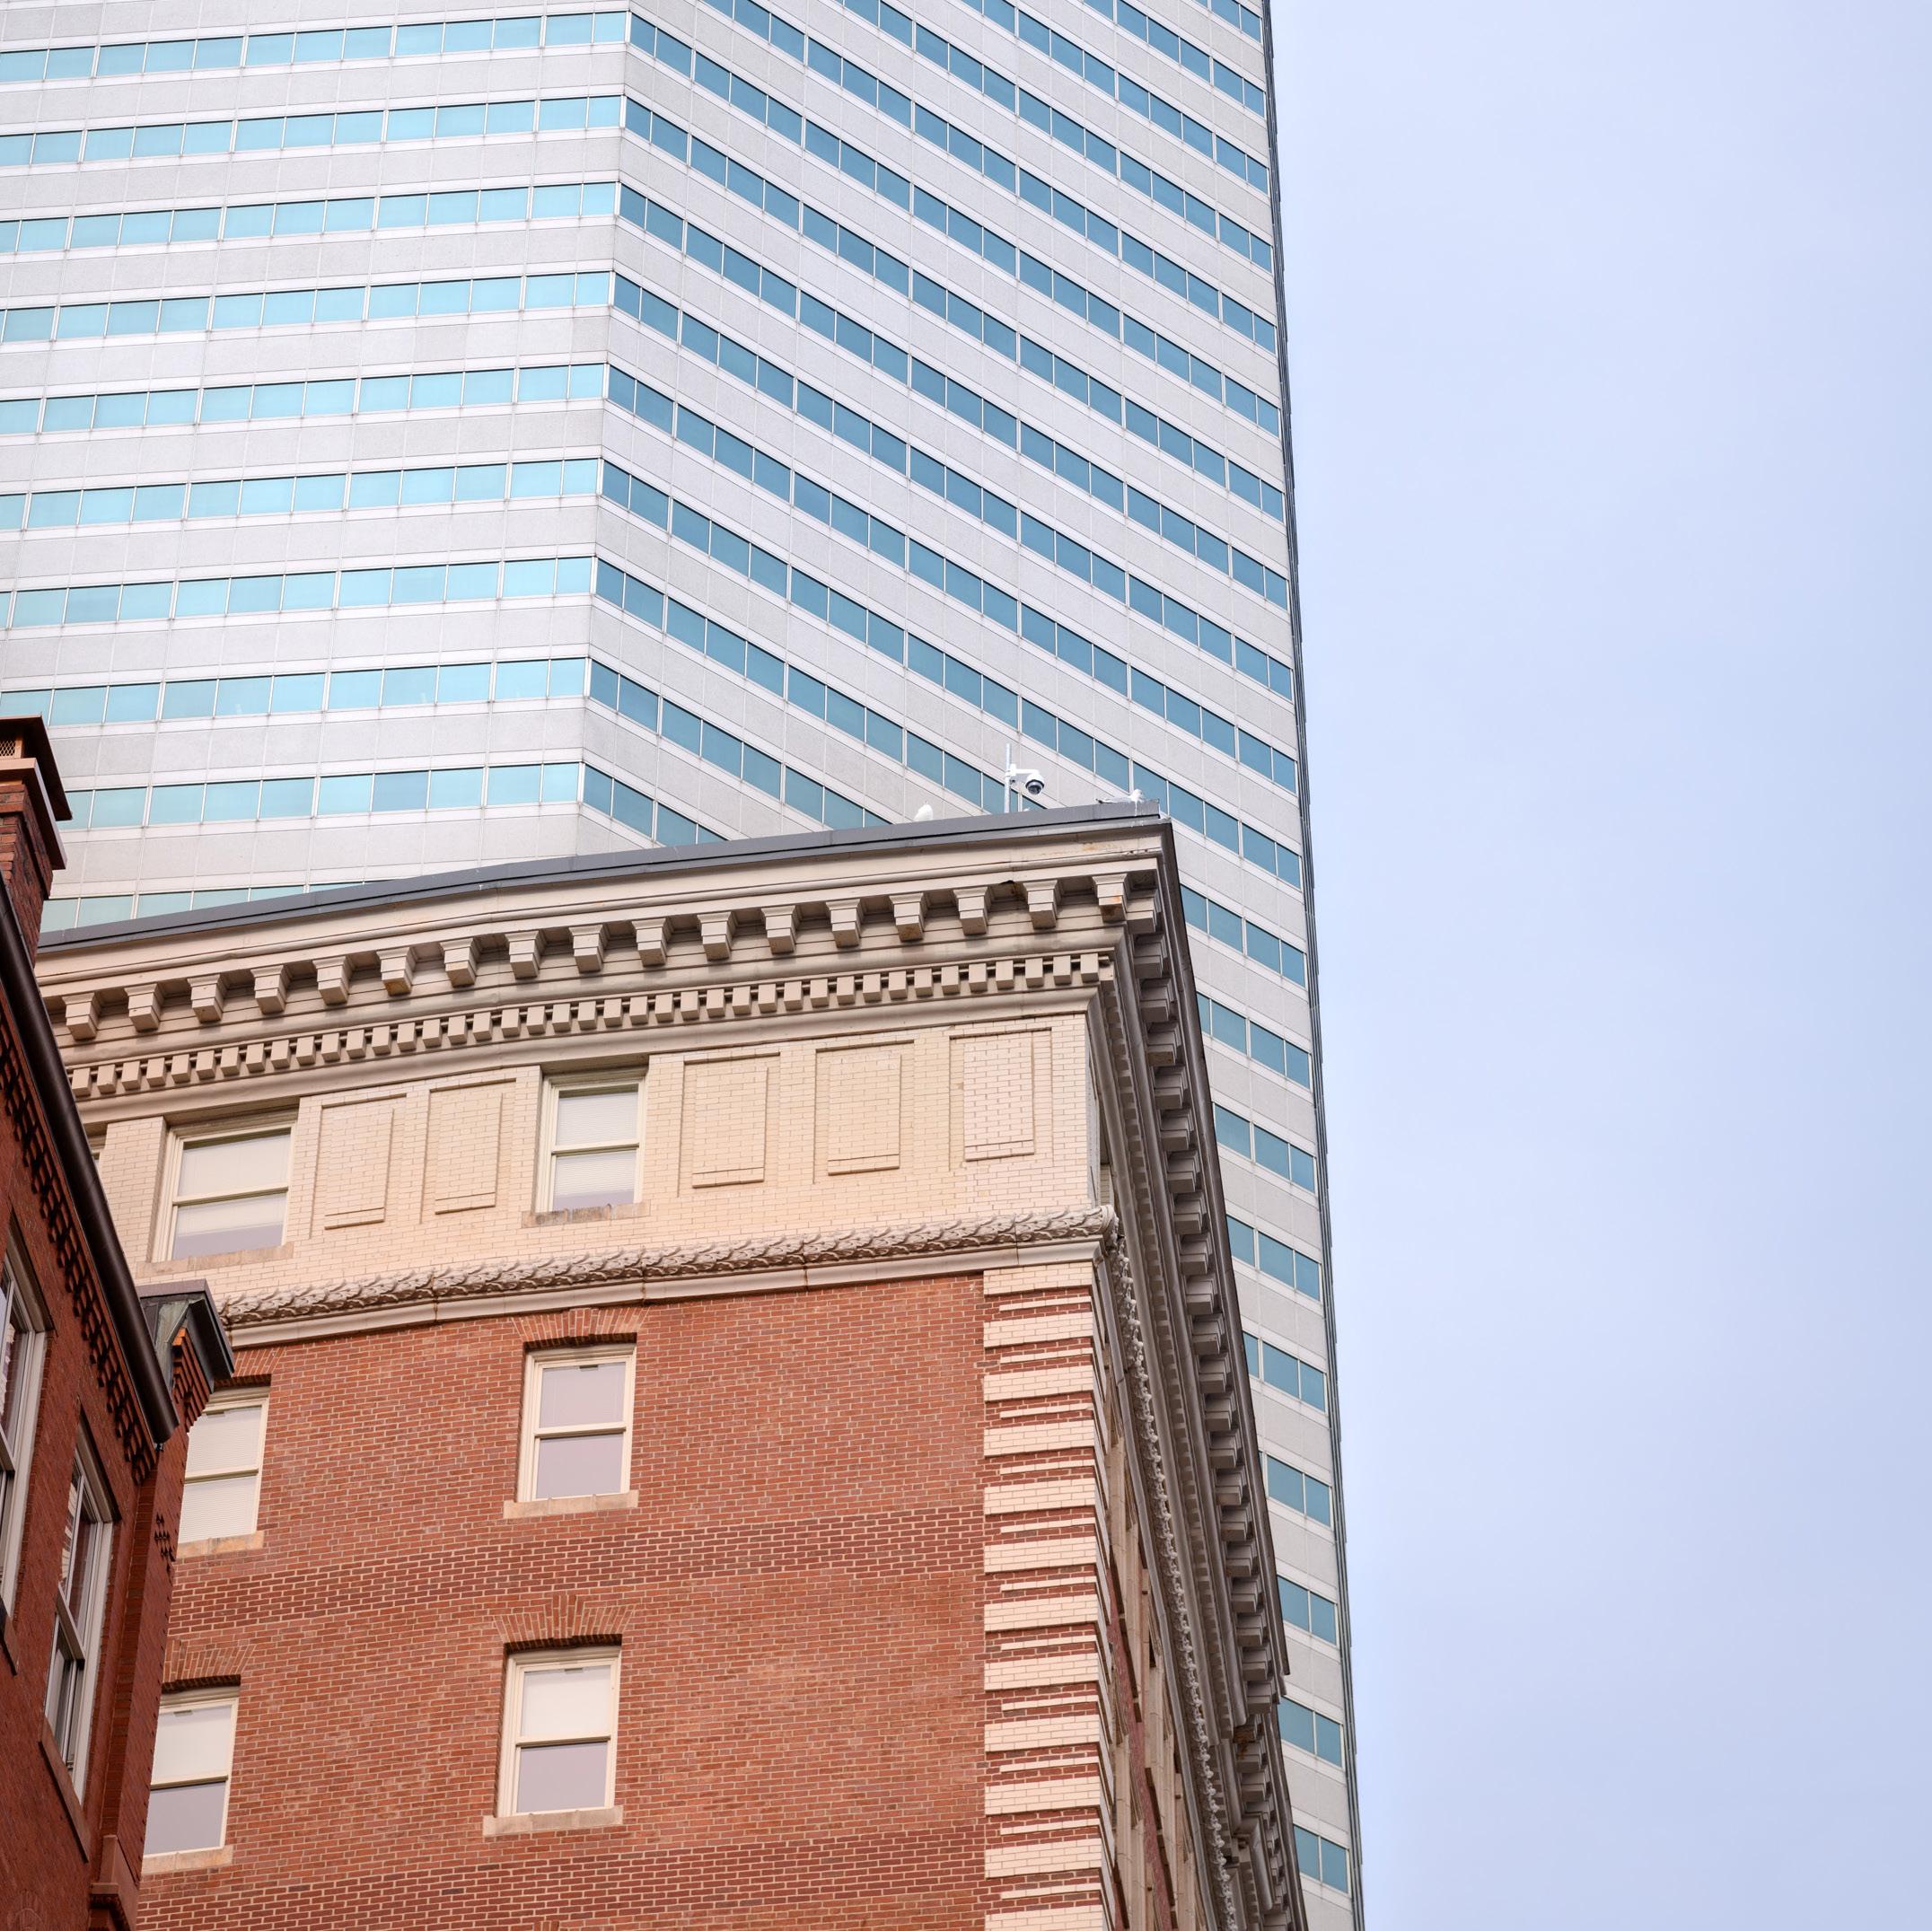
Change from 2021 to 2022
22.22%
31.03%
70.59% -26.82%
77.27%
15.38%
2018 2019 2020 2021 2022 Active 25 28 23 18 22 New 70 77 40 58 76 Sold 29 31 18 17 29 Pending 33 36 18 22 39 Average Days on Market 156 131 171 179 131 Median Sold Price $2,640,000 $2,550,000 $2,437,500 $2,600,000 $3,000,000
Homes,
Midtown
Single Family
Condominiums, $2M+
North End
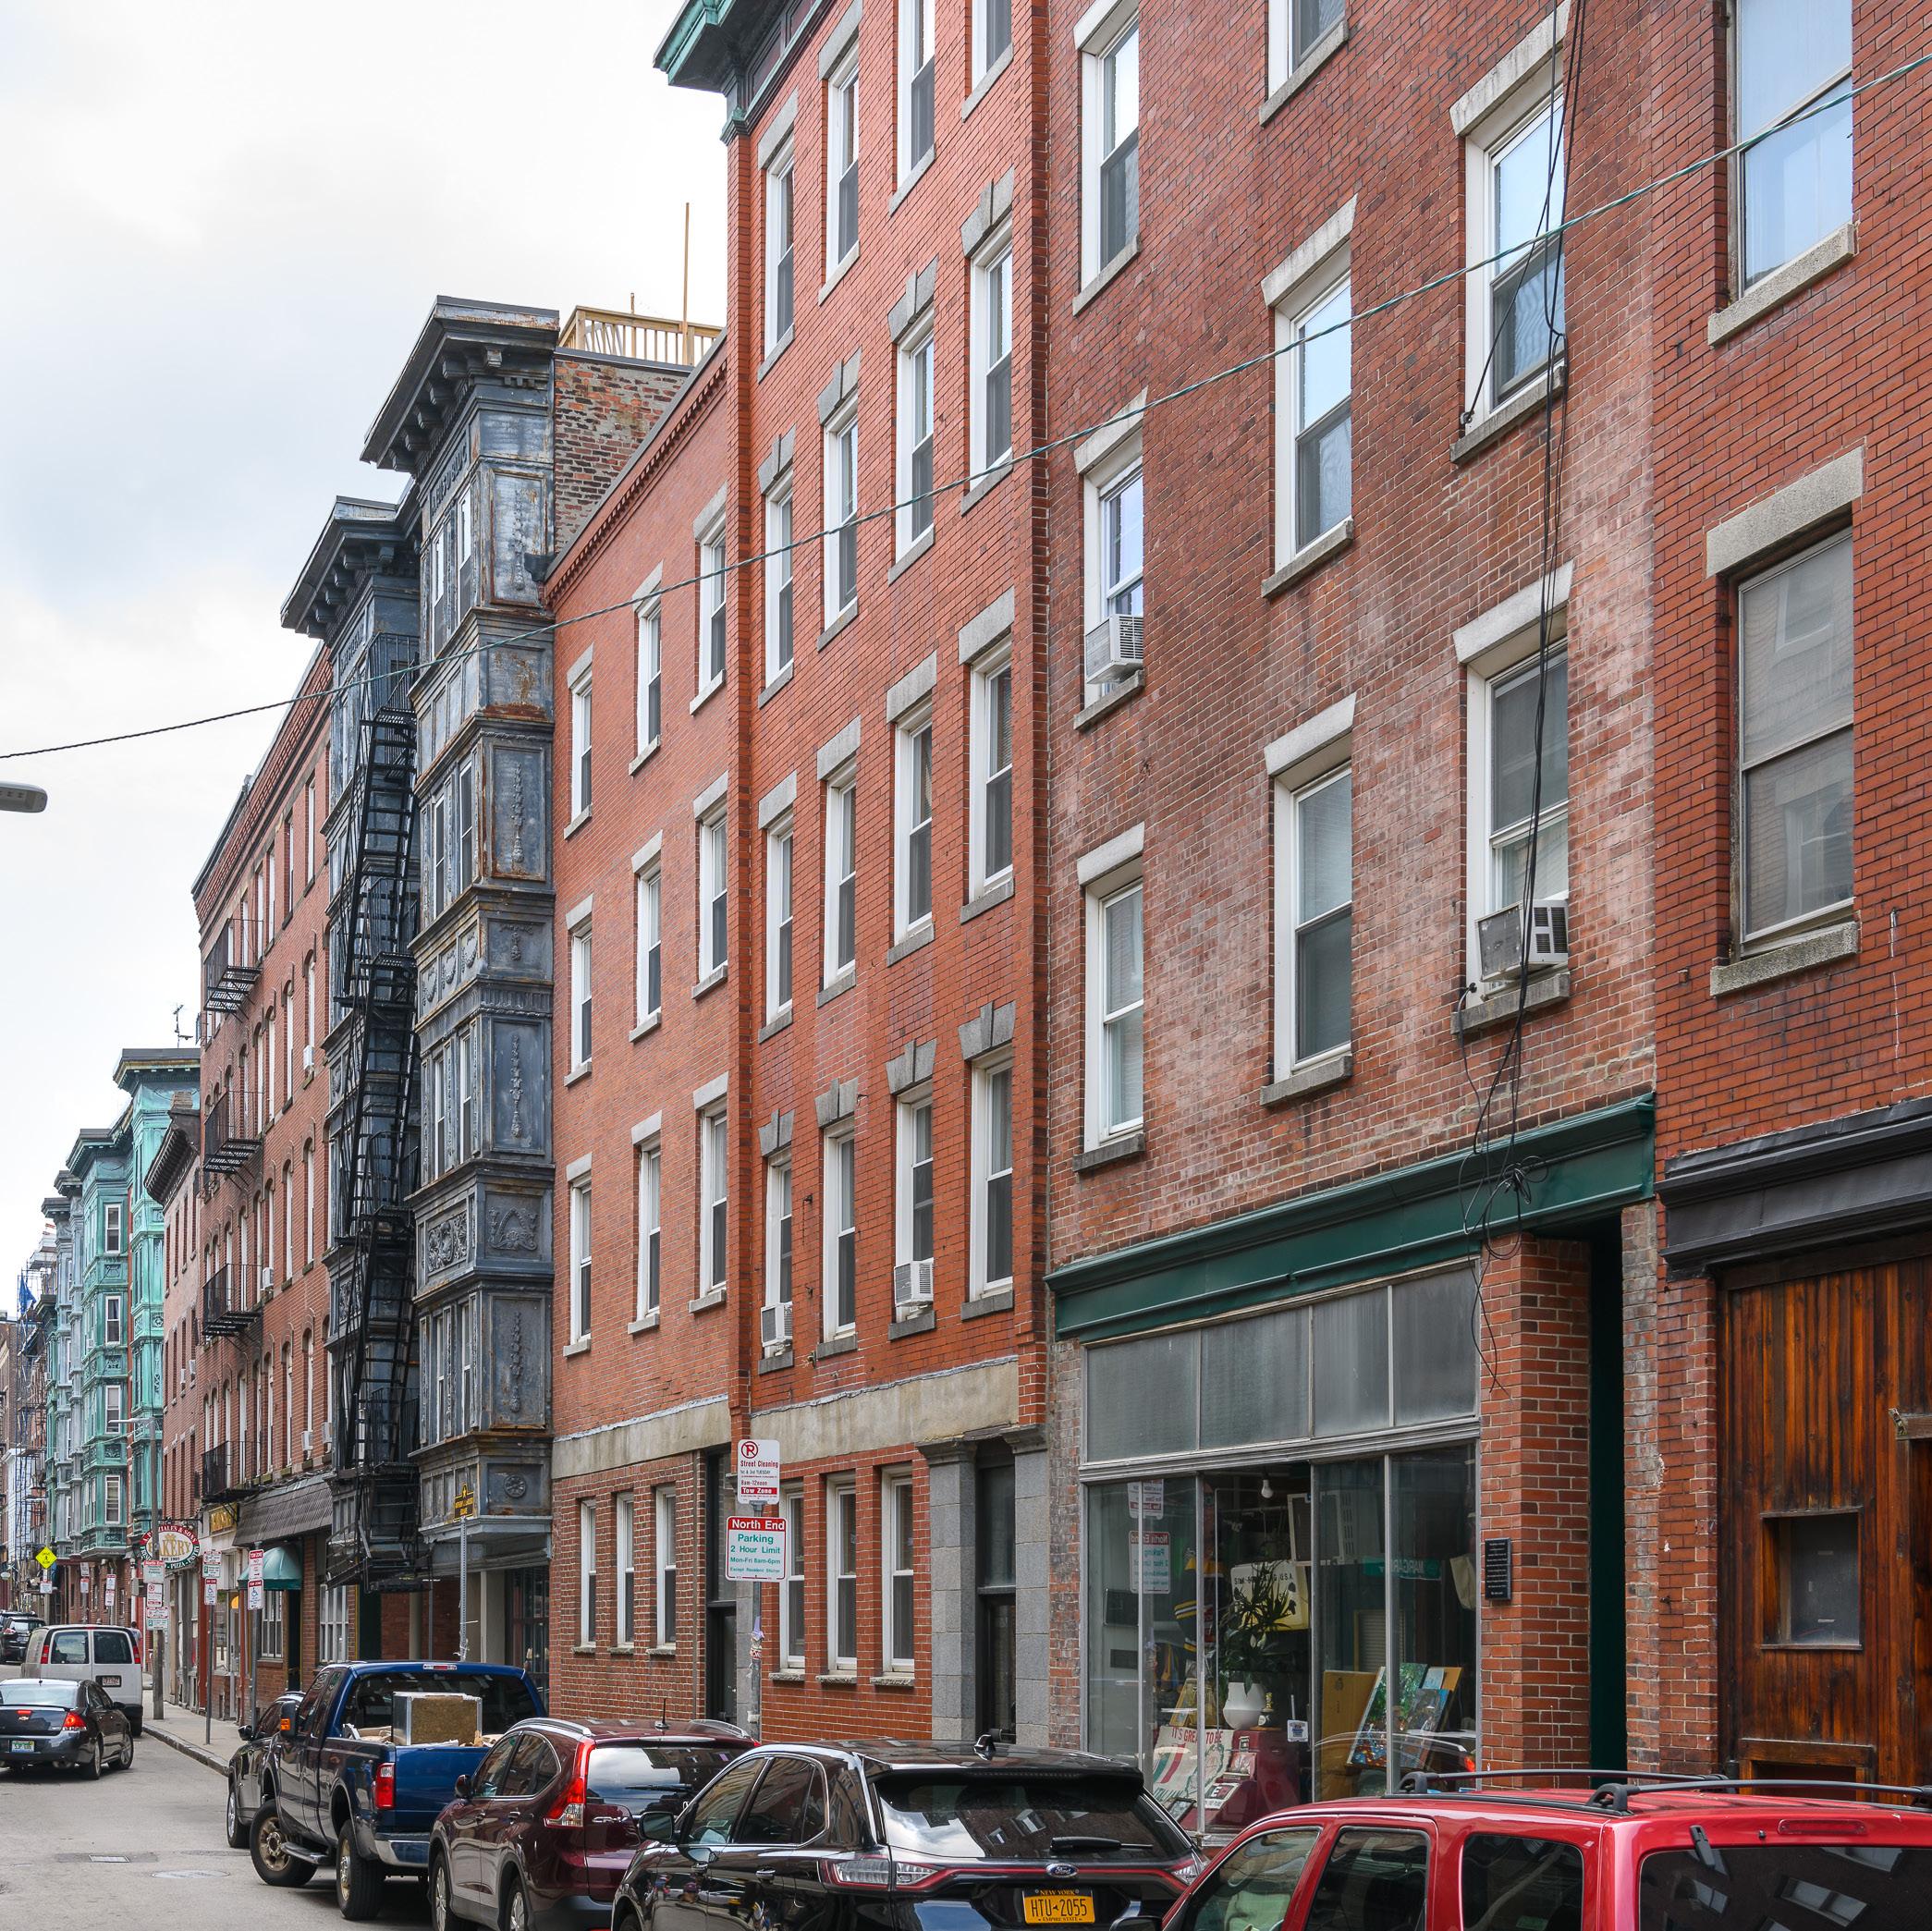
North End
Single Family Homes, Condominiums, $2M+
0% 0% 0% 0% 0% 0% Change from 2021 to 2022 2018 2019 2020 2021 2022 Active 1 0 1 0 2 New 2 2 3 0 7 Sold 1 1 0 0 4 Pending 1 1 1 0 4 Average Days on Market 63 40 0 0 46 Median Sold Price $2,095,000 $3,500,000 $0 $0 $2,012,500
Seaport District

Seaport District
12.89%
Single Family Homes, Condominiums, $2M+
-25.00% -54.17%
-41.94% -55.84%
Change from 2021 to 2022 2018 2019 2020 2021 2022 Active 11 19 10 12 9 New 64 142 74 124 72 Sold 27 79 51 72 33 Pending 38 93 34 77 34 Average Days on Market 67 39 58 46 92 Median Sold Price $3,190,000 $2,897,600 $2,825,000 $2,923,250 $3,300,000
100%
South Boston
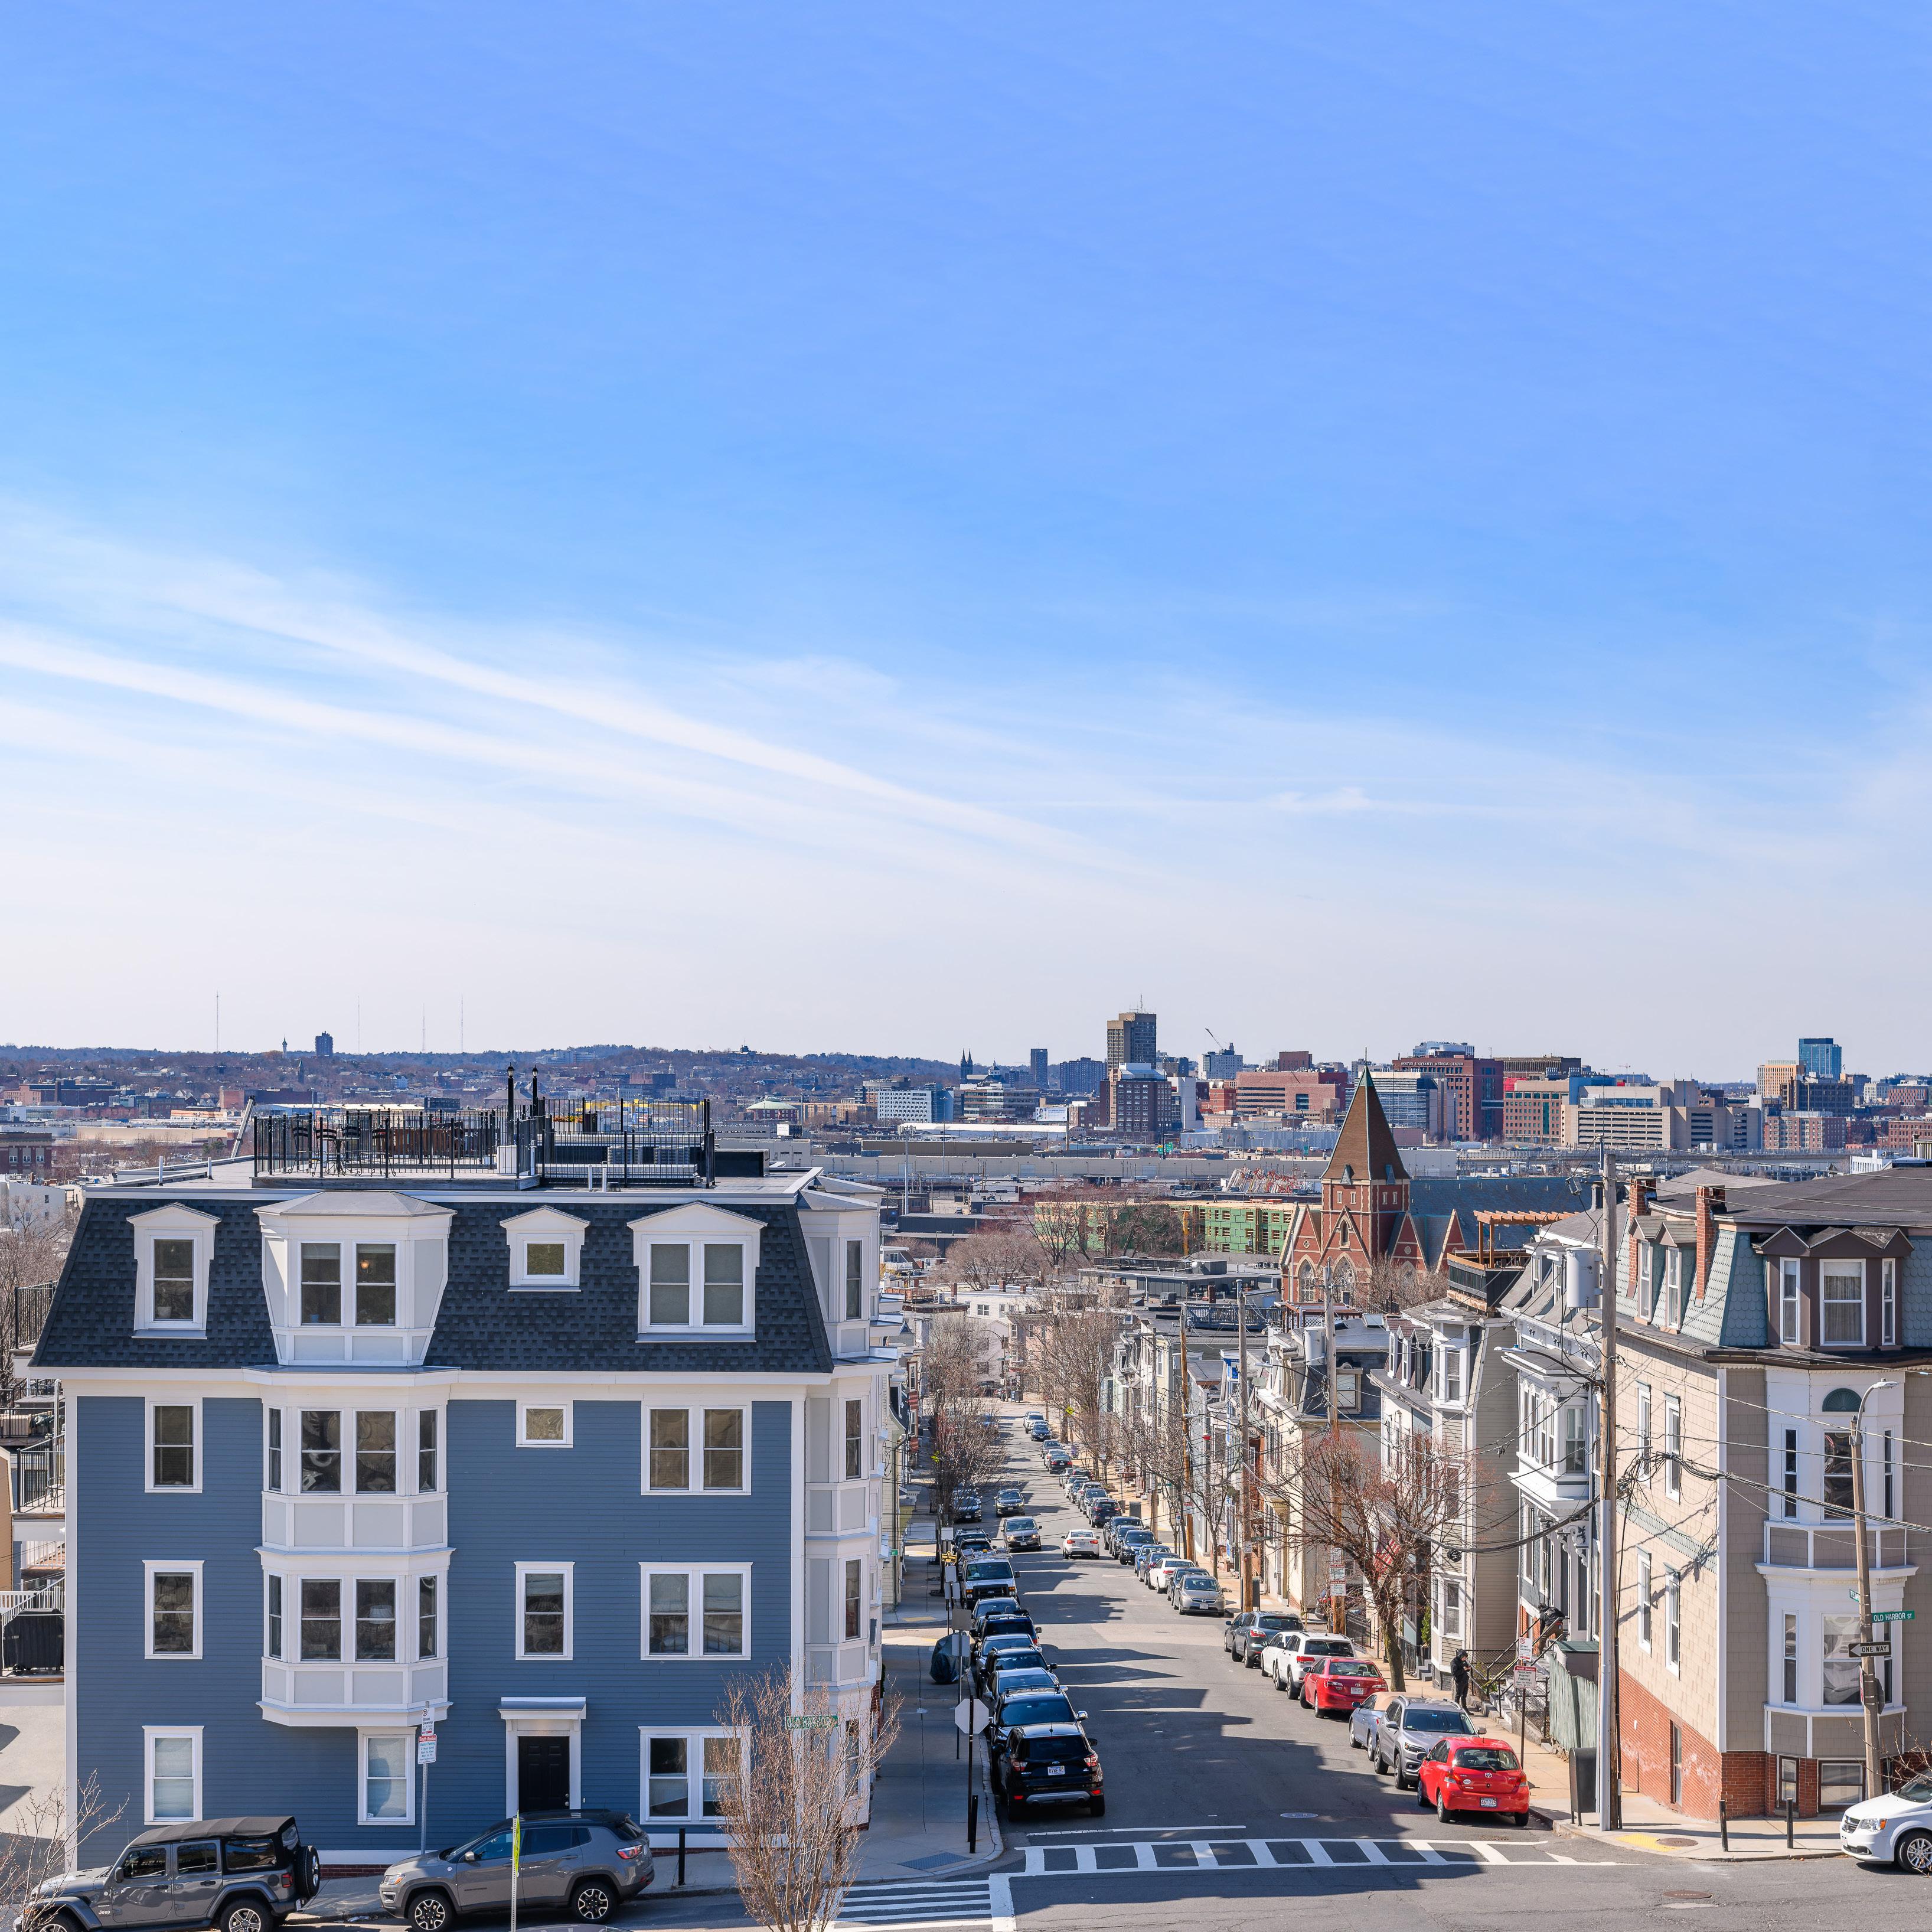
South Boston
Change from 2021 to 2022
Single Family Homes, Condominiums, $2M+
69.23% 0%
-40.00% 40.00%
2018 2019 2020 2021 2022 Active 3 2 3 5 3 New 9 9 14 13 22 Sold 3 4 6 5 5 Pending 3 5 5 5 7 Average Days on Market 45 102 111 43 73 Median Sold Price $2,120,625 $2,250,000 $2,662,500 $2,300,000 $2,250,000
69.77%
-2.17%
South End

South End
Change from 2021 to 2022
-25.93%
14.36% 12.04% -1.72%
2.88% -22.97%
2018 2019 2020 2021 2022 Active 15 12 36 27 20 New 107 126 147 181 207 Sold 82 77 43 104 107 Pending 83 88 57 108 121 Average Days on Market 69 73 64 74 57 Median Sold Price $2,600,000 $2,600,000 $2,580,000 $2,798,000 $2,750,000
Single Family Homes, Condominiums, $2M+
Waterfront
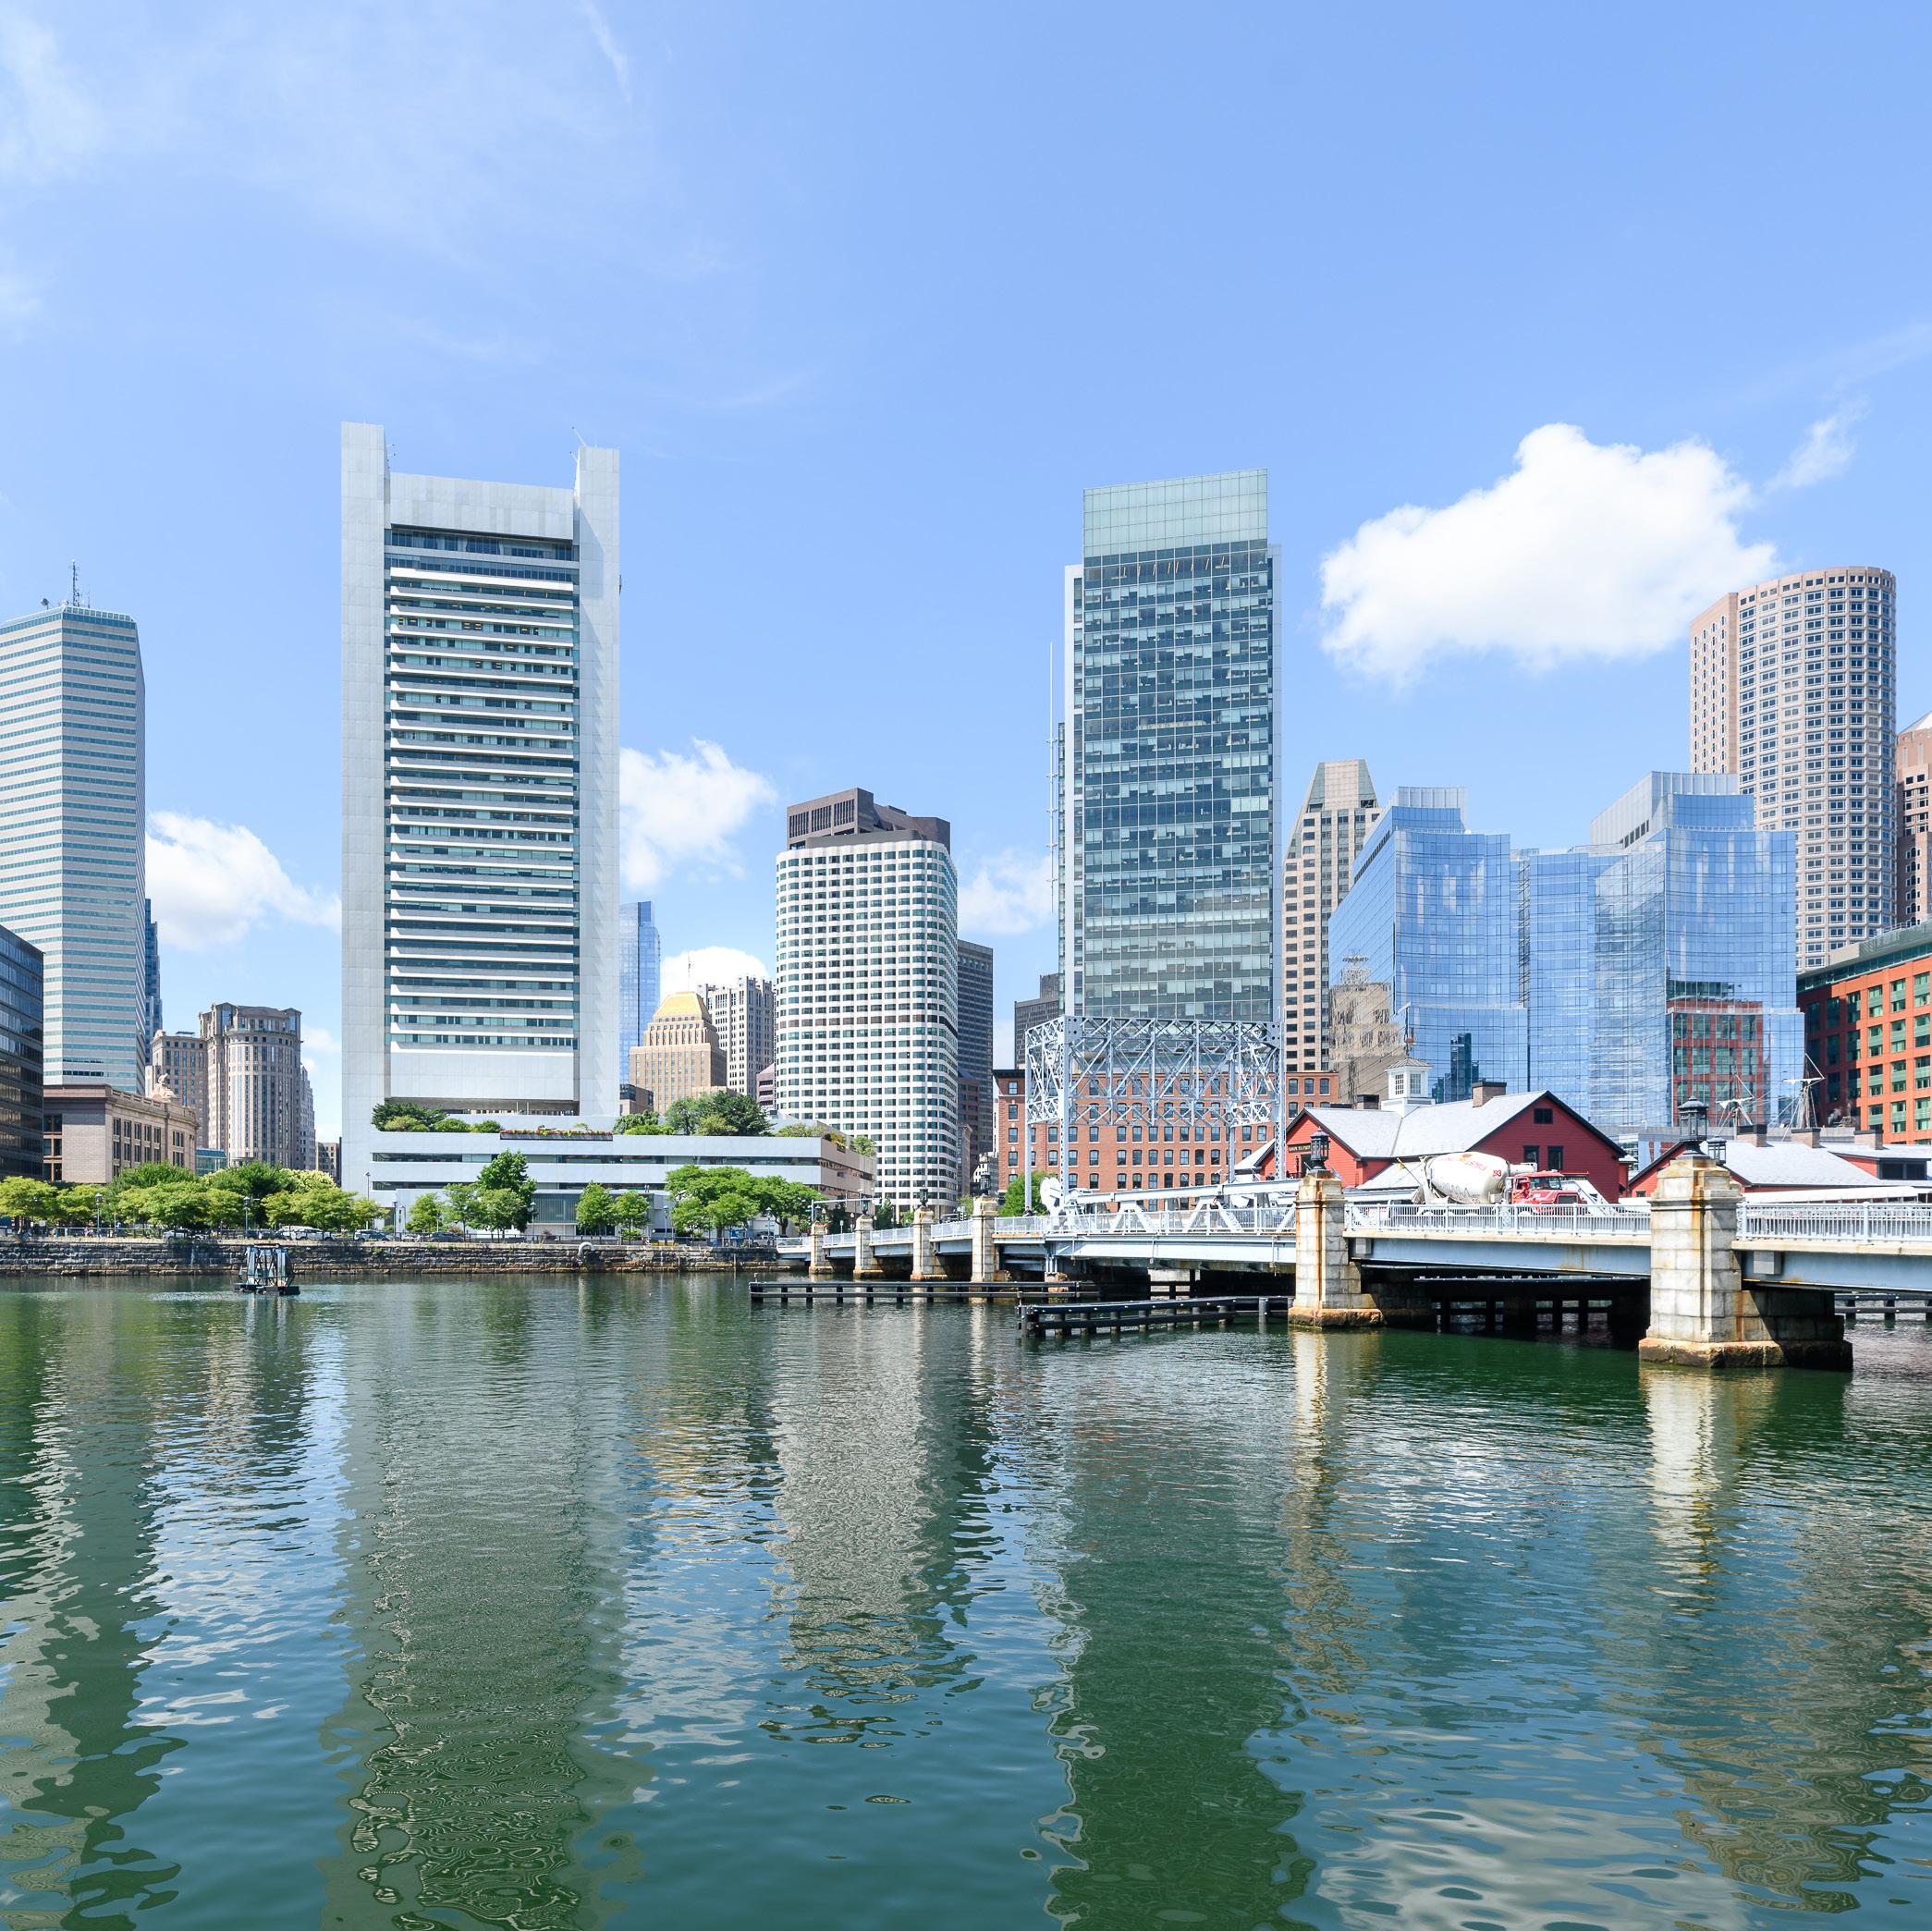
Change from 2021 to 2022
-27.27%
-11.76%
-27.78%
-2.86% 23.50%
-6.67%
2018 2019 2020 2021 2022 Active 9 14 14 11 8 New 30 52 70 68 60 Sold 20 27 17 36 26 Pending 21 26 19 35 34 Average Days on Market 107 114 125 75 70 Median Sold Price $2,785,000 $2,575,000 $2,565,000 $2,712,500 $3,350,000
Waterfront
Single Family Homes, Condominiums, $2M+

Our residential locations 1 Lewis Wharf, Boston, MA 02110 84 Atlantic Avenue, Boston, MA 02110 1675 Massachusetts Avenue, Cambridge, MA 02138 75 Park Avenue, Arlington, MA 02476 21 Cochituate Road, Wayland, MA 01778


