
1 2023 SEGD Communication + Place 2023 Communication + Place
2 Contents Introduction 4 2023 Academic Task 5 Force Members A Message from 6 Joell Angel-Chumbley A Message from 8 Cybelle Jones AR in the Graphic 10 Design Classroom Bonding Across Distances: 18 How to Create Shared Emotional Experiences in Remote Settings Design for Social Impact: 28 Participation as a Catalyst for Experiential Graphic Design Directional Type Design: Improving 38 Wayfinding Systems Through the use of Variable Fonts and Digital Signage Technologies
3 2023 SEGD Communication + Place Experiential Design: A 48 Interdisciplinary Certificate Program for Post-Secondary Design Education Floral Design + AR/XR 58 Incorporating Augmented 68 Reality (AR) into Placemaking Metacognitions 82 in the Metaverse The Design Charrette: Lessons 92 Learned in Seeking Methods to Accelerate Student Learning Using Social Science to Improve 108 Social Impact Why Black Spaces Matter: 116 Designing Racialized Spaces Wow Moments: A methodology 122 for measuring the experiential impact of exhibition design
Introduction
The Society for Experiential Graphic Design (SEGD) is a multidisciplinary community collectively shaping the future of experience design. We are designers of experiences connecting people to place.
We are a thought leader and an amplifier in the practice of experience design. Our work puts people at the center. We are motivated by our impact and our belief in the power of design to improve the human experience in the environments we create. We cultivate equity and inclusion because we value diversity in many forms, advocating for representation of all voices and equitable access to our profession. Learning is at the heart of our mission; we promote mentorship, knowledge-sharing, and continuing education. We build relationships, encourage strategic collaboration, and value a multidisciplinary, cooperative, and user centric-design process. We encourage sustainability, conservation, and preservation of resources to ensure a healthy future for our planet and its people. Our work is defined by professionalism, and we foster skill, judiciousness, and a code of ethics. Above all, we are propelled by the pursuit of excellence, challenging ourselves to make meaningful and inspiring work.
We live all of these values through the work of our committees, who support SEGD initiatives in education, inclusion, sustainability, and accessibility.
For over fifty years, SEGD has been the go-to resource for wayfinding, placemaking, and experience design. SEGD’s education conferences, events, and webinars span our practice areas including: branded environments, digital experiences, exhibition, placemaking, public installation, strategy / research / planning, and wayfinding.
SEGD actively collaborates with and provides outreach to design programs at internationally recognized colleges and universities. Our signature academic education event is the annual SEGD Academic Summit, a two-day virtual event. Design educators and researchers from around the world are invited to submit papers for presentation at the SEGD Academic Summit and publication in SEGD’s blind peer-reviewed Communication + Place journal, which is published electronically on an annual basis. The Summit and e-publication are platforms for academic researchers to disseminate their creative work, models for innovation in curriculum, and best practices for research related to experiential design.
4
2023 Academic Task Force
Chair: Joell Angel-Chumbley | University of Cincinnati DAAP, City of Cincinnati
Yeohyun Ahn | University of Wisconsin Madison
Aija Freimane | TU Dublin School of Creative Arts, Ireland
Angela Iarocci | Sheridan College
Michael Lee Poy | Ontario College of Design University
George Lim | University of Colorado School of Environmental Design
Christina Lyons | Fashion Institute of Technology
Tim McNeil | University of California Davis
Muhammad Rahman | University of Cincinnati DAAP
Amy Rees | Drexel University, Exit Design
Loran Sanvido | University of Cincinnati DAAP
Debra Satterfield | California State University
Neeta Verma | University of Notre Dame
Willhemina Wahlin | Charles Stuart University
Michele Y. Washington | Design Researcher /Strategist
5 2023 SEGD Communication + Place

“The annual SEGD Academic Summit . . . has become a forum for global design academics, researchers, and students to share their research, innovative curriculum, and projects.”
6
On behalf of SEGD ‘Designers of Experiences - Connecting People to Place,’ and the Academic Task Force, we would like to thank the selected authors for sharing their innovative research to be published in the 2023 Communication + Place academic journal. Your contributions to SEGD and the global academic design community is critical to forging a pathway forward for diversity in design education and professional practice.
The SEGD Academic Task Force is a diverse team of US-based and international design faculty, researchers, and practitioners that collectively share research and resources to advance global academic design education and professional practice.
Each year the Academic Task Force commits to multiple initiatives designed to promote knowledge and awareness of experiential graphic design with a strategic focus on the advancement of design education, research, and publication; diversity, equity, accessibility, and inclusion (DEAI) education and best practices; and student outreach.
The annual SEGD Academic Summit, a signature event produced by the Academic Task Force, has become a forum for global design academics, researchers, and students to share their
research, innovative curriculum, and projects. This event is also great for industry members to reconnect with new ideas emerging from researchers today. The Academic Task Force sends out a Call for Papers and conducts a blind peer review of abstracts submitted from across the globe. The selected authors are then invited to present at the Summit and publish full papers in Communication + Place to highlight research and insights for professional development and education in the field of experiential graphic design.
If you are interested in learning more about the work of the SEGD Academic Task Force, please contact Joell AngelChumbley, SEGD Academic Task Force Chair, at academic@segd.org.
7 2023 SEGD Communication + Place
Joell Angel-Chumbley SEGD Academic Task Force Chair

“Marking 50 years at SEGD, we celebrate our steadfast dedication to educating and inspiring experiential graphic designers.”
8
“Our 50-year journey at SEGD has been marked by an unwavering dedication to education in the realm of experiential graphic design. This golden anniversary celebrates our enduring commitment to nurturing and inspiring generations of designers, shaping a future where design transcends mere aesthetics to profoundly impact people, spaces, and culture.”
As the Society for Experiential Graphic Design (SEGD) celebrates its 50th anniversary, we reflect on our enduring commitment to education and empowerment. We are more than an association; we are a beacon guiding emerging professionals, students, and the broader design community.
SEGD today represents a vibrant, multidisciplinary collective shaping the future of experience design. Our members, spanning graphic and exhibition designers, fabricators, architects, media developers, and creative technologists, to students and educators, all share a singular vision: to harness design as a force for positive impact on people, spaces, and culture.
Our golden anniversary marks not just a milestone but a reaffirmation of our purpose. We are dedicated to fostering professional growth, inspiration, and connection. Our focus on inclusivity and collaboration ensures that as we evolve, we elevate the standards of practice in our diverse fields.
 Cybelle Jones Chief Executive Officer, SEGD
9 2023 SEGD Communication + Place
AR in the Graphic Design Classroom
Enhancing Student Learning through Augmented Reality
Tamara McLean
MFA/Graduate Student, Graphic Design Program, Art Department, University of Wisconsin-Madison
Abstract
This paper explores the integration of augmented reality (AR) into higher education art programs, specifically within the curricula of graphic design. It proposes a four-week hybrid summer course as an example of introducing AR to undergraduate students studying graphic design.
The field of graphic design is currently undergoing significant changes due to the rise of artificial intelligence (AI), causing many students to perceive limited career advancement opportunities compared to other fields such as business marketing, communications, and computer science.
However, the introduction of AI in graphic design offers numerous benefits, as AI-powered design tools can streamline labor-intensive tasks and enhance creativity. Developing literacy in AI and AR is crucial for future graphic design professionals, who must possess a diverse skill set including proficiency in AI design tools, understanding of designing for AR experiences, and the ability to collaborate with AI systems. Adapting to these emerging technologies unlocks new creative possibilities and facilitates the delivery of immersive and engaging experiences in graphic design.
The pioneering digital design work of April Greiman in 1984 and Jessica Helfand’s 2001 essay “Dematerialism of Screen Space” are recognized as efforts that embraced emerging technology and transformed the traditional graphic design process.
In the year 2023, augmented reality represents a new frontier for graphic design, with continuously evolving tools and delivery systems. Despite these changes, graphic design remains a visual communication medium, whether in printed posters or AR experiences. Evolving graphic design curricula enable students to become thought leaders in their chosen organizations after graduation.
10
Introduction
In the digital landscape of today, augmented reality (AR) has emerged as a transformative technology with vast potential across various industries, including graphic design. With the recent launch of Apple’s Vision Pro in June 2023, the field of graphic design continues to evolve, necessitating the acquisition of AR design skills by higher education undergraduate students studying graphic design. This paper delves into the significance of incorporating AR into graphic design education and provides relevant sources to support the discussion.
Augmented reality opens up new avenues for creativity and innovation in graphic design. By seamlessly integrating virtual elements into the real world, designers can create immersive and interactive user experiences. Incorporating AR into graphic design education nurtures students’ ability to think beyond the confines of static visuals, encouraging exploration of dynamic and engaging design solutions (Iqbal, 2020).
Proficiency in AR design equips undergraduate students with a competitive edge in the job market. The demand for AR designers is steadily growing across various industries, including advertising, entertainment, retail, and education (Jha et al., 2019). Employers seek graphic designers who can leverage AR technologies to deliver captivating user experiences and drive customer engagement. By acquiring AR design skills, students position themselves for a broader range of employment opportunities.
According to the U.S. Bureau of Labor Statistics (2022), Web Developers and Digital Designers project a job growth rate of 23% by 2031, while Graphic Designers anticipate a 3% growth rate, which is 2% less than the average across all occupations. Additionally, the pay for Graphic Designers is considerably lower than that of Web Developers and Digital Designers.
Designing for augmented reality necessitates a deep understanding of user behavior and the ability to create meaningful interactions. The inclusion of AR in graphic design education empowers students to develop user-centric design thinking skills (Diaz et al., 2020). They learn to consider the user’s context, needs, and expectations while designing AR experiences, resulting in more intuitive and impactful design solutions.
AR design projects often involve collaboration with professionals from diverse disciplines, such as developers, engineers, and content creators. Graphic design students exposed to AR during their undergraduate education gain experience in multidisciplinary teamwork, honing their communication and collaboration skills (Wang et al., 2020).
Integrating augmented reality into graphic design education for higher education undergraduate students offers a range of benefits. It stimulates creativity, expands career opportunities, fosters user-centric design thinking, and cultivates collaboration skills. As AR continues to shape the future of design, educational institutions must equip graphic design students with the necessary knowledge and skills to leverage this transformative technology.
Benefits and Challenges
Augmented reality (AR) technology has the potential to revolutionize higher education, particularly in the graphic design classroom. By overlaying virtual elements onto the real world, AR enhances the learning experience and offers numerous benefits. However, it also presents unique challenges that must be considered.
One significant benefit of teaching how to build AR projects in the graphic design classroom is the ability to provide immersive and interactive learning experiences. Students can visualize their designs in three dimensions, allowing for a better understanding of spatial relationships and proportions. This hands-on approach enhances creativity and problem-solving skills, as students can experiment with various design elements in real time. According to a study published in the International Journal of Virtual and Augmented Reality, AR-based learning environments have been shown to improve student engagement and motivation, leading to better learning outcomes.
Furthermore, AR technology enables collaboration by leveraging key user and peer feedback. Students can share their AR designs with classmates, who can then provide real-time comments and suggestions. This fosters a sense of community and encourages design thinking and teamwork, a crucial aspect of graphic design practice. In an article by Forbes, it is stated that AR allows for “visual communication and interaction among students, encouraging them to work together on projects and solve design challenges collectively.”
11 2023 SEGD Communication + Place
However, implementing AR technology in higher education also poses challenges. Cost is a significant factor, as the equipment and software required for AR experiences can be expensive. Additionally, there is a learning curve associated with using AR tools, both for students and instructors, which may require additional training and support. Technical issues and compatibility across devices and platforms can also hinder the seamless integration of AR into the classroom.
While there are challenges to overcome, the benefits of using AR technology in the graphic design classroom are significant. By enhancing the learning experience, promoting collaboration, and fostering creativity, AR has the potential to revolutionize higher education and prepare students for the evolving demands of the design industry.
Current State of Learning Opportunities
Augmented reality has become increasingly popular in graphic design, providing new opportunities for creative expression and interactive experiences. In the context of higher education, several learning opportunities are available to students interested in incorporating AR into their graphic design studies.
Here are some key areas:
AR Design and Development Courses: A few universities and colleges offer AR design and development courses. The ones that do offer courses communicating AR design principles, 3D modeling, interaction design, programming for AR, and user experience design. These courses provide students with the knowledge and skills to create design elements that support AR experiences; however these courses lack formal process instruction for creating a final immersive AR experiences for graphic design students in art departments.
Workshops and Bootcamps: Short-term workshops and boot camps are often organized by industry professionals to introduce designers to the concepts and tools of AR design. These intensive learning experiences offer hands-on training in creating AR content and help designers gain practical skills quickly.
Design Competitions and Challenges: Various design competitions and challenges encourage designers to explore AR as a medium for their graphic design projects. Participating in these events provides an opportunity to apply AR concepts in real-world scenarios, gain exposure and receive feedback from experts in the field.
Collaboration with Computer Science and Engineering Programs: Collaborative projects with computer science or engineering departments can foster interdisciplinary learning experiences. Graphic design students can team up with students from technical backgrounds to develop AR applications, combining their design skills with programming expertise.
Online Tutorials and Resources: Numerous online platforms provide tutorials and resources for learning AR design. Websites like Unity Learn, Google ARCore, and Apple Developer provide documentation, tutorials, and sample projects that can help students get started with AR design and development.
AR for the Graphic Design Classroom Course Description
This course is an introduction to the history, process, and best practices of designing augmented reality (AR) experiences for mobile devices. AR is an interactive experience that combines the real world and computergenerated content. It has been gaining popularity in recent years and is being used in a wide range of fields: gaming, education, retail, tourism, healthcare, and advertising. Since new digital technology yields a strong influence in the industry, infusing AR into graphic education is necessary. Seeking new opportunities in design applications using AR benefits immersive environments and safe spaces for training and exploring.
In this course, the structured design process will be introduced and practiced, from creative inquiry to user testing. Students will learn how to create assets with various prototyping skills and art-direct scenes, building and sharing immersive experiences on mobile devices.
12


“…as designers, we might begin to tackle the enormous opportunities to be had in staking claim to and shaping a new and unprecedented universe.”
Jessica Helfand, “Dematerialism of Screen Space” 2001
13 2023 SEGD Communication + Place
Student Example: Jessica Sutryk, 2023. Designed in the foundation course ART 102: Introduction to Two-Dimensional Design, Spring 2023, Art Department, School of Education, University of Wisconsin-Madison. This project asks students to create an original pattern design incorporating the elements of graphic design in Adobe Illustrator, apply the design to a 3d primative in Adobe Dimensions, then export the asset to Adobe Aero and add actions.


14
Tamara McLean, “HOME “Mural in Green Bay, WI, 2021, Animated Augmented Reality Origami Forest Pack, Adobe Aero-Planning
Tamara McLean, “HOME “Mural in Green Bay, WI, 2021, Animated Augmented Reality Origami Forest Pack, Adobe Aero-Painted Mural & Animated AR
Learning Outcomes
Upon completing this course, students will be able to:
1) Understand the historical background and Augmented Reality (AR) applications.
2) Understand the importance of using AR and mobile devices for information, training, and entertainment.
3) Research design opportunities currently available and ideate new possibilities using new digital technology.
4) Apply elements of graphic design such as line, shape, composition, typography, color and illustration, and images.
5) Build storyboard anchors and interactions for immersive experiences.
6) Apply an iterative design process, including prototyping and user testing.
7) Analyze design problems (forward thinking) and propose alternative design solutions.
8) Prepare high-quality professional documentation of the design process and presentation for a professional portfolio.
This course is created for students who want to explore the potential of AR in design and gain practical skills in designing AR experiences for mobile devices. By the end of the course, students will have a portfolio of AR projects that showcase their design skills and understanding of AR technology.
Proposed Schedule and Deliverables
Week 1: History, research, sketching and storyboards
Week 2: Moodboards, working prototypes build and asset collection.
Week 3: Interaction and animation build
Week 4: Testing, reiteration, sharing, and archiving a completed AR project
Conclusion
This research contributes to the field of educational technology by providing a comprehensive overview of the current state of AR technology in education. It examines the challenges and limitations of incorporating AR technology into graphic design curricula and offers recommendations for educators and instructional designers interested in implementing AR for graphic design instruction.
“… as designers, we might begin to tackle the enormous opportunities to be had in staking claim to and shaping a new and unprecedented universe.” “Dematerialization of Screen Space,” written by Jessica Helfand in 2001, questions the future of graphic design and inspires all of us to pass the torch on to the next generation of spacial designers, offering them our shared knowledge and support.
Graphic designers entering the workforce now will need to bring skills beyond two-dimensional screen graphics in order to thrive in their chosen vocation. As our entertainment and work spaces spill out into the world and surround us, motion, audio, haptic sensory, and scent will all be components completing an entity AR experience. This course is an initial introduction to learning these vital skills. My future plan is to developing a 14-week semester course for undergraduate students. I am also interested leading an academic workshops for educators who would like to incorporate AR projects into existing graphic design curriculum.
15 2023 SEGD Communication + Place

Resources
Armstrong, Helen. 2009. Graphic Design Theory: Readings from the Field. New York: Princeton Architectural Press.
Carter, Rebekah. 2023. “How Big Is the Augmented Reality Market?” XR Today. May 18, 2023. https:// www.xrtoday.com/augmented-reality/how-big-is-theaugmented-reality-market/
Danhoff, Christine. 2021. “7 Augmented Reality Tools for the Classroom.” Edutopia. June 16, 2021. https:// www.edutopia.org/article/7-augmented-realitytools-classroom
Ejaz, Afshan, Dr Syed, Muhammad Yasir, and Dr Farhan. 2019. “Graphic User Interface Design Principles for Designing Augmented Reality Applications.” International Journal of Advanced Computer Science and Applications 10 (2). https://doi.org/10.14569/ijacsa.2019.0100228
Huda, Asrul, Nelda Azhar, Almasri Almasri, Rizky Ema Wulansari, Akrimullah Mubai, Rizki Hardian Sakti, Firdaus Firdaus, and Suryo Hartanto. 2021. “Augmented Reality Technology as a Complement on Graphic Design to Face Revolution Industry 4.0 Learning and Competence: The Development and Validity.” International Journal of Interactive Mobile Technologies (IJIM) 15 (05): 116. https://doi.org/10.3991/ ijim.v15i05.20905
Javornik, Ana. 2016. “The Mainstreaming of Augmented Reality: A Brief History.” Harvard Business Review October 4, 2016. https://hbr.org/2016/10/themainstreaming-of-augmented-reality-a-brief-history
Mohamed, Tarek I. 2020. “The Impact of Using Virtual-Augmented Reality on Some Design Careers (Product, Multimedia, Graphic).” Proceedings of the 2020 5th International Conference on Multimedia Systems and Signal Processing, May. https://doi. org/10.1145/3404716.3404736
“Plan - VisionOS.” n.d. Apple Developer. https://developer. apple.com/visionos/planning/
Quora. n.d. “The Difference between Virtual Reality, Augmented Reality and Mixed Reality.” Forbes. Accessed June 12, 2023. https://www.forbes.com/ sites/quora/2018/02/02/the-difference-betweenvirtual-reality-augmented-reality-and-mixedreality/?sh=5ee46372d07c
Schuld, Dawna. 2023. “Augmented Reality and the Dematerialization of Experiential Art.” Arts 12 (3): 116. https://doi.org/10.3390/arts12030116
U.S. Bureau of Labor Statistics. 2022. “Graphic Designers: Occupational Outlook Handbook: U.S. Bureau of Labor Statistics.” Bls.gov. September 8, 2022. https:// www.bls.gov/ooh/arts-and-design/graphic-designers. htm
16
Tamara McLean, “Landed, “2023, University of Wisconsin-Madison “Total Tolerance” Group Show, Backspace Gallery, Madison, WI, Apple Reality Composer and NASA animated assets.
17 2023 SEGD Communication + Place
Bonding Across Distances
How to Create Shared Emotional Experiences
in Remote Settings
Jenny
Hsin-Yi Chang
Master of Arts in Exhibition & Experience Design |
Exhibit Designer at Deckel & Moneypenny
Abstract
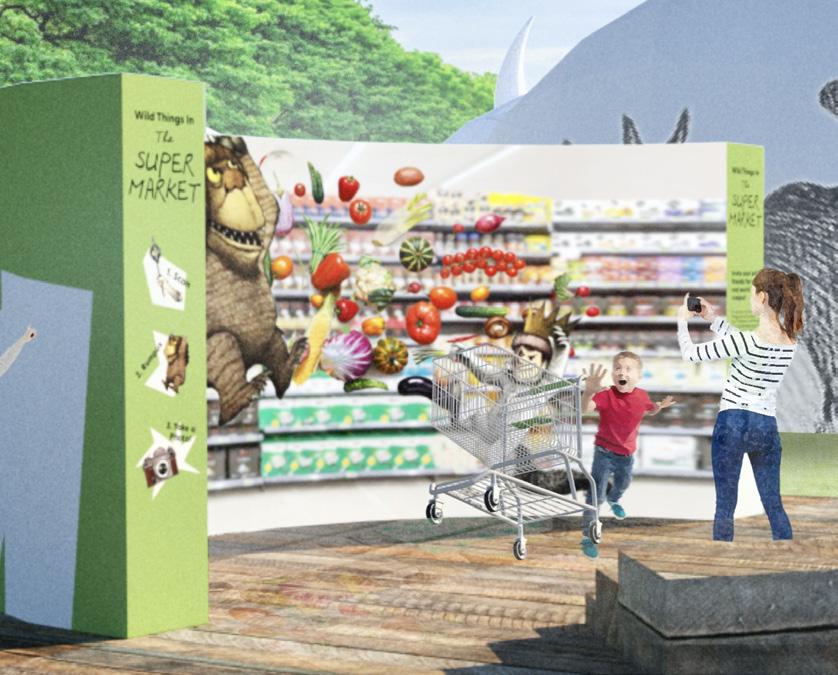
This research explores the creation of shared emotional experiences in remote settings to foster interpersonal connections and societal well-being. The study investigates how synchronized multi-sensory experiences, interactivity, and emotionality contribute to forming interpersonal bonds among physically distant participants. The research consists of two parts: an examination of factors fostering emotional social connections in virtual settings through primary and secondary research, and the development of an exhibition project, “ Where The Wild Things Are: Return To The Wild,” to demonstrate the application of the theory.
Overall, this research emphasizes the significance of shared experiences and the role of synchronized multisensory experiences, interactivity, and emotionality in creating meaningful connections in remote settings. The findings demonstrate the potential for innovative remote experiences that foster human connections and contribute to personal and societal well-being, even in physically distant contexts.
18
Introduction
During the prolonged social isolation of the COVID-19 pandemic, people experienced decreased well-being resulting from the lack of meaningful interaction with others. In a world where people cannot always be physically present with each other, how can we continue to create shared emotional experiences to foster interpersonal connections and societal well-being?
In this research, I explored how shared emotional experiences can be created in remote settings to effectively engage physically distant participants and foster interpersonal bonds.
I formed a hypothesis that, as a key to forming interpersonal bonds, shared emotional experiences can be created in remote settings through sharing synchronized multi-sensory experience, interactivity, and emotional content among physically distant participants. By designing with these three elements, institutions can create engaging, emotional and social experiences for physically distant audiences to build personal connections, shape loyal communities and foster personal and societal well-being.
Approach
This research investigated this hypothesis in two parts:
In the first part, I examined the factors that help foster emotional social connections in traditional inperson settings and explore how these factors can be transferred or recreated in remote settings. Through my secondary research, I identified “shared experiences” as one of the keys to forming interpersonal bonds and defined three key factors — synchronized multi-sensory experience, interactivity and emotionality — that contribute to successfully creating such experiences in remote settings. I then conducted prototype testing and an interview with an industry professional to further understand the validity of my theory.
In the second part, I created an exhibition project, “Where The Wild Things Are: Return To The Wild, ” to illustrate how this theory can be used to create a new generation of hybrid experience. This application demonstrates the potential path for exhibition designers to expand the reach and impact of future exhibition projects, and help institutions remain relevant and connected to their audiences in the post-pandemic world.

19 2023 SEGD Communication + Place
Figure 1. Remote Shared Experience Theory Model
Primary Research: Bonding, From Traditional Settings to Remote Settings
I began my research looking into social studies focused on social connections in traditional face-to-face settings to understand what makes people connect in a natural setting. In a study by McMillan and Chavis, shared experience was marked as a definite element to forming interpersonal emotional connections. In an in-person setting, shared experience can be seen as a result of shared events which build interpersonal emotional connections through:
a) bringing participants to a common place and spending time together,
b) providing opportunities for quality interaction, and
c) creating positive emotional impact.
However, in a remote setting where sharing a common time and place is not an option, and the participants’ ability to interact and share emotions do not come naturally, how can shared experiences be created? To answer this question, I turn to literature on social studies in virtual and remote contexts.
The first aspect to creating a shared experience in remote settings is to create the perception of sharing a common time and place without physically doing so. In Durlach and Slater’s research, such perception is referred to as “virtual togetherness.” The article suggests that for a number of individuals to feel present in a common environment, they must all a) have a sense of presence in the place depicted and b) have a sense of sharing a common environment with another individual. The research identified sensory experience and interactivity as two key elements to creating virtual togetherness.
Key 1. Synchronized Multi-sensory Experience
As humans experience surroundings through their senses, the sense of commonality in time and place can be achieved by creating a level of synchronized sensorial experiences. In a remote setting, the lower the latency rate and the more senses that are shared among the participants, the higher the sense of sharing a common time and place, which leads to a greater emotional contagion and sense of social connection.
Visual and auditory experiences are currently the two most accessible sensory experiences in remote settings. Other sensory experiences such as taste, smell, touch are still difficult to share remotely due to current technology constraints. However, in Durlach and Slater’s research, visual representations of taste, smell or touch were found to elicit substantial emotional reactions, suggesting that visual or audio representations may be good alternatives for senses that our technology can not yet convey.
Key 2. P-P and P-E Interactivity
Other than synchronized multi-sensory experiences, interactivity also plays a big role in building a sense of connection in remote settings. There are two types of interactions: person-to-person (P-P) interaction, and person-to-environment (P-E) interaction.
The P-E interaction refers to participants being able to have an impact on the environment. Research shows that in a virtual environment, a sense of shared togetherness will be increased if alterations to the environment caused by one participant are clearly perceived by the other participants. Furthermore, if participants can collectively make alterations to the environment and the changes are perceived by all participants, the sense of shared togetherness increases even more potently.
The P-P interaction, on the other hand, refers to participants being able to come into contact, communicate or have an impact on each other. As found in traditional social studies, P-P interaction is a cornerstone to forming interpersonal connections. In a remote setting, enabling participants to exchange multimodal communication and rich interaction is critical to forming interpersonal connections.
Other than verbal communication, studies have found that physical communication (such as hugging and touching) is most closely linked to closeness and intimacy, and is a powerful tool in promoting deep and emotional connections.
Key 3. Shared Emotional Impact
The last and perhaps the most important element to creating a shared experience with a bonding effect in remote settings is to create an emotional impact. Emotional experiences promote social bonding because it is often followed by social sharing, which allows
20


“Emotions are above all social phenomena. They are the basis of social interaction, they are the products of social interaction, their origins, and their currency.”
Zajonc,
1998, Emotions (pp. 619–620)
the participants to enjoy empathy and emotional communion, and result in an experience of emotional connection. Generally speaking, the stronger the elicited emotion, the better the bonding effect.
In How Games Move Us: Emotion By Design, research on game design points out many successful strategies to evoke emotions in remote settings, including emotions through content, emotions through social play, emotions through body movement, and emotions through immersion, within which the use of avatars was pointed out as a particularly effective method.
Shared Emotional Experience Theory Conclusion
The three key elements highlighted above–synchronized multi-sensory experience, interactivity, and emotionality–create the basis that makes a shared emotional experience in remote settings. As shown in Figure 1, each of the three elements contributes to the sense of connection and also reinforces each other: The synchronization of environmental and psychological cues strengthen the emotional ties among participants. Interaction and collaborative actions increase the enjoyment level when a sense of connectedness is elicited, and enhance the sense of sharing common time and place. The emotionality of the experience prompts social sharing and further induces interactivity and sense
21 2023 SEGD Communication + Place
Figure 2. Prototype testing 1 conducted in a virtual gaming environment in Sky, a mobile game by That Game Company.
Figure 3. Prototype testing 2 conducted in a simulated hybrid setting using mobile interface mockup and human actors as avatars controlled by the participants.
of common time and place. Together, the three elements create a truly shareable, interactable and emotional shared experience through which a sense of connection can be experienced between individuals that are far apart.
Secondary Research: Shared Emotional Experience, from Virtual Settings to Hybrid Settings
To understand the effectiveness of the theory, prototype testings were conducted in virtual (Figure 2) and hybrid (Figure 3) settings. Both tests contain the three key elements— synchronized multi-sensory experience, interactivity, and emotional elements. Participants were invited to complete a mission collaboratively or individually. Throughout the test, the participants’ emotional responses were observed, and their sense of connection was evaluated at the end of the test.
The virtual prototype had 10 participants (6 participants tested in pairs and 4 participants tested individually). and the test time was 7 minutes. The hybrid prototype test had one group of 3 participants (1 remote and 2 in-person), and the test time was 10 minutes. Although most participants reported that it was difficult to establish a significant sense of connection within the short time frame, early signs of emotional connection were observed in groups that had better results with the mission. In addition, participants from the group tests report a higher level of emotional impact than the solo testers, validating that sharing an experience has an amplifying effect on human emotions.
Applied Project: Where The Wild Things Are: Return To The Wild
To demonstrate how the Remote Shared Experience Theory can be used to create innovative remote experiences, an exhibition project was developed.
“ Where The Wild Things Are: Return to The Wild” is a hybrid experience based on Where The Wild Things Are, both the original story by Maurice Sendak and the 2009 feature film adaptation directed by Spike Jonze. The experience aims to inspire emotional awareness and illustrate a new way to extend empathy and build connection in an increasingly remote-reliant postpandemic world.
Consisting of two parts, an online mobile game (Figure 4) and a traveling exhibition (Figure 5), the project created an emotional journey that can be shared between online and in-person audiences. The mobile game is scheduled to be launched four months prior to the opening of the physical exhibition. With the entire island available for free exploration, the mobile game invites players into world of Where The Wild Things Are as the Wild Things avatars. The game features interactive tasks to engage the players with other on-line players as well as the in-person audience. Players can express their emotional state and develop lasting connections with other Wild Things through this platform.
The physical exhibition, on the other hand, brings parts of the Wild Things Island into mixed reality environments and invites the audience into the fantasy world as the human child. Through the use of technology, the audience can interact with the Wild Things controlled by the remote audience, explore emotions and stories, and create wild memories together. The exhibition will be traveling for six months, each month bringing new visitors into the world of Where The Wild Things Are Prospect Park in Brooklyn, NY will be used as a sample site.
The experience centers around a highly emotional story, Where The Wild Things Are, which explores the topics of personal emotions and social connections through a child-like yet sensitive manner. Through the innovative use of technology (Figures 6, 7, 8), the story is enhanced with collaborative and interactive missions and synchronized visuals, audio and touch, for the in-person and remote audiences to explore and enjoy together (Figure 9).
The project was met with high enthusiasm when presented to a panel of exhibit industry professionals. Many members from the panel expressed that the project presented an imaginative yet convincing solution to the remote engagement challenge, and that the theory provides a great anatomy to how future remote interactions can be designed. This application successfully demonstrated how the theoretical framework of synchronized multi-sensory experience, interactivity and emotionality can be applied to exhibition and experience design projects to expand the reach and impact of future exhibitions and help institutions remain relevant and connected to their audiences in the postpandemic world.
22


23 2023 SEGD Communication + Place
Figure 4. “Where The Wild Things Are: Return To The Wild” mobile game interface for remote audience.
Figure 5. “Where The Wild Things Are: Return To The Wild” traveling exhibition for in-person audience.


24
Figure 6. The interactive environments inside the exhibition enable in-person participants to gesture control their avatars and interact with avatars controlled by remote participants.
Figure 7. In-person and remote audiences interacting through avatars via the interactive environment and mobile game interface. The two systems work together to provide synchronized visual, audio and other sensory experiences as well as interactivity between the two audiences.


25 2023 SEGD Communication + Place
Figure 8. Various sensors inside the exhibition allow for multiple ways of interacting with the environment which enriches the synchronized sensory experience and subsequently enhances the shared experience. For example, the inclusion of vibration sensors in the floor enables in-person visitors to activate a programmed event by stomping on the ground. Meanwhile, the online participants will experience the effect of their stomping in the form of phone vibration, enhancing the sense of sharing a common time and place with the in-person audience.
Figure 9. In-person and remote participants sharing an emotionally rewarding moment with synchronized visual and audio after collaboration.


Conclusion
Through my research, it is evident that shared experience is a definite element to forming interpersonal emotional connections, and that ensuring synchronized multisensory experiences, interactivity and emotionality between physically distant participants is fundamental to creating a shared experience in remote settings.
In an era that anticipates more and more remote interactions, this research aims to provide a theoretical foundation to help exhibition and experience designers create a new generation of remote experiences that are truly engaging, connecting and impactful. By identifying the cornerstones of an effective remote shared experience, designers can explore outside of the existing experience models, and take advantage of the new possibilities this new form of interaction brings.

The project, “ Where The Wild Things Are: Return to The Wild,” is an imaginative demonstration of how these three key aspects of a remote shared experience –synchronized multi-sensory, interactivity and emotionality– can be intertwined fluidly and innovatively to create fascinating experiences and foster human connections. It is a preliminary showcase of how people can continue to have rich shared experiences together even when they are physically apart.
It is through these shared moments that connections grow and, in turn, nurture our personal and societal wellbeing. By having people see themselves together, roar together, and share emotions together, the findings of this paper illustrate that we can continue to enjoy the benefits of shared experiences, and thrive together, no matter how far.
26
-
Move Exchange
-
Play
Shared Objectives - Fort
Playful Interactions
Dance
Collaborative Play
Dream City
Session
Building
Sharing Wow Moments - The Celebration Show up for One Another and RUMPUS!!!
Figure 10. Various shared emotional experiences in “Where The Wild Things Are: Return To The Wild”
Resources
Boothby, Erica J., Margaret S. Clark, and John A. Bargh. “Shared Experiences Are Amplified.” Psychological Science 25, no. 12 (December 2014)
Cwir, David, Priyanka B. Carr, Gregory M. Walton, and Steven J. Spencer. “Your Heart Makes My Heart Move: Cues of Social Connectedness Cause Shared Emotions and Physiological States among Strangers.” Journal of Experimental Social Psychology 47, no. 3 (May 2011)
Durlach, Nat, and Mel Slater. “Presence in Shared Virtual Environments and Virtual Togetherness.” Presence: Teleoperators and Virtual Environments 9, no. 2 (April 2000)
McMillan, David W., and David M. Chavis. “Sense of Community: A Definition and Theory.” Journal of Community Psychology 14, no. 1 (January 1986)
Isbister, Katherine. How Games Move Us: Emotion by Design. MIT Press, 2016.
Zajonc, R. B. (1998). Emotions. In D. T. Gilbert, S. T. Fiske, & G. Lindsay (Eds.), (4th ed). The Handbook of Social Psychology, Vol. 1. (pp. 591−632) Boston: McGraw-Hill.
Kate E. Min, Peggy J. Liu, and Soo Kim, “Sharing Extraordinary Experiences Fosters Feelings of Closeness,” Personality and Social Psychology Bulletin 44, no. 1 (January 1, 2018)
27 2023 SEGD Communication + Place
Design for Social Impact
Participation as a Catalyst for Experiential Graphic Design
Niloufar Abdolmaleki Design MFA/ Experiential Graphic Design
Abstract
Design for social change is an emerging field of design that focuses on using design tools to create solutions that promote social justice and equity. It has the potential to make a significant positive impact on society and the environment. By addressing social issues such as poverty, inequality, and environmental degradation, designers can contribute to positive social change and promote social justice and equity (Buchanan, 2015). Design for social change can also benefit the design field by expanding its scope and demonstrating the value of design thinking as a tool for social change. This approach can help to position designers as thought leaders and change agents who are capable of making a positive impact on society (Thackara, 2015). Design for social change has many benefits, both for society and for the designer as a whole. By creating relevant, meaningful work, expanding the scope of design, collaborating with diverse perspectives, positively impacting society, and advancing the design field, designers can use their skills to create solutions that address complex social issues and promote social justice and equity.
Experiential graphic design has become an increasingly popular way to transform public spaces and engage communities. This paper presents a general adaptable guideline for experiential graphics. Drawing on examples from various participatory design projects, the guideline outlines a framework consisting of practices for designing participatory projects that aim to activate public spaces, foster community engagement, and create low-cost, high-impact designs that can be easily adapted to different contexts. The approach involves multiple case studies and three distinct designs for social impact plans, each with its unique concept. The methodology includes prototyping and testing; designs are then presented to the UC Davis community and tested to validate that they can be implemented in various settings and locations. Through this approach, designers can create experiential environments that engage people and create a wide range of transformative impacts on communities in purposeful and concrete ways.
28
Introduction
Participation is a powerful catalyst for creativity and engagement in experiential graphic design. By engaging users in the design process and creating opportunities for them to contribute to the final product, designers can create experiences that are more meaningful, memorable, and impactful. However, participation also presents challenges and opportunities, and designers need to be aware of these factors when incorporating participation into their EGD projects. By leveraging participation in their work, designers can create environments that reflect the needs and desires of the community, foster social connections, and inspire emotional responses.
The paper begins by outlining the challenges of traditional top-down design and the benefits of participatory design for experiential graphics. It then provides an overview of the design research and the case studies used to develop the framework. The paper summarizes the practices for designing participatory projects with social impact contexts and the potential of experiential environments to transform public spaces and engage communities.
Literature Review
“Experiential graphic design involves orchestrating typography, color, imagery, form, technology, and, especially, content to create communication environments.” -Peter
Dixon
Examples of experiential graphic design include wayfinding, architectural graphics, signage, exhibit design, retail design, and themed or branded environments. Increasingly, experiential graphic design involves using systems and digital technologies to present dynamic content through motion graphics, making rich interaction between the information provided and the user possible (What Is Experiential, 2013).
Visual arts are crucial in understanding diverse human experiences (Bailey et al., D., 2005). The designers and design researchers understand the built environment in one of four contexts—as object, product, communicator, or social domain (Gross, J.J., 2002) (Figure 1). It is experienced by the viewer not simply as a visual interpretation but as a bodily experience (which incorporates each of the senses to a greater or lesser degree), and this involves the environment as
a trigger for interpretation (Gross, J.J., 2002)(Figure 2). The interpreter’s field of interpretation is merged with the potential of an environmental situation “to produce” a particular understanding within that context. Franz (Franz J. A, 1997) proposes four conceptions of designing: experiential, structural, production, and retail.
Designers’ conceptions of what it is to design are related to how they design in practice. The experiential conception portrays design as “the development of a framework incorporating both people and their environments” and that designing is “a way of being in the world for the designer.” (Gross, J.J., 2002)
Community engagement can be done in various simple ways and still tremendously impact the audience. How would the audience feel more connected to the design? Would they feel like they are an essential design part and still learn from the experience? Through users’ selftracking Instagram posts, it is easy to find one way to share their emotions: drawing, which could express the emotions. Like coloring books were prevalent a few years ago (i.e., the Secret Garden coloring book), Turturro and Drake proved that any drawing could reduce anxiety (Turturro et al. Drake., 2020). As the example explained, there are simple approaches to engaging people utilizing various strategies to communicate our message. An experiential environment has distinct advantages: engagement, community interactions, inspiring people, increasing user knowledge and walking in spaces, and developing cross-cultural adaptations in the built environment.
What is wrong with the traditional top-down design?
When analyzing the traditional top-down design, a study (Hernandez et al., 2020) discusses how the design process itself remains almost unchanged despite the evolution of other design areas, like sustainable design, co-design, inclusive design, and social design, that have expanded the horizon of the design fields, addressing the complexity of the problems we are facing nowadays. Economic aims stand as the bold concern in the traditional approach. When more criteria are being considered and environmental and social objectives are pursued in the design process, responding to those objectives uses the same logic stages as traditional approaches.
29 2023 SEGD Communication + Place

Another study (Digital Commons, 2023) reflects on design as a field currently re-evaluating its political agency. Historically, designers have tried to instigate social change by designing objects. However, today’s social design comprehends itself as a change agent within a much more direct relation to the social. The study identifies the importance of re-evaluating our understanding of design’s roles in dealing with the contradictions arising from the traditional framing of our field constructively.
Traditional top-down design approaches in experiential graphic design (EGD) can lead to a lack of user engagement and satisfaction, as users may feel that their needs and preferences must be considered (Constantin, A. et al., 1970). Meanwhile, participatory design strategies can increase user engagement and lead to more meaningful experiences, enhanced creativity, and a positive social impact by bringing diverse perspectives and ideas together (Participatory Design, 2023).
Approach
This research results in a variety of prototypes and testing. The framework is tested on the University of California Davis community.
• This thesis research demonstrates a methodological approach that began with research, case studies, and theoretical analysis. With a clear goal based on experiential graphics, Phase 1 was to create a cross-cultural community engagement project as an interactive installation. The Dakhil project was installed in the UC Davis Arboretum in the Spring of 2022.

• The second phase includes another implementation of the Phase 1 project, Dakhil, to show its adaptability to all environments and concepts. The project is titled Woman Life Freedom.
• The third shows a wholly different concept. Change Makers is a flexible, interactive installation with the concept of mitigating climate change, which includes producing a series of prototypes and testing before the final production. This project proves we can design and create many other projects using this research framework.
Case Study- Before I Die by Candy Chang
Candy Chang, a Taiwanese-American artist known for her public space activation work, created the project Before I Die as a means for individuals to reflect on their values and contemplate their aspirations. Inspired by personal loss, Chang transformed an abandoned house in her neighborhood into a community space by turning one side of it into a large chalkboard. Passersby were invited to complete the prompt “Before I die, I want to ___” with their own aspirations using chalk. The project quickly gained traction, with people sharing heartfelt and diverse responses on the wall. The success of Before I Die led to the creation of online resources, enabling communities worldwide to create their own reflective walls, resulting in over 5,000 installations in more than 75 countries.
The project’s impact lies in its simplicity, fostering community engagement, reflection, and participation while activating neglected spaces. Chang emphasizes the importance of public spaces as platforms for expression, connection, and reminders of what truly
30
Figure 1
Figure 2
matters in life. The project aligns with the author’s own research interests, which explore the potential of simple but meaningful designs that can be adapted to various locations and concepts. The accessibility and effectiveness of Before I Die as a template or structure for engaging and activating spaces highlight the power of simplicity in design.
Implications
First Project - Dakhil
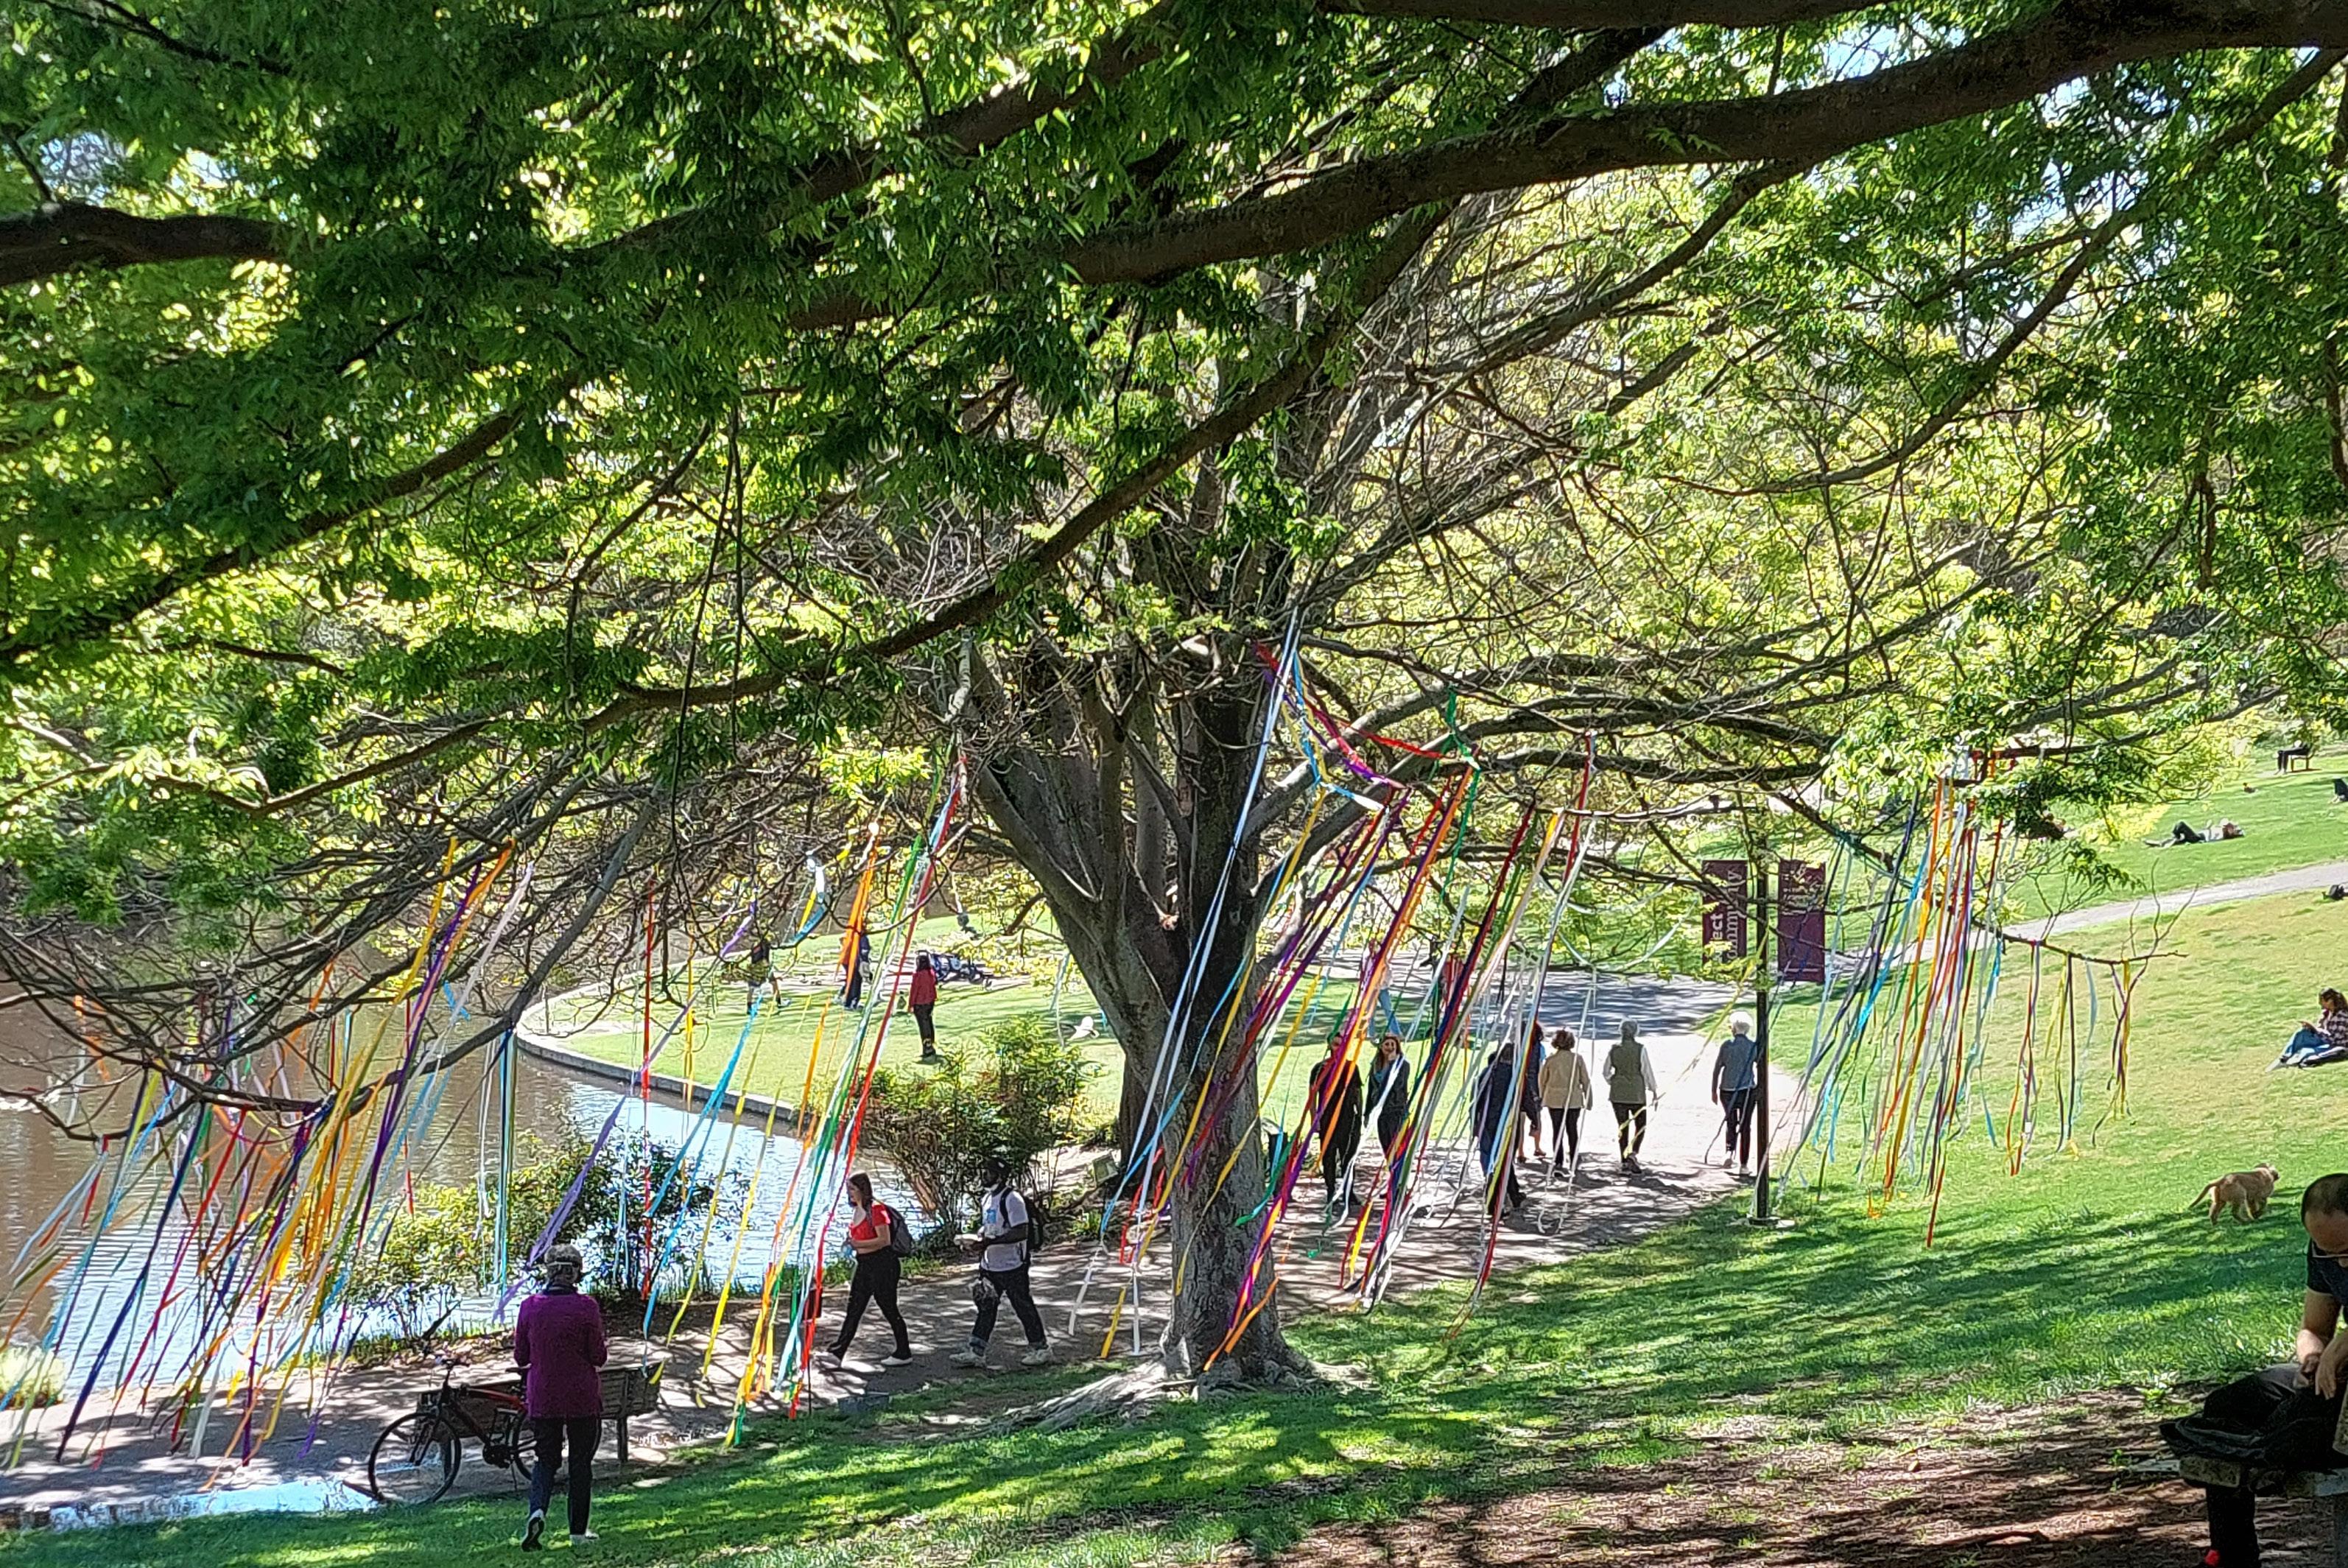
Project concept: To create an opportunity for people to self-reflect and write their wishes and hopes on the ribbons. The concept of the project is in support of the design Museum installation Guardians: Spirits of Protection by Design Prof. Emerita Ann E Savageau. The relationship between the two is to expand the knowledge of cultural approaches to healing and hope. The project was up in Davis at the Arboretum for a month and was published on the UC Davis website.
Dakhil is a traditional Islamic act of devotion that involves tying fabric to a shrine of an elder, a tree, or anything one considers sacred. It is usually done to heal the sick or to pray for the good things a person wants. However, this practice is not limited to Islamic traditions. It can be seen all over the world, such as in clootie wells in Scotland and Ireland and in Tibetan Buddhist prayer flag traditions.
The project shows a cultural adaptation of the Dakhil practice.
The installation comprises over 200 colorful ribbon pieces on tree branches and markers placed under the tree. Staples were used to attach the ribbons instead of knotting them for safety measures and to avoid damage to the branches. Washers were added to the bottom of each ribbon to prevent tangles caused by the wind and to add some weight to the hanging ribbons. This art installation also functions as a complete package for implementation in other places, checking the adaptability factor.
Three hundred and ten people participated in the Dakhil project. These are some of the written responses on the ribbons: “reunite with my son,” “acceptance to UC Davis,” “confidence in who I am without proving it to others,” “happy, healthy, safe, and fulfilled loved ones,” “Eddie wishes to find true compassionate love,” “a place that feels like home for all,” “pass law school,” “I hope for a long happy life for my grandchildren,” “to reach my goals,” “I wish for a house and peace,” “find peace of mind,” “just keep it up,” “less trash litter,” “lower gas prices,” “be authentic and true,” “kindness to one another.”

31 2023 SEGD Communication + Place
“New Orleans, Louisiana.” Candy Chang.
Second ProjectWoman Life Freedom
Project concept: To expand the knowledge of cultural approaches, protest, solidarity, and being hopeful for the Iranian people to win their fight against the Islamic regime and the oppressive system.
The Woman Life Freedom installation shows the creative relationship between trauma, empathy, and design and was created in solidarity with the Iranian people who are fighting against the Islamic regime dictatorship for their fundamental human rights. #Mahsaamini UC Davis community members were asked to share and spread the information to the world and raise awareness about what is happening in Iran in any possible way. People were encouraged to write one of the fundamental human rights on each ribbon to acknowledge one of the most significant woman’s movements in history, which is happening in Iran now. The Woman Life Freedom installation showcases a different type of Dakhil project to show its adaptability to other concepts, messages, and locations.
This installation comprises 600 yards of satin ribbons in green, red, and white (the colors of the Iranian flag). The height of each strip is three feet. Two hundred seventyfive washers are tied at the bottom of the stripes. Two pieces of vinyl are used to show the project title and the prompt. A QR code is provided under the instructions for people who are curious to know more about the project.
The installation was on display in the Cruess Hall building’s courtyard at UC Davis for two months, from November 2022 to January 2023. 120 people participated in the project. These are a few written responses: “to choose,” “security,” “healthcare,” “free to believe,” “respect everyone,” “access to clean water,” “kissing your lover,” “women singing,” “we deserve peace,” “to love whoever you want,” “free and unrestricted access to internet,” “peace of mind,” “to feel safe to go out,” “clean air,” “wearing what I want to,” “having control over your own body,” “privacy,” “equal opportunities for education.”
32
Dakhil Ribbons, Spring 2022


Dakhil Ribbons, Spring 2022


“Design rethinks the role of visual communication in the built environment.”
The poster design for this project was accepted as one of the top twenty posters reflecting the theme, Women’s Rights in the Visual Voice (Graphic et al.) at the University of North Georgia. The printed poster was displayed in the Roy C. Moore Gallery on the Gainesville campus for a month. This project is also the Merit Award winner at the 2023 SEGD Global Design Awards.
Third Project - Change Makers
Project concept: To raise awareness about climate change and emphasizing its significance. The project comprises two participatory components. Climate change is a significant concern for the planet due to its potential environmental, economic, and social impacts. It has long-term implications for future generations and devastating, irreversible impacts on the planet.
Change Makers highlights various concerns related to climate change on the left side of the board (dark color theme), and lists actions that individuals can take to help mitigate the effects of climate change on the right side of the board (light color theme). Visitors are initially prompted to reflect on how climate change impacts them personally. The second step for the participants is to share how they contribute as individuals to help the climate change situation.
Change Makers’ design process includes sketching, testing, and prototyping to find the best way to highlight accessibility, equity, and adaptability. The height of the board is designed based on the ADA principles for signage systems. Materials include Sande plywood, hardboard, magnet roll and magnet tapes, mat board, vinyl, wood glue, screw, and chains.
33 2023 SEGD Communication + Place
Prototyping and Testing
After making some prototypes to test the structure (Figure 3), I made a mockup using paper printed, including the prompt and colorful labels, to test out the interactive element of the project (Figure 4). The project was explained to undergraduate students, who were invited to participate. The prompt includes:
My concern about climate change is…
My activity to help climate change is…
The results showed that the prototype was successful in terms of interaction and communication with the participants based on the participants’ reflections and feedback about the project.
On the first day of the project display, approximately 60 people participated in the Jan Shrem and Maria Manetti Shrem Museum of Art. According to the project’s timeline, the number of participants will increase over the next two weeks while the project is on display. These are some of the written responses:
My concern about climate change is “anthropocene,” “plastic waste in the ocean,” “lack of knowledge,” “air quality,” “wild fires,” “plastic waste,” “extinction of polar bears,” “Asiatic cheetah,” “summers being too hot,” “social changes such as having no kids.”
My activity to help climate change is “use reusable bags,” “composting my coffee grounds,” “upcycle used things,” “gardening,” “no fossil fuels,” “I will use reusable things and protect the nature around me,” “stop fast fashion purchases,” “using solar energy for house,” “self educate about current climate change news.”
Wave and Breeze
In the Spring of 2023, two undergraduate students, Liang Qiao, and Yuchen Hou, showed interest in working with my supervision to produce their interactive installation as a group project using this thesis framework. This project helped this research reach its purpose as a guideline that can be used for other creative projects.
Project’s concept: Raise awareness and acceptance of mood and anxiety disorders within the community, using design as a tool for empathy. Build connections within individuals and provide more social support.
Wave and Breeze is an interactive installation that provides a profound platform for exploring/examining the current mental health crisis among many collegeage students. It fosters community awareness and acceptance of mood and anxiety disorders. The installation comprises hardboard, paper pinwheels, and screws. The board is placed on two easels.


34
Woman Life Freedom, Winter 2022


35 2023 SEGD Communication + Place
Change Makers, Spring 2023
Figure 3
Figure 4
The centerpiece of Wave and Breeze comprises pinwheels as a nostalgic symbol of childhood and happiness. The pinwheels moving with the wind, emanating a soothing aura, inviting the UC Davis community to embrace a moment of tranquility and relaxation. All the audiences are encouraged to express and write on the pinwheels.
Low Cost
Controlling the project’s budget could always be challenging. This part of the framework helped me to realize that there could always be an alternative that works when it comes to material selection. Three projects’ total costs are:
Dakhil: $200 Total, Woman Life Freedom: $200 Total, Change Makers: $280 Total.
Wave and Breeze: $220 Total.
As mentioned, the budget is low for all the projects, but this did not affect their impact.
Conclusion
Experiential graphic design is an expanding field that grows every day. Incorporating adaptable experiential environments with participatory design holds immense potential to engage and profoundly influence diverse communities actively. The power and effectiveness of participation are apparent in all the presented projects when people are in charge of bringing them to life. The touching concepts with social impact are practical as a critical element that brings people to interact with the projects by bringing a specific emotion through design. For instance, Dakhil touched the sense of self, love, hope, and healing. Additionally, the color choice helped the project to be more appealing and engaging for the visitors. Women Life Freedom brought a sense of empathy and made a heavy concept relatable to everyone by making them reflect on human rights and righting one on the ribbons. Furthermore, ribbons helped the place activation element catch the viewers to participate. Change Makers colorful magnetic labels made the project’s participation more enjoyable, as people could choose the colors they wanted and place them on the board with their preferred positioning. The simplicity of the prompts also helped to bring in more participants.
Although this thesis offers only a limited number of examples, it is essential to acknowledge this field’s vast array of possibilities. The framework presented here underscores the importance of considering factors such as participation, place activation, community engagement, Low cost- High impact, and adaptability throughout the design process. By integrating these factors, designers can effectively contribute to creating environments that foster meaningful experiences and reach positive social outcomes within communities.
Future
This research endeavors to serve as a valuable resource for researchers and educators, delving into the crucial realm of design for social change. In particular, it sheds light on the potential impact of experiential graphic design, empowering creatives to explore novel avenues for crafting impactful temporary installations or incorporating the framework into their prototyping endeavors, especially when designing for the communities. The inherent simplicity of these methods holds the power to ignite inspiration, fostering the activation of spaces and cultivating remarkable experiences, all while alleviating economic concerns.
36

Resources
1. Buchanan, Richard. “Wicked problems in design thinking.” Design Issues, vol. 31, no. 4, 2015, pp. 3-9.
2. Thackara, John. How to Thrive in the Next Economy: Designing Tomorrow’s World Today. Thames & Hudson, 2015.
3. Bailey, Carol, and Dipti Desai. “Visual art and education: Engaged visions of history and community.” Multicultural Perspectives, vol. 7, no. 1, 2005, pp. 39-43, https://doi.org/10.1207/s15327892mcp0701_7
4. Gross, J. J. “Emotion Regulation: Affective, Cognitive, and Social Consequences.” Psychophysiology, vol. 39, no. 3, 2002, pp. 281–291.
5. Turturro, Nicole, and J. E E. Drake. “Does Coloring Reduce Anxiety? Comparing the Psychological and Psychophysiological Benefits of Coloring Versus Drawing.” Empirical Studies of the Arts, 2020.
6. Turturro, N., and J. E. Drake. “Does Coloring Reduce Anxiety? Comparing the Psychological and Psychophysiological Benefits of Coloring Versus Drawing.” Empir. Stud. Arts, 2020.
7. Franz, Jillian. “A phenomenographic study of design in the interior context.” Doctoral dissertation, Queensland University of Technology, Australia, 1997.
8. Hernandez, Ricardo J., and Julian Goñi. “Responsible Design for Sustainable Innovation: Towards an Extended Design Process.” MDPI, 29 Nov. 2020, www.mdpi. com/2227-9717/8/12/1574
9. “Urban Struggles and the Role of Design.” Digital Commons, www.tandfonline.com/doi/pdf/10.1080/14606 925.2017.1352818. Accessed 6 June 2023.
10. Constantin, Andreea, et al. “Pushing the Boundaries of Participatory Design with Children with Special Needs.” Proceedings of the 18th ACM International Conference on Interaction Design and Children, 1 Jan. 1970, www.semanticscholar.org/paper/Pushing-theBoundaries-of-Participatory-Design-with-ConstantinFails/fc2b6d94b94092eb685bcb98e96f5c71ae31e48a
11. “Participatory Design Going Digital: Challenges and ...” Springer, link.springer.com/content/pdf/10.1007/ s10606-022-09438-3.pdf?pdf=button. Accessed 6 June 2023.
12. “Before I Die I Want to... | Candy Chang.” YouTube, uploaded by user Candy Chang, 4 Sept. 2012, www. youtube.com/watch?v=uebxlIrosiM
13. Chang, Candy. “Before I Die.” Candy Chang Before I Die Comments, candychang.com/work/before-i-die-innola/
37 2023 SEGD Communication + Place
Wave and Breeze, Liang Qiao, and Yuchen Hou, Spring 2023
Directional Type Design
Improving Wayfinding Systems Through the use of Variable Fonts and Digital Signage Technologies
Lauren Green, Typo-Graphic Designer, Researcher, MFA, Adjunct Professor, Kent State University
Abstract
Utilizing a typographic-based lens when approaching how designers problem-solve in environmental spaces can open up new opportunities and solutions to solving the divide between physical and digital spaces and their technology. The combination of variable fonts and digital signage presents a unique and practical solution to the various challenges wayfinding systems face.
These challenges include issues with readability, monolingual signage, low visibility, minimal readership, material waste, and limited adaptability to environmental conditions and space functionality.
Variable fonts, on the other hand, are incredibly versatile and adaptive. They can be easily modified, and their display methods can be customized for any resolution or medium, static or digital.
With new infrastructures and spaces emerging, typographic and display technologies continually evolve. Designers must capitalize on and leverage these advancements to instill a better experience for those interacting with them. This investigation examines the directional attributes of a partially formed typeface to ascertain whether typography alone can aid users in navigating a given space or improve the logic of current systems. The findings of this investigation set the foundation for shaping the future of environmental graphic design’s relationship with typography and presenting a solution to how digital wayfinding systems can utilize variable font technology more effectively.
38
Introduction
To understand wayfinding systems and their typography, we must first understand how humans navigate a space. This can be generalized and a simple way to get from point A to B. But it can also be a very complex system that stems from the physiological and psychological reasons we as humans make certain decisions. Cognitive processing is a series of operations carried out to create and manipulate mental representations of information. Designers can better understand and apply these theories to wayfinding systems through implementation. By making more intentional choices tailored to the environmental space where the type is displayed and viewed, designers can better comprehend the choices needed to improve recall and recognition.
Digital wayfinding is a facet of environmental graphic design that digitally displays signage containing information that supports the viewer to a particular destination.
Typography or textual content is one of the most important ingredients in digital environmental signage. Many signage systems rely on legible, straightforward, and well-designed font families to convey the right directional indicators. Their purpose is to be seen and read. Unlike the traditional means of wayfinding, like static signage, digital systems offer more variability and interactivity for viewers. This includes the possibility of utilizing variable fonts within this sometimes unnecessarily static design field. A variable font, also known as an OpenType Font Variation font, is the equivalent of multiple individual fonts that can be compactly packaged within a single file.

Variable typefaces are frequently used within web design and other digital platforms to decrease file sizes, augment browser speeds, and provide users with more visual attributes. With their more efficient storage and file-handling capabilities, variable fonts can contain more information than just the words they spell. By utilizing this font type, designers have the ability to embed what is called social characteristics into the creation of a font, a capability that static non-variable typefaces can never contain. Social characteristics are specific attributes a font has that solve or cater to varying needs. For instance, take the well-known typeface Helvetica. It has modernly been used to convey professionalism in business and is excellent for a simplistic approach to signage design. However, the infamous font can not be modified or tweaked to better suit an environment. This is the advantage variable fonts contain. They can be designed to best fit the reader, no matter the environment, static, digital, or interactive. To name a few axis point options, these fonts can adapt to changes in italicization, weight, size, width, and slant for a better reading angle and almost any other changing variable many signage systems face.
This research explores ways to improve and implement this technology into signage systems and how directional signage can benefit from variable typography within digital signage environments. To accomplish this, a partial character set was designed to embody and test the physical directional value of typography over a pool of 65 participants. Success can be defined by the readability and functionality of the created typeface and how well respondents understood its directional instruction with and without additional cues like arrows or icons to assist in a simulated wayfinding journey.
39 2023 SEGD Communication + Place
Figure 1. Variable Font File Compression (Stocks, E. J. 2023)
“There are no specific references in either the 1991 ADAAG or 2010 SAD guidelines for interactive digital signage.”
SEGD 2012 ADA White Paper Update
Case Studies
Wayfinding and typographic recognition is a continuous learning process as environments and places change, new infrastructure is created, and signs and signals are installed; the cyclical cycle of learning never stops as new things are constantly being created.
Gen Ramirez: Entorno
Designer Gen Ramirez, a practicing professional and graduate of Typography at the Royal Academy of Art, The Hague, Netherlands, has experimented with and created a typeface that starts to explore the relationship variable font technology has with wayfinding systems. Ramirez recognized a similar lacking need or gap within the wayfinding and EGD industries regarding typography. He questioned that if environments are becoming more interactive, why can’t the typography


used within them act the same way? This begs the question of how the ideology of type design must change to meet these new needs and trends for future use. Entorno, a typeface created by Ramirez, incorporated variable fonts and axis manipulation as a response to this new paradigm.
According to Ramirez, three scenarios were conceptualized in figure 2. A) Variable font that adapts in width and weight axes, B) Variable font that depending on the relative distance of the observer, letterforms are stretched in its vertical dimensions without modifying the width of its vertical strokes and adjusting the weight of his horizontal strokes. C) Variable font: according to the observer’s view angle and distance, single characters adapt their weight and width to compensate for or improve possible readability problems (Ramirez, G. 2018).


40
Figure 2. Gen Ramirez Entorno Type Specimen (Ramirez, G. 2018)
Ramirez’s work on Entorno exemplifies how variable font design involves the complex interweaving of considerations, demonstrating that type design or a more typographic approach to solving design problems can offer alternative solutions to wayfinding systems that the current landscape of designers has yet to consider. The success of a type design, such as Entorno, demonstrates the significant impact that typography can have in challenging and changing expectations.
P.A.M: Sofi Stadium
Apart from the inevitable variations in visual style, most of the innovation for sign panel systems has focused on an individual sign’s changeability (Edo Smitshuijzen, 2007). Entorno has proven the typographic capabilities towards the future of these dynamic systems, but where will they live? How can they be displayed? Progressive Asset Management, or PAM, has been a longstanding SEGD affiliate and has started the digital signage revolution with its innovative design, software, and installment of Sofi Stadium, located in Inglewood, California. PAM’s innovative digital wayfinding system was implemented to better help manage the wayfinding flow for traffic and crowds as visitors navigate through different venues throughout the year. Due to Sofi’s wide variety of venues and events, they were in need of a signage system that was as adaptable as their very own venue.
The digital revolution and progression of technology have allowed for easy adaptability for venues like Hollywood Park and Sofi Stadium to become a part of complete electronic networks. These networks prove that we no longer need to install just permanent physical signs, but to have a multifaceted system containing both stationary and dynamic digital signage is well on its way to becoming the future of dynamic wayfinding.
Design Methodology
It is important to acknowledge that, just like fine art, typography is still influenced by periods of successful trends from the past (Unger, 2018). We identify and accept these cognitively shared trends, leading one to conclude that SEGD’s selection of commonly used typefaces for wayfinding systems is based on our exposure and familiarity with these forms alongside the strategic clear visual character guidelines depicted in section 1.3.3 of the 2012 White Paper Update. Once a type designer identifies an unmet need, the initial step is to ascertain the stylistic attributes the font will adopt. When considering this, I heavily relied on the characteristics in the SEGD 2012 White Paper Update for ADA guidelines. Expanding the ideation process outside the normal box typically seen in wayfinding signage is important at this stage. The goal of these

41 2023 SEGD Communication + Place
Figure 3. PAM Sofi Stadium Digital Sigange System (PAM. 2022)


1 x-height - height of a letter extending from the baseline to the top of the letter x.
2 descender/ascender - part of a letter that extends above or below the x-height or baseline.
3 low contrast weight - a font style that that even strokes in all parts of the letter
4 joint uniform stems - the point or cross section of a letter and the weight associated with them

42
Figure 4. Preliminary Type Sketches
Figure 5. Partial Type Specimen
initial experimentation sketches was twofold: to determine the most effective approaches and to also identify faulty strategies, which can be just as valuable in the process of elimination.
The trend emerging for the more successful sketches embodied a taller x-height,1 shorter descenders,2 ascenders,2 sans serif and slab serif characters, a wider width, low contrast in weight, 3 and letterforms that slanted no more than 20-30%. These characteristics also align with common traits seen in approved fonts for wayfinding systems created for maximum legibility and readership, two of the most important aspects of wayfinding typography. By utilizing a slab design, more movement directionally can be achieved based on the length and angle of the serifs that joint with uniform stems.4
Letterform Solution
The goal was to see what parts of each letterform should indicate and contain the directional characteristics. Should that movement be placed in the stem, near the baseline, through the weight of the letter, by expanding the width or an expanding stroke? All of which raised the question, “What is the most efficient way to portray movement that is understandable and has the lowest chance of misinterpretation?”
By examining various approaches, I concluded that italicized motion was more effective in conveying meaning than the warped and distorted methods used in previous sketches. To encapsulate this discovery, the partial typeface created will embody two axis points, 1.) left and right, which will be italicized in both directions and 2.) an up and down axis point to convey all possible movements.
Simulated Wayfinding Testing
Before taking any other steps, I had to set initial expectations and goals for what I wanted to get out of this test. The most important factor was if variable typography alone could navigate participants through the course without the help of any other external factors, like arrows or directions.
To accomplish this, I created three different course types
1) Featuring just the animated variable font
2) Containing the animated variable font with an arrow included
3) A stagnant non-animated variable version.
It was imperative to have course number two, with the featured arrow, as a control group or baseline to determine the effectiveness of the other courses with these variables in consideration.
To accommodate the limitations of the gallery space, I chose to utilize only two of the four axes of variation present in the typeface I had designed for this research.
To determine a successful test, these factors were considered:
1) Time per decision point of the control group
2) Number of correct answers or successful navigational paths
3) Learning curve
4) Rate of understanding by the participant
Results
Over six days, 65 participants ran through three different courses. The factors for each course number were collected, analyzed, and compared to determine which content was more effective in guiding participants from the starting point to the endpoint. Each course is given a ranking for each category based on the final data points presented. The rank total represents the cumulative amount received in each category. The course with the lowest rank total, in this case, course one, was the most successful course throughout the duration of testing. Success can be measured based on the degree of proximity to the ideal score of four by receiving a one in all categories. A perfect score of four indicates that the corresponding wayfinding system enables quick navigation, allows all participants to learn its usage with minimal difficulty, and ultimately helps them reach their intended destination on time.
43 2023 SEGD Communication + Place

Astonishingly, course number two, originally intended to provide a baseline, was ranked last in directing participants through the course. Despite its efficiency in leading users to their desired destination, it performed poorly in all other categories. While it is true that finding the intended destination is the most critical aspect of this ranking system, the emergence of new technologies and the growing complexity of these systems, such as digital displays and variable typography, emphasizes the importance of categories one, two, and four in determining a successful experience.
Limitations and Considerations
By providing a platform for further experimentation and growth into this concept, it is important to note what could not be accomplished by this series of user testing. The study’s achievement in determining typography’s
significance in directional signage depended on a single phrase set at display size. Expanding the experiment by using more content could yield different and more expansive results. It would be intriguing to investigate whether the readability and comprehensibility of multiple signs can be maintained simultaneously with several animations in motion. In addition to this idea, another aspect that should have been utilized within user testing was the effects of societal influence on decision-making. Participants were only allowed to enter each course one at a time without observing the user in front of them. Comparing individual participation with group evaluation within the same three courses could yield different results by introducing a collaborative approach. Regarding ADA guidelines, having a wider variety of participants with disabilities could have also expanded the results of this test for a more inclusive panel of users.
44
Figure 6. Course Displayed Content


Yielded Takeaways
Using the four identified categories to measure courses one through three’s success and effectiveness (overall time, learning curve, ease of understanding, and route correctness) provides a tool to determine successful wayfinding systems during a design’s user testing process. As indicated by Figure 10, this rating scale allows for any wayfinding systems to be compared to one another to determine which is most successful after gathering categories one through four data points.
Before launch, designers can also assess a single system in isolation, without any comparison, to ensure its rating is as close to four as possible for optimal outcomes. The key points and takeaways identified in this research make this rating system suitable for future wayfinding evaluations as a framework for designers to utilize for any number of purposes.
45 2023 SEGD Communication + Place
Figure 7. Course Setup
Figure 10. Evaluation Framework


46
Figure 9. Result Ranking Chart
Figure 8. Course Setup Diagram
Conclusions
Wayfinding systems incorporate typography as a fundamental component, providing directions, instructing us on how to reach our desired destination, and effectively directing us to where we need to go. User testing results reveal new meanings and potential with how typography can be used within these systems. Not only can type be read, but it has proven that variable typefaces can provide more than textual context by implementing direction to its readers. The use of stylized italics in directional signage is significant in light of the increased prevalence of digital systems and the uptick in variable font usage. With new technology comes new ideas that open up the opportunity for new experimentation with these acceptable norms. The relevance of these results is most significant within the field of EGD for two reasons. The first and most anticipated is that designers of wayfinding systems now have the opportunity to improve the way directional signage could be presented through the use of this variable font when designing for digital systems, as well as discover the option to create other stylized italic typefaces to use in their very own designs. Despite being a new approach for users, the use of italic type as a movement has been proven to have significant learning potential, as demonstrated by the evidence presented in this study.
Until now, there has not been a comprehensive discussion on the significance of incorporating variable typography in EGD. The concept of replicating direction through these axis points indirectly connects to wayfinding practices. Through interdisciplinary exploration, this research adds fresh perspectives and value to both design fields. It contributes to a need for ongoing research and development to further improve
and heighten the experience for all users of wayfinding systems in light of technological advancements to digital signage and their display methods.
By providing more ways direction can be interpreted and used within a signage system, the end user will ultimately navigate, learn, and remember the system more effectively. The potential of advanced typography in wayfinding systems is immense, with the power to significantly improve the user experience. In the words of Jean Piaget, “Intelligence is what you use when you do not know what to do. What we see changes what we know. What we know changes what we see.” With continued exposure, any experience can become habitual. The exploration of variable typography is the catalyst for the future development of wayfinding systems, with greater experimentation, which leads to even more significant advancement.
Resources
Edo Smitshuijzen. (2007). Signage Design Manual (pp. 68–69). Lars Müller.
PAM. (2022). SoFi Stadium Digital Wayfinding Signage System [Online image]. Link
Ramirez, G. (2018). Angular Perspective Variability [Online Specimen graphic]. Link
Stocks, E. J. (2023a). Variable verses Traditional [Digital infographic]. Link
Unger, G. (2018). Theory of Type Design (pp. 155–161). Nai010.
“This research suggests that directional icons, such as arrows, are not the only means of indicating direction and that variable typography in italic or contra-italic form can be equally effective over time.”
47 2023 SEGD Communication + Place
Experiential Design
An Interdisciplinary Certificate Program for Post-Secondary Design Education
Loran Sanvido, Master of Design
Abstract
Experiential graphic Ddesign (EGD) is a multidisciplinary design field not commonly taught in post-secondary education. Entry-level designers face a steep learning curve when starting in this field due to the specific skills, knowledge, and personal attributes required to design for the built environment. While the position is open to individuals from multidisciplinary backgrounds, an interdisciplinary mindset is necessary for success. Introducing EGD into post-secondary design education can better prepare entry-level designers for the current design challenges and make them more aware of the skills and attributes needed for a career in the EGD field.
To fully understand the entry-level experiential graphic design position, this case study uses a mixed-method convergent design approach. A questionnaire is used to gather qualitative and quantitative data, and ten industry professionals are recruited through convenience and purposive sampling for their experience level. The data gathered is analyzed using data screening, the structural coding method, and the Designers’ Professional Identity framework (Kunrath et al., 2020).
An interdisciplinary experiential design (EXD) certificate program is designed for post-secondary education, at the University of Cincinnati, with four components — the Society of Experiential Graphic Design’s (SEGD) Core Competencies, mentorship, reflective practices, and the Designers’ Professional Identity (DPI) framework. These components are the foundation of the EXD program. They are used to create the five courses and one co-operative (co-op) experience that meets the needs of the entry-level experiential graphic design position. This program teaches students how to leverage relationships, interactions, and the interconnection of people, places, and artifacts to become successful experiential graphic designers.
48
Introduction
Experiential graphic design (EGD) is a design practice that focuses on creating visually appealing and immersive experiences for people in the built environment. The built environment encompasses all human-made surroundings built for use by humans, such as buildings, museums, and public places. EGD uses various design elements such as typography, color, imagery, and content to create signage, wayfinding, environmental graphics, and interactive installations. These design elements aid people in navigating and engaging with their surroundings, making their experience memorable.
A successful experiential graphic designer must have an interdisciplinary mindset incorporating knowledge from various fields like graphic design, architecture, urban planning, interior design, landscape design, digital design, and industrial design. However, post-secondary design education seldom includes EGD teachings, which makes it challenging for recent design graduates or entry-level designers to meet the requirements of an entry-level position. Integrating EGD into post-secondary design education can equip students to meet the needs of entry-level positions and raise awareness about the field.
The scope of this case study aims to explore the requirements for an entry-level experiential graphic design position to provide insights into the skills, knowledge, and personal attributes needed for the position. The mixed methods convergent design approach is necessary to gather qualitative and quantitative data to understand the position entirely. Participants were selected through convenience and purposive sampling, and they provided data through a questionnaire. This study is bound by the participant’s voluntary time to complete the questionnaire and in the timeframe of this thesis research. Data analysis was conducted through data screening and thematic coding. The results of the qualitative data are interpreted through the Designers’ Professional Identity framework by Kunrath, Cash, and Kleinsmann (Kunrath et al., 2020).
This study seeks to learn how experiential graphic design can become integrated into post-secondary design education Specifically, the research pursues the following questions:
1) What skills, knowledge, and personal attributes are needed for an entry-level experiential graphic design position?
2) Where does experiential graphic design fit into post-secondary design education?
3) How might an interdisciplinary, experiential graphic design program be designed to better prepare students for an entry-level EGD position and meet the needs of contemporary design challenges?
In today’s post-secondary education, multidisciplinary and interdisciplinary design programs are increasingly popular. This research proposes an interdisciplinary experiential design program called the EXD certificate, which will equip students with diverse skills not typically available in a single-discipline program. By participating in this program, students will become versatile designers capable of tackling problems from multiple angles and working seamlessly in a collaborative environment similar to experiential graphic designers.
Personal Statement
As an undergraduate graphic design student at the University of Cincinnati’s College of Design, Architecture, Art, & Planning, I was introduced to experiential graphic design (EGD) through co-op. The University is well-known for its co-op, an educational model where students alternate between traditional academic semesters and work in their field of study to gain hands-on experience. Through this program, I discovered my passion for EGD — a field that combines architecture and graphic design. However, no specific EGD courses were included in the curriculum at that time.
After graduation, I began working as an entry-level designer in the EGD industry. Initially, I struggled due to a lack of preparation, but with time, I progressed to become a senior designer and a co-op mentor. Despite sharing tips and tricks with students, they still faced similar challenges. As a result, I developed self-reflective practices while mentoring them, observing their progress, and reflecting on my growth.
Recently, I left the professional world to pursue a Master of Design degree at the University of Cincinnati in hopes of becoming an educator. During this time, I became an Adjunct Instructor and implemented reflective teaching practices in my courses to help students recognize their
49 2023 SEGD Communication + Place
developing skills and learning processes. Through this experience, I improved my self-reflective practices and gained more confidence in teaching.
This research is a culmination of my insights from different roles over many years. It draws on my experiences as an undergraduate design student, my professional design career as an experiential graphic designer, a Master of Design graduate student, and an educator. A literature review and user testing are also conducted to support these findings. My objective with this research is to create a better path for students to become entry-level experiential graphic designers through formal design education.
Literature Review
Experiential graphic design (EGD) has its roots in prehistoric times, where graphic symbols and images were used to communicate, as evidenced by the cave paintings in Lascaux, France. However, the origins of EGD, as we know it today, can be traced to the growth of human-made environments, such as cities. With the expansion of cities, the complexity of the built environment increased, necessitating people’s need for information to navigate and use their surroundings (Calori & Vanden-Eynden, 2015, p. 3). This need gave rise to the term “wayfinding,” an early form of EGD.
The term “wayfinding” was not coined until 1960 by urban theorist Kevin Lynch in his book Image of a City. By the 1970s, experiential graphic design was more notably known as architectural graphics, or architectural signing, because these designers “often worked in architectural offices, and their design work related to architectural spaces” (Calori & Vanden-Eynden, 2015, p. 3). However, these terms were seen as limiting to designers and were confusing to those outside the field.
In 1973, a group of designers came together to discuss the increasing importance of sign design and 3D graphic communications in the built environment (SEGD | About, 2023). This led to the creation of the Society of Environmental Graphic Designers (SEGD), which aimed to promote the sharing of expertise, development of best practices, and evolution of the discipline (SEGD | About, 2023). However, in 2013, the organization changed to Society for Experiential Graphic Design “to encompass the ever-changing diversification of its membership” (SEGD | About, 2023).
SEGD’s membership includes EGD practitioners, industry professionals, educators, and students who come from various design fields (including graphic design, architecture, urban planning, interior design, landscape design, digital design, and industrial design). These practitioners span 16 industry verticals or disciplines defined by SEGD (SEGD | About, 2023). Each vertical aims to improve the user experience by creating memorable and engaging experiences.
These types of experiences are trending in the United States. According to Trend Hunter, the country is in an “Experience Economy” mega-trend — a stable trend capable of influencing for over a decade (Trend Hunter, 2022). This means “consumers are less inclined to purchase products than they are to seek experiences and the opportunity to create memories” (Trend Hunter, 2022). Furthermore, this trend illuminates the potential need for more experiential graphic designers to meet the consumer’s demands for experiences.
More experiential graphic designers are needed in the field to meet these demands. Unfortunately, however, the EGD field is primarily taught in the field like a trade rather than being taught in higher education as a design practice. Historically, design practices began in the field as a trade until the 20th century when an increase in professional design services was needed (Davis, 2017, p. 5). According to Meredith Davis, a Professor Emeritus at North Carolina State University and author of Teaching Design, design education programs were developed to ensure “a predictable supply of competent designers” in their fields (Davis, 2017, p. 5). Design education is now primarily offered at the post-secondary level, typically through universities or colleges, where only a few EGD programs exist. Implementing more EGD programs into post-secondary design education would help develop more experiential graphic designers and meet the needs of the industry.
In 2009 David Gibson wrote in his book, The Wayfinding Handbook, “there is no single, obvious career path for becoming a wayfinding or environmental graphic designer, but rather an indirect journey that combines interests, talents, obsessions, ideas, training, experience, and mentorship” (p. 25). The winding career path that Gibson describes can be attributed to the lack of presence in design schools and changing identity over the years.
50
Only a few EGD programs have emerged in the recent decade. These programs are offered at undergraduate and graduate levels but are inconsistent in their names. For instance, Sheridan College offers an undergraduate program called Experience Design (Sheridan College, 2023), while the Fashion Institute of Technology has a graduate program in Exhibition and Experience Design (FITNYC, 2023), and Iowa State University has a graduate program called Master of Environmental Graphic Design (Iowa State University, 2023). These inconsistencies arise due to the difference in the breadth of knowledge being taught. However, these EGD-related programs at the post-secondary level are a significant achievement for the field.
The most typical place to find EGD in post-secondary education is integrated into graphic design-related curricula. According to SEGD’s Academic Task Force, most courses are offered as electives by adjuncts and lecture faculty who practice EGD (SEGD | Education, 2023). These courses vary by institution, ranging from elective seminars to practice-based studios (SEGD | Education, 2023). Additionally, the SEGD organization notes that students exposed to an “interdisciplinary collaboration” will enter the professional practice prepared to tackle a wide range of design problems (SEGD | Education, 2023).
In 2017, SEGD conducted a skills survey defining the competencies and skills required for professional practice. From the survey, the organization updated its EGD Core Competencies, which are guidelines for educators and professionals to expand the baseline of skills and knowledge needed for an experiential graphic designer (SEGD | Core Competencies, 2023). SEGD, however, does not distill these competencies and skills into a program or curriculum for educators. Nor does the organization mention the importance of personal attributes or overcoming challenges experienced within the field.
User Testing
This research aims to conduct a comprehensive case study on an entry-level experiential graphic designer role. According to Sharan Merriam, Ph.D., case study research involves a detailed analysis of a specific phenomenon, such as a program, institution, person, process, or social unit (Ebneyamini & Moghadam, 2018, p. 2). A systematic
approach is used to conduct this study, including a literature review, theoretical framework development, and research question identification (Yazan, 2015, p. 141). The identified research questions are:
1) What skills, knowledge, and personal attributes are needed for an entry-level experiential graphic design position?
2) Where does experiential graphic design fit into postsecondary design education?
3) How might an interdisciplinary, experiential graphic design program be designed to better prepare students for an entry-level EGD position and meet the needs of contemporary design challenges?
To answer these questions, user testing in the form of a questionnaire is the most effective due to the short time frame. A participant sample of ten participants is sourced using two sampling methods: convenience and purposive sampling. Convenience sampling involves selecting professionals from my LinkedIn network. At the same time, purposive sampling involves selecting participants with professional design experience and experience managing or hiring entry-level EGD designers. Seven participants hold a director or higher-level position; the other three are Senior Designers or Designers with significant experience (10+ years). Once participants agreed to participate in the study, participants were given a digital link to complete an online questionnaire through JotForm.
The questionnaire includes two quantitative questions that relate to applicants for an entry-level position in experiential graphic design. One question inquires how often applicants meet the position’s requirements, while the other asks about their educational background. The purpose of these questions is to identify if there are any consistent patterns across the EGD field that suggest a need for formal education. Additionally, participants are requested to submit a job description from their current employer for this role. Using qualitative questioning, participants are then asked to provide any skills, knowledge or personal attributes that may be necessary for the entry-level position, but not listed in the job description. Similarly, professionals are asked to discuss their expectations regarding the skills, knowledge, and/ or expertise they are looking for when reviewing an applicant’s portfolio.
51 2023 SEGD Communication + Place
The qualitative data is analyzed with the structural coding method (Saldana, 2015). In this case study, the structurally coded data is sorted using skills, knowledge, and personal attributes into the Designer’s Professional Identity (DPI) framework. The framework provides “a holistic understanding of the major elements that constitute DPI, associated with two overall sets of Personal Attributes (PA) and Design Skills (DS)” (Kunrath et al., 2020). After the data is sorted into the two sets of the DPI framework, each category is tallied and quantified. These quantities reveal the skills, knowledge, and personal attributes most desired for the entry-level experiential graphic designer role.
Findings
The findings from the collected data show that applicants sometimes meet the job description needs 70% of the time, while 10% rarely do and 20% very frequently do. This shows a need for more consistency in the skills and abilities of the applicants for an entry-level experiential graphic design position. The findings also show that almost 30% of applicants typically have a formal education in graphic design. Other disciplines, such as industrial design, interior architecture, fine arts, digital animation, and fabrication, also apply to this role. This data also suggests that skills and knowledge from all the specialties listed apply to the entry-level position, requiring the applicant to have an interdisciplinary mindset.
It was also found that 100% of participants agreed formal training is necessary for this entry-level position. Participants remarked that employers often invest 12-18 months in training entry-level designers because they are not taught in post-secondary design education. Instead, higher-level designers are often tasked with training entry-level designers, who unfortunately do not have the time to train these young designers.
The data collected about the skills, knowledge, or personal attributes needed are sorted into the Designer’s Professional Identity framework. The DPI framework provides a holistic understanding of the major elements that constitute a designer’s professional identity, divided into Design Skills and Personal Attributes. Design Skills are necessary to execute design work unrelated to the designer. These include cognitive, technical, and behavioral characteristics related to design practice. Personal Attributes are closely related to personality and
character. These elements are related to psychological characteristics such as values, emotions, feelings, attitudes, and behaviors, typically developing over time and can influence career development.
The analysis found that cognitive abilities were the most sought-after design skill. In comparison, the personal attribute entry-level experiential graphic designers primarily use is their social abilities. However, if we merge these frameworks, we start to think of the designer as a whole person.
Entry-level experiential graphic designers need both design skills and personal attribute sets to be successful in the EGD field. Interpretations from the data can be assessed holistically when both are combined.
These six groups make up the insights gathered from the combined data sets.
1) Design Capabilities: to understand an EGD problem and ideate a solution.
2) Communication Skills: to communicate their work and collaboratively work with others.
3) Expertise: the action and know-how to solve EGD problems.
4) Accountability: taking on a task and seeing it through to the finish.
5) Innovation: embracing one’s work with creativity and curiosity while managing one’s own time.
6) Integrity: the ability to identify with others’ emotions and self-awareness of one’s feelings and abilities.
Overall, design skills play a significant part in the needs of this position, but also personal attributes are needed. These insights emphasize the most desired qualities for an entry-level experiential graphic designer and the areas that must be developed before entering the field.
Triangulation
The triangulation occurs at the convergence of my observations of the EGD field, from my literature review, and through my user testing. My interpretation from the triangulation is (1) the term “experiential graphic design” does not fully capture the field’s multidisciplinary nature, and removing “graphic” from the name would be more
52
inclusive; (2) current applicants have multidisciplinary backgrounds and are not consistently meeting the requirements for an entry-level designer role; (3) the EGD industry thinks a post-secondary education would benefit the field; (4) entry-level designers must have design capabilities, communication skills, expertise, accountability, innovation, and integrity; (5) personal attributes are crucial for success in this field and should be developed along with the SEGD’s core competencies; and (6) mentoring is needed at an early stage of development to fill in the knowledge gaps and provide guidance.
Design
The proposal to address the gap in post-secondary education is to create a post-secondary certificate program for experiential design (EXD), the most pragmatic implementation option. “Experiential Design” is a broader term encompassing a range of disciplines, including environmental design, interior design, interactive design, and experiential graphic design. While “experiential graphic design” typically focuses on the visual and graphic components of a designed experience, “experiential design” includes a broader range of sensory and immersive experiences, such as spatial, interactive, and multimedia experiences. Therefore, using the term “experiential design” for the certificate program allows for a more diverse range of students with different program backgrounds and interests to participate and benefit from the program, as it emphasizes a broader scope of experiential design beyond just graphic design.
This program will be designed specifically for the Ullman School of Design within the College of Design, Architecture, Art, and Planning at the University of Cincinnati. The program will be open to students who have at least completed their second year of undergraduate studies and are interested in experiential design, interdisciplinary learning, and gaining real-world experience in the profession. The mission of this program is to provide students with a comprehensive and immersive education in the field of experiential design (EXD).
The program involves four components aimed at helping students develop their skills in the field of EXD. The first component, (1) SEGD’s Core Competencies, involves learning the essential knowledge and skills
required in the industry. The second component, (2) reflective practice, involves reflecting on one’s beliefs and values and documenting them in writing. The third component, (3) professional mentoring, involves building relationships with industry professionals to get feedback and guidance on navigating one’s interests in the field. The fourth component, (4) the DPI framework, aims to provide students with a holistic understanding of their professional development. These four components form the foundation of the program and guide the creation of its courses and learning objectives.
Interdisciplinary
The EXD certificate program is designed to incorporate a variety of subjects, including design history, visual communication, user experience, and environmental design, resulting in an interdisciplinary curriculum that enables students to explore different approaches to design and gain a comprehensive understanding of the field. The program also offers partnerships with industry professionals and organizations, providing students with exposure to a range of design disciplines and industries as well as the opportunity to work on real-world problems and network with professionals from diverse backgrounds. By adopting interdisciplinary approaches, students can develop a broader range of skills that are applicable across various disciplines, preparing them for diverse career paths and providing a more comprehensive understanding of the design industry.
Contemporary Design Challenges
The design program emphasizes several important aspects. Firstly, it teaches students how to understand user needs and behaviors, and how to create inclusive and accessible experiences. Secondly, the program provides real-world project opportunities through industry partnerships, exposing students to diverse design disciplines and industries. Thirdly, technology is integrated into the curriculum as a tool for solving design challenges, allowing students to create interactive and immersive experiences that respond to user needs. Finally, the program emphasizes sustainable design practices to address environmental challenges, teaching students to create socially responsible experiences. By incorporating these approaches, the program helps students develop a comprehensive understanding of the design industry, a broader range of skills, and the ability to tackle contemporary design challenges.
53 2023 SEGD Communication + Place
Diversity, Equity, & Inclusion
To enhance student engagement and collaboration, it’s important to implement strategies that cater to diverse learning styles and offer various forms of assessment. To promote diversity and inclusion, outreach efforts to underrepresented groups and scholarships aimed at supporting diversity are crucial. Partnering with organizations, community groups, and design firms that prioritize DEI can also provide students with practical experience in tackling real-world DEI issues. By integrating DEI into the EXD certificate program, students can gain the skills and knowledge needed to create more inclusive and equitable experiences and be better prepared to address DEI challenges in the design industry.
Experiential Design Courses, Learning Objectives, & Course Format
The EXD certificate program comprises a comprehensive curriculum consisting of three studio courses, two seminar courses, and an EXD co-op experience. The six courses are: (1) History and Survey of Experiential
Design, (2) Storytelling for Impact, (3) Arena Wayfinding Design, (4) Topics of EXD Practice, (5) Digital Production, and (6) an EXD Co-op Experience. Additionally, each course and learning objectives align with the six qualities identified in the research.
Limitations
There are two main limitations to consider. First, this study was conducted in a short time frame, which limited the sample size and data collection method to a questionnaire. As a result, all verticals of the EGD field are not represented in the sample size, which could alter the results of the Designers’ Professional Identity framework.
The second limitation is that the proposed certificate program was not tested in a post-secondary setting. The program’s success cannot be determined without testing the certificate program. These limitations provide opportunities for further research to be conducted.
COMBINED DPI FRAMEWORK TOTALS

54
Combined DPI Framework Totals
1
2
Implications
4
Meet with EXD Certificate Program Director to discuss DPI Progress
Using the Designer’s Professional Identity (DPI) framework in a post-secondary EXD certificate could enhance the alignment between a designer’s perception of their profession, their position in it, and the expectation of others (Kunrath et al., 2020). By modifying the structure of course syllabi, the DPI framework can be used to communicate to students how completing courses will prepare them for the profession. This can help to align education and professional practice, which is critical to professional development” (Kunrath et al., 2020).
Another implication of this research is for the program to be developed into an intensive and immersive education program for those interested in experiential design. This learning program type is an accelerated curriculum or a bootcamp-style business platform. These learning programs provide aggregated or bundled content into short, intensive, and rigorous curricula. This format is designed to take motivated individuals from a beginner level to a job-ready state within a shortened time frame of three months to a year.
Conclusion
Experiential graphic design is a professional design field that needs entry-level designers to have specific skills, knowledge, and personal attributes to succeed. However, entry-level applicants have multidisciplinary backgrounds and must gain the necessary qualifications. As a solution, professionals in the EGD field agree that a post-secondary EGD education would benefit the industry.
Experiential graphic design fits into post-secondary education as an interdisciplinary experiential design certificate program. Interdisciplinary programs are becoming increasingly common in post-secondary education, and a certificate program is a practical and recognizable credential. The program’s use of “experiential design” reflects a broader range of design fields beyond graphic design, making it accessible to students with diverse backgrounds and interests.
The proposed EXD certificate program would allow students to learn diverse skills that may not be available in a single-discipline program. The four components —
55 2023 SEGD Communication + Place
Program Journey Map Digital Production STUDIO ELECTIVE EXD Professional Practice CO-OP History and Survey of EXD SEMINAR Arena Wayfinding Design STUDIO Storytelling for Impact STUDIO Topics of EXD Practice SEMINAR CORE REQUIREMENTS
COURSES 3 1 3 2 1 3 1 3 1 3 2 1 3 1
EXD CERTIFICATE
EXD
Acceptance
Apply for the
Certificate Program
into the EXD Certificate Program
2
Certificate Completion
Reflection
EXD Courses
Meet with mentor Write End-of-Semester
Complete
EXD Courses
3 4 2 2 4 PROGRAM JOURNEY MAP 3 4 2 1 SEGD’S CORE COMPETENCIES EXD CORE COMPONENTS: REFLECTIVE PRACTICE PROFESSIONAL MENTORING DESIGNERS’ PROFESSIONAL IDENTITY
Meet with mentor Meet with EXD Program Director Sign up for
3
(1) SEGD’s Core Competencies, (2) reflective practice, (3) mentorship, and (4) the Designers’ Professional Identity (DPI) framework — are the foundation of the EXD certificate program and will prepare students for success in the entry-level experiential graphic designer position. Moreover, the program prioritizes educating students on contemporary design challenges and diversity, equity, and inclusion topics.
An EXD certificate program can educate students on this form of communication and relationships, interactions, and the interconnection of people, places, and artifacts. With a pipeline of well-trained entry-level designers, the EGD field can address contemporary design challenges and raise awareness of the industry’s value. Ultimately, entry-level designers can become catalysts for innovation and progress, driving the field into new and exciting territories.
Resources
Adams et al. “Being a Professional: Three Lenses Into Design Thinking, Acting, and Being.” Design Studies 32 (3): p. 255–291. 2011.
Calori, C., & Vanden-Eynden, D. Signage and Wayfinding Design: A Complete Guide to Creating Environmental Graphic Design Systems. Wiley, 2015.
Creswell & Plano Clarke. Research Design: Qualitative, Quantitative, and Mixed Methods Approaches. SAGE Publications, 2014.
Dall’Alba, G. “Learning Professional Ways of Being: Ambiguities of Becoming.” Educational Philosophy and Theory, p. 34–45. doi:10.1111/j.14695812.2008.00475.x. 2009.
Davis, M. Teaching Design: A Guide to Curriculum and Pedagogy for College Design Faculty and Teachers Who Use Design in Their Classrooms. Allworth, 2017.
Ebneyamini, S., & Moghadam, M. R. S. Toward Developing a Framework for Conducting Case Study Research. International Journal of Qualitative Methods, 17(1). DOI, 2018.
FITNYC. Exhibition and Experience Design. 2023. https://www.fitnyc.edu/academics/academic-divisions/ graduate-studies/exhibition-design/index.php
Gibson, D. The Wayfinding Handbook: Information Design for Public Places. Princeton Architectural Press, 2009.
Hanington, B., & Martin, B. Universal Methods of Design: 100 Ways to Research Complex Problems, Develop Innovative Ideas, and Design Effective Solutions Rockport Publishers, 2012.
Iowa State University. Master of Arts – Experiential Graphic Design (MAxGD): Iowa State University College of Design. 2023. https://www.design.iastate.edu/ graphic-design/degrees/graphic-design-ma/
Kunrath, K., et al. “Designers’ professional identity: Personal attributes and design skills.” Journal of Engineering Design, 31(6), p. 297–330, 2020. https://doi. org/10.1080/09544828.2020.1743244
Saldana, J. The Coding Manual for Qualitative Researchers. SAGE Publications, 2015.
SEGD. SEGD | About. 2023. https://segd.org/about
SEGD. SEGD | Core Competencies. 2023. https://segd. org/egd-core-competencies
SEGD. SEGD | Education. 2023. https://segd.org/ education
56
Sheridan College. Bachelor of Experiential Design. Sheridan College. 2023. https://www.sheridancollege.ca/ programs/backelor-experiential-design
Skorikov, V. B., & F. W. Vondracek. “Occupational Identity.” In Handbook of Identity Theory and Research, p. 693–714. 2011.
Trend Hunter. Trend Hunter Consumer Insights— Experience Megatrend. Trend Hunter. 2022. https://www. trendhunter.com/megatrend/experience
Visser P. S., et al. Survey research. In Handbook of research methods in social and personality psychology p. 223–252. Cambridge University Press, 2000.
Visser, W. Schön: “Design as a reflective practice. Collection,” p. 21-25, 2010.
Yazan, B. Three Approaches to Case Study Methods in Education: Yin, Merriam, and Stake. The Qualitative Report, 20(2), p. 134–152, 2015. https://doi. org/10.46743/2160-3715/2015.2102
57 2023 SEGD Communication + Place
Floral Design + AR/XR
A Trans-disciplinary Floral Design with Augmented/ Mixed Realities
Yeohyun Ahn, MFA, Assistant Professor of Graphic Design and Interaction Design, Graphic Design program, Art Department, University of Wisconsin, Madison, WI
Abstract
Floral art utilizes plant materials and flowers to create a visually appealing and eye-catching composition or display. The earliest known flower arrangement proceeds to ancient Egypt. Egyptians decorated with flowers as early as 2,500 BCE.1
The Gutenberg Bible in the 1450s is the earliest major book printed using mass-produced movable metal type in Europe. It adopted illustrated flowers to value the printed book’s high aesthetic and artistic quality. In the modern era, floral design professionally incorporates floral elements using line, form, space, texture, color, balance, proportion, rhythm, contrast, harmony, and unity.
Floral Design + CODE with AR/XR reinterprets traditional art and floral design into a generative floral system. It employs mathematical expressions, computer algorithms, sound, and video libraries. It is a new visual language integrating computational floral art, textile design, type, typography, interactive art, augmented reality, and digital fabrication with floral elements.
It allows the audience to experience immersive floral images using space, projection, and computer vision. This narrative conveys diversified visual messages inspired by nature, healing through arts, and exploring philosophical and religious interpretations regarding life, death, and love.
This visual research suggests a new trans-disciplinary graphic art integrating floral elements and computer vision with physical computing and immersive space.
1. “The Ancient History of Flower Arrangements.”, (2019), Chicago, IL. June 21, 2023, https://bouqs.com/blog/history-of-flowerarrangements
58
Introduction
The Bible is one of the most influential and best-selling books ever. It has greatly influenced literature and history in the Western world. The Gutenberg Bible in the 1450s is probably the most famous Bible in the world. It is the earliest major book printed using mass-produced movable metal type in Europe. It adopted illustrated flowers to value the printed book’s high aesthetic and artistic quality (Figure 1).
In the modern era, floral design incorporates floral elements using line, form, space, texture, color, balance, proportion, rhythm, contrast, harmony, and unit .
This research explores new floral design using creative coding, sound, augmented and mixed realities and suggests novel and immersive floral experiences.
Approach
Floral typography is the technique that combines typography, calligraphy, and lettering to create dynamic, “flourishing” design. 3 With the help of floral elements, It makes very tempting and vivid artworks in which the typography seems to be shaped by plants and flowers (Figure2). It enables to convey of visual messages in artistic ways. The visual styles of this research were inspired by Marian Bantjes’ typographic arts using natural floral materials. Love aesthetically delivers the meaning of love using floral elements (Figure 3).
Floral Design + AR/XR reinterprets traditional floral art into computational graphic art. It employs mathematical expressions, computer algorithms, sound, video, and computer vision libraries. It is a visual generative system integrating computational floral arrangements, textile, type, typography, sound interaction, and augmented and Mixed Realities with floral elements.

1.“Gutenberg Bible,” London, England, June 21, 2023, https://www.bl.uk/collection-items/gutenberg-bible
2. Johnson, James, “Principles of Design: A Course in Design Production”. Austin, Texas, 2014.
3. Akhter, Aquil, (2009), “67 Gorgeous Examples of Floral Typography.” Smashing Magazine, June 21, 2023, https://www.smashingmagazine. com/2009/05/gorgeous-examples-of-floral-typography
59 2023 SEGD Communication + Place
Figure1. The Gutenberg Bible, the Morgan Library & Museum, NYC, NY

This narrative conveys diversified visual messages inspired by healing through arts, and exploring philosophical and religious interpretations regarding life, death, and love. Conceptually it was inspired by Korean Contemporary Christian Music, 꽃들도, Even Flowers, in English. It is a part of the lyrics,
A fountain of life springs up here, When tears pass, Sooner or later it will bear fruit, The sound of laughter will overflow, The flowers, the clouds, the wind, the open sea, The sky opens on that day, Everyone will see, Finally the flowers bloom.
Initially, it was created for the solo exhibition, The Bible + CODE II. at Trinity International University in Deerfield, IL in 2019.
Augmented reality is an interactive experience that enhances the real world with computer-generated perceptual information. Using software, apps, and hardware such as AR glasses and web cameras, augmented reality overlays digital content onto real-life environments and objects. 4
Floral design + AR is an immersive floral experience as an argument reality (Figure 4). It used the Mirror of Video Libraries in Processing developed by Daniel Shiffman (Figure 4).
Mixed reality blends physical and digital worlds, unlocking natural and intuitive 3D human, computer, and environmental interactions.5 Floral Design + XR is a series of generative self-portraits using the profile image. It uses Face Detection of OpenCV Library in Processing. It automatically detects the facial area of any photos (Figure 7). It replaced the sample image to the profile images in the same code (Figure 8).
Implications
You are beautiful is a self-reflection from the author constantly suffering from lacking self-esteem. It is self-comfort using computer vision. It is implemented by Face Detection of OpenCV Library in Processing again (Figure 9). Frida Kahlo was a Mexican painter known for her many portraits, self-portraits, and works inspired by nature. Floral Selfie + Frida is a homage to her paintings (Figure 10).
“What is augmented reality (AR)?” SAP.com, June 21, 2023, https://www.sap.com/products/scm/industry-4-0/what-is-augmented-reality.html 5. Ibid.
60
Figure 2. Left: Valentines, 2005; Right: I WANT IT ALL, 2006, by Marian Bantjes
4.

“It is a visual generative system integrating computational graphic art, textile, typography, Sound Interaction, and augmented and Mixed Realities with floral elements.”
61 2023 SEGD Communication + Place
Figure3 Love, Seed font: Times New Roman; Geomerative Library by Ricard Marxer; Processing by Yeohyun Ahn, 2022


62
Figure 4. Floral Design + AR, 2023, by Yeohyun Ahn
Figure 5. Tutorial Code of Mirror from Video Libraries in Processing, by Daniel Shiffman
Hope is a feeling of expectation and desire for something to happen. HOPE expresses a positively growing floral object in adverse situations. It used Geomerative Library, and a seed font, Avenir Next Ultra Light, in Processing (Figure 11). HOPE + AR is another augmented reality with hope using the Mirror Library of Processing (Figure 12).
A Garden Where Hope is Growing is an immersive installation for the audience to interact with generative floral art in a blank and dark space. It is a co-creation with my 10-year child, Scarlett Jin. The small rectangular shape indicates where she plays. The scales of the flowers increase with the real-time sound frequency values. It suggested another mixed reality as a play with the interaction with the audience (Figure 13).
Conclusion
Floral Design + AR/XR suggests a new trans-disciplinary floral design integrating floral elements and computer vision with web cameras and physical computing. It delivers creative augmented and mixed realities using lower-level computation. This research contributes to experiential graphic design to move forward from software or app-oriented AR/XR developments to the creative freedom of AR/XR with coding directly. Ultimately it suggests the future gallery installation as a play with the audience interaction in an immersive space or environment.


63 2023 SEGD Communication + Place
Figure 6. Floral Illustration + XR, 2023, by Yeohyun Ahn
Figure 7. Tutorial Code of OpenCV Libraries in Processing
Figure 8. Floral Illustration + XR Development Process


64
Figure 9. You are Beautiful, 2023, by Yeohyun Ahn
Figure 10. Floral Selfie + Frida, 2023, by Yeohyun Ahn
Figure 13. A Garden Where Hope is Growing, gallery plan, 2023, by Yeohyun Ahn


65 2023 SEGD Communication + Place
Figure 12. HOPE + AR, 2023, Yeohyun Ahn
Figure 11. HOPE, 2022, by Yeohyun Ahn
Resources
“The Ancient History of Flower Arrangements.”, (2019), Chicago, IL. June 21, 2023, https://bouqs.com/blog/ history-of-flower-arrangements
“Gutenberg Bible.” London, England, June 21, 2023, https://www.bl.uk/collection-items/gutenberg-bible
Johnson, James, “Principles of Design: A Course in Design Production”. Austin, Texas, 2014.
Akhter, Aquil, (2009), “67 Gorgeous Examples of Floral Typography.” Smashing Magazine, June 21, 2023, https:// www.smashingmagazine.com/2009/05/gorgeousexamples-of-floral-typography
“What is augmented reality (AR)?” SAP.com, June 21, 2023, https://www.sap.com/products/scm/industry-4-0/ what-is-augmented-reality.html
“What is mixed reality?,” Microsoft.com, Seattle WA, June 21, 2023, https://learn.microsoft.com/en-us/windows/ mixed-reality/discover/mixed-reality
List of Images
Figure1, The Gutenberg Bible, the Morgan Library & Museum, NYC, NY
Figure 2, Left: Valentines, 2005, Right: I WANT IT ALL, 2006, Marian Bantjes.
Figure 3, Love, 2022, Seed font: Times New Roman, Geomerative Library by Ricard Marxer, Yeohyun Ahn,
Figure 4, Floral Design + AR, 2023, Yeohyun Ahn
Figure 5, Tutorial Code of Mirror from Video Libraries in Processing, Daniel Shiffman
Figure 6, Floral Illustration + XR, 2023, Yeohyun Ahn
Figure 7, Tutorial Code of OpenCV Libraries in Processing, Daniel Shiffman
Figure 8, Floral Illustration + XR Development Process, Yeohyun Ahn
Figure 9, You are Beautiful, 2023, Yeohyun Ahn
Figure 10, Floral Selfie + Frida Kahlo, 2023, Yeohyun Ahn
Figure 11, HOPE, 2022, Yeohyun Ahn
Figure 12, HOPE + AR, 2023, Yeohyun Ahn
Figure 13, A Garden where Hope is Growing, gallery plan, 2023, Yeohyun Ahn
66
67 2023 SEGD Communication + Place
Incorporating Augmented Reality (AR) into Placemaking
Brett Louis Snyder, Associate Professor, University of California Davis Principal, Cheng+Snyder
Abstract
Augmented reality (AR) is a tool that can allow designers to share complex stories about place. Often the history of place is told on site through historical plaques and is limited to text or image alone. AR has the ability to weave together text, image, and sound into a short movie format, taking advantage of visitors’ cell phones. This paper will describe the process of a recent advanced undergraduate studio that uses AR as a platform for telling stories about climate change in California. The class, titled “Graphitecture” looks at different ways that digital tools and mobile media are enriching our reading and understanding of place.
Climate change is often unseen, occurring over decades or more. Augmented reality, a platform available on most cell phones, offers ways to visually compress time and to present changes that might occur over centuries in just seconds. The class, which was piloted (incorporating AR) in 2022 and run a second time in 2023, has woven together a variety of processes: place-based research, architectural drawing methods, digital animation, and finally making augmented reality posters that show particular places in light of climate change.
Not all of the student projects from this studio focus on the negative impacts of climate change. On the contrary, student projects focus on a broad array of themes from the negative consequences of climate change (such as erosion along the California coast) to the positive ways that communities are addressing climate change (such as a utopian ecological living experiment in Berkeley, California).
The paper will present the strategies and outcomes from this class but will also talk more broadly about how incorporating AR can allow more nuanced place-based storytelling to be developed.
68
Introduction
Drought, wildfire, and floods. We need not imagine some distant abstract future as many of these disasters occur on a yearly – if not weekly basis throughout California (and in increasingly severe form) (Clynes, 2023). While we typically think of climate change related events occurring at a grand scale, they also have an impact on (and are impacted by) the places we inhabit every day. Our houses, our parks, and our places of gathering.
Though activities such as driving, flying, and eating are often linked to climate change – it’s more seldom that the dwellings we inhabit and the roles they play in relationship to climate change are considered. Looked at this way, how might we see dwelling as a protagonist or antagonist in this climate related struggle? A cabin at risk of wildfire due to drought. A house at risk of erosion combined with the risks of sea level rise. A public walkway that is estimated to be underwater in ten years time built over former marshland. While none of these risks would necessarily be apparent to a visitor, this studio course challenges students to document sites in ways that brings these critical issues to the forefront.
This background forms the conceptual framework for the recent studio, Graphitecture, taught at UC Davis in the Department of Design. The goal of the course was to create an augmented reality poster bringing architectural sites to life through the lens of climate change. The resulting collection of these posters (which have been exhibited to date both at UC Davis and at San Francisco Design Week) is titled: California Changing: An Augmented Reality Poster Collection
Background of Digital Placemaking
According to the organization Project for Public Spaces, the definition of placemaking can be described as follows:
“placemaking inspires people to collectively reimagine and reinvent public spaces as the heart of every community. Strengthening the connection between people and the places they share, placemaking refers to a collaborative process by which we can shape our public realm in order to maximize shared value. More than just promoting better urban design, placemaking facilitates creative patterns of use, paying particular attention to the physical, cultural, and social identities that define a place and support its ongoing evolution.” (Project for Public Spaces, 2007)
Placemaking, looked at this way is less a static definition of place, but one that invites participation as well as past, present, and future understandings of place. And the idea of digital placemaking combines this fluid understanding of place with digital tools that allow a dynamic process both in the construction and communication of these ideas. Along these lines, digital placemaking has undergone a renaissance over the last two decades as a range of tools have allowed designers to incorporate emerging technologies into the way ideas are combined and conveyed.
This has been analyzed by authors including the media scholar Lev Manovich in The Language of New Media Key to Manovich’s argument around new media, he states that it is “interactive. In contrast to old media where the order of presentation is fixed, the user can now interact with a media object.” (Manovich, 2001)
In the realm of digital placemaking that uses new media, there have been museums without walls (such as Michael Epstein’s Museum of the Hidden City ), podcasts that allow users to tour sites with an audio guide (such as Safari-7 by Janette Kim, Kate Orff, and Glen Cummings). And there have been popular games, like Pokemon Go that allow participants to simultaneously occupy the real world and a game space using augmented reality (AR). Many of these projects challenge static understanding of sites either by soliciting participation, gamifying space, or by revealing hidden elements that would otherwise be invisible on a site (such as information about its past).
In the example of Michael Epstein’s work, content is designed to be experienced as Epstein refers to it in a “heads-up media” fashion. In other words, the content is designed to encourage users to look both at their phones and at the world around them. The writer Benjamin Schneider succinctly describes Epstein’s work in the San Francisco Chronicle:
“The Museum of the Hidden City is a 75 minute academic and literary exploration of one of the darkest and most significant moments in San Francisco’s history. While there remain some lingering issues with the tech, and a few stops that may or may not stay open as public health rules change, this tour is an engaging, novel way to learn about the city, all while keeping your distance from others. And the stories it tells — about racism, affordable housing, and the evolution of neighborhoods — feel profoundly relevant.” (Schneider, 2020)
69 2023 SEGD Communication + Place
Safari-7, another example of mobile media placemaking, merges site specific podcasts that are curated to be experienced on the 7 train in New York. This project was brought to life by the architect Janette Kim, the graphic designer Glenn Cummings, and landscape architect Kate Orff through studios they taught at Columbia University and Barnard College. Content was developed over multiple design studios and in collaboration with various experts. This content was then deployed through multiple mediums including maps, podcasts, and exhibitions, which solicited visitors’ feedback. While trains are usually just a way to get from one place to another, Safari-7 takes advantage of public transportation as a moment to learn about and engage with the complex ecologies of place. Kim, Orff, and Cummings describe the project on the platform Urban Omnibus:
“The 7 Line is a physical, urban transect through New York City’s most diverse collection of human
ecosystems. Affectionately called the International Express, the 7 line runs from Manhattan’s dense core, under the East River, and through a dispersed mixture of residences and parklands, terminating in downtown Flushing, Queens, the nation’s most ethnically diverse county. Here, in territories excavated by Robert Moses’ transportation networks, watersheds constructed by the World’s Fair, and tree canopies stretched across residential street grids, species find systems necessary for survival, develop mating rituals and behaviors amidst inter-species competition and cooperation, and respond to migration, colonization, and disturbances of this dynamic urban landscape. By mapping the complexity, biodiversity, conflicts, and potentials of our urban ecosystems Safari-7 aims to unpack the role of architecture and the related disciplines in the construction of networks, spatial patterns, enclosures, grounds, rituals, and policies that are the city’s life support mechanism.” (Cummings, Kim, Orff, 2009)
“Drought, wildfire, and floods..these disasters occur on a yearly – if not weekly basis throughout California”

70
The orange hue apocalypse sky as seen over Oakland on September 9, 2020. Photo by the author.

This project is a core inspiration for the Graphitecture studio as it brings otherwise banal sites to life (in other words the spaces between train stations) through stories of the various species that have either historically or currently inhabit these areas. It is, on other words, a multi-species tour of the places that are neglected to highlight the critical importance urban infrastructure plays in supporting habitat.
In my own work (as someone that works at the intersection of media, architecture, and placemaking), in collaboration with my partner Irene Cheng we created one of the first projects in the space of mobile-mediamuseums designed to use the iPhone, Museum of the Phantom City (launched in 2009). The underlying idea of this project was to allow users to see visionary but unbuilt architecture on the project’s intended site. To this end, the app was designed to unlock projects for viewing only when users were on the intended site. It was designed as an iPhone app and after initial launch in New York, was subsequently made available in San Francisco and Chicago, two other cities that have had
many visionary, but unbuilt projects. One thing we learned through this project, was that while the original intention was to spur people to visit these physical sites (to be able to experience the difference between what is and what could have been), initial feedback suggested people also wanted to be able to access these visionary designs from anywhere.
To this end, one friction around placemaking and place understanding is the question of how much you can know a site without any one aspect of its complex nature. For example, can you know a place without visiting it? Or can you know it only through one specific culture’s understanding of it?
Another project, in my own work, that has been a precedent for California Changing is a collaboration with the landscape architect Claire Napawan and geographer Sheryl-Ann Simpson called #ourchangingclimate. This project asked participants to share evidence of climate
71 2023 SEGD Communication + Place
Final posters from the Graphitecture course. From left to right: 1. Brett Snyder (author/instructor), 2. Joel Kjellberg and Danae Navarrette, 3. Cesar Vargasaparicio, 4. Adam Overmeer and Langston Hay, 5. Nadya Verick and Elias Britton, 6. Sophie Martinez and Umang Ahluwalia
change in the places they inhabit everyday. The intention of this initiative was to change the imagery associated with climate change from polar bears and glaciers to images such as sidewalks, lawns, and daily food choices.
Many of the above projects were included in an exhibition at California College of the Arts, organized by Irene Cheng called Platforms: Augmented Histories of Space. As Cheng describes “Platforms explores an array of new digital tools for uncovering the history of buildings and cities. How might historians employ mobile, locative, and pervasive technologies to present their research in more immersive and engaged formats?” This same question has been central to the Graphitecture studio – which asks students to present compelling research using the affordances of augmented reality.
AR Placemaking Projects
One emerging technology that holds vast potential as a placemaking tool is augmented reality (AR). It allows users – either on a specific site, or when seeing an image representing a site, to see multiple layers in space, and allows the user to move around the images in space. As a medium, it allows multiple layers to be revealed over time and adds a layer of spatial interactivity to an image. Artists interested in creatively using this medium have begun to use AR in their own work and have been testing its spatial and temporal possibilities.
Some examples of site-specific augmented reality include Apple’s (AR)T Walk, which in 2019 hosted artists including Nick Cave, Cao Fei, John Giorno and others to produce geo-located artwork in several cities (including San Francisco). These projects created playful sitespecific installations. Though the pieces didn’t specifically address site history, they did engage with the technology and encourage participants to interact with the city in a new way. Each artist had a site, located within walking distance of the Apple Store, and on that site works ranged from spinning geometric forms, to poetic elements that visitors had to find in a scavenger-hunt like way. Perhaps the most surprising aspect of these works was the way in which artists were able to play with scale (without normal regards that artists would be forced to reconcile with budget). For example, some pieces went super-scale – allowing visitors to see King-Kong-like creatures dancing atop buildings as well as super-small hiding treasure like gems within the trunks of trees.
Collectively, these works incorporate AR in a range of innovative ways, though they lean more towards playing with and gamifying space than addressing the complex histories, layers, and understandings of space that are generally associated with placemaking.
To that end, this last set of precedents for this course are projects that fall into the category of what I’d call “augmented placemaking.” In other words, projects that use AR to heighten an individuals’ understanding of place. One artist who has explored this is Tamiko Thiel who has explored speculative futures through AR in several projects. Two that we, as a class, looked at more in depth include Gardens of the Anthropocene (2016) and Unexpected Growth (2018).
In each of these projects, Thiel imagined futures through the lens of climate change and heightened viewers awareness of the precarious nature of place. In the case of The Gardens of the Anthropocene, Theil describes the project as it:
“posits a science fiction future in which native aquatic and terrestrial plants have mutated to cope with the increasing unpredictable and erratic climate swings. The plants in the installation are all derived from actual native plants in and around the Olympic Sculpture Park that are tolerant respectively to drought on land or to warming sea waters, and are therefore expected to adapt to the increasing temperatures to come.
Beyond this actual scientific basis, however, the artwork takes artistic license to imagine a surreal, dystopian scenario in which plants are “mutating” to breach natural boundaries: from photosynthesis of visible light to feeding off of mobile devices’ electromagnetic radiation, from extracting nutrients from soil to feeding off man-made structures, and to transgressing boundaries between underwater and dry land, between reactive flora and active fauna.” (Thiel, 2016)
Collectively these projects set a strong foundation of work being produced by artists and designers to inspire students and what they might produce in the Graphitecture: California Changing studio. Next, I’ll provide an overview of the course and how it was taught.
72


73 2023 SEGD Communication + Place
Safari – 7 Map, Glenn Cummings, Janette Kim, and Kate Orff
Museum of the Phantom City, Irene Cheng+Brett Snyder
Overview of the Graphitecture: California Changing Design Studio Course
Over the past two years, I have dedicated a specific course I teach, Graphitecture, in the UC Davis Department of Design, to use augmented reality as a tool for placemaking. The project is taught through a series of inter-related phases:
1) Handshake Project (1 week)
2) Case Studies of Digital Placemaking (1 week)
3) Site Research (1 week)
4) Architectural Drawing (2 weeks)
5) Information Animation (3 weeks)
6) Exporting to AR and testing (2 weeks)
Summaries of each of these phases are as follows:
Handshake Project
This is intended as a broad introduction to the creation of effective information graphics. We looked at sources from seminal information visualization books by Edward Tufte as well as several contemporary examples of data visualizations. These examples were followed by a short challenge in which students had to document time relative to something they could observe on a daily basis. As background reading, we used a short segment from Saving Time: Discovering a Life Beyond the Clock, by Jenny Odell. In Saving Time, Odell asks,
“What happens when nothing happens…it’s never true that nothing happens. Weather, people, cars, and clouds are all things that move. Even if you were to stand on a vast concrete plaza, in the middle of the desert, you would be surrounded by the swirling of air particles, the movement of the sun overhead, a drifting tectonic plate, and the aging of the mind and body you use to perceive these things.” (Odell, 2023)
Outcomes from this phase included novel attempts at documenting everyday occurrences in surprising ways that conveyed a time component.
Case Studies of Digital Placemaking
The next phase asks students to look at many of the digital placemaking projects described earlier in this paper to understand how design projects use media to creatively engage with the unique qualities of site. Many of these case studies have used information graphics and text to enhance users’ understanding of a specific site. Even projects that use sound (such as podcasts) as a main medium, are enhanced with powerful graphics that create a sophisticated, but comprehensible and digestible user experience (such as Safari-7, which has maps and graphics that accompany the podcast). Students present this research in case studies analyzing the projects to uncover what they understand the designers process to be.
Site Research
The third phase asks students to do specific site research related to sites. I’ve created a growing list of these sites over the past couple years, with assistance from colleagues (including Simon Sadler, UC Davis; Albert Narath, UC Santa Cruz; and David Gissen, Parsons). I chose sites for the students to study that had a relationship to climate change either because of rising sea levels, drought, increasing frequency of severe fire, or disappearing habitat – or on the positive side, because the architecture had been designed in such a way as to consider climate change in a proactive way. For example, the first locally mandated solar panels, or a utopian experimental green building. The challenge, as Lynn Ingram describes in The West Without Water is that much of climate change is visually diffuse. She describes:
“Droughts lack the visual and visceral images of other natural disasters; instead, they creep up on the landscape with no clear beginning or end” (Ingram, 2013)
Some highlights of sites that I’ve included are:
• Apartment buildings in Pacifica that face the triple threat of drought, erosion, and sea level rise
• A building in Mission Bay, a part of San Francisco built over former marshland (which also represents the loss of about 90% of marshland throughout the greater San Francisco Bay)
74

75 2023 SEGD Communication + Place
(AR)T Walk, 2019, Photo by the author
• The first building in California (in Lancaster) that was required by local code to include solar panels
• The integral Urban House in Berkeley California that was in experiment in ecological urban living
Collectively these sites represent a range of issues related to climate change from it’s most devastating impacts to novel ways that architects are considering methods to address our carbon footprint.
Drawing
The history of architectural drawing is rich with attempts to convey information beyond simply the dimensional qualities of architecture. We begin the drawing phase by looking at precedents of drawings that in their time offered novel ways of documenting space. Highlights from these examples include Giambattista Nolli’s Map of Rome, which just using poche was able to show the continuity of public space between streets and interiors in the 1700s; Zaha Hadid’s urban drawings that merges plan and section; and recent examples such as Lewis Tsurumaki Lewis and Atelier Bow Wow (both work with sectional perspective).
These most recent examples show how section and axonometric have the ability to convey information with space in a method that is visually understandable not just to architects but to a more general public. These techniques allow students to draw in layers that at a fundamental level look like the site they are examining, but hold the potential to easily layer information over it that can convey additional messages at different scales. Students were encouraged to create “plates of information” that could be used to make their drawings into exploded axonometrics – that could in the animation phase be exploded and put back together in a seamless manner.
Students drawings were produced in Rhino (a 3d drafting program commonly used by architects) which allowed them to export 3-dimensional drawings as axonometric style drawings that could be further edited in Adobe Illustrator. The challenge for students, was to add conceptual layers to their drawings built on their research. For example, a group looking at sea level rise, might include lines at the predicted height of water in 10, 20, or 50 years time.
Or they might include where an existing marshland used to be. Or, as one group did, they might a add detail to a portion of the drawing, that could be blown up in animation to show how it works.
Animation
Just as the drawing phase began with an overview of architects’ techniques of representation, we began the animation phase with an overview of motion graphics, specifically related to conveying information graphics so it would be most relevant to students’ work. Examples included many animations from the canon of film title design such as the work of Saul Bass (in the 1960s), Kyle Cooper (in the 1990s), and many contemporary film titles. Because film title designers are often approaching animation from a graphic design standpoint, they are trying to use typography and images often to tell an abbreviated version of a movie through the film credits.
This led to students testing out their own animations, first in short studies, then in longer segments. The nature of AR is that short videos of 30-60 seconds helps give the animations a brevity and clarity that allows students to convey the most important aspects of their site research. To create their videos, students learned Adobe After Effects, a robust video editing software that allows students to import their drawings from Adobe Illustrator as well as to incorporate other elements including video.
Exporting to AR and testing
The final phase is surprisingly the least technically challenging one as the software to translate images and videos into AR is fairly intuitive and easy to revise. For this course, we used the app called Artivive which has been designed with artists in mind.
Students begin by uploading an image of their poster to the Artivive website, and then they load their animations, which can be loaded either as a single animation or as several animations, each that can be located on a unique plane in space, relative to the poster they will be seen with. Effects range from animating issues like sea level rise, having people occupy the site in different ways, or showing different species as they might occupy the site in the past and/or future.
76

77 2023 SEGD Communication + Place
Graphitecture: California Changing, Exhibited at UC Davis, 2023, Photo by the author
Outcomes and Conclusion
The final works presented in the class look like posters depicting architectural sites with elements that suggest the students’ reading of the site. Like a movie poster, they hint at a narrative, without giving away too much. For the AR component to be experienced, one uses the Artivive App and looks at the poster through their phone. This activates the AR component and animates the poster through the viewers’ phone. Examples of student projects show what the site used to look like a hundred years ago (for example, how marshland preceded industrial infrastructure), what the wildfire risk is like (for example, in Yosemite Valley), or how sea level rise is threatening the very existence of luxury homes (for example, on Blaire Island) and it might look like in 50 years time.

The main learning outcome for students is to be able to tell a compelling story in a legible manner using an emerging technology. What goes into it: researching a site, developing clear drawing methods, and creating a visual narrative. Taken together, these aspects challenge students to come up with a narrative that sparks viewers curiosity and holds their attention with details.
A couple of the most rewarding aspects of the class are seeing students joy when they see their ability to make sophisticated augmented reality experiences come to life. Equally rewarding, is seeing the cumulative work now built over almost 30 projects that is beginning to shape new narratives about climate change in California. Having the chance to share this work at SF Design

Along Mission Creek San Francisco, sea levels rise could increase by up to 1 foot by 2050 and 3.5 feet by 2100 according to the Ocean Protection Council. 90% of Bay Area marshland has been lost over the past 20 years, which was in some ways the first line of defense against rising sea levels. The houseboats in Mission Creek can serve as a model to alternative housing as it adapts to the water levels day in and out.
78
Mission Creek Houseboat Poster Study by Ana Panaligan and Ashley Preciado

Week was also satisfying, seeing hundreds of visitors experience the work and engage with it. As I personally hosted the exhibition for the day long event, I was able to witness many visitors that took the time to watch and interact with each poster. Given that museum viewers often glance over material, it was a pleasant surprise to see how the built-in interactivity encouraged users to engage so closely with the work.
On the flip side, there are also many lessons learned in teaching the class. Though most collaborations between students were fruitful, it was clear that many students divided up the work in ways that they didn’t necessarily do each of the steps individually – but one student would focus on drawing and another on animation. In future iterations of the class, I’d like to find ways to encourage each student to work on every aspect that could help make the work even more sophisticated.
As these technologies become more widespread, I could imagine a future when participants may not need to access a special app (such as Artivive) – but just by using their phone’s camera, would be able to access the AR material.
The challenge for educators as I see it, is to hold an equal footing in the research component that asks designers timeless questions, such as how do you understand a site, and how do you make a legible drawing -- while at the same time offering support and guidance into emerging technologies that help make the work relevant and exciting to both a design audience and a broader public. Embracing emerging technologies has the potential to pique the public’s interest and with topical material, affect a broader and more meaningful conversation.
79 2023 SEGD Communication + Place

“The main learning outcome for students is to be able to tell a compelling story in a legible manner using an emerging technology.”
80
California Changing at San Francisco Design Week, June 6, 2023, Photo by the author
Resources
Clynes, Tom. (2023, January 23) What has California’s flooding (and drought) got to do with climate change? https://www.edf.org/article/what-has-californiasflooding-and-drought-got-do-climate-change
Manovich, Lev. (2001) The Language of New Media: MIT Press, p 49.
Schneider, Benjamin. (2020) “Fillmore Redevelopment Recounted in Open Air ‘Museum’” SF Weekly https:// www.sfweekly.com/archives/fillmore-redevelopmentrecounted-in-open-air-museum/article_8569e06d-144752f7-8329-e7fcd6a06c69.html
Project for Public Spaces. (2007) What Is Placemaking? https://www.pps.org/article/what-is-placemaking
Cummings, Glen; Kim, Janette; and Orff, Kate. (2009, May 20) Safari-7, Urban Omnibus https://urbanomnibus.net/2009/05/safari-7
Cheng, Irene (2016) Platforms: Augmented Histories of Space https://htx.cca.edu/index.php/portfolio/platformsaugmented-histories-of-space/
Odell, Jenny. (2023) Saving Time: Discovering a Life Beyond the Clock, Random House, p 133.
Ingram, B. Lynn. (2013) The West Without Water: What Past Floods, Droughts, and Other Climatic Clues Tell us About Tomorrow : University of California Press, p 20.
81 2023 SEGD Communication + Place
Metacognitions in the Metaverse Modeling design approaches to enable climate education through experiences
Hansa Hatrote, MA Exhibition and Experience Design, Experiential Designer
Abstract
The devastating environmental impacts of current and emerging technologies demand a deeper look into how humans conceptualize complex environmental crises. Since human nature thrives on curiosity, discovery, and innovation, limiting ourselves to our needs and curbing our want for newer advancements has never been a solution. The solution is behavioral change– instilling environmentally conscious thinking as we progress to newer heights of human achievement.
Exploring the strategies of metacognition– the process of thinking about one’s own thinking and learning– and studying the human mind helps us understand how we recognize climate change. Behavioral change is the most significant impediment to solving climate change. Behavior is driven by our cognition, and metacognitive strategies help us understand how we conceptualize complex climate crises. Human behavioral barriers to climate change can be overcome by research and implementation of new learning styles and experiences. As climate education becomes more crucial, finding new effective ways to educate and inculcate climate-conscious behavior is vital. With the rise of metaverse technologies, various studies in the field of education prove the effectiveness of virtual reality– a simulated 3D environment that enables users to explore and interact with virtual surroundings. Metaverse technologies including augmented reality, virtual reality, and artificial intelligence present the opportunity to model climate-conscious behaviors while blurring the line between physical and extended reality experiences. This study will examine how these technologies can be integrated into physical experiences to educate visitors in a non-traditional informal learning experience. This study will then explore how these strategies can be adapted and applied to an exhibition environment to increase climate awareness, inculcate climate-conscious behavior, and pave the path to a greener future.
82
Introduction
The current climate crisis urges us to find sustainable solutions. Environmental sustainability is finding a harmonious balance between our needs and replenishing used resources. Since human nature thrives on curiosity, discovery, and innovation, limiting ourselves to our needs and curbing our want for newer advancements has never been a solution. The solution is behavioral change– instilling environmentally conscious thinking as we progress to newer heights of human achievement.
The latest and most talked about advancement is the Metaverse, a three-dimensional iteration of the Internet as we know it. A virtual reality where you can eat, work, study, shop, and socialize as you would in your current reality, only with no real-world boundaries. As we are on the brink of unfolding this new medium, the Metaverse is currently at its inception stage and if we do not plan carefully, we may wind up with vast online footprints that create a huge demand for data storage, more products, and more waste. Making climate change a priority as we build the Metaverse will most certainly lay a greener foundation for the future.
Studying the theory of metacognition– the process of thinking about one’s own thinking and learning– is significant because our ideas about our thoughts have a significant impact on the formation of attitudes and subsequent behaviors. Integrating metacognitive strategies in experience design can foster change in individuals’ environmentally detrimental behavior. Furthermore, it can help us design climate educational experiences in non-traditional informal learning environments.
Current and developing technologies are certainly part of the climate crisis but are also tools we can harness in finding and implementing sustainable solutions. Metaverse technologies including augmented reality, virtual reality, and artificial intelligence present the opportunity to model climate-conscious behaviors while blurring the line between physical and extended reality experiences. These when integrated into designed shared environments harnessing metacognitive strategies become very important tools in instilling sustainable values in the generation that builds the future.
Approach
This paper is organized into two sections. The first section explores the strategies of metacognition– the process of thinking about one’s own thinking and learning– and how the study of the human mind helps us understand how we conceptualize climate change. This study will examine how Metaverse technologies can be integrated into physical experiences to educate visitors in a non-traditional informal learning experience. This study will then explore how these strategies can be adapted and applied to an exhibition environment to increase climate awareness, inculcate climate-conscious behavior and pave the path to a greener future.
The second section describes a proposed project that applies the strategies of metacognition and metaverse technologies explored in my thesis to the design of an innovative experience. Additional research of the target audience as well as the selection of a proposed subject, venue, and client allows for a deeper investigation of the proposed thesis. The proposed project showcases the use of technology for climate education while utilizing non-traditional educational experiences.
Through this thesis and proposed project, this paper identifies a design methodology for spatial designers to develop climate educational experiences that merge physical and digital realities.
Metacognitive Strategies for Experiential Design
Understanding metacognition may be a key way of helping people reconsider their behaviors impacting the environment, further exploring the relationship between metacognition and visitors’ understanding of concepts like climate change and aid in designing educational experiences.
In both formal and informal learning settings, several ways for fostering metacognition have been created. According to a review of the literature, there are seven techniques for enhancing metacognition, as represented in Image 2.
83 2023 SEGD Communication + Place

Immersive Experiences and Climate Change Education
“Immersive experiences can help overcome human barriers to climate action.”
The most significant impediment to combating climate change is behavioral, not technological. According to a research study of two billion social media posts, we will soon normalize climate circumstances that were previously considered exceptional. According to the study, people’s perceptions of regular weather are based on events from the last two to eight years.
Fortunately, the immersive experiences that will be a fundamental component of the Metaverse have the potential to tap into other aspects of our brain in order to build new climate consciousness and prompt action. “As with any form of immersive technology, the Metaverse is likely to offer a range of promises the physical world can’t,” says David Markowitz, co-author of “Virtual Reality and the Psychology of Climate Change.”
Immersive experiences produce better learning outcomes, more personalized (local) influence, and greater emotional engagement (empathy) with the
issue, according to several virtual reality experiments concentrating on climate and other sustainability challenges. According to Markowitz, gamification is another critical component of the evolving Metaverse, which might operate in tandem with immersive experiences to encourage long-term behavior. The future of content marketing is immersive media. It can be used to generate material that is interesting, interactive, and immersive. New technologies such as virtual reality, augmented reality, 360-degree videos, and others have made it easier for anyone to create a tailored experience for their audience.
Testing and Verification
A full-scale prototype was conducted in an exhibition environment to test various interaction methods and gauge visitors’ understanding and learning of climate concepts. The prototype, called Climate Clock, aimed to make visitors understand the concept of the climate clock and present questions and challenges to solve within a set timeframe. The questionnaire format was used, with physical movements as response collection. Three participants were tested and their behaviors observed. Feedback was collected from all observing participants.
84
IMAGE 1: Visual of participant in prototype testing, using WWF Free Rivers AR application to test metacognition through various learning methods


85 2023 SEGD Communication + Place
IMAGE 2: Integrating Metacognitive Strategies with Metaverse Technologies to Design Climate Positive Experiences. As presented at 2023 SEGD Academic Summit.
IMAGE 3: Visual of participant in prototype testing, using designed experiences with climate action outcomes to test integration of Metaverse technologies and behavioral outcomes.
INTRO EXPERIENCE

A kaleidoscopic circular immersive room invites and briefs you into the experience.
UPLOAD YOUR REALITY


Wall murals and BAs help set up your profile and connecting the RFID wristband.
CAUSE & EFFECT

An interactive screen that forecasts the future of your city based on your choices.
MOVE TO ZERO

An interactive screen highlighting water concerns. A pledge table asking you to invite people to pledge together.
A wall of NIKE boxes light and unbox them. Inside are learn and digital takeaways.

An interactive game wall to answer climate questions interactive.
86
UNBOX EXPERIENCE CLIMATE
EXPERIENCE

light up, inviting you to open are discounts, terms to takeaways.
PIXEL JUMP

An interactive game wall that is motion controlled with jump pads.
MATERIALS LAB
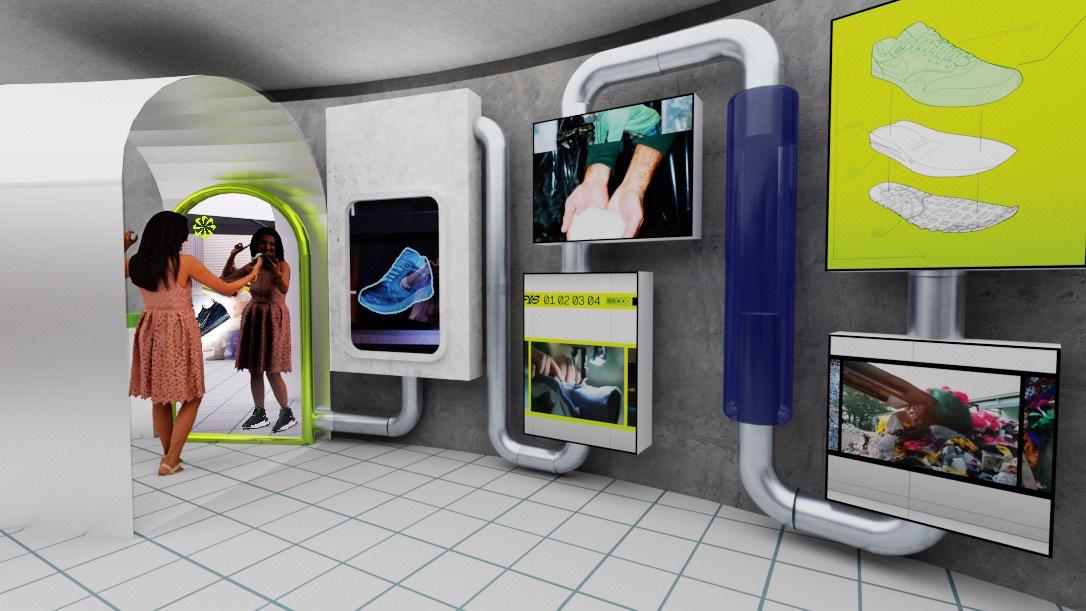
An interactive screen to design your own NIKE shoes with an AR try-on mirror to try and collect your digital creation.
ON THE CLOUD


that challenges you questions using the game
A giant cloud dimmed, an interactive screen with prompts that calculate your carbon footprint.
BLOOM OVER DOOM

An immersive experience where you face the consequences of your choices throughout the experience.
87 2023 SEGD Communication + Place
CLIMATE CLOCK

“If the biggest barrier to addressing climate change is behavioral, immersive experiences can amplify emotional engagement and drive meaningful action.”

The prototype successfully compared various interactive answer collection styles and received positive feedback. The prototype supports the thesis that incorporating metaverse technologies and interactive design in climate education can increase knowledge, perception, and certainty of climate change among users.
Interview
Ritesh Lala, a creative technologist specializing in the fusion of art, science, and engineering, discussed the connection between sustainability and the metaverse. He emphasized the importance of creating meaningful and immersive experiences for people, emphasizing the potential of metaverse technologies in pushing the boundaries of physical reality and offering unique and enhanced experiences. The integration of virtual reality (VR) and augmented reality (AR) in designed spaces can help visitors adapt to different physical environments, eliciting a wide range of emotions and thoughts. VR fosters empathy with other creatures and provides novel experiences of time and space, while AR enhances our understanding of the present moment and enriches interactions with the physical world.
Ritesh also emphasized the importance of accommodating different learning styles in designed spaces, highlighting the power of extended reality (XR) applications like VR and AR. Different form factors, like mobile apps or desktop web pages, offer diverse ways of presenting information, enhancing the learning experience for individuals. However, there is ongoing debate about the justification of using metaverse technologies, with uneven access and potential to widen socio-economic divides. Carbon-offsetting is a common practice to justify resource usage, but Ritesh cautions that it should only be considered as a secondary solution after exhausting other means of minimizing emissions.
Applied Project
ENDGAME: Race against the Climate Clock is a physical exhibition designed for Nike’s Move to Zero initiative; the exhibition is held at the Gansevoort Plaza in New York City, a popular space for branded experiences. The exhibition is a climate education experience with the goal to inform and inspire visitors to adopt more sustainable behaviors. This exhibit has been designed to be a gamified experience, which not only integrates the client– Nike’s brand personality but also takes an educational experience and makes it easy to understand
while adding a layer of fun which is vital in reaching the audiences targeted.
Metacognition is a valuable tool in understanding how people conceptualize complex environmental concepts while also nudging visitors to explore their cognition in the context of climate change. The experience is designed to integrate various metacognitive strategies such as question asking, meeting challenges, and interactivity, which helps visitors to think about their own thinking which then leads to behavioral change The experience is also highly personalized for each visitor as they choose an avatar and username, which then follows through the entire exhibit. Visitors explore the space to learn about sustainability in various contexts, from understanding basic concepts to learning about Nike’s sustainability initiative and then leading to technology’s impact on climate change.
This branded experience explores how to integrate metaverse technologies not only for retail marketing as Nike is already doing, but also to fulfill the brand philosophy of pushing boundaries of sustainable innovation. Metaverse technologies such as artificial intelligence, augmented reality, NFTs, and more provide newer mediums to integrate into experiential learning, with proven effectiveness as compared to other learning methods.
Conclusion
Through the first case study, I came across the seven strategies of fostering metacognition. Namely, questionasking, mental modeling, comparing ideas, solving real-world problems, and three strategies that are used in informal learning environments: interactivity, assuming roles, and meeting challenges. This case study also confirmed that fostering metacognition through one of these strategies, in this case, “question asking”, may be a key way of helping people reconsider their behaviors impacting the environment, especially in an experiential learning environment.
As part of the initial goal, understanding the new age Metaverse as a medium and how to use it as a canvas for learning was vital. The second case study explores the use of virtual reality experiences as an effective mode of learning. The case study proves that virtual reality technologies improve knowledge retention about ecological concepts and are an innovative alternative to standard lesson plans.
90
Through prototyping, I discovered that people are attracted to new methods of learning. Using a mixedreality experience can make a topic like environmental sustainability immersive, fun, and interactive. This could potentially lead to behavioral change. There is a scope to explore what ‘phygital’ experiences bring to learning and how they can be incorporated to instigate environmentally conscious behavior.
Resources
Arcanjo, Marcus. “Individuals and Climate Change: Facilitating Behavior Change for Societal Transformation,” n.d. https://climate.org/individualsand-climate-change-facilitating-behavior-change-forsocietal-transformation/
Duwan, Emily, Francis Choi, and Brian Helmuth. “Assessing The Use of Virtual Reality Technology in Teaching Marine Ecological Concepts.” Journal of STEM Outreach 2, no. 1 (August 19, 2019): 1–11. https://doi. org/10.15695/jstem/v2i1.14
Gutwill, Joshua P., and Toni Dancstep (née Dancu). “Boosting Metacognition in Science Museums: Simple Exhibit Label Designs to Enhance Learning.” Visitor Studies 20, no. 1 (January 2017): 72–88. https://doi.org/1 0.1080/10645578.2017.1297132
Haus von Eden. “Is the Metaverse bad for the environment?,” February 17, 2022. https://www. hausvoneden.com/technology/metaverse-environmentsustainable/
Jamie K. Pringle, Ian G. Stimpson, Adam J. Jeffery, Kristopher D. Wisniewski, Timothy Grossey, Luke Hobson, Vivienne Heaton, Vladimir Zholobenko, Steven L. Rogers. “Extended Reality (XR) Virtual Practical and Educational EGaming to Provide Effective Immersive Environments for Learning and Teaching in Forensic Science,” n.d.
Ma, Joyce. “Listening for Self-Reflective Talk in Visitors’ Conversations: A Case Study of the Exploratorium’s Mind Collection.” Visitor Studies 15, no. 2 (July 1, 2012): 136–56. https://doi.org/10.1080/10645578.2012.715001
“Making the Metaverse Accessible and Inclusive By.” Accessed May 29, 2022. https://media.monks.com/ articles/making-metaverse-accessible-and-inclusivedesign
“Metaverse: Could Creating a Virtual World Build a More Sustainable One?,” EY.Com. Accessed May 29, 2022. https://www.ey.com/en_us/digital/metaverse-couldcreating-a-virtual-world-build-a-more-sustainable-one
Sortlist Blog. “Metaverse For Business (2022 State of the Metaverse Study),” March 22, 2022. https://www.sortlist. com/blog/metaverse-for-business/
Scannell, Leila, and Frederick M.E. Grouzet. “The Metacognitions of Climate Change.” New Ideas in Psychology 28, no. 1 (April 2010): 94–103. https://doi. org/10.1016/j.newideapsych.2009.09.020
VentureBeat. “Sustainability and the Metaverse: 5 Considerations for Preparing for the next Big Tech Paradigm Shift,” April 3, 2022. https://venturebeat. com/2022/04/03/sustainability-and-the-metaverse5-considerations-for-preparing-for-the-next-big-techparadigm-shift/
“Why The Metaverse Is Marketing’s Next Big Thing.” Accessed May 29, 2022. https://www.forbes.com/ sites/forbesbusinessdevelopmentcouncil/2021/12/21/ why-the-metaverse-is-marketings-next-bigthing/?sh=210e741425f0
Williams, Sean. “The Single Biggest Question That’ll Determine the Future of the $30 Trillion Metaverse.” The Motley Fool, December 14, 2021. https://www.fool.com/ investing/2021/12/14/question-determine-future-of-30trillion-metaverse/
91 2023 SEGD Communication + Place
The Design Charrette Lessons Learned in Seeking Methods to Accelerate Student Learning
Terry Londy, Assistant Professor, Florida State University
Steven B. Webber, Associate Professor, Florida State University
Abstract
Students in design disciplines learn within a higher education system that is simultaneously divided horizontally based upon discipline and vertically based upon expertise (first- through fourth-year and graduate levels). These divisions provide benefits for the higher education system, allowing faculty to specialize in specific fields taught toward an audience of a certain expertise level, but it does not parallel professional practice. This reality becomes apparent to students when they graduate from college and enter design practice to discover that they will collaborate across disciplinary boundaries with allied design disciplines, engineering, fabrication, and construction fields. In addition, mentorship relationships develop within design disciplines to facilitate professional development of new practitioners as they seek to advance their careers quickly. Educators are seeking ways to bridge this gap between higher education and professional practice using an annual competitive student design charrette in the interior design program at Florida State University. The charrette has just completed its tenth year, and many lessons have been learned during this time. This article will present the challenges and successes encountered with cross-disciplinary and cross-expertise collaboration, the types of design scenarios employed each year, the rationale behind team formation, and the desired direction for improvement with future charrettes in the program. To celebrate the students, their design work, and the growth of the charrette in the FSU interior design program, a gallery exhibition was designed and executed at the conclusion of the most recent charrette and this gallery exhibition is also presented in this article.
92
Higher Education and Design Practice: Systemic Structural Differences
Educators across design-related fields, and many other disciplines, continually seek ways to improve the education of their students to prepare them for an evolving practice environment. Accreditation bodies provide third-party oversight as they offer guidance to educators, accountability for education systems, and a means for families and students to find appropriate education programs where they will spend significant resources and time in professional preparation. Over time, the complexity of higher education has increased to meet the needs of professional preparation. This has resulted in a thick bureaucracy - the typical university is comprised of colleges, colleges of schools and departments, and these of individual degree programs. It is no wonder that images of silos are used to describe the lack of interdisciplinary interaction among students of varying disciplines (Buchbinder, 2005). In addition, vertical divisions divide student cohorts from one another based upon expertise level (first-year students through senior and graduate level students). This matrix of division, simultaneously by discipline and expertise level, has its benefits within higher education, but it comes at a cost paid by the students when they enter design practice.
The realities of design practice stand in stark contrast to this higher education model. Design practitioners collaborate regularly and frequently with consultants from various disciplines including engineering, fabrication, and construction. Design practice crosses expertise boundaries by engaging newly minted graduates in mentorship relationships. Within interior design, the mentorship process is reinforced by the Council for Interior Design Qualifications work experience requirements that act as a gateway to take the CIDQ exam (NCIDQ, n.d.). As it relates to accreditation guidelines, agencies such as the Council for Interior Design Accreditation (CIDA) place significant emphasis on preparing students to collaborate across disciplines and to engage in team-based projects (CIDA, 2020). While CIDA does not require it, educators can choose to perforate the expertise boundaries that have been established between students to accelerate student learning.
As educators work to address the practical needs of professional preparation and accreditation standards, they are faced with finding the best methods to do so. Educators consider the interests of their students, weighed in context with what is needed to thoroughly prepare them for their professional endeavors. In this case, student interests and their professional preparation needs align – students place a high value on collaborative learning experiences with diverse disciplines (Walker, 2007). Educators have articulated the challenges presented by interdisciplinary collaboration, but the benefits are worth the additional work required on the part of the instructional team (Neuman, Perrone, & Mossa, 2022).
Design Charrette: Perforating Higher Education Structural Barriers
A competitive design charrette has been an annual effort within the undergraduate interior design program at Florida State University for ten years. The goals have evolved over this time, starting with the initial intent to improve cross-disciplinary collaboration for the students. The need for more cross-disciplinary collaboration in the FSU interior design program became clear when preparing for CIDA accreditation in 2012-13. The faculty considered ways to integrate multi-disciplinary collaboration into the program, but it was inherently challenging due to the makeup of the College – interior design does not have allied design, engineering, or construction disciplines within the College of Fine Arts at FSU. The lack of an obvious solution led to the idea of creating a department-wide student design charrette that would integrate the input of professionals in the community through breakout sessions at the charrette kickoff. Over time, the goals shifted to emphasize crossexpertise collaboration with multi-disciplinary expertise input from less traditional disciplines.
Charrette Logistics
Each year, the charrette involves approximately 120 students spread across 30 teams where each team includes at least one sophomore, one junior, and one senior student. The topic is confidential until a kickoff event where the scenario is unveiled, and interdisciplinary guest lecturers were often invited to discuss a topic pertinent to the charrette scenario for that year. Student teams have four to five days to complete the work when they must have their 24” x 48” poster or board displayed for faculty to judge. Each project is
93 2023 SEGD Communication + Place
judged blind by two pairs of faculty, scores averaged, and winners determined. Within four days of completing the charrette work, students could voluntarily complete a peer evaluation form to evaluate their individual team member’s performance. The scoring from the faculty judging produced a grade for the team. Individual student grades were influenced by the outcomes of the peer evaluation form providing nuance in each student’s grade for the charrette. The peer evaluation was added in the third year of the charrette when it became clear that some students were not devoting an appropriate amount of energy to the work.
Charrette Design Scenarios
The ten years of student design charrettes in the Department of Interior Architecture and Design at Florida State University can be broadly characterized as embracing fantastical design scenarios. The rigor of design studios at FSU IA&D is high and the design scenarios are typically practical which prepares students very well for practice. The faculty saw the opportunity to offer a vastly distinctive design experience for the student teams through the charrette where students and faculty alike could take creative risks. Over the years faculty have created a variety of creative design scenarios each year for the students:
2014: A safehouse for 50 people and 5 dogs on the Florida State University campus to withstand a zombie apocalypse.
2015: The public spaces of the National High Magnetic Field Laboratory at FSU to engage people of all ages with the innovations created by the scientists at the facility.
2016: The Dohnanyi Recital Hall, lobby space, and a new luthier studio at FSU inspired by a piece of music composed for the violin.
2017: A correctional facility for comic book supervillains that integrated criminal science and the role of art therapy in rehabilitation.
2018: An interior space overlooking one of the cities described in Italo Calvino’s Invisible Cities.
2020: A Mars habitat in 2050 for 100 scientists who will establish the foundation of a future large Mars settlement.
2021: A mind palace inspired by a piece of poetry.
2022: A hidden meeting place for a secret society on the campus of FSU.
2023: GameOn! A spectator event/game and environment inspired by a nostalgic childhood game or toy.
Refinements to the Student Design Charrettes
Over these ten years, the charrette has been refined to improve logistical factors, the scope of design for the student teams, and the method of creating the student teams. In the early years, the charrette took place in the fall semester, but was changed in the fourth year to occur at the start of spring/winter semester to avoid numerous calendar conflicts in the fall and to allow the 2nd year students to build more skills that they can bring to bear in the charrette. Another change involved the scope of work and level of detail that was given to the student teams at the kickoff. The first three years of the charrette involved actual spaces on campus and drawings for the existing spaces were provided to the students. The fourth year marked a notable change in the work scope and detail level by omitting this portion of provided information and instead expected students to conceptualize the space for themselves. The outcomes demonstrated significant improvement over prior years, so the change was made permanent for future charrette scenarios. A third major change was employed by the charrette creator in relation to the methodology of team formation. In the first two years, the teams were formed based upon student performance to preserve fairness. Starting in the third year, emotional intelligence testing outcomes were used to form teams which provided extremely useful observations related to team dynamics. In the seventh year and following, teams were formed based upon empathy quotient and systemizing quotient testing which allowed the researcher to further analyze team dynamics and the traits of design students. A summary of the emotional intelligence findings is included later in this article.
2019: A safe haven from a gas attack for influential scientists and automatons set in 1880s London inspired by a steampunk aesthetic.
94

The Silo Experience of Academia
Multi-Displinary Approach in Practice
GRADUATE STUDENTS
Cross-Expertise Approach to the Charrette

SENIORS
JUNIORS
SOPHMORES
FRESHMAN
95 2023 SEGD Communication + Place a + + + + + INTERIOR DESIGN ARCHITECTURE GRAPHIC DESIGN INDUSTRIAL DESIGN
DESIGN STRATEGY EGD
Figure 1. Higher education is constructed to divide disciplines while design practice calls practitioners to multi-disciplinary collaboration.
Figure 2. Higher education typically creates boundaries between levels of expertise while design practice unites individuals across levels of expertise in mentoring relationships.


96
Figure 3. Nine years of design charrettes at FSU Interior Architecture and Design - the winning students’ boards accompanied by the thematic logos for each year.
Figure 4. The winning student presentation from 2023 and accompanying logo, year ten of the charrette.
2014 2015 2016 2017 2018 2019 2020 2021 2022
Zombie Safehouse
The Mag Lab
The Red Violin Penitentiary for Super Villians Hidden Cities Steam Punk Civilization on Mars Mind Palace Secret Societies
Creative Integration of CrossDisciplinary Expertise
The authors of this study can attest to the challenges of traditional cross-disciplinary engagements in student projects. Because the FSU interior design program does not have allied academic disciplines focusing on the built environment within the College, these partnerships were sought through professional practitioners in the community for charrette scenarios where this made the most sense (2014, 2015, and 2023 primarily). For several of the charrettes, multidisciplinary collaboration was sought, but for various reasons was not able to be secured. In the process of addressing these challenges, faculty have built partnerships with experts outside of the built environment disciplines that could act as crossdisciplinary advisors based upon the specific charrette topic for the year. This aspect of building non-traditional partnerships between design and a variety of disciplines has become one of the most rich and rewarding aspects of this work. The following provides examples of multidisciplinary input into the annual charrette kickoff event:
2014 | Zombie Safe House: A practicing architect, engineer, urban planner, and an academic physician to provide breakout sessions where student teams were presented with compelling topics to consider when designing a safe house to withstand a zombie outbreak.
2015 | Public spaces at the FSU NHMFL: An architect, DisneyImagineer, and scientists provided breakout sessions for students as they were called to redesign the public spaces of the National High Magnetic Field Laboratory on the FSU Engineering campus.
2016 | Dohnanyi Recital Hall: A luthier, master violinist, and live musical performances supported students in redesigning the Dohnanyi Recital Hall at FSU.
2017 | Correctional Facility for Comic Book Supervillains: A nationally renowned expert in art therapy and a researcher in criminology expanded students’ thinking about the needs of prisoners in a correctional facility for comic book supervillains.
2018 | Visualizing Invisible Cities: An art historian provided an engaging lecture on Italo Calvino’s Invisible Cities to help students engage in the highly conceptual descriptions of fantastical cities that students were called upon to visualize from the interior of these conceptual places.
2023 | Game On!: An architect specializing in arena and stadium design engaged students with an introduction to designing large spectator event facilities in preparation to design a spectator experience based upon a childhood game or toy.
These multidisciplinary partnerships have served to improved student learning in several ways. First, students were able to learn how to integrate knowledge from practitioners in allied design fields within the context of a specific design scenario. For example, in the case of the 2014 zombie safehouse scenario, students engaged in breakout sessions given by an architect, engineer, and urban planner on relevant topics from their professional points-of-view. Design work was judged on the creative integration of this cross-disciplinary knowledge into the design solutions. Even though the design scenario was fantastical in nature, this interaction between design disciplines mirrors everyday situations in professional practice. Second, students were presented with less traditional sources of cross-disciplinary expertise and they were able to experience how design is impacted by and can have a positive impact upon all manner of knowledge areas and fields of practice. For example, the 2017 charrette scenario described above embraced the disciplines of art therapy and criminology to set the stage for the design students immerse themselves in this theoretical design scenario.
Moving forward, faculty are looking for ways to expand the cross-disciplinary qualities of the annual charrette. The researchers would like to see the charrette incorporate students from multiple disciplines across the university even if they are not part of the typical built environment fields of study. In many ways, the greater the diversity of disciplines, the greater the benefits could be for all involved. In practice, design professionals work for all varieties of clients and a wide variation of colleagues from diverse backgrounds and the charrette could help design students prepare for this reality.
97 2023 SEGD Communication + Place
Acceleration of Student Learning through Cross-Expertise Student Teams
The formation of the charrette student teams has evolved over time, with some common characteristics enduring over the ten years. These common characteristics include:
The teams are typically made up of four students (occasionally five based upon participation totals),
Each team must have at least one second-year, one third-year, and one fourth-year student.
Student teams are created by the faculty member who creates and organizes the charrette.
Several faculty members evaluate the first draft of the team assignments to avoid problematic combinations of students based upon their past studio performance.
This model of team formation can lead to improved student skills in creative thinking, visual communication, and collaboration. The cross-expertise makeup of the teams can provide less experienced students with opportunities to learn from those with more experience and those who are more seasoned can apply leadership skills. A team of faculty providing oversight of the team formation can limit problematic situations that may rise between team members, ideally removing barriers to learning. As described earlier, a peer evaluation was employed starting with the third charrette which provided students with peer-based accountability further improving team dynamics and enhancing the learning process.
Also in the third year of the charrette, a new strategy was added to the team formation process. The Assessing Emotions Scale (AES) (Schutte et al., 1998), a 33-item emotional intelligence (EI) test, was piloted with FSU IRB approval. Emotional intelligence is “a form of social intelligence that involves the ability to monitor one’s own and others’ feelings and emotions, to


98
Figure 5. Emotional intelligence data suggests that students are viewed more favorably on peer evaluations if they possess high overall EI and a high score in ‘Managing One’s Own Emotions.’
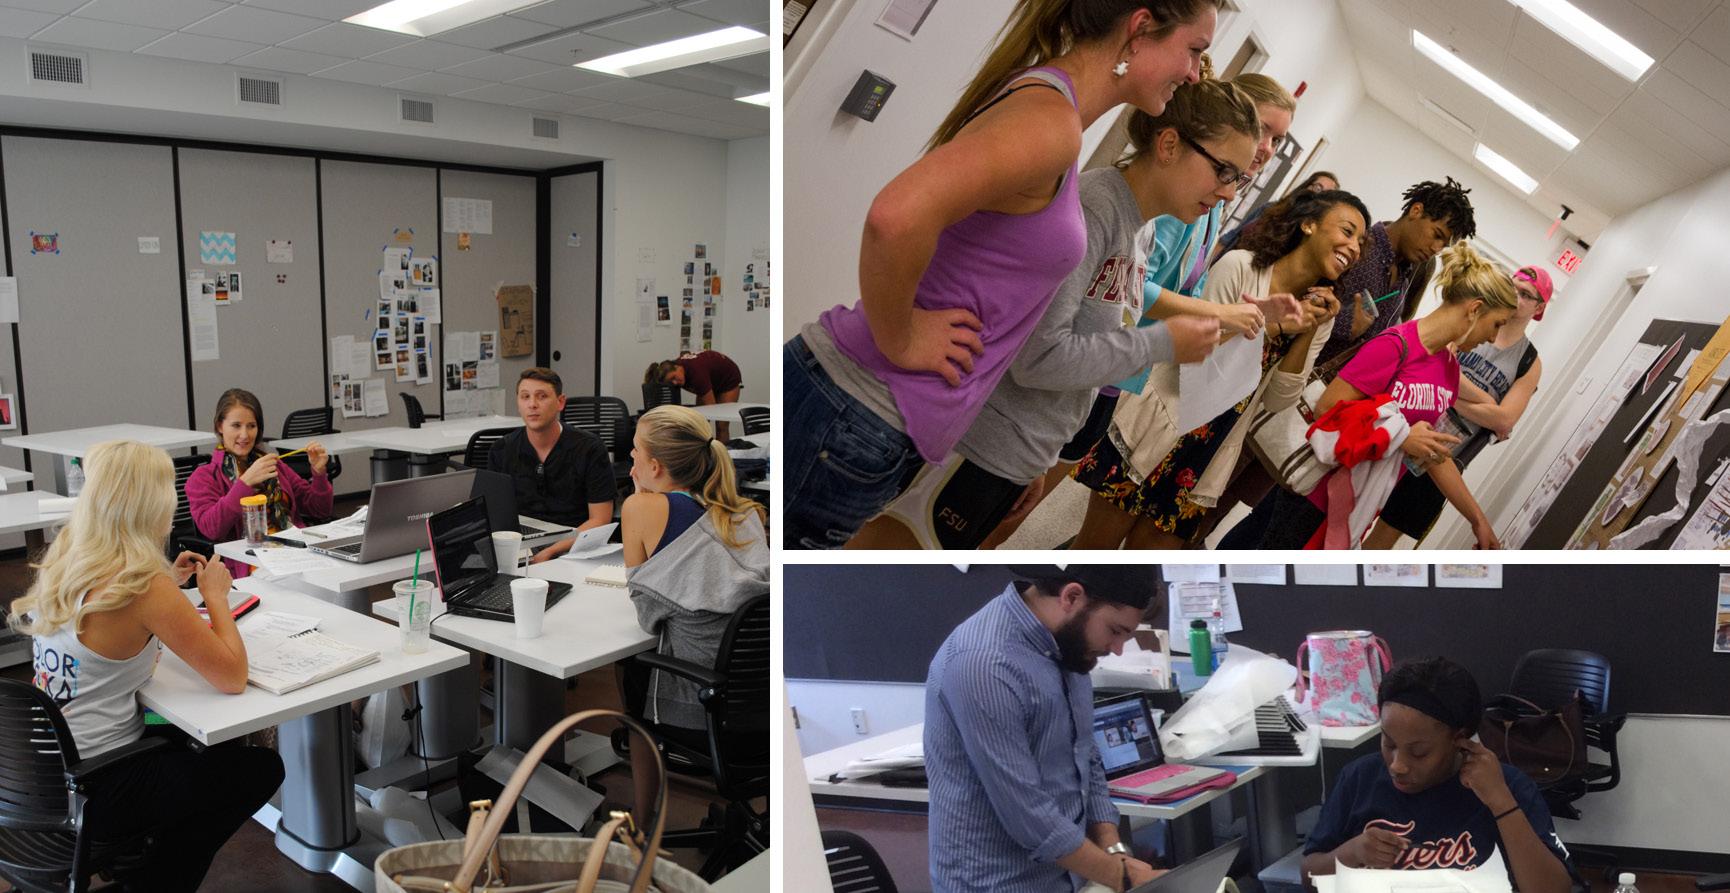
discriminate among them, and to use this information to guide one’s thinking and action” (Salovey and Mayer, 1990). The AES is a self-report instrument, was chosen because it has demonstrated reliability (Austin, E. J. et al., 2004), and it has been used in many studies involving college students (Schutte et al., 2009). EI has also been determined to be a contributing factor to performance in collaborative settings involving college students (Offermann et al., 2004).
The pilot test of the AES in context with the third charrette was successful, and it was used for the next several years to collect data on students’ EI that was then used to influence team creation. Students completed the test several weeks prior to the charrette kickoff, the charrette organizer analyzed the data, and then created teams using the data in two primary ways. First, teams were formed based upon total score by grouping high scores together, mid-range together, and low range together. The second phase of this part of the research grouped students to increase diversity of EI scores within the teams (high, mid, and low on the same team). Across all the years using the AES to measure EI, there were no discernible differences in charrette performance in relation to judging the projects. In other
words, high or low EI does not result in better or worse design project outcomes as measured through judging the creativity and visual quality of the poster and board presentations.
Two additional observations emerged. First, interior design students demonstrated a higher EI as measured by the AES when compared to other general university students and with two specific disciplines of university students, psychiatry and dentistry (Webber, 2017a). These findings could indicate that EI differs by discipline at the higher education level. It is not yet clear why this is the case, but it could be that students are attracted to certain disciplines due to their inherent traits, including emotional intelligence. Across design disciplines, more research on the trait-level emotional intelligence of students and practitioners could yield important findings leading to improvements in higher education, training, mentoring, leadership, and the overall effectiveness of professional development.
Second, students with high overall EI and those with a high score in the ‘Managing One’s Own Emotions’ category receive better peer evaluations from their team members on the charrette (Webber, 2017b). EI scores
99 2023 SEGD Communication + Place
Figure 6. Cross-expertise student teams work together for 4-5 days on the charrette and celebrate the work of their peers once it is on display.

of students were compared to the results from the peer evaluations for three years’ worth of data. Students who scored low in overall EI and low in the category of ‘Managing One’s Own Emotions’ demonstrated a higher frequency of scoring less than perfect on the peer evaluations. In other words, high overall EI and high ‘Managing One’s Own Emotions’ subcategory of EI as measured by the AES increases one’s likelihood of being perceived positively by peers on a collaborative project. This observation could be transferable to professional scenarios, providing an additional learning opportunity for students as they prepare for design practice.
In summary, this line of research in connection with ten years of student design charrettes in an interior design program has yielded results in perforating expertise boundaries among students. First, faculty can use these lessons to build cross-expertise teams that accelerate student learning for those with less experience and provide an environment where more seasoned students can develop leadership skills. Second, incorporating a peer evaluation metric immediately following the completion of the charrette provides a means of accountability amongst students enhancing the learning process and mimicking the accountability of team collaboration in professional practice. Third,
using EI as a metric in the background of the charrette can provide insight that faculty can use to improve professional training for students as they seek to know themselves more fully and what will be expected of them in professional practice as they work in cross-disciplinary and cross-expertise teams. The charrette provides an opportunity to mimic the team dynamics of professional practice in a manner that can be enjoyable and highly engaging for both students and faculty.
The Gallery Exhibition: Celebrating Ten Years of Student Design Success
Each year the charrette student work phase concluded with displaying the work in a prominent hallway in the William Johnston Building on the campus of FSU. The charrette boards and posters would remain on display for several weeks allowing students, faculty, and visitors to enjoy the work. Immediately following the completion of the work faculty conducted the judging process, scores were tabulated, winning projects were determined, and were then announced at an awards ceremony. For the tenth charrette, this rhythm was repeated, but it was coupled with a gallery exhibition that celebrated the nine prior years of charrettes and their winning projects along with all the student project entries for the tenth
100
Figure 7. Charrette gallery layout showing experience diagram strategy. ”R” shown on plan for area of Relics & Resources.

year with special recognition for the winners. The gallery opening was positioned as the culmination of the awards celebration with a social gathering and refreshments.
This tenth charrette awards celebration served as the perfect moment for an immersive storytelling exhibit highlighting the previous nine years as well as an opportunity to showcase this tenth year of student design solutions in a gallery setting. The exhibit strategy focused on three parts:
To Immerse: Create a level of activity that will surround the visitors on all sides with enticing visuals and reflection.
To Connect: Build connections with the visitors and participants through nostalgia and the previous year’s design story and winners.
To Inform: Highlight the connection between the heritage of the charrette and the 2023 edition to provide a platform to display the current student work.
With 50 linear feet of floor-to-ceiling windows commanding an entire side of the gallery, this presented
the opportunity to tease the exhibit by showcasing each year’s iconic theme through logos applied as window graphics. The vinyl graphics served as a branded timeline for each year’s unique topic, and as visitors would traverse the building atrium, they were given a subtle hint of the charrette exhibit.
As each visitor enters the exhibit, they were provided a sense of welcome through an overview of what the current gallery experience would include. The gallery content to come was highly detailed, so this entry experience was crafted to condense the charrette to its essence using an informative faceted timeline showing an overview of each year’s charrette topic. This repurposed foam core timeline employs an undulating rhythm that is intended to reflect each charrette’s unique design problem, design requirement, and solutions. On a pedestal, adjacent to the timeline was a curated 4-person Uno game giving the visitor an invitation to play a hand as they enter. The running game would be self-governed, inviting interaction, as well as setting the tone for the 2023 charrette theme.
At the gallery entry, the timeline was affixed to a large movable wall on casters. The wall was placed at an angle that would naturally direct visitors to the
101 2023 SEGD Communication + Place
Figure 8. Gallery Entry Wall with faceted timeline.


102
Figure 9. “Champions Row”: Nine years of charrette winners.
Figure 10. GAME ON! Introduction poster and student design boards.


103 2023 SEGD Communication + Place
Figure 11. View of the gallery overlooking the GAME ON! student work and relics.
Figure 12. GAME ON! Winners wall with past relics & inspiration resources in the foreground.
next experience along the dominant exhibit wall in the gallery. The fifty-foot-long wall, unofficially termed “Champion’s Row,” showcased a total of 18 posters and boards, two for each year. The posters and boards celebrated each prior year’s winning team with their 24” x 48” presentation board. Each winning board was accompanied by an informative poster of the same size detailing the theme for that charrette, the kickoff event, unique requirements, and outcomes.
As the visitors exit “Champion’s Row” and enter the nucleus of the gallery space, they were greeted with the 2023 charrette introduction poster and the spectacular visual presentations of the 24 student teams. The 2023 design theme was developed to be a crescendo of sorts in the life of the charrette at FSU. The depth of storytelling, connection to the viewer, and overall scale of the exhibit reflects this intent. The topic of 2023, “GAME ON!,” leveraged each student’s personal experience by using the inspiration of a childhood game and transforming it into a stadium environment. The student teams designed the spectator and player experience, the playing surface or volume for the game, and they conceptualized the game rules.
“GAME ON!” was brought to life in the gallery by emphasizing the students’ design boards and supporting these with relics from nostalgic games of the recent past. Relics were selected to engage visitors in conversations, connections, and storytelling of their own. The relics featured monopoly property cards, a dodge-ball, stacked Jenga pieces, and a running Perfection game. An elongated pedestal featured books, figurines, mementos, music, and film relics in reference to the pre-2023 charrettes. This elongated pedestal provided the visitors with a transition to the final area of the gallery.
Finally, after the visitors explored each unique student board and thematic relics, they were presented with the 2023 Charrette winners feature wall that highlighted first, second, third, and honorable mention student projects. The “GAME ON!” winning board featured graphic and dimensional elements that were both hand-crafted, 3D-printed, digitally rendered, and handsketched. The winning presentation board shows the breadth of where the charrette began and how far the students have grown in their collaboration, ideation, & visual-communication skills. The exhibit also ignited conversations between faculty and staff of many fields across the University as people were drawn to the
gallery to see the results of ten years of the FSU Interior Architecture & Design Annual Student Design Charrette. These conversations could shape the future of the annual design charrette to expand its reach into more disciplines across the University.
Next Steps
This article provides a look behind the scenes on the successes and challenges of the annual student design charrette in the Interior Architecture & Design Department at Florida State University. Embracing innovative design scenarios, cross-disciplinary input, cross-expertise team structure, emotional intelligence, and a celebration of student success have helped to accelerate student learning and prepare them for an evolving professional practice environment. In addition to the learning benefits for students, the charrette has given the students and faculty something to rally around, provided fertile ground to start new friendships and mentoring relationships that extend far beyond the scope and duration of the charrette itself, and provides the opportunity to unite meaningful research with teaching and service – a rare trifecta in the higher education environment. On many levels the charrette provides a means to positively perforate the systemic structure of higher education for the benefit of students and faculty alike.
Looking ahead at the next ten years, the researchers are considering ways to improve the annual charrette. One idea is for the charrette to reach out into the community with an eye towards engagement, offering design solutions to real-world problems, and allying with local practitioners. Another area for improvement is in cross-disciplinary collaboration within student teams. A lack of built environment disciplines within the higher education structure should not be allowed to stop faculty from pursuing this goal. Answers to this challenge can be found in what started with inviting cross-disciplinary experts from a variety of fields to provide lectures and breakout sessions and has grown through the connections made via the gallery exhibition. Design benefits from and provides benefits to countless diverse disciplines. Establishing a common ground between design and medicine, literature, history, criminology, urban planning, engineering, and architecture is just the beginning.
104

“Establishing a common ground between design and medicine, literature, history, criminology, urban planning, engineering, and architecture is just the beginning.”
105 2023 SEGD Communication + Place
Figure 13. Looking ahead to future collaborations on the annual student design charrette.
Resources
Austin, E. J., Saklofske, D. H., Huang, S. H., & McKenney, D. (2004). “Measurement of Trait Emotional Intelligence: Testing and Cross-Validating a Modified Version of Schutte et al.’s (1998) Measure.” Personality and Individual Differences, 36(3), 555-562.
Buchbinder, S. B., Alt, P. M., Eskow, K., Forbes, W., Hester, E., & Struck, M. (2005). “Creating Learning Prisms with an Interdisciplinary Case Study Workshop.” Innovative Higher Education, 29(4), 257-274.
CIDA. (2020). Professional Standards 2020. Retrieved 03/14/2023, from https://www.accredit-id.org/s/IIProfessional-Standards-2020-yh8t.pdf
NCIDQ. (n.d.). NCIDQ Examination Eligibility Paths. NCIDQ Exams. Retrieved May 24, 2023, from https:// www.cidq.org/paths
Neuman, M., Perrone, C., & Mossa, A. (2022). “Applied Research by Design: An Experimental Collaborative and Interdisciplinary Design Charrette.” European Planning Studies, 30(6), 1013-1033.
Offermann, L. R., Bailey, J. R., Vasilopoulos, N. L., Seal, C., & Sass, M. (2004). “The Relative Contribution of Emotional Competence and Cognitive Ability to Individual and Team Performance.” Human Performance, 17(2), 219-243.
Salovey, P., & Mayer, J. D. (1990). “Emotional Intelligence.” Imagination, Cognition and Personality, 9, 185-211.
Schutte, N.S., Malouff, J.M., & Bhullar, N. (2009). “The Assessing Emotions Scale.” C. Stough, D. Saklofske & J. Parker (Eds.), The Assessment of Emotional Intelligence New York: Springer Publishing, 119-135.
Schutte, N. S., Malouff, J. M., Hall, L. E., Haggerty, D. J., Cooper, J. T., Golden, C. J., & Dornheim, L. (1998). “Development and Validation of a Measure of Emotional Intelligence.” Personality and Individual Differences, 25, 167–177.
Walker, J. B., & Seymour, M. W. (2008). “Utilizing the Design Charrette for Teaching Sustainability.” International Journal of Sustainability in Higher Education, 9(2), 157-169.
Webber, S. B. (2017a). “Emotional Intelligence in the Interior Design Context.” Journal of Interior Design, 42(4), 29-44.
Webber, S. B. (2017b). “Emotional Intelligence and Peer Perceptions within Interior Design Teams.” 2017 IDEC Annual Conference Proceedings, 2017(1), 639–642. https://doi.org/
106
107 2023 SEGD Communication + Place
Using Social Science to Improve Social Impact
Communication Strategies for Experience Designers
Nathan Lachenmyer, Partner, Sitara Systems
Abstract
This paper explores the intersection of strategic communication, social impact, and experience design in addressing interconnected and complex social issues that pose challenges to understanding and collective action. It emphasizes the need for data-driven communication strategies to navigate the complexities of these crises and generate action. Leveraging insights from social science research, the paper highlights the importance of tailored strategic communication that acknowledges and addresses the diverse motivations shaping individuals’ thoughts, emotions, and actions toward social issues. Drawing upon research from the Yale Program on Climate Change Communication, the paper examines population segmentation based on beliefs and attitudes toward climate change issues in the United States. These population segments are utilized to develop targeted communication strategies most likely to appeal to individuals’ needs and desires. Finally, the paper identifies opportunities for further research, including the development of communication strategies for other social impact issues and the exploration of evaluation methods for assessing the social impacts of design interventions.
108
Introduction
Today we live in an age of polycrises – multiple concurrent crises that are interconnected in ways that amplify their pain points and make them difficult to disentangle. The crises we face today are often interconnected on a global scale, exhibiting long delays between cause and effect, and intertwined with various political, social, and economic factors. The complex nature of each crisis often gives rise to a sense of intractability. We need new communication tools to help us understand the complexity of our modern world and take collective action toward solving these crises.
At its very core, experience design is about creating environments that improve the human experience, whether it is helping people find their way, communicating important information, fueling a dialogue between inhabitants of the space, or simply creating a sense of place. As social impact becomes increasingly important for experience designers to engage in and aspire to, they have begun to investigate how strategic communications meant to inspire action can be integrated into the practice of placemaking.
To generate social impact, strategic communication must be customized to address the diverse motivations that shape individuals’ thoughts, emotions, and actions in response to social issues. By leveraging insights from social science, designers gain a deeper understanding of the attitudes and behaviors exhibited by the general public, equipping them with tools to create impactful experiences. Drawing upon social science research allows designers to effectively address collective action problems, such as climate change, by shaping perceptions, fostering engagement, and driving action.
In this paper, research from the Yale Program on Climate Change Communication is examined, investigating population segmentation based on beliefs and attitudes toward climate change issues in the United States. This research identifies distinct audience segments that allow communicators to gain valuable insights into the preferences and needs of individuals. Recommended communication strategies for different populations follow an overview of the existing research; these strategies can help designers effectively inspire collective action for positive change.
Existing Research
Since 2008, researchers at Yale and George Mason University have conducted nationally representative surveys that investigate public climate change beliefs, risk perceptions, and policy support, as well as the underlying psychological, cultural, and political factors that influence them (Maibach 2008). The original 2008 data was utilized to conduct a segmentation analysis to identify different audiences within the American public that each responds to climate change differently. This research, spanning 36 measures of global warming beliefs, preferences, and behavior, identified what has since become known as “Global Warming’s Six Americas” (Leiserowitz 2011). The Yale Program for Climate Change Communication has since periodically updated its analysis, providing insights into the relative proportion of each population segment and their individual beliefs. The latest Six Americas report, published in December 2022, segments the population into six groups:
The Alarmed are convinced that the identified problem is real, serious, and urgent; they also strongly support immediate government policies to remedy the issue.
The Concerned have a similar attitudinal valence to the Alarmed, but are separated by a lower issue engagement – they typically place the issue at a lower priority and are thus less likely to support immediate action.
The Cautious haven’t decided yet on the facts; they are typically willing to be engaged on the issue but need some convincing.
The Disengaged are, as their name suggests, broadly disengaged from the issue at hand and rarely think about it or act on it.
The Doubtful lie further on the spectrum of attitudinal valence and generally doubt the factual merits of the issue.
The Dismissive strongly do not believe the facts of the issue at hand, strongly oppose action by governmental bodies, and often support conspiracy theories and other propaganda.
109 2023 SEGD Communication + Place
Communication Strategies
To fully leverage the Six Americas report, it is important to understand the two key dimensions underlying the segmentation – attitudinal valence and issue involvement. Attitudinal valence represents the emotional or affective aspect of an individual’s attitude toward climate change and measures how strongly an individual accepts or rejects the scientific facts. Issue involvement measures the personal relevance or importance an individual gives climate change, as well as their attitudinal certainty around it. High issue involvement implies that individuals are deeply interested, knowledgeable, and emotionally invested in climate change, actively seeking information, and likely to participate in discussions or actions related to global warming. Conversely, low issue involvement suggests a lack of personal relevance or concern, resulting in less attention, knowledge, and engagement.
These two metrics can provide substantial insights into population segments. For example, both the Alarmed and Dismissive think about climate change frequently and have strongly held beliefs about the matter (high issue involvement). However, the Alarmed understand the key facts about climate change (high attitudinal valence), while the Dismissive reject facts and messages consistent with science (low attitudinal valence). The remaining population segments have low issue involvement but varying attitudinal valences.
By understanding the underlying metrics, experience designers can develop effective communication strategies that are most likely to elicit action from each population segment.
Strategy: Know Your Audience
The most important strategy is to know your audience. While this is a truism of general public communication, it is crucial for communicating the realities of climate change. A recent study concluded that over 80% of Americans underestimate the prevalence of support for major climate change mitigation policies and overall climate concern by more than a factor of two (Sparkman 2021). While 66-80% of Americans support these policies, Americans estimate the level of public support to be between 37-43% on average. What this research makes clear is, despite the truism, most designers do not know their audience.
The Six Americas report confirms the general support for climate change mitigation policies, with 70% of the population having a positive attitudinal valence (belonging to the Alarmed, Concerned, or Cautious segments). Only 22% of the population rejects climate change science (the Doubtful and Dismissive), while only half of those in this margin are actively engaged against climate policies.
However, these figures represent national averages and should not be solely relied upon for targeting specific audiences, as attitudes toward climate change can exhibit significant variations across different locales and regions (Howe 2015). The Yale Program for Climate Change Communication provides several tools that can be used to identify more local trends in climate opinions. The first tool is the Yale Climate Opinion Maps,1 which summarizes trends in climate opinions at the national, state, county, and congressional district levels. A second tool is the Six Americas Super Short Survey (SASSY),2 which uses four questions to quickly align an individual to one of the six population segments. The ability to hyper-localize trends through a survey is particularly beneficial for experience designers, as it allows them to account for the demographic variations among visitors that may diverge from more general trends. This consideration is especially relevant due to self-selection bias, where individuals who choose to participate in specific physical spaces, such as university buildings or office buildings, may exhibit different attitudes and preferences regarding climate policy. By acknowledging and addressing this bias, experience designers can ensure that their communication strategies and designed experiences are attuned to the specific demographics and perspectives of the visitors in those spaces.
Strategy: Break the False Social Reality
Climate change, like many social impact issues, is a collective action problem. This requires individuals to recognize the problem as a threat and to engage in coordinated actions to create major social change. Underestimating public support for climate change action counterproductively affects both aspects of collective action. Individuals rely on social responses to accurately identify and perceive threats; if individuals believe that the general public doesn’t
1 https://climatecommunication.yale.edu/visualizations-data/ycom-us/
2 https://climatecommunication.yale.edu/visualizations-data/sassy/
110

see climate change as a threat, then they themselves are less likely to view it as a threat (Frantz 2009). Similarly, individual actions alone are insufficient – longlasting structural changes require a coordinated effort. Individuals are less likely to act when they perceive that others aren’t acting in concert with their own individual actions (Fischer 2011).
It is clear from the research that most Americans live in a false social reality where they dramatically underestimate each other’s support for action, which helps to reinforce the notion that collective action faces an uphill battle. A primary challenge for designers is to help break down the communication barriers so that audiences understand their desire for positive social change is not a minority opinion, and that their individual actions are, in fact, part of a larger coordinated action meant to create long-term structural and social change.
Strategy: Focus on Actions
A key interpretation of this research is that in their work, designers must communicate that most of us are aligned on the reality of the climate crisis – therefore, our public communications should not be focused on conveying the facts of climate change. The majority of Americans agree that global warming is happening (72%), will harm future generations (71%), and is caused by human activity (57%) – there’s no further need to debate the scientific merit of action on climate change.
When we look at the audience segments, the Alarmed are eager to know what individual and collective actions they can take to help reduce global warming. These are the members of the population that are the most engaged on this issue. They have the highest belief in global warming and are the most motivated to take action – they are extremely likely to take concrete actions if designers/communicators engage with them about the next step to take. The Concerned are less liberal and less engaged than the Alarmed but still believe that action must be taken – just not as urgently as the Alarmed believe. By placing actions front and center and making them easy to complete, designers can engage the Alarmed and the Concerned segments of the population.
There is a widespread misconception that the most impactful actions are necessarily political ones. However, data suggests that this is far from the truth. Political actions, such as candidate support, political donations, and positions on legislative issues, are deeply intertwined with several other issues due to the structure of our political systems. Voters generally vote based on various factors, and research shows that climate change is a relatively low priority for most (Leiserowitz 2022). While four out of ten voters acknowledge that climate change is a very important issue, only 4% of voters chose it as their top priority, and it ranked the 24th most important issue out of 29 possible issues overall.
111 2023 SEGD Communication + Place
Figure 1: Summary of Global Warming’s Six Americas. Image courtesy of Yale Program on Climate Change Communication.

“A primary challenge for designers is to help break down the communication barriers so that audiences understand that their desire for positive social change is not a minority opinion.”
112
Figure 2: Example opinion map showing county-level public support for the statement “Global warming is happening.” Image courtesy of Yale Program on Climate Change Communication.
Another challenge is the rapid rate at which circumstances change, and the desired action might change. Experience designers creating experiences for the built environment frequently design environments that will last 10 years or longer, meaning that references to specific political actions, such as legislation, may fall out of date and become irrelevant quickly.
Instead of political action, it is recommended that designers encourage their specific audiences to join local non-partisan groups focused on mobilizing their communities on climate issues. This serves a two-fold purpose: first, by connecting our audiences to a larger organization, we help connect them to other individuals who share their interest in collective action; second, this allows local groups to organize individuals based on the current needs of the overall movement. In short, designers can be most effective when they collaborate with existing organizations to amplify their voices and mobilize individuals.
Strategy: Focus on Locality and Urgency
Six Americas has shown that the most successful strategy for converting Concerned and Cautious members into action is to focus not on the facts but on the issue’s urgency. These two segments (44% of the population) are convertible in that they have weak issue engagement, with a weakly held attitudinal valence –they believe and support the facts of climate change (albeit weakly), and they are very weakly engaged with the issue and unlikely to take action.
A large proportion of these population segments believe that climate change is real but simply don’t believe that the problem will affect them personally. A common view amongst these individuals is that climate change is a problem that will affect the developing world the most (in another place) or that it will affect future generations negatively (in another time) – but since they won’t be impacted, there isn’t an urgent need for action. This view of climate change as a distant problem lacking personal relevance is the belief that needs to be directly addressed.
Designers should structure their narrative to emphasize that climate change is an urgent and widespread issue. This means shifting the narrative to focus less on longterm impacts (such as long-term weather patterns or
changes to sea levels) and instead focusing on shortterm impacts on human lives and property. As these audiences are typically less engaged with climate change, it is important to focus on simple, short, and clear messaging that is repeated often to ensure that these impacts are conveyed.
Strategy: Ignore the Dismissive
The Dismissive are a unique audience that rejects climate change as an issue of concern. They have both a strong attitudinal valence, firmly rejecting scientific claims about global warming, and a strong issue engagement that makes them extremely certain in their views and very likely to propagate their views to others. The Dismissive are the most likely group to spread propaganda and misinformation related to climate science.
Given these factors, the best strategy for most designers seeking to create social impact is to ignore this group. As of the latest Six Americas report, the Dismissive only comprise 8% of the population – a small enough percentage that they are unlikely to serve as a major obstacle to structural change. Six Americas research has shown that communicating climate change to the Dismissive can even cause a backlash, further antagonizing them and entrenching their opinions. It is best not to address these population segments that reject climate science.
Future Work
Success in strategic communication is not marked by the production of an object or the completion of a project, but through observation, feedback, and assessment over the long term. Feedback is a critical requirement of design for social impact in that it measures success not based on what the designer thinks has been accomplished but on the user’s needs, experiences, and responses. Designing for social impact must be measured both by the immediate gains— does the designed system function as planned—as well as the changes that occur when people engage in real time and space with those systems and how change is created.
As this is an emerging field of study, there may be room to examine what a successful case study would comprise. The social impacts we are asking to measure relate to chronic, systemic issues that require long-term impact studies to draw any significant conclusions.
113 2023 SEGD Communication + Place
This is a large shift in evaluation for most experience designers, and how one can properly plan the evaluation of the social impacts of their work is an open question that merits further research in the field.
There is also substantial work that could be done in developing communications strategies for other social impact issues with perception gaps – disparities in how they perceive the beliefs of the American public and what the public believes. Recent research has shown that, like climate change, several other intensely debated social issues possess perception gaps of over 20% [More In Common]. While this research shows the existence of a perception gap, it does not segment the population into functional groups based on their attitudinal valence and issue engagement and thus does not propose novel communication strategies. The development of communication strategies for a variety of other social impact issues is a clear topic of research where collaboration could occur between designers and social scientists.
Conclusion
In conclusion, the convergence of strategic communication, social impact, and experience design provides a powerful framework for addressing the interconnected and complex challenges of our modern world. The need for new communication strategies that navigate the intricacies of these interconnected systems is evident, and leveraging insights from social science research proves invaluable in creating tailored communication strategies. By understanding the diverse motivations that shape individuals’ responses to social issues, designers can develop experiences that generate social impact and inspire collective action.
The examination of population segmentation research, particularly in the context of climate change attitudes, highlights the importance of understanding attitudinal valence and issue involvement for effective communication. Designers can utilize this knowledge to identify distinct audience segments, gain insights into their preferences and needs, and craft targeted strategies that resonate with different populations. It is crucial to recognize the significance of knowing your audience, focusing on concrete actions, and emphasizing locality and urgency in driving meaningful change.
Ultimately, the design for social impact is an ongoing journey that requires continuous learning, adaptation, and collaboration. By harnessing the power of strategic communication, social science research, and experience design, we can create transformative experiences that empower individuals, inspire collective action, and contribute to positive change on a global scale. Through interdisciplinary efforts, we can forge a path toward a more sustainable, inclusive, and equitable future.
Resources
Fischer, Peter, et al. “The Bystander-Effect: A MetaAnalytic Review on Bystander Intervention in Dangerous and Non-Dangerous Emergencies.” Psychological Bulletin, vol. 137, no. 4, 2011, pp. 517–537, https://doi. org/10.1037/a0023304
Frantz, Cynthia M., and F. Stephan Mayer. “The Emergency of Climate Change: Why Are We Failing to Take Action?” Analyses of Social Issues and Public Policy, vol. 9, no. 1, 2009, pp. 205–222, https://doi.org/10.1111/ j.1530-2415.2009.01180.x
Howe, Peter D., et al. “Geographic Variation in Opinions on Climate Change at State and Local Scales in the USA.” Nature Climate Change, vol. 5, no. 6, 2015, pp. 596–603, https://doi.org/10.1038/nclimate2583
Leiserowitz, Anthony, et al. “Global Warming’s Six Americas: A Review and Recommendations for Climate Change Communication.” Current Opinion in Behavioral Sciences, vol. 42, 2021, pp. 97–103, https://doi. org/10.1016/j.cobeha.2021.04.007
Leiserowitz, Anthony, et al. “Politics & Global Warming, April 2022” Yale University and George Mason University. New Haven, CT: Yale Program on Climate Change Communication.
Maibach, Edward W., et al. “Identifying Like-Minded Audiences for Global Warming Public Engagement Campaigns: An Audience Segmentation Analysis and Tool Development.” PLoS ONE, vol. 6, no. 3, 2011, https:// doi.org/10.1371/journal.pone.0017571
Sparkman, Gregg, et al. “Americans Experience a False Social Reality by Underestimating Popular Climate Policy Support by Nearly Half.” Nature Communications, vol. 13, no. 1, 2022, https://doi.org/10.1038/s41467-02232412-y.
114
115 2023 SEGD Communication + Place
Why Black Spaces Matter
Designing Racialized Spaces
Michele Washington, MFA, Designer, Researcher, Strategists
Abstract
This project, Land of the Blacks, brings forth awareness of the African Diaspora and its role in establishing of New York City, and addresses issues of cultural displacement, erasure, and social history. In the book, Black Landscapes Matter, landscape architect Walter Hood declares that designers can reimagine segregated urban landscapes that can be reborn again.
Hood’s statement is vital for driving how designers tackle critical conversations around Black landscapes and racialized spaces that address reimagining Black public spaces. The project Land of the Blacks provided graduate students with a way to reconstruct the visitor’s experience of historical New Netherland, later British New York, during the first century of what became New York City in the United States. Today, the mentioned Black space is located in what is now Washington Square Park and the surrounding areas, such as Soho, East Village, and West Village. Generally, the local community must learn more. However, through the Black Gotham Experience, founder Kamu Ware has reconstructed five tours, and Land of the Blacks is the first in this series of tours. This tour was pivotal to crafting the narrative for the entire project and grounding Black geographies of what was once a free Black community.
This public space changes the narrative of cultural displacement, erasure, and social history by prompting the designer to choose collaborative approaches that apply situation-centered propositions over solely adapting the user-centered strategy for the interactivity of such places/ spaces. In designing to activate public spaces, branding, interactivity, and public art can transpire through multiple modes of how people choose or are directed to navigate such ecosystems of green spaces. With social design integration, many designers are adapting humanitarian strategies, which are a necessity for the inclusion of participatory design and gamification with systematic issues concerning accessibility and usability through every phase of concept development, such as the branding of graphics and the inclusion of technology, materiality, and sensorial modes and their relationship upon the built environment and public space. In our daily lives, such systems have become more commonplace as bodies have grown more comfortable interacting with technology, branding, civic engagement, culture, democracy, design, politics, product design, and public space, all of which are still being fleshed out.
116
Introduction
Land of the Blacks is derived from my interaction with architects, designers, educators, and Black Memory Workers currently engaged with Black cultural geographies, interrogating Black spaces, and preserving their historical legacy through various modes of documentation. My connections have been with Dark Matters University (DMU), which grew out of the killing of George Floyd in May 2020. DMU draws from the BIPOC community throughout the United States, challenging academic institutions’ pedagogical architecture and design. DMU calls for more inclusive practices and collaborative teaching models within the academy, along with more professors of Color and administrators.
Essentially, “Land of the Blacks,” was the first free Black community in North America, in what was called New Amsterdam, in 1642. The Dutch West Indies Company brought enslaved Africans to New Amsterdam, where they were used to fight against the Native Americans. Eventually, the Africans petitioned for their freedom, which they were granted, and were given land. By 1643, a small town called the Land of the Blacks was settled. In 1655, Land of the Blacks was over twice the size of SoHo today. Families settled the land, creating farms and businesses and building a community encompassing the Washington Square Park area and parts of North SoHo, Chinatown, and East and West Village. [1]
Black Landscapes Matter by Walter Hood was my point of interrogation. Hood declares that as designers, we are responsible for designing Black spaces.
In the introduction of Black Landscapes Matter, Walter Hood states the following:
“Black Landscapes matter because they can be “born again.” They exist all around us and are continuously resuscitated. Doing so requires care in how we exhume and resuscitate these landscapes to ensure that their resonance and power are not lost. Maybe some Black landscapes have become vernacular: we now have a Malcolm X Plaza, a Frederick Douglass Circle, an Invisible Man sculpture in Harlem, an MLK memorial in Washington, DC, and a plethora of new landscapes, conserved to correct history. But we need something more powerful— not simply pedagogical, not a vernacular past, and not merely a chronicle to correct
history, we must see the original condition as “holy and beautiful.” We must be audacious in what we bring forward.
Black Landscapes matter because they are renewable. We can uncover, exhume, validate, and celebrate these landscapes through new narratives and stories that return us to our origins. The contested and the forgotten landscapes, renewed through myriad expressions, can give us incentive to obligations for years to come.” [2]
Approach
The students work in teams; each is given a name, much like they would as design firms pitching proposals for clients. Teams: Werk-it: Cameron, Emily, Steven; Public Lab: Laura, Janine; Now Motion: Caroline, Flavia, Tanisi; Us Viewers: Janielle, Sonali, WanTing
Our research phase consisted of a tour of the Land of the Blacks site by Kamau Ware, founder of Black Gotham Experience. Ware weaves a visually engaging story, taking the students through the site, which is Washington Square Park, located across from New York University. He’s a brilliant storyteller and historian who provides explicit details of individuals who lived and owned farmland in 1642 and the history of New Amsterdam before it was New York City. “Land of the Blacks,” is the first of five tours offered by Black Gotham Experience, ending in the Wall Street area of Lower Manhattan. During this site tour, Ware discusses the joint partnership in 2022 between the Department of Environmental Protection (DEP) and NYC Parks that built the plaza and how he was invited by NYC Parks to name the site. [3] He decided to call it Manuel Plaza, which honors Manuel de Gerrit de Reus, Big Manuel, Clyn Manuel, Manuel Sanders, and Manuel Trumpeter. These five Black men were among 28 land grant recipients in the area earned by people of African descent between 1643 and 1663. [4]
Then the students were introduced to the BlackSpace Manifesto, produced by BlackSpace, a collective of architects, artists, designers, curators, writers, and storytellers. BlackSpace Urbanist Collective grew from the Black in Design conference held at Harvard University in 2016, organized by the Black Student Union. Peter Robinson, guest speaker, Professor of Architecture at Cornell University and a board member of BlackSpace, discussed the inception of the BlackSpace
117 2023 SEGD Communication + Place
Manifesto development. He further stressed the importance of listening to the community since they offer lived experiences as subject matter experts. The teams developed a creative brief outlining the scope of objectives and design deliverables. Some conducted additional site visits to observe Washington Square Park, Manuel Plaza, and the surrounding area at different times of the day.
Each team designed a branding system that functioned across platforms from analog to digital and 2D to 3D. Along with ways of activating spaces, they developed interactive kiosks, other interactive devices for storytelling, street graphics, plus a printed zine that documented history. The proposed clients included Black Gotham Experience, Community Board 2, and the NYC Dept of Parks. Each team was required to select two or more BlackSpace Manifesto principles. Also, they had the option of combining biophilic patterns with the principles.
Implications
Working in tandem, each team tackled their projects based on concepts derived from creative briefs. The teams’ outcomes differed in how they addressed branding design and activating public spaces meshing with the chosen BlackSpace Manifesto principles.
Werk-it: Cameron, Emily, and Steven used the theme “Common Thread” to develop in-person and digital experiences for visitors. Figurative wire motifs were part of the wayfinding and activation systems marking Black geographies throughout the park. They included seating and public art, often left out of such conversations. In addition, interactive QR Codes for phones guided visitors through Washington Square and to Manual Plaza.
Public Lab: Laura and Janine
The teams Branding Identity for, “Land of the Blacks” was superimposed over an abstract representational map of the location. They illustrated characters and voice-overs and created posters and LinkNYC kiosks throughout the neighborhood. People walking through the area could learn about the site before visiting Washington Square Park.
Now Motion: Caroline, Flavia, and Tanisi designed interactive wayfinding kiosks and storytelling devices to capture the historical legacy that supported the mission of the Black Gotham Experience. Through secondary
research, they referenced the Ghost Houses used as open framework houses paired with interactive kiosks. Both served as portals for the storytelling of the first free African settlement in North America. Besides the manifesto, they meshed biophilia patterns, natural analogues (Complexity & Order), and Nature of the Space (Mystery). They also sought out collaborators within the surrounding community.
Paired with manifesto principles, Us Viewers wanted to tackle preservation by amplifying Black joy and cultural engagement using public art as artistic expression. They adapted Walter Hood’s quote, “Black Landscapes matter because they can be ‘born again,’” to explore ways of delivering untold history in Washington Square Park and Manuel Plaza. The team referenced artists’ work throughout their project and in the interactive kiosks. Land of Colors functioned throughout their designs as a core connector; they used mapping to inspire branding identity, colored the sectors, and overlaid the logo. Street graphics wound throughout the park, directing visitors along pathways.
For nighttime, art was projected on the arches located on the north side of the park. They featured people that would inhabit the site, a colorful way to draw visitors beyond the daytime visits.
Conclusion
Developing such projects allows students to create work that provide real life experiences. In accessing the future of public spaces—provides new forms of knowledge utilizing methods such as the BlackSpace Manifesto. Introducing the design of racialized spaces can be tricky; however, as our world becomes more multicultural, such projects will only enhance one’s ability to work with marginalized communities. Students can also gain even more if such projects, were a semester long, and were able to interact with the surrounding community, and engaged experts from similar projects such as African Burial Ground, Seneca Village, and Weeksville.
Within New York City, there exist more unrecognized Black spaces that are ripe for acknowledgment beyond monuments or plagues. We designers must begin to hold our public and built environments as sacred spaces and challenge the historical legacy of much of the lands we reside in.
118


119 2023 SEGD Communication + Place
Werk It team, Kiosk and seating in Washington Square Park, Interactive app for storytelling in Manuel Plaza.


120
Now Motions Team, AR experience in Manuel Plaza.
US Viewers, interactive Kiosk in Washington Square Park, and streetgraphics system for wayfinding.
Furthering such Black racialized spaces raises such questions: What if the English had not taken over the colony and withdrawn the rights of Black land ownership? Would this community have survived? The same could be said of Seneca Village, located on the site of Central Park. Further questions arise, such as whether one views the “Land of the Blacks,” as a case of eminent domain or simply using laws to steal land from its rightful owners. Like architects, designers and landscape designers must begin reimagining such spaces and what they would be like if these Africans had not been displaced or culturally erased. For me, such projects allow designers to unlearn to learn, give voice to the unheard, and make the invisible —visible. At the same time, it taps into the soul of my ancestors through storytelling as we “Say their Names. SAY MY NAME.”
Domainator culture has tried to keep us all afraid, to make us choose safety instead of risk, sameness instead of diversity. Moving through that fear, finding and what connect us, reveling in our difference; this the process that brings us closer, that gives us a world of shared values, of meaningful community— bell hooks
Resources
1. Black Landscapes Matter, edited by Walter Hood and Grace Mitchell Tada, University Of Virginia Press, 2020
2. Walter Hood Urban Diaries, 02 Landmarks, edited by Leah Lery, Spacemaker Press, 1997
3. 14 Biophilia Patterns of Design by Terrapin Bright Green
4. BlackSpace Manifesto by Black Space Urban Collective
5. What Can a Body Do? How We Meet the Built World by Sara Hendren, an imprint of Penguin Random House, 2020
6. Towards and Urban Ecology: SCAPE/ Landscape Architecture by Kate Orff
7. Land of the Blacks Early Settlements, NYPL
8. “North America’s First Freed Black Settlement Right in our Neighborhood,” Sarah Bean ApMann, Village Preservation Blog, February 16, 2018
https://www.villagepreservation.org/2018/02/16/northamericas-first-freed-black-settlement-right-in-ourneighborhood/
9. Black Space Urbanist Collective; https://blackspace. org/
10. BlackSpace Manifesto https://blackspace.wpengine. com/wp-content/uploads/2022/09/BlackSpaceManifesto.pdf
11. Black Gotham Experience, Kamu Ware; https:// blackgotham.com/
12. Manuel Plaza, https://www.nycgovparks.org/ parks/manuel-plaza?mc_cid=db28d88c04&mc_ eid=ad2517fc66
13. History of Manuel Plaza, https://www.nycgovparks. org/parks/manuel-plaza/history
14. Civil Rights and Social Justice Map, https://www.google.com/maps/d/u/0/ viewer?mid=1NN8Q-GXFGJiZZqDNBm9hxTMG m7E&shorturl=1&ll=40.733610800000044%2C74.00148699999998&z=15
121 2023 SEGD Communication + Place
Wow Moments
A methodology for measuring the experiential impact of exhibition design
Tim McNeil, MFA / Professor,
UC Davis Department of Design
Abstract
Today’s multimodal, participatory exhibitions and attractions are bound by a desire to convey information, excite the viewer, and create social and narrative experiences. The earliest exhibitions were driven by spectacle utilizing the visual impact of objects and artifacts. The 20th century witnessed the professionalization of the exhibition field with a goal to educate, interpret and explain as curators, administrators, and experts devalued spectacle in favor of content.
Advances in technology and new media, the shared, gig, and attention-economy where breadth wins over depth, talented and persuasive design firms, generational change, and a desire for entertainment and instantaneous satisfaction/gratification has ushered in a renewed appreciation for visual experiences. Design is key to this transformation. Without design at the helm and employed effectively experiential moments would fail to become lasting memories that inform and inspire an ever increasingly sophisticated audience.
This paper presents a pattern of design practice— a series of reoccurring design tropes (you could also call them principles, or conventions), overlooked, and taken for granted in the exhibition design process. Exhibition design employs these tropes within an ever evolving and transdisciplinary field to inform a range of experiences. When assessed, these tropes can be used as a methodology for measuring the impact of “experiences” on a broad range of exhibition venues and spaces. The premise of this paper is to prove that despite rapid advances in technology, the original methods used to shape the design of exhibition and experience environments laid the foundations for the dynamic devices of display we encounter today, and that when reverse engineered, each method/principle becomes an evaluation tool to measure an expanding array of experiences.
122
Nothing is New
Having visited multiple exhibition environments in various parts of the world I recognized a pattern of design practice—a series of reoccurring design tropes (you could also call them principles, or conventions), overlooked, and taken for granted in the exhibition design process. These design conventions go back to the formative years of exhibition and experience making and employ many of the same tools and techniques. Collectively, they chart a methodology for understanding exhibition design, the trajectory of exhibition development and making, and introduce design theory, techniques, and tools used to deliver successful exhibition-based experiences. I have validated this methodology successfully as a pedagogical framework in the classroom and during visits to exhibition spaces to witness the tropes in various degrees of application.
This methodology can be used to assess, evaluate, and measure the impact of a multitude of experiences, and has the potential to enrich related disciplines such as architecture, graphic design, fashion design, product design and more. This is particularly germane to the rapidly expanding metaverse and fields of user interface (UI)/user experience (UX) design, that create virtual exhibition and experience spaces in which elements are digitally rendered rather than physically built and allow for remote engagement. Indeed, the virtual worlds we find in gaming, augmented reality (AR), virtual reality (VR), and mixed reality (MR) applications employ— and thus can be enriched by—the same methods that help us to better understand the success of designed experiences in physical spaces.
Professional Exhibition Design Practice: A Brief History
The accompanying timeline visualizes the origins of people-centered experiences. The chart presents a cyclical synopsis of notable exhibition and experience design events with a focus on the last 100 years. Radiating out from the center, the role of the designer and their impact, raises questions about when design was consciously commissioned to elevate the aesthetic quality, audience engagement, and standards of exhibition making. This timeline is helpful for understanding the context for each of the design tropes.
Exhibition makers tend to have a short memory span since the notion of exhibitions as places of entertainment
and interaction is nothing new.1 Large department stores of the late 1900s, World’s Fairs, and eventually museums were developed to leverage commerce, entertainment, and culture resulting in the design of popular displays and interpretive experiences. Their merchandising principle called for attractive displays, careful selection and arrangement of objects, and the facilitation of visitor movement.2
Professional exhibition design practice can be traced to the German Bauhaus School and its’ founding in the 1920s. Serving to unite art, craft, and industrial design, the Bauhaus was influenced by the preceding European Arts and Crafts Movements. The Bauhaus professors and their students designed experimental “set-like” environments that were purposefully interdisciplinary combining architecture, visual communication, and theater. László Moholy-Nagy introduced “Display, Exhibition, and Stage” to the New Bauhaus curriculum in Chicago (1937). The Bauhaus model offers a successful but increasingly outdated base for contemporary design education, but it is around this time formal exhibition design practice begins.
Contemporary practice
For such a young discipline, formal exhibition design practice has been through a remarkable transformation responding to societal changes, industry, commerce, entertainment trends, design thinking, tools, technology, and shifting economic models. Museums and attractions now compete with participatory and placemaking experiences and likewise exhibition and experience makers come from a variety of disciplines and creative backgrounds. Evolving from a solitary form in the first half of the 20th century to collaborative and interdisciplinary in the post-war years, exhibition and experience design practice in the mid-late 20th century is defined by the formation of inhouse and multidisciplinary teams that include people from a variety of backgrounds to shape content as well as form. Teams of exhibition researchers, developers, interpreters, and designers blurred disciplinary boundaries and cross-pollinated. This flattened exhibit team structure was collaborative and coalesced as a group to deliver effective narrative, audience, and client-centric experiences.
With expanding opportunities, greater diversity, and increased audience engagement and authorship, the conventional client-to-designer, concept-to-
123 2023 SEGD Communication + Place
implementation design process is a model seeming less relevant. This paper proposes an approach to exhibition making that learns from the success and failures of historical precedence, and argues for a revised methodology, one that can effectively guide the design of any type of exhibition, attraction, or experience environment regardless of its content, message, size, or budget.
Methods of Evaluation
Today’s multi-modal, participatory exhibitions and attractions are bound by a desire to convey information, excite the viewer, and create social and narrative experiences. But when was design employed effectively to create these experiences? Afterall, good design engages visitors, making them ready and willing to experience more. 3 Formal and informal feedback mechanisms (front-end; formative; remedial; summative evaluation) are commonplace, however, few contemporary frameworks exist for critically evaluating the effectiveness of exhibition design and the corresponding quality of an audience’s experience.
Designer’s Toolbox: Timeline
Experiences permeate commercial, entertainment, cultural, and civic environments and reflect changes in society, taste, and technology, and the rise of the shared and participatory economy. Take a spin around the designer’s toolbox to discover notable experiential events, and when design was consciously formalized, recognized, and commissioned to elevate standards of exhibition making. Illustration:
Judy Rand’s Visitor’s Bill of Rights (1996) is a touchstone for the design of experiences. While originally intended for museums it is applicable to every experience-making sector from the click of a mouse to one stomach-churning ride. Focusing on the whole person, it considers physical, intellectual, emotional, social, and cultural needs from an audience’s perspective. Rand encouraged designers to use it as a standard, a set of visitor-centered goals that offers a why and what but does not dictate how—that is up to the designer’s creativity.4 Acknowledging the continued focus on diversity, equity, and inclusion, Rand’s “call to action” remains remarkably present and relevant.
Ronald Mace and design researchers at North Carolina State University (The Center for Universal Design, 1997) advocated for all people with diverse abilities regardless of their age, size, ability, or disability. Their Universal Design Principles apply to people-centered exhibition and experience environments.5 The seven principles include equitable use, flexibility in use, design that is simple and intuitive, perceptible, and understandable information, a tolerance for error that minimizes hazards, adverse consequences, accidental or unintended actions,
1817Skylightsandceilingalcoves,DulwichPictureGallery
1841P.T.Barnum’sAmericanMuseumopens 1822Dioramatheater,Paris
Earlythemedentertainmentpark,TivoliGardens,Copenhagen
PittRiversMuseumfounded,UniversityofOxford 1852Moderndepartmentstoredisplays,MarshallField’s,Chicago 1843
MuseumParalympic&OlympicU.S.accessibility,arttheofState
Plywoodusedforconstructiononanindustrialscale
Firstmodernamusementpark,ConeyIsland
Largescalepopupexhibitionstructures,CrystalPalace,London
1953
1955
SeoulKorea,ofMuseumNationalGalleries,Digital
1955
all,forDesignHumanBeingLondonTrust,Wellcome,
projection,Cutting-edgeMasterpieceaExperienceLeonardo:LondonGalleryNational,
QatarofMuseumNationalcontext,historicalversusContemporary
layers,GraphicWorldtheinBibletheofImpactD.C.Washington,,
museumsSmithsonianatquestionsvisitor’sanswers“Pepper”robotHumanoid 2018LondonBuildingBloombergMithras,ofTempletime,infillsprojectionLight 2017FranciscoSanindebutsFactoryColorandCreamIceofMuseumtime,Selfie 2016MuseumNationalEstonianlabels,objectDynamic 2015RotterdamInstituut,NieuweHetmuseum,fashionPopup 2015Shanghai(NECC),CenterConventionandExhibitionNationalspace,Flexible 2014StirlingCenter,VisitorBannockburnofBattleplay,Role 2014YorkNewMuseum,DesignSmithsonianHewitt,Cooperdiorama,digitalImmersive 20142.0,cubeWhite tranquilocaminabacírculoEl AiresBuenosdeModernoArtedeMuseo, 2013second,exhibitionfirst,spaceDiscursive ConflictoriumAhmedabad, 2013post-visittoPreimmersion, IsBowieDavidMuseumV&A, 2012LondonTour,StudioBros.WarnerPotter,HarryofMakingmoments,“Wow” 2012Interactive graphics,interpretive OneGalleryArtofMuseumCleveland, 2011cars,ofwallSalon-style Riverside Museum, Glasgow 2010firsttheoflaunchtablets,Mobile iPadgeneration 2008 Artist collective Meow Wolf firstcreates installation 2008 GoghVan VRimmersive experiences begin tourinternational 2007 andImmersive interactive film, Secret Cinema 2005 Nested information graphics, Churchill Museum, London 2002 Dynamic graphics, Sparking Reactions Sellafield,, Cumbria 2001 Interdisciplinary creative group teamLab founded 2000 PlayZone advances interaction, Millenium Dome, London 2000 Engagement of senses, Guinness Storehouse, Dublin 2000s Paint manufacturers market lower-VOC coatings
1959
1960s
FestivalofBritainlaunchescareerexhibitiondesigners
1968
1963
1969Pepper’sghostusedin
1961FirstiterationoftracklightinginventedbyLightolier
PogowallsdesignedtopopupatYaleUniversityArtGallery 1951
Disneylandopens,Anaheim,California
1955SmithsonianO ceofExhibitsCentralestablished
Groundbreakingphotographyexhibition,TheFamilyofMan,MoMA
1964Multi-projection,InformationMachine ,NewYorkWorld’sFair
1967Labyrinthof“wow”moments,U.S.Pavilion,MontrealExpo
1970U.S.NationalParkServiceHarpersFerryCenterfounded 1969People-centered,OaklandMuseumofCalifornia 1969Learningbydoing, ExploratoriumandOntarioScienceMuseum
1964LifelikeAudio-AnimatronicfigureAbrahamLincoln,NewYorkWorld’sFair
LinaBoBardirethinksdisplayfurniture,MuseudeArtedeSãoPaulo,Brazil
1962Revolutionaryhands-onlearningmodel,BostonChildren’sMuseum
printing 1986 Burning Man festival founded 1985 New themed open-air exhibits, San Diego Zoo 1984 Multisensory experience, JORVIK Viking Center, York 1984 Mission driven design, Monterey Bay Aquarium Mid-1980s Desktop publishing transforms graphics production 1982 Touchscreen/video disk, Knoxville World’s Fair, Tennessee 1981 National Association of Museum Exhibitions (NAME) founded 1980s First high resolution LCD projectors 1979 Unconventional historic house, Dennis Severs House, London 1976 IMAX film, National Air and Space Museum, Washington, D.C. 1975 First laser cutting systems commercially available 1973 Societyfor Experiential Graphic Design (SEGD) founded 1972 Precedentsetforthe blockbuster exhibition, KingTut,British Museum 1972 LCDflat screens become available 1972 Graphics-driven, StoryoftheEarth ,Geological Museum, London 1970s Inkjetprintingandcutvinyl lettering available 1970Multisensoryand immersive experience,Pepsi Pavilion,OsakaExpo,Japan
MDFparticleboarddevelopedbasedonthedesignofhardboard
Firstblockbusterexhibition,MonaLisavisitsWashington,D.C.andNewYork
Rampswithbreakoutexhibits,GuggenheimMuseum,NewYork
1961Didacticexhibitions,Mathematica,CAMuseumofScienceandIndustry
Disneyland’sHauntedMansion
100 Years of Designer-driven Experiences
124
1946Popupandmodularexhibitmaking,BritainCanMakeItandEnterpriseScotland 1946FirstlistedexhibitiondesignerAustinFrazer,DesignResearchUnit(DRU) 1943Immersivespheres,room-within-a-room,AirwaystoPeace, MoMA 1942 Suspending art, removing frames and pedestals, Art of This Century, New York 1939 Herbert Bayer’s Fundamentals of Exhibition Design 1939 Futurama’s mechanical diorama, New York World’s Fair 1938 Early streetscape diorama, Kirkgate, York Castle Museum 1938 Duchamp’s sensory interventions, Exposition Internationale du Surréalisme 1937 Science learning, Palais de la Découverte, Paris 1937 Exhibition design included in New Bauhaus curriculum, Chicago 1936 White cube technique, Cubism and Abstract Art MoMA 1929 Herbert Bayer’s Field of Vision diagram, Deutscher Werkbund Exposition 1927 Lily Reich’s flexible exhibition walls, Velvet and Silk Café 1926 El Lissitzky’s super-graphic structures, Pressa Exhibition 1925 Frederick Kiesler’s modular, self-supporting T-type and L-type structures 1924 First supergraphics, Gesellschafts- und Wirtschaftsmuseum, Vienna 1919-1933 Bauhaus School integrates architecture, visual communication, theater 1911 Commercialscreenprintingindustrybegins1906American Alliance of Museums founded 1906Firstinteractivesciencemuseumopens,DeutschesMuseum 1893Amusementparkdisplaysandcarnival-typeatmosphere,ChicagoExposition 1891Earlyopen-air/Livinghistorymuseum,Skansen,Stockholm 1889Firsthabitatdiorama,MilwaukeePublicMuseum 1889Firstchildren’smuseumopensinBrooklyn 1875
1851
1850s
1884
2020
2020
2019
2019
2019
2019
2018
1999 Pine and
1998 Community
Te
New
1998 Habitat Wall, American Museum of Natural History 1997 Universal Design Principles Mid-1990s Guidelines for Accessible Exhibition Design 1994 LED light fixtures commercially available 1993 Tower of Faces, U.S. Holocaust Memorial Museum 1991 Micro Gallery, National Gallery London 1991 Themed Entertainment Association (TEA) founded 1990 Accessible design standards (ADA) 1988 Deception/illusion, Museum of Jurassic Technology 1987 First commercial stereolithographic 3D
Gilmore’s book The Experience Economy
building,
Papa Tongarewa,
Zealand
Julie
Kai
Ebens. © Timothy J. McNeil
Eleanor Bemis,
Daseking,
Sase
Timeline entries correspond to examples cited in the book chapters
Charting the history of exhibition design - 100 years of designer-driven experiences
“I recognized a pattern of design practice— a series of reoccurring design tropes, overlooked, and taken for granted in the exhibition design process.”
design that requires low physical effort with a minimum of fatigue, and design that accommodates body size, posture, or mobility. While not established as a set of evaluation tools the principles constitute a form of assessment.
Beverly Serrell’s framework for assessing excellence in exhibitions Judging Exhibitions (2006) consists of four visitor driven criteria: Comfortable; Engaging; Reinforcing; and Meaningful. The judges use the framework during an exhibit visit and write specific notes about their reactions to the designed environment. The framework needs more design language and to be less education/ curatorial focused—it addresses experiences but not aesthetics—these are harder to define because they are often subjective—the two are really interrelated. Aesthetics are an unspoken element in every designed environment—they carry the intent and meaning—leave an impression even if we can’t articulate it.6
Patterns of Practice
The methodology this paper presents aligns with these existing evaluation methods. However, it also has the potential to serve and improve a wealth of other creative industries and disciplines. Experience design has evolved into an umbrella term that accommodates an expanding menu of sub-disciplines. Interaction, virtual reality, and artificial intelligence infiltrate and vie to overshadow the design practice of placemaking, environmental, architectural, product, theater, and visual merchandising. These sub-disciplines constitute and combine into exhibition design—the mother of transdisciplinary practice.
Designer’s Toolbox
As mentioned, this evaluation method is based on a set of 12 reoccurring design tropes collectively grouped into the Designer’s Toolbox. This methodology advocates
for incorporating these patterns of practice at some level into the design of every exhibition and experience regardless of its content or venue.
1. People: The designer’s responsibility during the design development process to understand audiences, and cultivate welcoming environments to interpret content in an informative and accessible manner.
2. Narrative: The designer’s role to organize and spatialize experiential narratives, and develop engaging methods to structure, sequence, and bring to life exhibition stories.
3. Journey: The designer’s contribution to market the pre, during, and post experience, and craft comprehensive solutions that shape an entire visual message and identity.
4. Form: The designer’s skill to sculpt the exhibition experience from a multitude of pop-up forms and build modular and memorable interventions made from a range of materials.
5. Spectacle: The designer’s impulse to include “wow moments” to trigger people’s behavioral responses using scale, color, lighting, and placement to illicit emotive reactions.
6. Atmosphere: The designer’s duty to move “beyond the white cube” and create environments that combine multisensory qualities that react to origins of the material being presented.
7. Staging: The designer’s knowledge of compositional theory and field of vision principles to add visual variety and captivating arrangements to engage people in experiences.
125 2023 SEGD Communication + Place

8. Constraints: The designer’s obligation to recognize and work within limitations to create economical and practical applications for safe, object, and peoplecentered environments.
9. Immersion: The designer’s desire to create “wraparound worlds” using technological tools to indulge people’s innate desire for escapism and alternative realities.
10. Wonder: The designer’s inclination to experiment with “smoke and mirrors” techniques that deploy illusion and magic to surprise and then transform people’s experiential encounters.
11. Communication: The designer’s instinctive urge for simple, understandable information that brings visual clarity, cohesion, and consistency to exhibition graphics.
12. Learning: The designer’s proclivity for experiencing through doing, resulting in a range of passive to interactive modalities to inform, engage, and educate diverse communities.


Scoring Experiences
The next generation of exhibition and experience designers are defined by their ability to adapt, their ethics and advocacy for social justice and the environment, and their questioning of content, purpose, audiences, outcomes, and the impact of their work. All these facets mean taking risks and embracing failure as much as success. There is much at stake, and we will not accomplish this journey without feeling comfortable with testing, and the associated trial and error.
Taking the time to observe and talk with exhibit audiences, evaluate what works and what does not, and then reflect on the teams’ accomplishments is a vital component of the design ideation process. The reoccurring tropes covered in this paper constitute a methodology for evaluating exhibitions and experiential design. Employ all 12 as a tool to measure the multimodality of the design response and the engagement level of experience whether it is a museum, tradeshow, attraction, retail space, or festival.
The associated SCORECARD was developed in response to the tropes and to document the experiential quality of exhibition environments. Participants are asked to enter


126
Toolbox: People visitor studies and audience engagement inclusive and accessible design solutions behaviors, expectations, and abilities. toolbox and welcome multiple audiences study for three minutes or three hours. designer based in Sacramento and the San Francisco Bay Area, U.S.A. San Francisco Bay Area photographer People Narrative Journey Designer’s Toolbox: People Designers familiar with visitor studies and audience engagement methods advocate for inclusive and accessible design solutions that anticipate people’s behaviors, expectations, and abilities. Dive into the designer’s toolbox and welcome multiple audiences whether they stop or study for three minutes or three hours. Illustration: Zoey Ward is an emerging exhibition designer based in Sacramento and the San Francisco Bay Area, U.S.A. Scale model photography: Rachel McGraw is San Francisco Bay Area photographer Form Spectacle Designer’s Toolbox: People Designers familiar with visitor studies and audience engagement methods advocate for inclusive and accessible design solutions that anticipate people’s behaviors, expectations, and abilities. Dive into the designer’s toolbox and welcome multiple audiences whether they stop or study for three minutes or three hours. Illustration: Zoey Ward is an emerging exhibition designer based in Sacramento and the San Francisco Bay Area, U.S.A. Scale model photography: Rachel McGraw is San Francisco Bay Area photographer Atmosphere Designer’s Toolbox: People Designers familiar with visitor studies and audience engagement methods advocate for inclusive and accessible design solutions that anticipate people’s behaviors, expectations, and abilities. Dive into the designer’s toolbox and welcome multiple audiences whether they stop or study for three minutes or three hours. Scale model photography: Rachel McGraw is San Francisco Bay Area photographer Staging Constraints Immersion Designer’s Toolbox: People Designers familiar with visitor studies and audience engagement methods advocate for inclusive and accessible design solutions that anticipate people’s behaviors, expectations, and abilities. Dive into the designer’s toolbox and welcome multiple audiences whether they stop or study for three minutes or three hours. Illustration: Zoey Ward is an emerging exhibition designer based in Sacramento and the San Francisco Bay Area, U.S.A. Scale model photography: Rachel McGraw a San Francisco Bay Area photographer
Learning
Wonder Communication
Designer’s Toolbox - Twelve exhibition design tropes formatted as a set of experience prompt cards
their name, the title of the venue they are scoring, and then score the experience using 12 questions/prompts.
The SCORECARD is part of an ongoing project to turn the methodology into a practical tool for measuring the effectiveness of exhibition and experience design. It has been tested multiple times within a learning environment with students at the University of California, Davis in a variety of national and international exhibition spaces. What follows is a summary of this exploration and the corresponding iterations of the SCORECARD to improve access, usability, and content structure.
SCORECARD version 1.0 (May 2022)
FORMAT: A printed handout to mark-up in an exhibition. Participants record their scores by marking with a pencil on a zero to ten scale. This scale is reinforced using the prompts “no” to “yes.” This version of the SCORECARD was tested with an undergraduate first-generation seminar class of 12 students who were new to the field of exhibition design and whose knowledge of exhibition/ experience environments was limited or low. The course was called Make an Exhibition and introduced students to the field of exhibition design through a series of hands-on projects culminating in the installation of a small curated and designed exhibition. The group used the SCORECARD to evaluate an exhibition Young, Gifted, and Black at the Jan Shrem and Maria Manetti Shrem Museum of Art.
RESULTS: These skewed towards high scores for “Narrative” and “Learning,” and lower scores for “Atmosphere” and “Spectacle”—not surprising for art exhibition featuring mostly paintings and drawings. Feedback from the class about the design and content of the SCORECARD suggested that the numerical scale (1–10) was too great; the terms needed further definition and revision; and that a digital version of the SCORECARD would be helpful as well as the printed paper version.
SCORECARD version 2.0 (July 2022)
FORMAT: A digital Google survey form available through a personal handheld device (phone). Participants record their scores by selecting the circle on a zero to five scale (1 is low; 5 is high) and scroll through the 12 questions. The scale kept the prompts “no” to “yes.” This version of the SCORECARD was tested with an undergraduate
study abroad program of 32 students who were familiar with the field of exhibition design and whose knowledge of exhibition/experience environments was low to medium. The program Design in Britain introduces students to the field of exhibition design through a series of projects, studio visits, and field trips to nearly 40 exhibition related attractions and museums in England and Scotland. The group used the SCORECARD to evaluate most of these venues during their visit.
RESULTS: These ranged dramatically because of the breadth of venues which included highly narrative based exhibitions to less content heavy immersive experiences. Generally, with practice each participant was able to identify and score all 12 of the questions proving that the tropes were omnipresent at all venues to varying degrees. At the conclusion of the program there were hundreds of completed SCORECARDS. Feedback from the participants about the design and content of this second version of the SCORECARD recommended less venues to score—too many to complete; more indepth orientation to use the SCORECARD; streamlined prompts; a more organized and segmented structure for the SCORECARD survey design into four main categories; and that both a digital and printed version of the SCORECARD was required because some venues did not have Wi-Fi or accessible data, and not everyone has a mobile phone.
SCORECARD version 3.0 (April 2023)
FORMAT: A revised digital Google survey form available through a personal handheld device (phone). Participants record their scores by selecting the circle on a zero to five scale (1 is low; 5 is high) and scrolled through the 12 questions categorized into “Narrative,” “Atmosphere,” “Spectacle,” and “Learning” with questions under each category. The prompts “no” to “yes” were retained. This version of the SCORECARD was tested with an undergraduate senior capstone course of 20 students who were familiar with the field of exhibition design and whose knowledge of exhibition/experience environments was medium to high. The course Narrative Environments introduces students to advanced exhibition design through two client-based in-depth projects and field trips to local museums and attractions. The group used the SCORECARD to score exhibit spaces at the SMUD Museum of Science and Curiosity.
127 2023 SEGD Communication + Place
Exhibition/Experience Design Scorecard
Rate each question from 0–10
Did the exhibition allow for lots of to get something out of it?
Did the shape of the space react or give context to the content presented?
Did the exhibition create a wow moment that stuck with you?
Did the exhibtion graphics help you understand more about what was displayed?
Did the exhibition provide a narrative structure to help make exhibition concepts clearer?
Did the marketing for the exhibition influence your experience before and after your visit?
Did the atmosphere of the space react or give context to the content presented? Were objects on display staged in a way that varied or excited you?
Was there part of the exhibition that provided an immersive experience? Was there part of the exhibition that felt like a magic trick and made you wonder how they did it?
Did the exhibition provide an interactive experience that helped you learn?
Did safety measures to protect the objects detract or enhance your experience?

Add up all your answers for final result:

128
TOTAL SCORE:
0 10 5 (no) (yes) 0 10 5 (no) (yes) 0 10 5 (no) (yes) 0 10 5 (no) (yes) 0 10 5 (no) (yes) 0 10 5 (no) (yes) 0 10 5 (no) (yes) 0 10 5 (no) (yes) 0 10 5 (no) (yes) 0 10 5 (no) (yes) 0 10 5 (no) (yes) 0 10 5 (no) (yes)
/120
NARRATIVE ATMOSPHERE SPECTACLE LEARNING
Various iterations of the SCORECARD from a printed version to online survey forms
RESULTS: Participants commented that the SCORECARD aided their understanding and the design elements contributed to the overall experience—they were surprised to see that all 12 tropes were present and scored highly at the museum, particularly the “Education” category—which makes sense for an interactive science venue. Feedback from the participants about the design and content of the third version of the SCORECARD found the written and in-class contextualization of the SCORECARD very supportive; they asked for more location specificity and to choose and score one exhibit gallery or exhibit only to keep it focused; interestingly, the advanced level of the students meant that the participants questioned the SCORECARD as a viable tool for measuring such a diverse array of experience types—from theme parks to parties—and whether there could be a one-size fits all method of evaluation since some venues will clearly excel in certain categories more than others; and this group agreed that both a digital and printed version of the SCORECARD was required to make it accessible to as many people as possible.
Results and Recommendations
Data from the trope-based methodology and corresponding SCORECARD reinforce the effectiveness of a much-needed historical context for exhibition and experience design—a primer for practice. It offers a revisionist approach to understanding and reflecting on exhibition making by placing contemporary practice on a continuum with historical precedence to argue that nothing is new, just improved with more efficient and enhanced tools. Armed with this deeper, richer depth of understanding enables exhibition development teams to formulate stronger concepts based on best precedence and pitch original ideas more effectively to clients and stakeholders. It is particularly relevant currently as exhibition design is central to the success of the experience and gig economy.
The groups who participated in using the current version of the SCORECARD were able to identify and successfully score all 12 of the questions demonstrating that the tropes were omnipresent to varying degrees at a variety of venues. Through the scoring process, the participants accurately gauged the components that creatively make up exhibition design and attempted to measure what constitutes an experience. I say “attempt” because measuring experiences requires a more robust means of recording people’s emotive reactions, memory,
and psychological impact—the methodology simply helps to frame the experience conversation through the lens of design.
While I believe that all exhibitions and experiences should exemplify the 12 tropes in some shape or form to be deemed effective and successful, I understand that not all will score highly in every category. It would be biased to see a lack of “wow” moments or visitor participation as more credible than an example driven by narrative and constraints— comparing an art museum to a children’s museum—but both can learn from one another and strive to include the spectrum of tropes on the SCORECARD.
The next iteration of the SCORECARD will be launched in July 2023 for the study abroad program Design in Europe. A less is more approach will include specific exhibits and less venues to evaluate and an improved survey interface. My goal is to expand the SCORECARD’s reach to participants in professional design/museum practice and a general audience. Perhaps everyone can keep the SCORECARD nearby next time they participate in the expanding array of experiential encounters and find themselves having a “wow” moment.
Further information
This methodology and associated SCORECARD are derived from The Exhibition and Experience Design Handbook (2023). The publication’s chapters follow the exhibition design process from story development, spatial planning and staging to communication and learning. Each of the 12 reoccurring design tropes form single chapters. Primary case studies—three to a chapter—are organized chronologically and exemplary of an array of commercial, entertainment, cultural, and civic spaces. Other examples reinforce the trope’s conventions over time, origins, context, and theoretical underpinnings.
Notes
The established and accepted history and theory of the exhibitions field is largely seen through a Euro-centric perspective. Important work is just beginning to redress this imbalance. Any case studies or examples I have cited are global and represent a diversity of cultures and voices. Some are lesser known, others canonized, the majority are experiences I have witnessed and feel qualified to talk about.
129 2023 SEGD Communication + Place
Thank you to the students who participated in the surveys and for their willingness to test out the SCORECARD and provide feedback. And to the designers for illustrating the 12 tropes depicted on the experience prompt cards: Kai Sase Ebens, Zoey Ward, Claire Healy, Asma AlDabal, Noor AlKathiri, Sarah AlMaghlouth, Lydia Lee, Siddhartha Das, Roger Escalante Quintero, Evan Yang, Sayaka Koike, JeanPierre Dufresne, John Haden, Leidy Karina Gómez Montoya, and Magnús Elvar Jónsson.
Resources
1. Kathleen McLean, Planning for People in Museum Exhibitions, 5. repr (Washington, DC: Association of Science-Technology Centers, 2009), x.
2. Michael Steven Shapiro and Louis Ward Kemp, eds., The Museum: A Reference Guide (New York: Greenwood Press, 1990), 202.
3. Beverly Serrell, Judging Exhibitions: A Framework for Assessing Excellence (Walnut Creek, Calif: Left Coast, 2006), 30–33.
4. Judy Rand, “The 227-Mile Museum, or Why We Need a Visitor’s Bill of Rights,” Visitor Studies: Theory, Research and Practice 9 (1997): 21.
5. “The 7 Principles | Centre for Excellence in Universal Design,” accessed April 15, 2022, https://universaldesign. ie/what-is-universal-design/the-7-principles/
6. Beverly Serrell, Judging Exhibitions: A Framework for Assessing Excellence (Walnut Creek, Calif: Left Coast, 2006). 89.
130
131 2023 SEGD Communication + Place

© 2023 Society For Experiential Graphic Design 1701 Rhode Island Avenue NW Office 3-132 Washington, DC 20036 segd@segd.org
