Approaching the inner city Sydney suburb of Darlinghurst as an exercise on generative design in urban planning.
This project takes on three simple, rational design objectives:
1. Maximise Sunlight on Green Spaces
2. Maximise Building Density
3. Optimise Green Space to Building Ratio
SIMULATION CONSTRUCTION
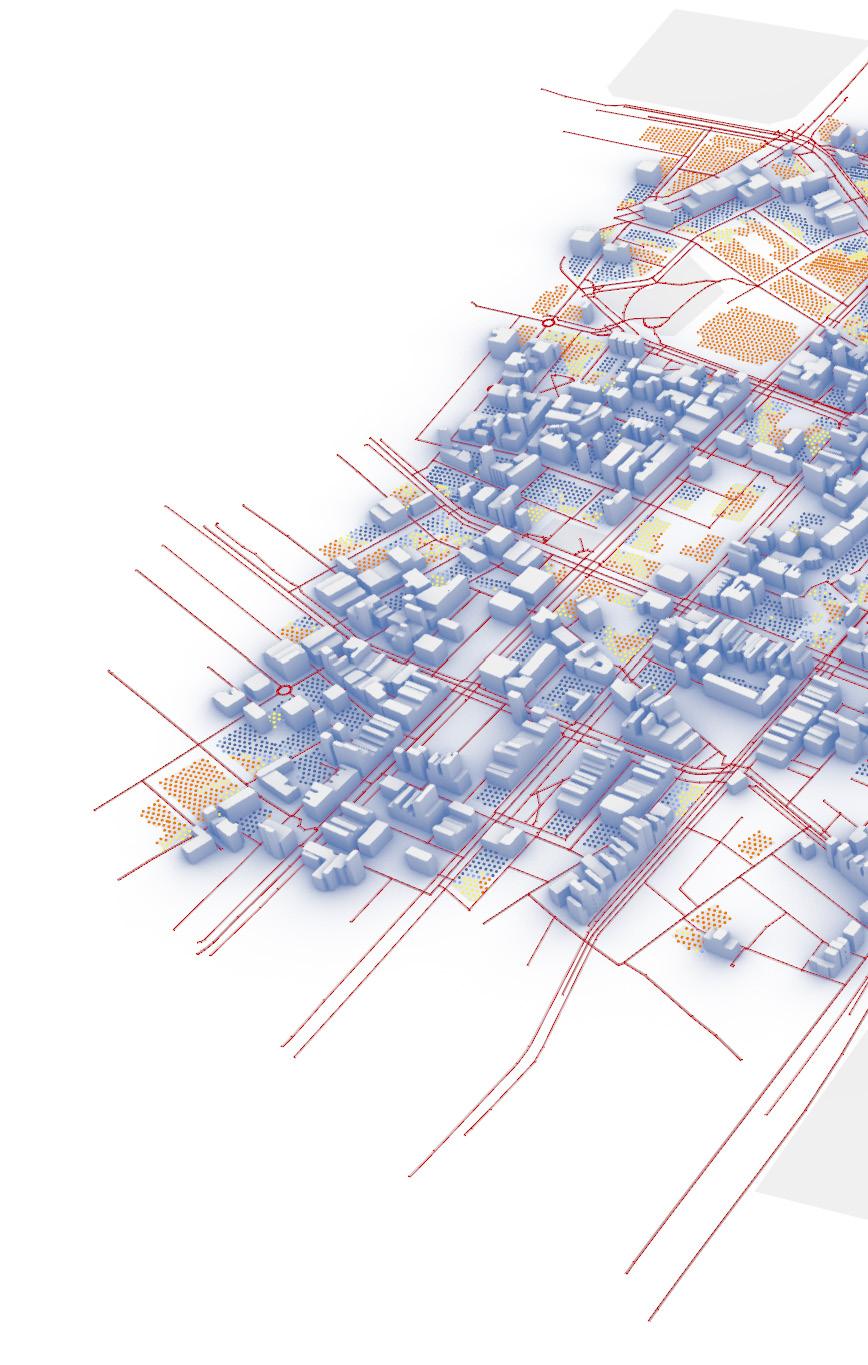
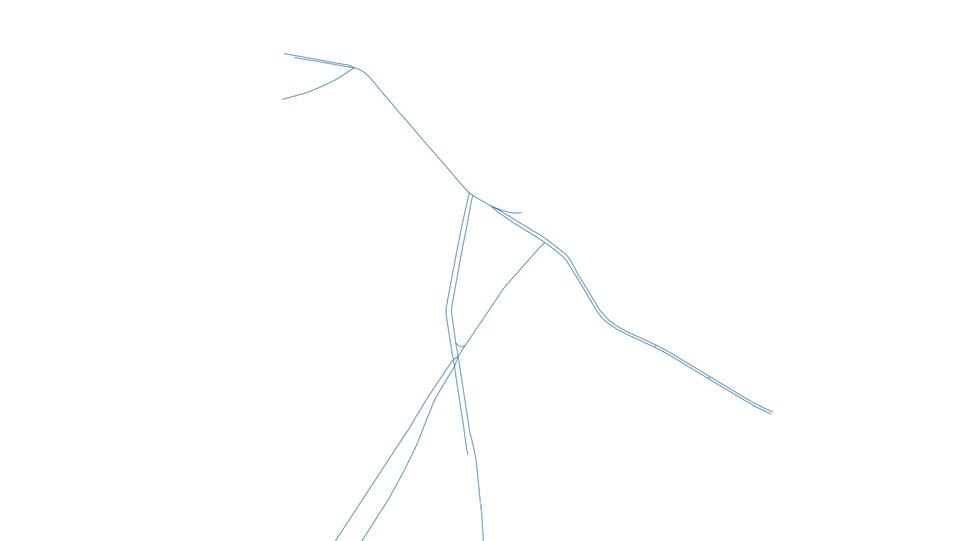
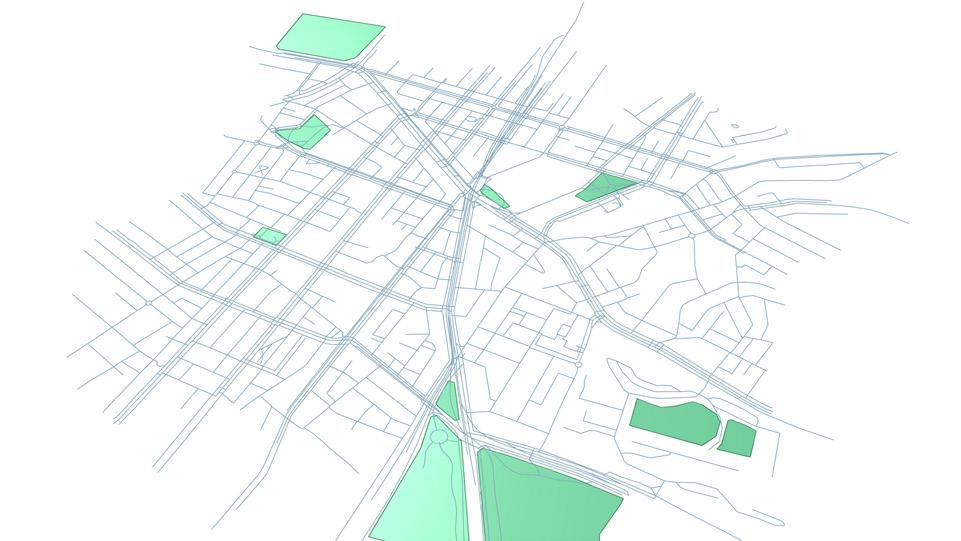
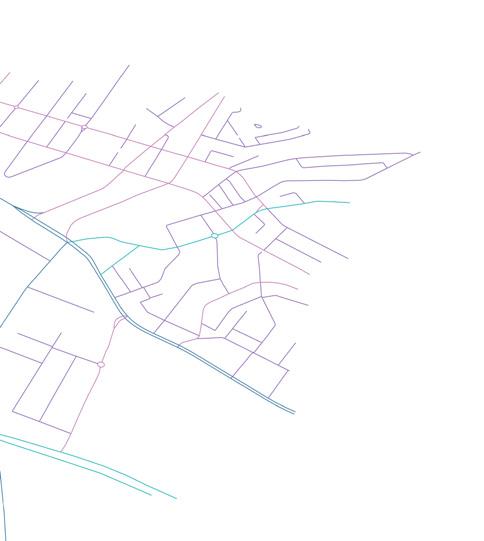
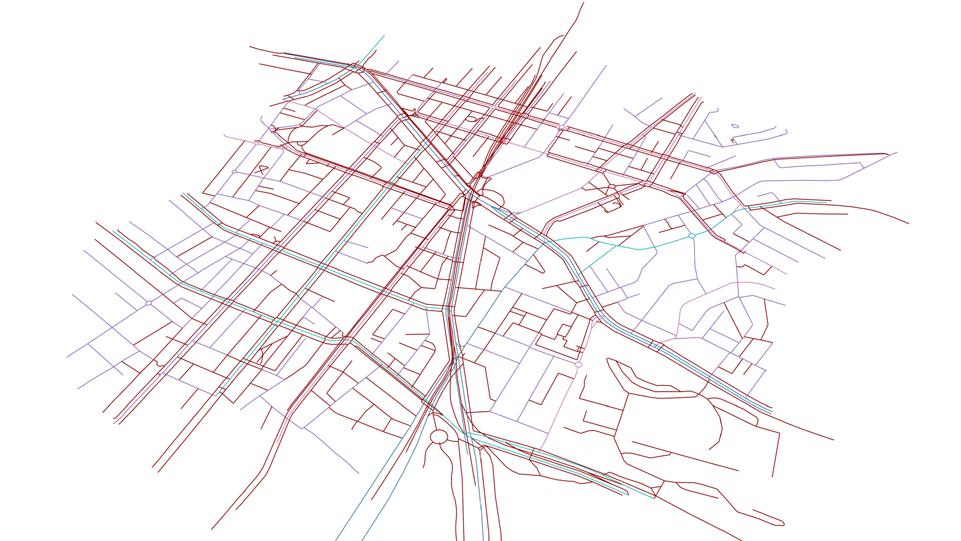
[01] Major Road Generation:
Main circulation roads are established from OSM data along South Dowling Street + Oxford Street
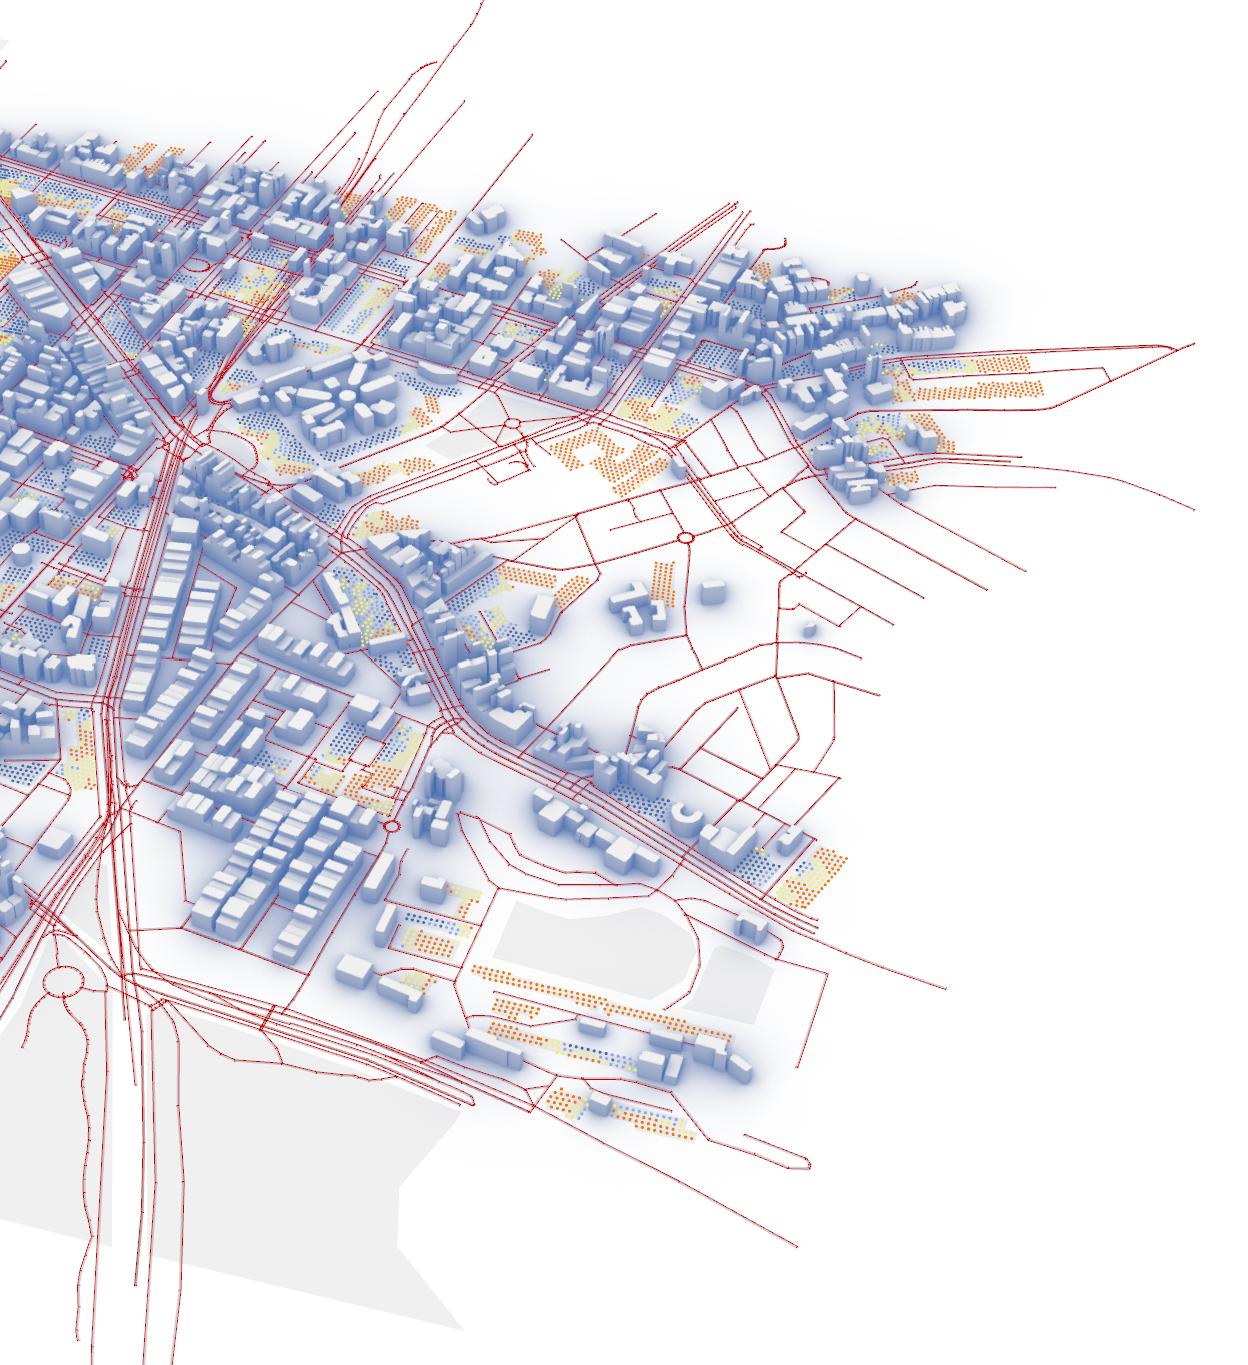
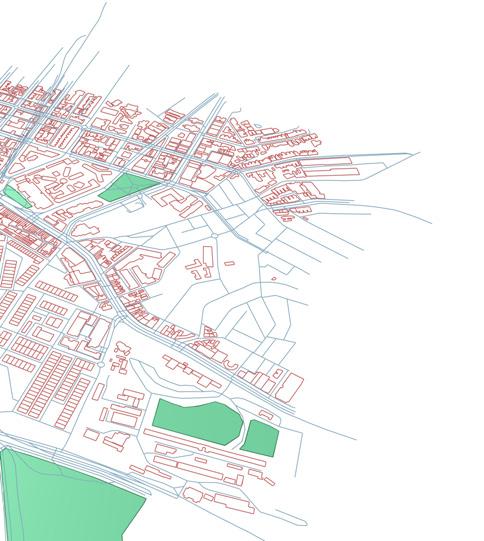
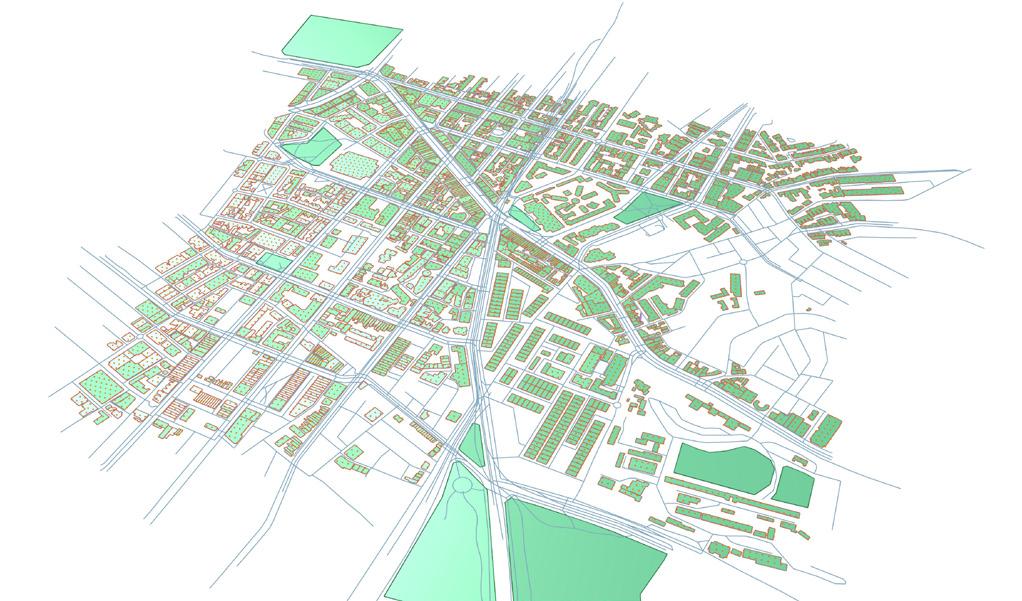
[04] Existing Green Space Generation:
Existing Green Spaces are established from OSM data, with major spaces being Moore Park and southern Hyde Park
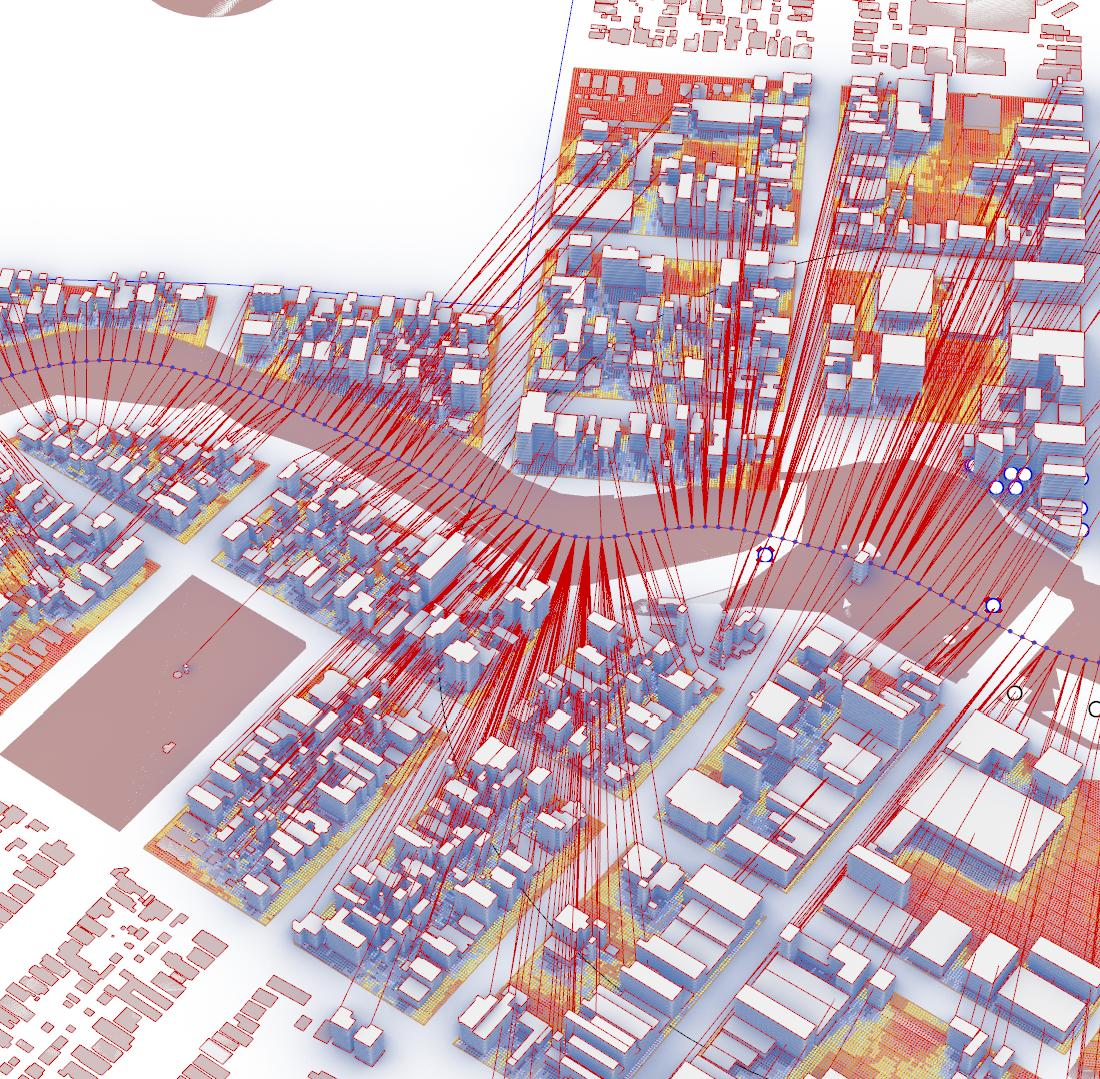
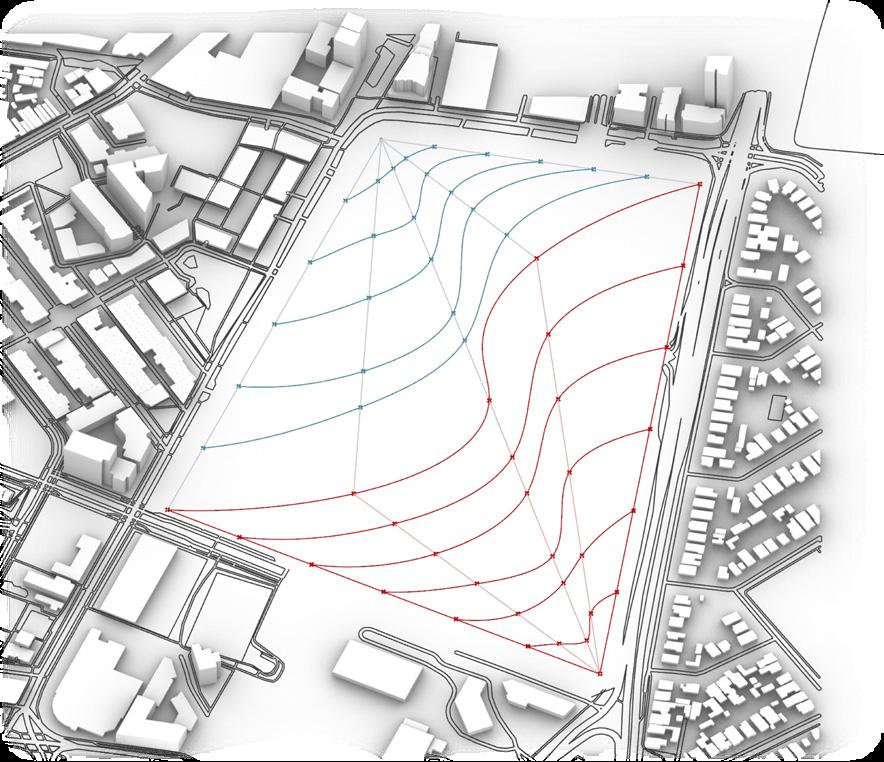
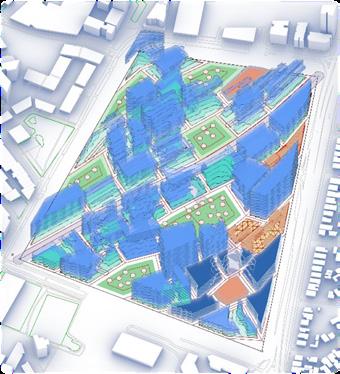
[07] Objective 1: Maximise Green space Sunlight
The evolutionary engine seeks to maximise sunlight on Green spaces using vector rays on analysis points
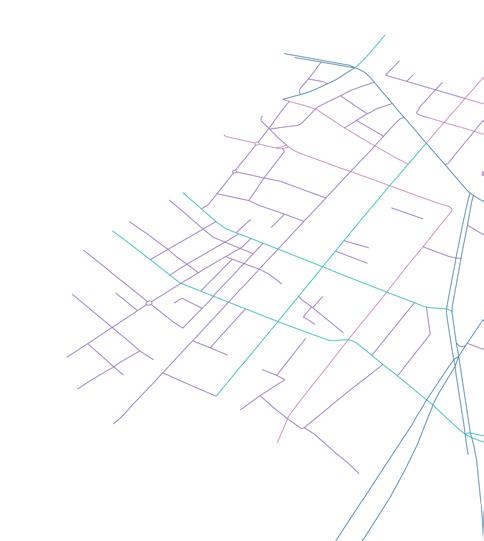
[02] Minor Road Generation:
Secondary circulation roads are established defining block and residential streets
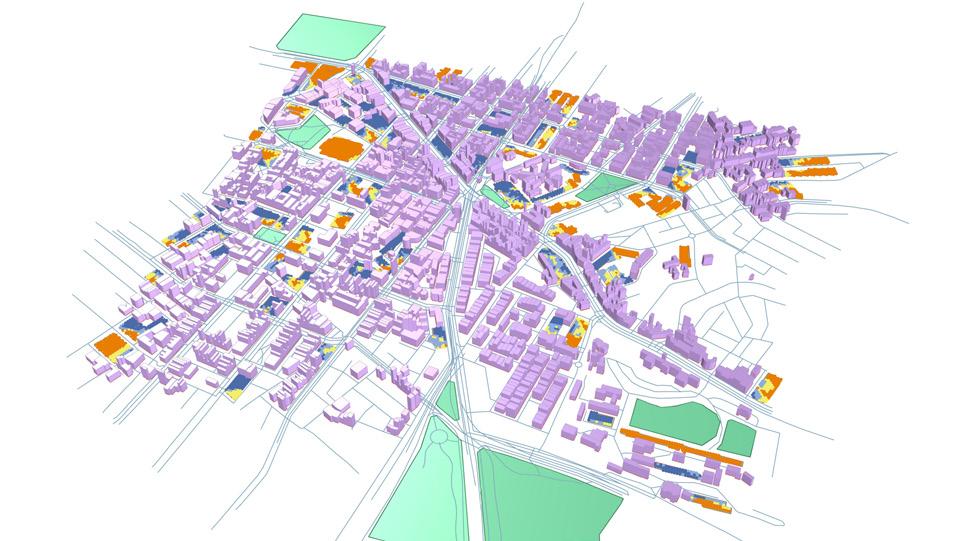
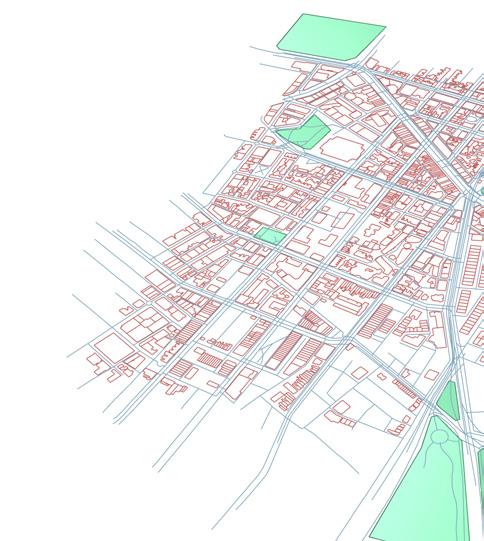
[05] Existing Plot Generation:
Existing building plots established used to define new green spaces
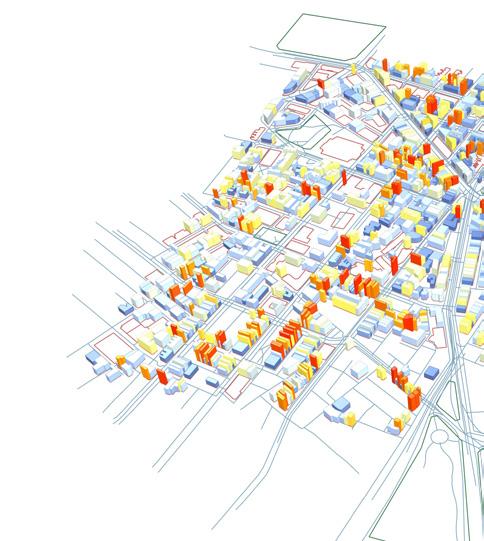
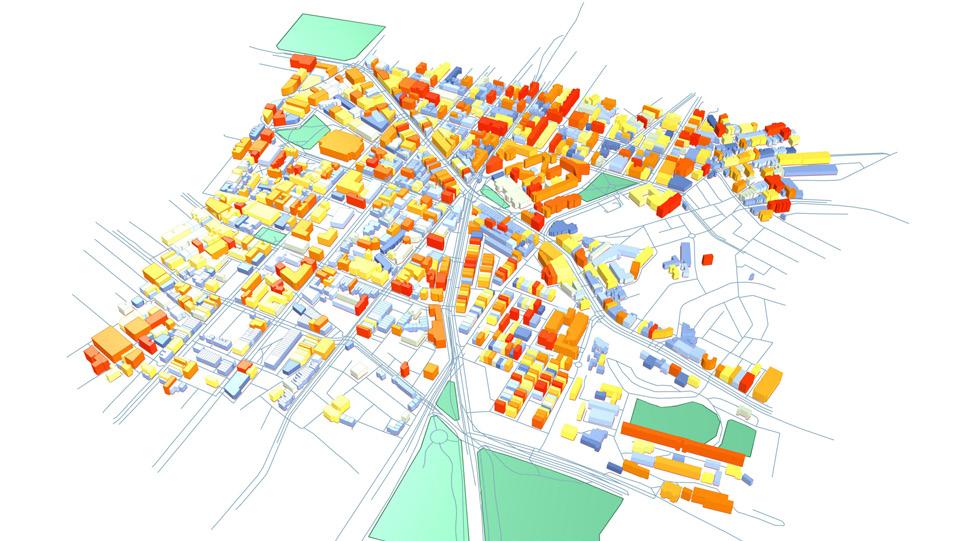
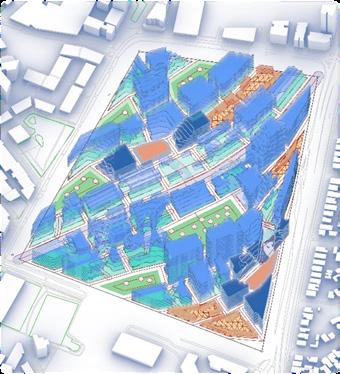
[08] Objective 2: Maximise Building
The evolutionary engine seeks to buildings by increasing building heights
established from OSM data, streets
established from OSM data, these will be and establish building heights
Building Density
maximise the density of heights
[03] Residential Network Generation:
Residential side streets are established from OSM data, these laneways being a signature of Darlinghurst’s character
[06] Evolutionary Engine Paramaters:
Data is linked to paramater controls to change building densities and establish new green spaces as per the design objectives
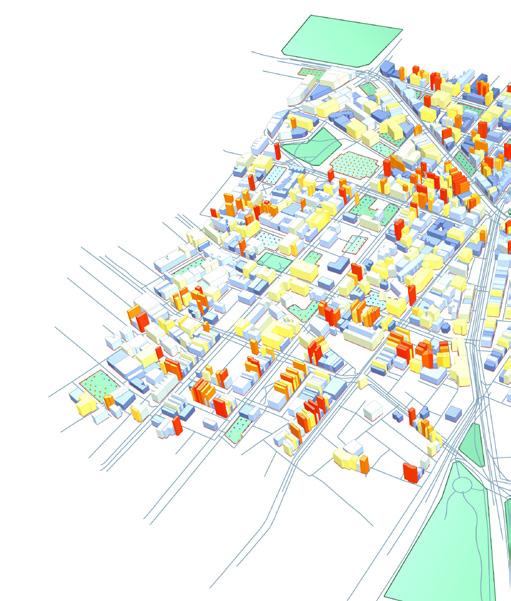
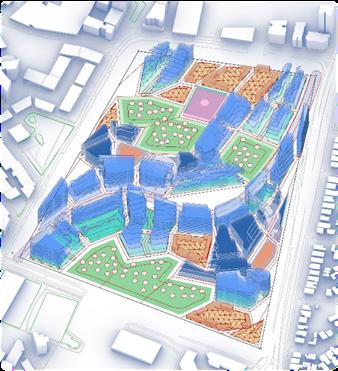
[09] Objective 3: Optimise Green space to Building Ratio
Seeks to reach an optimal balance of 10 : 1 building floor space to green space ratio by establishing new green space plots.
SIMULATION RESULTS + ANALYSIS
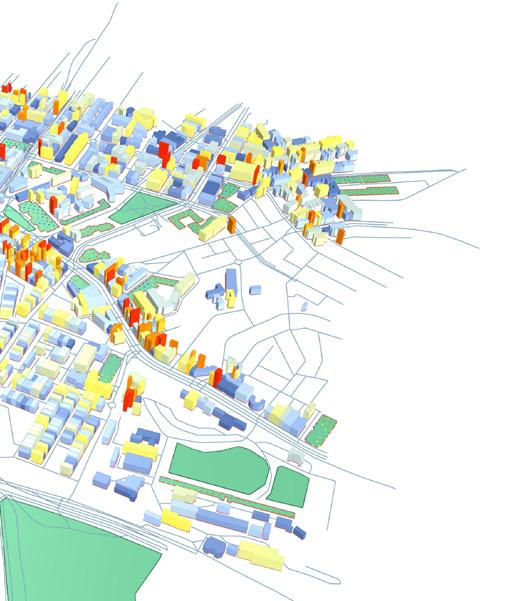
[01] Objective 1 Best Performing Solution:
The best performing solution in the maximising green space objective sought to convert all existing building plots to green space. While this objective may seem unusable it becomes a key tool in analysing the perfromance of more balanced solutions by being such an extreme outlier to measure against
[02] Objective 2 Best Performing
The best performing solution in the objective saw minimal increases in green creating increased density in clusters Oxford Street and throughout Bourke
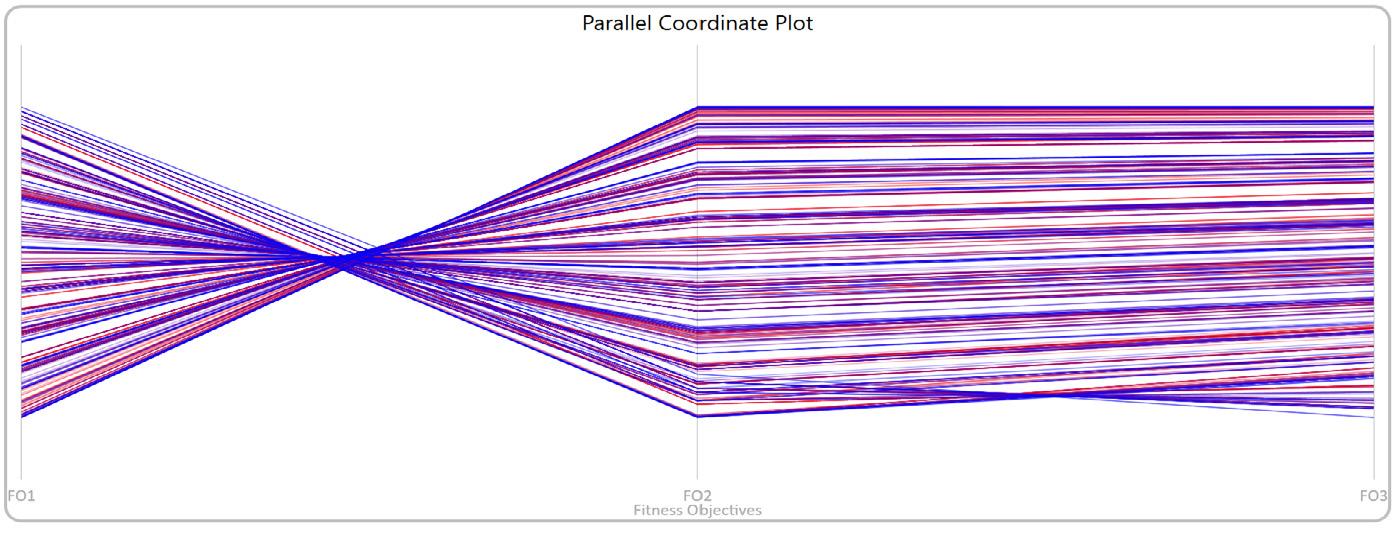
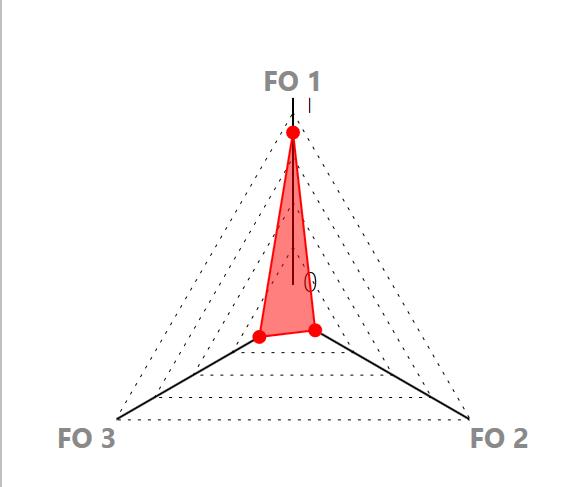
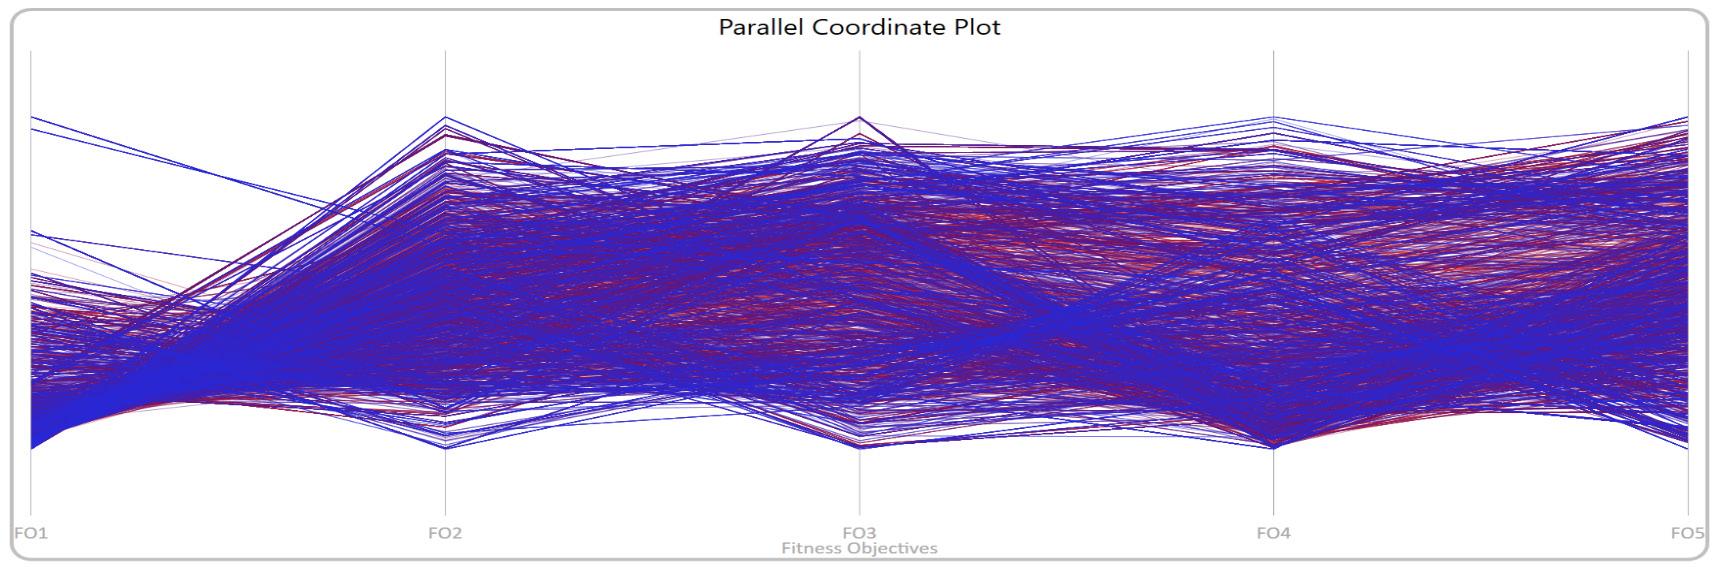
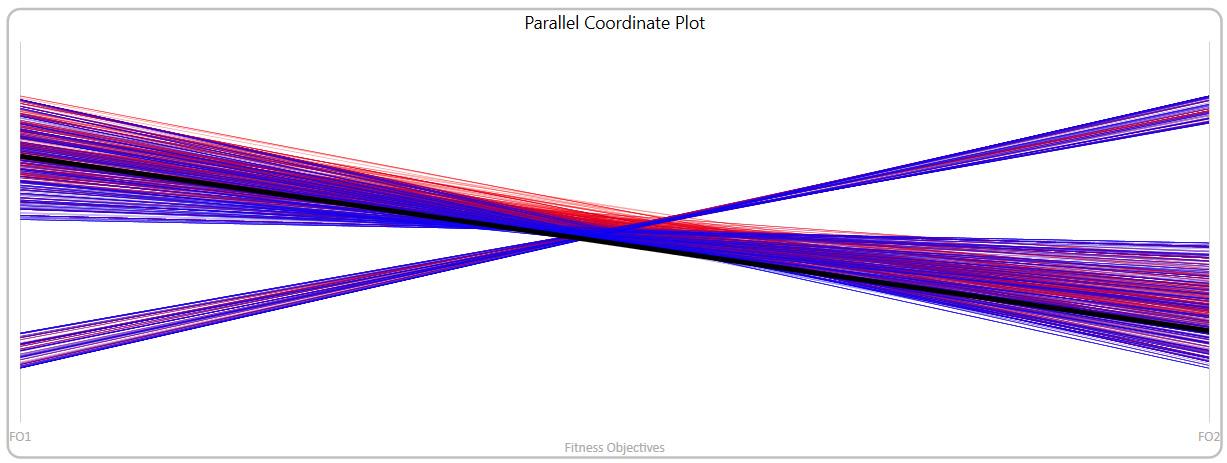
[04] Parallel Coordinate Plot Analysis:
This chart displays the performace of each objective as the simulation progresses as well as the realtionship between different objectives. From analysing the chart we see that the perfomance of Objective 1 (maximising green spaces) was in direct conflict with the other objectives, which were close to 1 : 1 in terms of mutual performance.
Solution:
the maximising building density green spaces from the existing while clusters around Taylor Square along Bourke Street.
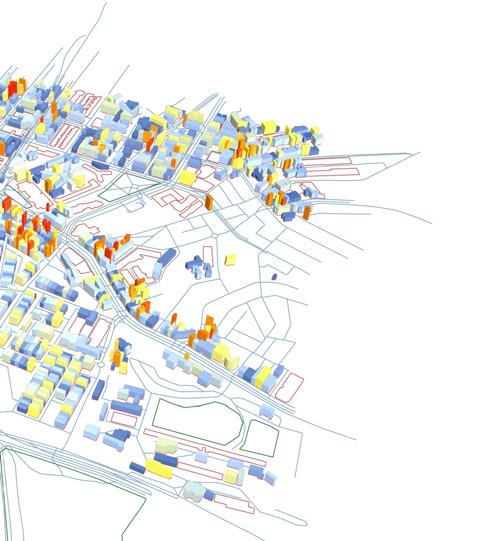
[01] Objective 3 Best Performing Solution:
The best performing solution in the optimisation objective saw increased density in a large pocket around Taylore Square, with minimal increases new green spaces but a significantly higher level of sunlight on existing green spaces reducing neighbouring building hights to prevent overshadowing
[05] Data Anaysis:
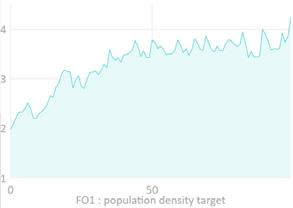
From the graphs generated by the simulation, we see that perfomance in objectives 2 + 3 increased rapidly as the simulation progressed, particularly objective 3 which reached near its perfect result. While conversely objective 1 strucggled as the evolutionary engine sought to prioritise achieving high performance in the other 2 objectives.
SELECTED SOLUTION
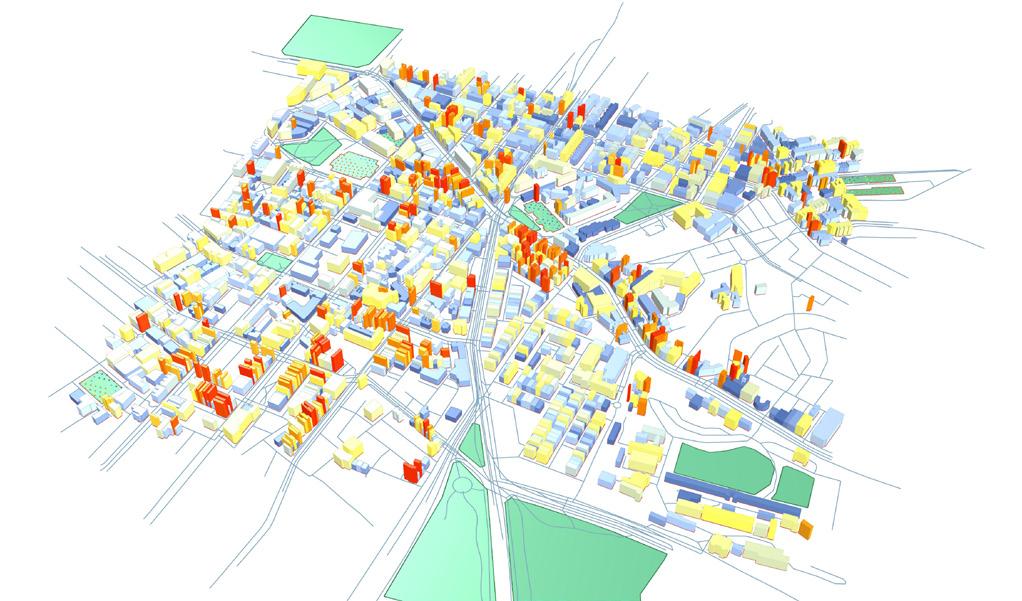
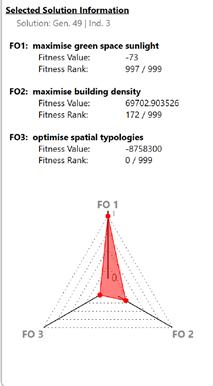
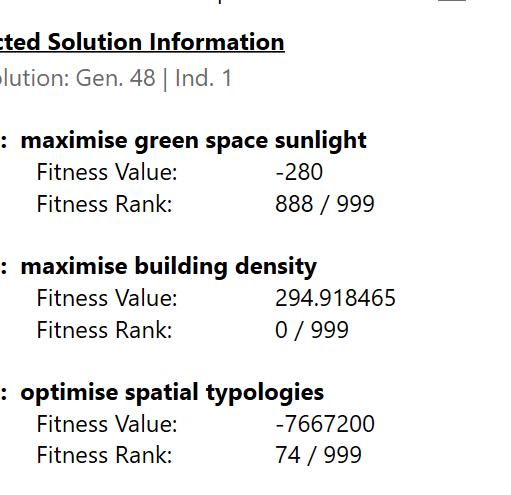
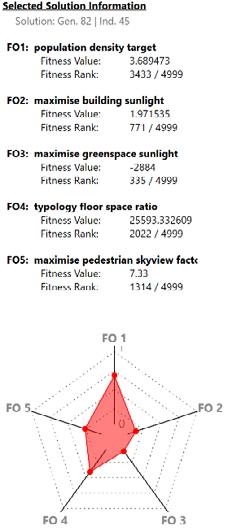
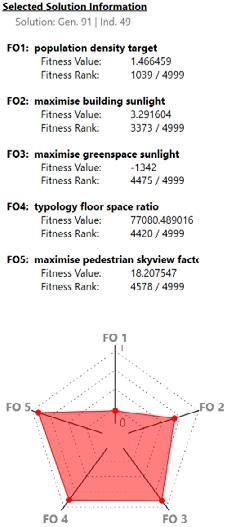
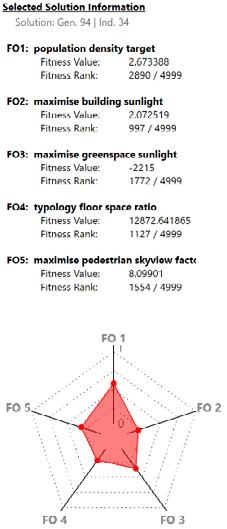
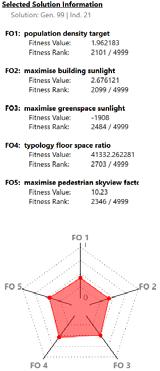
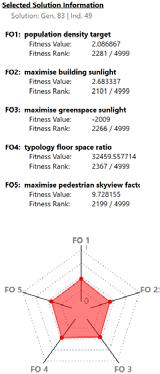
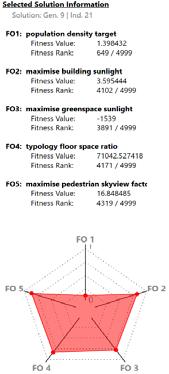
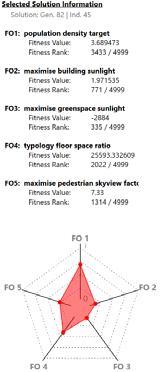
[01] Selected Solution Analysis:
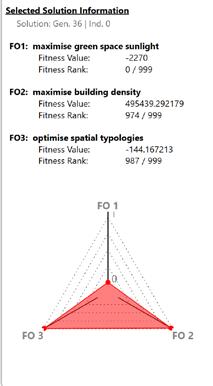
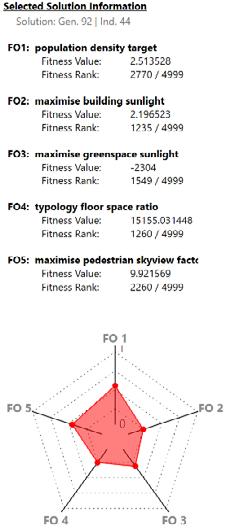
For this project the chosen solution was the one with the highest average performance across the 3 objectives. Despite this average ranking, the solution still favoured the building centric objectives of increasing denisty and achieving typology ratios. However, the poor performance in the green space objective is exagerated by the existance of outlier solutions as previously shown.
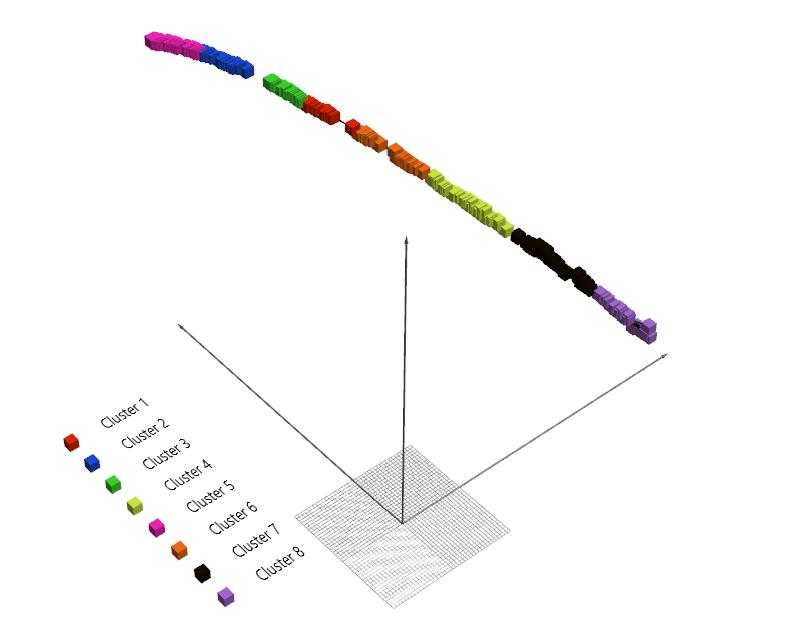
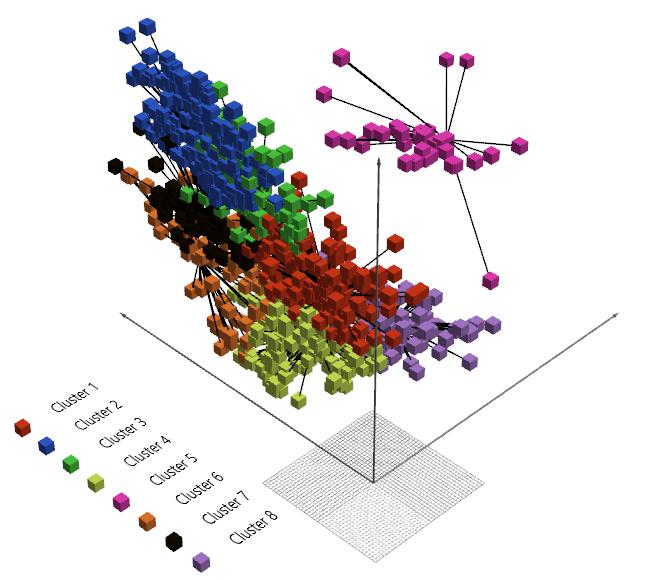
The clustring of solutions as shown below displayed a linear trajectory for how solutions scored and the favouring of objectives 2 + 3.
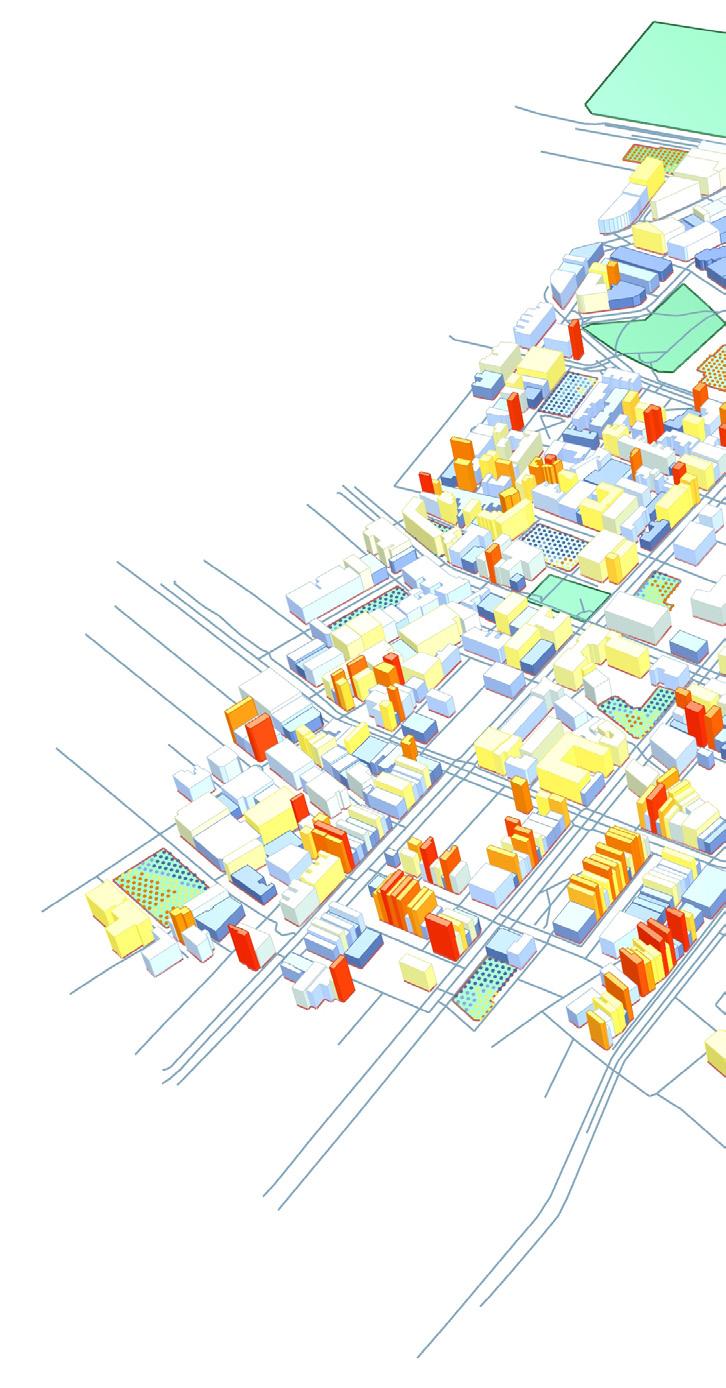
This result sought to achieve increased solar exposure on green spaces by reducing building heights which would otherwise block solar gain. While incrasing building density intensification around Taylor Square and the southern end of the suburb along Bourke Street and South Dowling Street.
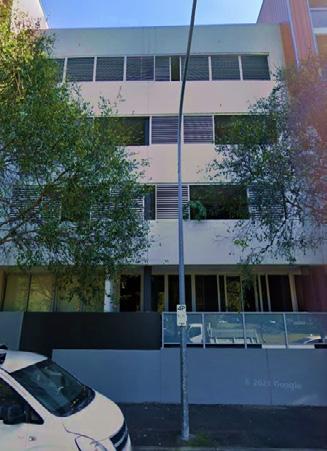
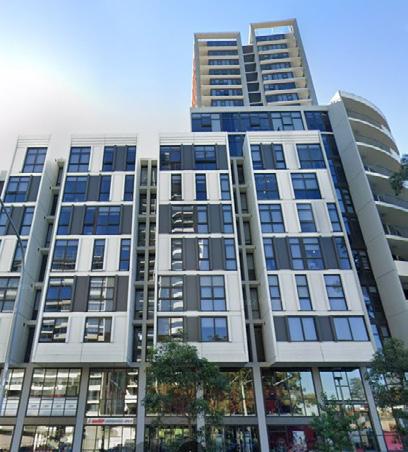
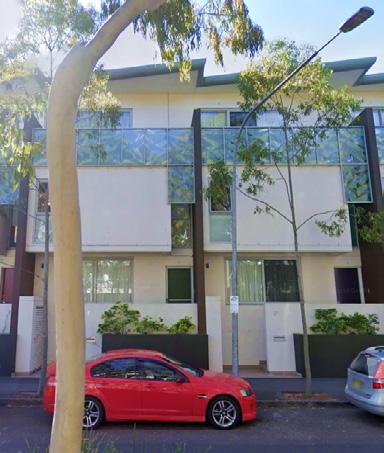
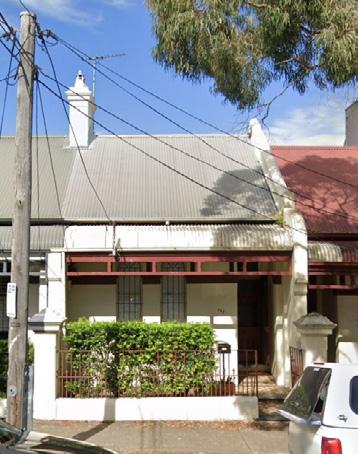
Zetland today stands as a model case for Sydney inner city suburbs. Balancing its heavily urban location and abundance of mid to high rise apartment complexes with a desirable pedesetrian experience of wide access to sunlight, green space, and amenity.
However as Sydney’s population continues to grow and inner city regions experience increasingly high population densities, Zetland must adapt if it is to keep this character into the coming decades.
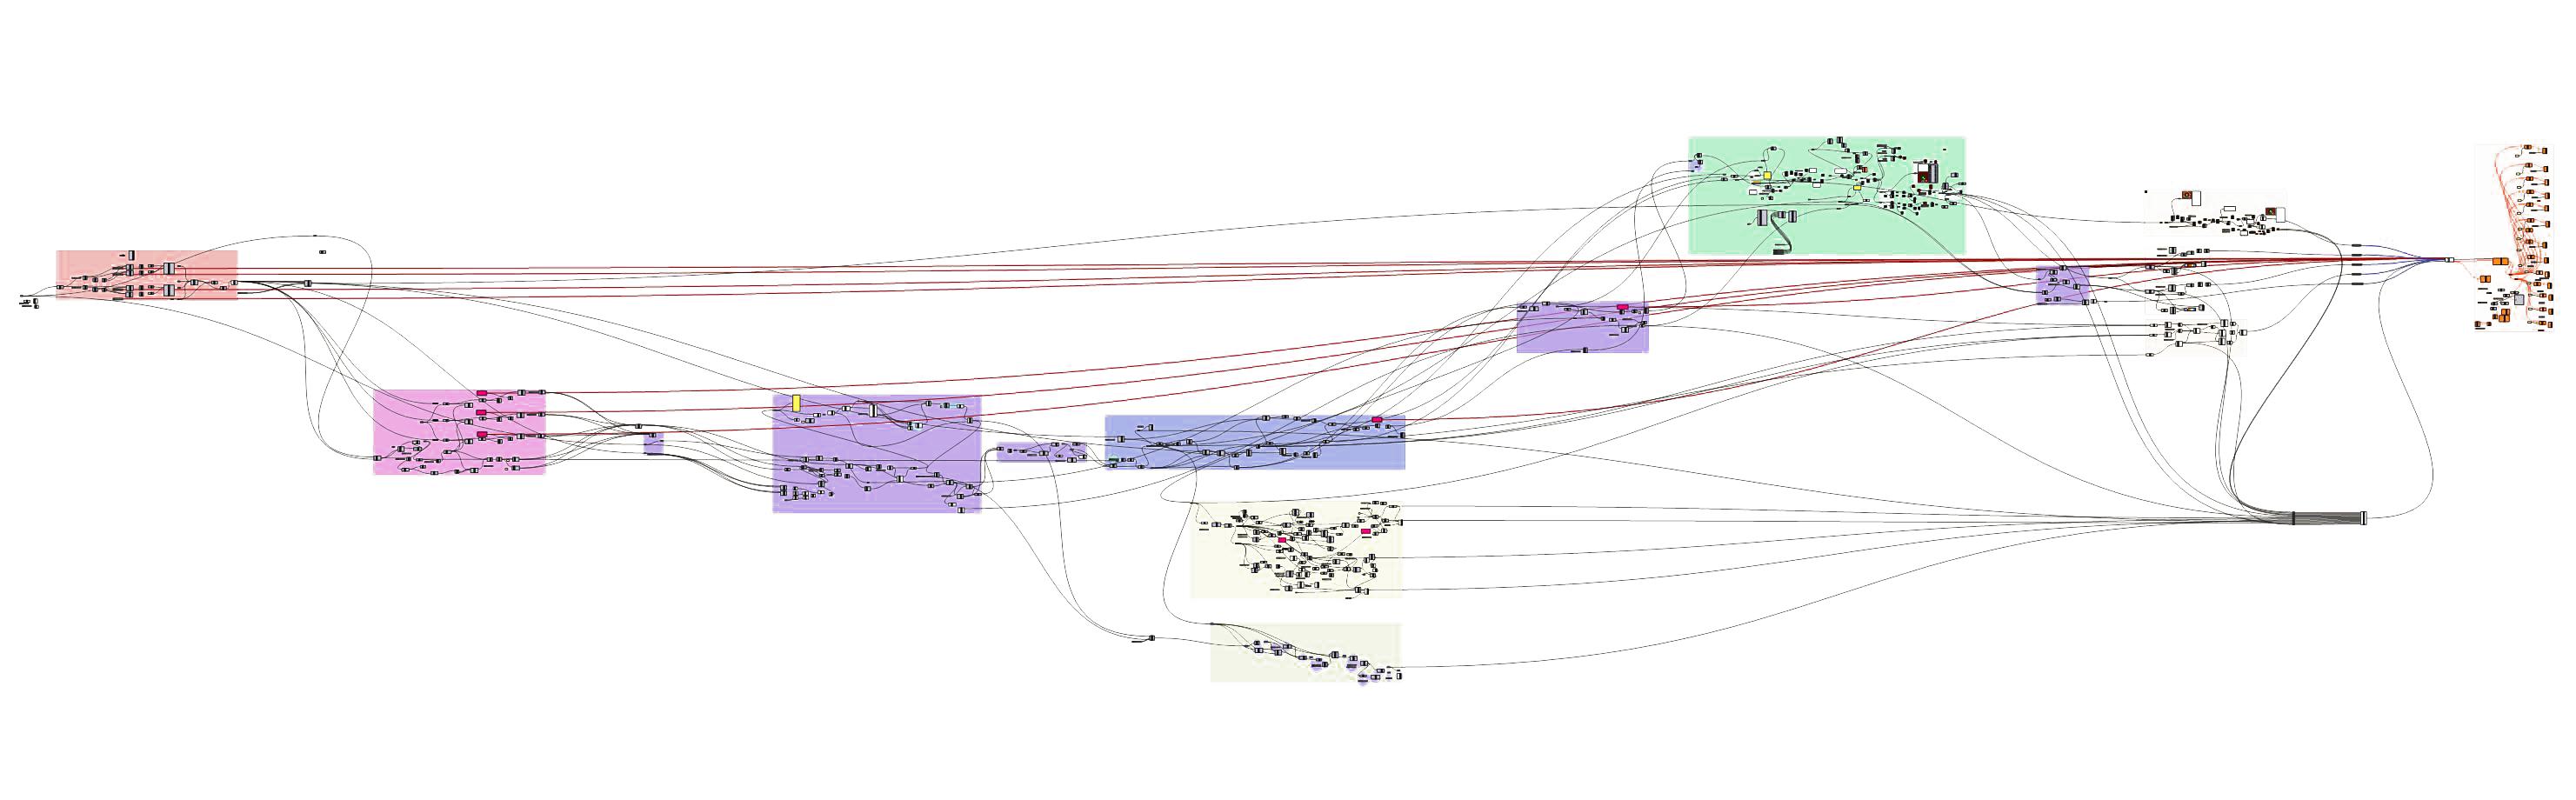
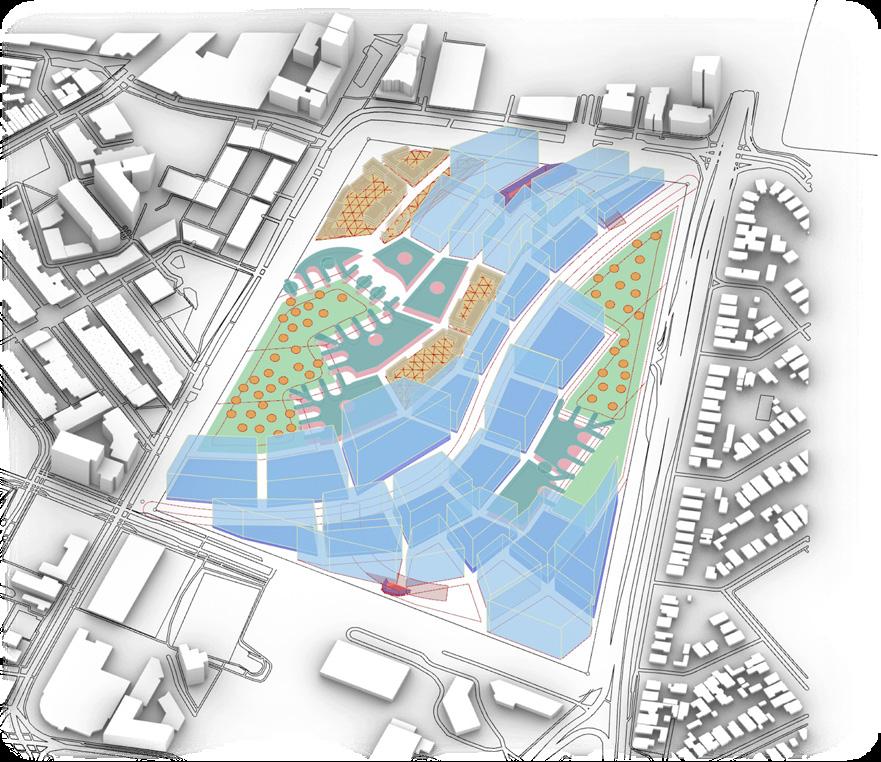
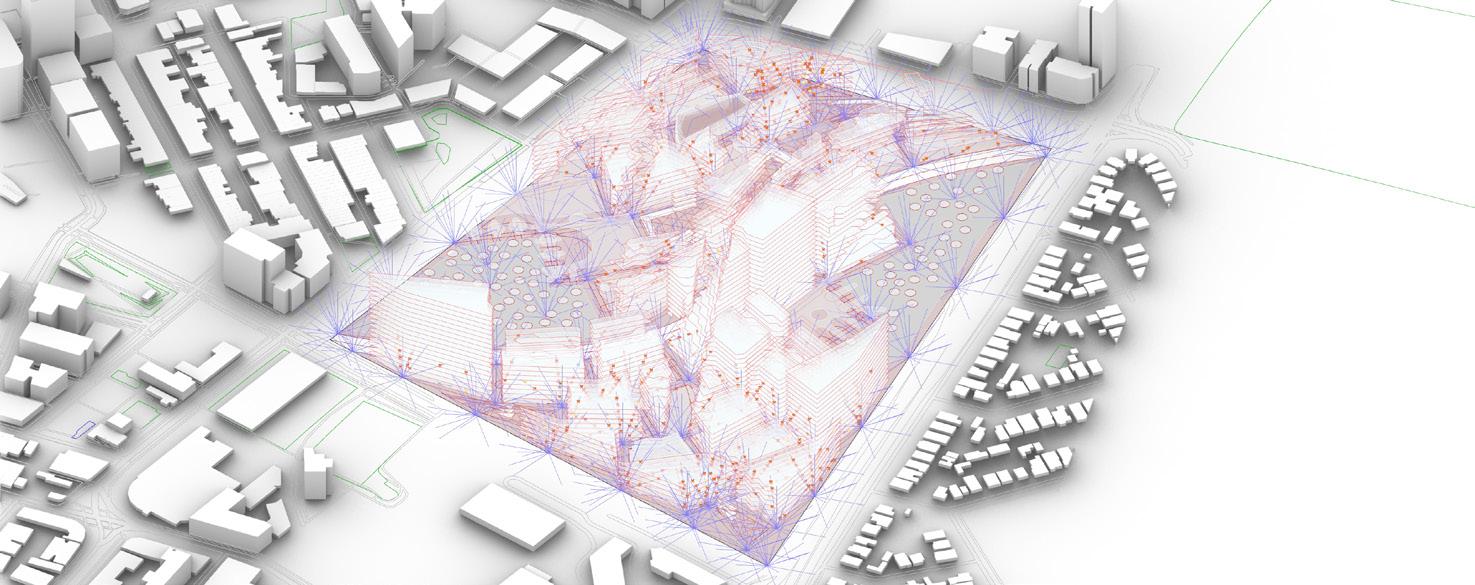
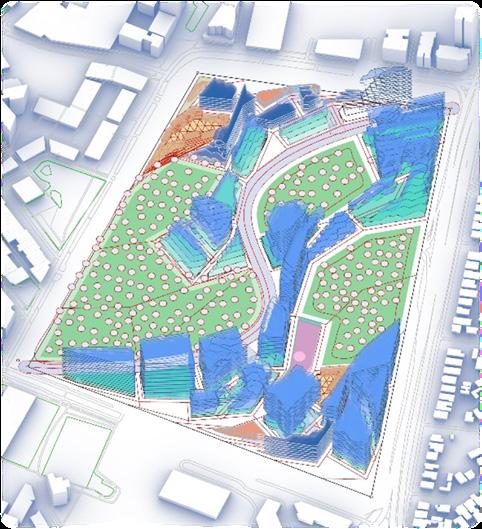
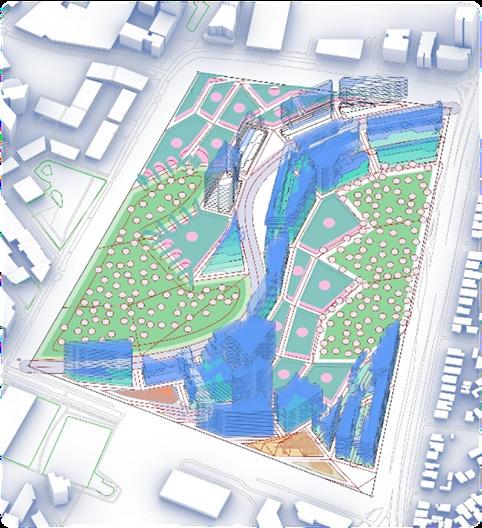
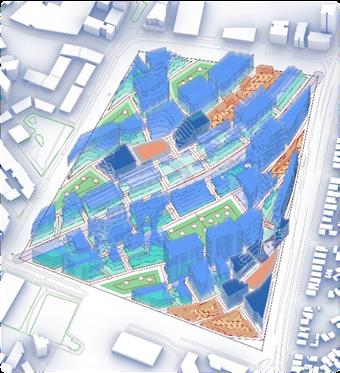
[02] Grasshopper Definition
Utilising the evolutionary engine Wallacei within a parametrically built generative model of Zetland, urban analysis of the suburb’s climate, demographics, context, and history is conducted to create quanitifiable targets which the engine then iterates the design upon, generating towards an optimal result.
The foundational objectives of the algorithm being: 3 x current population target of 37 500; increased sun exposure on residential and green spaces; and optimised spatial typology distribution to accomodate different living situations, inviting more varied family and cultural dynamics to exist in the suburb.
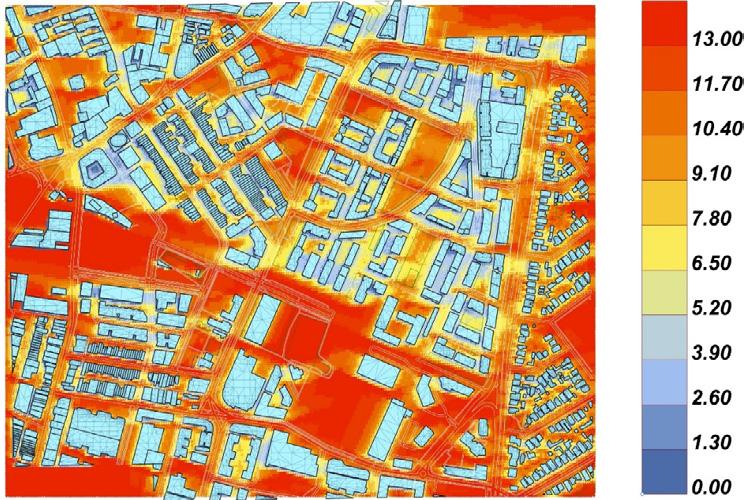
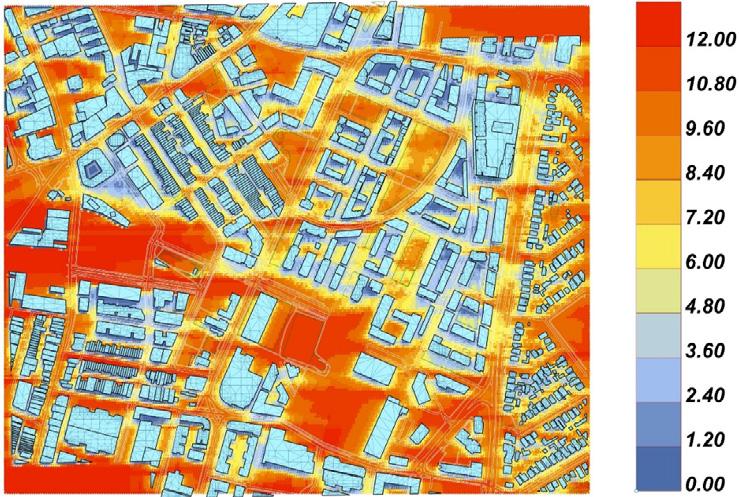
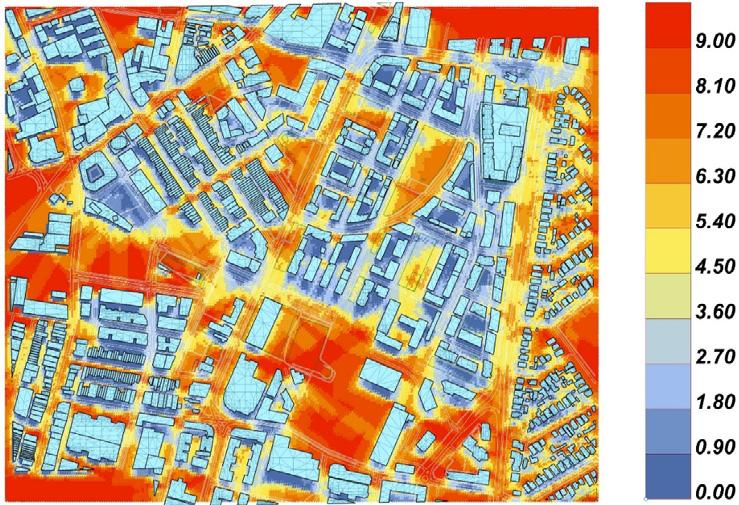
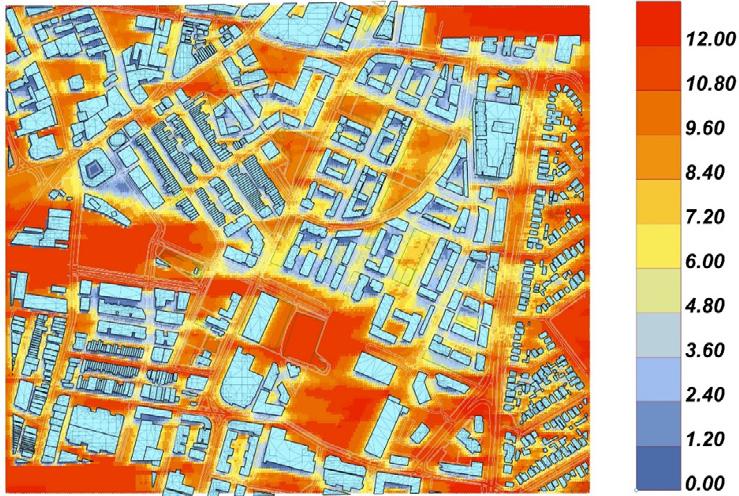
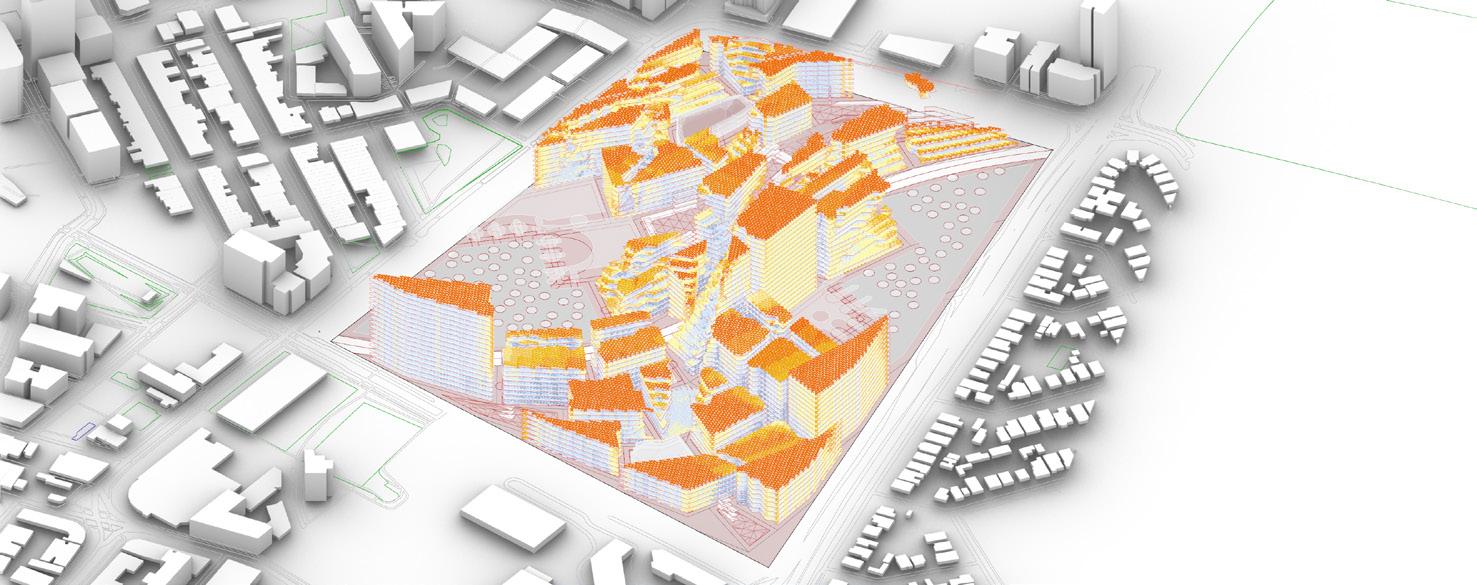
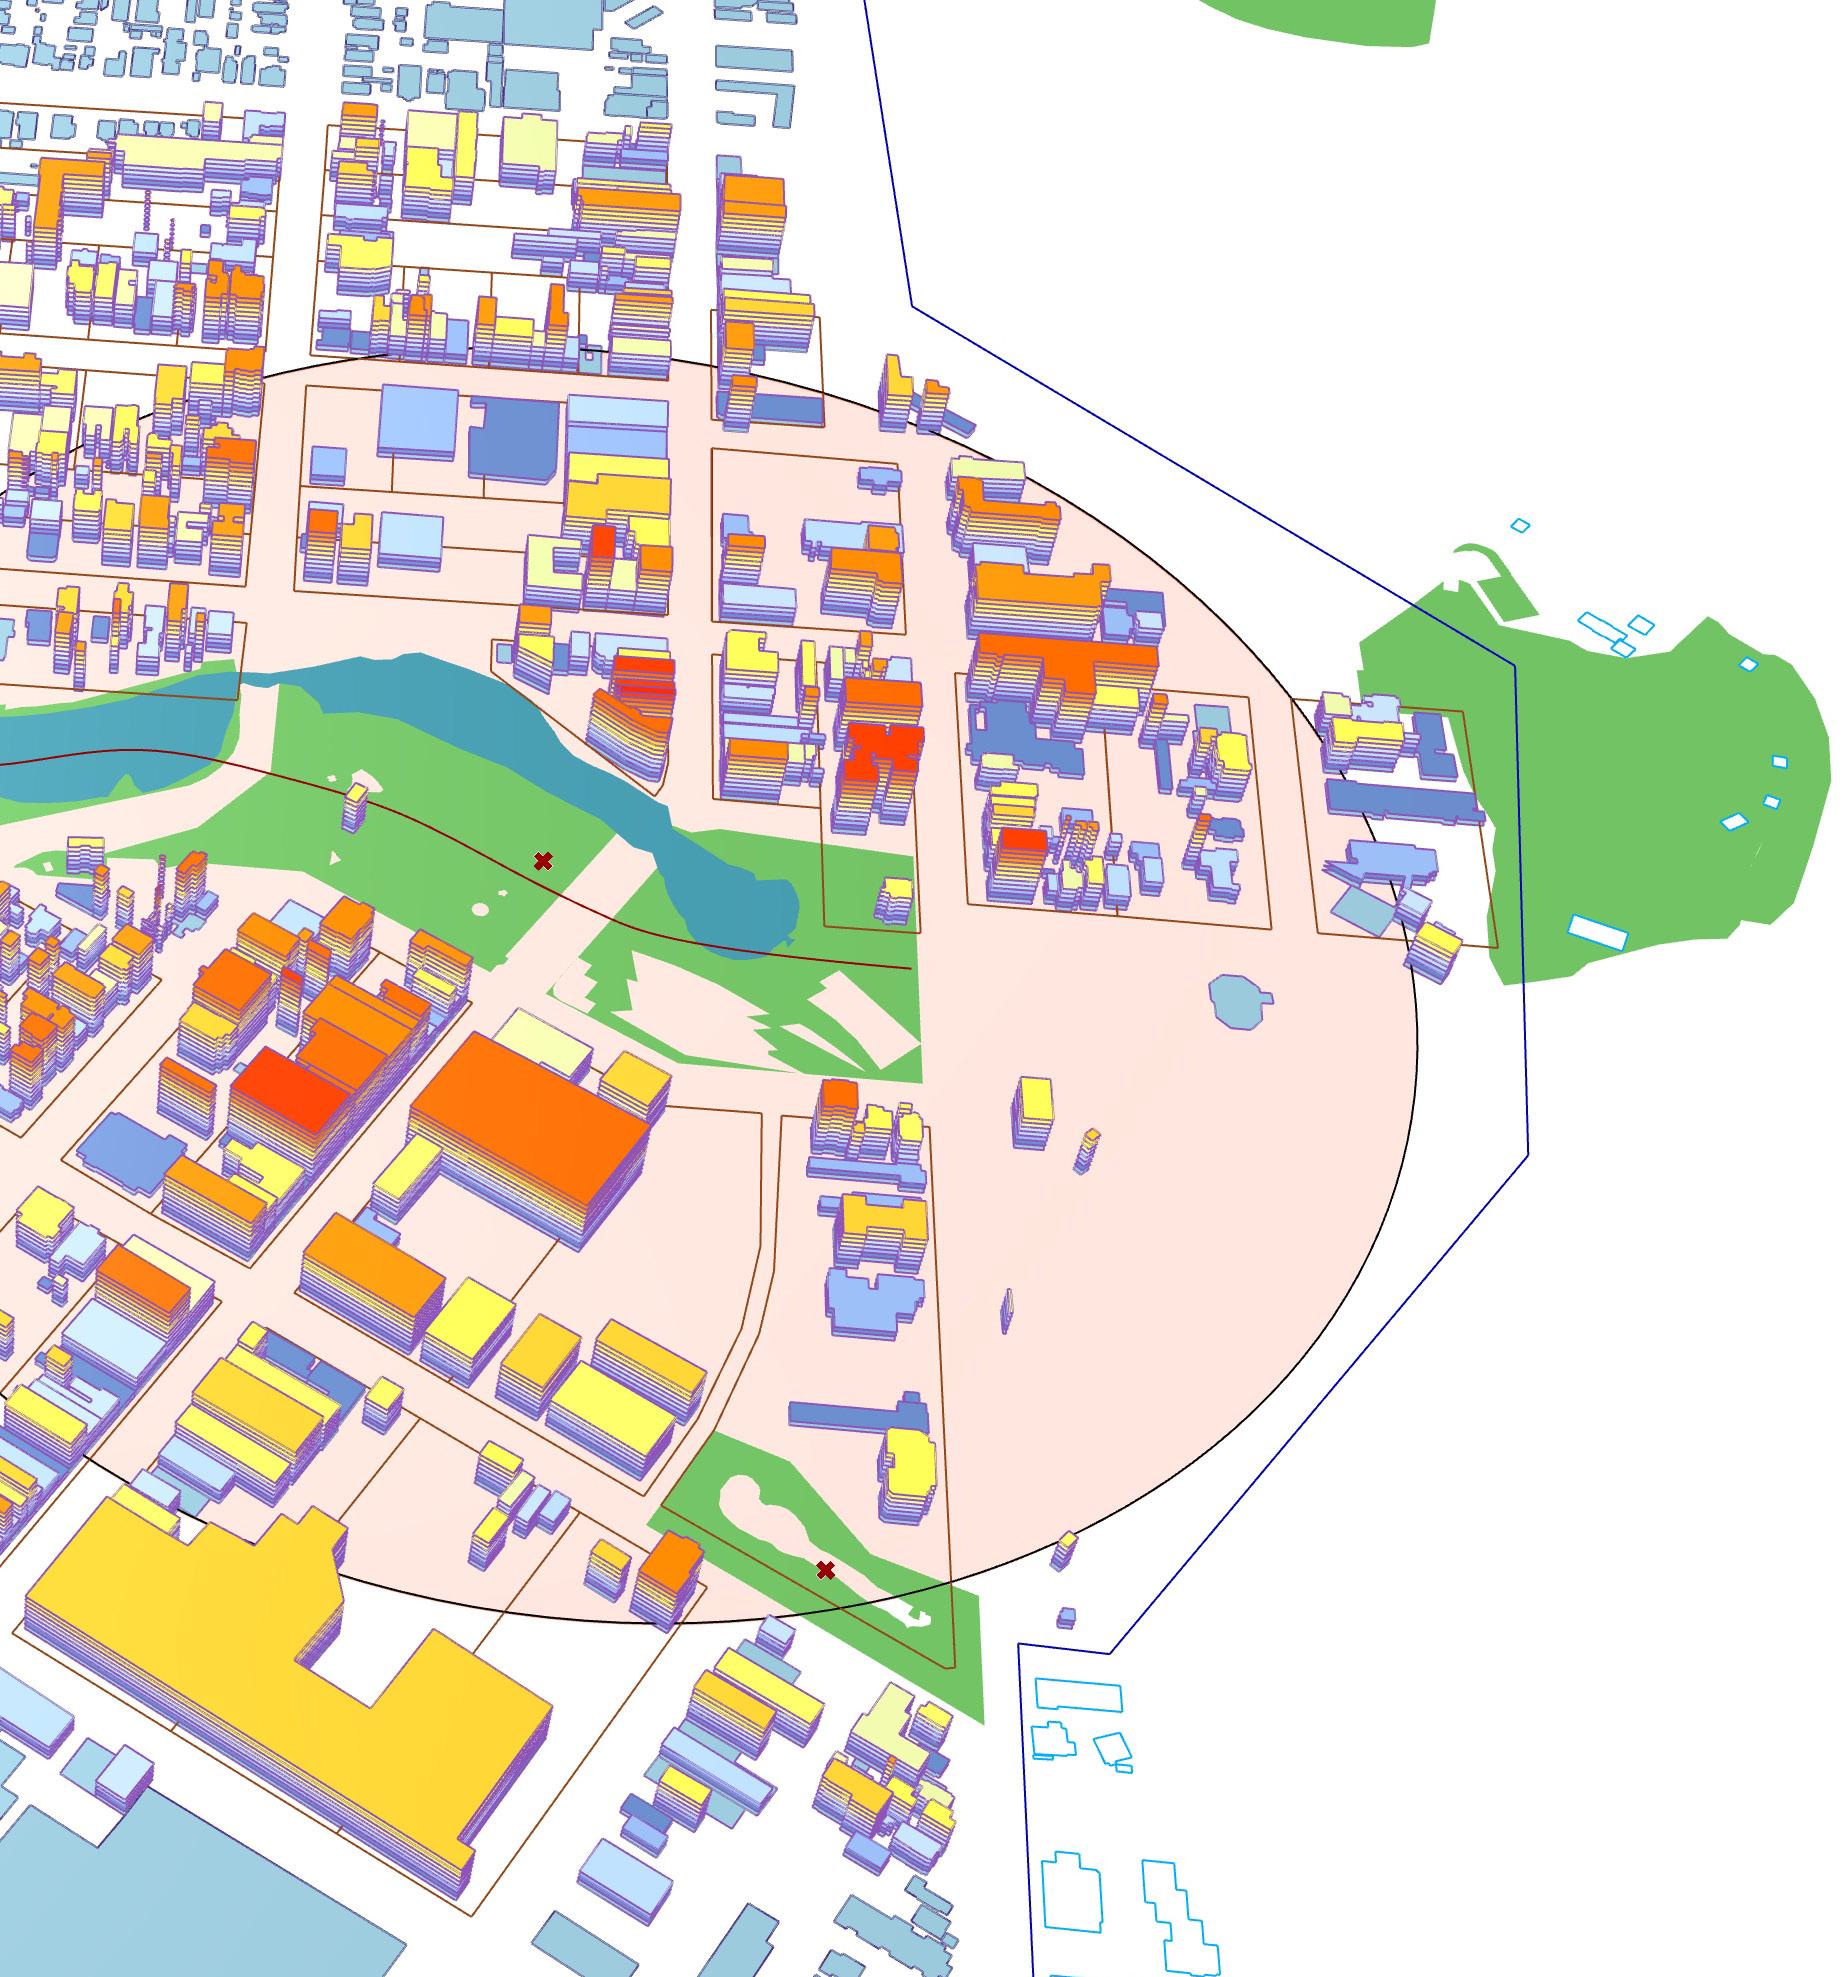
[05] Summer Solar Access
[06] Autumn Solar Access
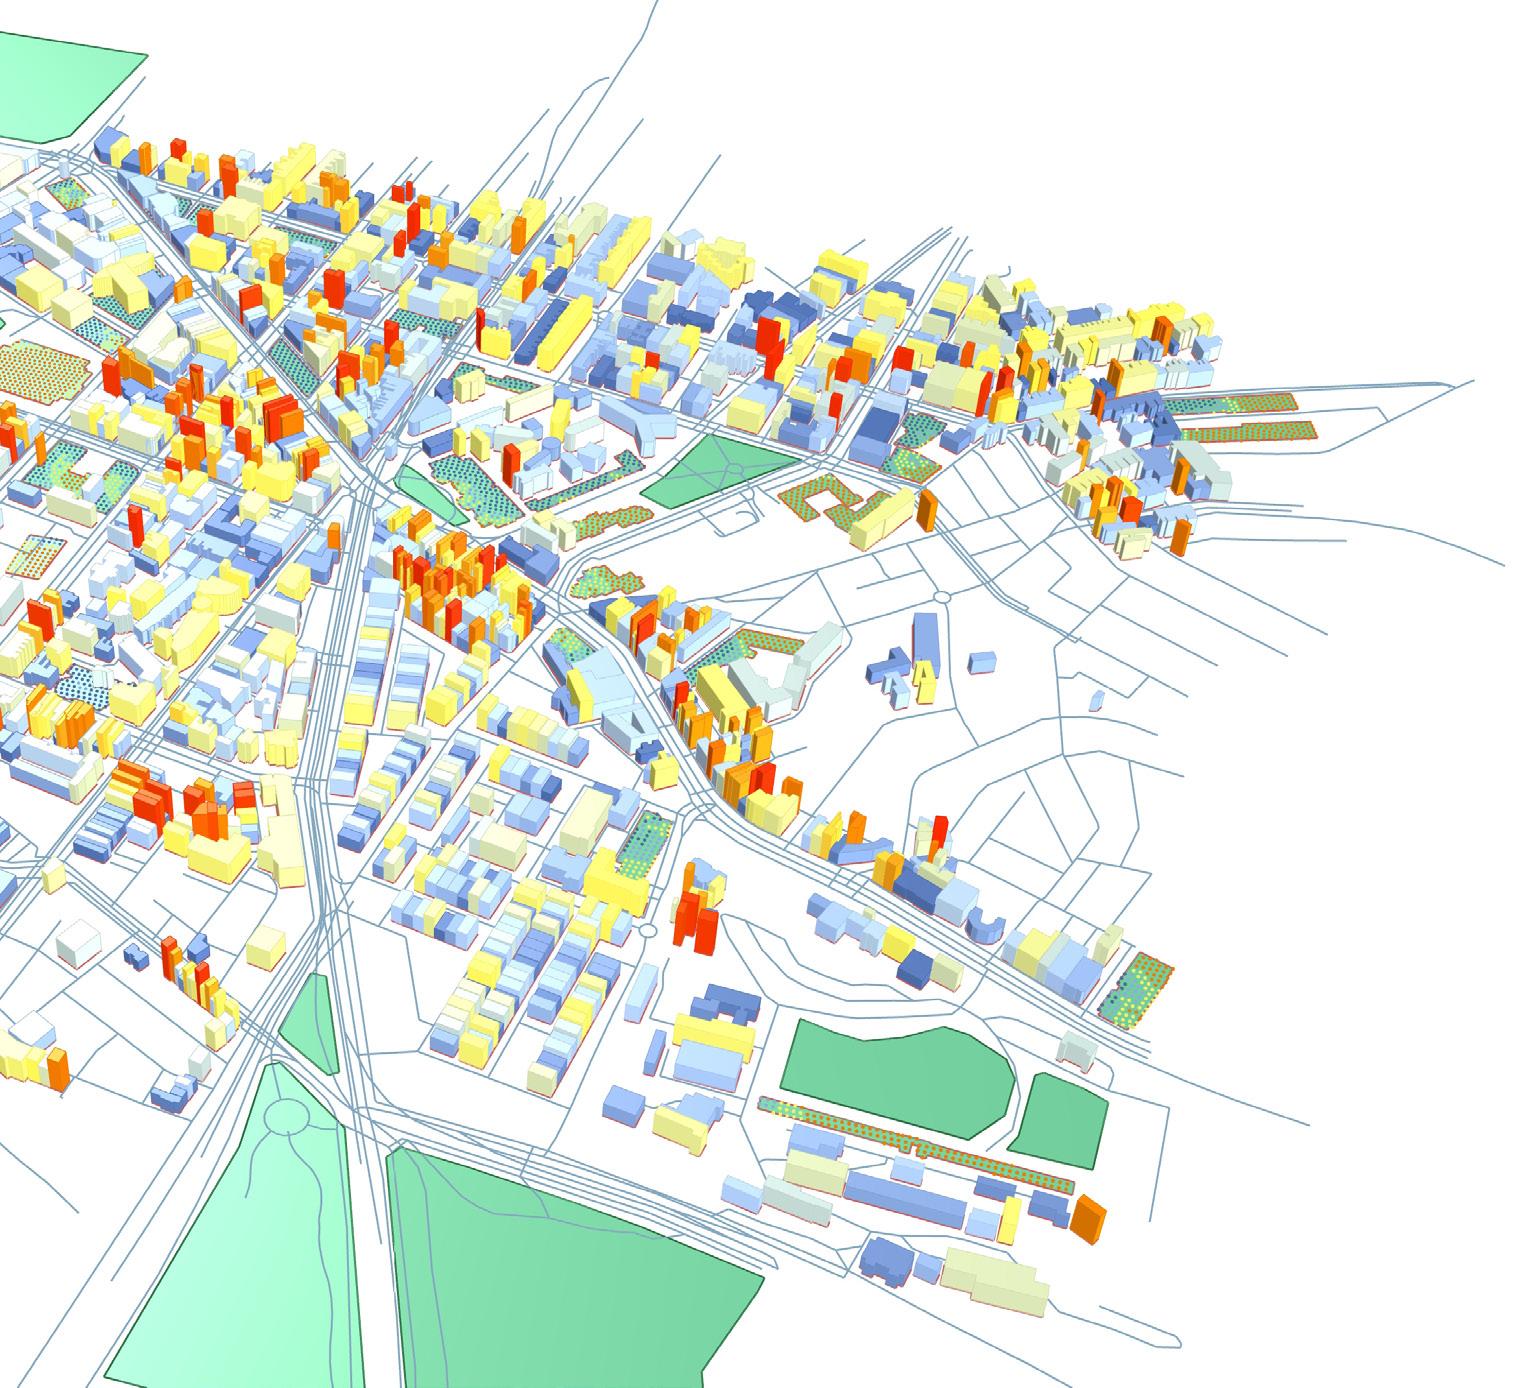
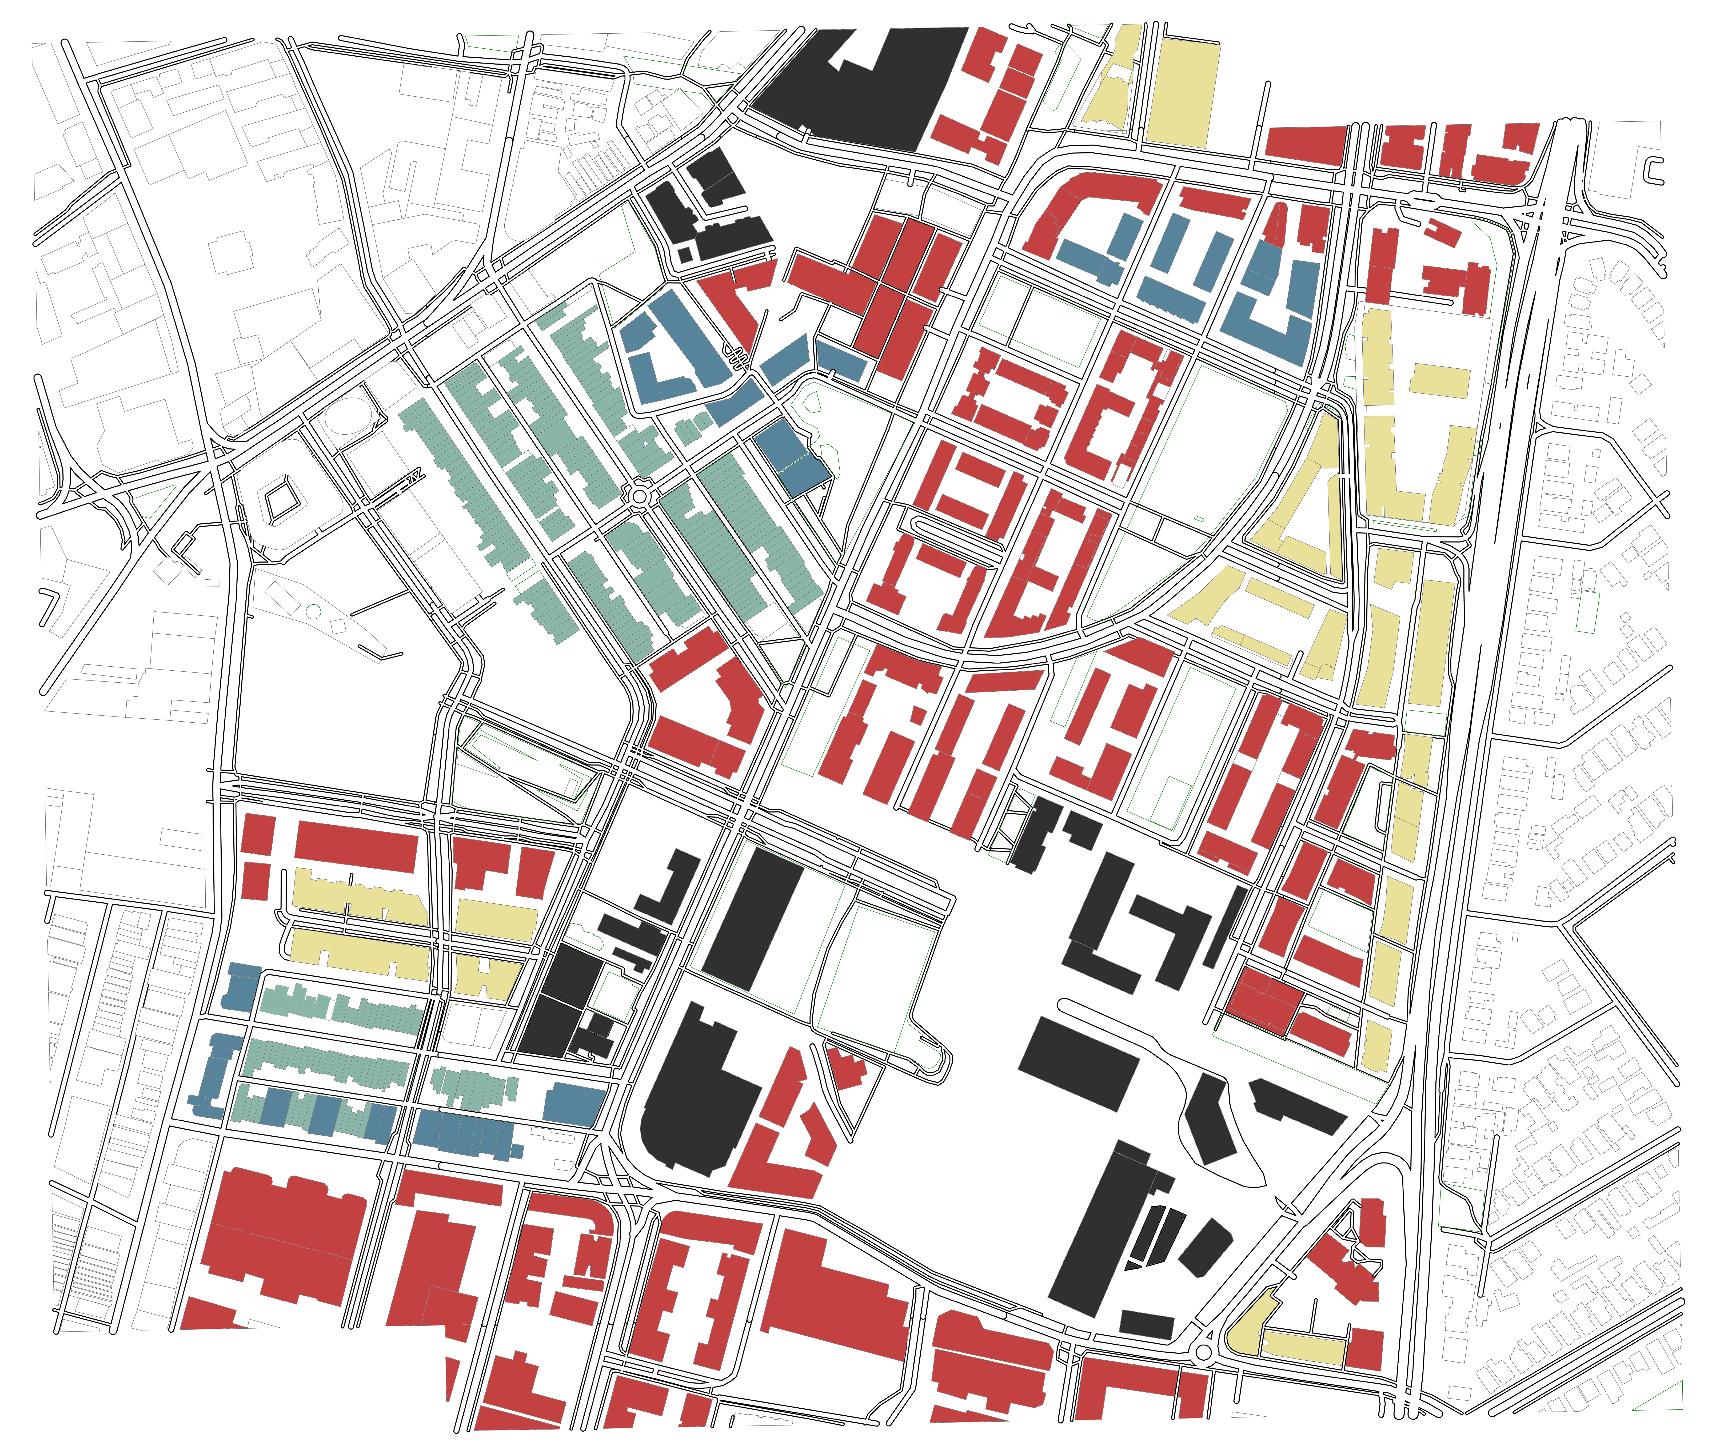
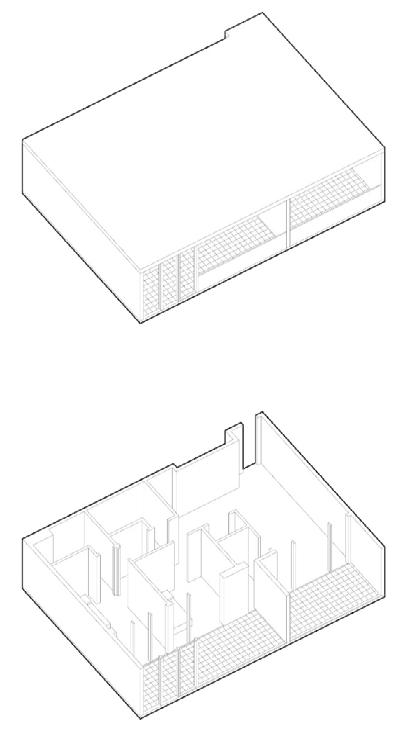
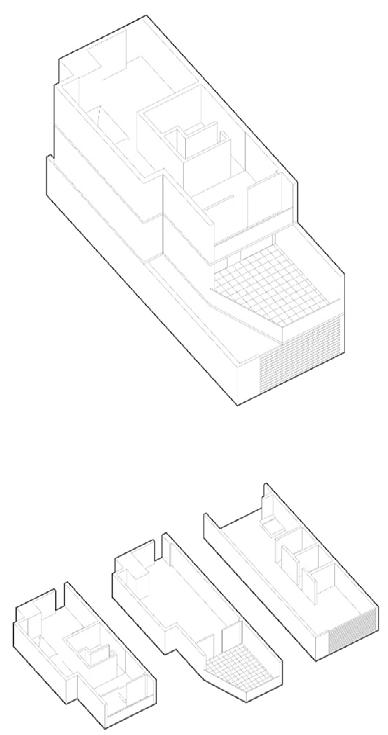
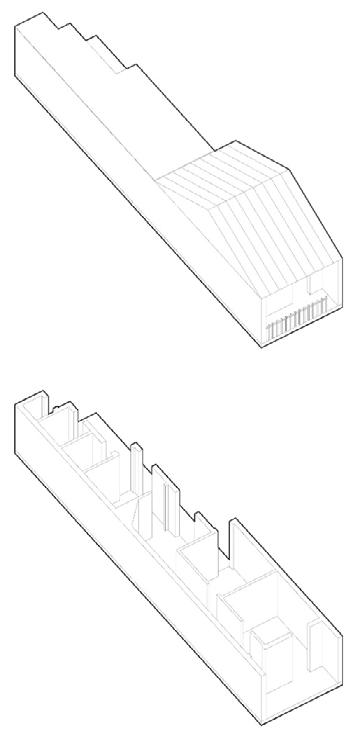
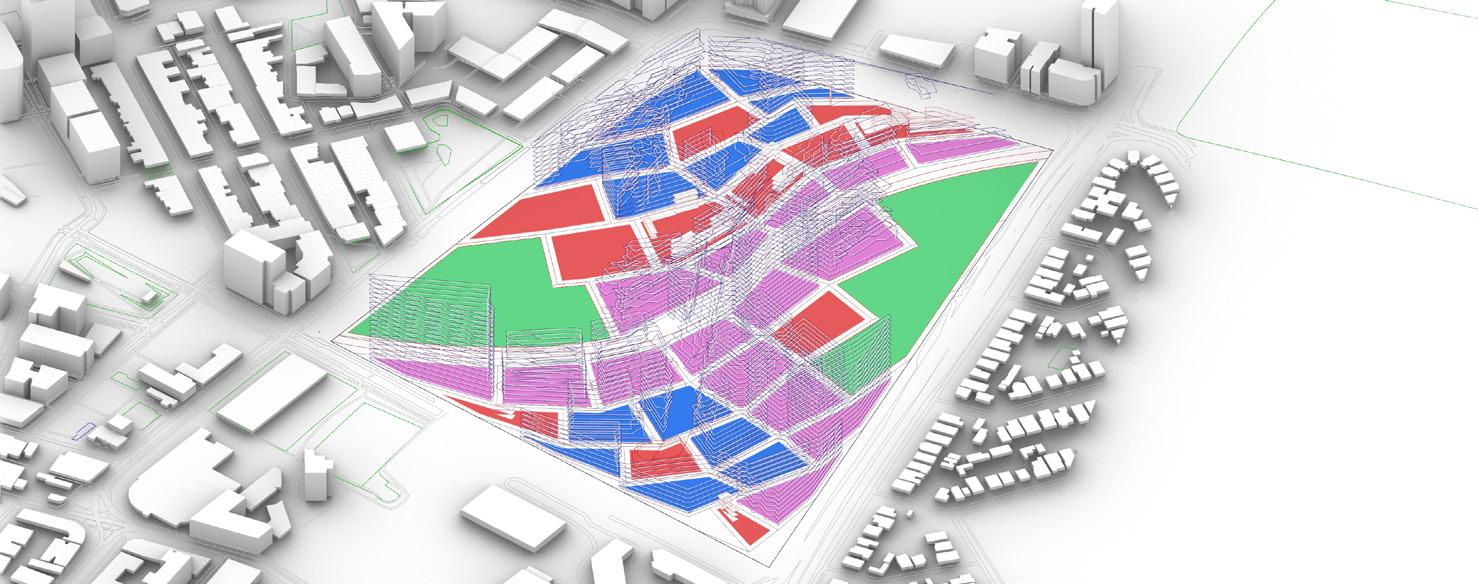
[03] Existing Residential Typology Plan
[07] Winter Solar Access
[08] Spring Solar Access
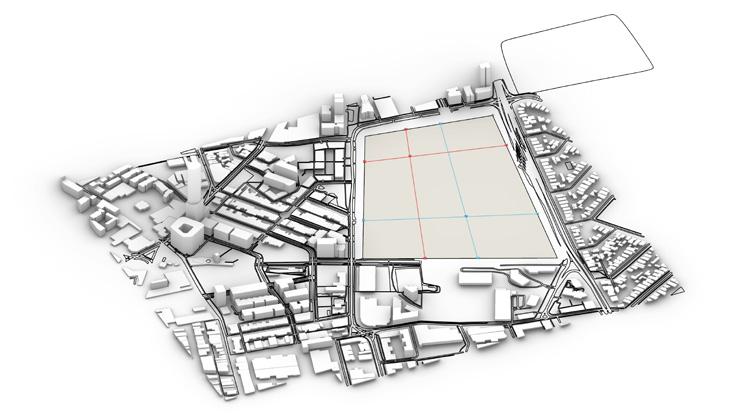
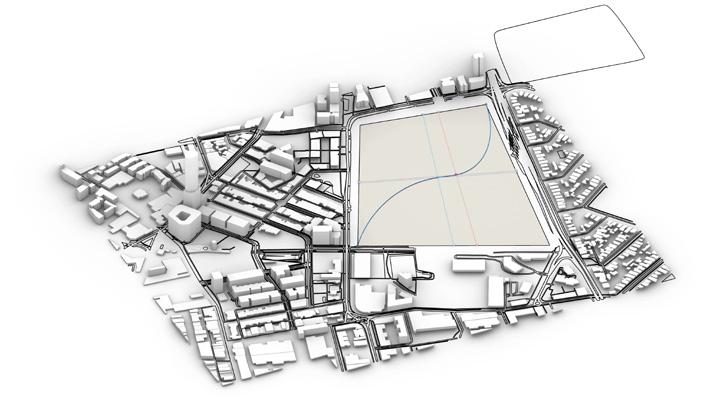
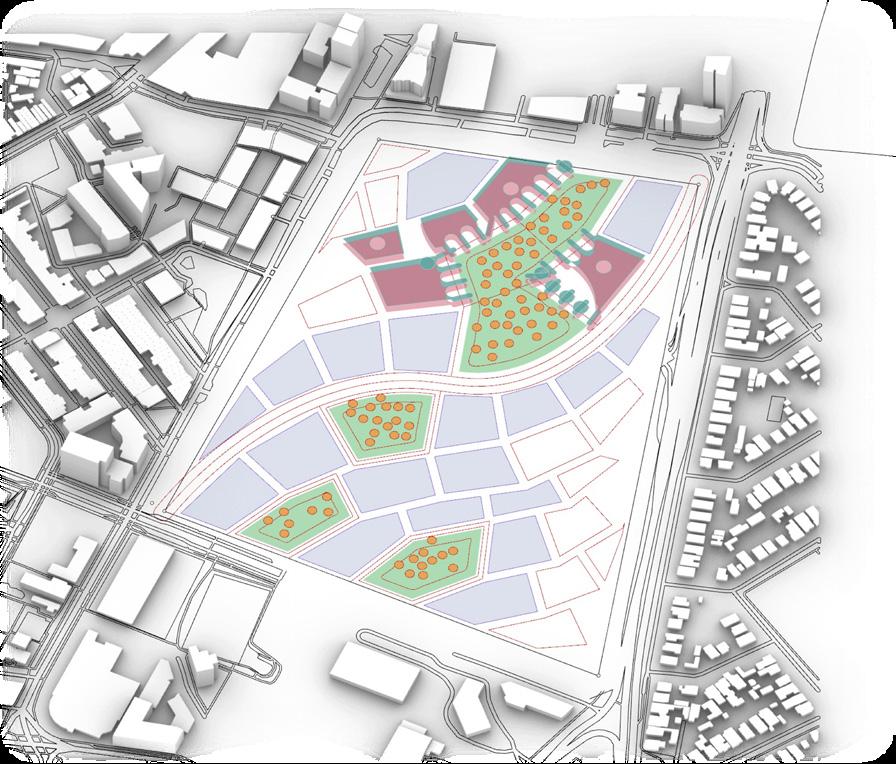
[04]
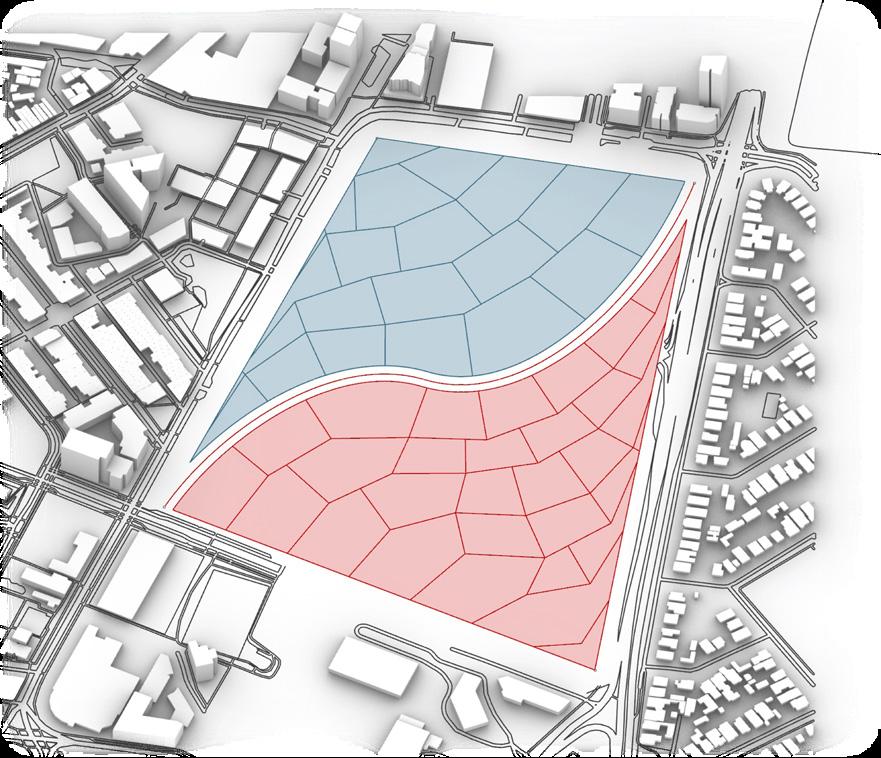
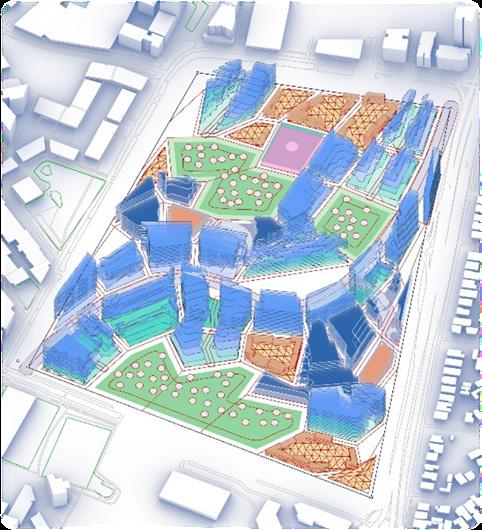
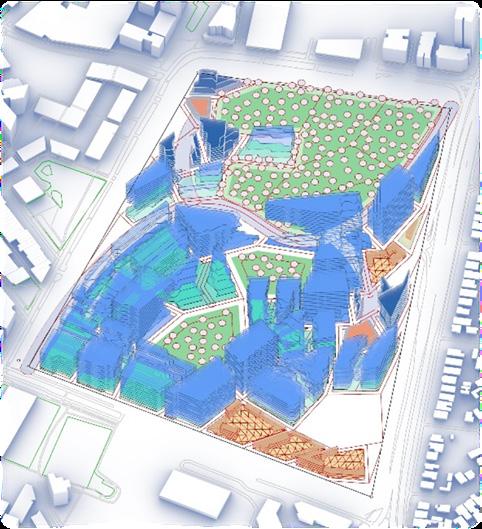
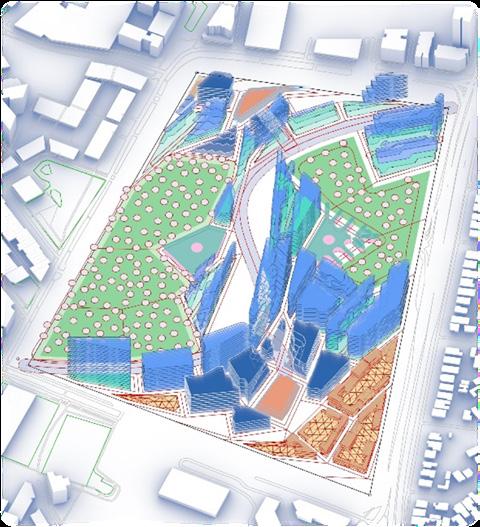
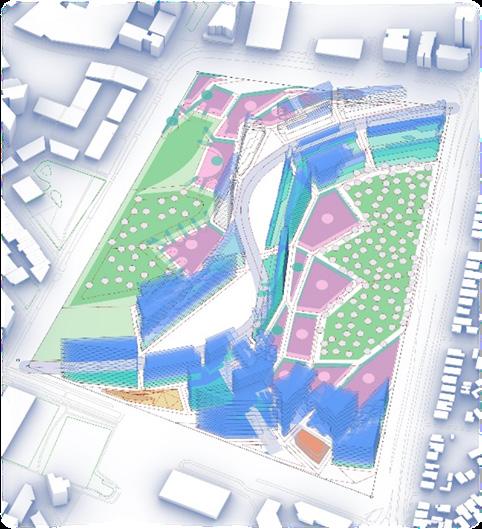
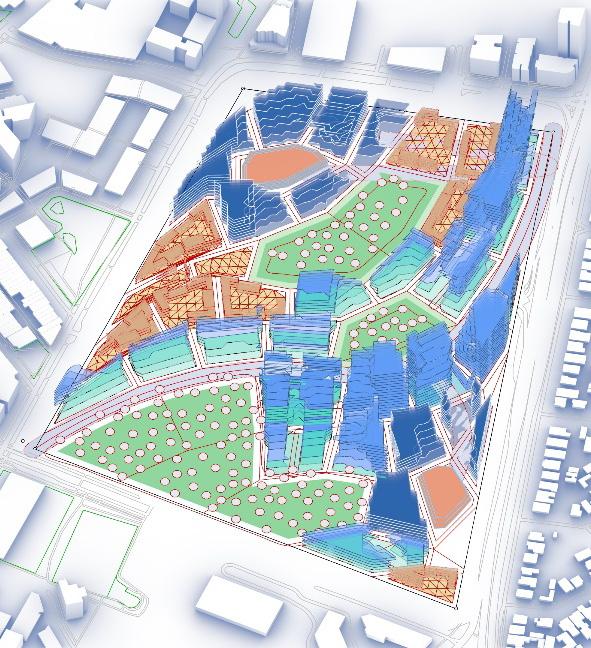
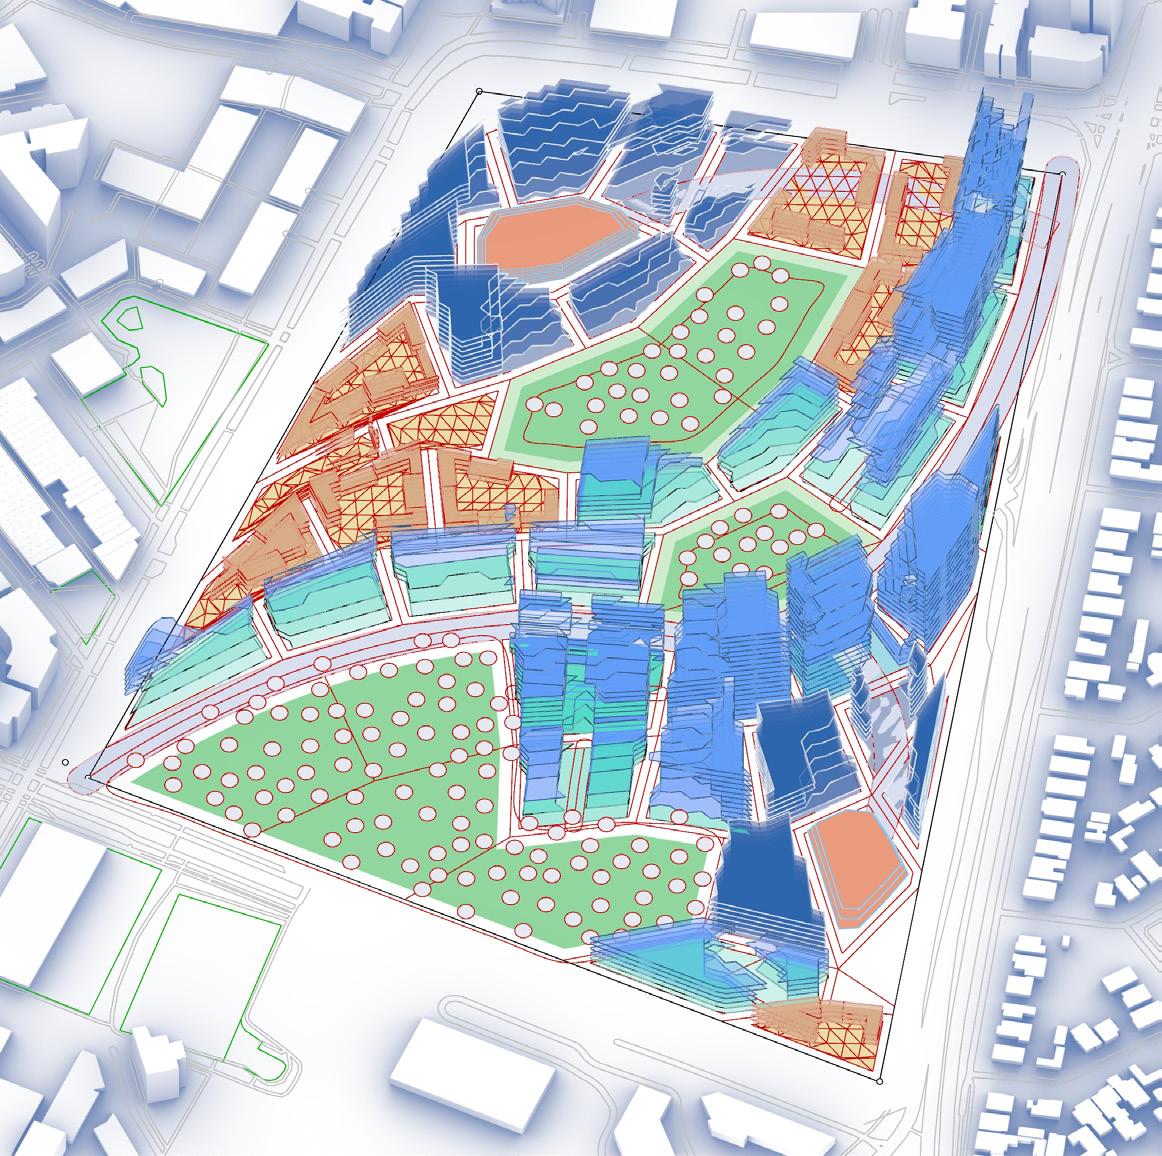
[09] Main Avenue + Street Division Generation: The founding step for plot generation is a main avenue in the manner population of Zetland for both family and individual demographics. Secondary divisions are then generated based on
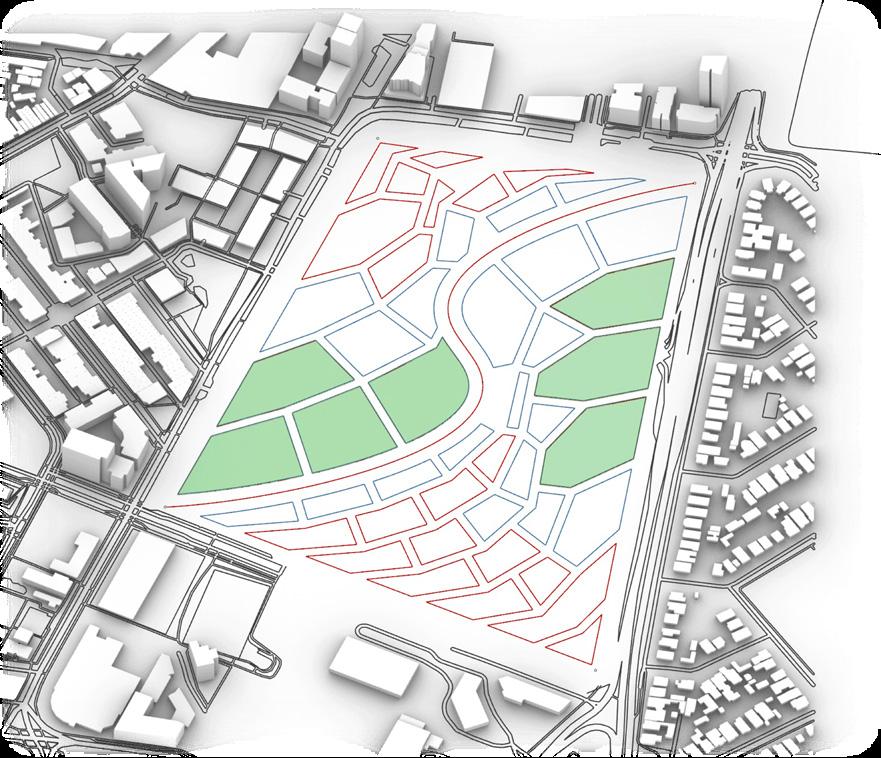
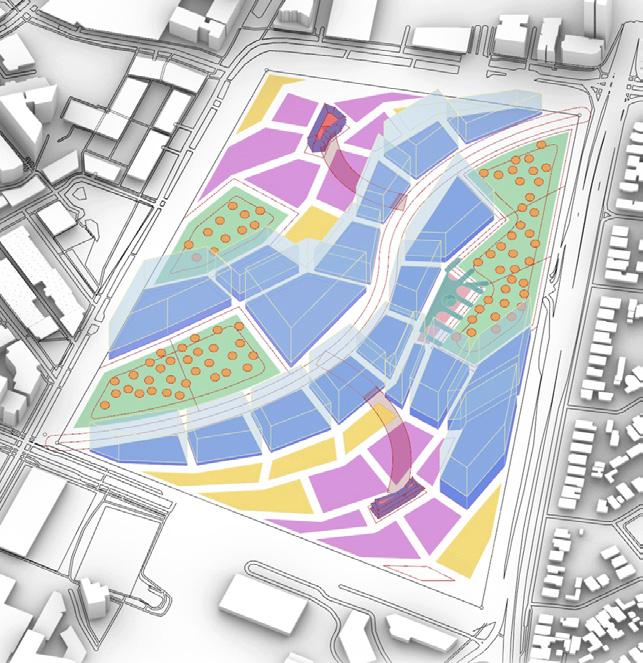
[10] Plot Typology Allocation + Building Height Generation: First, green space typologies are determined by the largest dering green spaces and the main avenue due to their proximity to amenity. Third, community hubs (Purple) are established
manner of the existing Gadigal Avenue, connecting Gunyama recreation center and Moore Park, two key amenities for the on the shape of the avenue and area of each half, from which connecting lanes are generated to define street networks.
largest plots on each suburb half + the size of the half’s. Second, mixed use residential plots (Blue) are defined on plots borestablished from the remaining plots determined by cluster size. Fourth, commercial spaces (yellow) populate remaining plots.
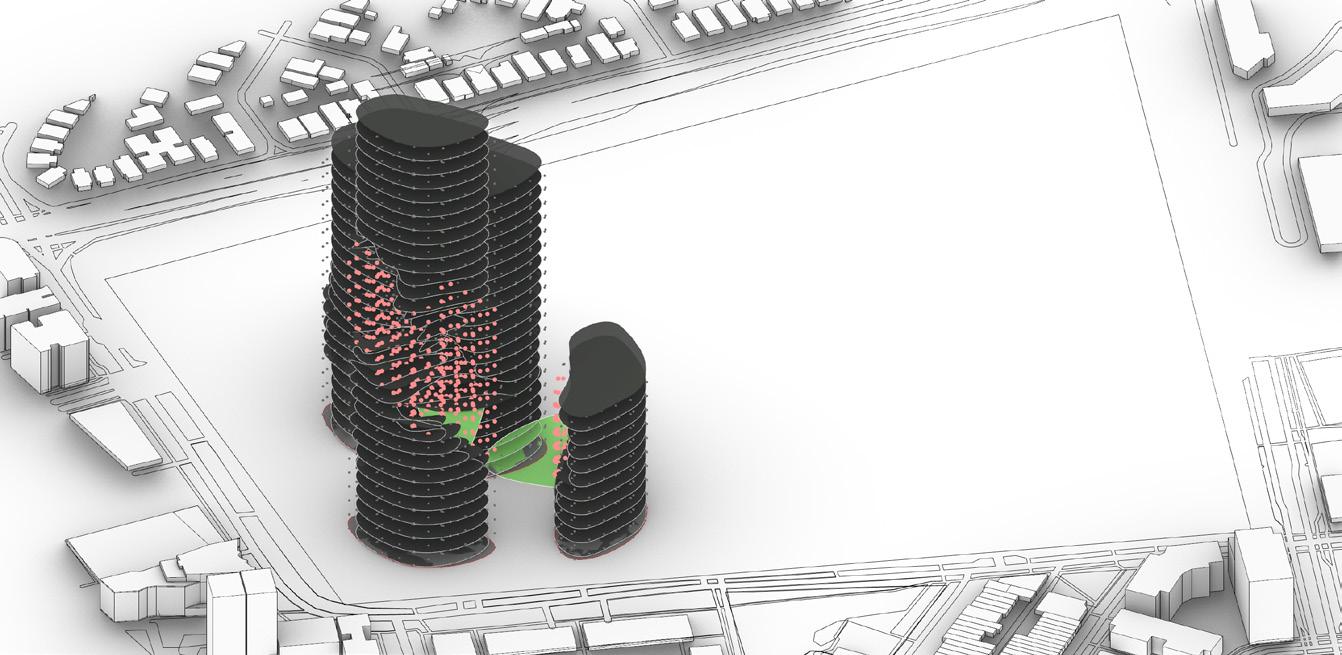
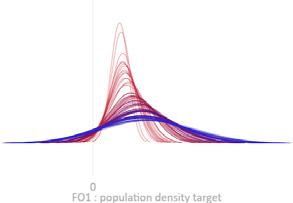
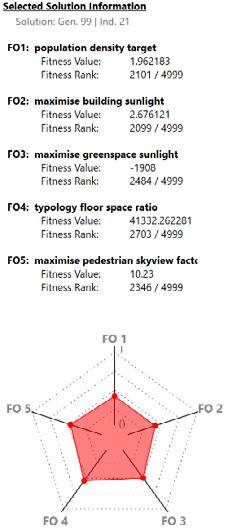
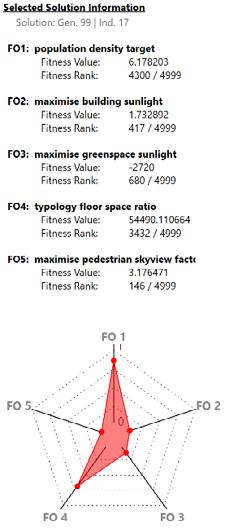
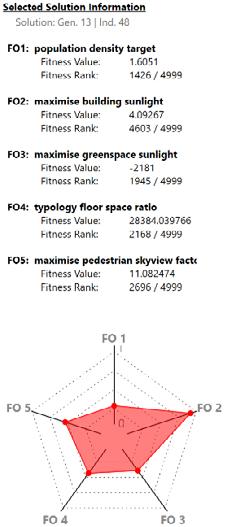
[12] Fitness Objective 1 | Maximise Building Density
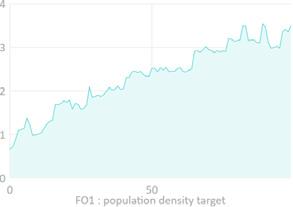
In order to achieve the population target of 37 500 a quantifiable sqm² per person objective is used, based on a Japanese study of desirable living spatial quality
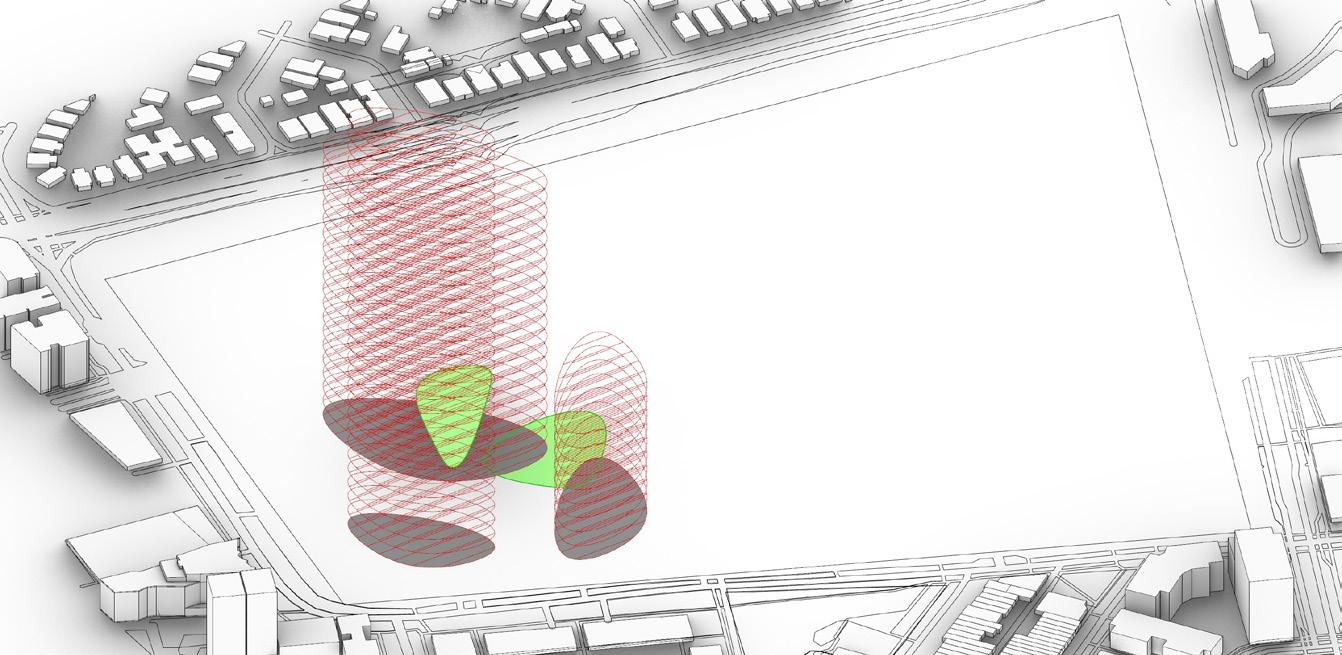
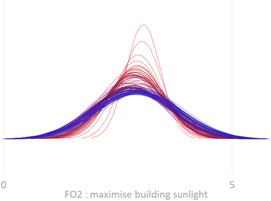
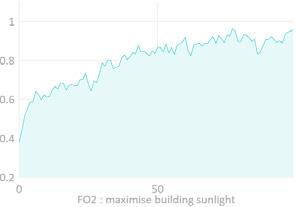
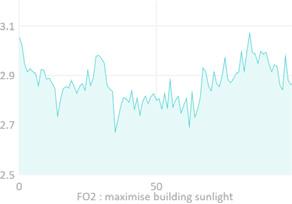
[13] Fitness Objective 2 | Maximise Residential Sun
Seeks to maintain desirable levels of solar exposure on residential living spacess, as obj. 1 favours larger + higher density buildings leading too heavy overshadowing
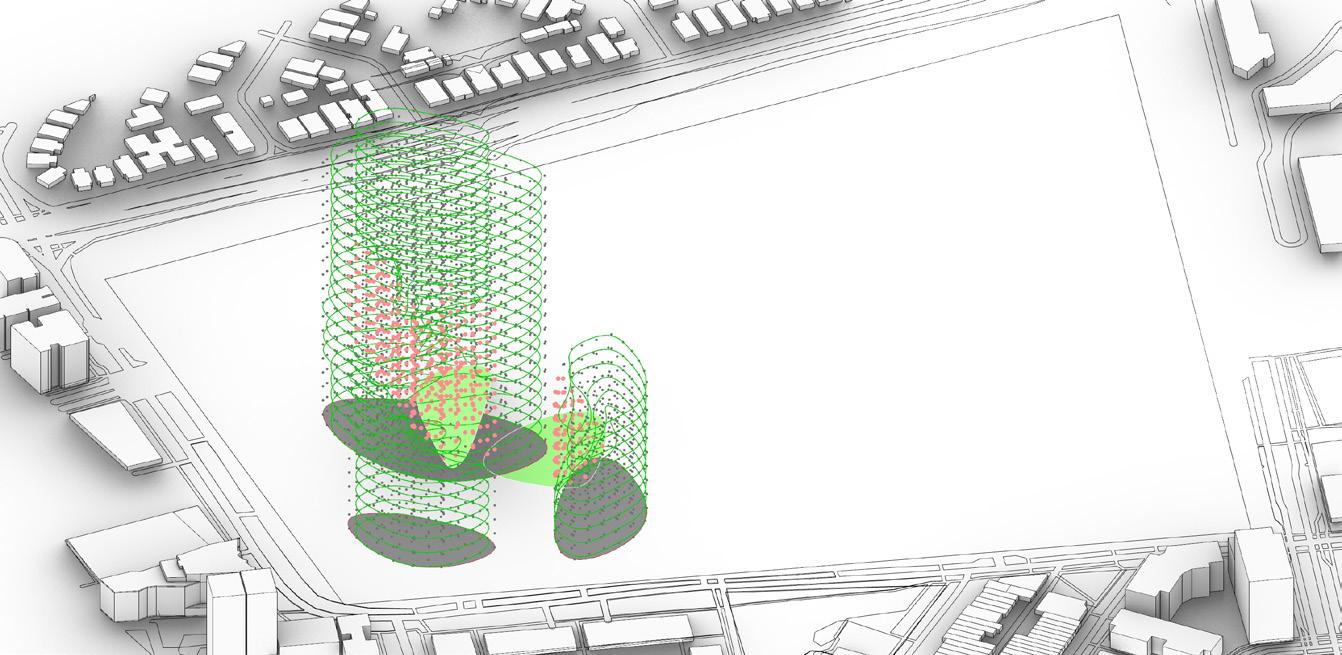
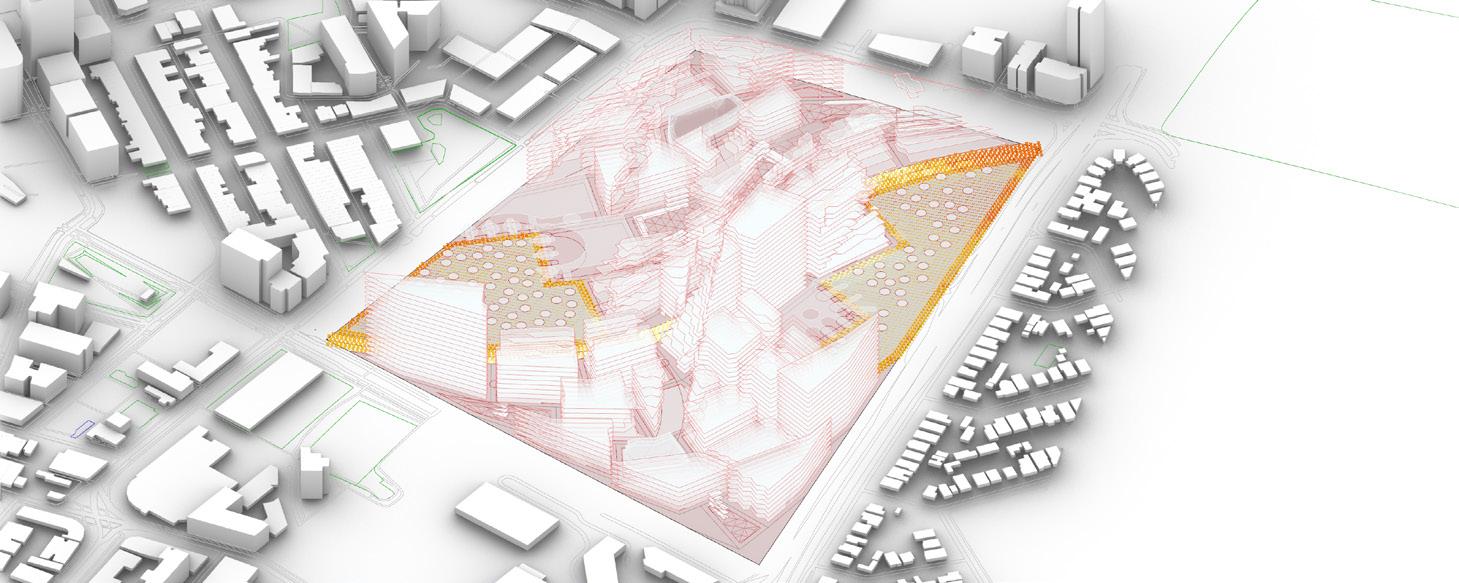
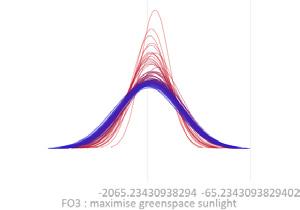
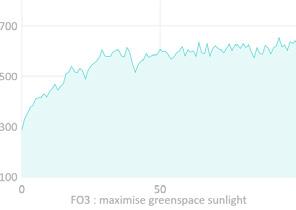
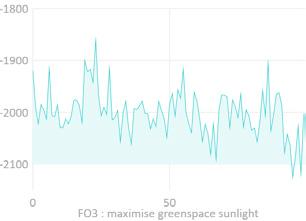
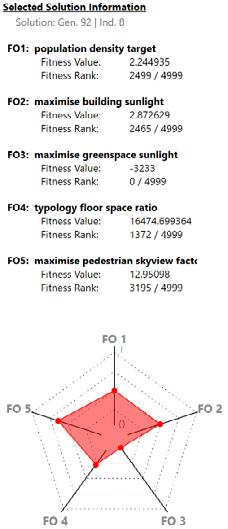
[14] Fitness Objective 3 | Maximise Greenspace Sun
Maintains Zetland’s existing pedestrian quality of high solar exposure on public and green space
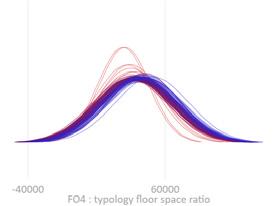
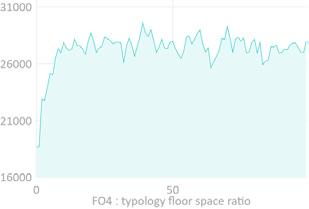
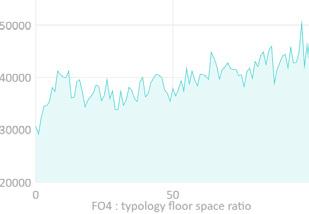
[15] Fitness Objective 4 | Optimise Typology FSR
Seeks an optimal balance between typology floor space ratios of 2:2:1 - residential; mixed use; green space
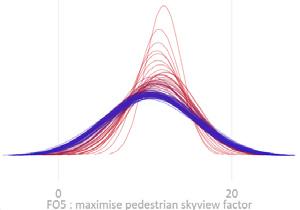
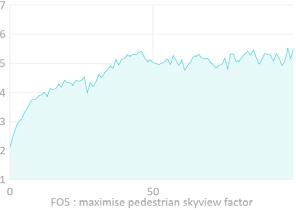
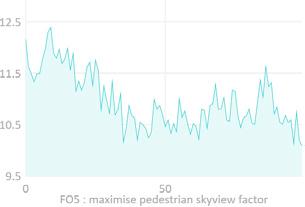
Maximises sky view exposure at pedestrian junctions
The evolutionary engine parametrically controls the shape of the main avenue, building heights, and the depth and angle of street divisions. Instating different slider values to achieve optimal results between the five fitness objectives.
A series of logic gates based on plot size and proximities dictates plot designation in order to ensure optimal typology relationships, i.e residential plots neighbouring open green space, community hubs designated based on number of neighbouring residential plots, etc.
This mix of controls between the designer and the algorith maintains the best qualities of both approaches, utilising the engine as a tool to aid design rather than replace it.
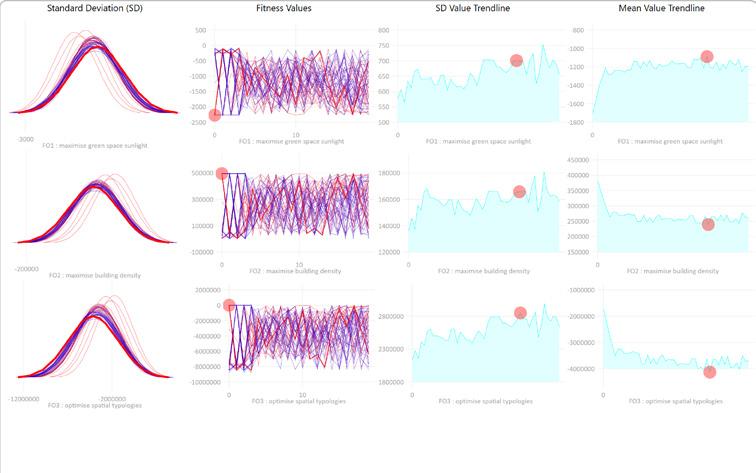
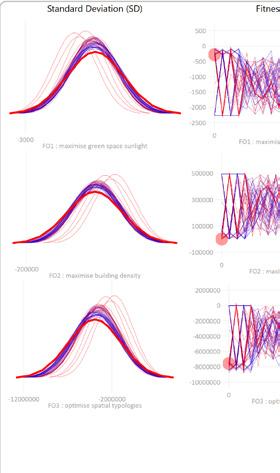
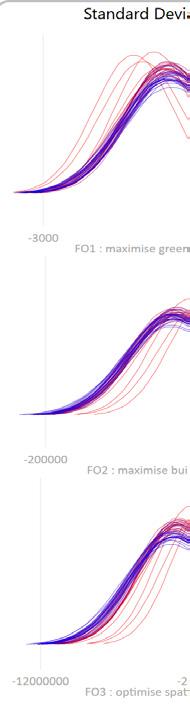
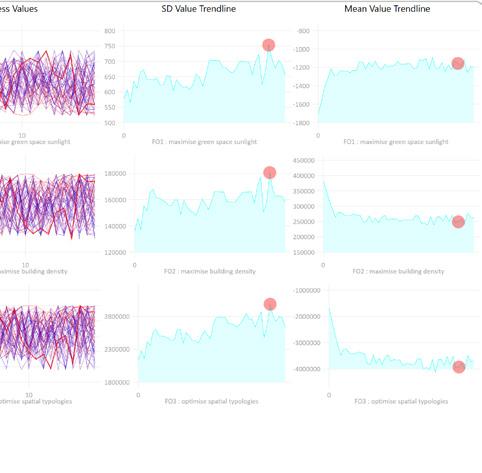
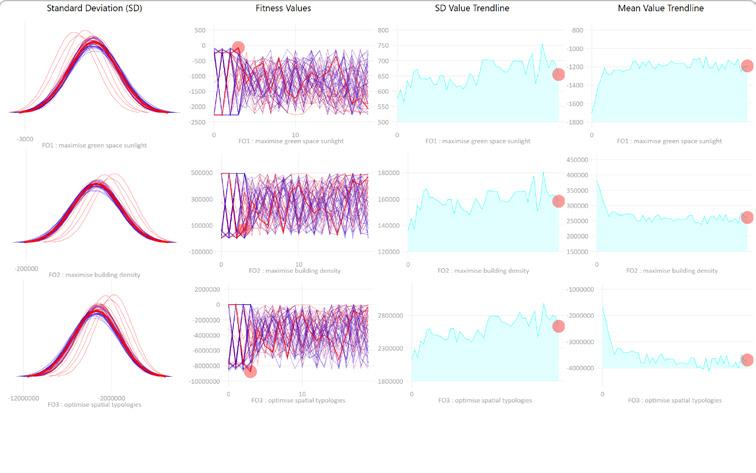
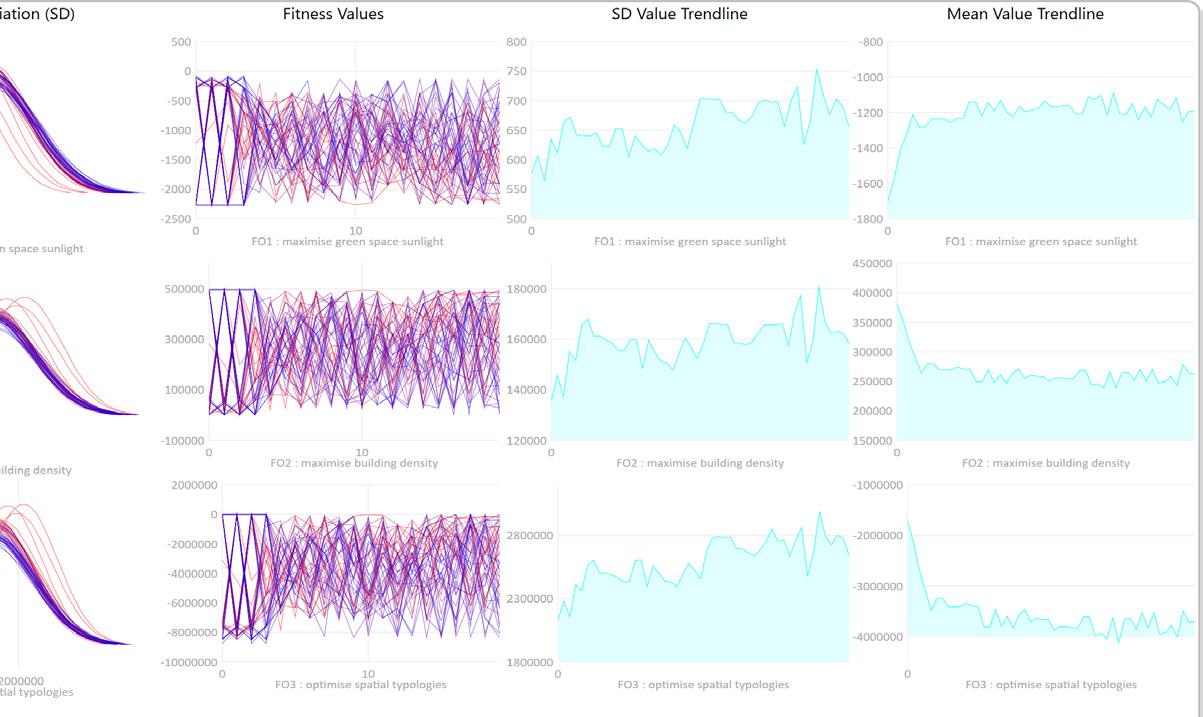
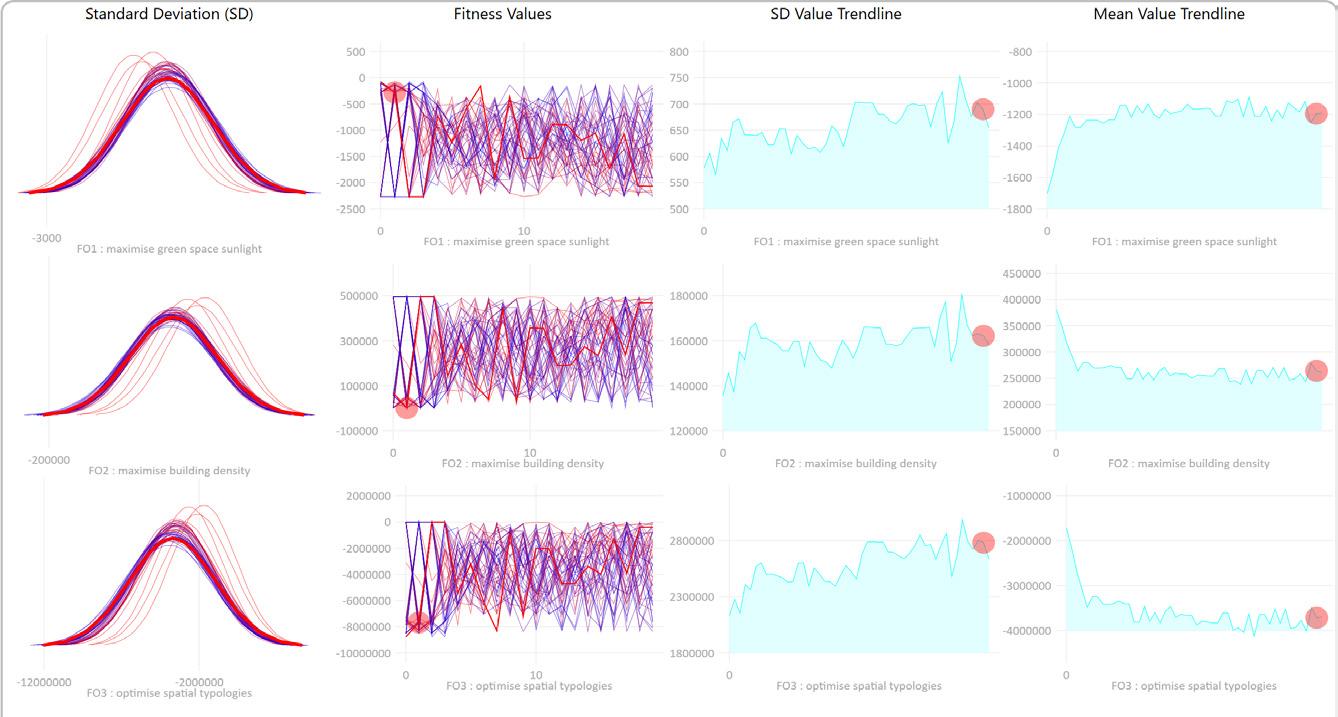
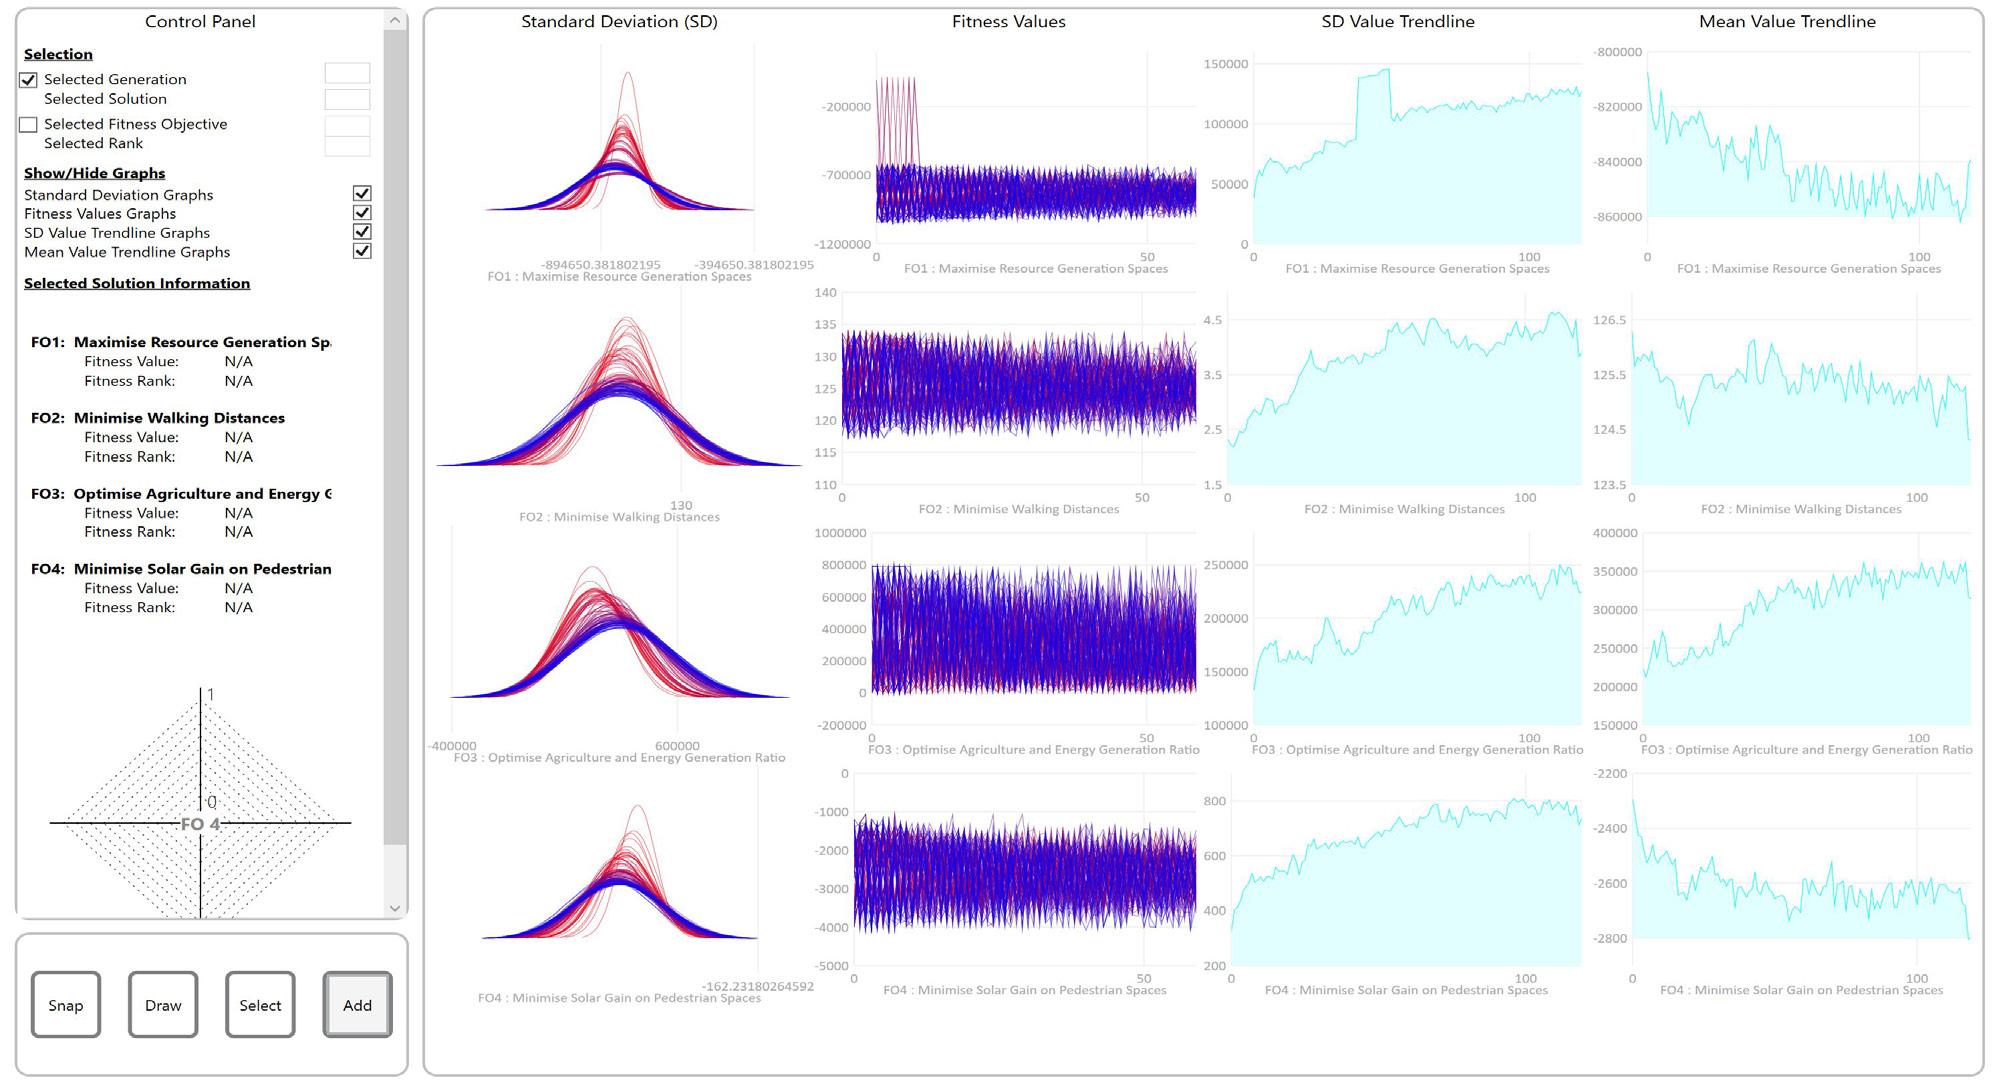
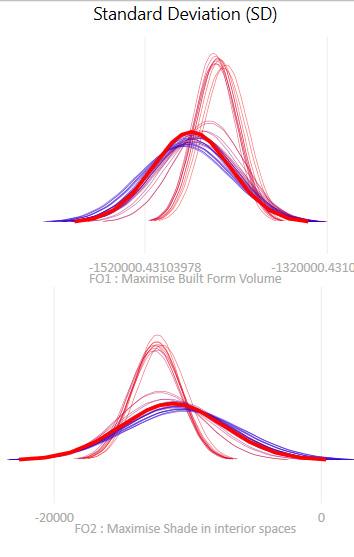
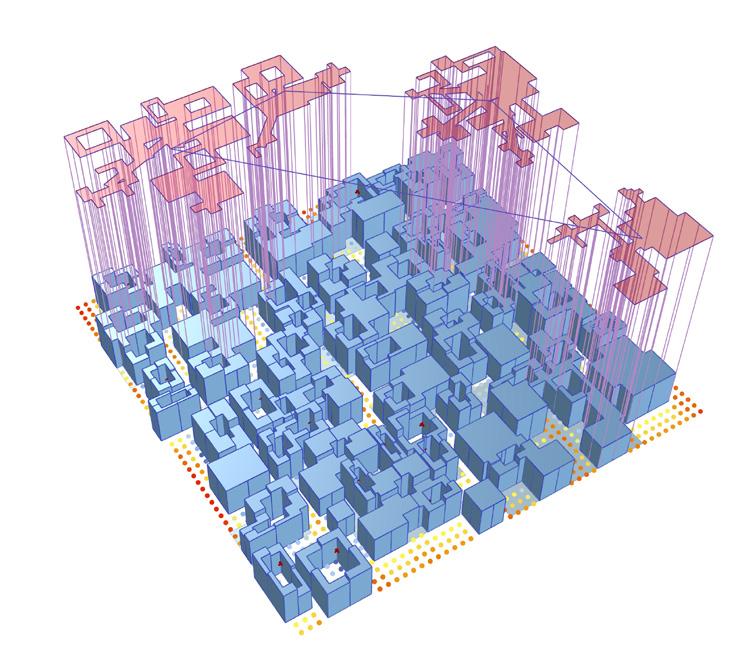
[17] Standard Deviation Chart: Red indicates early results - Blue indicates progressive results
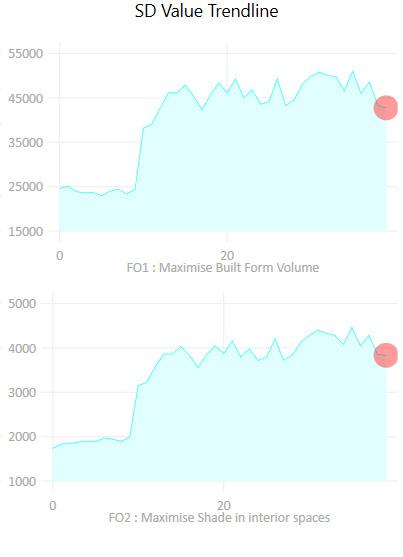
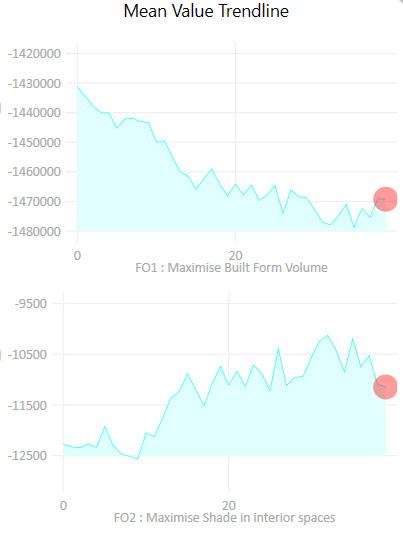
[18] Standard Deviation Value Trendline: X axis indicates result chronology - Y axis indicates result variation [19] Mean Value Trendline: X axis indicates result chronology - Y axis indicates result performance {0 = optimal}
From the 5000 results, analysis for selection involves a multi step process. The first of which is analysing the data in numerical terms as seen in the charts above. From this data we can see that while results converged towards more optimal models as the simulation continued, variation between these results also increased. This data tells us that vastly different configurations were capable of achieving high levels of optimisation [20] Parallel Coordinate Plot
The engine repeated simulations for a result pool of 5000. Built from 50 individuals x 100 generations. Wherein a single generation’s individual results vary slightly in arrangement from precise adjustments of slider values, while progressive generations invoke more substantial adjustments, incorporating data of previous generation towards a more optimal result.
Selection Results [22]
As there are over 200 pareto front ‘optimal results’ a secondary selection process takes place to filter these results into 16 individuals that can be further analysed both visually and numerically.
These 16 results are constituted as follows:
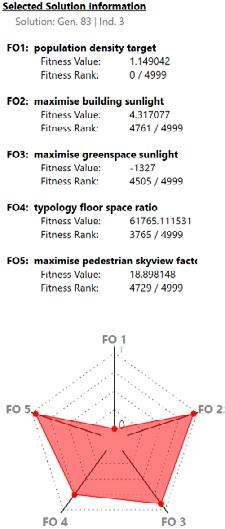
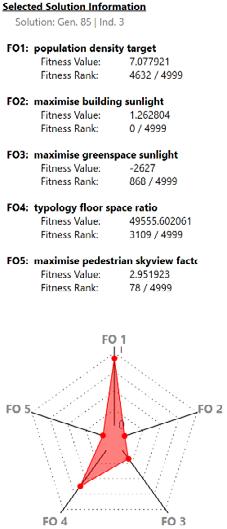
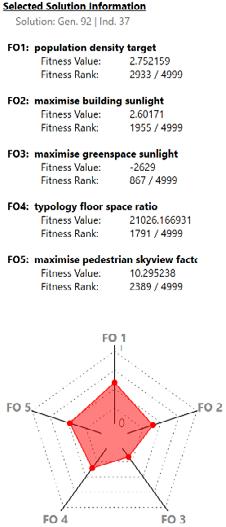
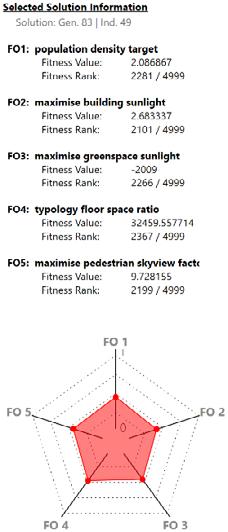
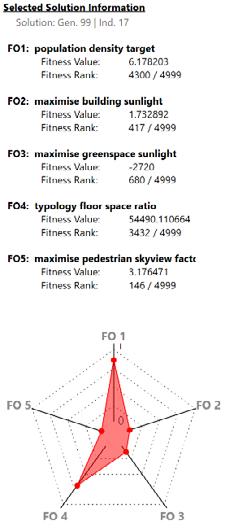
The highest performing weighted average result across the five fitness objectives. {1}
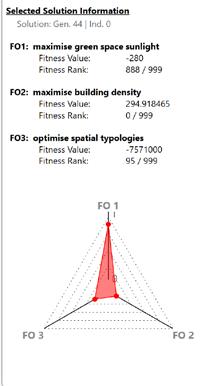
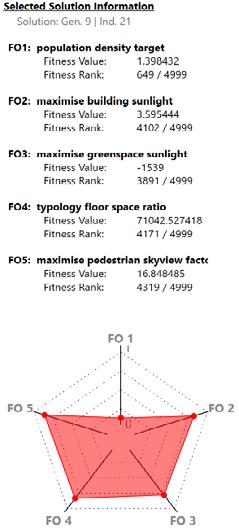
The result with the lowest relative difference in performance between the five objectives. {1}
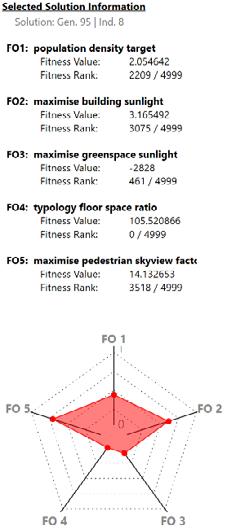
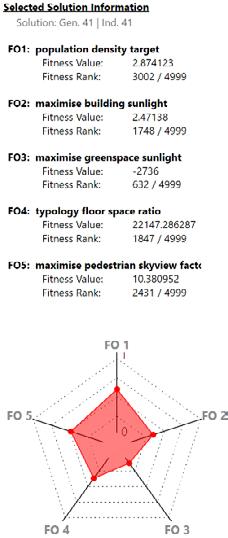
The best performing result in each of the five objectives. {5}
9 pareto front solutions establised throgh k-means clustering. Wherein optimal results with similar fitness objective performances are grouped together in clusters, with the cluster center (which represents the average qualities of results within the cluster) selected for analysis. {9}
From here results undergo a third round of analysis and selection criteria, wherein the individuals are measured against a set of secondary targets known as phenotypic indicators. These indicators can be considered as objectives that hold less weigthing than the fitness objecitves used to dictate the simulation.
[23] Network Performance: Comparing metrics related to pedestrian street networks in terms of efficency, connectivity, livability. Analysis showed that results of a similar ‘S’ shaped symmetrical avenue prospered.
[24] Pedestrian Spatial Quality : Measuring the availability of amenity such as green space, commercial centers, and community hubs, as well as their proximity for pedestrians. Grid like configurations with a straight avenue prospered.
Residential Hub Performance : Measuring the size, siting, and access of residential hubs which act as key amenity and community centers for the denser residential areas of the suburb.
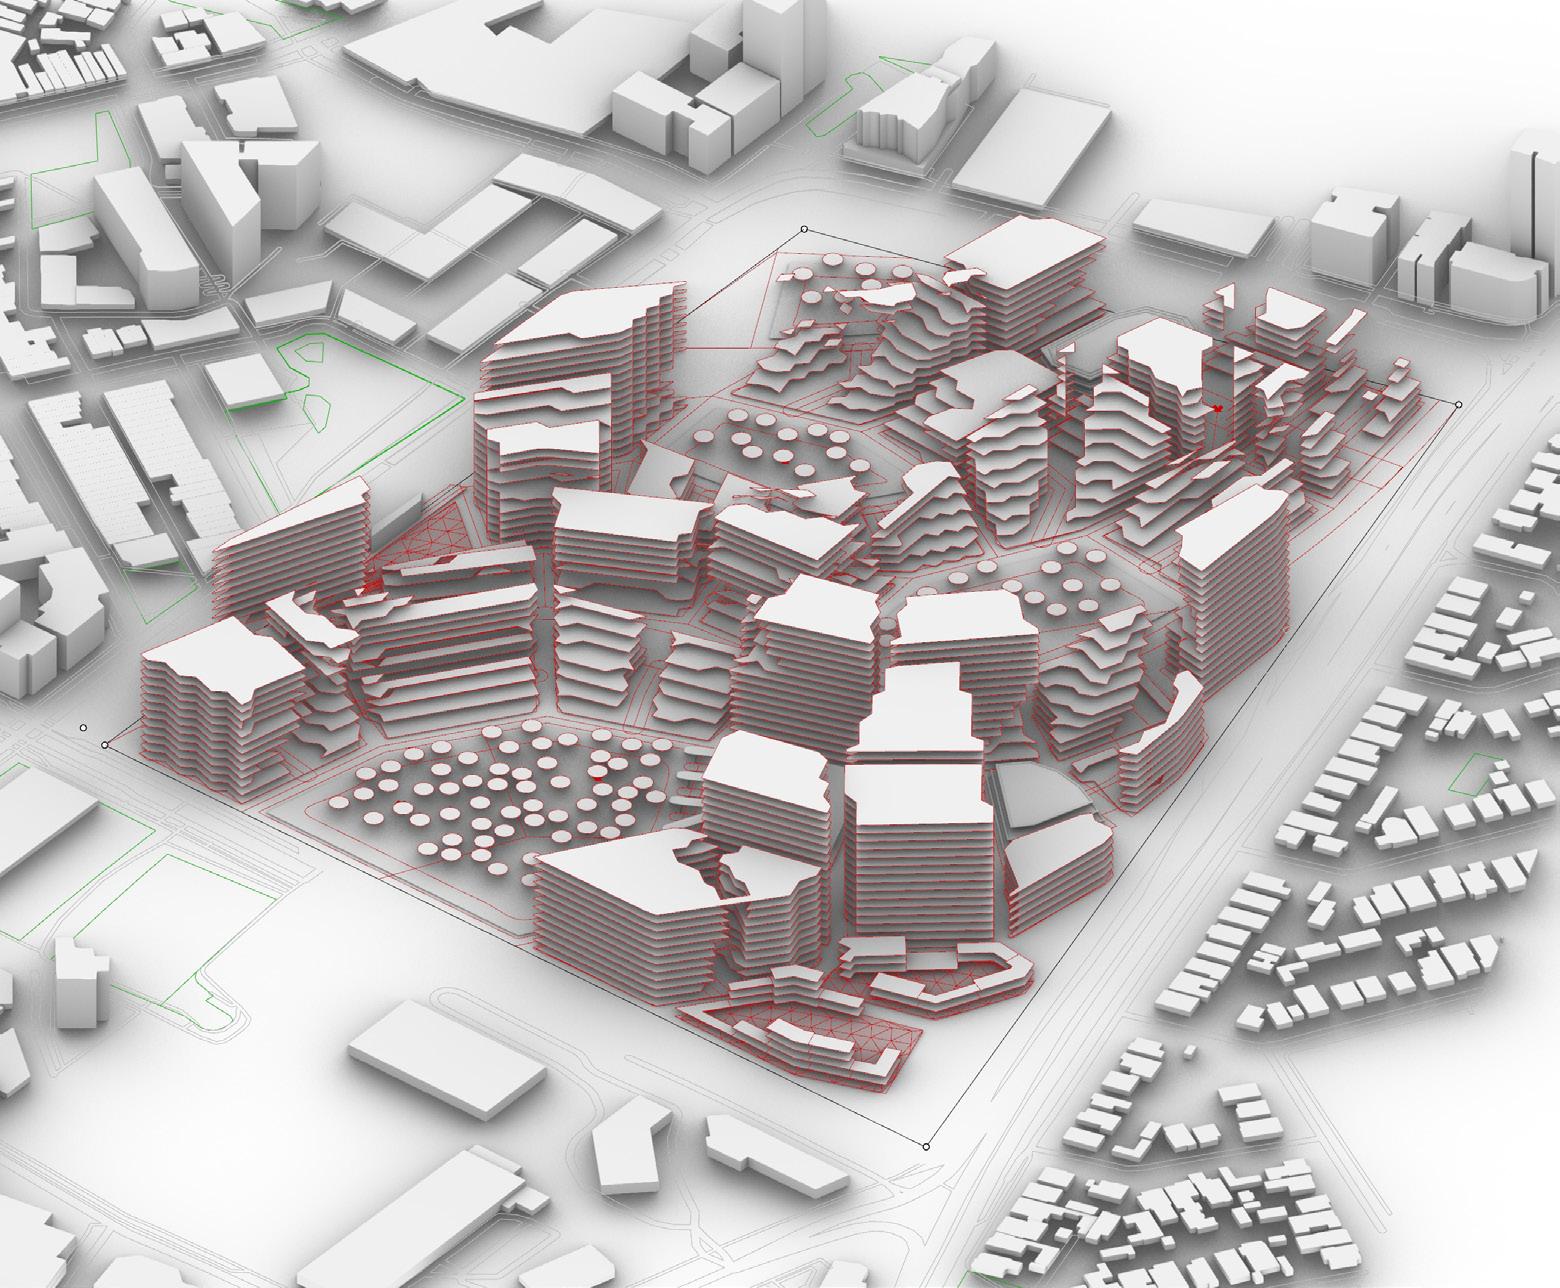
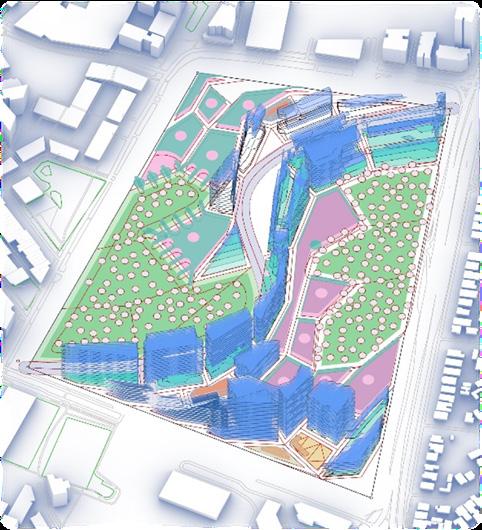
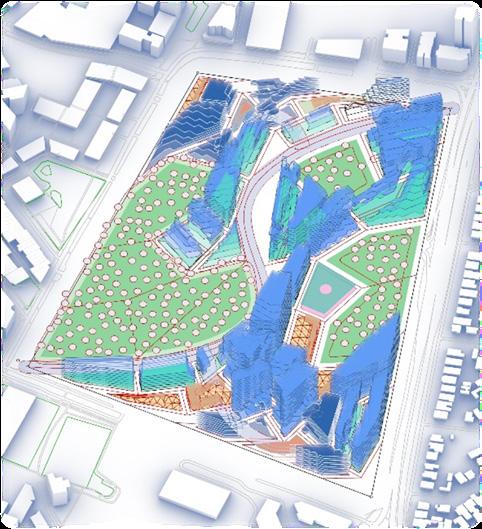
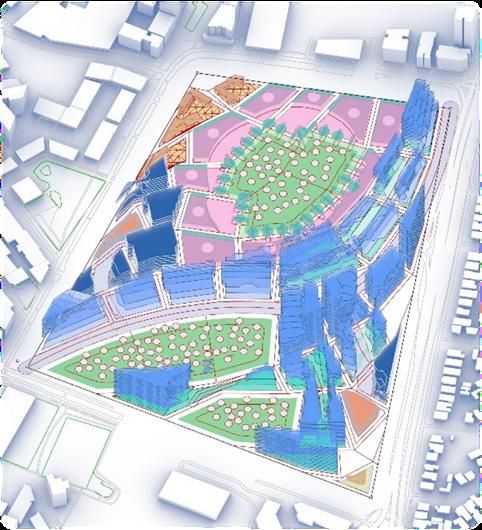
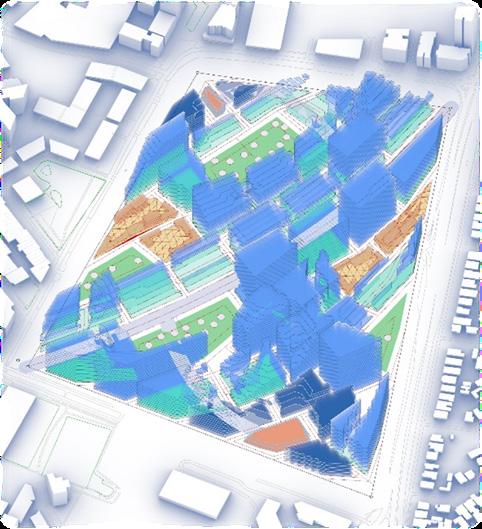
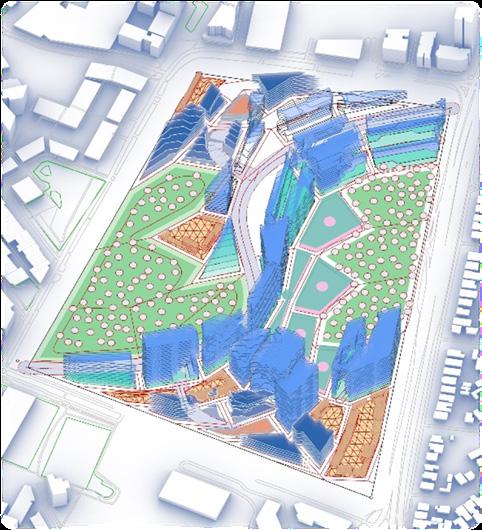
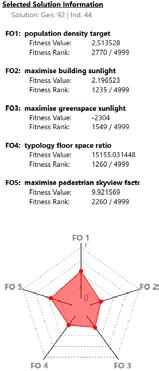
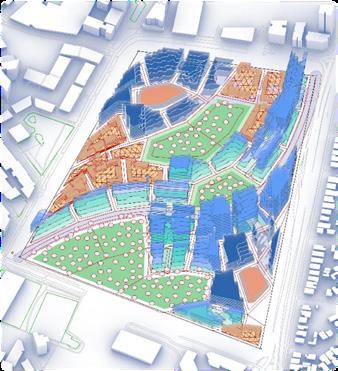
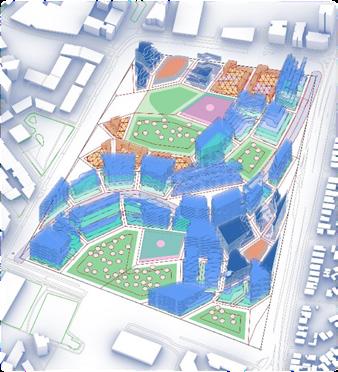
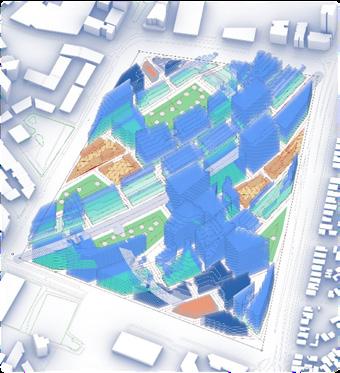
[23] Selected result - Individual 44 Generation 92: Comparing results from all phenotypic indicators, as well as an additional indicator measuring structural overhang, the highest performing individual from the 5000 results was found to be individual 44 of the 92nd generation. The individual featured a symmetrical curve avenue which allowed for green spaces along the avenue on the south side of the suburb, turning this half into largely open public space surrounding the Gunyama community center. While the north side saw a strong residential hub core and green space seperating 2 distinct commercial zones, defining this half as a more trade oriented side of Zetland.
03
Wagga Wagga NSW
In collaboration with Elaine Wang
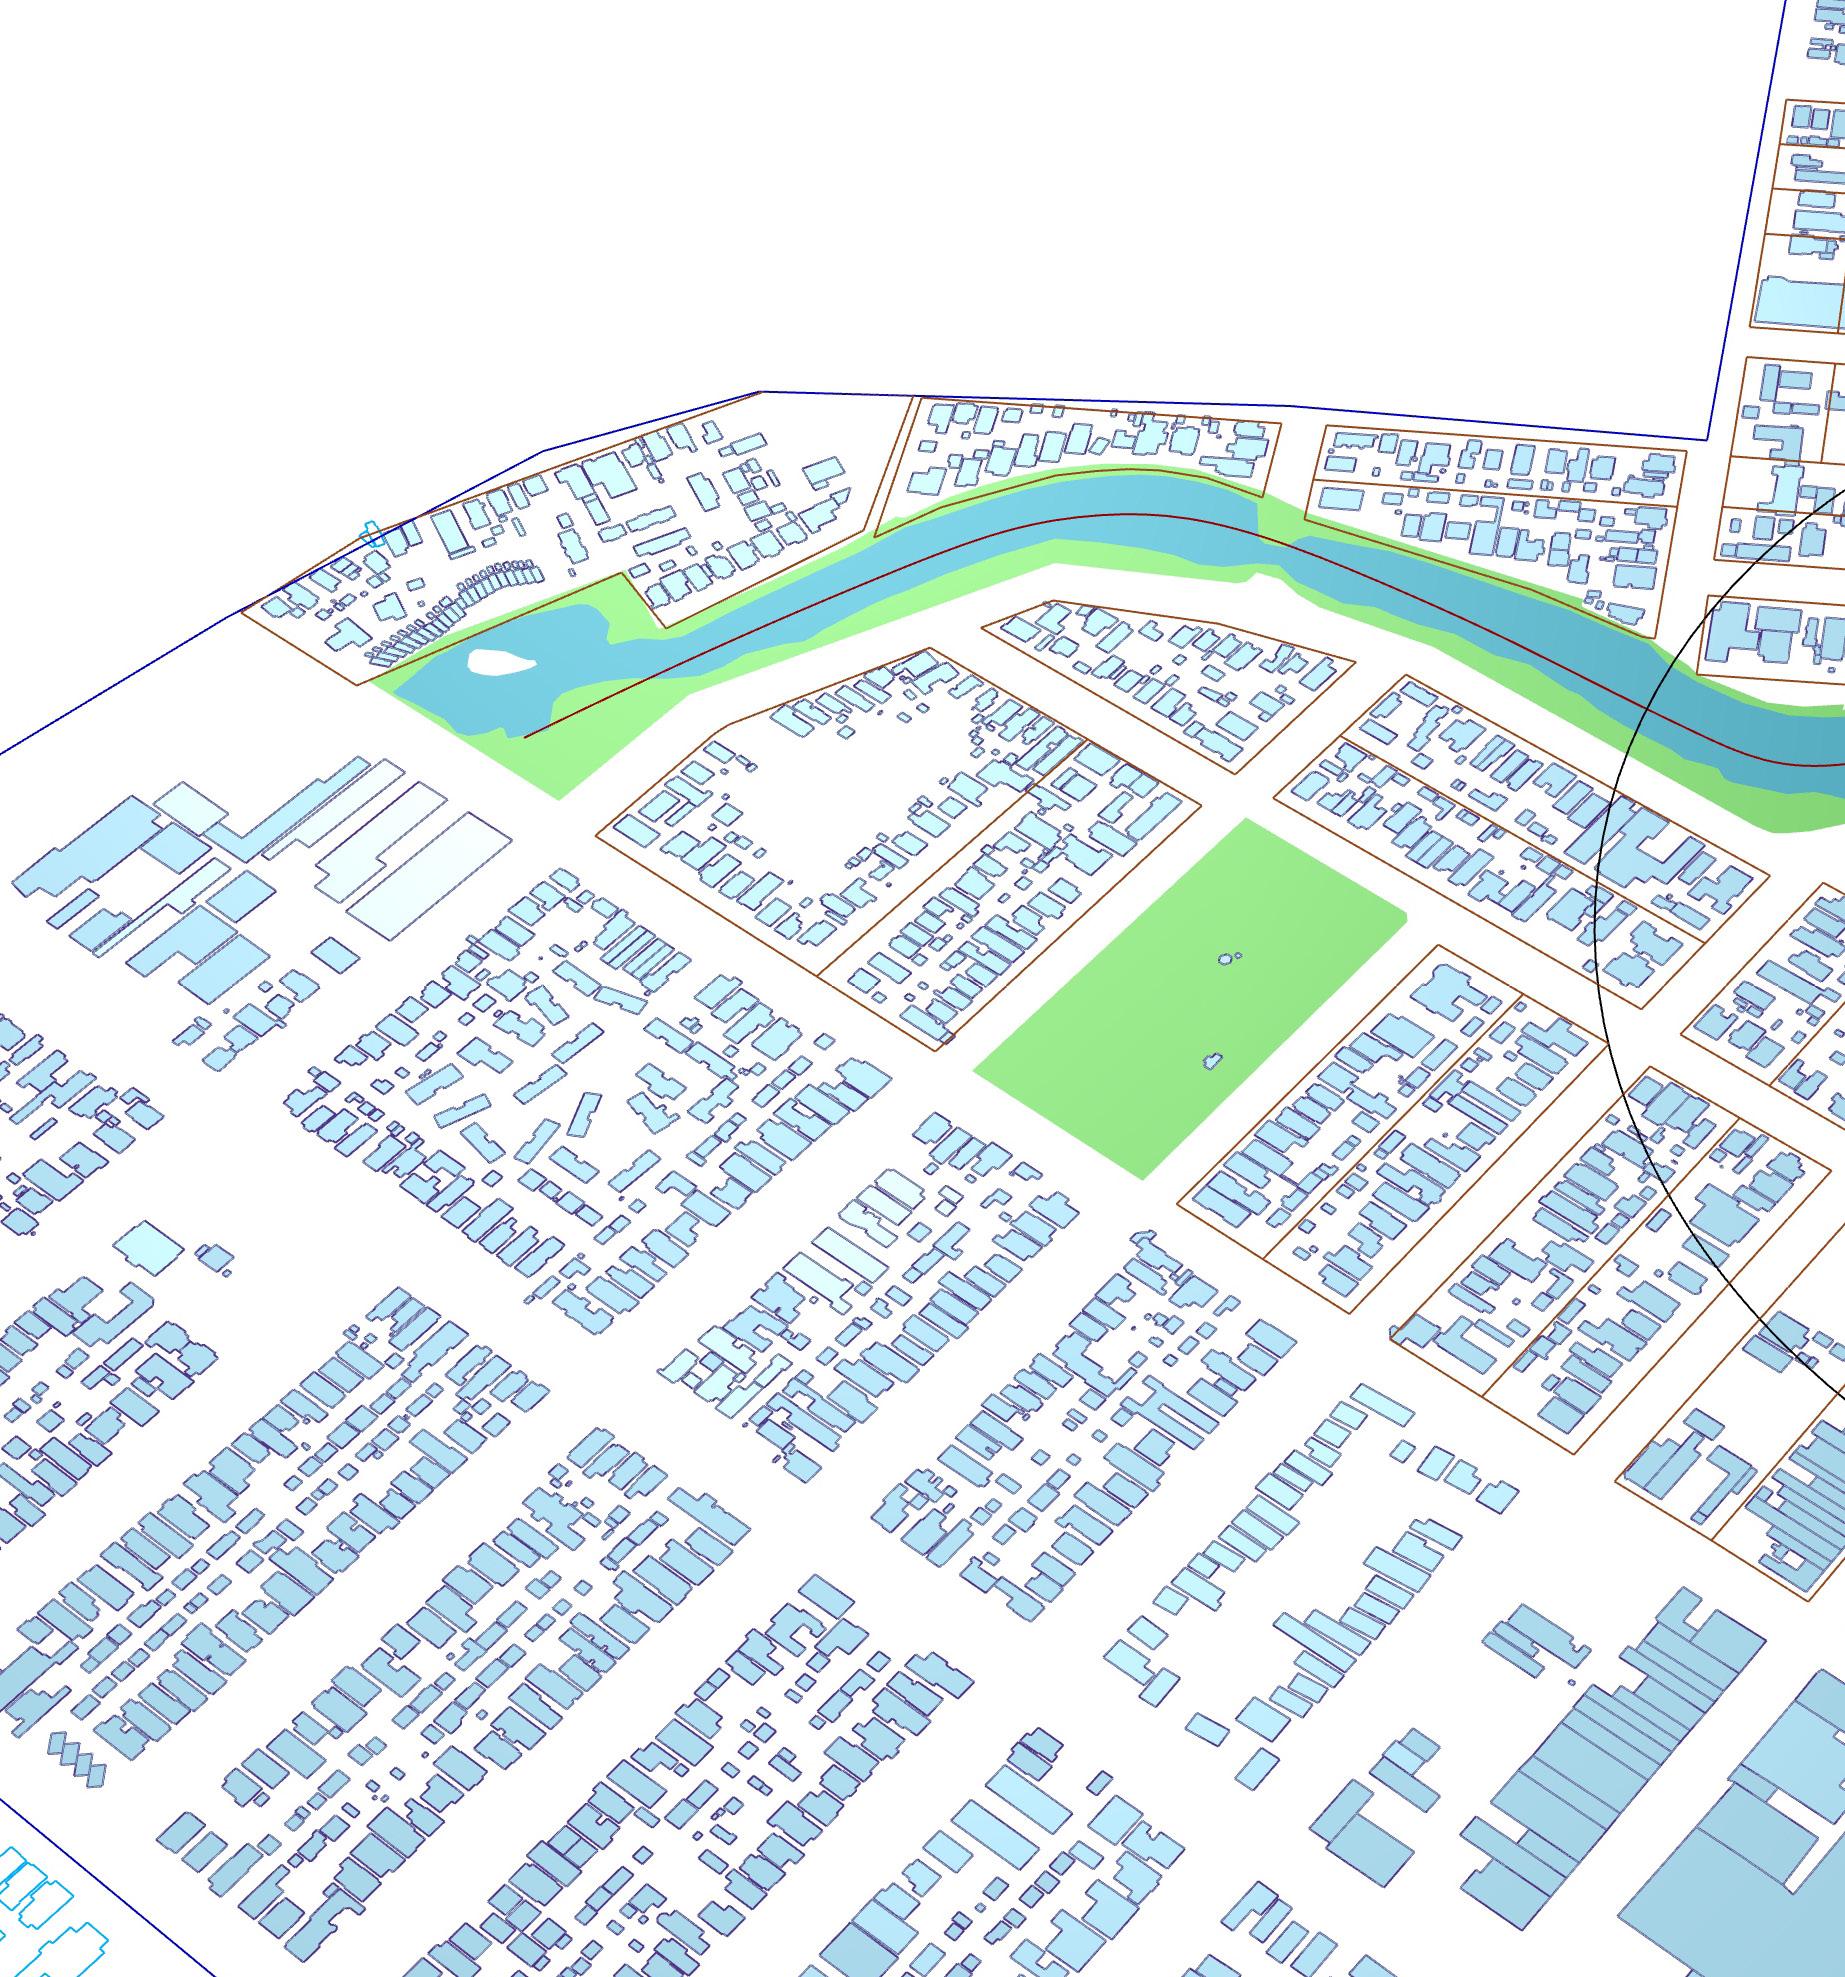
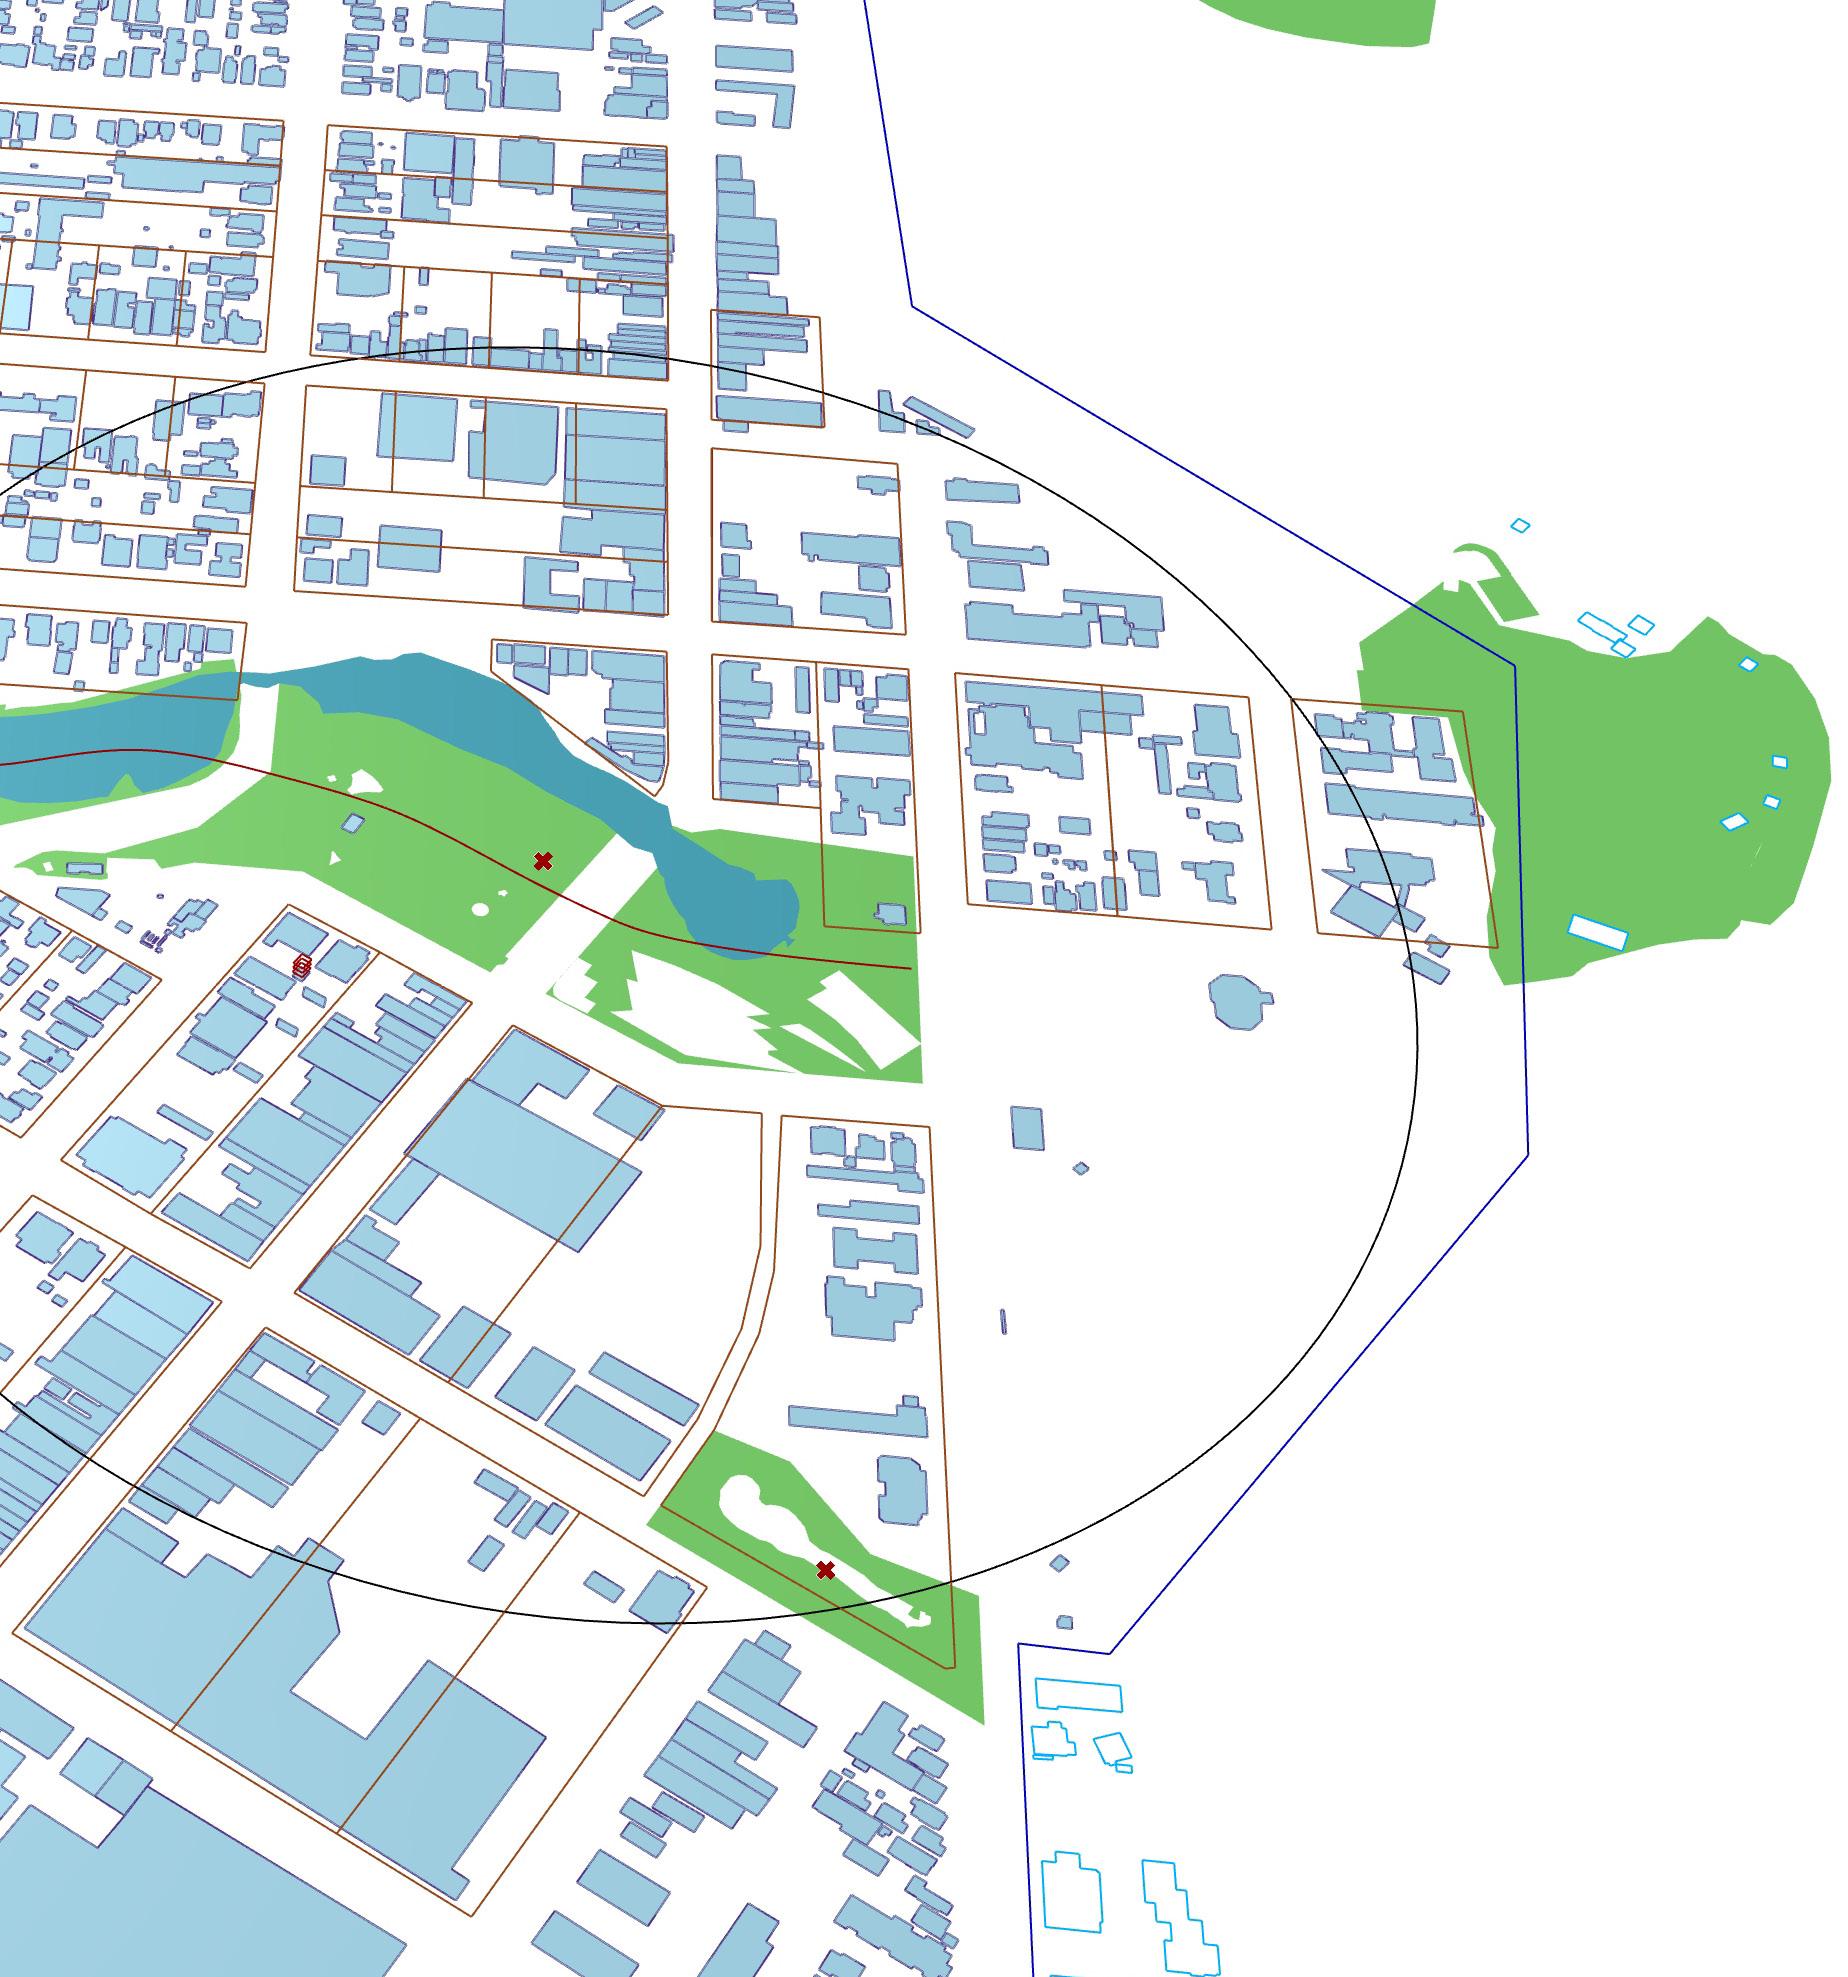
In order to activate the Wagga Wagga CBD, an approach utilising Grasshopper + Wallacei is taken with the aims of increasing density within the CBD and along the lagoon, maintaing sightlines and exposure for heritage buildings and points of interest, maximising sunlight on greenspaces, and increasing the amount of greenspaces available to users in ratio to the increased floor space and density generated.
Grasshopper Construction : 1
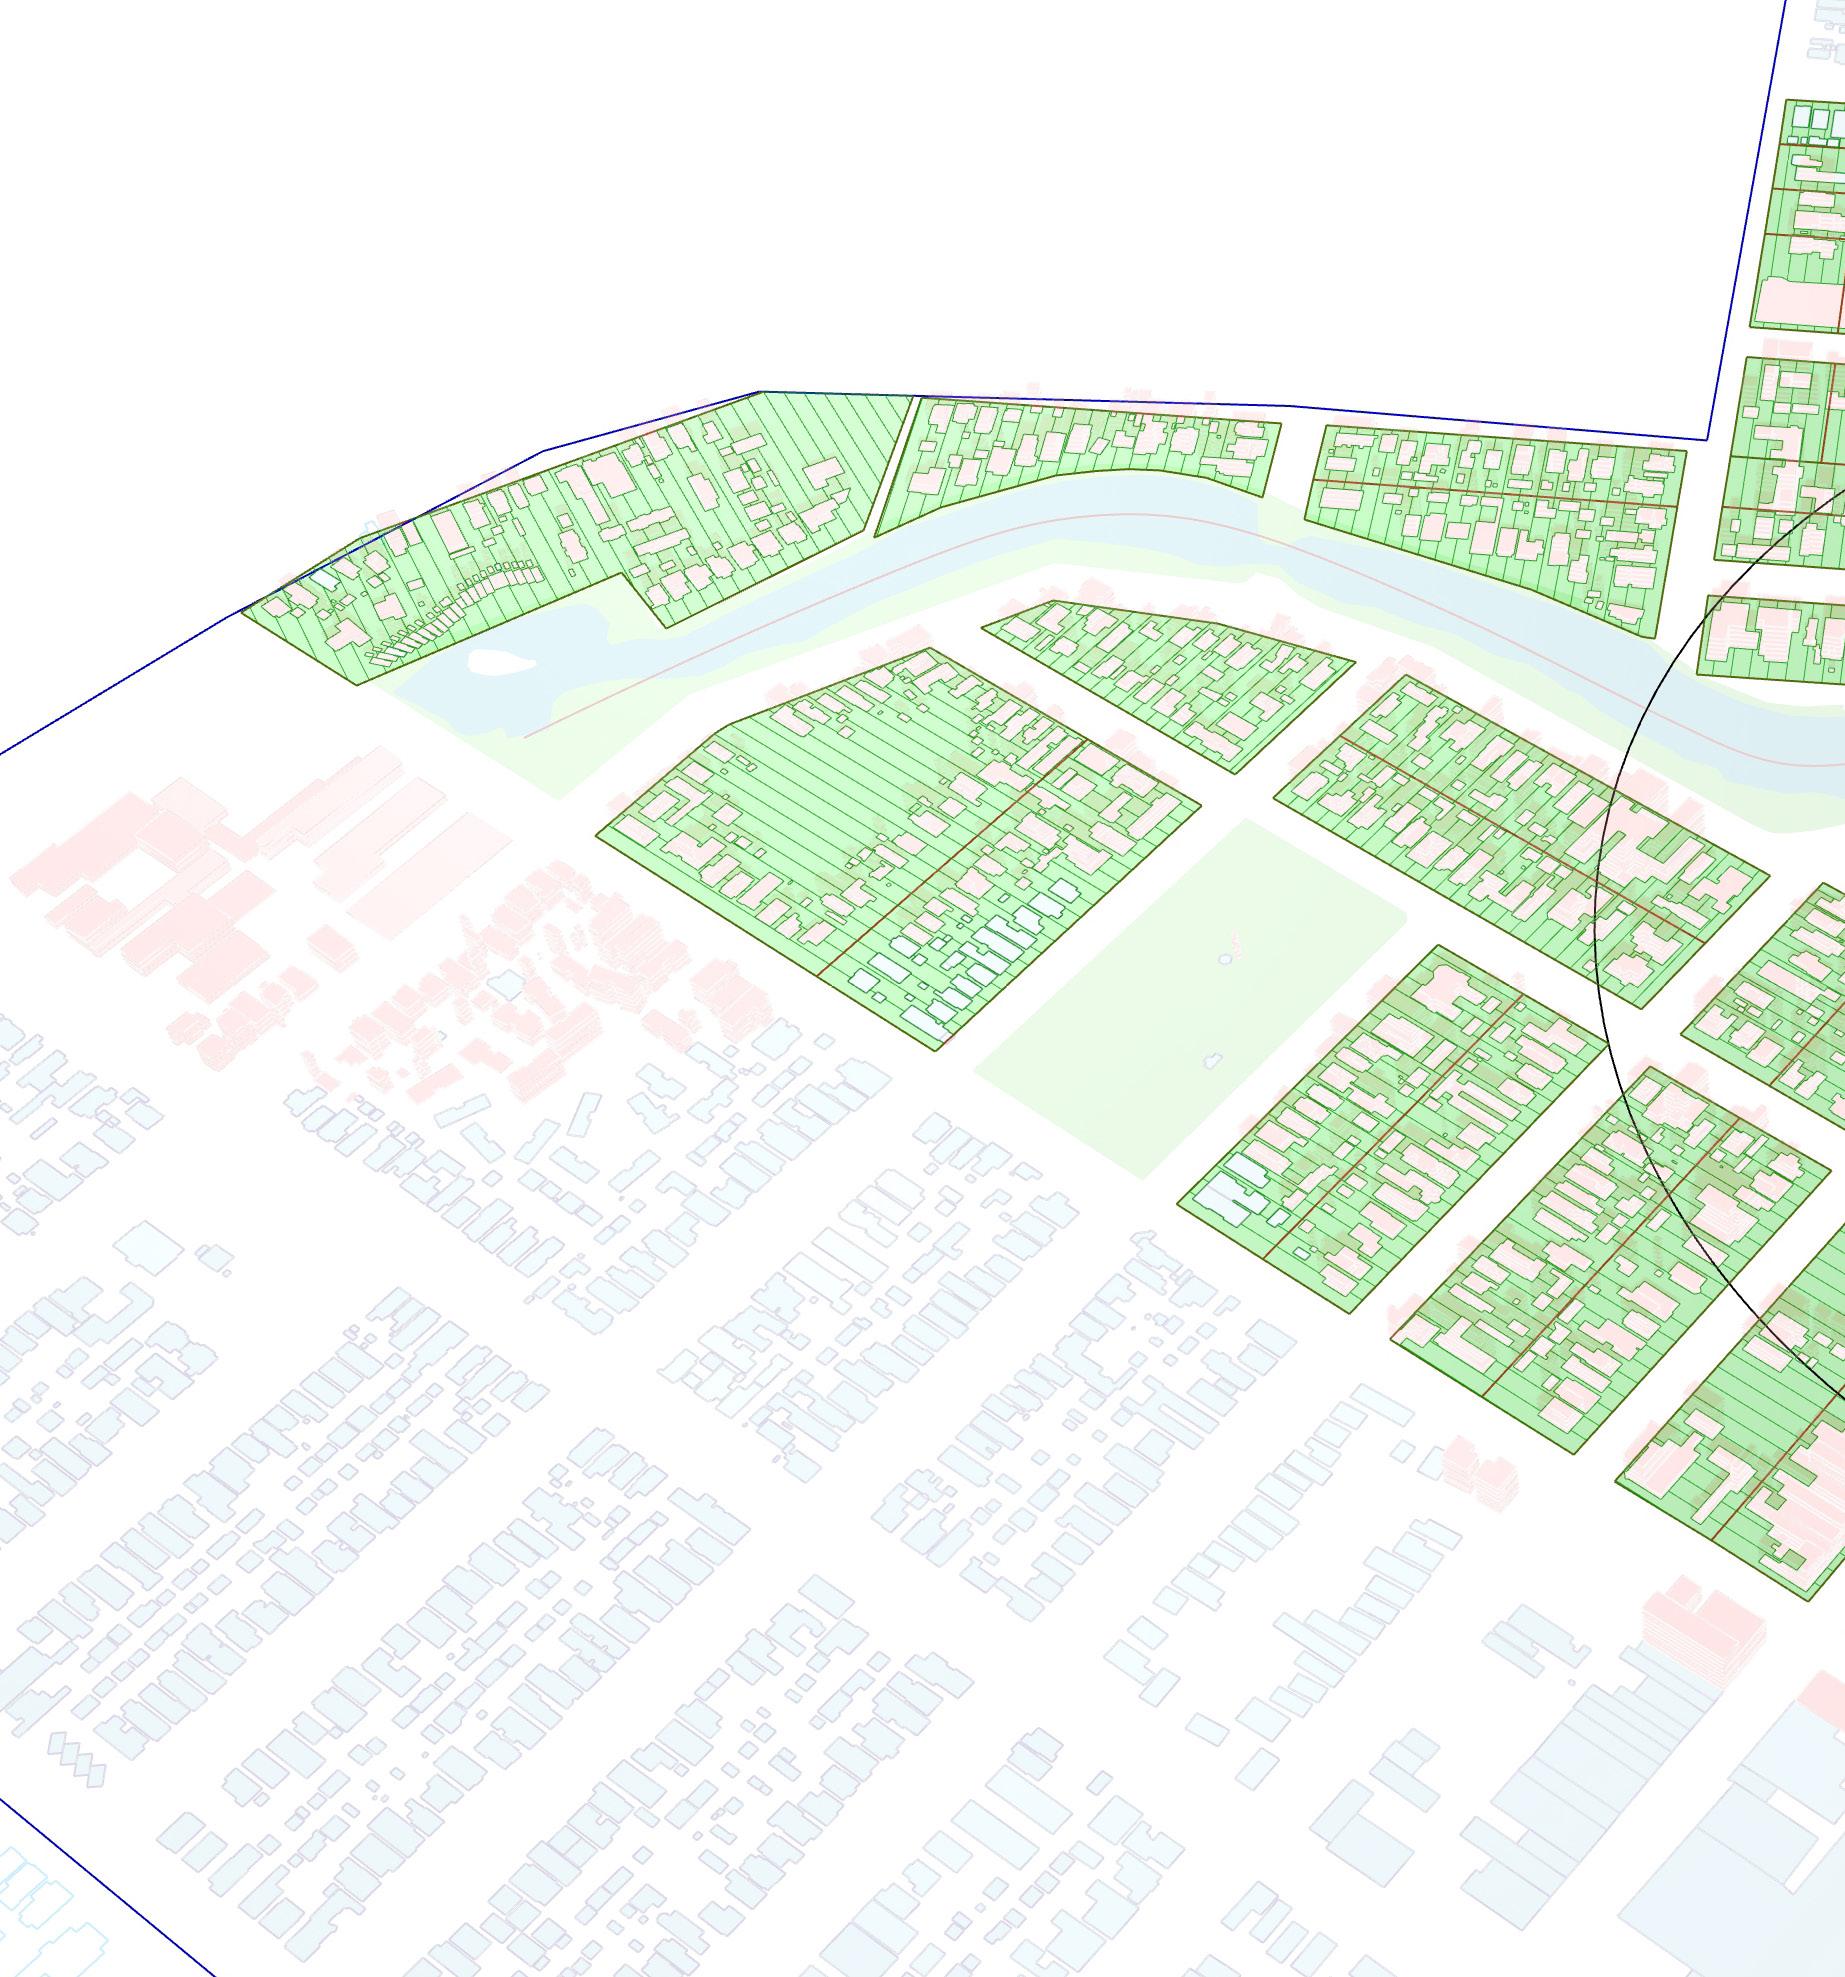
OSM Plot Generation
In collaboration with Elaine Wang
Existing street divisions, building plots, green spaces, and amenity are established utilsing OSM data, providing information on the nature and classification of each of these. From here points of interest are selected to be preserved from changes by the evolutionary engine.
Grasshopper Construction : 2
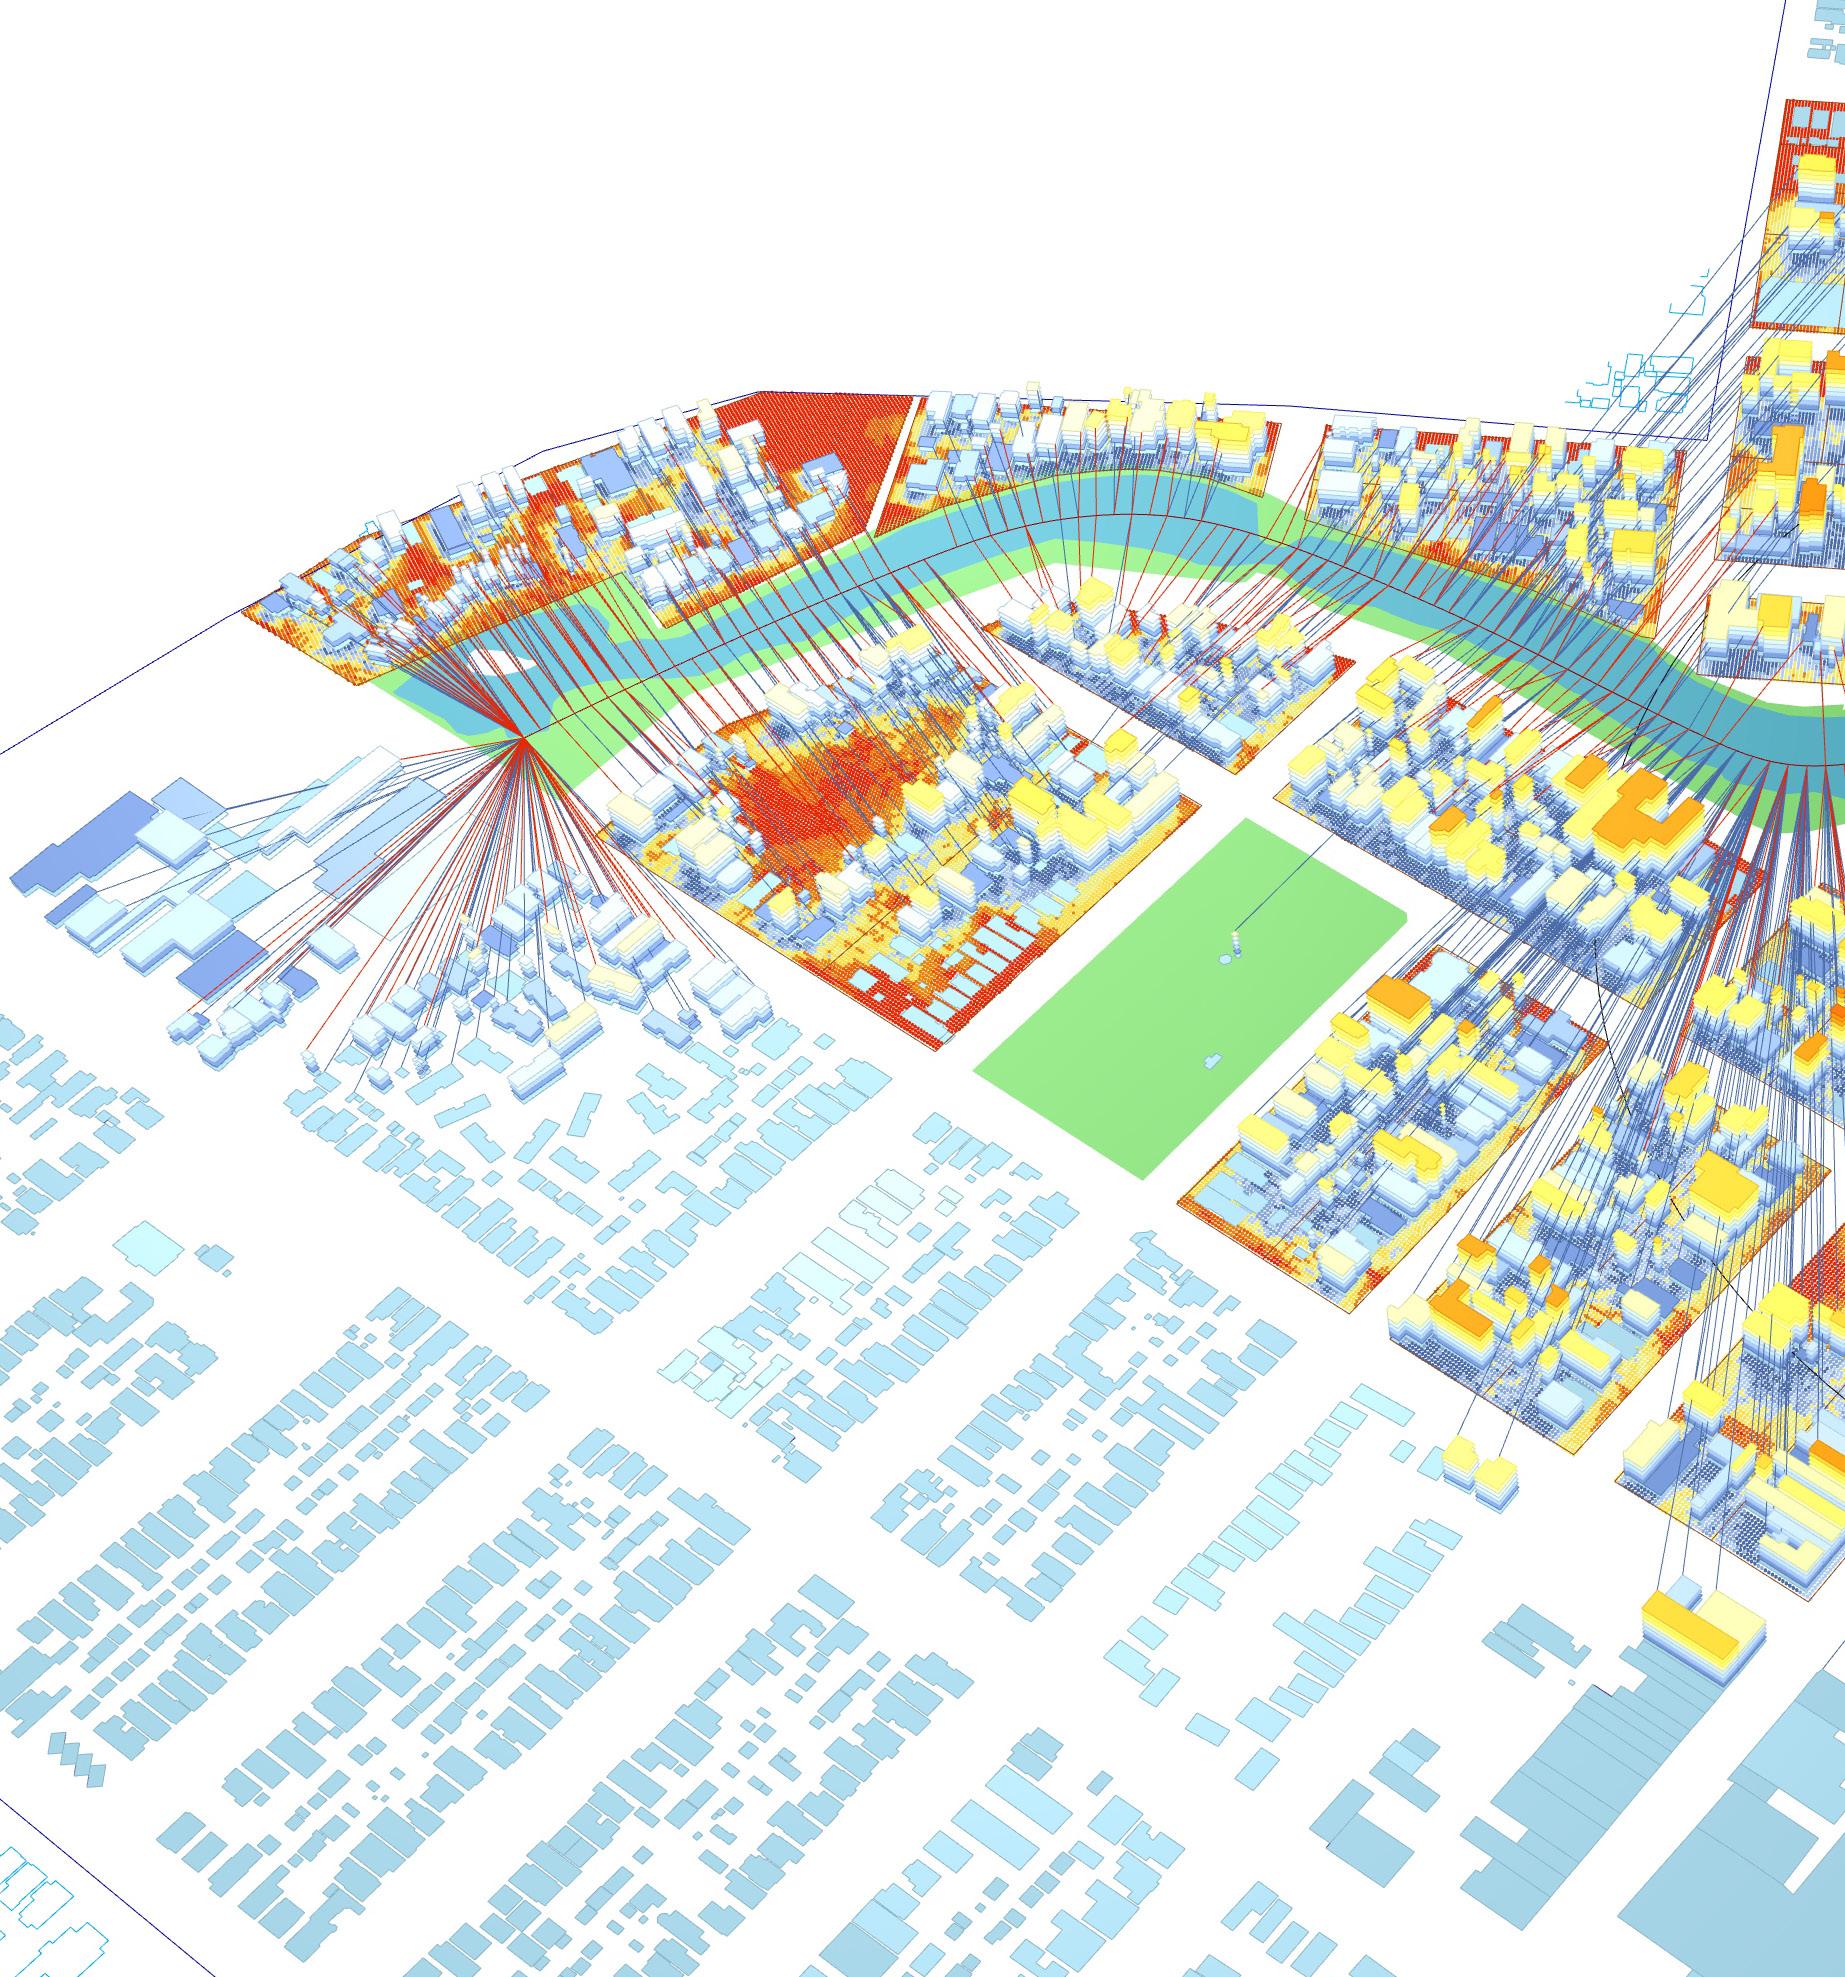
CBD Intensification + Density Paramaters
In collaboration with Elaine Wang
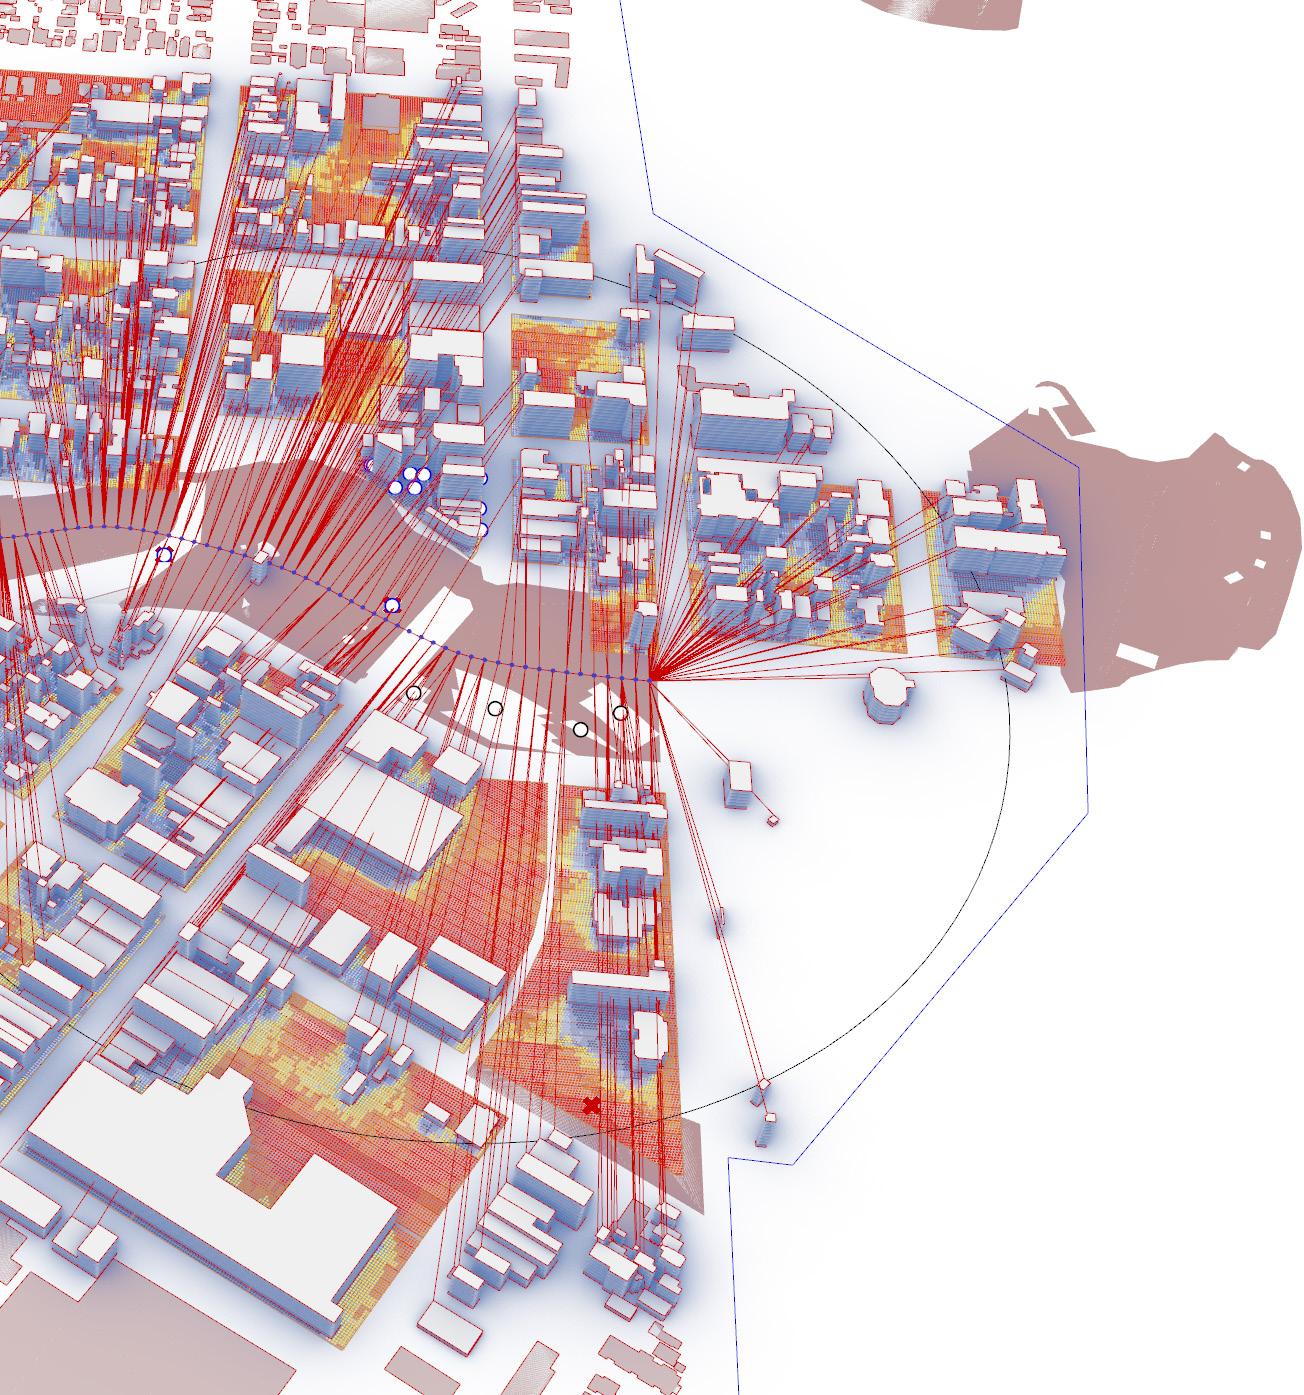
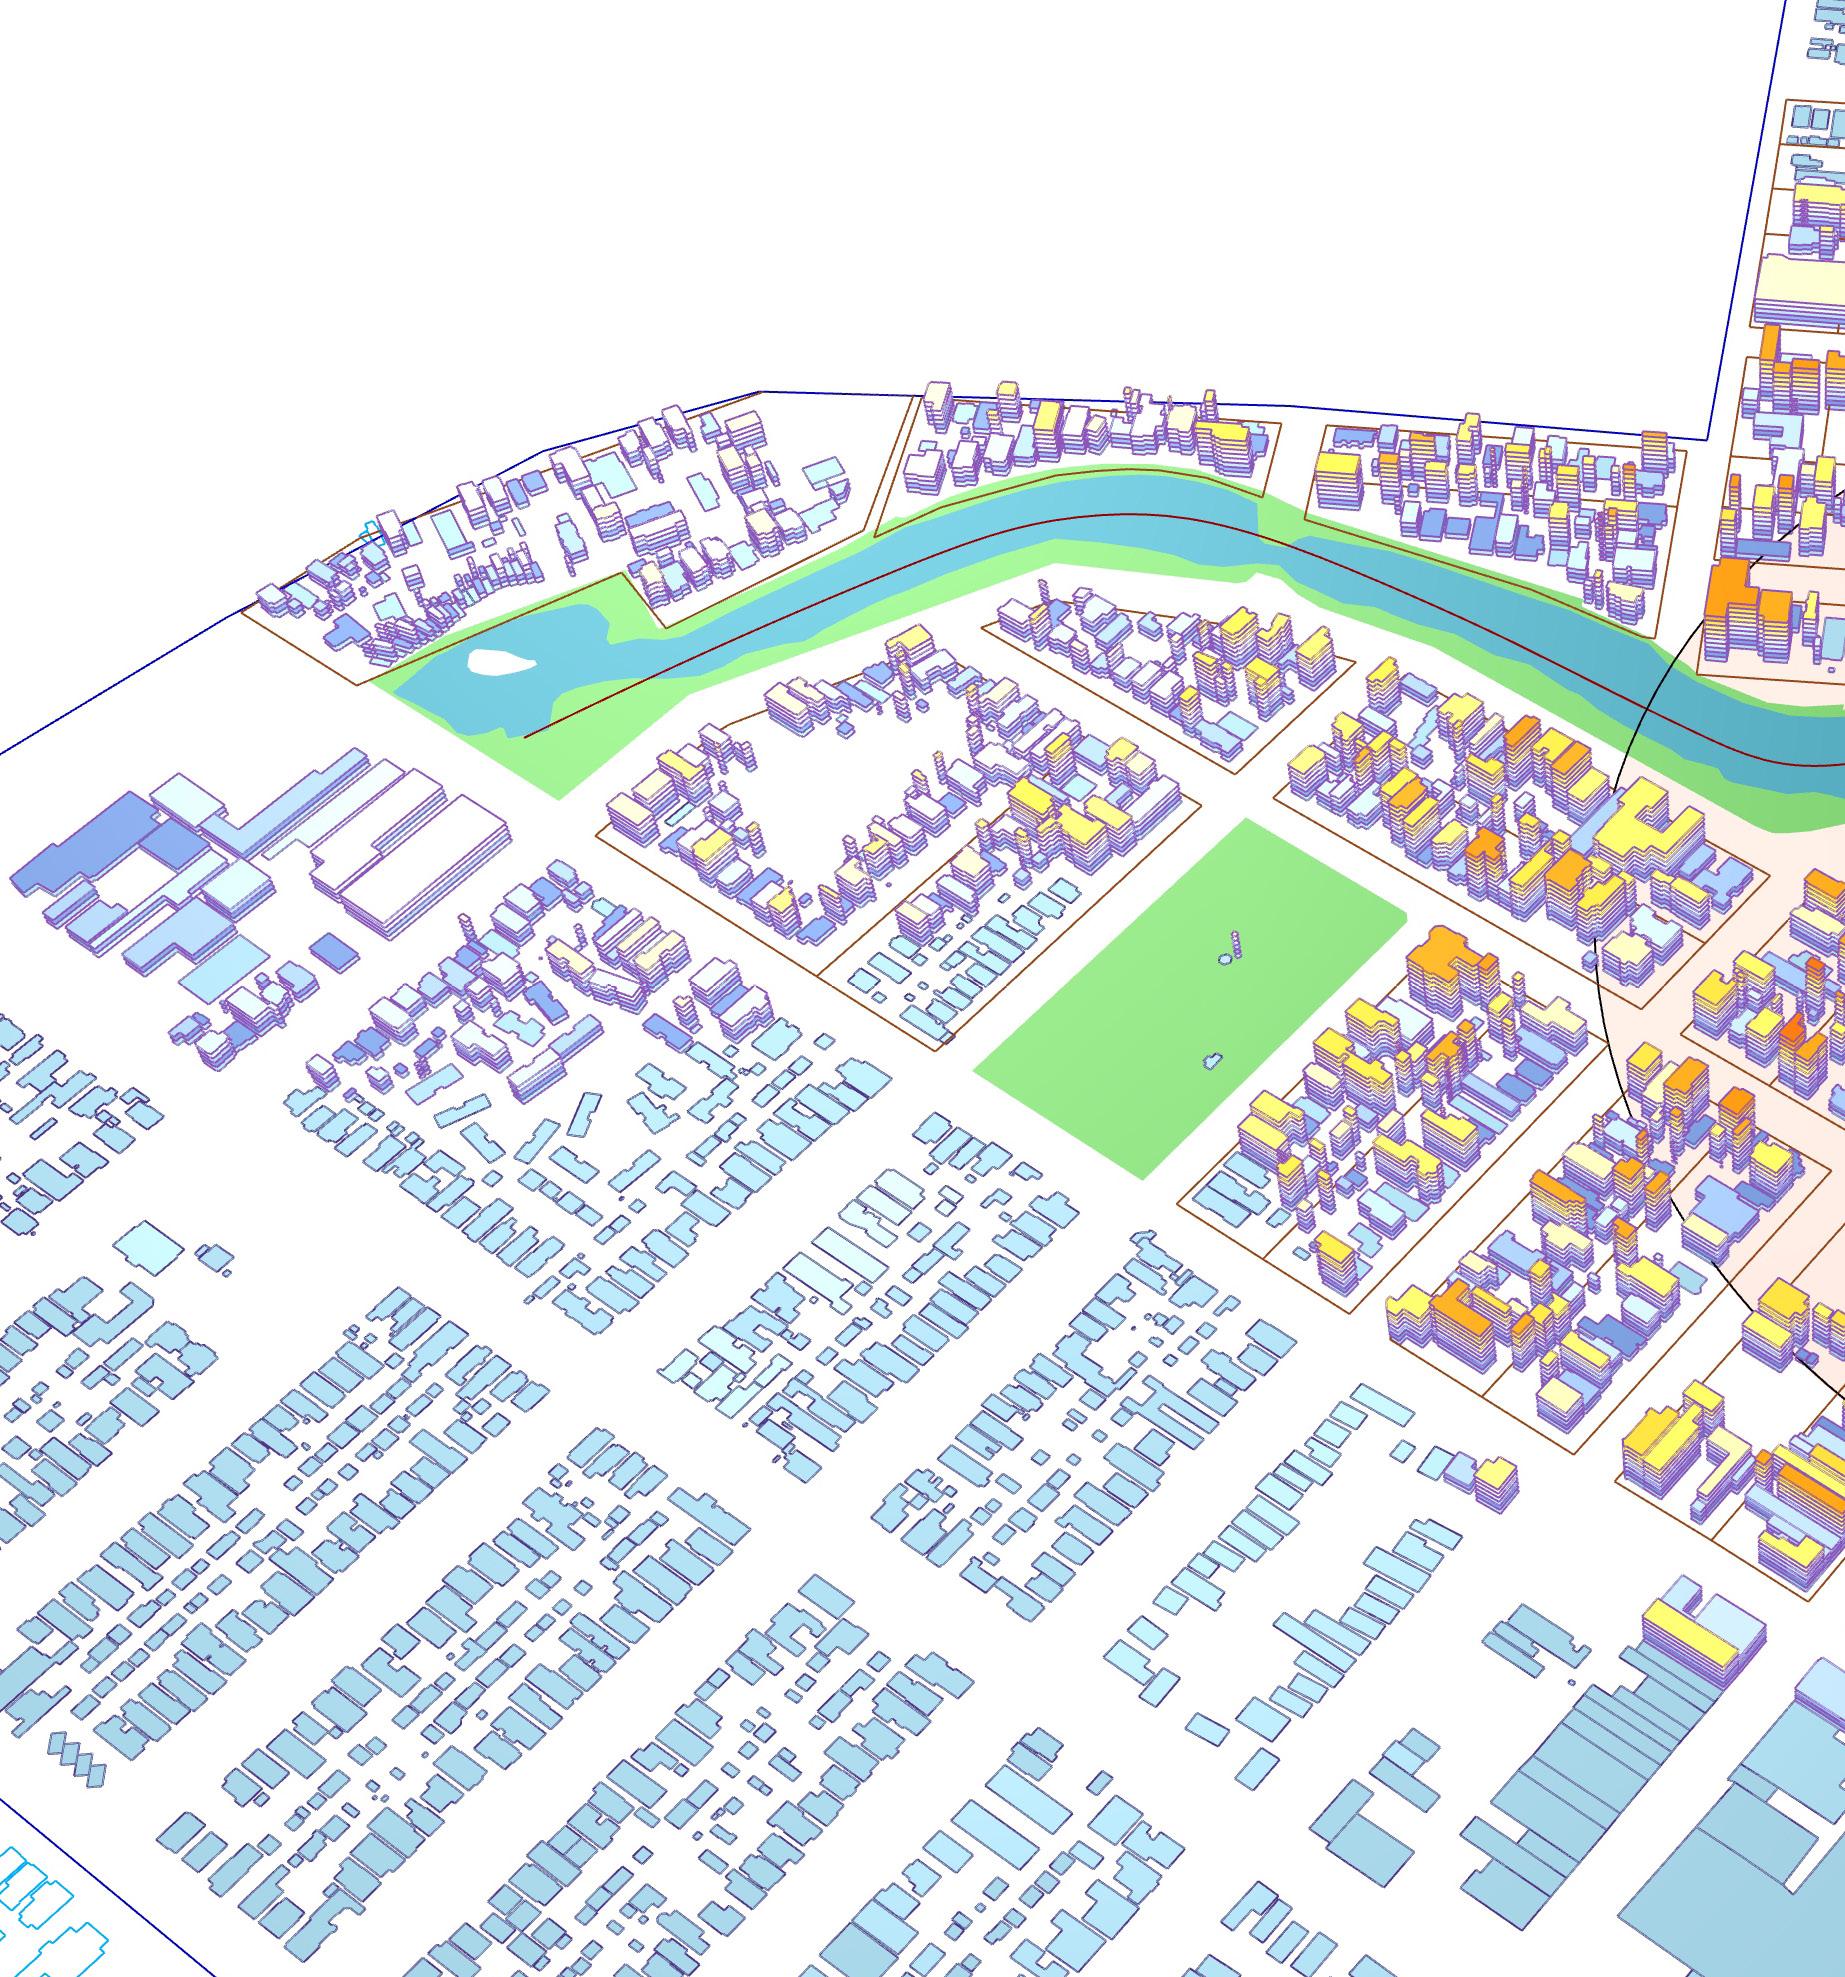
Building plots are given verticality to achieve density targets, the manner in which the paramters are set up causes buildings that are closer to the lagoon waterfront + the CBD cetner experience amplified scaling to focus intensification in these key areas
Grasshopper Construction : 3
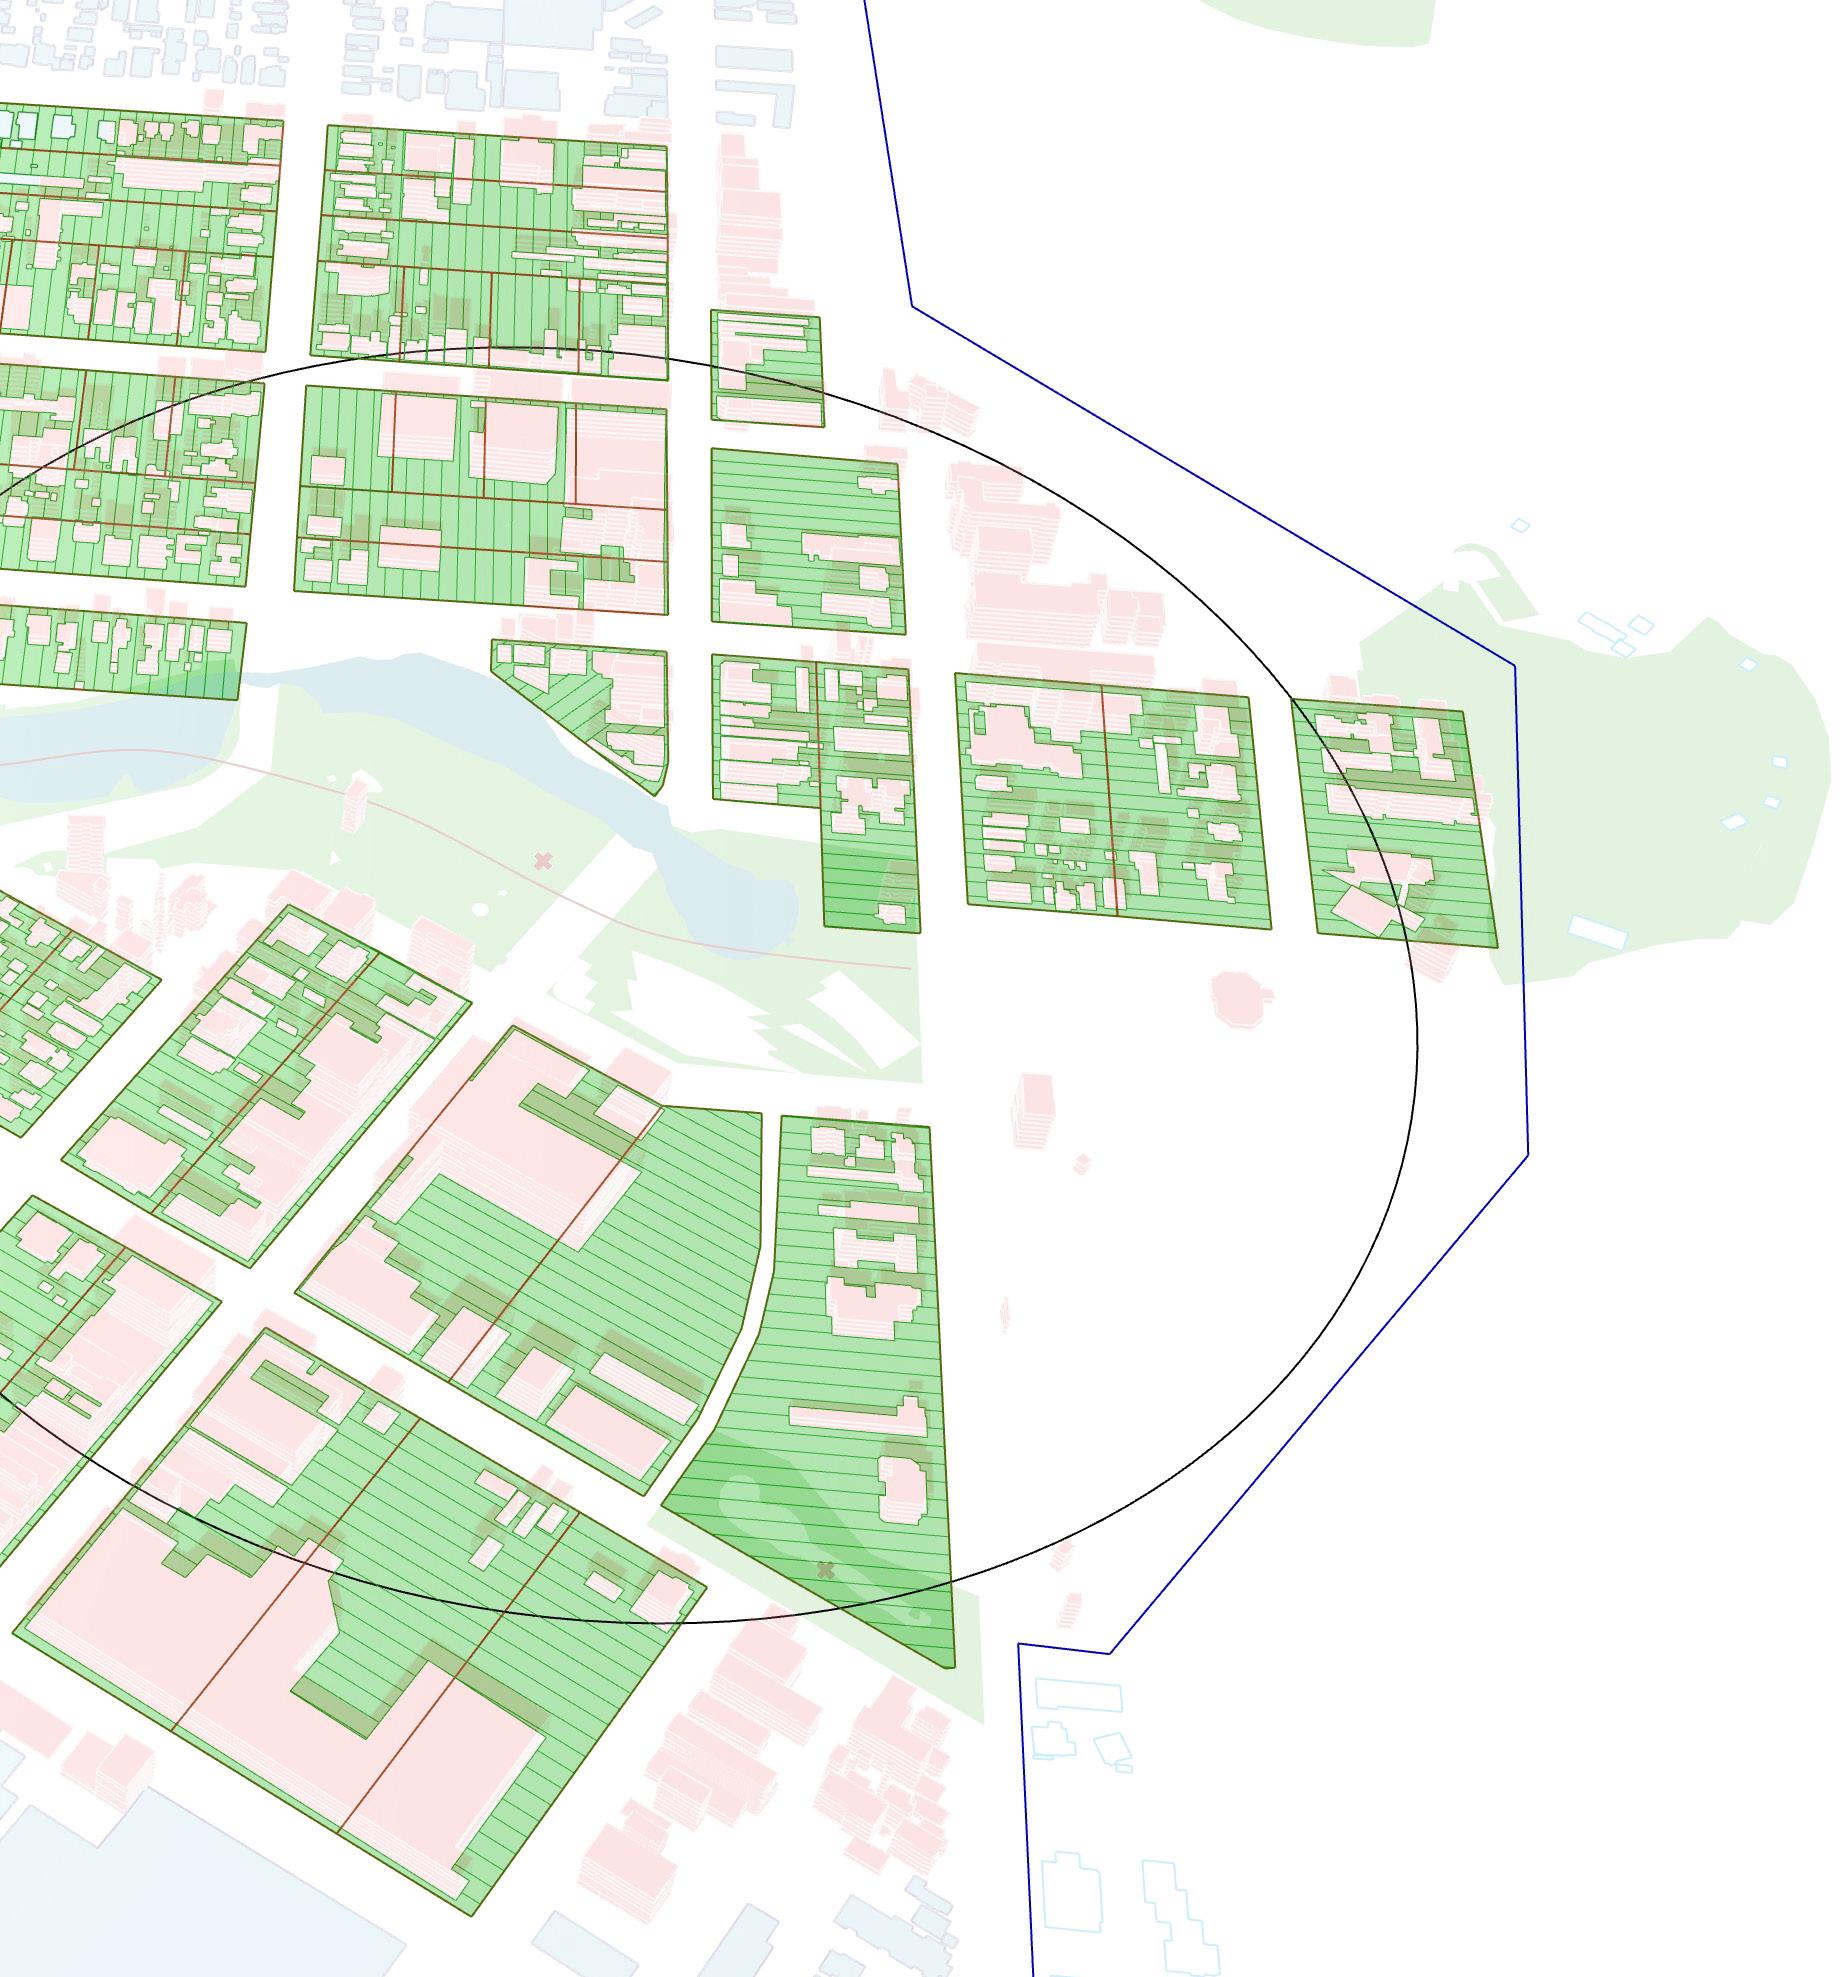
Potential Green Space Generation + Sunlight Analysis
In collaboration with Elaine Wang
Interstital spaces within street blocks are established between building plots in parrallel segments. In order to maintain a desired ratio of building density to green space availability as building density increases in the previous step, these segments are selected based on their optimal sunlight exposure
Grasshopper Construction : 4
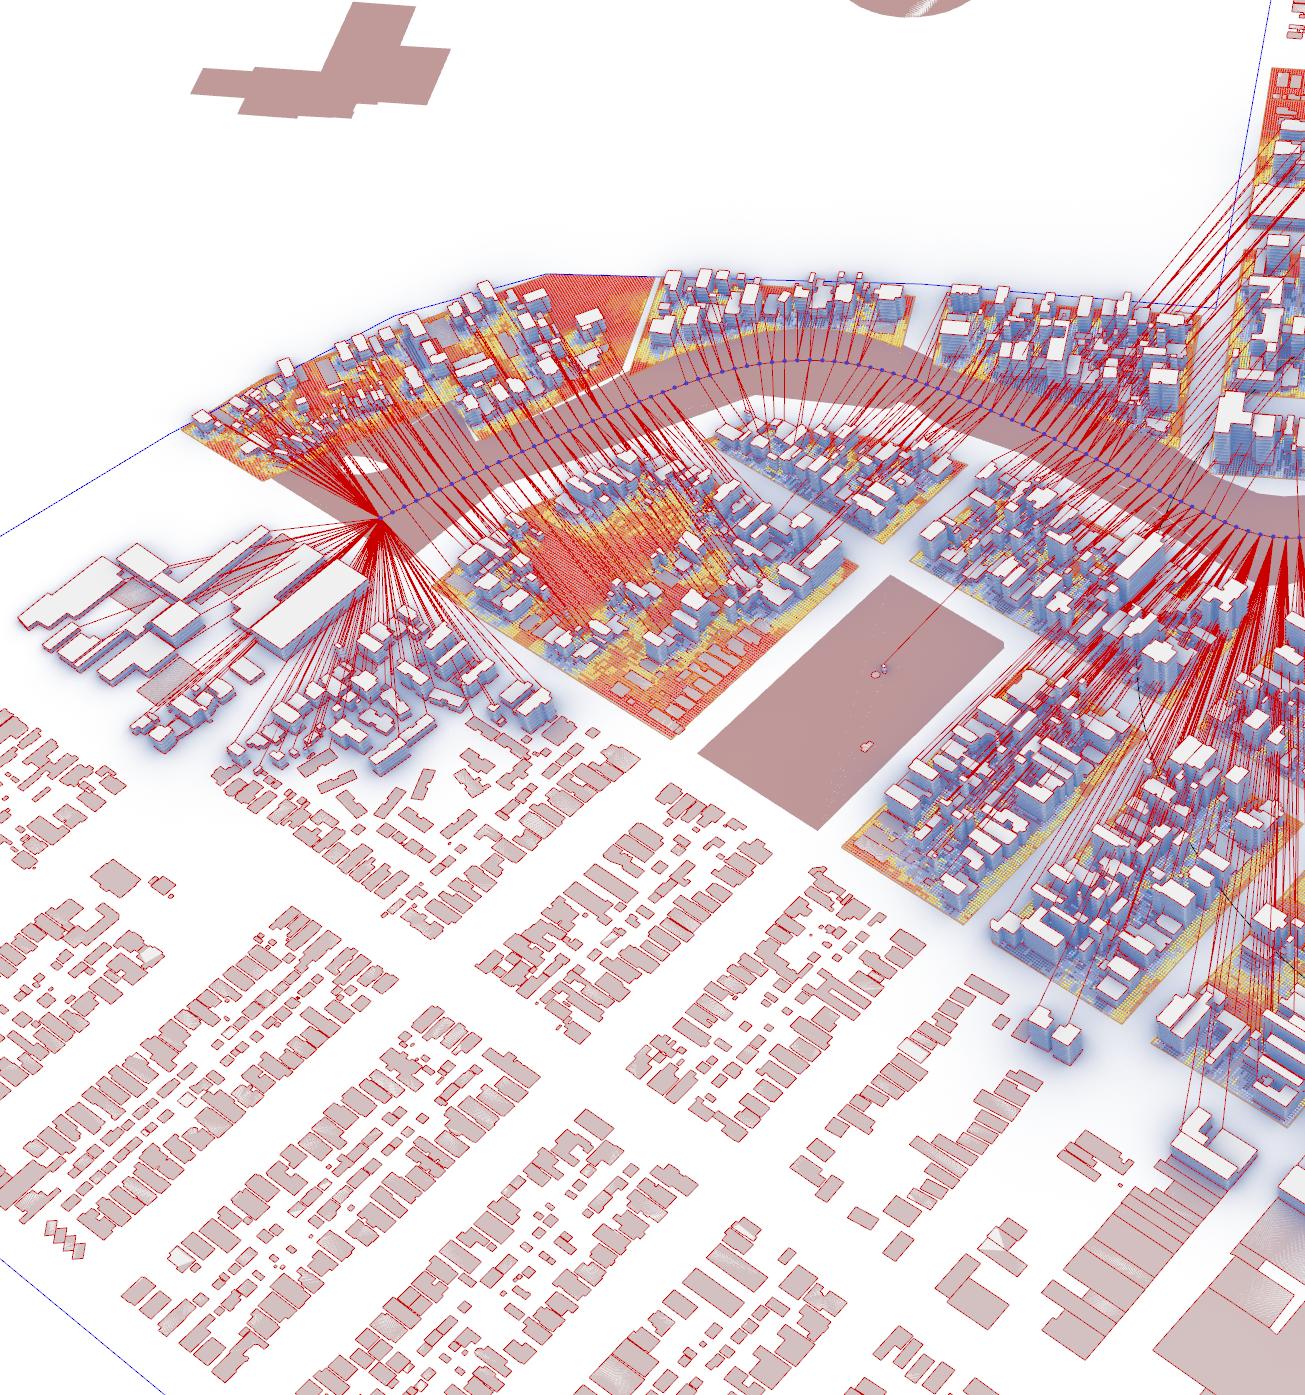
Sightlines to Points of Interest + Heritage
In collaboration with Elaine Wang
In order to maintain living quality and prevent overshadowing post intensification, buildings are analysed for their ability to achieve sightlines between themselves and key points of interest including the lagoon and heritage sites.
In 2011 Phoenix Arizona was labelled the least sustainable city in the world. Being the hottest city in the U.S and progressively its fastest warming.
Paradoxically it is also the highest listed city in the U.S for people moving, with a population growing by 1 million every decade and major tech companies like microsoft investing in development of the area and further exacerbating the cities urban sprawl.
Under current trends and with projected changes in climate, Pheonix will be uninhabitable by 2099.
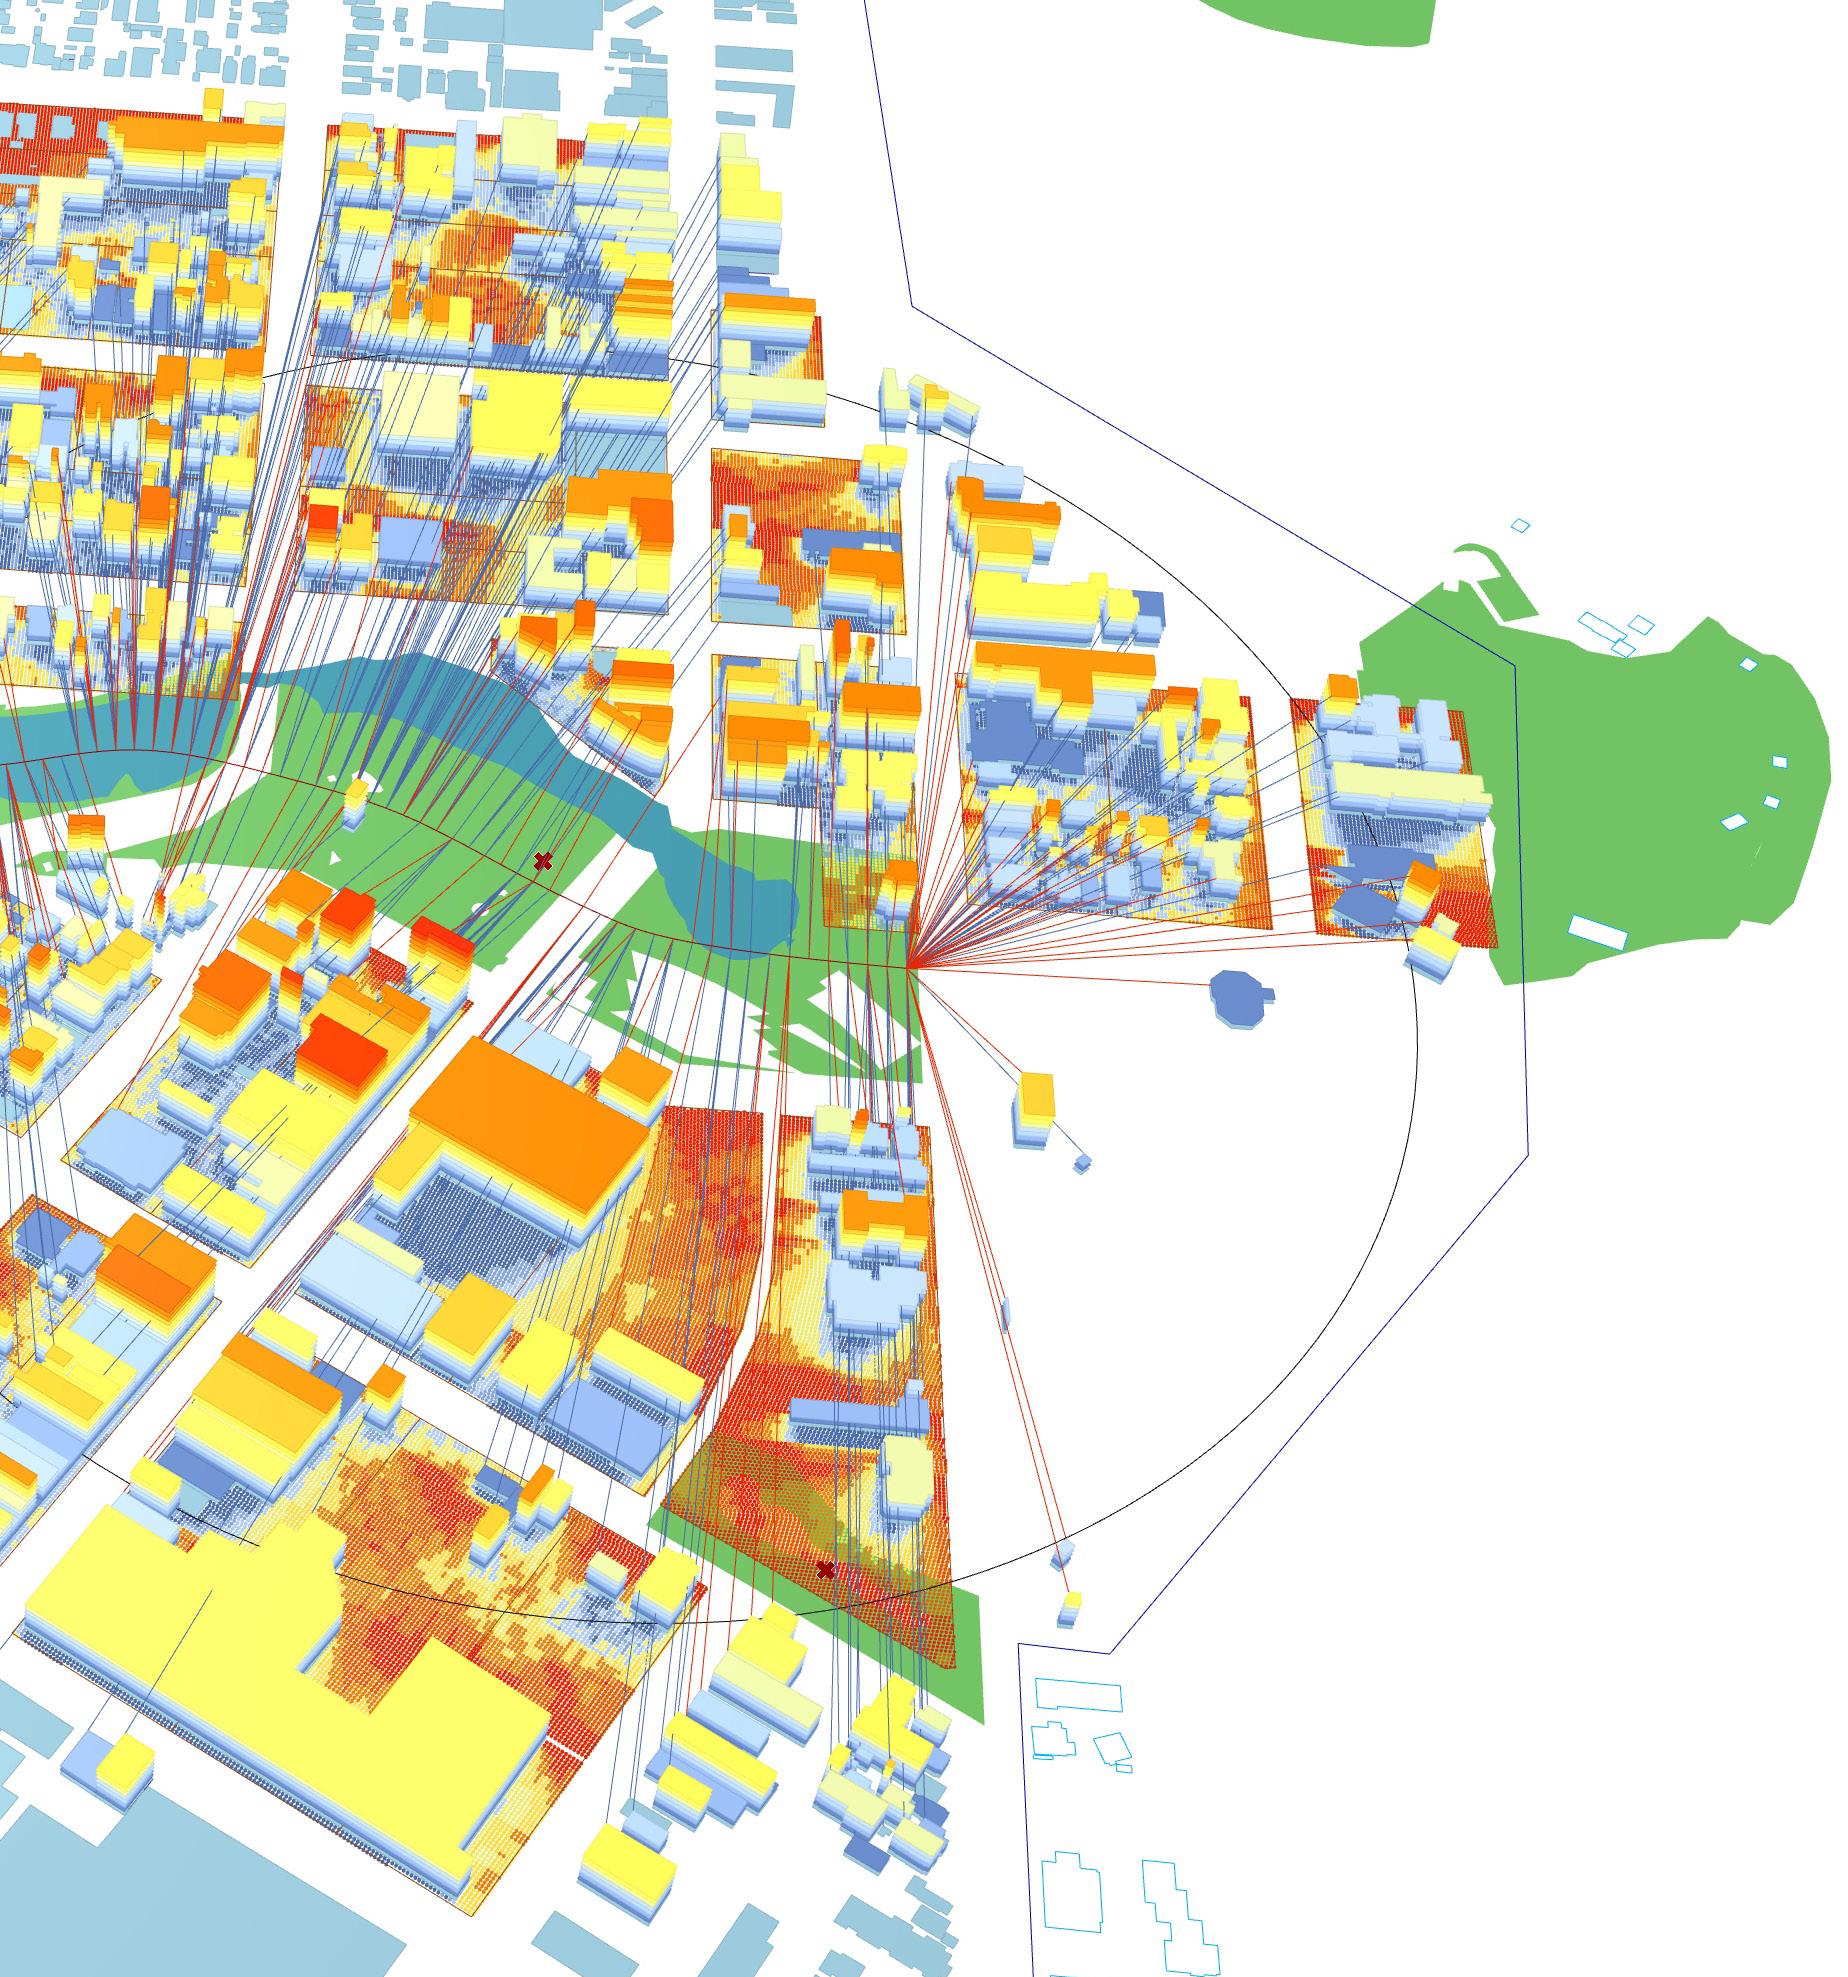
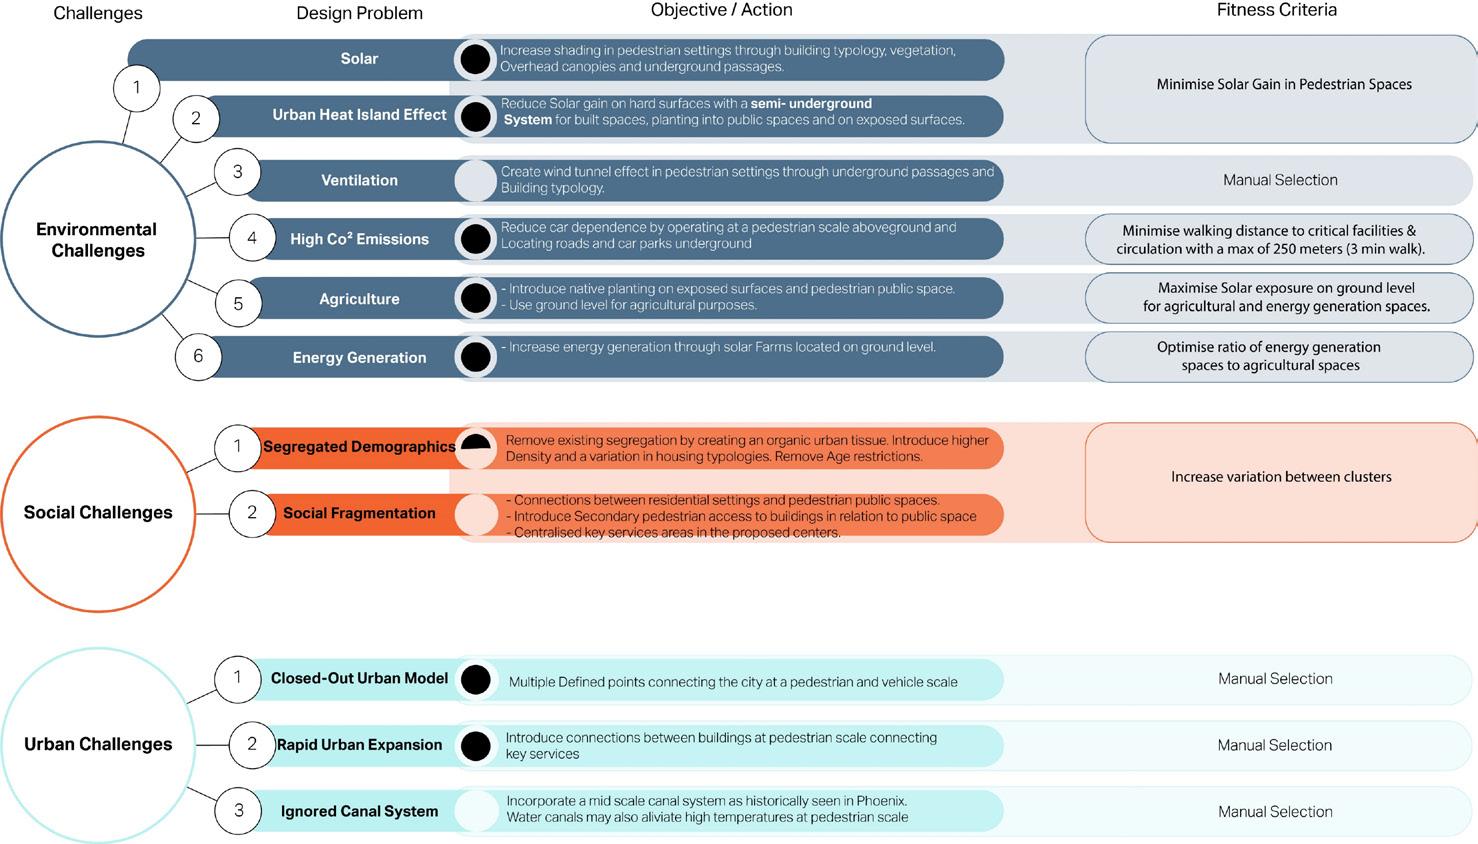
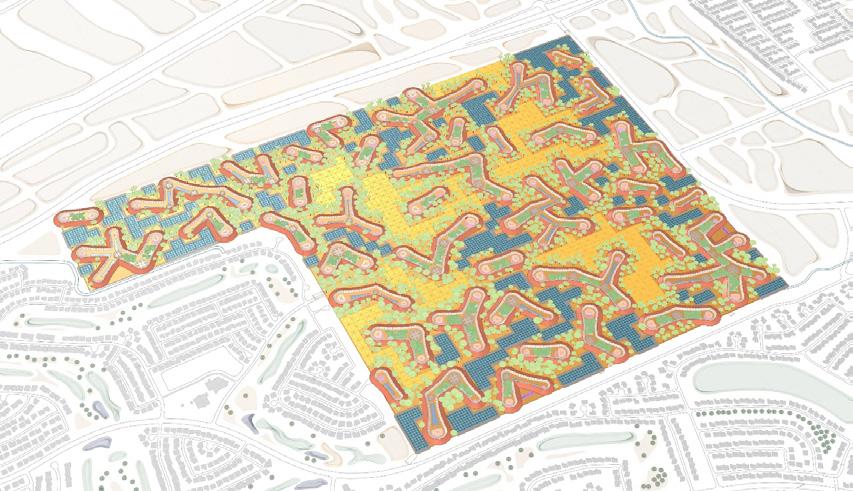
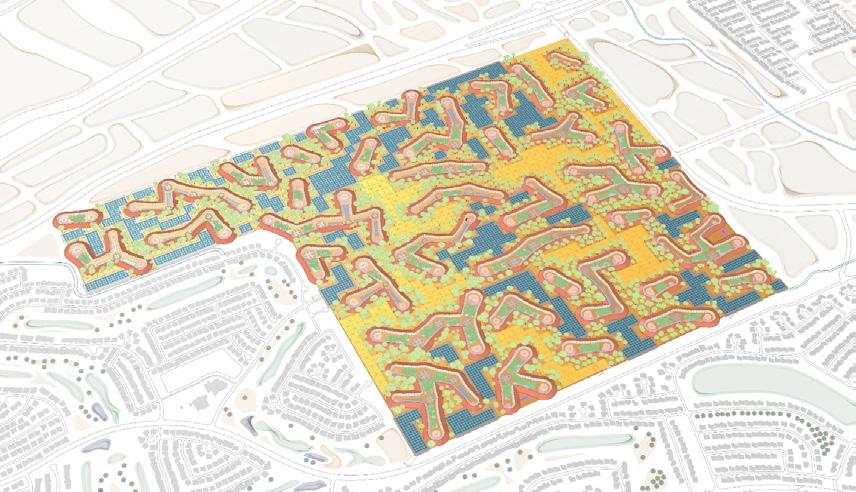
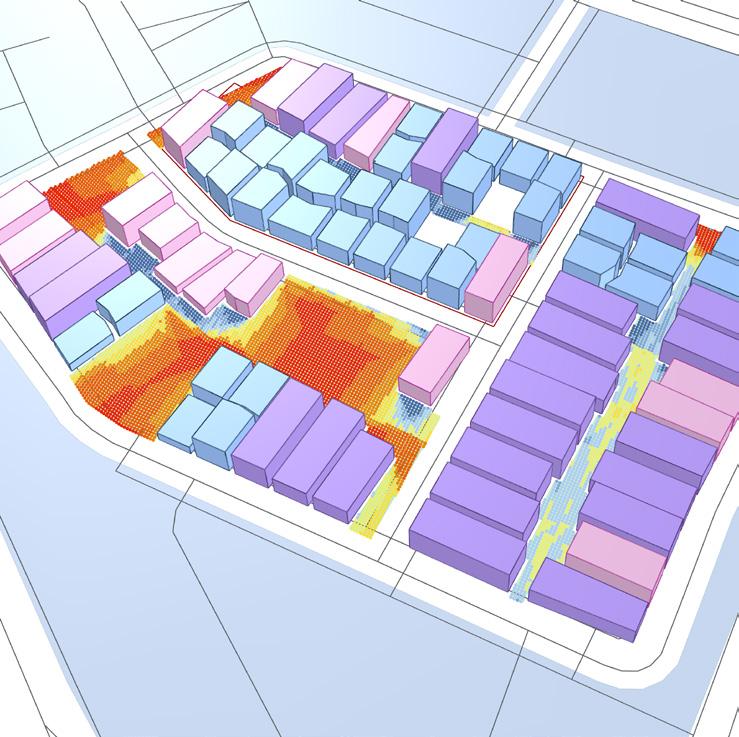
This project utilises the evolutionary engine Wallacei to parametrically re-design the currently highly unsustainable suburb of Corte Belle, an extreme example of Phoenix’s urban unsustainability. Responding to issues of solar exposure, dependance on HVAC system and the automobile, urban heat island, resource and energy sustainability, and social fragmentation.
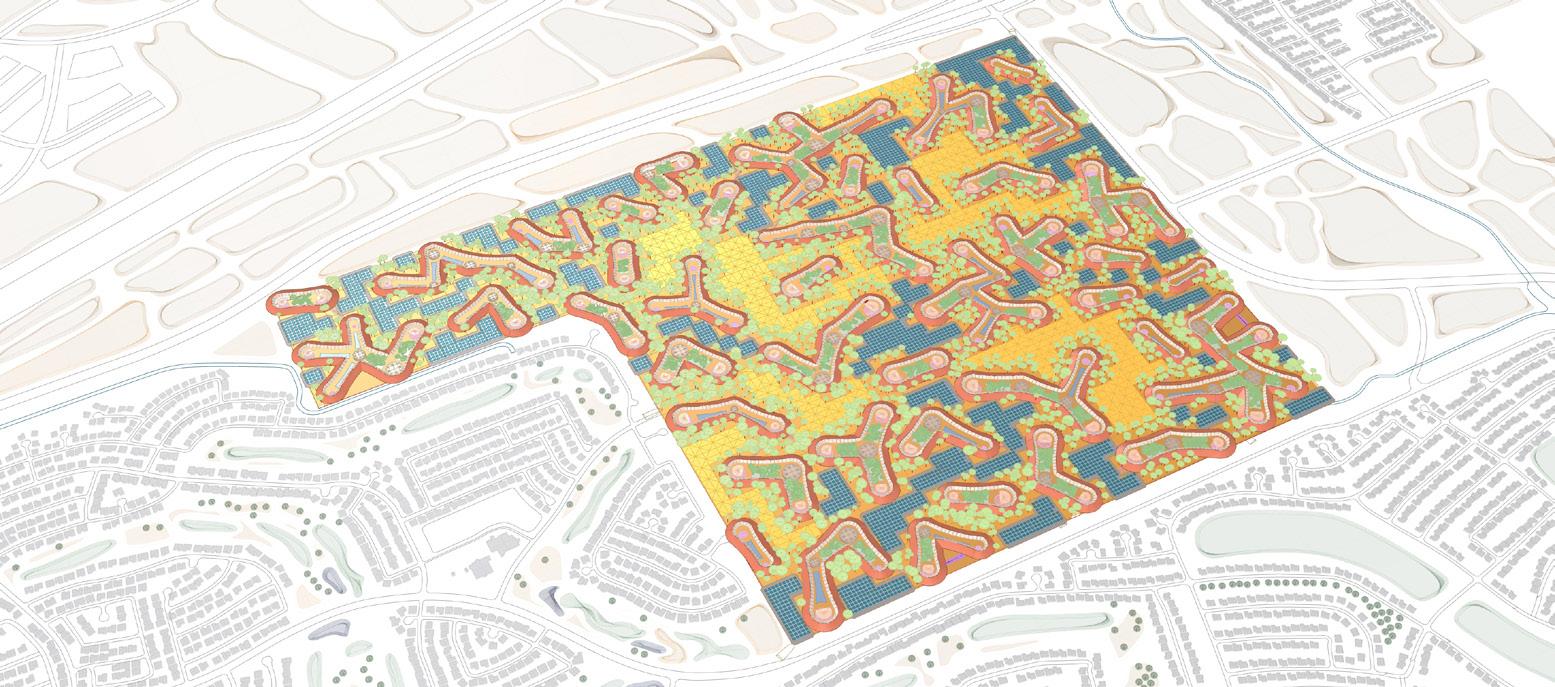
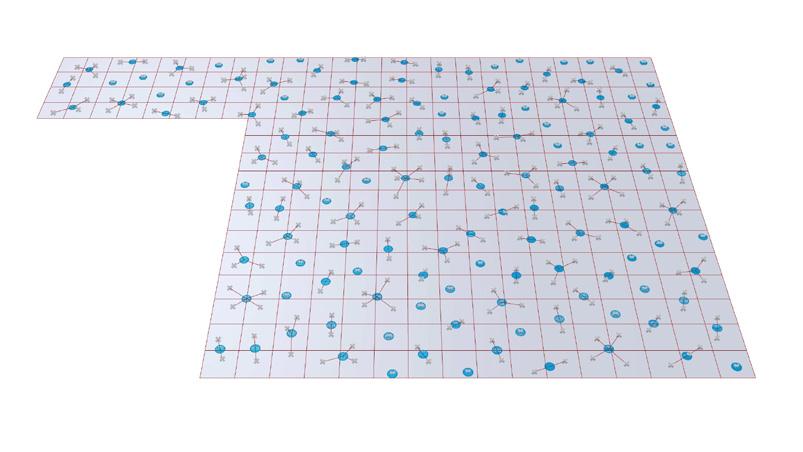
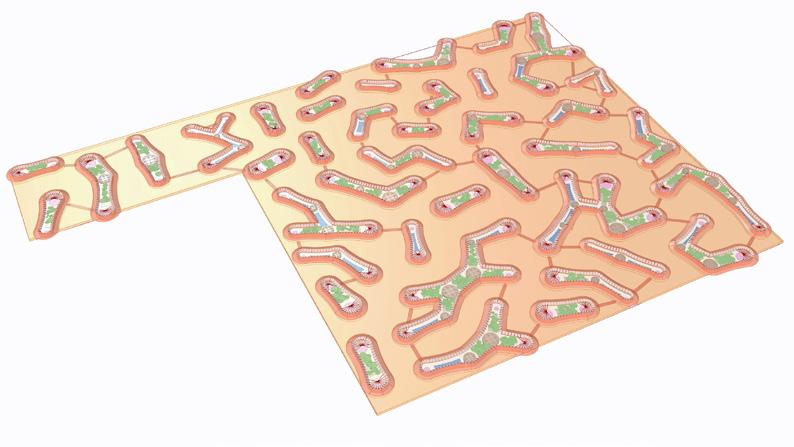
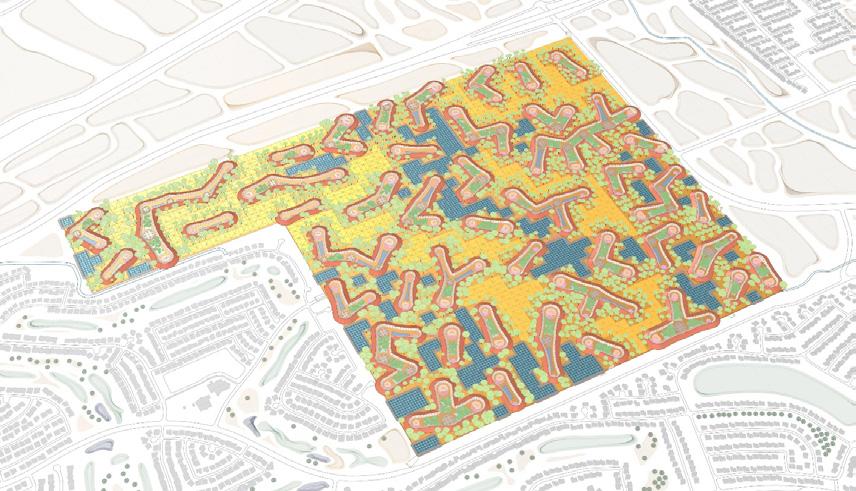
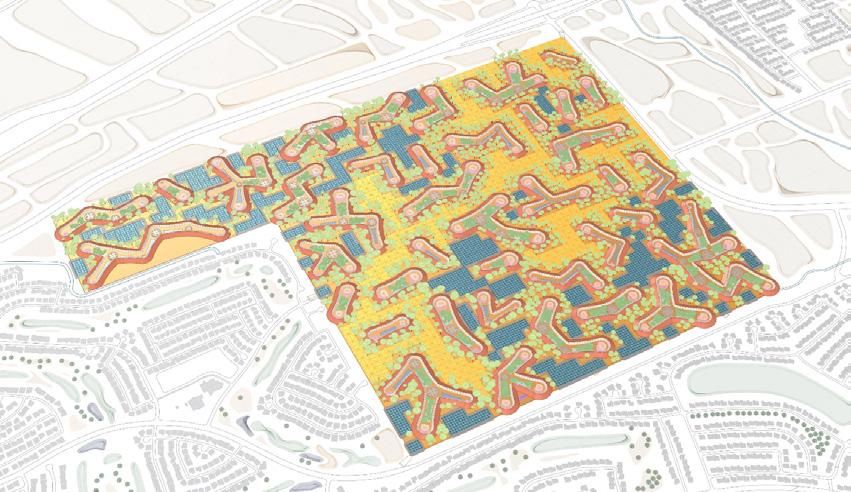
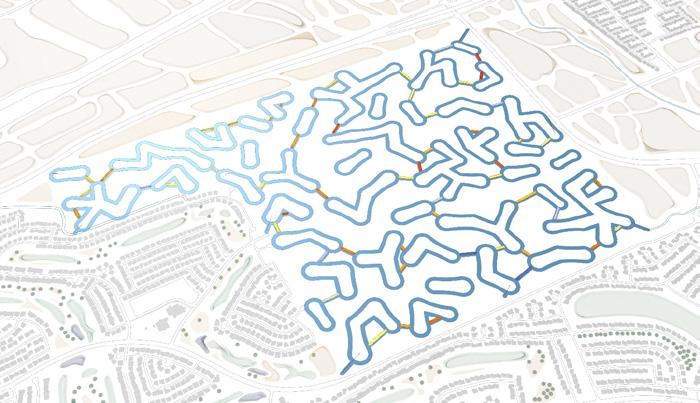
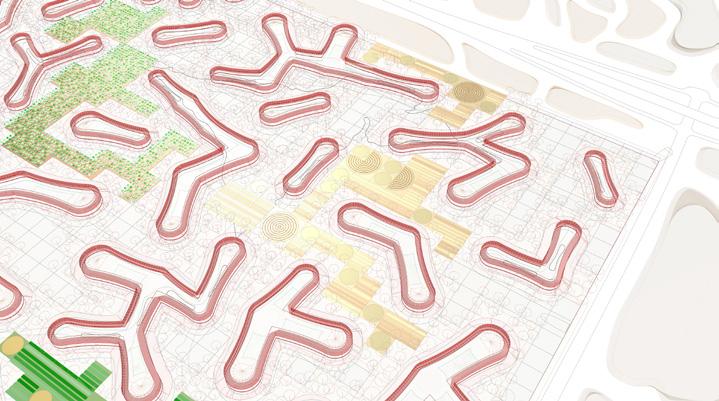
[05] Urban Center Allocation: 2400 x 1600 m site sequenced into 100 m² blocks. Each block is then allocated a point whose coordinates are controlled by algorithm
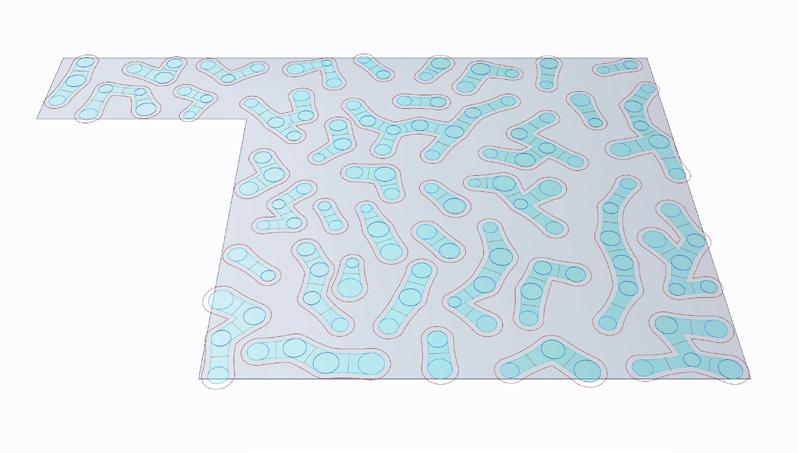
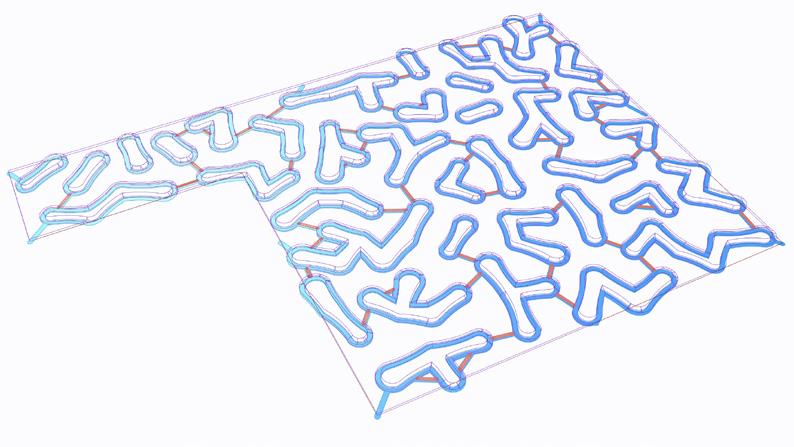
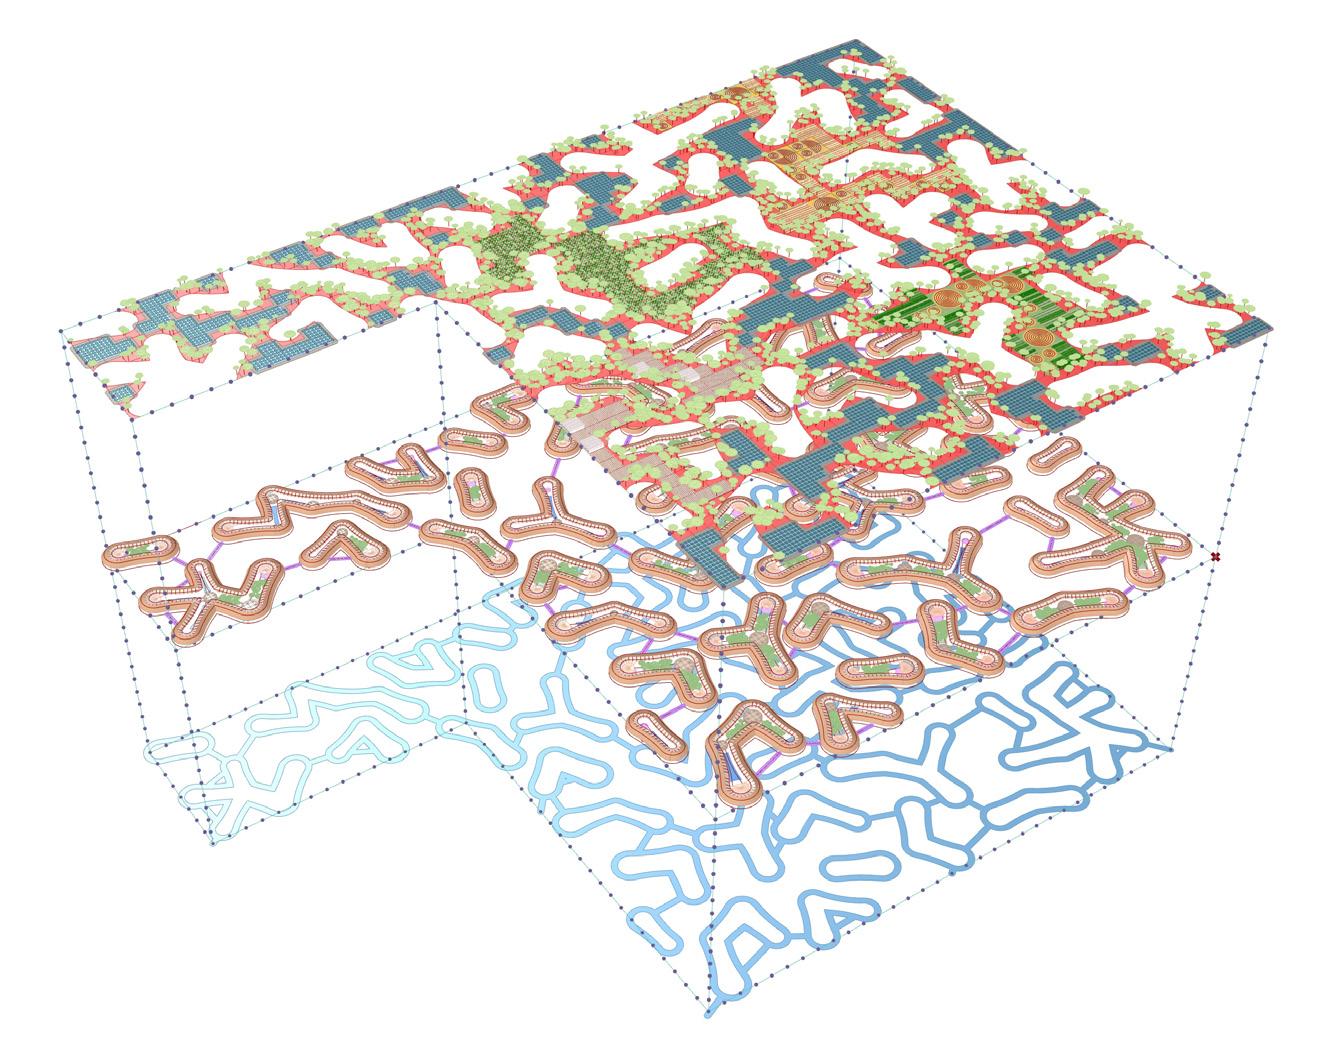
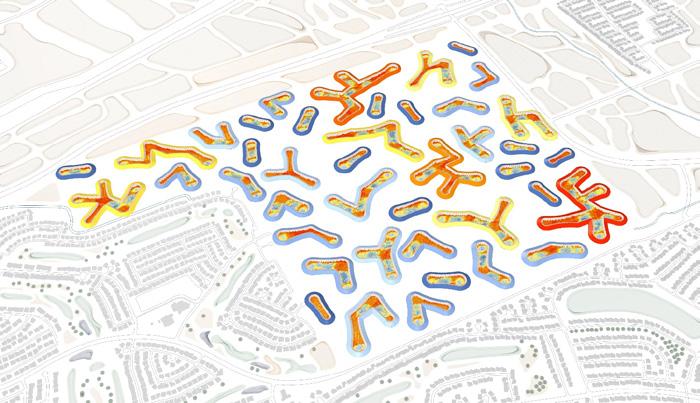
[07] Burrow Form Generation: Center clusters form subterranean burrows and ground level mounds. Algorithm determines the density, width, and circulation of burrows
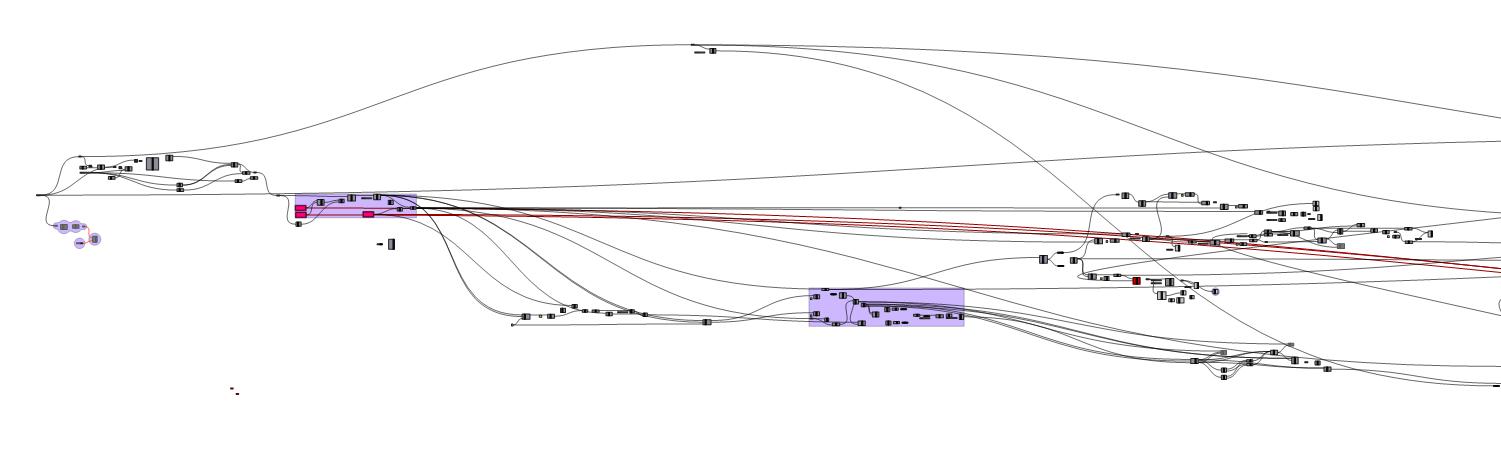
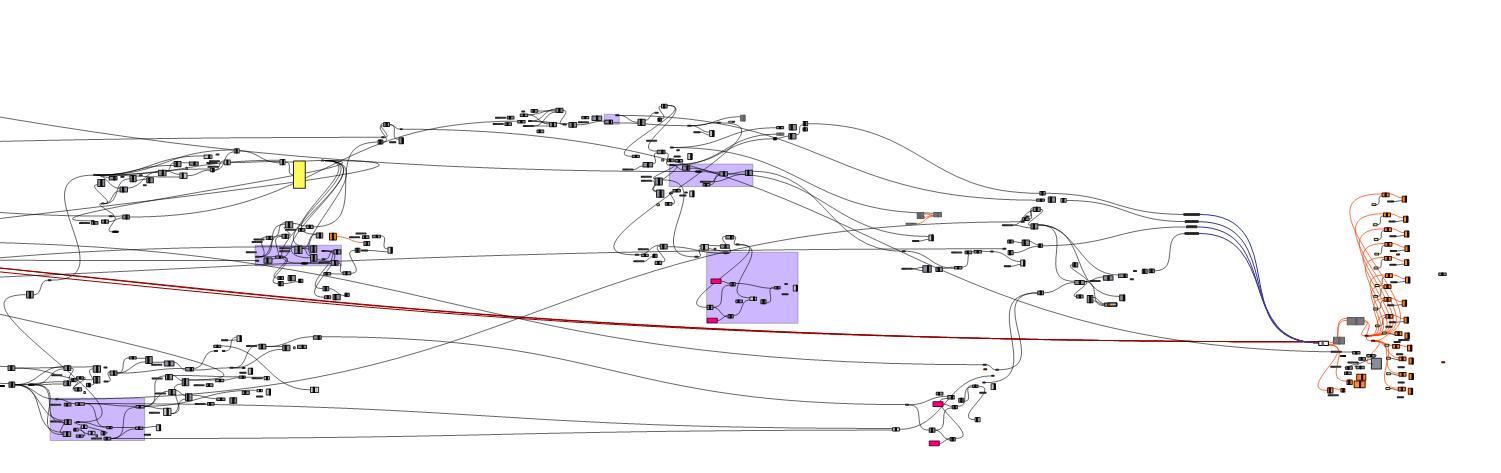
[13] Grasshopper Definition
[06] Center Cluster Generation: Urban centers connect to their nearest neighbour, resulting in clusters of varying density and scale. Maximum distances between centers is set to 220 m to ensure sub 3 minute walking distances
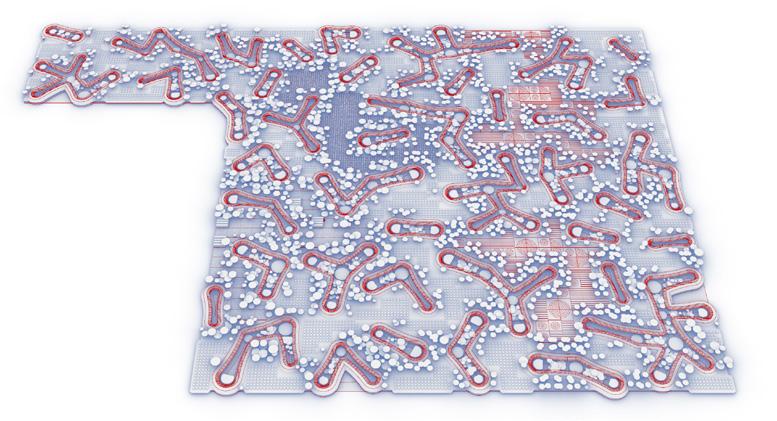
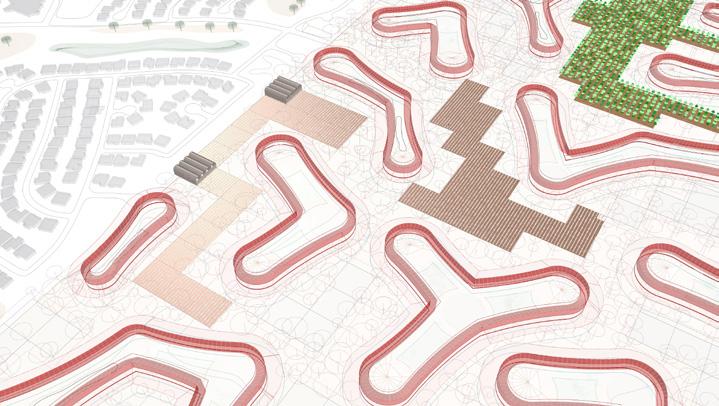
[08] Subterranean Level: Subterranean vehicle circulation routes are established between neighbouring burrows and site entry points, moving pedestrian circulation to shaded sub-terranean layer and reducing social fragmentation
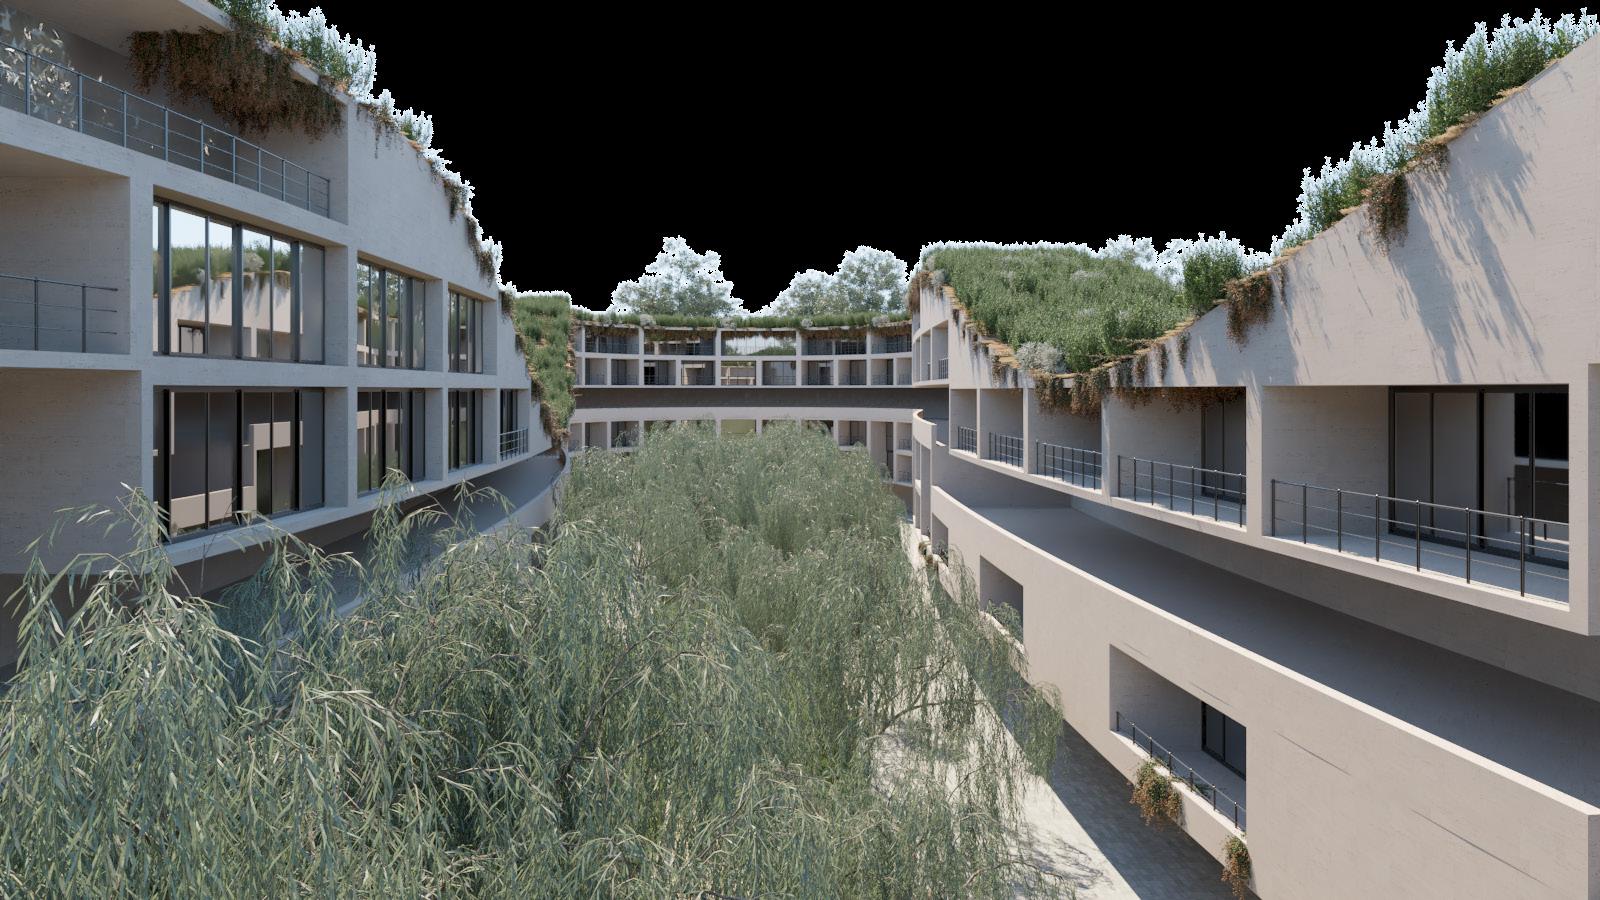
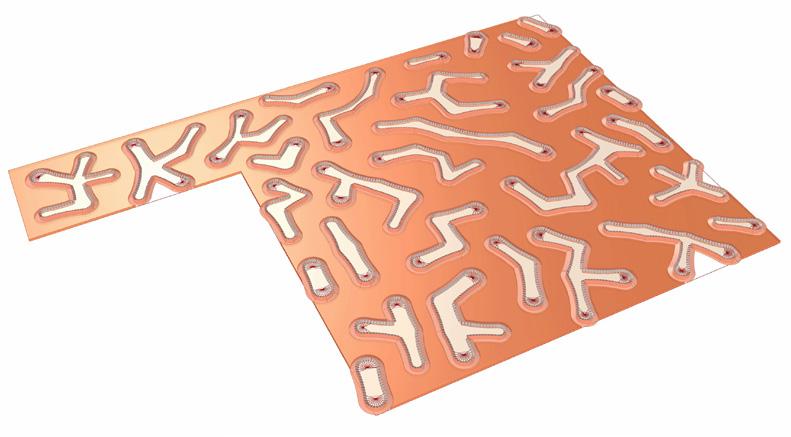
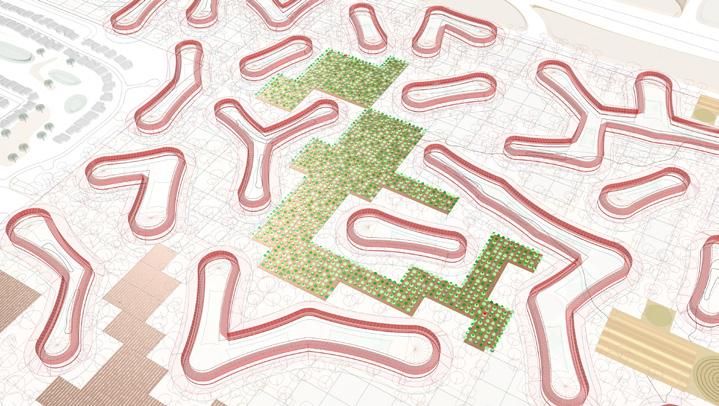
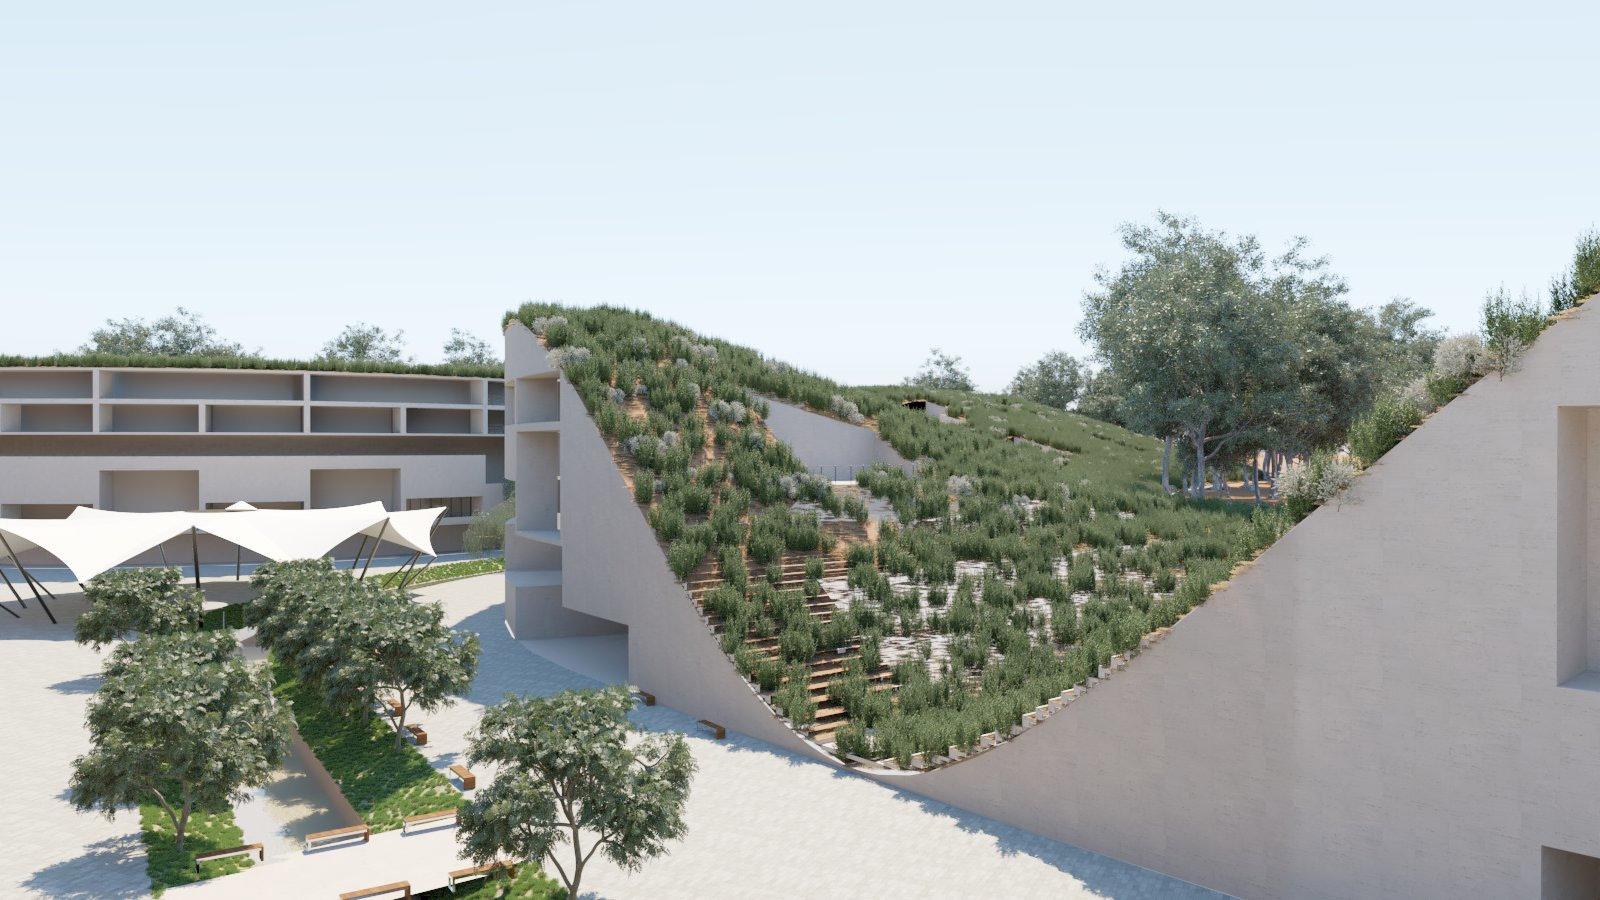
[09] Mound Generation: Burrows are covered by mound topography to increase shading on pedestrian spaces. Internal shading canopies line mound boundaries
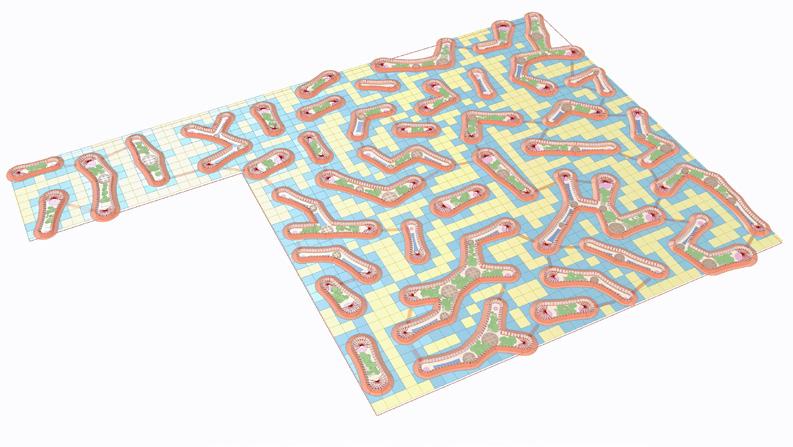
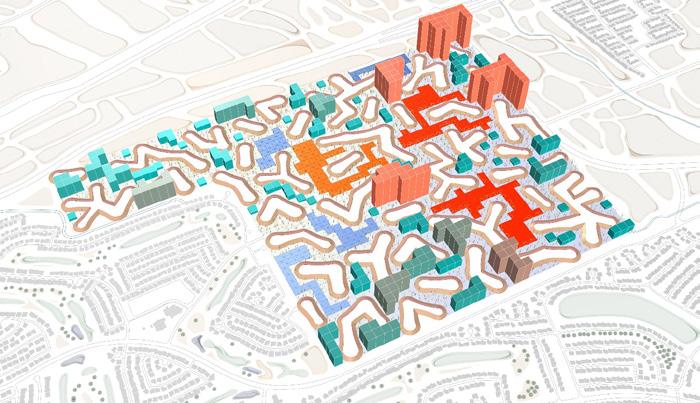
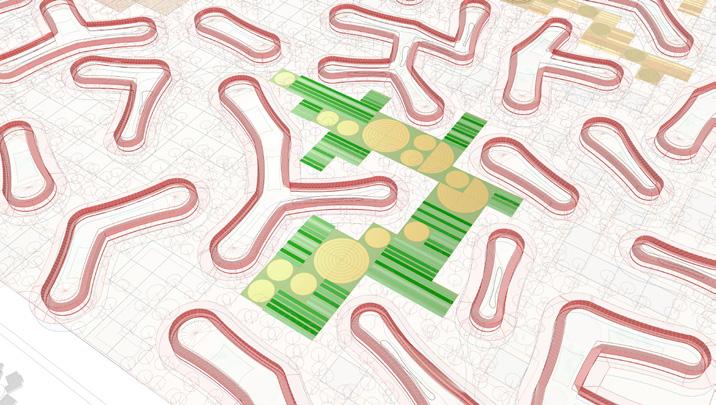
[11] Resource Generation Level: 40 x 40 m2 blocks are establied on ground level around mounds. With whole blocks becoming resource generation spaces.
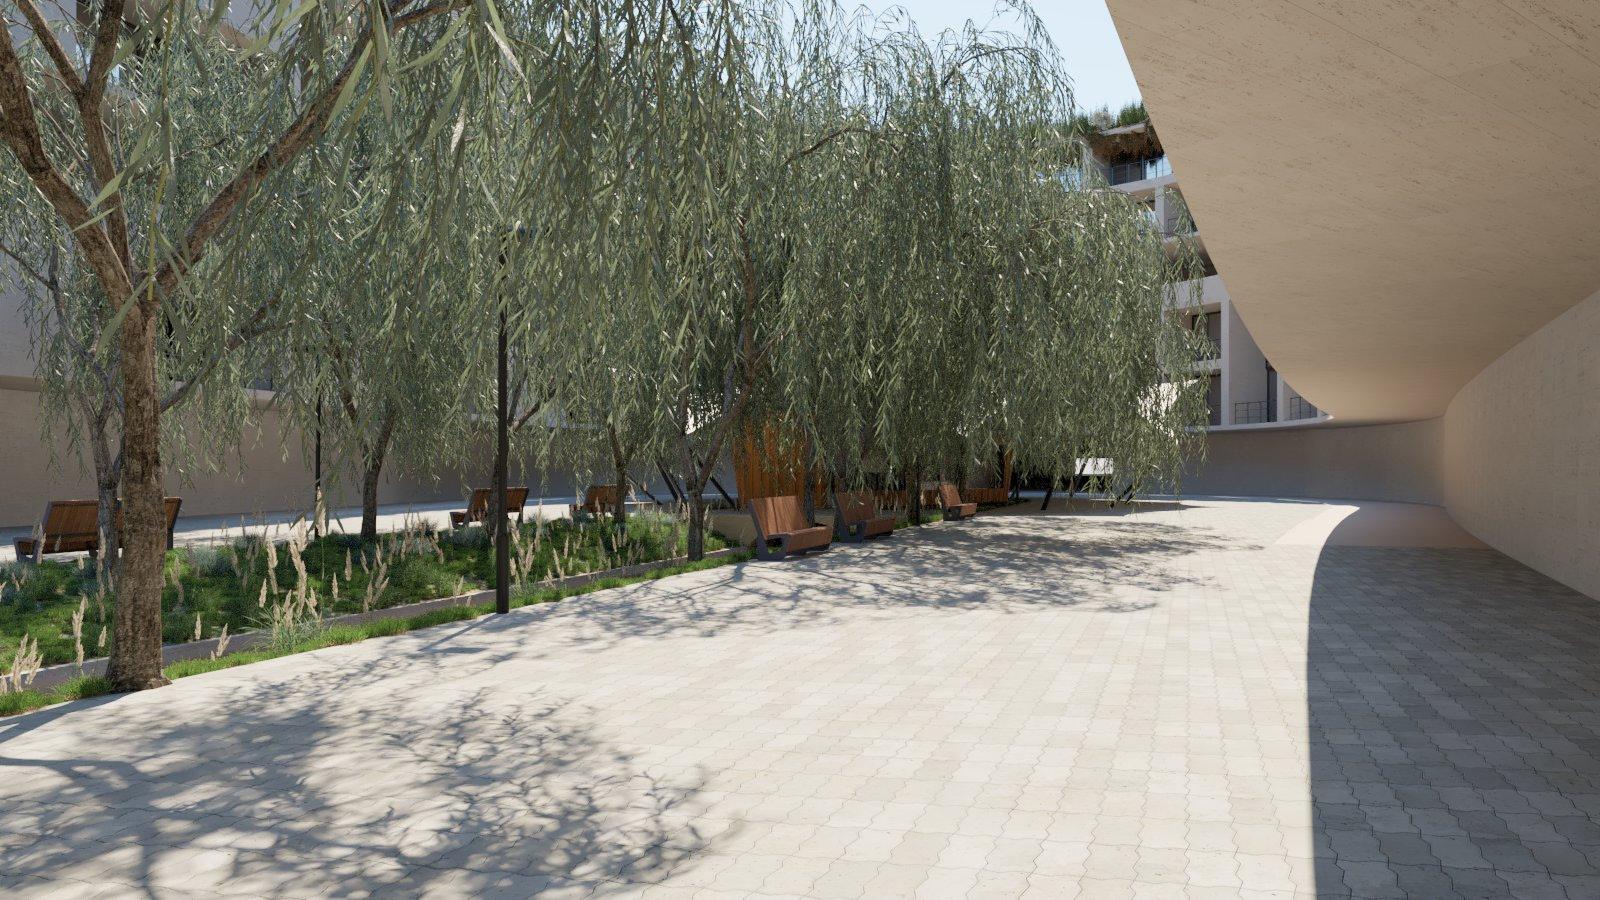
[10] Pedestrian Level: Burrow centers are defined based on the needs of inhabitants, with end centers being populated with essential services and internal holding non essential goods and service, vegetation, and shaded water bodies.
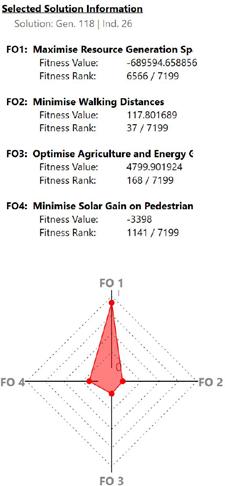
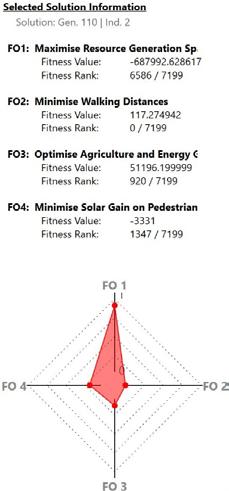
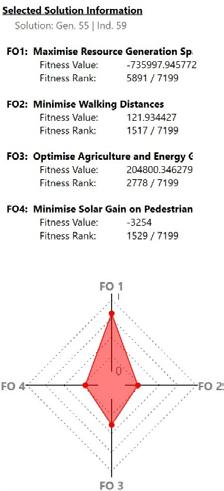
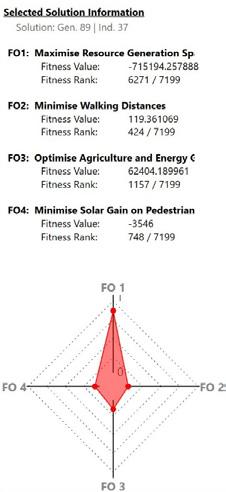
[12] Wallacei Analysis: The algoirthm runs a 4 objective simulation to {1} maximise resource generation spaces, {2} minimise walking distances {3} optimise resource generation {4} minimise solar gain on pedestrian spaces
: 7.65 / 13
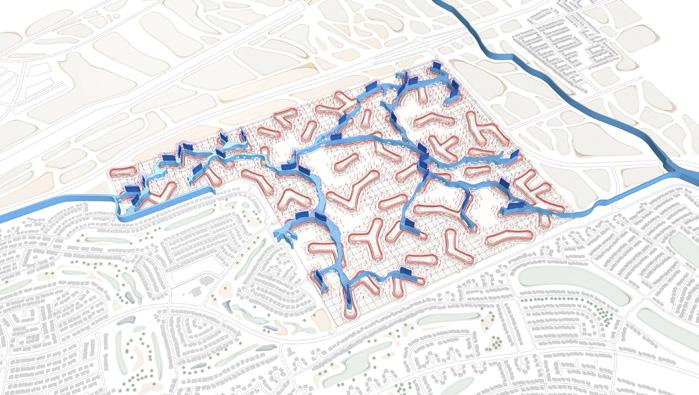
[20] Existing Water Canal Manipulation:
Like much of metropoliton Pheonix the site is intersected by canals carrying water from the Colorado river. These canals are manipulated to run through shaded inhabited spaces to provide cooling.
[21] Layer Performance Analysis:
Subterranean Layer: Many very short connections between burrows and site entries, low score
Burrow Layer: Highest score of 4 analysis sslections Resource Layer: Max tree coverage, medium score
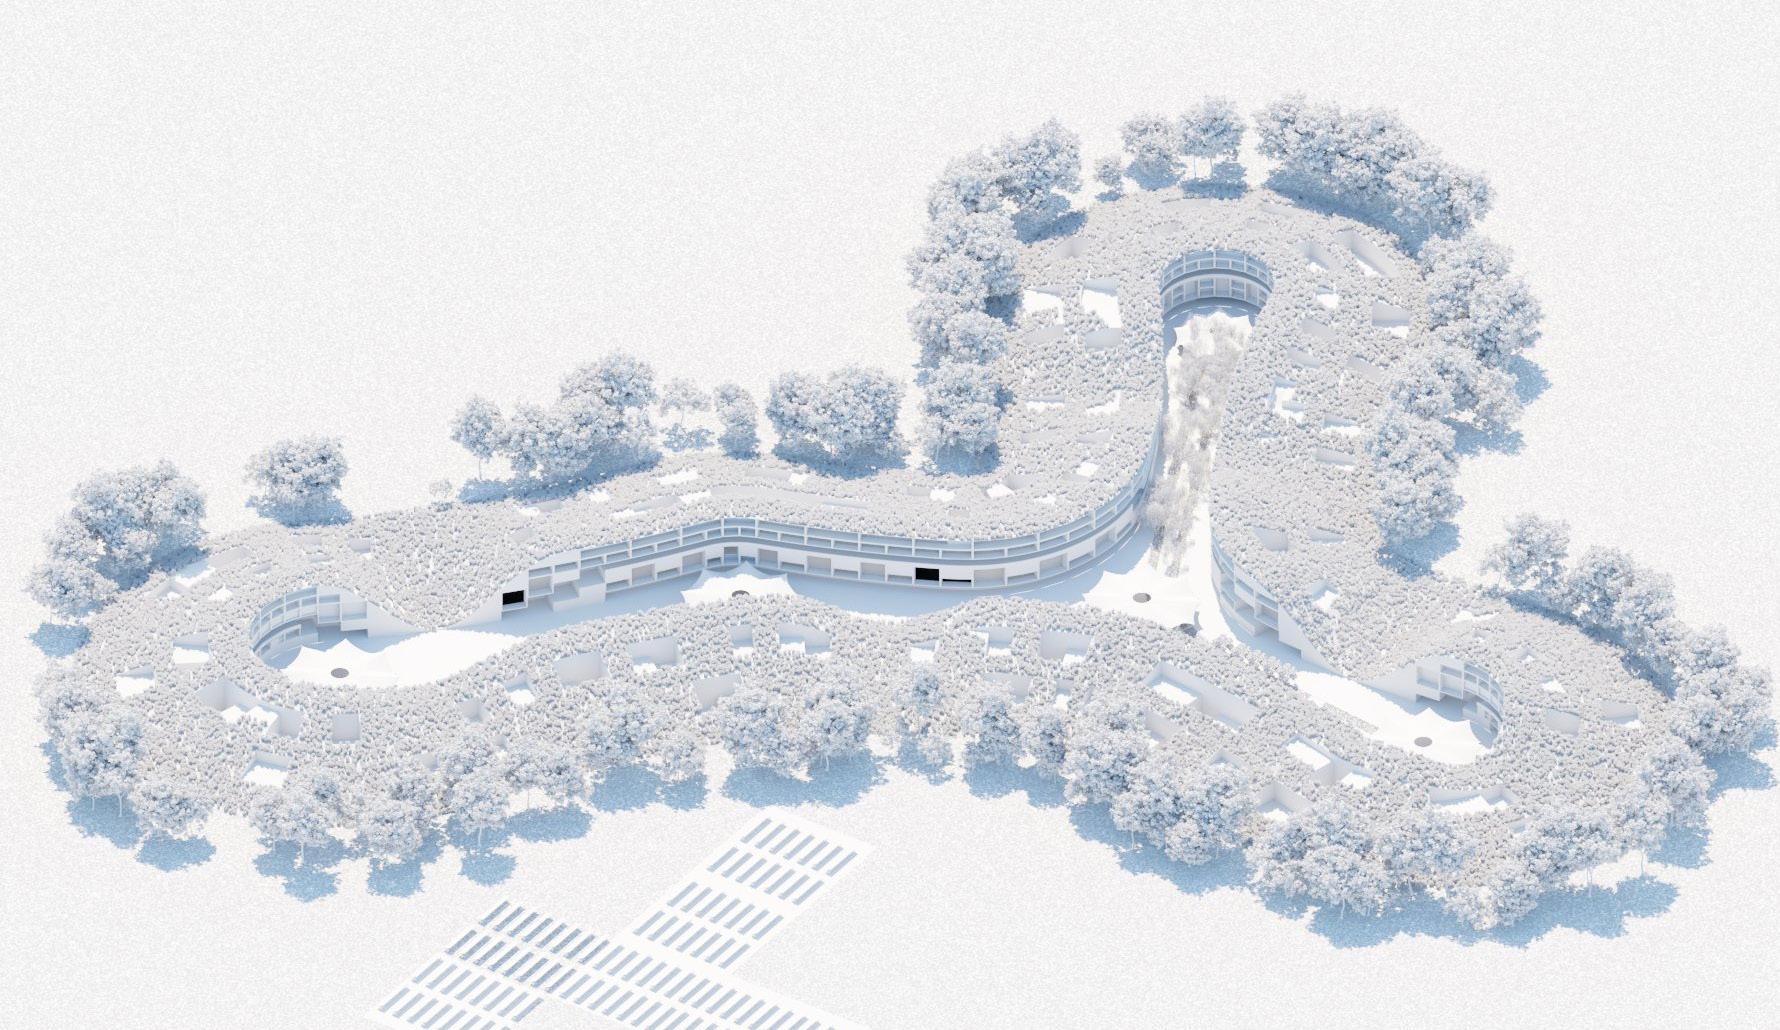
[22] Selected Solution [23] Burrow Render
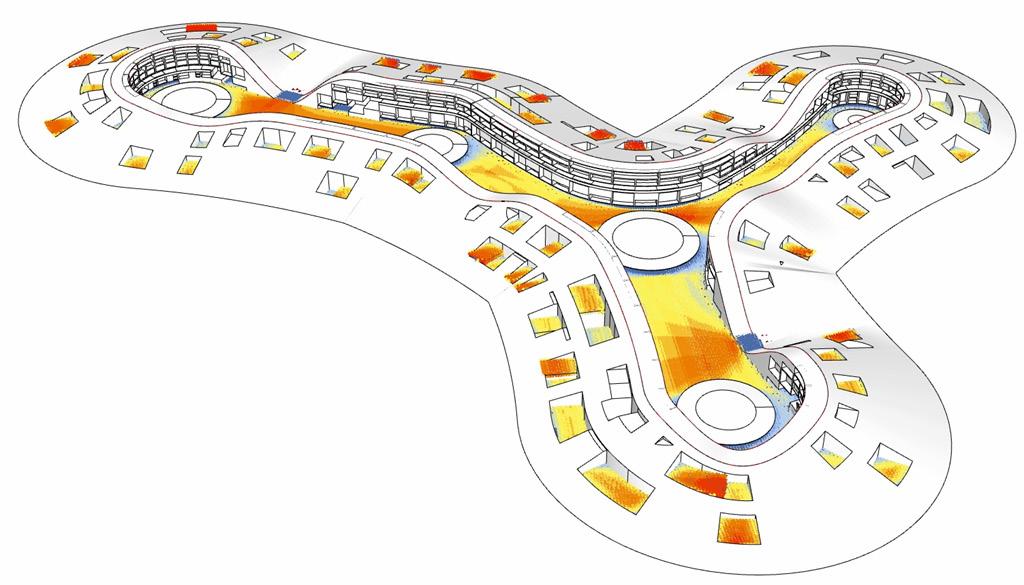
[24] Agriculture Produce Analysis:
Utilising the abundant solar exposure on ground level between solar farms and agriculture, the agricultural production of the project is split into the 4 most prominent outputs of current Arizona, these being wheat, citrus, lettuce, and cotton. These produces seek to supplement the needs of inhabitants, meeting 1 quarter of their daily subsistence.
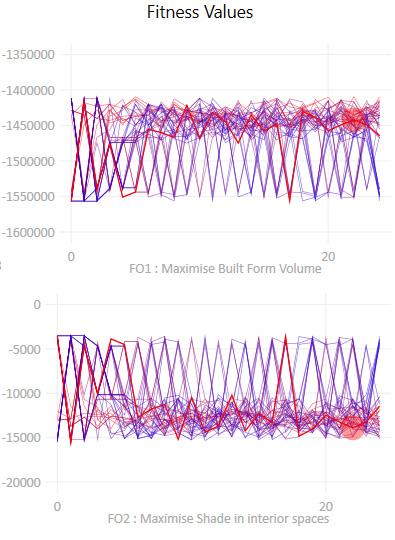
A second simulation is run on a burrow in the southern region of the selected result, this simulation seeks to optimise the burrow between 2 objectives of: {1} Maximising built form volume - so as to achieve the most efficient use of space, and {2} Maximise shade on interior spaces - so that where perforations are made in the burrows exterior for balconies and courtyards, they are in the optimal positions for shading inhabitants on the periphary of the burrow and limiting solar gain on its internal regions.
Burrow Optimisation
[27] Burrow Circulation Render
[28] Burrow Interior Render
05 Miscellaneous Projects
Various projects arcross urban desigm and architecture utilising Grasshopper, Wallacei, and GIS progroams.
Jacka, ACT
In collaboration with Elaine Wang
Utilised Grasshopper + Wallacei to establish new residential plots and green spaces of varying sizes and typologies, in the aim of achieving a greater balance between population and amenity.
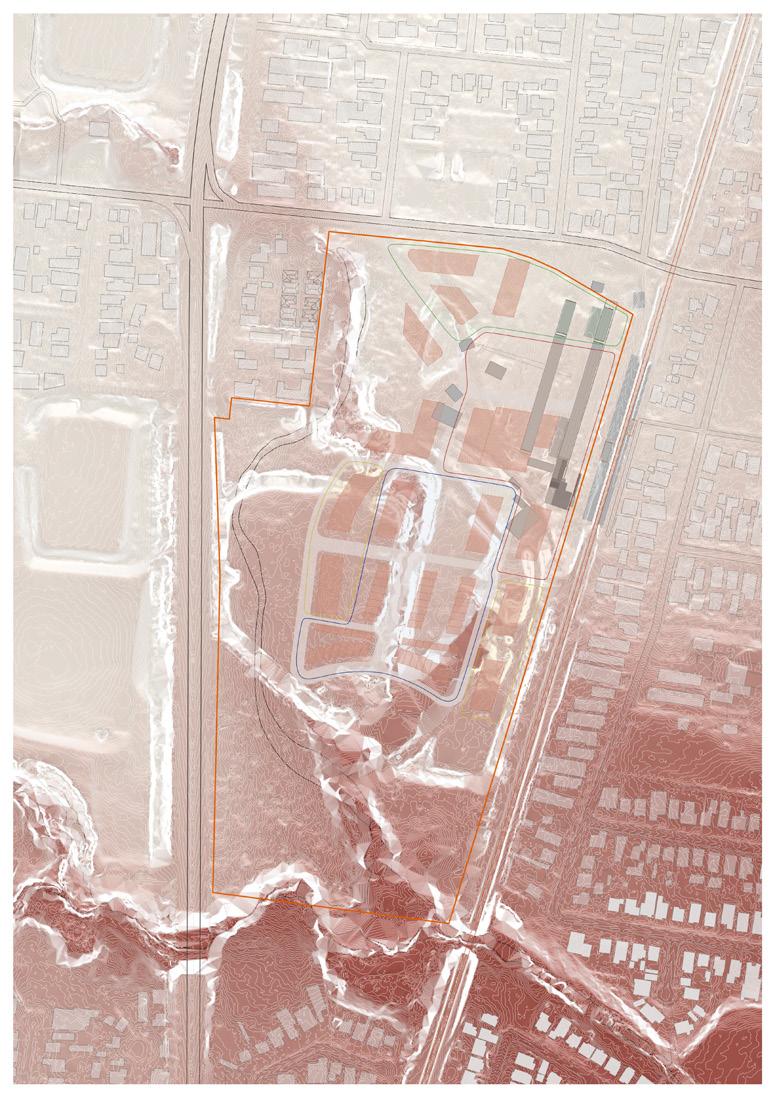
Site Analysis + Planning
Utilised QGIS + Grasshopper to produce site analysis involving elevation mapping and representation, climatic condition, sunlight hours, and wind analysis. Providing a base to measure design proposal against.
Corrimal Cokeworks, Wollongong NSW
Urban Block Generation
Utilised Grasshopper + Wallacei to generate new urban block with the sprawling character of Fes. Emphasising the unique rooftop open spaces generated and the natural shading systems at ground level Fes, Morocco
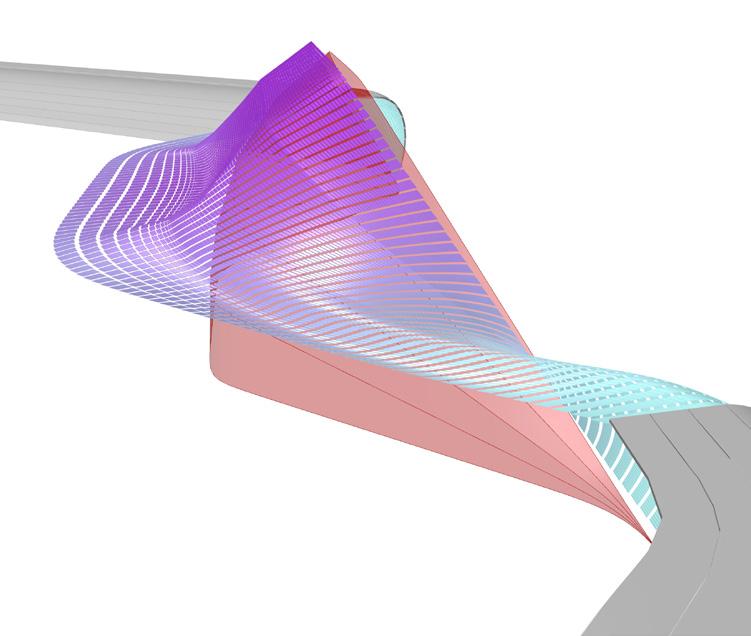
Complex Form Generation
Moore Park, NSW
Utilised Grasshopper + Rhino to generate compex geometry otherwise not possible with Rhino along. Utilising paramter based tools to adjust and shape form for boundary wall in Moore Park landscape project.